Embed Size (px)
Citation preview

Experimental investigation of a two-truck platoon consideringinter-vehicle distance, lateral offset and yaw
Downloaded from: https://research.chalmers.se, 2022-03-15 03:34 UTC
Citation for the original published paper (version of record):Törnell, J., Sebben, S., Elofsson, P. (2021)Experimental investigation of a two-truck platoon considering inter-vehicle distance, lateraloffset and yawJournal of Wind Engineering and Industrial Aerodynamics, 213http://dx.doi.org/10.1016/j.jweia.2021.104596
N.B. When citing this work, cite the original published paper.
research.chalmers.se offers the possibility of retrieving research publications produced at Chalmers University of Technology.It covers all kind of research output: articles, dissertations, conference papers, reports etc. since 2004.research.chalmers.se is administrated and maintained by Chalmers Library
(article starts on next page)

Journal of Wind Engineering & Industrial Aerodynamics 213 (2021) 104596
Contents lists available at ScienceDirect
Journal of Wind Engineering & Industrial Aerodynamics
journal homepage: www.elsevier.com/locate/jweia
Experimental investigation of a two-truck platoon considering inter-vehicledistance, lateral offset and yaw
Johannes T€ornell a,*, Simone Sebben a, Per Elofsson b
a Department of Mechanics and Maritime Science, Chalmers University of Technology, SE-412 96, Gothenburg, Swedenb Fluid Mechanics, Scania CV, SE-151 87, S€odert€alje, Sweden
A R T I C L E I N F O
Keywords:truckPlatooningDragWind tunnel experimentsLateral offsetClose-proximityReynolds independenceInter-vehicle distance
* Corresponding author.E-mail addresses: [email protected]
https://doi.org/10.1016/j.jweia.2021.104596Received 6 October 2020; Received in revised formAvailable online 13 April 20210167-6105/© 2021 The Authors. Published by Else
A B S T R A C T
In recent years a renewed interest in platooning has emerged due to increasing pressure on vehicle manufacturersto reduce greenhouse gas emissions of their fleets. Vehicles traveling in close proximity have been studied in somedepth, particularly simplified bodies and North American trucks. Still, there is a lack of understanding of thebenefits of platooning for European style trucks. In this study, experiments were undertaken using two 1:6 scaledetailed cab over engine tractor-trailer models in a wind tunnel with a moving ground. Surface pressures weremeasured on both trucks, while force measurements were taken on the model placed on the belt. Inter-vehicledistance, lateral offset, and yaw conditions were varied. Results show that a reduction of drag for the platoonis seen as the inter-vehicle distance decreases. For the leading truck, the reduction is due to an increased basepressure caused by the truck behind. The trailing truck has a more complex behavior and is sensitive to yawchanges. At short inter-vehicle distances, the leading truck loses in performance with a lateral offset, while thetrailing truck gains in performance if under yaw conditions. To aid the flow analysis, numerical simulations wereundertaken for some conditions studied experimentally.
1. Introduction
A renewed interest in the concept of platooning has emerged in recentyears with new stricter requirements on vehicle greenhouse gas emis-sions and further improvements in vehicle automation and sensor tech-nology. Platooning is used in this paper to describe vehicles driving inclose proximity, which reduces aerodynamic drag. In addition to roadvehicles, the concept has been applied to sports, such as cycling andmotorsports, Blocken et al. (2018a); Jacuzzi and Granlund (2019);Blocken et al. (2018b), as well as trains, where the spacing betweencontainers has been studied for optimal drag by, for example, Li et al.(2017); Maleki et al. (2019). Additionally, the flow phenomena in pla-tooning can be connected to those occurring in the tractor-trailer gap ofsingle trucks, Allan (1981); €Osth and Krajnovic (2012).
A significant body of research has been carried out with regard to thefuel consumption and aerodynamic drag of trucks traveling in closeproximity; however, most of these have been done with small scalemodels in the aerodynamic drag studies and on North American styletractor-trailer combinations. All of the currently published experimentalstudies have used a stationary floor and non-rotating wheels and wereperformed at low Reynolds numbers. In the studies performed on North
(J. T€ornell), Simone.Sebben@ch
4 March 2021; Accepted 6 Mar
vier Ltd. This is an open access a
American trucks, Salari and Ortega (2018); Lammert et al. (2017);McAuliffe and Ahmadi-Baloutaki (2018, McAuliffe andAhmadi-Baloutaki, 2019, both the effects of inter-vehicle distance (IVD),lateral offset, yaw, and interference of varied vehicle types were inves-tigated. All studies have shown that there is a continuous decrease of dragwith reduced IVD for the leading vehicle and a general decrease in dragof the trailing vehicle, but with an increase occurring at roughly3m–20m. McAuliffe and Ahmadi-Baloutaki, 2019 argued that whenconsidering the benefits of platooning, these have to be compared to dragvalues that are representative for a vehicle driving in realistic roadconditions, that is considering traffic. McAuliffe and Ahmadi-Baloutaki(2018) also observed that the engine cooling flow decreases by up to70% at very short distances which is a potential negative effect ofplatooning.
Studies utilizing simplified models, i.e., Hammache et al. (2002);Schito and Braghin (2012); Le Good et al. (2018, 2019); Tsuei and €OmerSavas (2001); Fletcher and Stewart (1986); Watkins and Vino (2008),have found that the most beneficial combinations are those where thenon-streamlined ends are facing each other, for example, a square back infront of a flat front. Further, the studies show that the changes to drag ofNorth American style trucks were similar to those of simple, more squaremodels. There were, however, cases where no benefit was seen with a
almers.se (S. Sebben), [email protected] (P. Elofsson).
ch 2021
rticle under the CC BY license (http://creativecommons.org/licenses/by/4.0/).

Abbreviation
IVD Inter-vehicle distanceCOE Cab over engineCp Coefficient of PressureCD Coefficient of Drag
Fig. 1. Layout of the ground simulation system and the available space in thetest section for varying IVD, lateral offset, and yaw.
J. T€ornell et al. Journal of Wind Engineering & Industrial Aerodynamics 213 (2021) 104596
platooning scenario. This tended to be when an aerodynamic base of theleading vehicle was combined with a smooth and aerodynamic front ofthe trailing vehicle. Similar results have been observed in studies ofplatoons of passenger cars, however, with low sensitivity to yaw whenthis has been investigated, Marcu and Browand (1999); Hong et al.(1998); Ebrahim and Dominy (2020).
It is clear from the literature that there is a gap in knowledge, both inthe behavior of European, cab over engine (COE) style trucks, but also ofthe aerodynamic performance in more realistic settings with detailedmodels, ground simulation, and high Reynolds numbers. The influenceon drag of ground simulation and rotating wheels has long been known inaerodynamics, especially for passenger vehicles, as discussed in Howelland Everitt (1981); Hackett et al. (1987); Yamashita et al. (2018).However, for heavy vehicles, according to S€oderblom et al.; S€oderblom(2012), their influence is smaller and more local, with changes appearingaround the wheel wake region and in the lower part of the base wake,with some upwash being created near the centerline. In their study, theselocal changes had no impact on the rest of the rear wake, nor on drag.Still, the presence of a ground simulation system has shown to be ofsignificance for the Reynolds behavior, Baker and Brockie (1991); Burginet al. (1986); Sardou (1986). The present study provides experimentaldata from highly detailed COE models obtained in a wind tunnel fittedwith a moving ground under flow conditions shown to be in the Reynoldsnumber independent range. Furthermore, it provides useful insight onthe drag behavior of the system and on the areas of the truck which areaffected when inter-vehicle distance (IVD), lateral offset, and yaw angleare varied. As the experimental facility used had limited possibilities ofperforming measurements on the flow, Computational Fluid Dynamics(CFD) simulations were conducted as an addition to the analysis.
2. Method
This section describes the wind tunnel facilities, the models, theexperimental setup, and the CFD methodology used to complement theanalysis of the results.
2.1. Wind tunnel
The facility used in this study was the Volvo Cars Aerodynamic windtunnel. It is a slotted wall wind tunnel with a slot open area ratio of 30%and a cross-sectional area of 27.1m2, yielding a blockage of 1.07% for asingle truckmodel at zero yaw. The tunnel is also equipped with a groundsimulation and a boundary layer control system. The boundary layercontrol system consists of a scoop suction, distributed suction as well astangential blowing behind each of the five belts of the ground simulationsystem. The distributed suction, through more than 100 000 holesperforated in the floor, prevents a boundary layer build-up, and is splitinto two parts. The first part, between the scoop and the turntable,consists of a perforated floor with an open area ratio of 8.9%. The secondpart, with an open area ratio of 4.5%, is mounted on the turntabletogether with the moving belts and the tangential blowers. The five-beltsystem consists of four wheel drive units and a center belt. The center beltis 5.3m long and 1mwide and is approximately twice as long and wide asthe truck model (see model dimensions on the next section). The forcesare measured through an underfloor balance and the repeatability of themeasurements is roughly 0.5% of a single isolated truck drag. The forces
2
are averaged over 20s, as this is the standard procedure in the windtunnel. As a higher velocity and smaller scale than normal is used in thisstudy, this should be sufficient. An outline of the wind tunnel test sectionand the ground simulations system is shown in Fig. 1, where the lightgreen area is the space which was occupied by vehicles during the testwhile varying inter-vehicle distance (IVD), lateral offset and yaw. The redfilled rectangle represents the model that was attached to the balance andthe two outlined blanked rectangles exemplify the model moved aroundto create the platoon. Considering these limitations, a maximum of 30mIVD and 5-degree yaw angle were investigated. This yaw value iscommonly used in truck development as the drag coefficient measured at5� is a good approximation of a wind averaged drag for a COE tractor-trailer combination. Normally, the deviation between the 5-degree yawdrag value and the wind averaged drag value, as defined in J1252 (Rev.August 2012), is about 1% for this vehicle combination.
For more information on the wind tunnel, its ground simulationsystem, and flow quality, see Stern�eus et al. (2007) and Ljungskog(2019).
2.2. Test objects
Themodels used in this study, seen in Fig. 2, were a slightly simplified1/6th scale cab over engine (COE) tractor combined with a three-axlesemi-trailer. Both tractors were equipped with rolling wheels, however,only one model had a coating on the wheels and could be driven by thecenter belt. This model, termed as the measurement model, was keptfixed during the tests. This was the only possible alternative consideringthe number of configurations planned, the tunnel availability for thiscampaign and the long time necessary to place the measurement modelsafely in position on the belt (approximately 8 h). The second model,with stationary wheels, is referred to as the dummy model and wasmoved around to change both IVD and lateral offset. The tractors of eachvehicle had fairly detailed engine bays where the engine and gearboxwere simplified to only the larger parts with no cabling, see Fig. 2b. Thecooling package consisted of a mesh and a honeycomb setup.
The measurement model had a trailer equipped with a detailed un-dercarriage as shown in Fig. 2c, while the trailer of the dummy modelhad a slightly simplified undercarriage, which consisted of a box withadded half disks as wheels and skirts. Although the differences in theundercarriage and the non-rotating wheel condition of the dummymodelcould cause local variations in the flow close to the ground and affect thedrag of the vehicle, these were not possible to quantify and assumed notto have any major impact on the results of the platoon as a system. In thisstudy, the function of the dummy model was to create a blockage effect,and thereby change the pressures in front or behind the measurementmodel, rather than to guarantee the same drag and flow structures.Additionally, it is reasonable to expect that in real situations, vehiclestraveling in a platoon will not be exactly alike, and that the main aero-dynamic gains will come from themodels being in close proximity, ratherthan from specific details of the undercarriages.

Fig. 2. Models used in this study and relevant dimensions. A ¼ 2.720m, B ¼ 667 mm, C ¼ 0.467m, D ¼ 2.250, E ¼ 0.625m, F ¼ 0.433m.
J. T€ornell et al. Journal of Wind Engineering & Industrial Aerodynamics 213 (2021) 104596
The measurement model was instrumented with time-resolvingpressure sensors while the dummy model had mean pressure sensors.Fig. 3 shows the location of the pressure taps, and the colors represent thedifferent surfaces for mean pressures. As the front corners are very sen-sitive to separation, it was decided not to add pressure taps on them. Thepressure was, however, measured on the sides and roof, just behind theradii, but are used here to infer the pressure trends on the radii. Addi-tionally, the taps were placed above the height of local influences of theflow from the undercarriage and the wheel rotation.
The models have a frontal area of 0.28 m2.
2.3. Experimental setup
The models required a customized mounting solution and experi-enced personnel to guarantee proper safety when placed on the movingbelt. As the measurement model and center belt were not strong enoughto support the full weight of the model, it had to be suspended from theroof of the wind tunnel. This was done by fastening two 6mm steel cablesto a beam in the ceiling of the slotted wall test section. To constrain thetruck in the ground plane, four 6 mm steel cables were attached from thetrailer of the model to the restraint posts of the wind tunnel which areusually attached to the floor of the vehicle being tested, see Fig. 4. Theseposts are connected to the balance allowing for the forces to be measuredon the model. The holding cables have a frontal area of roughly 0.025m2,with most of the area coming from the two attaching the model to theceiling. It is expected that about half of the drag force exerted on them isexperienced by the balance. Although the cables will have some impact
Fig. 3. Pressure t
3
on the absolute values measured on the model, their effect is likely to besmall and will be here neglected. Additionally, as the present work fo-cuses on drag delta trends, these should not be influenced by the presenceof the cables, as they are mostly outside the area which will be affected bythe vehicle in front or behind. Furthermore, the rolling resistance of thewheels was removed by spinning up the center-belt to the correct speedwith the wind off and the balance was then tared. This should remainaccurate even if the model moves slightly due to lift forces as the wheelsare floating and only attached to the truck via a pivot.
The dummy model was attached to the floor of the wind tunnel by 6mm cables to existing mounting holes and when placed above the center-belt, it was supported under the wheels by a 20 mm thick beveled beamto avoid damage to the center belt. This slight change in height of thedummy model could potentially have a small effect on the results, but ishere neglected as there was no other possible way to mount it.
For all configurations, all five belts were run at the correspondingwind speed to minimize the force on the wheel-drive units, as these wereattached to the balance. The boundary layer control system was run intwo different modes based on if the dummy model was in front of orbehind the measurement model. When the dummymodel was behind themeasurement model, the suction scoop and distributed suction systemwere turned on, when the dummymodel was in front of the measurementmodel, the distributed suction system was turned off as the dummymodel was placed on top of the distributed suction system itself. Thetangential blowing system was turned off for all tests to simplify futurecomparisons with numerical simulations. Fig. 5 shows the different po-sition parameters that were varied during the experiment. As can be seen,
ap locations.
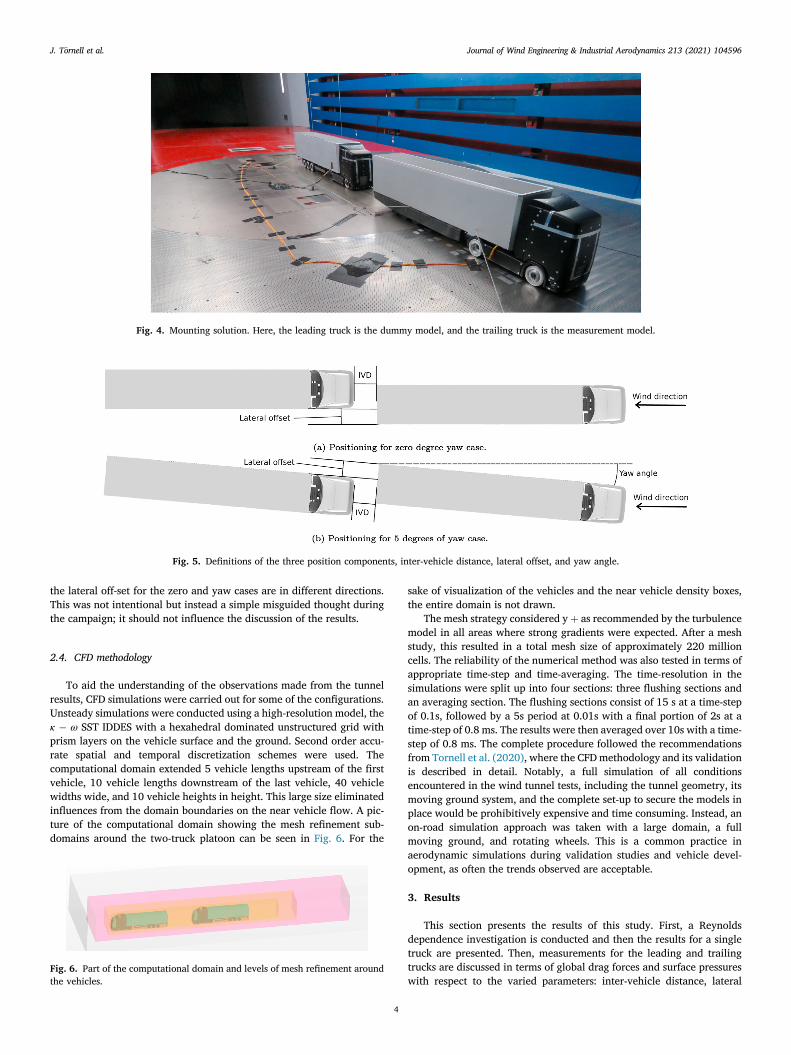
Fig. 4. Mounting solution. Here, the leading truck is the dummy model, and the trailing truck is the measurement model.
Fig. 5. Definitions of the three position components, inter-vehicle distance, lateral offset, and yaw angle.
J. T€ornell et al. Journal of Wind Engineering & Industrial Aerodynamics 213 (2021) 104596
the lateral off-set for the zero and yaw cases are in different directions.This was not intentional but instead a simple misguided thought duringthe campaign; it should not influence the discussion of the results.
2.4. CFD methodology
To aid the understanding of the observations made from the tunnelresults, CFD simulations were carried out for some of the configurations.Unsteady simulations were conducted using a high-resolution model, theκ � ω SST IDDES with a hexahedral dominated unstructured grid withprism layers on the vehicle surface and the ground. Second order accu-rate spatial and temporal discretization schemes were used. Thecomputational domain extended 5 vehicle lengths upstream of the firstvehicle, 10 vehicle lengths downstream of the last vehicle, 40 vehiclewidths wide, and 10 vehicle heights in height. This large size eliminatedinfluences from the domain boundaries on the near vehicle flow. A pic-ture of the computational domain showing the mesh refinement sub-domains around the two-truck platoon can be seen in Fig. 6. For the
Fig. 6. Part of the computational domain and levels of mesh refinement aroundthe vehicles.
4
sake of visualization of the vehicles and the near vehicle density boxes,the entire domain is not drawn.
The mesh strategy considered y þ as recommended by the turbulencemodel in all areas where strong gradients were expected. After a meshstudy, this resulted in a total mesh size of approximately 220 millioncells. The reliability of the numerical method was also tested in terms ofappropriate time-step and time-averaging. The time-resolution in thesimulations were split up into four sections: three flushing sections andan averaging section. The flushing sections consist of 15 s at a time-stepof 0.1s, followed by a 5s period at 0.01s with a final portion of 2s at atime-step of 0.8 ms. The results were then averaged over 10s with a time-step of 0.8 ms. The complete procedure followed the recommendationsfrom Tornell et al. (2020), where the CFDmethodology and its validationis described in detail. Notably, a full simulation of all conditionsencountered in the wind tunnel tests, including the tunnel geometry, itsmoving ground system, and the complete set-up to secure the models inplace would be prohibitively expensive and time consuming. Instead, anon-road simulation approach was taken with a large domain, a fullmoving ground, and rotating wheels. This is a common practice inaerodynamic simulations during validation studies and vehicle devel-opment, as often the trends observed are acceptable.
3. Results
This section presents the results of this study. First, a Reynoldsdependence investigation is conducted and then the results for a singletruck are presented. Then, measurements for the leading and trailingtrucks are discussed in terms of global drag forces and surface pressureswith respect to the varied parameters: inter-vehicle distance, lateral

J. T€ornell et al. Journal of Wind Engineering & Industrial Aerodynamics 213 (2021) 104596
offset, and yaw. Results from CFD simulations are added to complementthe analysis. Finally, the drag of the combined system is examined. Allforces have been normalized toward an isolated truck with correspond-ing wind tunnel conditions. That is, the leading truck forces have beennormalized toward a single truck with the distributed suction on, thetrailing truck forces toward a single truck with the distributed suction off,and when at yaw conditions they have been normalized toward a singletruck in yaw conditions. For the Reynolds sweep study, the forces havebeen normalized toward the forces at the highest Reynolds number.Throughout the paper, all IVDs and lateral offsets are expressed in full-scale equivalent distances.
3.1. Reynolds number dependence
To validate the results, several Reynolds sweeps were performedduring the study (the Reynolds number, Re, is based on the square root ofthe frontal area). The results are seen in Fig. 7. They show that for a singletruck and for a two-truck platoon at zero yaw conditions, the truck’s dragpractically does not change with an increase in Re. However, when a yawcondition is applied, the system becomes very sensitive to a change inReynolds numbers below roughly 1.5e6. From 1.7e6 to 1.9e6, almost nochange in drag is observed for any cases (0.05–0.8%). Therefore, thefollowing data presented in this paper are for configurations performed ata Re of 1.9e6.
The strong Re dependence of the drag under yaw conditions is mostlikely caused by a detachment of the flow at the leeward corner of thetractor as indicated by the large change in pressure seen in Fig. 8, abehavior that has also been noted by Cooper (1985). The reason for thisbehavior being present only under yaw conditions is most likely that theradius of the front corners are close to their critical Re and a small yawangle therefore causes detachment as the air has to be deflected to agreater degree. This can also be inferred by the time-resolved behavior ofa point just behind the leeward radius seen in Fig. 9, where a reduction ofhigher frequency fluctuations is observed as the Re increases from1.1*106 to 1.3*106. It is believed that the Re dependent behaviormeasured in this study is likely due to the sensitive nature of COE truckswhen compared to North American style trucks, and potentially due tothe addition of ground simulation as shown by Burgin et al. (1986).
3.2. Single truck
The results for a single truck are presented as a reference, Fig. 11.They were obtained with the measurement model with full groundsimulation conditions to normalize the drag for the leading truck andwith the moving belt on and the distributed suction off to normalize thedrag for the trailing truck in the platoon scenario. The drag coefficient atzero yaw was 0.545 and was 0.606 at 5� yaw with full moving groundsimulation. Fig. 10 shows the pressure distribution at the base of the
Fig. 7. CD versus Reynolds number, legend denotes ”Inter-vehicle distance, yaw anglevelocity of that configuration.
5
truck for zero and 5� yaw. The scale was chosen to allow comparisonswith the leading truck in a platoon. As it will be seen later in section3.3.1, the base pressures for a single truck are lower.
A frequency analysis, illustrated in Fig. 12, reveals that there are twodominant frequencies in the wake that correspond well with the fre-quencies at the sides of the tractor. These frequencies are believed to bemodel specific and their cause could not be determined. Frequencies withsimilar Strouhal numbers can be seen in the drag signal of the CFDsimulations as well. They are not believed to be acoustic noise from themain fan of the wind tunnel as that noise is expected to have a signifi-cantly higher frequency.
3.3. Two-truck platoon
To map the behavior of the system, forces were measured on themodel that was placed on the belt for all configurations. As mentioned,this measurement model functioned as the leading or trailing truckdepending on the position of the dummy vehicle.
3.3.1. Leading truck
3.3.1.1. Force measurements. The plots in Fig. 13, show that the trendsare similar between a zero yaw and a 5-degree yaw case. At zero yaw, thedrag of the leading truck decreases with a decreasing inter-vehicle dis-tance down to 2m, where it then increases slightly as the distance isreduced further to 0.5m. It can also be seen that the largest changes indrag occur between IVDs of 3m–15m. The leading truck is not sensitive tolateral offset when the IVD is greater than 7.5m. However, at shorterdistances some sensitivity develops and becomes particularly large at anIVD of 0.5m.
For 5� yaw, the biggest reduction in drag is seen from 3m to 12.5m.The changes in between distances are generally less than those of the zeroyaw case, and CD does not increase as the distance varies from 2m to0.5m, when no lateral offset is applied. The leading truck is practicallyunresponsive to lateral offset, except for an IVD of 0.5m where changesare apparent. Due to wind tunnel time limitations, only a few configu-rations with 1m offset and at low IVDs could be measured, and they allindicate an increase in drag.
To understand this behavior, plots of the surface pressure measured inthe tunnel and flow field pictures from numerical simulations are pre-sented next.
3.3.1.2. Pressure measurements and CFD results. For the leading truck, themost significant changes in pressure occur at the base of the trailer.
Fig. 14 shows the average Cp and as expected, it corresponds well withthe changes in drag seen in Fig. 13, that is, an increase in the basepressure leads to a decrease in drag, and vice-versa. Furthermore, the
, position of truck”. Normalized CD is defined as CD divided by CD for the highest

Fig. 8. Cp minus Cp at Re ¼ 1.9*106 versus Reynolds number for a point behind the leeward corner of the tractor.
Fig. 9. Frequency spectra at a point behind the leeward corner for the leading truck at a 0.5m IVD and 5� yaw.
Fig. 10. Base Cp distribution for a single truck and full ground simulation conditions.
J. T€ornell et al. Journal of Wind Engineering & Industrial Aerodynamics 213 (2021) 104596
same behavior can be observed when a lateral offset is applied where alower base pressure, especially at an IVD of 0.5m, leads to a higher drag.The reason for these changes is a high-pressure region emanated from thestagnation area of the trailing truck. This is apparent in the plots ofFig. 15, obtained from CFD simulations.
From 20m to 10m, the leading vehicle experiences an increase in basepressure due to the closer proximity of the following truck, Fig. 15c andd. The slower improvement in drag at lower IVDs appears to be due to adecreased pressure at the front of the trailing truck, Fig. 15b, thusreducing the effective pressure at the base of the leading vehicle. At veryshort distances, a change in flow structures occurs, from the two vehicles
6
operating independently, to them operating as a short cavity, similar to atractor-trailer gap. In such situations, a vortex pair is often formed,lowering the pressure in the gap and thus reducing the base pressure andincreasing drag. This is visible in Fig. 16 and confirms what has beenshown in previous studies, Allan (1981); €Osth and Krajnovic (2012).
Fig. 17 shows the distributed pressure on the base of the leadingtruck. For the no offset cases, figures a–f, the pressure increases graduallyand becomes more uniform as the IVD decreases. The base pressure isgenerally lower when yaw conditions are present, figures d–f, and thereis some asymmetry at high IVDs. For IVDs of 5m and above, the changesare minimal when an offset is applied (for example, Fig. 17b–h and

Fig. 11. Velocity magnitude plots obtained with CFD for zero yaw conditions with in-plane streamlines at y ¼ 0 and z ¼ 2.5m from the ground (approximately centerof the trailer).
Fig. 12. Frequency spectra at the front corner and base of an isolated truck.
Fig. 13. Normalized CD of the leading truck versus inter-vehicle distance with and without lateral offset.
Fig. 14. Average base CP for the leading truck versus inter-vehicle distance with and without lateral offset.
J. T€ornell et al. Journal of Wind Engineering & Industrial Aerodynamics 213 (2021) 104596
Fig. 17f-l). However, for the 0.5m cases, a large change in the basepressure distribution is seen. An area of low pressure appears on one sideof the base: right side at zero yaw, Fig. 17g, and left side at 5� yaw,
7
Fig. 17j. This is because the offset direction is different for the yaw and noyaw cases. These results confirm that the main effect of drag reduction forthe leading truck is the pressure area emanating from the trailing truck

Fig. 15. Time-averaged Cp distribution in between vehicles at z ¼ 2.5m. Results obtained from CFD simulations.
Fig. 16. Velocity magnitude with in-plane streamlines at z ¼ 2.5m for IVD ¼0.5m showing the counter rotating vortices in the gap between the vehicles.Results obtained from CFD simulations.
J. T€ornell et al. Journal of Wind Engineering & Industrial Aerodynamics 213 (2021) 104596
(Fig. 15) creating a higher and more uniform pressure at the base as theIVD decreases. The same phenomenon explains the relative insensitivityto lateral offset: The pressure in front of the stagnation area of the trailingtruck is strongly linked to the distance between vehicles, yielding a lowersensitivity to lateral offset at larger IVDs. At very short distances, moreeffects influence the drag behavior, the lateral offset generates an areasimilar to a backward-facing step, thus reducing the pressure on the sidewithout the blockage behind it.
Results of the unsteady pressure measurements on the base of theleading truck show the same dominant frequency at various IVDs, shownin Fig. 18. At lower IVDs, however, this frequency becomes less dominantand a broader spectrum is observed. This can indicate that the wake ofthe leading truck becomes more constrained. A new broad frequencypeak is seen for an IVD of 0.5m which could suggest a change in flowbehavior; this change in flow behavior can be seen between the vehiclesin Fig. 23a-c where the wake changes into a vortex pair.
3.3.2. Trailing truck
3.3.2.1. Force measurements. Fig. 19 shows the normalized drag for thetrailing truck. Due to the length of the wind tunnel test section and thelimitations in the experimental setup, inter-vehicle distances werelimited to a maximum of 5mwhenmeasuring forces for the trailing truck.
8
For these short distances, a continuous decrease in drag with decreasingIVD is seen for both yaw cases. At zero yaw, the trailing vehicle is notvery sensitive to offset, although a small increase in drag could bemeasured.
The benefits of platooning for the trailing vehicle are smaller at 5�
yaw, as is evident at 5m IVD where the normalized drag is close to unitywithout offset. Compared to zero yaw, a larger sensitivity to lateral offsetis observed. The effect is positive, with the vehicle experiencing less drag.It is to be noted, however that in previous CFD studies by Tornell et al.(2020), an increase in drag for the trailing was calculated as the IVDdecreased from 20m to 5m, after which, the same behavior as in the windtunnel was found. This is similar to the observations of McAuliffe andAhmadi-Baloutaki (2018, McAuliffe and Ahmadi-Baloutaki, 2019; Salariand Ortega (2018); Lammert et al. (2017) for North American styletrucks.
3.3.2.2. Pressure measurements and CFD results. For the trailing truck, therelevant changes in pressure occur around the tractor. Figs. 20 and 21present, respectively, the mean pressure and the pressure distribution forthe various conditions investigated. The values were measured withmean pressure sensors as they were obtained with the dummy model toallow for long IVDs (see Fig. 1). The mean Cp at the front face, Fig. 20aand b, decreases continuously as the IVD decreases for all lateral offsets.This reduction in pressure, confirmed by Figs. 15 and 21, is due to a loweroncoming velocity toward the trailing truck as a result of the wake of thevehicle in front, as shown in Fig. 23. For zero yaw and without a lateraloffset, Fig. 21a-c, the pressure at the front face of the truck has a fairlyuniform distribution, especially at very low IVDs. When a 0.5m lateraloffset is introduced, the pressure becomes less uniform and as the truckmoves away from the wake of the leading vehicle, the mean pressureincreases slightly, except at an IVD ¼ 0.5m. At yaw conditions the sametrend toward a less uniform pressure is seen, however with no apparentincrease in themean Cp curve, Fig. 20b, as in this case, the trailing truck ismoved into the wake. This difference between the zero yaw and 5-degreeyaw cases is believed to be due to the fact that the trailing truck is movedinto the wake in the 5� yaw case and out of the wake in the zero degreeyaw case (see Fig. 5).
The surface averaged pressures on the sides and roof, Fig. 20c–g and20i, show a reversed trend to that of the pressure on the front face. This isexpected as a decrease in the oncoming velocity at low IVDs will yieldreduced acceleration around these corners. This is confirmed by the CFDresults in Fig. 23 for four inter-vehicle distances.
There is, however, a visible difference between the right and leftcorners of the truck as an offset is applied where the exposed corner, leftfor zero yaw and right for 5� yaw, experiences a lower pressure. Theshielded corners see a slight increase in pressure or no change at greaterIVDs, but a reduction at short IVDs. The Cp on the exposed corner doesnot change significantly as the IVD decreases below 5m for a 0.5m offset.

Fig. 17. Base CP of the leading truck, a-f is with 0m offset and g-l is with 0.5m offset. The values denote ”inter-vehicle distance, yaw angle”.
Fig. 18. Frequency spectra at a point on the middle right edge of the base. Leading truck, no offset, zero yaw.
Fig. 19. Normalized CD of the trailing truck versus inter-vehicle distance with and without lateral offset.
J. T€ornell et al. Journal of Wind Engineering & Industrial Aerodynamics 213 (2021) 104596
This is in contrast with the behavior when no lateral offset is present. Thisdiscrepancy could potentially be explained by a fairly straight shear layerof the wake interacting with the trailing truck forming a stable flowstructure at the front as the IVD decreases further.
Looking at the tractor-trailer gap, see Fig. 20h and j, the mean Cp staysnearly constant down to an IVD of 15m where a slight increase is seen asthe IVD becomes shorter. This rise in pressure is apparent in Fig. 15 andhas been shown in a previous study by Tornell et al. (2020) to increasethe drag and be caused by both a lower oncoming flow velocity as well as
9
a change in the flow angle at the front of the truck, thus reducing theefficiency of the roof deflector (Fig. 22). A similar trend is observed forthe 5-degree yaw case. In addition, practically no changes are noticeablewith an added lateral offset.
All these effects combined produce the changes in drag for the trailingtruck where an increase in pressure yields an increase in drag. For IVDslower than 5m, the variations in drag are dominated by the changes inpressure at the front face of the truck. The decrease in drag with lateraloffset at 5� yaw can be explained by the reduction in pressure on the

Fig. 20. Average CP on the different surfaces on the front of the trailing truck versus IVD with and without lateral offset.
Fig. 21. Tractor CP of the trailing truck, a-f is with 0m offset and g-l is with 0.5m offset. The values denote ”inter-vehicle distance, yaw angle”.
10
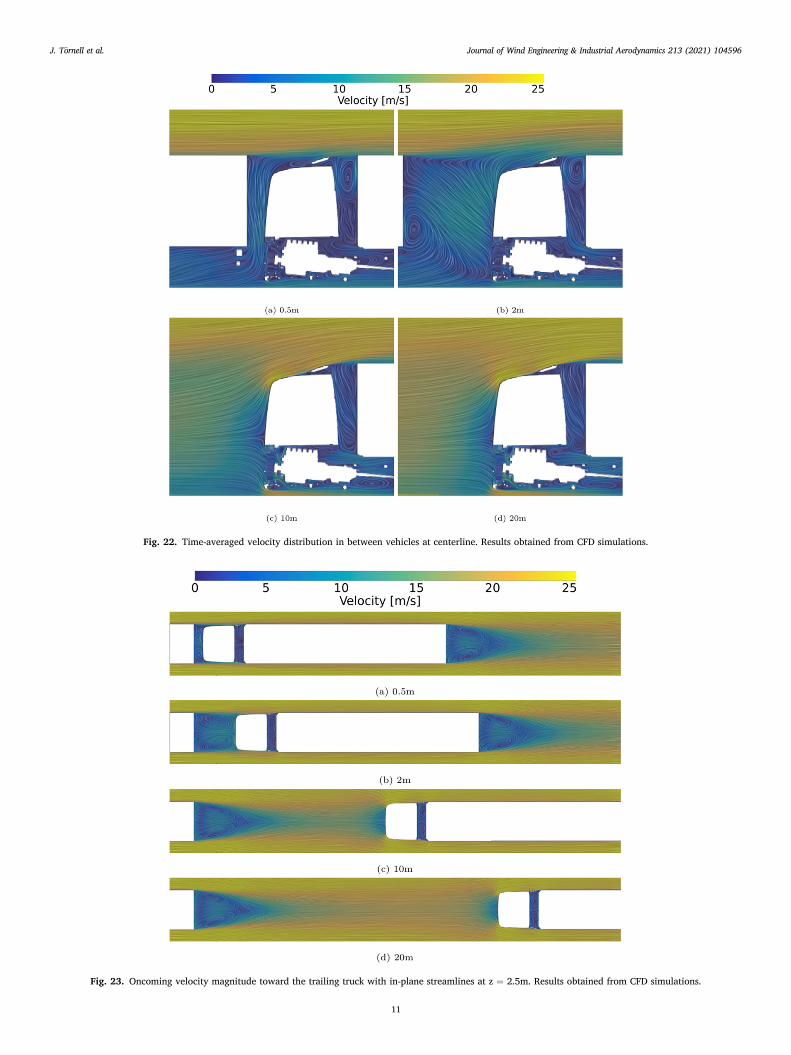
Fig. 22. Time-averaged velocity distribution in between vehicles at centerline. Results obtained from CFD simulations.
Fig. 23. Oncoming velocity magnitude toward the trailing truck with in-plane streamlines at z ¼ 2.5m. Results obtained from CFD simulations.
J. T€ornell et al. Journal of Wind Engineering & Industrial Aerodynamics 213 (2021) 104596
11
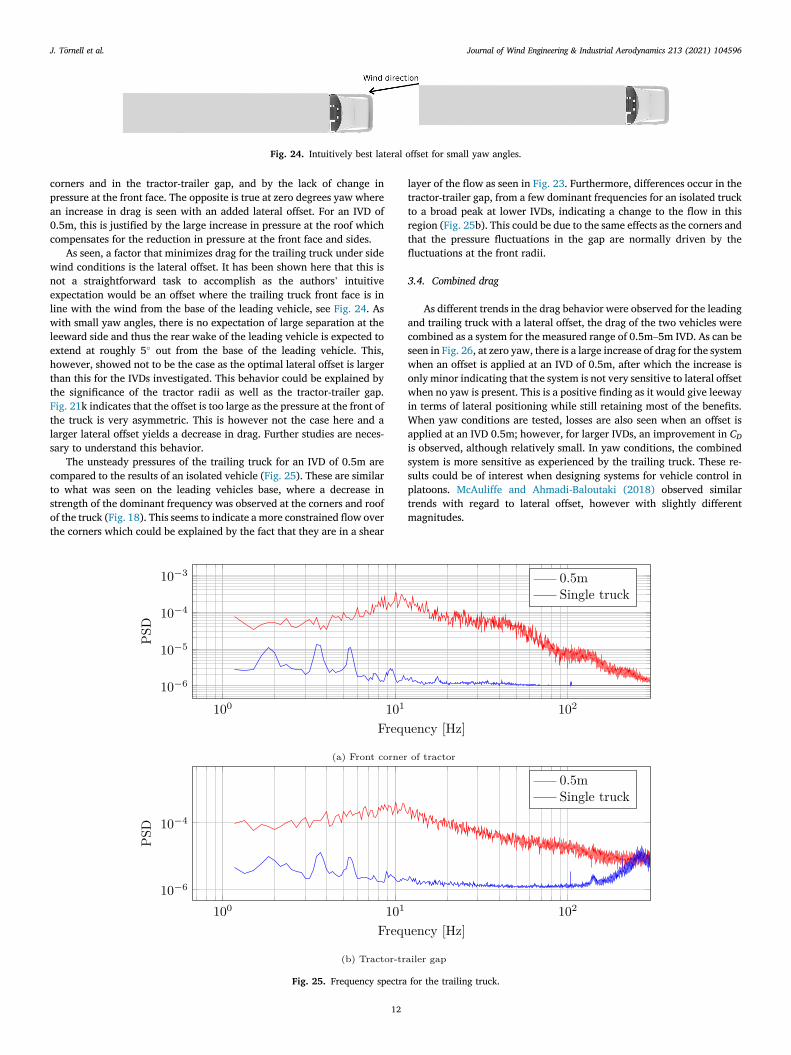
Fig. 24. Intuitively best lateral offset for small yaw angles.
J. T€ornell et al. Journal of Wind Engineering & Industrial Aerodynamics 213 (2021) 104596
corners and in the tractor-trailer gap, and by the lack of change inpressure at the front face. The opposite is true at zero degrees yaw wherean increase in drag is seen with an added lateral offset. For an IVD of0.5m, this is justified by the large increase in pressure at the roof whichcompensates for the reduction in pressure at the front face and sides.
As seen, a factor that minimizes drag for the trailing truck under sidewind conditions is the lateral offset. It has been shown here that this isnot a straightforward task to accomplish as the authors’ intuitiveexpectation would be an offset where the trailing truck front face is inline with the wind from the base of the leading vehicle, see Fig. 24. Aswith small yaw angles, there is no expectation of large separation at theleeward side and thus the rear wake of the leading vehicle is expected toextend at roughly 5� out from the base of the leading vehicle. This,however, showed not to be the case as the optimal lateral offset is largerthan this for the IVDs investigated. This behavior could be explained bythe significance of the tractor radii as well as the tractor-trailer gap.Fig. 21k indicates that the offset is too large as the pressure at the front ofthe truck is very asymmetric. This is however not the case here and alarger lateral offset yields a decrease in drag. Further studies are neces-sary to understand this behavior.
The unsteady pressures of the trailing truck for an IVD of 0.5m arecompared to the results of an isolated vehicle (Fig. 25). These are similarto what was seen on the leading vehicles base, where a decrease instrength of the dominant frequency was observed at the corners and roofof the truck (Fig. 18). This seems to indicate a more constrained flow overthe corners which could be explained by the fact that they are in a shear
Fig. 25. Frequency spectra
12
layer of the flow as seen in Fig. 23. Furthermore, differences occur in thetractor-trailer gap, from a few dominant frequencies for an isolated truckto a broad peak at lower IVDs, indicating a change to the flow in thisregion (Fig. 25b). This could be due to the same effects as the corners andthat the pressure fluctuations in the gap are normally driven by thefluctuations at the front radii.
3.4. Combined drag
As different trends in the drag behavior were observed for the leadingand trailing truck with a lateral offset, the drag of the two vehicles werecombined as a system for the measured range of 0.5m–5m IVD. As can beseen in Fig. 26, at zero yaw, there is a large increase of drag for the systemwhen an offset is applied at an IVD of 0.5m, after which the increase isonly minor indicating that the system is not very sensitive to lateral offsetwhen no yaw is present. This is a positive finding as it would give leewayin terms of lateral positioning while still retaining most of the benefits.When yaw conditions are tested, losses are also seen when an offset isapplied at an IVD 0.5m; however, for larger IVDs, an improvement in CD
is observed, although relatively small. In yaw conditions, the combinedsystem is more sensitive as experienced by the trailing truck. These re-sults could be of interest when designing systems for vehicle control inplatoons. McAuliffe and Ahmadi-Baloutaki (2018) observed similartrends with regard to lateral offset, however with slightly differentmagnitudes.
for the trailing truck.

Fig. 26. Combined drag of the platoon of two trucks. The forces of the two trucks were added and normalized with the sum of the appropriate values for eachconfiguration.
J. T€ornell et al. Journal of Wind Engineering & Industrial Aerodynamics 213 (2021) 104596
4. Conclusions
In this paper, the aerodynamic behavior of cab over engine (COE)style tractor-trailer combinations in close proximity were studiedexperimentally in a wind tunnel fitted with a moving ground system.Effects of inter-vehicle distance, lateral offset, and yaw were considered.To enhance the understanding of the flow phenomena, CFD simulationswere performed for several of the configurations investigated experi-mentally. The main observations from this work are the following:
4.1. Leading truck
● For the yaw angles and lateral offset investigated, the drag of theleading truck decreases with a shorter inter-vehicle distance down to2m, after which an increase is seen. The improvement in drag is dueto a higher base pressure caused by the presence of a vehicle behindit. At very low IVDs, a decreased pressure at the front of the trailingtruck reduces the effective pressure at the base of the leading vehicle,causing its drag to go up.
● The leading truck is not very sensitive to lateral offset except at verylow IVDs. This is because the pressure in front of the stagnation areaof the trailing truck is strongly linked to the distance between vehi-cles, yielding a lower sensitivity to lateral offset at larger IVDs.
● The changes in drag are dominated by the changes in the basepressure.
4.2. Trailing truck
● For the inter-vehicle distances possible to measure in the wind tunnel,the drag of the trailing truck showed a gradual decrease as the IVDchanged from 5m to 0.5m. This is because the truck experiences areduction in stagnation pressure.
● The trailing truck has a complex behavior and is sensitive to thepressure changes on the front face and radii of the tractor as well asthe tractor-trailer gap with variations in IVD and lateral offset.
● At low IVDs, an increase in pressure in the tractor-trailer gap, radii,and roof of the tractor which affects drag negatively.
4.3. Combined system
Yaw conditions reduce the efficiency of the platoon. It is important toensure Reynolds independence when performing measurements in awind tunnel, especially when studying the system under yaw conditions.The present work has shown that measurements taken at low Re valuescan yield different drag deltas compared to those taken at a Re number inthe Reynolds independent regime. Low sensitivity to lateral offset wasobserved, with some small drag improvements noticed at yaw conditions.
13
CRediT authorship contribution statement
Johannes T€ornell: Conceptualization, Methodology, Software,Validation, Formal analysis, Investigation, Data curation, Writing –
original draft, Visualization. Simone Sebben: Conceptualization, Meth-odology, Resources, Writing – review & editing, Supervision, Projectadministration, Funding acquisition. Per Elofsson: Conceptualization,Methodology, Investigation, Resources, Writing – review & editing, Su-pervision, Project administration, Funding acquisition.
Declaration of competing interest
The authors declare that they have no known competing financialinterests or personal relationships that could have appeared to influencethe work reported in this paper.
Acknowledgements
This work has been funded by the Swedish Energy Agency, grantnumber P44930-1, models were built by Scania CV and the experimentswere performed at the Volvo Car Corporation wind tunnel. The simula-tions were performed on resources provided by the Swedish NationalInfrastructure for Computing (SNIC) at the National SupercomputingCentre Sweden (NSC) and Chalmers Centre for Computational Scienceand Engineering (C3SE).
References
●●● Allan, J., 1981. Aerodynamic drag and pressure measurements on a simplifiedtractor-trailer model. J. Wind Eng. Ind. Aerod. 9 (1), 125–136.
Baker, C., Brockie, N., 1991. Wind tunnel tests to obtain train aerodynamic dragcoefficients: Reynolds number and ground simulation effects. J. Wind Eng. Ind.Aerod. 38 (1), 23–28.
Blocken, B., Toparlar, Y., van Druenen, T., Andrianne, T., 2018a. Aerodynamic drag incycling team time trials. J. Wind Eng. Ind. Aerod. 182, 128–145.
Blocken, B., van Druenen, T., Toparlar, Y., Malizia, F., Mannion, P., Andrianne, T.,Marchal, T., Maas, G.-J., Diepens, J., 2018b. Aerodynamic drag in cycling pelotons:new insights by cfd simulation and wind tunnel testing. J. Wind Eng. Ind. Aerod. 179,319–337.
Burgin, K., Adey, P., Beatham, J., 1986. Wind tunnel tests on road vehicle models using amoving belt simulation of ground effect. J. Wind Eng. Ind. Aerod. 22 (2), 227–236special Issue 6th Colloquium on Industrial Aerodynamics Vehicle Aerodynamics.
Cooper, K.R., 1985. The effect of front-edge rounding and rear-edge shaping on theaerodynamic drag of bluff vehicles in ground proximity. SAE Trans. 94, 727–757.URL. http://www.jstor.org/stable/44467612.
Ebrahim, H., Dominy, R., 2020. Wake and surface pressure analysis of vehicles in platoon.J. Wind Eng. Ind. Aerod. 201, 104144.
Fletcher, C., Stewart, G., 1986. Bus drag reduction by the trapped vortex concept for asingle bus and two buses in tandem. J. Wind Eng. Ind. Aerod. 24 (2), 143–168.
Hackett, J.E., Williams, J.E., Baker, J.B., Wallis, S.B., feb, 1987. On the influence ofground movement and wheel rotation in tests on modern car shapes. In: SAEInternational Congress and Exposition. SAE International.
Hammache, M., Michaelian, M., Browand, F., mar, 2002. Aerodynamic forces on truckmodels, including two trucks in tandem. In: SAE 2002 World Congress & Exhibition.SAE International.

J. T€ornell et al. Journal of Wind Engineering & Industrial Aerodynamics 213 (2021) 104596
Hong, P., Marcu, B., Browand, F., Tucker, A., feb, 1998. Drag forces experienced by two,full-scale vehicles at close spacing. In: International Congress & Exposition. SAEInternational.
Howell, J., Everitt, K., 1981. The underbody flow of an eds-type advanced groundtransport vehicle. J. Wind Eng. Ind. Aerod. 8 (3), 275–294.
J1252, Rev, August 2012. SAE wind tunnel test procedure for trucks and buses. SAEinternational surface vehicle recommended practice. SAE Standard J1252. URL.https://doi.org/10.4271/J1252_201207.
Jacuzzi, E., Granlund, K., 2019. Passive flow control for drag reduction in vehicleplatoons. J. Wind Eng. Ind. Aerod. 189, 104–117.
Lammert, M., Kelly, K., J, Y., 2017. Correlations of Platooning Track Test and WindTunnel Data. National Renewable Energy Laboratory.
Le Good, G., Resnick, M., Boardman, P., Clough, B., may 2018. Effects on theaerodynamic characteristics of vehicles in longitudinal proximity due to changes instyle. In: CO2 Reduction for Transportation Systems Conference. SAE International.
Le Good, G., Boardman, P., Resnick, M., Clough, B., apr 2019. An investigation ofaerodynamic characteristics of three bluff bodies in close longitudinal proximity. In:WCX SAE World Congress Experience. SAE International.
Li, C., Burton, D., Kost, M., Sheridan, J., Thompson, M.C., 2017. Flow topology of acontainer train wagon subjected to varying local loading configurations. J. Wind Eng.Ind. Aerod. 169, 12–29.
Ljungskog, E., 2019. Evaluation and Modeling of the Flow in a Slotted Wall Wind Tunnel.Doctoral thesis. Chalmers University.
Maleki, S., Burton, D., Thompson, M.C., 2019. Flow structure between freight traincontainers with implications for aerodynamic drag. J. Wind Eng. Ind. Aerod. 188,194–206.
Marcu, B., Browand, F., mar, 1999. Aerodynamic forces experienced by a 3-vehicleplatoon in a crosswind. In: International Congress & Exposition. SAE International.
McAuliffe, B.R., Ahmadi-Baloutaki, M., 2019 apr. An investigation of the influence ofclose-proximity traffic on the aerodynamic drag experienced by tractor-trailercombinations. SAE.Int. J. Adv. Curr. Pract.Mobil., 2019-01-0648
14
McAuliffe, B.R., Ahmadi-Baloutaki, M., jun 2018. A wind-tunnel investigation of theinfluence of separation distance, lateral stagger, and trailer configuration on the drag-reduction potential of a two-truck platoon. SAE. Int. J.Commerc.Veh 11, 125–150.
€Osth, J., Krajnovic, S., 2012. The flow around a simplified tractor-trailer model studied bylarge eddy simulation. J. Wind Eng. Ind. Aerod. 102, 36–47.
Salari, K., Ortega, J., apr 2018. Experimental investigation of the aerodynamic benefits oftruck platooning. In: WCX World Congress Experience. SAE International.
Sardou, M., 1986. “Reynolds effect” and “moving ground effect” tested in a quarter scalewind tunnel over a high speed moving belt. J. Wind Eng. Ind. Aerod. 22 (2), 245–270special Issue 6th Colloquium on Industrial Aerodynamics Vehicle Aerodynamics.
Schito, P., Braghin, F., apr 2012. Numerical and experimental investigation on vehicles inplatoon. SAE. Int. J.Commerc.Veh 5, 63–71.
S€oderblom, D., 2012. Wheel Housing Aerodynamics of Heavy Trucks. Doctoral thesis.Chalmers University.
S€oderblom, D., Elofsson, P., Hjelm, L., Lofdahl, L., apr 2012. Experimental and numericalinvestigation of wheel housing aerodynamics on heavy trucks. SAE. Int.J.Commerc.Veh, 2012-01-0106.
Stern�eus, J., Walker, T., Bender, T., apr 2007. Upgrade of the volvo cars aerodynamicwind tunnel. In: SAE World Congress & Exhibition. SAE International.
Tornell, J., Sebben, S., D, S., 2020. Influence of inter-vehicle distance on theaerodynamics of a two-truck platoon. Int. J. Automot. Technol. (Accepted forpublication.
Tsuei, L., Savas, €Omer, 2001. Transient aerodynamics of vehicle platoons during in-lineoscillations. J. Wind Eng. Ind. Aerod. 89 (13), 1085–1111.
Watkins, S., Vino, G., 2008. The effect of vehicle spacing on the aerodynamics of arepresentative car shape. J. Wind Eng. Ind. Aerod. 96 (6), 1232–1239, 5thInternational Colloquium on Bluff Body Aerodynamics and Applications.
Yamashita, T., Makihara, T., Saito, Y., Kato, C., Takayama, R., Takayama, T., Yamade, Y.,apr 2018. Effects of Moving Ground and Rotating Wheels on Aerodynamic Drag of aTwo-Box Vehicle.