Embed Size (px)
Citation preview

NASA TECHNICAL NOTE
¢"4
OO
|
ZI--
Z
NASA TN D-3822
EXPERIMENTAL INVESTIGATION
OF ACOUSTIC LINERS TO
SUPPRESS SCREECH IN
HYDROGEN-OXYGEN ROCKETS
by John P. Wanhainen, Harry E. Bloomer,
David IV. Vincent, and Jerome K. Curley
Lewis Research Center
Cleveland, Ohio
NATIONAL AERONAUTICS AND SPACE ADMINISTRATION • WASHINGTON, D. C. • FEBRUARY 1967
https://ntrs.nasa.gov/search.jsp?R=19670008175 2020-04-22T16:06:11+00:00Z


NASA TN D-3822
EXPERIMENTAL INVESTIGATION OF ACOUSTIC LINERS TO
SUPPRESS SCREECH IN HYDROGEN-OXYGEN ROCKETS
By John P. Wanhainen, Harry E. Bloomer,
David W. Vincent, and Jerome K. Curley
Lewis Research Center
Cleveland, Ohio
NATIONAL AERONAUTICS AND SPACE ADNINISTRATION
For sale by the Clearinghouse for Federal Scientific and Technical Information
Springfield, Virginia 22151 - Price $2.00


EXPERIMENTAL INVESTIGATIONOF ACOUSTIC LINERS TO
SUPPRESS SCREECH INHYDROGEN-OXYGEN ROCKETS
by John P. Wanhainen, Harry E. Bloomer,
David W. Vincent, and Jerome K. Curley
Lewis Research Center
SUMMARY
An investigation of suppression of high frequency combustion instability using
Helmholtz type acoustic damping devices was conducted at the Lewis Research Center in
a hydrogen-oxygen rocket of nominally 20 000-pound thrust size. Acoustic liner design
variables investigated include the number and the diameter of the apertures, the thick-
ness of the liner, the length of the liner, and the gap height behind the liner. The tests
were conducted at a chamber pressure (nominal) of 300 pounds per square inch absolute
and a range of oxidant-fuel ratios from 4 to 6. Hydrogen injection temperature was used
to rate the stability of the various liners. The liner with the lowest self-triggering tem-
perature was considered to be the most stable design.
High frequency combustion instability in hydrogen-oxygen engines of the size investi-
gated can be suppressed using a properly designed array of Helmholtz resonators. The
hydrogen temperature at which screech occurred could be reduced from 112 ° to less
than 60 ° R (minimum available) by incorporating an acoustic liner with a calculated ab-
sorption coefficient of 0.25 or greater. Analytical predictions based on acoustic theory
were in limited agreement with experimental results providing a flow past the apertures
of 0.2 free stream velocity was included in the calculation of absorption coefficient.
Liner cavity gas temperature varied from 600 ° to 1000 ° R during stable combustion de-
pending on the number of apertures and increased to 2000 ° R during screeching combus-
tion. A 17 percent partial length liner positioned at the injector end of the thrust cham-
ber had the same stability characteristics as the full length liner.
INTRODUCTION
Screech may be regarded as a state which exists when energy excitation exceeds
energy absorption. Accordingly, two approaches to eliminate screech are suggested,
(1) decrease acoustic energy generation or (2) increase acoustic absorption. The use of

acoustic liners represents oneapproachin increasing energy absorption and has the meritof probably being effective irrespective of the propellant combination. Becauseof theprobable universality of sucha solution, considerable effort hasbeenexpendedat theLewis ResearchCenter on acoustic liners (ref. 1).
The use,of acoustic liners of the Helmholtz type to suppress high frequency instabilityin combustionchambers hasbeen successfully demonstratedin ramjet and afterburningturbojet applications (refs. 2 to 4) andin rocket enginethrust chambers (refs. 5 and 6).However, the problem still exists of adaptingHelmholtz resonator theory to the conditionsin a screeching rocket engine. The purpose of this investigation was to determine theeffects of several designvariables on the absorption characteristics of multiple resonatorliners and incorporate these results in the developmentof a design procedure for liners.
The investigation reported herein was conductedin the Rocket EngineTest Facilityusing a liquid hydrogen-oxygenrocket which was 10.78 inches in diameter. The enginewas operatedat a chamber pressure of 300 poundsper square inch and produceda sealevel thrust of about20 000pounds. The effects of changesin liner designparameterswere evaluatedby ramping the hydrogeninjection temperature downinto screech anddetermining the improvement in hydrogentemperature stable operating limits. The con-figuration with the lowest self-triggering temperature was considered the most stabledesign. The rating criterion and the hydrogentemperature ramping techniquewere ob-tained from reference 7. The designvariables investigated included the number andthediameter of the apertures, the thickness of the liner, the length of the liner, and the gapheight behind the liner. The basic injector was selected to havepoor stability character-istics (a high screech transition hydrogentemperature) to provide a severe test for theliners. The designof the Helmholtz resonator arrays used in this investigation wasbasedon the work of Blackman (ref. 8) andIngaard (ref. 9) as modified by Pratt &Whitney Aircraft Corporation (unpublisheddata from G. E. Canuel).
SYMBOLS
Af amplitude parameter, sec/ft
a aperture spacing, in.
c velocity of sound for resonator, ft/sec
d aperture or orifice diameter, in.
f screech or design frequency, cps
fo liner resonator frequency, cps
g conversion factor, 32. 174 (Ibm) (ft)/(lbf) (sec 2)
2

L
left
O/F
Pi
Q
R
r d
r r
T
t
U
V
X o
X
An/
5
E
0
#
P
o"
cO
liner backing distance, in.
effective mass vibrating in neck of resonator, in.
oxidant-fuel ratio
pressure amplitude of incident wave (zero to peak), lbf/sq ft
bandwidth factor, dimensionless
gas constant, 1545 (lbm/S q ft)(cu ft)/(lbmole)(°R)
acoustic friction resistance, lbm/(S q ft)(sec)
acoustic radiation resistance, lbm/(S q ft)(sec)
gas temperature behind liner, OR
liner thickness, in.
flow velocity past orifice, ft/sec
flow velocity through orifice, ft/sec
particle displacement, in.
specific acoustic reactance ratio, dimensionless
absorption coefficient, dimensionless
nonlinear resistance term, in.
effective length correction factor, ft
nonlinear resistance parameter, dimensionless
specific acoustic resistance ratio, dimensionless
viscosity of fluid in volume of resonator, lbm/(Sec)(ft )
density of fluid in volume of resonator, lbm/CU ft
fraction of open area of resonator array, ud2/4a 2
design or screech frequency, rad/sec
Subscripts:
H 2 hydrogen
02 oxygen
o resonant
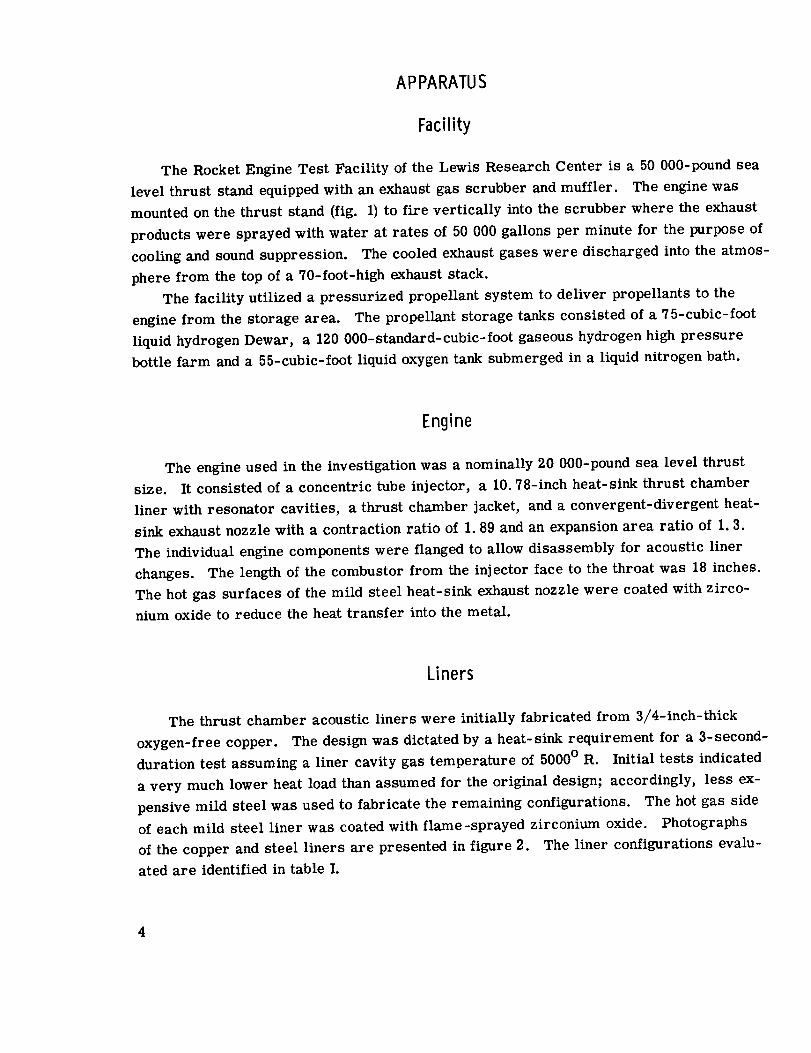
APPARATUS
Facility
The Rocket Engine Test Facility of the Lewis Research Center is a 50 000-pound sea
level thrust stand equipped with an exhaust gas scrubber and muffler. The engine was
mounted on the thrust stand (fig.1) to fireverticallyintothe scrubber where the exhaust
products were sprayed with water at rates of 50 000 gallons per minute for the purpose of
cooling and sound suppression. The cooled exhaust gases were discharged intothe atmos-
phere from the top of a 70-foot-high exhaust stack.
The facilityutilizeda pressurized propellant system to deliver propellants to the
engine from the storage area. The propellant storage tanks consisted of a 75-cubic-foot
liquidhydrogen Dewar, a 120 000-standard-cubic-foot gaseous hydrogen high pressure
bottlefarm and a 55-cubic-foot liquidoxygen tank submerged in a liquidnitrogen bath.
Engine
The engine used in the investigationwas a nominally 20 000-pound sea level thrust
size. R consisted of a concentric tube injector, a 10.78-inch heat-sink thrust chamber
liner with resonator cavities, a thrust chamber jacket, and a convergent-divergent heat-
sink exhaust nozzle with a contraction ratio of I.89 and an expansion area ratio of 1.3.
The individualengine components were flanged to allow disassembly for acoustic liner
changes. The length of the combustor from the injector face to the throat was 18 inches.
The hot gas surfaces of the mild steel heat-sink exhaust nozzle were coated with zirco-
nium oxide to reduce the heat transfer into the metal.
Liners
The thrust chamber acoustic linerswere initiallyfabricated from 3/4-inch-thick
oxygen-free copper. The design was dictated by a heat-sink requirement for a 3-second-
duration test assuming a liner cavity gas temperature of 5000° R. Initialtests indicated
a very much lower heat load than assumed for the original design; accordingly, less ex-
pensive mild steel was used to fabricate the remaining configurations. The hot gas side
of each mild steel liner was coated with flame-sprayed zirconium oxide. Photographs
of the copper and steel liners are presented in figure 2. The liner configurations evalu-
ated are identified in table I.

Oxygen
",w
Acoustic
liner --..
]
Nozzle
i
,!
\\
.--Injector
..--Temperaturetransducer
r Pressure
transducer
Duct to exhaust
scrubber
C D-8093
Figure 1. - Engine.

_!!!!!!!!_!!i!ili_¸i̧i_!!i̧i:!i!!ii̧iii:
Gapheight7
IC-72143 L l/2-1nch-diameter aperture
(a) 3/4-Inch-thick copper.
Figure 2. - Liner.
Instrumentation port
(b) 3//O-Inch-thick steel.
C-72893
TABLE I. - TEST CONFIGURATIONS
Wall
thickness,
t,
in.
3/4
3/4
3/83/16
3/163/16
3/163/16
3/163/16
Backing
distance,
L,
in.
0.41
.41
.785
.9745
I
I
't I'
Aperture
diameter,
d,
in.
1/4I/2
i/s
1/4
Open area
ratio, a
a
0.05
.20
• 10
.05
• i0
.15
• 20
. I0
• 10
. I0
Liner
length
from
injector,
in.
r
1.5
3.0
4.5
aFraction of open area of resonator array.
Material
Copper
Copper
Copper
Steel

Chamber
pressure tap7/
/!
!!
!
(a) Faceplate view.
1.75_
Fuel
distribution
plate
/-Wall, 0.1563 O.D. byO.031/
C-72129
Oxidant
distribution
plate --t/"
0.052
"_ Faceplate
Oxygen
//
Oxidant tube --/ Hydro
_'_L_o. 040 -8705CO
(b) Cross-sectional view. (All dimensions in inches unless specified otherwise.)
Figure 3. - Faceplate and cross-sectional views of 487-element injector.

Injector
Faceplate and cross-sectional views of the 487-element concentric tube injector
(thrust per element of about 40 lb) are presented in figure 3. The faceplate was fabricated
from 0. 085-inch-thick nickel material formed in a concave shape with a radius of curva-
ture of 20 inches. The injector also incorporated a hydrogen distribution plate to provide
a high coolant velocity behind the faceplate for efficient cooling. The hydrogen to oxygen
injection area ratio was 4.67. Element dimensions and other injector details are included
in figure 3(b). All thrust chamber acoustic liners were evaluated with this injector con-
figuration.
Hydrogen Temperature Controller
The temperature of the hydrogen entering the injector was varied by mixing various
amounts of liquid and (ambient) gaseous hydrogen. A schematic of the mixing device used
in the investigation is shown in figure 4. Mixing we.s accomplished by swirling the liquid
Liquid
hydrogen
7Swirler
Cold hydrogen
gas to injector
hydrogen _
\
8
Figure 4. - Schematic of mixing station.
CD-8094

into the gaseous hydrogen stream. This system could reduce the hydrogen injector inlet
temperature in a typical run by as much as 25 ° R per second. The position of the valves
used to control the flow rate of gas and liquid was controlled by an electrohydraulic ser-
vosystem. Temperature ramps were accomplished by varying the signal voltage to the
servovalve control amplifier by means of a potentiometer.
Instrumentation
The instrumentation used in the investigation and locations for the various trans-
ducers are shown in a diagram of the engine and associated plumbing in figure 5. The
signals from the transducers, except the high frequency response types, were transmitted
to the Center's automatic digital data recording system. Piezoelectric-type, water-
cooled, flush-mounted pressure transducers were used at three locations on the thrust
chamber to determine the character and phase relation of the pressure field and
allow identification of the screech mode. The response characteristics of the transducers
were flat to within 10 percent to a frequency of 6000 cps and had a nominal resonant fre-
quency of about 20 000 cps in the water-cooled mount. The signals from high frequency
response transducers were recorded in analog form on magnetic tape, and, in addition,
were displayed on direct reading instruments for visual monitoring during the tests.
Oxygen propellant weight flow was determined with a vane-type flowmeter which was
calibrated with water using a static weighing system. The correction from water calibra-
tion to cryogenic calibration necessitated by the dimensional change of the instrument
with temperature was obtained from the flowmeter manufacturer. Liquid hydrogen weight
flow was measured using a venturi, and the gaseous hydrogen weight flow was measured
using an orifice plate. The strain-gage-type pressure transducers were calibrated
against a commercial standard. Liquid flow temperatures were measured by platinum
resistance-type sensors. The pressure and temperature systems were calibrated imme-
diately prior to data acquisition by an electrical two-step calibration system, which used
resistances in an electrical circuit to simulate a given pressure.
Procedure
As mentioned in the INTRODUCTION, the stability rating of each configuration was
expressed in terms of the hydrogen temperature at which screech was encountered. The
technique employed was to select an initial hydrogen temperature by presetting the valves
of the mixer and, about 1/2 second after ignition, ramping the gas valve toward a closed
position and the liquid valve toward an open position to reduce the temperature of the in-

i"----7
c
F-'--..------._ _ I
I0

jected hydrogen to a value below the anticipated screech limit. After the first transition
point was obtained for a configuration, the ramp rate was reduced in the following runs
to minimize mass accumulation in the propellant system and, thus, errors in determina-
tion of instantaneous mass flow to the injector. The screech limit was obtained from
high-speed recorder data wherein the injector hydrogen temperature in the injector cavity
was read at the instant screech was indicated by an oscillograph trace of a flush-mounted
pressure transducer. Combustion was considered unstable when a periodic wave-form
with an amplitude substantially greater than the normal noise level (10 to 15 psi peak to
peak) was observed on the oscillograph record. A typical screech transition is presented
in the section RESULTS AND DISCUSSION of the text. Data were obtained over a range of
oxidant-fuel ratios to establish a limit curve.
For those configurations that exhibited low screech temperatures below about 70 ° R,
it was necessary to prechill all hydrogen lines and valves down to the fire valve (fig. 5)
by a preflow and overboard venting of liquid nitrogen. In addition, still lower tempera-
tures in the 55 ° to 65 ° R temperature range required the use of a 1-second lead of liquid
hydrogen through the injector for prechill prior to stepping the mixer to the preset con-
dition. Because of the use of heat-sink thrust chambers and nozzles, it was necessary to
limit run duration to 3 seconds; accordingly, all valve scheduling was accomplished by
the use of an automatic sequence timer.
RESULTS AND DISCUSSION
The investigation reported herein of suppression of high frequency combustion insta-
bility using arrays of acoustic damping devices of the Helmholtz type, includes both ana-
lytical and experimental results. Theoretical absorption coefficients (fractional part of
the energy of an incident sound wave absorbed) are presented to show the effect of varia-
tions in liner thickness, backing distance, resonator orifice diameter, open area ratio,
and liner cavity gas temperature on damping characteristics. The theory used for liner
design is described in the appendix. Experimentally, the effects of changes in these liner
design parameters were evaluated during rocket engine firings in terms of self-triggering
combustion instability hydrogen injection temperature. The hydrogen temperature rating
technique is based on the experience that hydrogen-oxygen combustion can be destabilized
by reducing the hydrogen injection temperature. Reference 7 has shown that, basically,
the screech stability characteristics are related to propellant injection velocity ratio
which is varied with changes in hydrogen temperature. A typical oscillograph trace
showing a hydrogen temperature reduction and a transient into screech is presented in
figure 6. Screech with a peak-to-peak amplitude of about 150 pounds per square inch was
11

I-2
Hydrogeninjection temperature
High-frequency chamberpressure
]-]50psi--/r300psi
2-"Staticchamber
pressure
Liquidoxygen /flow rate-, ,Gaseoushydrogen
Liquid hydrogen
_Iflowrate_,
I I 1 1 I I-I 0 i 2 3 4
Time,sec
Figure 6. - Oscillograph tracesof typical screechtest illustrating thetemperaturerating technique.
100t---o---Transition to screech1 ! I I F
l combustion __ _L_ __Stable
;- J----VH/Vo2=5"0 J -7/combust_n -
--[ -- combustion-
3 4 5 6 l 8Oxidant-fuelratio,OIF
9
triggered spontaneously when the hydro-
gen injection temperature reached
110 ° R with the particular combustor.
Stability Characteristics of
Basic Engine
Figure 7. - Hydrogen temperature stable operating limits of engine
withoutliner, was observed in the data. The transi-
tion temperature increases from a value of 107 ° R at an oxidant-fuel ratio of 4.5 to
122 ° R at an oxidant-fuel ratio of 6.
Typical amplitude spectral density graphs of screeching combustion during operation
at a hydrogen injection temperature of about 60 ° R with the basic combustor are presented
in figure 8. The predominant mode of instability was first tangential acoustic mode
(3000 to 3500 cps). Examination of the graphs shows that the screech amplitude reached
values on the order of 140 pounds per square inch peak to peak. In addition to the first
tangential mode, large amplitude pressure pulsations were present in several tests at
frequencies of 1500, 3800, and 5000 cps. With the exception of the frequency at 3800 cps
The injector used in the investiga-
tion was intentionally selected because
of its poor screech stability character-
istics, thus, providing a severe test
for the liner configurations. The hy-
drogen temperature stable operating
limit as a function of oxidant-fuel ratio
is shown for the combustor without liner
in figure 7. Each data point represents
a separate test, such as the run de-
picted in figure 6, during which the hy-
drogen injection temperature was
ramped down into screech. The area
above the line represents a region of
stable operation and, conversely, un-
stable operation occurs below the line.
Similar to the results of reference 7,
an oxidant-fuel ratio stability depend-
ence which correlated with a constant
2/_ =5.9/injection velocity ratio (VH 02
12

(a) Oxidant-fuel ratio 0/F = 3.94.
E
(b) Oxidant-fuel ratio O/F = 5.0.
0 1 2 3 4 5 6
Frequency, kcps
(c) Oxidant-fuel ratio O/F. 5.90.
Figure 8. - Typical examples of chamber oscillations during screech at hydrogen in-jection temperature of 60 ° R with basic engine.
13
(second longitudinal acoustic mode), these frequencies do not closely correspond to any
common mode. The variations in modal frequencies between tests reflect the change in
combustion temperature and, thus, acoustic velocity with oxidant-fuel ratio.
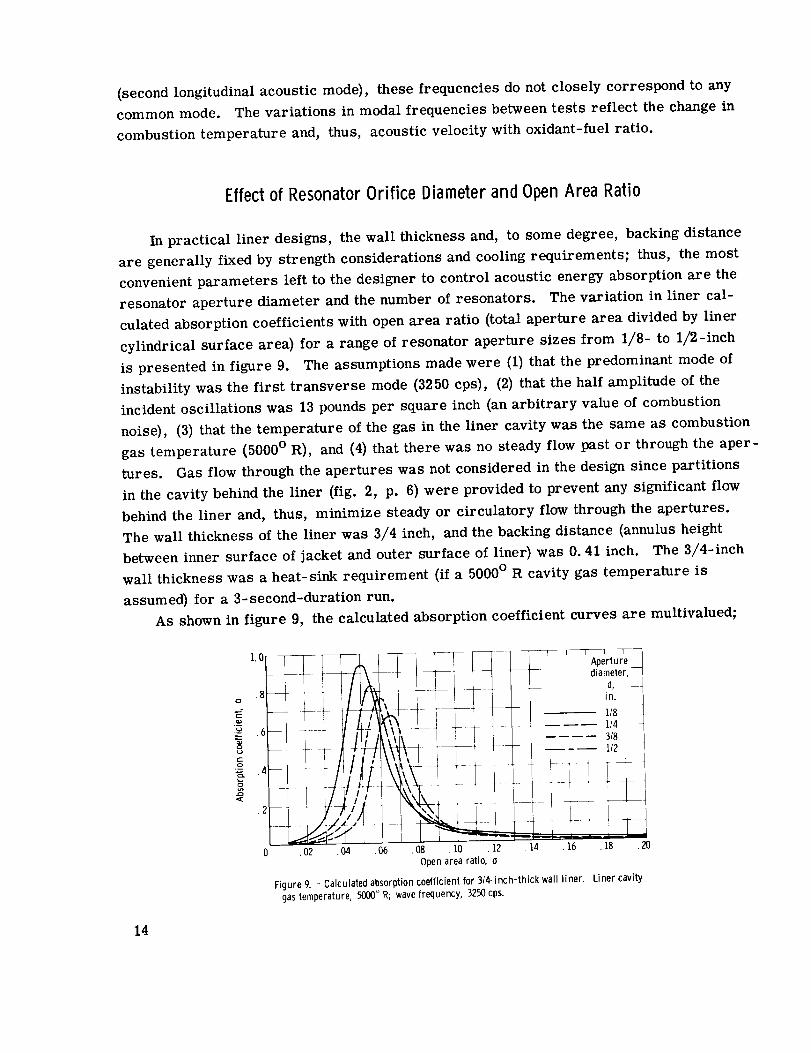
Effect of Resonator Orifice DiameterandOpen Area Ratio
In practical liner designs, the wall thickness and, to some degree, backing distance
are generally fixed by strength considerations and cooling requirements; thus, the most
convenient parameters left to the designer to control acoustic energy absorption are the
resonator aperture diameter and the number of resonators. The variation in liner cal-
culated absorption coefficients with open area ratio (total aperture area divided by liner
cylindrical surface area} for a range of resonator aperture sizes from 1/8- to 1/2-inch
is presented in figure 9. The assumptions made were (1) that the predominant mode of
instability was the first transverse mode (3250 cps), (2) that the half amplitude of the
incident oscillations was 13 pounds per square inch (an arbitrary value of combustion
noise), (3) that the temperature of the gas in the liner cavity was the same as combustion
gas temperature (5000 ° R), and (4) that there was no steady flow past or through the aper-
tures. Gas flow through the apertures was not considered in the design since partitions
in the cavity behind the liner (fig. 2, p. 6) were provided to prevent any significant flow
behind the liner and, thus, minimize steady or circulatory flow through the apertures.
The wall thickness of the liner was 3/4 inch, and the backing distance (annulus height
between inner surface of jacket and outer surface of liner} was 0.41 inch. The 3/4-inch
wall thickness was a heat-sink requirement (if a 5000 ° R cavity gas temperature is
assumed} for a 3-second-duration run.
As shown in figure 9, the calculated absorption coefficient curves are multivalued;
• 02 .04 .06 .08 .10 .12 ,14 .16 .18 .20
Open area ratio, a
Figure 9. - Calculated absorption coefficient for 3/4-inch-thick wall liner. Liner cavity
gas temperature, 5000° R; wave frequency, 3250 cps.
14

150[
Aperturediameter,d,
in.
0 Basicengine[] 1/4a 1/2
Open symbols denotetransition
stable []..combustion
Unstable
combustion [4 5 5 7 8
Oxidant-fuel ratio, O/F
Figure 10. - Hydrogeninjector temperature screech char-acteristicsof basic engine and314-inch-thickwalt liners.
thus, it is theoretically possible that two
liners of different open area ratios could
have the same performance. It must be
noted here that, although the liner perform-
ance is characterized as a function of total
area of apertures divided by the total surface
area in this figure and others, it actually rep-
resents the performance per unit area of the
liner. The number of apertures required
for screech suppression, and their effective-
ness as far as location in the combustor, is
discussed in the section Effect of Liner
Length. Examination of the figure shows that
resonator aperture diameter and open area
ratio together affect the liner calculated ab-
sorption coefficients. The open area ratio at
which optimum liner performance occurs de-
creases as the aperture diameter decreases.
Also, for any aperture size, the number of
holes or open area ratio is very critical for
good performance. For example, a change in open area ratio from 0.055 to 0.07 de-
creased the calculated absorption coefficient from 0.83 to 0.34 for 1/4-inch-diameter
ape rture s.
The two 3/4-inch thick liners evaluated experimentally had aperture diameters of
1/4 and 1/2 inch. The resonators had a 1-inch spacing which provided the liners with
open area ratios of about 0.05 and 0.2. The hydrogen temperature stable operatinglimits
of the combustor incorporating the 3/4-inch-thick wall liners are compared to the limit of
the basic engine in figure 10. Examination of the results of the figure shows that, al-
though the liners did not provide complete screech suppression, a large improvement in
the range of hydrogen temperature stable operation was demonstrated. The hydrogen
screech transition temperature was about 70 ° R with the 0.05 open area ratio liner and
about 63 ° R with the 0.2 open area ratio liner compared to 112 ° R for the basic engine at
an oxidant-fuel ratio of 5. The experimental results for the liners are not in agreement
with predicted trends (fig. 9); however, as will be shown later, the measured liner cavity
gas temperature was different than assumed in the results of figure 9.
The effectiveness of the liners in suppressing the amplitude of screech oscillations
at a hydrogen temperature operating condition of 60 ° R can be seen by comparing the re-
sults presented in figures 8, 11, and 12. As would be expected, the liners had the
largest effect on the first tangential mode of instability (3000 to 3500 cps). Whereas
15

I I(a) Oxidant-fuel ratio O/F = 4.36.
E
(b) Oxidant-fuel ratio O/F = 5.54.
I0 1 2 3 4 5 6
Frequency, kcps
(c) Oxidant-fuel ratio O/F : 6.27.
Figure 11. - Typical examples of chamber pressure oscillations during screech at hydrogen
injection temperature of 60 _ R with combustor incorporating 3/4-inch-thick wall, 1/4-inch -
diameter apertures, and 0.05 open area ratio liner.
16

(a) Oxidant-fuel ratio O/Fo 3.7.
°_
E
(b) Oxidant-fuel ratio O/F- 5.32.
0 1 2 3 4 5 6
Frequency, kcps
(c) Oxidant-fuel ratio O/F- 5.gl.
Figure I2. - Typicalexamples of chamberoxcillations during screech at hydrogen in-jection temperature of 60° Rwith combustorincorporating 3/4-inch-thick wall, 1/2-inch-diameterapertures, and 0.2 open area ratio liner.
1"/

oscillations with amplitudes of 140 pounds per square inch peak to peak were observed at
frequencies between 3000 to 3500 cps with the standard engine, the maximum amplitude
observed with the liner was generally less than 30 pounds per square inch in this same
frequency range. The amplitude of the second longitudinal mode of instability (3500 to
4000 cps) was also suppressed by the liners, although not to the extent of the tangential
mode. When observed, the longitudinal oscillations reach an amplitude of about 40 pounds
per square inch compared to 75 pounds per square inch for the basic engine. Reference 1
indicates a shift of the modal frequencies in cold flow tests with perforated liners not ex-
actly tuned to the wave frequency. A pro-
_L
_ Distance frominjector face,
2000-- in. - ___._
--- _ o_ _--
_bOD 3
1_ I or, _
:- ..... _- --_ S ree h .:ombustion
6001.0 1.2 1.4 1.6 1.8 2.0 2.2 2.4
Time, sec
Figure 13. - Typical exampleof liner cavity gas temperature dur-ing stable and unstable combustion with combustor incorpo-rating 3/4-inch-thick wall, ll4-inch-diameter aperture, andO.05 open area ratio liner.
nounced downward frequency shift of the
residual tangential mode was observed
only with the 0.2 open area ratio liner.
A typical time history of the gas tem-
perature behind the 0.05 open area ratio
liner is shown in figure 13. The level of
the cavity gas temperature during the run
was very much lower than the assumed
value of 5000 ° R. Prior to inception of
screech, the gas temperature measured
in four locations behind the liner varied
between 800 ° and 1100 ° R. At about 1.8
seconds when screech was encountered,
the temperature of the gas in the liner
cavity rapidly increased to a value of
about 2000 ° R, however, still consider-
ably lower than the value assumed in the
liner design.
The theoretical absorption character-
.16
• lZ
"_ . 08
.=_o.04
0•O2
Liner cavity gas Aperturetemperature, diameter,
°R el,in. -- _ ---
900 i18900 1/4800 1/2
.04 .06 .O8 .10
L'/
J
117.12 .14 .16 .18 ._
Openarea ratio, o
Figure 14. - Calculated absorption coefficientfor 3/4-inch-thick wall liners. Wavefrequency, 32.50cps.
18

Aperture Open Liner cavity gasdiameter, area temperature, --
d, ratio, °Rin. o
1/4 O.05 9001/2 .2 800
1 2 3 4Frequency, kcps
Figure 15. - Absorptionfrequency bandwidth of 3/4-inch-thick wall liners.
istics of the liners were reevaluated at an average liner cavity gas temperature typical of
the values measured just prior to screech inception (other design inputs same as before).
The calculated absorption coefficients are presented in figure 14 as functions of the open
area ratio. Examination of the figure shows a drastic reduction in absorption coefficient
of the 3/4-inch wall thickness liner and a pronounced aperture diameter effect at the
lower cavity gas temperature (in comparison to fig. 9). For example, the calculated ab-
sorption coefficient of the 0. 05 open area ratio liner configuration at a wave frequency of
3250 cps was only on the order of 0.005. These results also indicate that the open area
ratio must be increased and the aperture diameter decreased to improve the performance
of the 3/4-inch wall liners at the low cavity gas temperatures. The cavity resonant fre-
quency (frequency at which absorption maximizes) for both designs was lower than the
first transverse mode of about 3250 cps at the low cavity gas temperatures measured
prior to screech inception (fig. 15). At a frequency of 3250 cps, the liner configuration
with 1/2-inch apertures which had the best hydrogen temperature stable operating range
(fig. 10), also had the highest calculated absorption coefficient of 0. 018. The calculated
absorption coefficient of the 0.05 open area liner which lowered the screech transition
temperature by 42 ° R had a calculated absorption coefficient of less than 0.005 at 3250 cps.
Effect of Liner Thickness and Backing Distance
The results of the previous section indicate that complete suppression of screech at
very low hydrogen injection temperatures (60 ° R) could probably be accomplished with
liners for which relatively low values of energy absorption were calculated. Although the
absorption coefficient of the 3/4-inch-thick wall liners could be increased by decreasing
19

I ____/_L_._ _ • Liner thickness,__i ! _ ' [ T
' - - -- 3/8 '
0 1 2 3 4 5 7
Frequency, kcps
Figure 16. - Effect of liner thickness on absorption frequency bandwidth. Aper-
ture diameter, ]/4 inch; open area ratio, O. 1; liner cavity gas temperature,1000° R.
the resonator aperture diameter and adjusting open area ratio (fig. 14), the heavy-wall,
heat-sink liner was not considered practical geometry for application to a flight-weight
design; thus, no further attempt was made to improve its performance. An alternate
method to provide a liner with better absorption characteristics at the low cavity gas tem-
peratures and without changing the diameter of the thrust chamber jacket was to decrease
the liner wall thickness while simultaneously increasing the backing distance. From a
structural standpoint, decreasing wall thickness was considered possible because the cav-
ity gas temperature was very much lower than assumed in the original design (5000 ° R).
A comparison of the theoretical absorption characteristics of liners with wall thick-
nesses of 3/4, 3/8, and 3/16 inch is presented in figure 16. The inner jacket internal di-
mension was held constant for all configurations; thus_ the backing distance varied from
0.41 inch for the 3/4-inch-thick wall, to 0. 785 inch for the 3/8-inch-thick wall, and to
0. 9745 inch for the 3/16-inch-thick wall liner. Calculated absorption coefficients are
presented as a function of frequency for liners with 1/4-inch-diameter apertures at a
liner cavity gas temperature of 1000 ° R and no steady flow past the apertures. Examina-
tion of the figure shows that the damping characteristics can be significantly improved by
reducing the wall thickness and correspondingly increasing the backing distance. For ex-
ample, decreasing the wall thickness from 3/4 to 3/16 inch while increasing the backing
distance from 0.41 to 0. 9745 inch, increases the theoretical absorption coefficient from
about 0.01 to 0.13 at a frequency of 3250 cps. In addition to providing improved damp-
ing, the thin wall liner design also improves the absorption frequency bandwidth. At half
power level, the absorption frequency bandwidth was increased by about a factor of 2 by
decreasing the wall thickness from 3/4 to 3/16 inch.
In an attempt to verify these analytical results, an existing 3/4-inch-thick wall
copper liner was machined down to a wall thickness of 3/8 inch. The aperture diameter
was 1/8 inch, and the open area ratio was 0.1. Screech was encountered at a hydrogen
2O

90C
_n
_E s00
.E E
1 1 IIDistance frominjector face,
in.
.8 1.O 1.2 1.4Time, sec
I l -¸ "I
1.6 1.8
L_2.0
temperature of about 65 ° R in three of
the five tests of this liner. The meas-
ured cavity gas temperature for this
liner immediately prior to screech was
600 ° R, lower than the values measured
with the 3/4-inch wall configurations.
At this cavity temperature, the absorp-
tion coefficient for the 3/8-inch wall
liner was calculated to be 0.019, approx-
imately the same as the 3/4-inch wall
liner with 1/2-inch apertures. The im-
Figure 17. - Typicalexampleof cavity gastemperatureduringstablecombustion with combustorincorporating3lib-inch-thick wall, 1/4-inch-diameter aperture, and O.1 openarea
ratioliner, provement in stable operating limits pro-
vided by the two different wall thickness
liners was also the same, which lends confidence to use of acoustic theory in liner design.
A further reduction in liner wall thickness to 3/16 inch improved the hydrogen tem-
perature stable operating limits as predicted by theory. A 3/16-inch wall thickness,
0.1 open area ratio liner with 1/4-inch apertures provided stable operation at 60 ° R, the
minimum temperature attainable in the facility. Calculating the liner absorption coeffi-
cient at a measured cavity gas temperature of 800 ° R (fig. 17) produced a coefficient
of 0.055.
Typical examples of amplitude spectral density graph of combustion pressure oscil-
lations during operation at hydrogen temperatures of about 60 ° R with the 3/8- and
3/16-inch liners are presented in figures 18 and 19. The mode of instability encountered
with the 3/8-inch wall thickness liner was complex (fig. 18), containing a maximum pres-
sure amplitude of 40 pounds per square inch at about 3100 cps (first tangential mode) and
several lesser spikes at frequencies between 2600 and 3500 cps. In addition, pronounced
pressure amplitudes were present at 1500 and 5200 cps (second tangential mode). The
maximum pressure amplitude in the screech frequency range observed during tests of
the 3/16-inch-thick wall liner was on the order of 10 to 15 pounds per square inch
(fig. 19). The low to intermediate frequencies (0 to 1000 cps) which could possibly be
entropy waves (ref. 10) were not eliminated by the liner.
Effect of OpenArea RatioandLiner Cavity Temperature
The analysis and design of absorbing liners for rocket engines is complicated by the
variance in liner cavity gas temperatures between liner configurations. Typical values
of gas temperature behind the liner with changes in open area ratio from 0.05 to 0.2 for
21

{a) Oxidant-fuel ratio O/F= 3.99.
E
(b) Oxidant-fuel ratio OfF• 4.69.
0 1 2 3 4 5 6
Frequency, kcps
(c) Oxidant-fuel ratio OfF=5.22
Figure 18. - Typical examplesof chamber pressure oscillations during operation at hydrogentemperature of 60° Rwith combustor incorporating 3/8-inch-thick wall, 1/8-inch-diameterapertures, and 0.1 open area ratio liner.
22

!sd 'apn:l!ldLu v
-5
.,c:
$
o
•$ E,.e oi
0 o
o=
_=
f -r_o=
o
g
_=
14- e,_
o
g _
•_. E
, i
23

I 1_ I I L ner cavitygas
temperature,.3- °R ......
400i --"" '_ _--"......04 .08 .12 .16 .20 .02 .04 .06 .08 .10 .12 .14 .16 .18 .20
Openarearatio, o Openarearatio, o
Figure20. - Effectofopenarearatio Figure21.- Effectoflinercavitygastemperatureoncalculatedabsorptioncoefficientofon linercavitygastemperature. 3/16-inch-thickwalllinerwithl/4-inch-diameterapertures.Wavefrequency,3250cps.Linerwallthickness,3/16inch;aperturediameter,1/4inch;oxidant-fuelratioO/F_-5.
a constant aperture diameter of 1/4 inch are shown in figure 20. The results show that
the gas temperature behind the 3/16-inch-thick wall liner varied between 500 ° and 650 ° R
at an open area ratio of O. 05 (prior to inception of screech) depending on the axial loca-
tion. As would be expected, the liner cavity gas temperature also varied with the number
of apertures per unit area. The cavity gas temperature (average) increased from 600 ° R
at an open area ratio of O. 05 to 1000 ° R at an open area ratio of O. 2. This variance in
gas temperature undoubtedly results from the different amount of combustion gas recir-
culation under the liner. In addition, a variation in cavity gas temperature with injector
element size and spacing and also the propellant combination, along with the amount of
film cooling employed, might also be expected. Thus, unless a means of controlling liner
cavity gas temperature is found, such as a gas bleed, the designer is faced with an experi-
mental program to optimize the final acoustic liner design.
The effect of cavity gas temperature on the theoretical absorption characteristics of
a 3/16-inch-thick wall liner with 1/4-inch apertures is shown in figure 21. Computed
absorption coefficients are presented as functions of open area ratio for a range of liner
cavity gas temperatures from 600 ° to 1200 ° R. For a 0. 1 open area ratio liner, a de-
crease in liner cavity gas temperature from 1200 ° to 600 ° R decreased the calculated
absorption coefficient from about 0.21 to 0.02 at a frequency of 3250 cps. The effect of
the temperature is to change the tuning or the resonant frequency of the cavity, thus,
changing the absorption characteristics of the resonator. It must be noted that these re-
sults do not preclude the use of cold gas to control cavity gas temperature. For example,
the absorption coefficient of a 3/16-inch wall, 0.1 open area ratio liner with a backing
13 inches was calculated to be 0. 42 with an ambient hydrogen environmentdistance of
(520 ° R) in the cavity behind the liner.
24

t-o
,h
}
120,
100
__ Openarearatio, I0
-- ---C)---- 0.2 ----_--D .15
_ /k .10-- -K>--- .O5
--Open symbolsdenotetransition to -- -- Iscreechcombustion
--Solid symbolsdenotestablecombustion(<15-psiamplitude) I
---- WithoutlinerI
--_>_-_Stable/ I, combustionI
....... Unstable --4 ---_ -_combustio_ /o__:r _ ,
80 --_- () , , _Stable --
4 combustionII
__ I___'_a__. Unstable[3" VI combustion
i
-_J_ _L._3 4 5 5 7 8
Oxidant-fuelratio, O/F
Figure22.- Hydrogentemperaturestableoperatinglimits ofvariousopenarearatio, 3116-inch-thickwall liners. Aper-ture diameter,1/4inch.
The hydrogen temperature stable operating limits for the 3/16-inch wall thickness
liner configurations are presented in figure 22 as a function of oxidant-fuel ratio. As
shown in the figure, screech was encountered with the 0.05 and 0.2 open area ratio liners
while the 0.1 and 0.15 open area ratio configurations provided stable combustion at a hy-
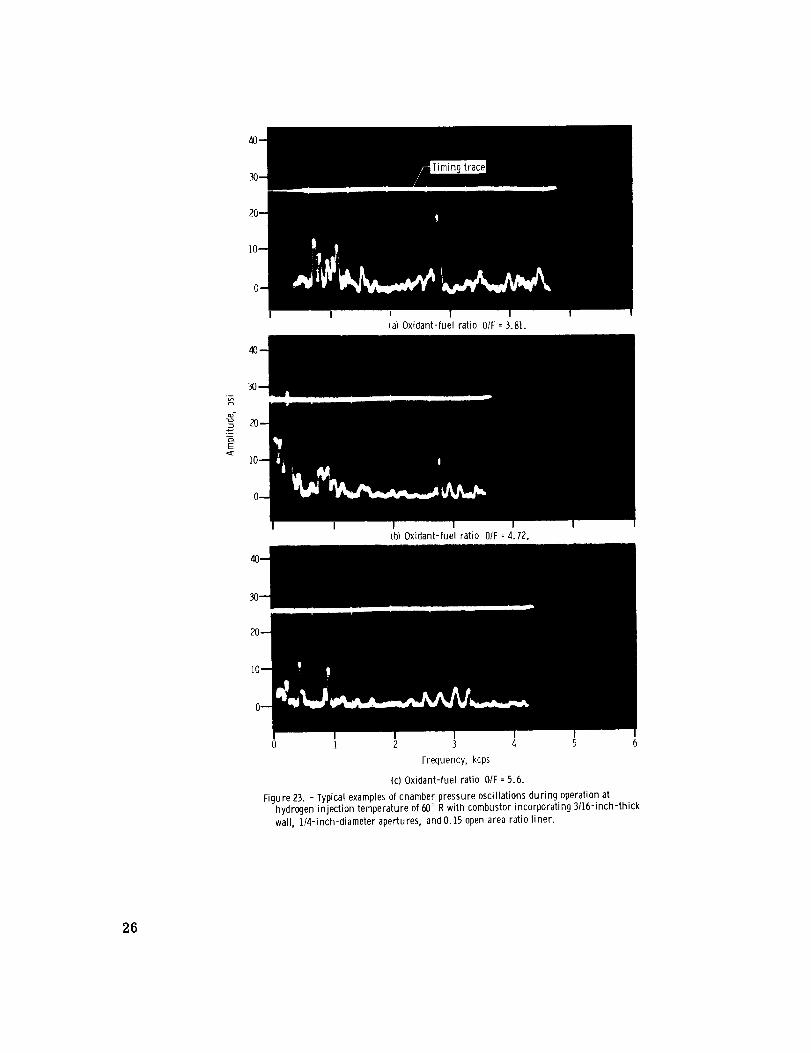
drogen injection temperature of 60 ° R. The peak-to-peak amplitude of chamber pressure
oscillation at a frequency corresponding to the first tangential mode was generally less
than 10 pounds per square inch (figs. 19 and 23) for the stable combustor configurations.
The 0.05 and 0.2 open area ratio liners had a screech amplitude of about 35 pounds per
square inch (fig. 24) and about 25 pounds per square inch (fig. 25), respectively, at a
60 ° R hydrogen temperature operating condition. The calculated absorption coefficients
for the 3/16-inch-thick wall liner configurations, which were computed at the measured
values of cavity gas temperature (fig. 20), are presented in figure 26 as functions of
wave frequency. The variation in stable operating limits with the calculated absorption
coefficients at a wave frequency of 3250 cps (first tangential acoustic mode) is shown in
figure 27. An anomaly exists between theoretical predictions and the experimental re-
sults when the calculations include the assumption of no flow past the apertures. Two
configurations (0.2 and 0.15 open area ratio) with the same calculated absorption coeffi-
25
i I I
(al Oxidant-fuel ratio O/F = 3.81.
E<[
(b) Oxidant-fuel ratio O/F = 4.72.
0 1 2 3 4 5 6
Frequency, kcps
(c) Oxidant-fuel ratio O/F = 5.6.
Figure 23. - Typical examples of chamber pressure oscillations during operation athydrogen injection temperature of 50° R with combustor incorporating 3/16-inch-thick
wall, 1/4-inch-diameter apertures, and 0.15 open area ratio liner.
26

2
E
(a) Oxidant-fuel ratio O/F = 5.03.
I I I I I0 1 2 3 4 5 6
Frequency, kcps
Ib) Oxidant-fuel ratio O/F = 3.95.
Figu re 24. - Typical examples of chamber pressure oscillations during screech at hydrogen
injection temperature of 60° R with combustor incorporating 3/]6-inch-thick wall, ]/4-inch-diameter apertures, and 0.05 open area ratio liner.
2'/

(a) Oxidant-fuel ratio O/F = 4.2.
E
I I I I
(b) Oxidant-fuel ratio O/F - 4.6.
0 ] 2 4 4 5 6
Frequency, kcps
(c) Oxidant-fuel ratio O/F • 5.45.
Figure 25. - Typical examples of chamber pressure oscillations during operation at
hydrogen temperature of 60° R with combustor incorporating 3/t6-inch-thick wall,
1/4-inch-diameter apertures, and 0.2 open area ratio liner.
28

.8
.6e--
.o
1
I
\
3
Frequency,kcps
I _ I I I 1Openarea Liner cavitygas
ratio, temperature,o °R --
O.05 6OO.1 800 --•15 800
1000
4 5
Figure 26. - Frequencyabsorptionbandwidthof various 3/16-inch-thick wall liners with l/4-inch-diameter apertures.
R [ I T _--T--
Openarea ratio,o
0 Basicengine
0 O.05-- _ _. .1
E () _ • _Open symbolsdenotetransition= _ .... ] to screech combuston --
I i _Solid symbolsdenote stable100 I I 1-- combustion i
=_ 6°o .o_ o4 -'.o6 .o_ .__Absorptioncoefficient, o
Figure 27. - Variation of hydrogen temperaturestable oper-ating limits with calculatedliner absorptioncoefficientfor 3/16-inch-thick wall full length liner without effectsof flow past
1.0
.8
° 1_u
:__ . 6 ......
r-.o
_. .4
' ' o_nariaLikerc_'vityg'_s
-- ratio, temperature, --
0 °R
O.05 600• 1 800
__ . 15 800
•2 1000
,'_ \
/ 2-..2 !
"--Z
O i 2 3 4 5 6
Frequency,kcps
Figure28. - Frequencyabsorptionbandwidthof 3/16-inch-thick wall linerswith 1/4-inch-diameter apertures. Velocitypastapertures, 280 feet persecond.
cient of 0. 099 at a frequency of
3250 cps provided different hydrogen
temperature stable operating condi-
tions. In view of this disagreement
of the predicted trends and experi-
mental data, the original design
assumptions were modified to include
the effects of side velocity or flow
past the apertures. The effective
length, or mass, of the vibrating
slug in the resonator neck is reduced
by increasing side velocity, thus
changing the tuning, or the resonant
frequency, of the spring-mass sys-
tem. Since the velocity of the flow
past the apertures was not known, a
trial and error process was used to
arrive at a velocity that would best
fit the experimental results from the
viewpoint of absorption. The absorp-
tion frequency bandwidth of the liners
with a 280-foot-per-second side ve-
locity is presented in figure 28. As
29

Open area ratio, ---t
O Basic:ngine[] 0. 05
--- A .1 -o ,, 1. 1_ __ OpeQnsymbol:2denotetransition_
_-] to screech combustionNJ, i Solid symbols denote stable |
i00 _--r _ -- - combustion i_
o=
0 .1 .2 .3 .4 .5 .o
Absorption coefficient, o
Flgure 29. - Variation of hydrogen temperature stable operating limits
with calculated absorption coefficient for 311b-inch-thick wall, full
length liners. Side velocity, 280 feet per second.
i Open area ratio, Wall thickness,
o in,
0 Basic engine Without liner
---_ © .A .1 3/8
a .01
0 .10 .15 3/16
0 .2 !
Open symbols denote transition to screech-i
combustion J
Solid symbols denote stable combustion |
' ' I- I
.2 .3 .4 .5 .6
Absorption coefficient, o
Figure 30. - Variation of hydrogen temperature stable operating limits
with calculated liner absorption coefficients for all full length liners.
Side velocity, 280 feet per second.
can be seen in figure 29, a better agree-
ment between experimental data and
predicted trends was obtained when the
effects of a 280-foot-per-second side
velocity (about 0.2 free stream veloc-
ity) were included in the calculations.
This correlation indicates that a liner
with a minimum absorption coefficient
of about 0.25 would be required to sta-
bilize combustion at a hydrogen injec-
tion temperature of 60 ° R for the par-
ticular injector used in this investiga-
tion. The magnitude of the side veloc-
ity for best correlation suggests that it
represents a flow past the first few
rows of resonators from the injector
which, as will be discussed in the sec-
tion Effect of Liner Length, contribute
most to the stability of the combustor.
The results of all liner configura-
tions presented in the previous figures
are summarized in figure 30. A sat-
isfactory agreement between the thick
wall and thin wall configurations was
not obtained even when the effects of
a 280- foot- per- second side velocity
were included in calculations of liner
absorption coefficient. Possibly, the
effects of side velocity may change with
aperture diameter and liner wall thick-
ness. Additional data would be re-
quired to conclusively evaluate these
effects.
It must be noted that the previous
correlation was based on a wave fre-
quency of 3250 cps, typical of the first
transverse mode of instability observed
in the basic engine without an acoustic
liner (fig. 8, p. 13). Correlating the
3O

results on the shifted frequency observed in tests with liners (generally less than3250cps} lowered the side velocity from 280to 240feet per secondat which the bestagreementbetweentheory andexperiment was attained. A side velocity of 240feet persecond, however, did not improve the agreementbetweenthick and thin wall liners.
Effect of Liner Length
Combustion instability in rocket engines has been successfully suppressed in many
instances by the use of injector face baffles (ref. 11). Successful baffles have varied
greatly in length from one engine to another; however, in all cases, the baffle lengths
were short compared to the length of the thrust chamber. Thus, it was hypothesized
that damping need only be provided near the injector end of the thrust chamber, possibly
at the point of highest energy release, to suppress combustion instability. The effect of
length was experimentally evaluated with a 0.1 open area ratio, 3/16-inch wall liner, the
most successful full length configuration. Liner length variations included were 17, 34,
and 50 percent of the full length configuration. The partial length configurations were
[ [ [ T 1 [ F T TLiner length,
percent
-_ 17<> 34
--_ 5O
Open symbols denotetransition to screech combustion-Solid symbolsdenote stable combustion (<lS-psi
amplitude)
1_ _ _Without liner
..... i
Unstablecombustion
J3 4 5 6 7
Oxidant-fuel ratio, OIF
Figure 31. - Effectof liner length on hydrogen temperaturestableoperatinglimits. Wall thickness, 3115inch; aper-ture diameter, ]/4 inch.
Y 120 , -
{ I
,oo -g
i
evaluated positioned only at the injector end
of the thrust chamber.
The hydrogen temperature stable oper-
ating limits of the combustor incorporating
the various length liner configurations are
presented in figure 31. The stable operating
limits of the 17 and 50 percent partial length
liner configurations were the same, with
transitions into screech at a hydrogen tem-
perature of about 58 ° R. The operating limit
was not defined for the 34 percent partial
length configuration because of a facility
limitation at the time of the tests. Screech
was not encountered during the full length
liner tests (fig. 22, p. 25); however, the
configuration was not evaluated at as low a
hydrogen temperature as the partial length
configurations. The instability (first tangen-
tial mode) encountered with the partial length
configurations was not a sustained type, but
one consisting of short bursts of 0. 1 to
0.2 second in duration. The maximum peak-
31
to-peak screech amplitude measuredwas about 50poundsper square inch. Although notconclusively evaluated, it appearsfrom these results that full combustion length linersare not required for screech suppression. The sensitive area appears to be the first fewinches from the injector face. Undoubtedly, the length of liner required for screech sup-pression will vary with engine size, thrust per element, and the propellant combination.
Effect of Filling the Liner Cavity with Porous Material
One limitation of simple perforated plate acoustic liners, especially at low fre-
quencies, is that such liners absorb selectively in the region of resonance only. Several
techniques, however, can be employed to alter the absorption frequency bandwidth of a
liner, one of which is to fill the liner cavity with a porous material (ref. 12). Porous
material in the liner cavity increases the specific acoustic resistance which extends the
frequency range of absorption and simultaneously, it increases the absorption coefficient
providing the specific acoustic resistance 0 is less than one. Referring to equation (A1)
(see appendix) reveals that a is a maximum when 0 equals one.
The effect of filling the resonator volume with porous material was evaluated using
a 0.2 open area ratio, 3/16-inch wall thickness liner, the configuration that provided the
least improvement in hydrogen temperature operating limits. The screech transition
temperature for this configuration (unfilled) was 93 ° R at an oxidant fuel ratio of 5. The
material used to fill the liner cavity was grade 2-medium steel wool packed to a density
of 0. 014 pounds per cubic inch. Examination of the results presented in figure 32 shows
a marked improvement in stability with the steel wool filled liner. The filled configura-
tion provided stable operation at a hydrogen injection temperature of about 58 ° R (mini-
mum available in the facility).
No attempt was made to calculate a theoretical absorption coefficient for the filled
liner because adequate data on porosity and structure factor of the porous material were
not available. However, inasmuch as complete stabilization was achieved, the adsorp-
tion coefficient of the liner must have increased to a value greater than 0.25 (minimum
value of the coefficient for stable operation at 60 ° R obtained from the correlation in
fig. 29, p. 30). The maximum adsorption coefficient for this configuration (unfilled) was
about 0.19 (fig. 28, p. 29).
It must be noted, however, that the use of steel wool as a liner cavity fill material
would not be suitable (without some method of cooling) for long duration operation inas-
much as burning occurred in the upstream portion (fig. 33) during the tests with a total
duration of about 11 seconds.
32

o=
.,5_=
"!-
f T T i T • _ F
0 W{thout steel wool i
[] With steel wool _ -- -- Without liner !
Open symbols denote transition
to screech combustion i
140 Solid symbols denote stable
combustion
120 t - - Stablecombustion
" !
'tt®i _0 combustion
'9..I80 -
60 .... • 1
4O3 4 5 6
Oxidant-fuel ratio, OIF
Figure 32. - The effect of packing the resonator volume
of an O.2 open area, 3/16-inch-thick wall liner withsteel wool.
il
7 8
C-66-922
Figure 33. - Postfire condition of steel wool packing in liner cavity.
33

Engine Performance
Although good combustion efficiency was not a primary consideration in the design
of the injector that was used in this investigation, its characteristic exhaust velocity effi-
ciency of 97 percent at an oxidant-fuel ratio of 5 compares favorably with the state of the
art. Variation of engine performance with oxidant-fuel ratio during stable combustion at
a hydrogen injection temperature of 120 ° R is presented in figure 34. Performance
dropped off slightly as oxidant-fuel ratio was increased. Also included on the figure are
performance data of the engine with acoustic liners. Liners had no apparent effect on
i
z_
__. i00
-- gOl3
._,-2_:"_._'r" t._
Wall thickness, Open area ratio,in.
© Without liner ....
[] 3t4 0. 05
[9 3116 .2L 4 •
4 5 6
Oxidant-fuel ratio, OE
Figure 34. - Performance of 2OK, H-O engine
during stable combustion at hydrogen injec-
tion temperature of 120 R with 487-element
coaxial injector.
F
98
94
gO
1 T l
Open area ratio,o
O.t
.15
II
4 5 6 1
Oxidant-fuel ratio, O/F
Figure 35. - Performance of 2OK, H-O engine
during stable combustion at hydrogen tempera-ture of 60' R with 487-element coaxial injector
with 3/t6-inch-thick wall liner.
engine performance at this hydrogen tempera-
ture operating condition. Figure 35 presents
the performance of the combustion during stable
operation at a hydrogen injection temperature
of 60 ° R. The characteristic exhaust velocity
efficiency decreased to about 92_ percent at an
oxidant-fuel ratio of 5. The decay of perform-
ance at low hydrogen injection temperatures is
not believed to be a temperature effect but
rather its influence on hydrogen injection veloc-
ity through changes in the propellant density.
Evidence to support this concept of hydrogen in-
jection velocity can be found in reference 7
which develops a correlation of hydrogen stable
operating limits with a constant injection veloc-
ity ratio irrespective of the level of hydrogen
temperature. Combustion performance for this
referenced series of concentric tube injectors
(approximately the same number of elements
as used in this investigation) at an injection
velocity, ratio of 6_ was constant
4
at about
96_ percent over a temperature range from
150 ° to 60 ° R. Thus, the apparent loss in per-
formance with hydrogen temperature is, in fact,
an injection velocity effect and can be prevented
with proper injector design.
34

SUMMARY OF RESULTS
An investigation of suppression of high frequency combustion instability using
Helmholtz type acoustic damping was conducted at the Lewis Research Center using an
20 000-pound thrust size hydrogen-oxygen engine. The tests were conducted at a chamber
pressure of 300 pounds per square inch absolute (nominal) and over a range of oxidant-
fuel ratios from 4 to 6. This investigation yielded the following results:
1. High frequency combustion instability in hydrogen-oxygen engines of the size in-
vestigated can be suppressed using a properly designed array of Helmholtz resonators.
2. Liner cavity gas temperature, which varied with liner variables such as aperture
size, open area ratio, and axial position, has a strong effect on liner absorption charac-
teristics. A variation in cavity gas temperature with injector element size and spacing,
contraction ratio, and the propellant combination might also be expected. Thus,
unless a means of predicting or controlling cavity temperature is found, no rational de-
sign procedure is possible.
3. Analytical predictions based on acoustic theory were in limited agreement with
experimental results providing the effect of flow past the apertures was included in the
calculation of absorption coefficient. A side velocity of 280 feet per second provided the
best agreement between analytical and experimental results for a 3/16-inch-thick liner.
Additional data evaluating the effect of flow past the apertures are required before liner
absorption characteristics can be predicted.
4. Calculated absorption coefficients of 0.25 or higher evaluated at a cavity gas tem-
perature typical of stable combustion and a sound pressure level of +13 pounds per square
inch were required for the injector used in the tests of eliminate screech to a hydrogen
injection temperature of 60 ° R (minimum available).
5. Full combustor length liners were not required to suppress acoustic mode insta-
bility for the particular combustor used in the investigation. A 17 percent partial length
liner positioned at the injector end of the thrust chamber provided stable combustion to
a hydrogen injection temperature of 58° R.
Lewis Research Center,
National Aeronautics and Space Administration,
Cleveland, Ohio, September 26, 1966,
731-65-06-02-22.
35

APPENDIX -THEORY AND DESIGN OF SCREECH SUPPRESSION LINERS
In essence, screech liners are made up of an array of acoustic absorbers of the
Helmholtz type. A Helmholtz resonator is an acoustic absorber consisting of a volume
of gas in communication with a sound source via a small channel. If the volume is large
compared to its connecting channel, the change in pressure at the entrance to the channel
(resulting from incident wave(s)) will set the mass of gas in the channel in vigorous
motion while the gas in the volume of the resonator is periodically compressed and rar-
ified. The incident wave(s) energy is lost in the resonator from friction at the side walls
and from turbulence near the resonator aperture. The manner in which Helmholtz reso-
nators absorb energy can be described by an analogous mechanical system (unpublished
data from G. E. Canuel) and/or by an electrical system (ref. 13). The problem of de-
signing liners for suppression of high amplitude pressure oscillations such as are likely
to occur in high output rocket combustion chambers, can be considered as one of adapting
the single Helmholtz resonator theory to their design. In reference 9, some of the prop-
erties of a resonator in a free field or in a wall are presented for normal incidence of
plane waves. It was also shown how the assumption of uniform wall impedance (i. e., each
resonator spaced on a square array such that the distance between the centers is less than
_/(2_) 1/2) represents the limiting condition for liner design. If the distance between1/2
centers is greater than )_/(2_) , each resonator should be treated independently. The
discussion thus far has been for plane waves of normal incidence in air with neither flow
past the orifices nor a steady component flow through the orifices. In reference 14, it
was shown that single Helmholtz resonators are effective in reducing some acoustic oscil-
lations produced from the combustion of hydrogen and air and gasoline and air, thus ex-
tending the applicability of the theory to conditions more closely allied to those in a
screeching rocket combustor (i. e., some net flow past the orifice in a medium other
than air). For high amplitude pressure waves, Blackman (ref. 8) suggests a resonator
array with uniform wall impedance for screech absorption liners. An array is also sug-
gested in unpublished data from G. E. Canuel. In both unpublished data from G. E.
Canuel and reference 8, the theory consists of low and high amplitude portions. For the
low amplitude portion, absorption is largely a function of pressure wave amplitude when
the amplitude level is less than 100 decibels. At higher levels, a resonator has a non-
linear resistance which becomes controlling. In reference 8, the nonlinear resistance
has been made dependent on sound pressure level, while in unpublished data from G. E.
Canuel, it is largely a function of the ratio of the particle displacement in the aperture
to liner thickness. The two approaches are not entirely different since particle displace-
ment is a linear function of the pressure amplitude. The energy absorbed by a resonator
may be expressed in terms of a coefficient of absorption _, defined as the fractional
part of the energy of an incident sound wave absorbed by the liner, and is dependent upon
36

the aperture or orifice specific acoustic resistance andreactance ratios. In the notationof reference 8, _ is defined as
4Oa = (A1)
(8 + I)2 + x2
the specific acoustic resistance ratio 0 is defined as
r r apc(A2)
where
=1+ An/
d(A3)
and the specific acoustic reactance ratio x is defined as
(A4)
where Q is the quality factor (measure of the liner absorption frequency bandwidth),
that is,
q
2_fo/ef f
_rcO(A5)
The liner resonant frequency fo is given as
(A6)
with the effective length of the mass vibrating in the neck of the resonator defined as
(unpublished data from G. E. Canuel)
/eff = t + 0.85d(1 - 0.7Yr_) (A7)
37
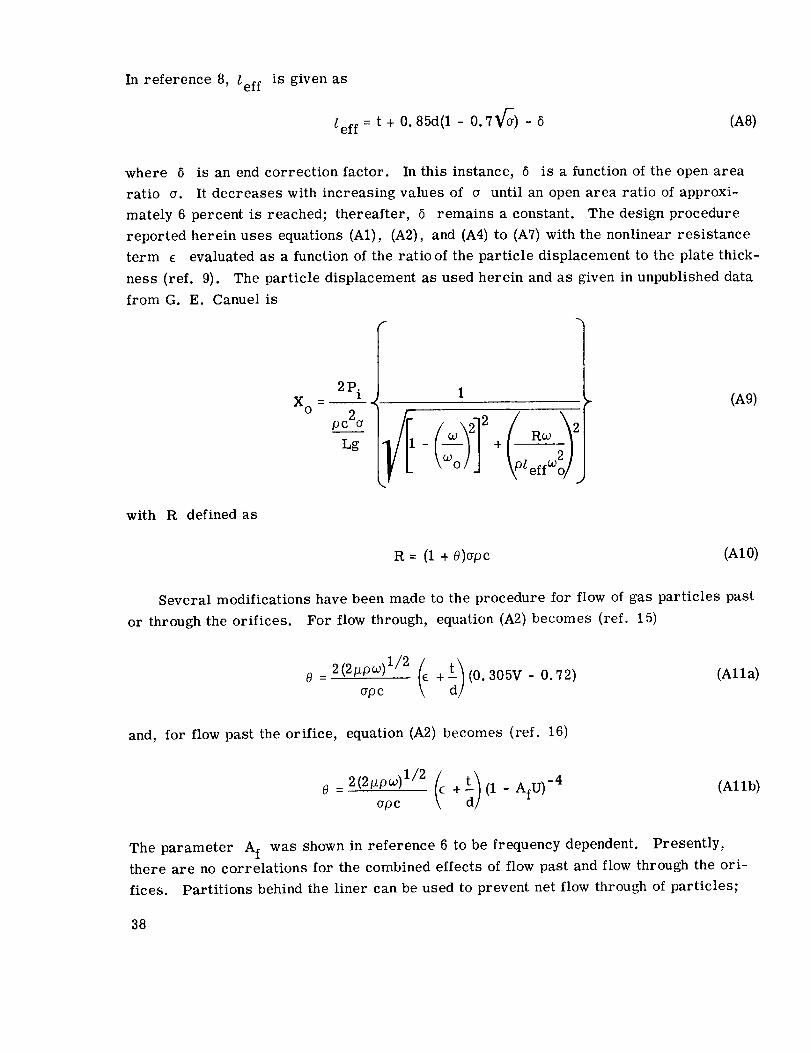
In reference 8, leff is given as
/eff
where 5
ratio _.
= t + o.85d(1- 0.7 ) - (A8)
is an end correction factor. In this instance, 5 is a function of the open area
It decreases with increasing values of _ until an open area ratio of approxi-
mately 6 percent is reached; thereafter, 5 remains a constant. The design procedure
reported herein uses equations (A1), (A2), and (A4) to (AT) with the nonlinear resistance
term e evaluated as a function of the ratio of the particle displacement to the plate thick-
ness (ref. 9). The particle displacement as used herein and as given in unpublished data
from G. E. Canuel is
f-
X O -
2P i
2pc (_
Lg
with R defined as
f Rw __2+ - --2
_PleffW2/!
(A9)
R = (1 + 0)_pc (A10)
or through the orifices. For flow through, equation (A2) becomes (ref.
e 2(2_pw)1/2 (_ t)= + (0.305V - 0.72)(Tpc
and, for flow past the orifice, equation (A2) becomes (ref. 16)
The parameter AI was shown in reference 6 to be frequency dependent.
Several modifications have been made to the procedure for flow of gas particles past
15)
(A11 a)
(Allb)
Presently,
there are no correlations for the combined effects of flow past and flow through the ori-
fices. Partitions behind the liner can be used to prevent net flow through of particles;
38

consequently, the designer will use either equation (A2} or (Allb). If the velocity pastthe orifices is small, equation (Allb) gives approximately the same results as equa-tion (A2).
The equations described are best solved ona high-speed computer andwere, there-fore, programmed for solution on the Lewis Research Center IBM 7090digital computer.The original program was received from Pratt andWhitney Aircraft Division of UnitedAircraft Corporation.
39

REFERENCES
I. Phillips, Bert, and Morgan, C. Joe: Mechanical Absorption of Acoustic Oscillations
in Simulated Rocket Combustion Chambers. NASA TN D-3792, 1966.
2. Usow, Karl H. ; Meyer, Carl L. ; and Schulze, Frederick W. : Experimental Inves-
tigation of Screeching Combustion in Full-scale Afterburner. NACA RM E53101,
1953.
3. Harp, James L., Jr. ; Velie, Wallace W. ; and Bryant, Lively: Investigation of Com-
bustion Screech and Method of Its Control. NACA RM E53L24b, 1954.
4. Backshear, Perry R. ; Rayle, Warren D. ; and Tower, Leonard K. : Study of Screech-
ing Combustion in a 6-inch Simulated Afterburner. NACA TN 3567, 1955.
5. Lawhead, R. B. ; and Levine, R. S. : Rocket Engine Vibration Studies. Project
MX 919. Rep. No. RE-134, North American Aviation, Inc., July 15, 1954.
6. Utnik, D. H. ; Ford, H. J. ; and Blackman, A. W.: Evaluation of Absorption Liners
for Suppression of Combustion Instability in Rocket Engines. J. Spacecraft, vol. 3,
no. 7, July 1966, pp. 1039-1045.
7. Wanhainen, John P. ; Parish, Harold C. ; and Conrad, E. William: Effect of Propel-
lant Injection Velocity on Screech in 20,000-Pound Hydrogen-Oxygen Rocket Engine.
NASA TN D-3373, 1966.
8. Blackman, A. W. : Effect of Nonlinear Losses on the Design of Absorbers for Com-
bustion Instabilities. ARS J. vol. 30, no. II, Nov. 1960, pp. 1022-1028.
9. Ingaard, Uno: On the Theory and Design of Acoustic Resonators. Acoust. Soc. Am.
J., vol. 25, no. 6, Nov. 1953, pp. 1037-1061.
I0. Crocco, Luigi; and Cheng, Sin-I: Theory of Combustion Instability in Liquid Propel-
lant Rocket Motors. Butterworth Scientific Fubl., 1956.
11. Hefner, R. J. : Review of Combustion Stability Development with Storable Propel-
lants. Paper No. 65-614, AIAA, June 1965.
12. Zwikker, C. ; and Kosten, C. W. : Sound Absorbing Materials. Elsevier Publ. Co.,
Inc., 1949.
13. Morse, Philip M. : Vibration and Sound. 2nd ed., McGraw-Hill Book Co., 1948.
14. Putnam, A. A. ; and Dennis, W. R. : Suppression of Burner Oscillations by Acous-
tical Dampers. ASME Trans., vol. 77, no. 6, Aug. 1955, pp. 875-883.
4O

15. McAuliffe, Clinton E. : The Influence of High Speed Air Flow on the Behavior of
Acoustical Elements. M.S. Thesis, M.I.T., 1950.
16. Mechel, F. ; and Schilz, W. : Research on Sound Propagration in Sound-Absorbent
Ducts with Superimposed Air Streams. Vol. II. Rep. No. AMRL-TDR-62-140 (I1),
U.S. Air Force, W-PAFB, Biomediceil Lab., Dec. 1962. (Available from DDC as
AD296985. )
N_A-L.,,g,_y.,987 E-3605 41