Embed Size (px)
Citation preview

Experimental Thermal and Fluid Science 33 (2009) 1037–1048
Contents lists available at ScienceDirect
Experimental Thermal and Fluid Science
journal homepage: www.elsevier .com/locate /et fs
Experimental investigation on a turbulence generation systemwith high-blockage plates
G. Coppola, A. Gomez *
Yale Center for Combustion Studies, Department of Mechanical Engineering, Yale University, New Haven, CT 06511, USA
a r t i c l e i n f o a b s t r a c t
Article history:Received 19 January 2009Received in revised form 4 June 2009Accepted 4 June 2009
Keywords:Turbulence generationHigh blockage
0894-1777/$ - see front matter � 2009 Elsevier Inc. Adoi:10.1016/j.expthermflusci.2009.06.001
* Corresponding author. Tel.: +1 203 432437; fax: +E-mail addresses: [email protected] (G
@yale.edu (A. Gomez).
An experimental study was conducted to develop and characterize systematically a new turbulence gen-erator system to yield large turbulent Reynolds numbers in a compact configuration. The effect of thegeometric parameters of two families of high-blockage plates on the resulting turbulent flow field wassystematically studied: one series of plates was characterized by the number and distribution of circularopenings; a second series had non-circular opening(s) with different shapes, distribution and position ofthe opening(s). The plates were placed upstream of a contoured contraction and the near field at the cen-terline of the resulting turbulent free jet was characterized by hot-wire anemometry in terms of meanaxial velocity, turbulence intensity, turbulence length scales and corresponding Reynolds numbers. Theplate with a central, non-circular opening produced the best compromise of highest turbulence levelsalong with excellent uniformity in average velocity and turbulence intensity, as evidenced by scan inthe transverse direction. It appears to be the most promising one. By comparison with more traditionalapproaches to turbulence generation, we increased the turbulent Reynolds numbers based on the integrallength scale to values on the order of 1000, which was one of the design objectives. Other plate geome-tries also yielded intense turbulence, but, in some cases, exhibited spurious frequency peaks in theirpower spectrum. The turbulent generation approach is to be adapted to combustion studies to reproduceconditions typical of practical system in relatively small experimental set-ups that are well-suited forbench-top experiments.
� 2009 Elsevier Inc. All rights reserved.
1. Introduction
To mimic the behavior of practical systems in a laboratory set-up typically requires the establishment of highly turbulent flows inrelatively confined systems and at flow rates much smaller than inapplications. Cost considerations and experimental limitationsmay in fact prevent the duplication of a practical system both interms of size and flow rates. Case in point are reacting flows ofgas turbines for which scaling considerations suggest operatingin a certain regime of turbulent Reynolds number, Rel = u0l/t, wherel is a suitable turbulent length scale, u0 the turbulence intensity andt the kinematic viscosity. That a turbulent Reynolds number, basedon either an integral scale, L, or a Taylor scale, k, rather than anengineering Reynolds number based on a macroscopic scale suchas an outlet diameter and an average velocity, ReD, ought to bethe critical scaling parameter is self evident from a turbulenceviewpoint, since Rel defines the range of length and time scalesof the problem. If such a range is sufficiently broad, as is the casefor sufficiently large Rel, the flow has the necessary prerequisites
ll rights reserved.
1 203 4327654.. Coppola), alessandro.gomez
of ‘‘true” turbulence and the study may have some general value.Since in the first approximation flow rates define the engineeringReD, the task is often to maximize Rel for a given ReD by using suit-able turbulence generation schemes, and yet preserve reasonablywell behaved velocity profiles. This is the objective of the presentinvestigation with the ultimate goal of applying the most promis-ing approach to combustion applications in well-controlled andcompact systems.
To generate turbulence in wind tunnels [1] and in axisymmetrictubes [2], we can distinguish between two approaches: passiveones, involving high velocity streams and jets issuing into a main-stream; and active ones involving, for example, oscillating grids.Both turbulence generation schemes show similar relative intensi-ties, at �20%, but with very different streamwise locations wherethe flow shows good symmetry/uniformity characteristics: �130jet diameters for the passive, jet approach and �1 jet diameterfor the active one, respectively. Passive grids are typically limitedto more modest turbulence intensities �10%. For example, with ameasured integral scale, L, on the order of 0.5 mm for every flowcondition [2], ReL ranging from 100 to 223 were achieved for thepassive approach and from 144 to 288 for the active one, at main-stream velocities of 27 and 39 m/s, respectively. The mixing layerdownstream of a free jet with its high levels of relative turbulence

Nomenclature
Dout inner diameter of nozzle outletH plate distance from nozzle exitRs radial position of the plate openingsRp plate radius, based on ½ of the wetted diameterd characteristic dimension of the plate opening(s)N number of openings on a plateAe plate open areaAp plate aream gas kinematic viscosityU mean axial velocityUout mass average axial velocity at nozzle exit section
u0 root mean square axial velocityL integral length scalek Taylor length scale�e mean energy dissipation rateReD engineering Reynolds number based on Dout and Uout
ReL Reynolds number based on the integral length scale, L,and u0
Rek Reynolds number based on the Taylor length scale, k,and u0
Red Reynolds number based on the characteristic lengthscale, d, of the plate opening
1038 G. Coppola, A. Gomez / Experimental Thermal and Fluid Science 33 (2009) 1037–1048
intensity has been exploited as turbulence generator [3] to studythe effect of high turbulence levels, for example, on heat transferand combustion [4]. More recently, fractal wakes generators [5]and fractal grids [6] have been exploited for multi-scale energyinjection with the same purpose, with a focus on the effect of thefractal dimension and of different geometrical parameters on theturbulence characteristics of the flow.
From a combustion perspective, reasonable turbulence levelsare typically generated in high-speed reactant jets. Flame extinc-tion/blow off limits the turbulence levels achievable, by limitingthe maximum jet velocity. Different solutions have been adoptedto overcome this limit, ranging from pilot flames [4] to bluff body[7] or swirl stabilization [8], each introducing new challenges,especially for computational modelers of those flames. A poten-tially ‘‘clean” alternative that has found some limited success relieson aerodynamic stabilization. It entails mounting two jets oppositeto each other and anchoring the flame in the resulting stagnationflow field without resorting to any pilot. Grid or plate turbulencegenerators are adopted to boost the turbulence levels and the mostcommon approach is to use a perforated plate downstream of a con-tracting nozzle. This approach allowed Kostiuk et al. [9] to achieve�12% of relative turbulence intensity, an integral scaleL � 2.25 mm and ReL = 165, based on such a scale, as measuredclose to the jet exit. Even more modest values were reported byKitajima et al. [10] (ReL � 50 with relative intensities up to �8%).Yoshida et al. [11] designed a turbulence generator, which con-sisted of 18 � 4 closed-end tubes, each of which had four 1.5 mmholes equally spaced around it. The jets impinge on each otherand produce a turbulent ReL � 220. In another study [12] the sameauthors developed yet another design specifically to study counter-flow premixed and diffusion flames relying on the turbulence gen-eration by opposed jets. The group in Darmstadt has performedsome of the most comprehensive investigation to date on thesetypes of flames [13–16]. But also in their case, the turbulent Rey-nolds numbers tend to be low, on the order of 100.
Clearly in all of these studies, the turbulence is weak, whichmakes these experiments less relevant to practical applications.Possibly, this is the reason why counterflow turbulent flames havenot been embraced by the combustion community, despite theenormous success of its laminar counterpart that is the prototypi-cal well-defined combustion environment [17]. Yet, the advantageof pilotless flame stabilization is very significant if these flames areto be computationally modeled without ad hoc assumptions. Themodeling of pilot flames, with attending burner losses that are dif-ficult to quantify, and their influence on the turbulence, pose noto-rious computational challenges. Our ultimate objective is tocontribute to the counterflow turbulent combustion literature bycircumventing the above mentioned ReL limitations.
Clearly, to establish strong turbulence we cannot let it developfrom shear flows by impinging jets hundreds of diameters apart. In
a typical counterflow configuration the nozzles are about one ortwo diameters apart, to reduce interference of the ambient air orinert shroud on the gas composition and ensure stable flames. Asa result, we are left with the challenge to develop highly turbulentand reasonably homogeneous flows inside the nozzle. Most inter-esting in this context is an approach that was inspired by someinternal combustion engine applications using either a 2D [18] oran axisymmetric [19] slot, upstream of a converging nozzle unlike[9,10] to generate vigorous turbulence intensities, up to 40%, andReL up to 1600. Of all the available turbulence generation schemes,these designs seem to be able to produce the most intense turbu-lent fields, at the cost of lack of homogeneity and isotropy. Theseauthors did not examine systematically the effect of geometricalparameters on the turbulence characteristics of the flow.
The aim of the present work is to develop and characterize sys-tematically a new turbulence generator scheme suited to studynon-premixed and premixed flames under intense turbulence,yielding ReL = O(1000). We investigated a variety of high-blockageplates, partly inspired by previous designs [18,19], and the influ-ence of many geometric parameters. In view of the large numberof plates and the extensive parameter space to be explored, sin-gle-point data at the center of the nozzle exit section were col-lected first to classify the plates. Subsequently, radial scans areused to assess the radial uniformity for the most promisingconfigurations.
2. Experimental system
2.1. Experimental set-up
The plates were tested in the nozzle assembly shown in Fig. 1.N2 gas entered at the bottom and went through a flow condition-ing section, consisting of two honeycombs measuring �46.6 mmin diameter, 38 mm apart from each other. Each honeycombwas 19 mm thick with a 0.8 mm cell size. The uniform flow leav-ing the conditioning section was then forced through a perfo-rated/slotted plate (Fig. 2), positioned at a variable distance, H,from the nozzle exit section. Depending on the radial positionof the plate opening(s), Rs, the flow would impact the top surfaceof the nozzle. It eventually exited through the 12.7 mm diameteropening at the nozzle top (Fig. 1b). The flow rate was controlledby digital flow controllers (Teledyne-Hastings 300D series) pro-viding readout and full scale accuracies of ±0.5% and ±0.2%,respectively. The estimated uncertainties at the minimum (30slpm) and maximum (90 slpm) flow rate were ±2.50% and±1.20%, respectively.
Turbulence characteristics were derived from velocity measure-ments by hot-wire anemometry. A high frequency (up to 150 kHz)response anemometer (IFA 100, TSI Inc.) was used and a single sen-sor probe (TSI, Inc., Model 1212) made of a 5 lm diameter (dw) sil-

Fig. 1. (a) Schematic drawing of the plate-nozzle assembly: H is the axial distance of the plate from the nozzle exit section; Dout is the nozzle outlet diameter; a is the nozzlecontraction angle; Rs is the radial position of the opening center; d is the plate opening diameter; Dp is the plate wetted diameter in the section upstream of the contraction;(b) Schematic drawing of the mean flow pattern through the nozzle with the hot-wire probe in position.
G. Coppola, A. Gomez / Experimental Thermal and Fluid Science 33 (2009) 1037–1048 1039
ver coated platinum wire with a 1.27 mm sensitive length (lw),resulting in an lw/dw � 250. The hot wire was calibrated using aunit (TSI, Inc., Model 1125) consisting of a contoured nozzle, pro-ducing a very flat and laminar flow at the exit section, a pressuretransducer, allowing for a very accurate measurement of the flowrate, and a probe holder, to position the sensitive wire at the centerof the nozzle exit section and perpendicular to the flow. Duringeach calibration, performed under the highest flow rate conditions,a square wave test was performed to guarantee a stable and fastwire response.
2.2. Data analysis and uncertainty estimates
All the data were sampled at the maximum sampling frequencyallowed by the data acquisition board fs = 200 kHz and high-passfiltered at fa = fs/2 = 100 kHz to prevent aliasing. The length of eachrecord was chosen to be the largest allowed by the system memorycapability, which resulted in records of up to 8.4�106 points(�65,000 integral time scales). The one-dimensional power spec-trum in the frequency space, E1 [20], was estimated by the Welchmethod [21], by which after dividing the record in many sub-re-cords (typically �1000) with 50% overlap, the power spectrumwas estimated on each sub-record by applying a Hamming win-dow [21], and averaging was performed on all sub-records. Theintegral length scale, L, was estimated by fitting the estimatedpower spectrum with the von Karman’s turbulent spectrum [22]
UE1ffgLu02
¼ 4 1þ 8pfL3U
� �2" #�5=6
; ð1Þ
where f is the frequency, u02 is the velocity variance and U is themean velocity. The transverse Taylor length scale, k, was estimatedfrom the mean energy dissipation rate, �e, according to the equation
k ¼ 15mu02
�e
� �1=2
; ð2Þ
where m is the kinematic viscosity [23]. The mean energy dissipa-tion rate, �e; was estimated by fitting the power spectrum inertialsubrange to the equation [23]
E1fk1g ¼1855
A�e2=3k�5=31 ; ð3Þ
where k1 = 2pf/U is the wavenumber and A = 1.62 is a constant [22].The statistical uncertainty was estimated by assuming a generaldistribution for the samples [24] and 95% confidence. The errorpropagation rules were applied to estimate the uncertainties inthe derived quantities. Conservatively, we assumed a ±3% uncer-tainty for a single velocity sample related to the apparatus, includ-ing calibrator [25]. The errors resulting from high turbulenceintensity were also taken into account and estimated from [26].The resulting total uncertainty comprises the flow metering systemuncertainty, the measurement system uncertainty for a single sam-ple, the statistical uncertainty and the uncertainty arising from theturbulence levels effect on the hot wire.
2.3. Turbulence generators
All plates were built by laser cutting a 2.54 mm thick cast ac-rylic plate with outer radius RP = 23.18 mm. The laser cutting sys-tem (Universal Laser Systems Inc., Model V-35) had an accuracyof ±0.01667% and a beam diameter at the focal point of0.127 mm, which limited the size of smallest feature/hole. Twofamilies of turbulence generators were considered: Multi-circularjet plates (MCJ) and non-circular jet plates (NCJ). The MCJ series(Fig. 2, top left) had a number of holes positioned at equal intervalsin the azymuthal direction and at a fixed radial position. The platesin this series are geometrically defined by the hole diameter, d, thenumber of holes N and their radial position Rs. The open area of thistype of perforated plate is given by Ae = NAh, where Ah is the area ofa single hole of diameter d.
To explore the possibility of affecting turbulent scales and flowhomogeneity with a more complex plate design, we considered also

Fig. 2. Turbulence generator families: multi-circular jet (MCJ) plate (top left) and non-circular jet (NCJ) plates (single-jet (top center); central-jet (top right); central wake(bottom left), multi-jet (bottom center), wake (bottom right)).
1040 G. Coppola, A. Gomez / Experimental Thermal and Fluid Science 33 (2009) 1037–1048
the flow through openings of different non-circular shapes. Manyexamples of flows from non-circular geometries have been re-ported, showing different features, like streamwise vortices, higherinstability, tendency to symmetry, etc. We considered a non-circu-lar geometry as a good candidate for turbulence generation in a sys-tem like the one under investigation and explored differentgeometric (sharp corners, lobed orifices and fractal openings) andflow configurations (jets and wakes), to exploit their flow features.The resulting geometries have been classified according to the platedominant geometric arrangement into four different sub-families:single-jet (SJ), central-jet (CJ), central wake (CW), wake (W), mul-ti-jet (MJ). For brevity, only one plate representative of each familyis presented. The single-jet (Fig. 2, top center) is the simplest one, asit consists of a hole at the plate center with different types of pro-trusions (triangular in the present design). The central-jet (Fig. 2,top right) is the evolution of the single-jet, where the protrusionsarea becomes larger than the open area, and the shape resemblesmultiple slit openings in a radial pattern connected at the center.The central wake (Fig. 2, bottom left) is a variant of the central-jet, where the protrusions meet at the center of the plate, blockingit and the result is a plate with a number of disconnected openingsclose to the plate center in a radial pattern. The multi-jet (Fig. 2, bot-tom center) implies multiple opening of the same type positionedat equal intervals and at the same radial position, as in the previousseries. The wake (Fig. 2, bottom right) can be generated by partiallyblocking the opening of a plate or placing an object downstream ofthe plate generated jets. In this case, each jet will generate a wakethat, depending on the holes radial position, may impact the nozzlewall, stretch/break the wake related structures and emerge fromthe nozzle exit section. In all cases, the plate outer radius measuredRP = DP/2 = 23.18 mm.
We also considered two additional families of plates, one with acircular slot and the other with a single circular opening in the cen-ter. For brevity we are not presenting results on these series be-cause they were less promising as compared to the two seriesdiscussed below.
3. Results and discussion
To cover as wide a parameter space as possible, a first screeningof the turbulence generators was based on single-point measure-ments on the centerline, �0.5 mm above the nozzle exit (Fig. 1b).In selected cases, radial scans were performed to check for radialuniformity and correlate it with the single-point measurements.Indeed, the normalized mean centerline axial velocity is a reason-ably good predictor of uniformity of the mean velocity profilealong the radial direction for symmetric patterns. Results are pre-sented in terms of: mean centerline axial velocity, U, normalized bythe mass average velocity at the plate at the specific flow rate, Uout,turbulence intensity, u0, normalized by the mean centerline veloc-ity, U, turbulent longitudinal integral scale, L, Taylor microscale, k,both normalized by the nozzle diameter, and the turbulent Rey-nolds numbers based on these scales, ReL and Rek, respectively.The rationale for this selection is that we wish to maximize the ra-tio of turbulent Reynolds number(s) to the engineering Reynoldsnumber, ReD, without compromising the uniformity of the flowin the radial direction. For example, ReL/ReDout = (L/Dout)(u0/U)(U/Uout), with the three non-dimensional variables to be shown insubsequent figures. This goal is achievable by maximizing L/Dout
and u0/U and keeping U/Uout as close to unity as possible for the ra-dial uniformity constraint.
The contoured nozzle and the large contraction ratio used inthis work, reduce possible flow asymmetry, producing profiles thatcould be assumed symmetric for the purpose of this work. In viewof the large number of plates investigated, radial profiles weremeasured only for the most interesting plates. At fixed flow rate,the plate open area, Ae, is expected to play a central role in the plateperformance, since it affects the energy injection at the largescales. Because of the high blockage used, this parameter is ex-pressed in relative terms, as the percentage of plate open area withrespect to the plate total area, %Ae = 100 Ae/Ap, where Ap = pR2
p isthe plate total area and Rp is the plate wetted radius. The holes/slotradial position is normalized by the nozzle exit section radius, Rout,

G. Coppola, A. Gomez / Experimental Thermal and Fluid Science 33 (2009) 1037–1048 1041
and the non-dimensional quantity R0 = Rs/Rout will be usedthroughout the discussion. The distance, H, between each plateand the nozzle exit section is normalized by the plate wet diame-ter, Dp, or nozzle base inner diameter. Also use will be made of theplate Reynolds number defined as Rep = Upd/m, where d is the hole/opening characteristic length and Up is the hole mass averagedvelocity.
3.1. Turbulence characteristics multi-circular jet plates (MCJ Series)
The multi-circular jet plates (MCJ Series) (Fig. 2, top left) weredesigned to understand the effect, if any, of the non-dimensionalradial position of the holes, R0, their number, N, and the plate openarea ratio, %Ae. The normalized mean centerline velocity shows atendency to increases with Rep (Fig. 3, top left). At fixed flow rate,an increase in Rep is achieved by decreasing d and/or N, and atevery radial position, N can be considered an indirect inverse mea-sure of the jet-to-jet distance. Increasing this distance, or decreas-ing N (Fig. 3, top right) increases U/Uout, probably by delaying thejet-to-jet momentum exchange, producing a flow less and less uni-form. On the other hand, fixing N, and increasing d, increases the%Ae, which, in turn, lowers the jet exit velocity at the plate and con-sequently the U/Uout ratio, thereby producing more uniform meanprofiles at the nozzle exit section. The holes radial position, R0, alsoinfluences the U/Uout ratio, although through a seemingly non-monotonic behavior (Fig. 3, bottom left). In fact, the U/Uout ratioseem to decrease from small (R0 < 1) to about R0 � 1 and possiblyincrease again at larger R0. The radial position also affects the jet-to-jet distance, therefore we would expect it to produce an effectsimilar to N, which seems to be the case for R0 > 1. In reality theflow pattern in the nozzle is quite different depending on whetherR0 < 1 or R0 > 1. In fact, for R0 < 1 the jets are directly under the noz-zle exit section, and should behave more like a free jet, while forR0 > 1 the jets impact onto the nozzle wall and develop into a wall
0.00
0.40
0.80
1.20
1.60
0 10000 20000 30000 40000Rep
U/U o
ut R'=0.6 %Ae=0.35R'=1.0 %Ae=0.35R'=1.6 %Ae=0.35R'=2.4 %Ae=0.35R'=1.6 %Ae=0.70R'=2.4 %Ae=0.70R'=1.0 %Ae=4.50R'=1.6 %Ae=4.50
0.0
0.4
0.8
1.2
1.6
0.0 1.0 2.0 3.0 4.0R'
U/U
out N=4 d=1.2 %Ae=0.35
N=8 d=0.9 %Ae=0.35N=6 d=1.0 %Ae=0.35N=3 d=1.4 %Ae=0.35N=6 d=1.4 %Ae=0.70N=8 d=1.2 %Ae=0.70N=4 d=4.4 %Ae=4.50N=6 d=3.6 %Ae=4.50
Fig. 3. Normalized centerline velocity of multiple circular jet plates (MCJ Series) at ReD �parametric in R0 and %Ae; R0 (bottom left) and H/Dp (bottom right), both parametric in N
jet, before leaving the nozzle. Increasing the non-dimensional dis-tance, H/Dp, between the perforated plate and the nozzle exit sec-tion (Fig. 3, bottom right) has the expected effect of lowering the U/Uout ratio, resulting in more uniform mean velocity profiles. Thelarger distance, in fact, allows the jet to develop and merge bythe time they reach the nozzle exit section and the flow has ad-justed to the local geometric configuration. For R0 < 1 (not shown)the turbulent jets spread with an angle of �20� and merge at a dis-tance of about 3� their separation [27], while for R0 > 1 the jetsmay or may not merge before impacting onto the nozzle innerwall, depending on the ratio between the merging distance andthe jet to wall distance. In any case, the wall jet emerging afterthe impact will merge faster, having a spreading rate about 3�higher than in free jets [28].
The radial scans of the normalized mean velocity (Fig. 4) con-firm the trends observed by evaluating the U/Uout ratio, showinga more pronounced bell shape profile with small N and at largeR0. It should be noticed that some plates show some degree ofasymmetry in the profiles, which can be the result of a large scaleinstability induced by the high blockage [27] and are possibly trig-gered by small geometric imperfections. The mechanism of suchinstabilities has been investigated by others [27,29–31] and is be-yond the scope of this work.
The turbulence relative intensity increases linearly with Rep
(Fig. 5, top left) to a good approximation. Notice the large valuesachieved with the present plate. Decreasing the %Ae increases themean velocity at the plate, which results in higher turbulence lev-els, while the mean velocity at the nozzle can change only to a lim-ited extent and is locked by the flow rate. At fixed %Ae, and flowrate, increasing Rep requires increasing d and appropriatelydecreasing N, which again has the effect of boosting the fluctua-tions (Fig. 5, top right). The holes radial position, R0, has a stronginfluence on the turbulence intensity (Fig. 5, bottom left), whichdecreases with increasing R0, to reach what could be a plateau for
0.00
0.40
0.80
1.20
1.60
1 3 5 7 9 11 13N
U/U
out
R' = 1.6 %Ae=0.35R' = 2.4 %Ae=0.35R' = 1.6 %Ae=0.70R' = 2.4 %Ae=0.70
0.0
0.4
0.8
1.2
1.6
H/Dp
U/U
out
N=4 d=1.2 %Ae=0.35 R'=2.4N=3 d=2.0 %Ae=0.68 R'=2.4N=4 d=1.9 %Ae=0.83 R'=2.4N=4 d=2.2 %Ae=1.13 R'=2.4N=3 d=2.2 %Ae=0.85 R'=2.4
10000 and fixed H/Dp � 1.4, as a function of: Rep (top left) and N (top right), bothand %Ae.

1.0
1.1
1.2
1.3
1.4
-1.0 -0.5 0.0 0.5 1.0
r/Rout
U/U
out
N=10 d=0.8 %Ae=0.35N=5 d=1.6 %Ae=0.70
1.0
1.1
1.2
1.3
1.4
-1.0 -0.5 0.0 0.5 1.0
r/Rout
U/U
out
R'=1.6R'=2.4R'=3.0
Fig. 4. MCJ Series radial profiles of the mean axial velocity component scaled by the mean centerline velocity, at ReD � 10,000 and H/Dp � 1.4. Left: radial profile parametric inN and %Ae. Right: radial profile parametric in R0 .
0
0.1
0.2
0.3
0.4
0.5
0.6
Rep
u'/U
R'=0.6 %Ae=0.35R'=1.0 %Ae=0.35R'=1.6 %Ae=0.35R'=2.4 %Ae=0.35R'=1.6 %Ae=0.70R'=2.4 %Ae=0.70R'=1.0 %Ae=4.50R'=1.6 %Ae=4.50 0
0.1
0.2
0.3
0.4
0.5
0.6
N
u'/U
R' = 1.6 %Ae=0.35
R' = 2.4 %Ae=0.35
R' = 1.6 %Ae=0.70
R' = 2.4 %Ae=0.70
0
0.2
0.4
0.6
0.8
R'
u'/U
N=4 d=0.05 %Ae=0.35N=8 d=0.03 %Ae=0.35N=6 d=0.04 %Ae=0.35N=3 d=0.06 %Ae=0.35N=6 d=0.06 %Ae=0.70N=8 d=0.05 %Ae=0.70N=4 d=0.18 %Ae=4.50N=6 d=0.14 %Ae=4.50
0.35
0.350.35
0.35
0.70.7
4.5 4.5
0
0.1
0.2
0.3
0.4
0 10000 20000 30000 40000 1 3 5 7 9 11 13
0.0 1.0 2.0 3.0 4.0 1.0 1.5 2.0 2.5H/Dp
u'/U
N=4 d=1.2 %Ae=0.35 R'=2.4N=3 d=2.0 %Ae=0.68 R'=2.4N=4 d=1.9 %Ae=0.83 R'=2.4N=4 d=2.2 %Ae=1.13 R'=2.4N=3 d=2.2 %Ae=0.83 R'=2.4
Fig. 5. Axial rms velocity normalized by the local mean value for multiple circular jet plates (MCJ Series) at ReD � 10,000 and fixed H/Dp � 1.4, as a function of: Rep (top left),and N (top right), both parametric in R0 and %Ae; R0 (bottom left) and H/Dp (bottom right), both parametric in N and %Ae.
1042 G. Coppola, A. Gomez / Experimental Thermal and Fluid Science 33 (2009) 1037–1048
R0 > 1, suggesting the existence of two regimes. In fact, for R0 < 1 thejets emerge from the plate, possibly merge and reach the nozzleexit section, behaving, overall, as free jets; for R0 > 1 the jets emergefrom the plate, and impact the nozzle wall, forming wall jets, be-fore reaching the nozzle exit section. The different behavior at%Ae = 0.35 can be explained as a Rep or N effect. In the first case,we notice that at fixed %Ae and flow rate, Rep increases linearlywith d, explaining the increase of the turbulence intensity withd. On the other hand, the fluctuations increase with decreasingnumber of holes. In the absence of flow visualization because oflack of optical access, one can speculate that the jet-to-jet interac-tion may be playing a role by inducing instabilities [27] in the flowand these instabilities may be favored by the larger separation be-tween the jets and high velocity. At %Ae > 0.35 this effect seems tobe negligible, probably supporting the idea of an instability basedon jet-to-jet interaction, with a critical value for Rep. Moving theplate further away from the nozzle exit section has the effect ofdecreasing the turbulence intensity, and there seem to be a critical
value of the distance before the decrease becomes evident at�1.8Dp. This suggests that the rate of decay is regulated by the noz-zle geometry (its internal diameter) and not by the plate holediameter. Significantly, the plates achieve a good radial uniformityin turbulence intensity (Fig. 6), which seem to slightly deterioratewith increasing R0.
The integral scale is relatively unaffected by Rep and N (Fig. 7,top), falling for most part in a band between 0.29Dout and 0.34Dout,corresponding to 3.75 and 4.25 mm, respectively. The exceptionare the plates with the largest area ratio (and lowest Rep), with val-ues of about 0.15Dout. The holes radial position (Fig. 7, bottom left)also has a weak influence, while the plates with %Ae � 4.5 show alarge variation with the radial position, with values falling to about0.15Dout for R0 > 1, suggesting the existence of a Rep-dependenttransition in the large scale dynamics. The integral scale growswith H/Dp (Fig. 7, bottom right), independently of Rep, with a pos-sible asymptotic value of �0.35Dout. Overall, the values of the inte-gral scale, for Rep > 10,000, fall within the range 0.3Dout–0.35Dout. If

0.00
0.10
0.20
0.30
0.40
-1.0 -0.5 0.0 0.5 1.0
r/Rout
u'/U
N=10 d=0.8 %Ae=0.35N=8 d=0.9 %Ae=0.35
0.0
0.1
0.2
0.3
0.4
-1.0 -0.5 0.0 0.5 1.0
-1.0 -0.5 0.0 0.5 1.0
r/Rout
u'/U
N=10 d=0.8 %Ae=0.35
N=5 d=1.6 %Ae=0.70
0.0
0.1
0.2
0.3
0.4
r/Rout
u'/U
R'=1.6R'=2.4R'=3.0
Fig. 6. MCJ Series radial profiles of the axial velocity rms normalized by the local mean axial velocity, at ReD � 10,000 and H/Dp � 1.4. Top left: radial profile parametric in Nand %Ae. Top right: radial profile parametric in %Ae. Bottom: radial profile parametric in R0 .
0.0
0.1
0.2
0.3
0.4
0 10000 20000 30000 40000Rep
L/D
out
R'=0.6 %Ae=0.35R'=1.0 %Ae=0.35R'=1.6 %Ae=0.35R'=2.4 %Ae=0.35R'=1.6 %Ae=0.70R'=2.4 %Ae=0.70R'=1.0 %Ae=4.50R'=1.6 %Ae=4.50 0.0
0.1
0.2
0.3
0.4
1 3 5 7 9 11 13N
L/D
out
R' = 1.6 %Ae=0.35R' = 2.4 %Ae=0.35R' = 1.6 %Ae=0.70R' = 2.4 %Ae=0.70
0.0
0.1
0.2
0.3
0.4
0.0 1.0 2.0 3.0 4.0
R'
L/D
out
N=4 d=0.05 %Ae=0.35N=8 d=0.03 %Ae=0.35N=6 d=0.04 %Ae=0.35N=3 d=0.06 %Ae=0.35N=6 d=0.06 %Ae=0.70N=8 d=0.05 %Ae=0.70N=4 d=0.18 %Ae=4.50N=6 d=0.14 %Ae=4.50
0.35 0.35 0.350.35
0.70.7
4.54.5
0.0
0.1
0.2
0.3
0.4
1.0 1.5 2.0 2.5H/Dp
L/D
out
N=4 d=1.2 %Ae=0.35 R'=2.4N=3 d=2.0 %Ae=0.68 R'=2.4N=4 d=1.9 %Ae=0.83 R'=2.4N=4 d=2.2 %Ae=1.13 R'=2.4N=3 d=2.2 %Ae=0.85 R'=2.4
Fig. 7. Normalized integral length scale of multiple circular jet plates (MCJ Series) at ReD � 10,000 and fixed H/Dp � 1.4, as a function of: Rep (top left), and N (top right),parametric in R0 and %Ae; R0 (bottom left) and H/Dp (bottom right), parametric in N and %Ae.
G. Coppola, A. Gomez / Experimental Thermal and Fluid Science 33 (2009) 1037–1048 1043
we normalize the integral scale by the plate wet diameter, Dp, therange becomes 0.075Dp–0.097Dp, which is in reasonable agree-ment with the existing literature [32] on confined single-jets, inspite of the different geometry. This last observation may suggestthat the integral scale is locked by the nozzle base internal diame-
ter (or plate wet diameter) [32–34] rather than by the plate holediameter [35].
The Taylor scale decreases with increasing Rep and N (Fig. 8,top) independently of R0 and %Ae. The dependence on R0 (Fig. 8, bot-tom left) is not simple, but overall k seems to increase as the holes

0.00
0.02
0.04
0.06
0 10000 20000 30000 40000
Rep
λ/D
out
λ/D
out
λ/D
out
λ/D
out
R'=0.6 %Ae=0.35R'=1.0 %Ae=0.35R'=1.6 %Ae=0.35R'=2.4 %Ae=0.35R'=1.6 %Ae=0.70R'=2.4 %Ae=0.70R'=1.0 %Ae=4.50R'=1.6 %Ae=4.50 0.00
0.02
0.04
0.06
0 2 4 6 8 10 12 14N
R' = 1.6 %Ae=0.35R' = 2.4 %Ae=0.35R' = 1.6 %Ae=0.70R' = 2.4 %Ae=0.70
0.00
0.02
0.04
0.06
0.0 1.0 2.0 3.0 4.0
R'
N=4 d=0.05 %Ae=0.35N=8 d=0.03 %Ae=0.35N=6 d=0.04 %Ae=0.35N=3 d=0.06 %Ae=0.35N=6 d=0.06 %Ae=0.70N=8 d=0.05 %Ae=0.70N=4 d=0.18 %Ae=4.50N=6 d=0.14 %Ae=4.50
0.350.35
0.350.35
0.7 0.7
4.54.5
0.00
0.01
0.02
0.03
0.04
0.05
0.06
1.0 1.5 2.0 2.5
H/Dp
N=4 d=1.2 %Ae=0.35 R'=2.4N=3 d=2.0 %Ae=0.68 R'=2.4N=4 d=1.9 %Ae=0.83 R'=2.4N=4 d=2.2 %Ae=1.13 R'=2.4N=3 d=2.2 %Ae=0.85 R'=2.4
Fig. 8. Normalized Taylor length scale of multiple circular jet plates (MCJ Series) at ReD � 10,000 and fixed H/Dp � 1.4, as a function of: Rep (top left), and N (top right),parametric in R0 and %Ae; R0 (bottom left) and H/Dp (bottom right), parametric in N and %Ae.
1044 G. Coppola, A. Gomez / Experimental Thermal and Fluid Science 33 (2009) 1037–1048
are positioned farther and farther away from the center of theplate. Increasing the distance of the plate from the nozzle exit sec-tion (Fig. 8, bottom right), has the effect of increasing k, indepen-dently of the area ratio. The turbulent Reynolds numbers, basedon the integral and the Taylor length scales, follow quite closelythe trends observed for the relative intensity with respect to R0
and H (Fig. 9), with values on the order of 2000 and 200, respec-tively for the centermost positions and small area ratios. Noticethat the objective of achieving a healthy turbulence has beenachieved under the present conditions. On the other hand, valueson the order of 150 and 60 for ReL and Rek are obtained for R0 > 1and high area ratios. The Reynolds numbers dependence on H alsosuggests the existence of an optimal position, dependent possiblyon the hole diameter.
We analyzed the shape of the power spectrum of the flow gen-erated by the plates and noticed for some of the plates a small‘bump’ at a frequency, f � 650 Hz, as shown in Fig. 10 At the high-est plate average velocity, this ‘bump’ becomes more noticeable asthe jets radial position R0 ? 0, with a possible critical value atR0 = 2.4. As the plate average velocity decreases, so does the criticalvalue, and for the peak to become noticeable the radial position, R0
has to be 1 or less. Decreasing N or increasing Rep (Fig. 10, left) hasa damping effect on the peak, as it gets less pronounced till it dis-appears completely for N = 3. Larger radial position or lower num-ber of jets imply a larger distance between the jets, suggesting thatthe peak could be induced by jet-to-jet interaction. Although notshown here for brevity, flow rate has no influence on the peak fre-quency therefore Rep does not seem to be playing a role. Althoughwe can only speculate on the origin of the ‘bump’, we did observethat this feature is present only for some plates and as such it canbe avoided by properly choosing the geometric parameters. Sincethe extent of the inertial range in the power spectrum is on the or-der of one decade, the system does not appear to be well-suited tostudy scaling laws generally requiring a much broader inertialrange.
In summary, the multi circular jet plate configuration offers areasonably good control over the relative fluctuations, lengthscales and turbulent Reynolds numbers. The plates seem to operateunder three regimes, depending on holes radial position, R0 andRep. The insurgence of a peak in the spectrum and of mean flowasymmetry under some conditions does, however, reduce therange of achievable turbulent Reynolds numbers. Homogeneity isrelatively good and is affected by R0 and N, improving by increasingN or decreasing R0. The turbulent Reynolds’ numbers are directlyproportional to the plate Reynolds number. If the objective ofinserting such a plate is to induce the largest possible turbulentReynolds’ numbers at a given flow rate without sacrificing radialhomogeneity in the velocity profiles, the present data suggests thatthe highest turbulence levels are achieved for small open area,small N and R0 < 1. Also, the plate should be close to the nozzle exitsection, if one can tolerate less homogeneous mean profile, other-wise one has to compromise between homogeneity requirementsand turbulence levels. The centerline velocity is a reasonably goodindicator of the shape of the mean velocity profile. By comparisonwith more traditional approaches to turbulence generation [9,36],we managed to increase the turbulent Reynolds number dramati-cally, which was one of the design objectives of the nozzle. In thatway, one may reproduce conditions typical of practical system inrelatively small experimental systems well-suited for bench-topexperiments and computational modeling.
3.2. Turbulence characteristics of selected non-circular jet plates (NCJ)
Data for the NCJ plates are presented in Figs. 11–13. The nor-malized mean velocity at the centerline (Fig. 11, top left) decreaseswith H/Dp for all the plates. The central-jet CJ type shows the high-est value of centerline velocity, reaching almost twice its averagevalue and being about 30% higher than the other plates at the sameposition, indicating a highly non-uniform profile, probably causedby the persistence of the high velocity central-jet. The central wake

0
500
1000
1500
2000
2500
0 10000 20000 30000 40000 0 10000 20000 30000 40000Rep
Re L
R'=0.6 %Ae=0.35R'=1.0 %Ae=0.35R'=1.6 %Ae=0.35R'=2.4 %Ae=0.35R'=1.6 %Ae=0.70R'=2.4 %Ae=0.70R'=1.0 %Ae=4.50R'=1.6 %Ae=4.50
0
50
100
150
200
250
Rep
Re λ R'=0.6 %Ae=0.35
R'=1.0 %Ae=0.35R'=1.6 %Ae=0.35R'=2.4 %Ae=0.35R'=1.6 %Ae=0.70R'=2.4 %Ae=0.70R'=1.0 %Ae=4.50R'=1.6 %Ae=4.50
0
500
1000
1500
2000
2500
R'
ReL
N=4 d=0.05 %Ae=0.35N=8 d=0.03 %Ae=0.35N=6 d=0.04 %Ae=0.35N=3 d=0.06 %Ae=0.35N=6 d=0.06 %Ae=0.70N=8 d=0.05 %Ae=0.70N=4 d=0.18 %Ae=4.50N=6 d=0.14 %Ae=4.500.35
0.35
0.35
0.70.74.5
4.5
0
50
100
150
200
250
0.0 1.0 2.0 3.0 4.00.0 1.0 2.0 3.0 4.0R'
Reλ
N=4 d=0.05 %Ae=0.35N=8 d=0.03 %Ae=0.35N=6 d=0.04 %Ae=0.35N=3 d=0.06 %Ae=0.35N=6 d=0.06 %Ae=0.70N=8 d=0.05 %Ae=0.70N=4 d=0.18 %Ae=4.50N=6 d=0.14 %Ae=4.50
0.350.35
0.35 0.35
0.7 0.7
4.5
4.5
0
400
800
1200
1600
2000
1.0 1.5 2.0 2.5 1.0 1.5 2.0 2.5H/Dp
Re L
N=4 d=1.2 %Ae=0.35 R'=2.4N=3 d=2.0 %Ae=0.68 R'=2.4N=4 d=1.9 %Ae=0.83 R'=2.4N=4 d=2.2 %Ae=1.13 R'=2.4N=3 d=2.2 %Ae=0.85 R'=2.4
0
50
100
150
200
H/Dp
Re λ
N=4 d=1.2 %Ae=0.35 R'=2.4N=3 d=2.0 %Ae=0.68 R'=2.4N=4 d=1.9 %Ae=0.83 R'=2.4N=4 d=2.2 %Ae=1.13 R'=2.4N=3 d=2.2 %Ae=0.85 R'=2.4
Fig. 9. Turbulent Re numbers of multiple circular jet plates (MCJ Series) based on the integral scale (left column) and the Taylor length scale (right column) at Re � 10,000 andH/Dp � 1.4. Top row: as a function of Rep and parametric in R0 and %Ae. Middle row: as function of R0 and parametric in N (or d) and %Ae. Bottom row: as function of H/Dp andparametric in N (or d) and %Ae.
Fig. 10. Energy spectra vs. wavenumber of multiple circular jet plates (MCJ Series). Left: parametric in N. Right: parametric in R0 .
G. Coppola, A. Gomez / Experimental Thermal and Fluid Science 33 (2009) 1037–1048 1045
(CW) and multi-jet (MJ) plates produce more uniform profiles, inspite of their lower %Ae, probably as a consequence of the hole po-
sition. The turbulence intensity (Fig. 11, top right) decreases withH, and the single-jet (SJ), CJ and CW plates show the highest values,
0.0
0.5
1.0
1.5
2.0
1.0 1.5 2.0 2.5H/Dp
U/U
out
SJPCJPCWPMJPWP4.5
2.4
1.6 2.9
0
0.1
0.2
0.3
0.4
H/Dp
u'/U
SJPCJPCWPMJPWP
2.91.6
4.5
1.6
2.4
0.0
0.1
0.2
0.3
0.4
0.5
H/Dp
L/D
out
SJPCJPCWPMJPWP
2.94.5
1.6
2.4
0.00
0.02
0.04
0.06
H/Dp
λ/D
out
SJPCJPCWPMJPWP
1.6 4.52.9
1.6
2.4
0
1000
2000
3000
H/Dp
Re
L
SJPCJPCWPMJPWP
2.9 4.5
1.6
1.6
2.4
0
100
200
300
1. . .
1.0 1.5 2.0 2.5
1.0 1.5 2.0 2.5 1.0 1.5 2.0 2.5
1.0 1.5 2.0 2.5 0 1 5 2 0 2.5H/Dp
Re
λ
SJPCJPCWPMJPWP
4.52.91.6
1.6
2.4
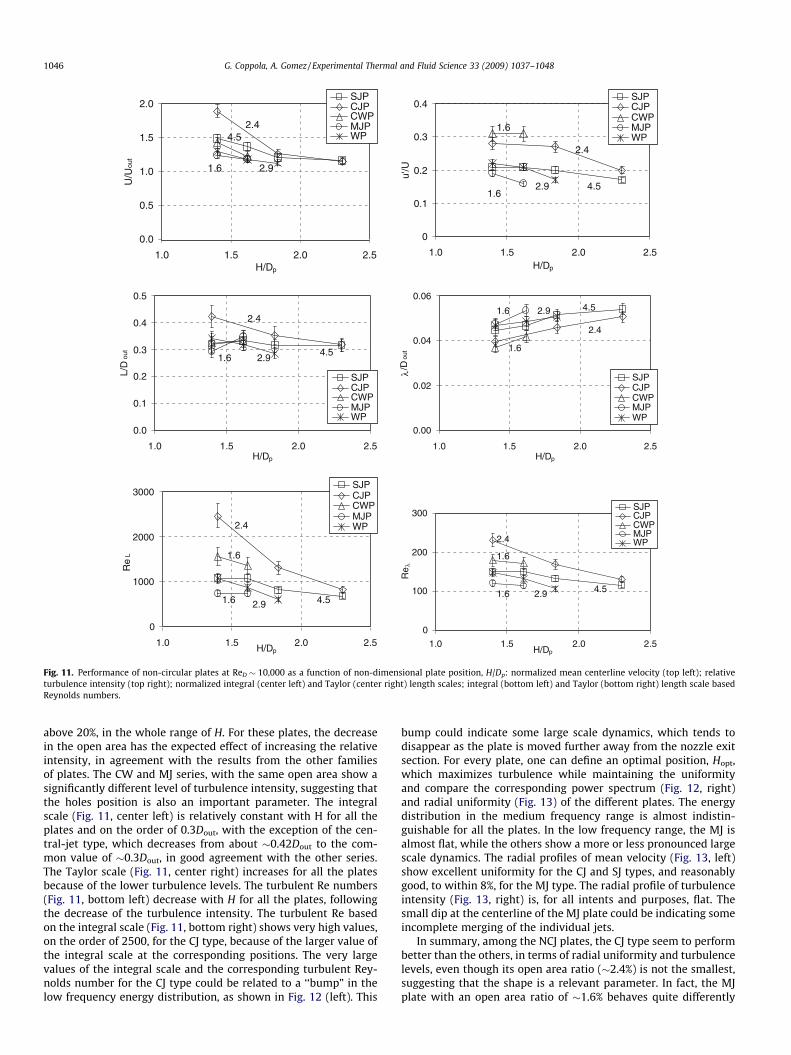
Fig. 11. Performance of non-circular plates at ReD � 10,000 as a function of non-dimensional plate position, H/Dp: normalized mean centerline velocity (top left); relativeturbulence intensity (top right); normalized integral (center left) and Taylor (center right) length scales; integral (bottom left) and Taylor (bottom right) length scale basedReynolds numbers.
1046 G. Coppola, A. Gomez / Experimental Thermal and Fluid Science 33 (2009) 1037–1048
above 20%, in the whole range of H. For these plates, the decreasein the open area has the expected effect of increasing the relativeintensity, in agreement with the results from the other familiesof plates. The CW and MJ series, with the same open area show asignificantly different level of turbulence intensity, suggesting thatthe holes position is also an important parameter. The integralscale (Fig. 11, center left) is relatively constant with H for all theplates and on the order of 0.3Dout, with the exception of the cen-tral-jet type, which decreases from about �0.42Dout to the com-mon value of �0.3Dout, in good agreement with the other series.The Taylor scale (Fig. 11, center right) increases for all the platesbecause of the lower turbulence levels. The turbulent Re numbers(Fig. 11, bottom left) decrease with H for all the plates, followingthe decrease of the turbulence intensity. The turbulent Re basedon the integral scale (Fig. 11, bottom right) shows very high values,on the order of 2500, for the CJ type, because of the larger value ofthe integral scale at the corresponding positions. The very largevalues of the integral scale and the corresponding turbulent Rey-nolds number for the CJ type could be related to a ‘‘bump” in thelow frequency energy distribution, as shown in Fig. 12 (left). This
bump could indicate some large scale dynamics, which tends todisappear as the plate is moved further away from the nozzle exitsection. For every plate, one can define an optimal position, Hopt,which maximizes turbulence while maintaining the uniformityand compare the corresponding power spectrum (Fig. 12, right)and radial uniformity (Fig. 13) of the different plates. The energydistribution in the medium frequency range is almost indistin-guishable for all the plates. In the low frequency range, the MJ isalmost flat, while the others show a more or less pronounced largescale dynamics. The radial profiles of mean velocity (Fig. 13, left)show excellent uniformity for the CJ and SJ types, and reasonablygood, to within 8%, for the MJ type. The radial profile of turbulenceintensity (Fig. 13, right) is, for all intents and purposes, flat. Thesmall dip at the centerline of the MJ plate could be indicating someincomplete merging of the individual jets.
In summary, among the NCJ plates, the CJ type seem to performbetter than the others, in terms of radial uniformity and turbulencelevels, even though its open area ratio (�2.4%) is not the smallest,suggesting that the shape is a relevant parameter. In fact, the MJplate with an open area ratio of �1.6% behaves quite differently

Fig. 12. Energy spectra of non-circular plates versus frequency. Left plot: non-circular central-jet at different distances from the nozzle exit section. Dotted line: H/Dp � 1.4;dashed line: H/Dp � 1.8; plain line: H/Dp � 2.3. Right plot: non-circular plates at their respective optimal position H. Plain line: single-jet plate at H/Dp � 1.8; dashed line:central-jet plate at H/Dp � 2.3; dotted line: central wake plate at H/Dp � 1.6; dashed-dotted line: multi-jet plate at H/Dp � 1.4; plain line with empty circles: wake plate at H/Dp � 1.6.
0.92
0.94
0.96
0.98
1.00
1.02
-1.0 -0.5 0.0 0.5 1.0 -1.0 -0.5 0.0 0.5 1.0
r/Rout
U/U
c
SJPCJPMJP
0.00
0.05
0.10
0.15
0.20
0.25
r/Rout
u'/U
SJPCJPMJP
Fig. 13. Non-circular plate radial profiles of mean axial velocity component (right) and the rms axial velocity component (left), scaled respectively by the mean centerlinevelocity and local mean velocity. Diamonds: single jet plate at H/Dp � 1.8; squares: central-jet plate at H/Dp � 2.3; triangles: multi-jet plate at H/Dp � 1.4.
G. Coppola, A. Gomez / Experimental Thermal and Fluid Science 33 (2009) 1037–1048 1047
from the CW plate with the same open area ratio. Overall, the NCJseries achieves larger turbulent Re with a lower blockage than inthe MCJ series discussed in Section 3.1, coupled to excellent flowhomogeneity. The lack of frequency peaks as found occasionallyin the previous series suggests that the holes geometry has also apronounced effect on the fluid dynamics instabilities and it is a via-ble way to offset them, if not overcome them. The geometric shapeis a powerful parameter offering considerable flexibility.
4. Conclusions
The typical objective of experimental systems for turbulencegeneration is that of maximizing the turbulent Reynolds numbersto mimic flows of practical interest within the confines of abench-top experimental system. A systematic experimental studywas conducted on a system consisting of a high-blockage plateplaced upstream of a contoured contraction. The effect of the geo-metric parameters of two families of high-blockage plates on theresulting turbulent flow field was systematically studied: one ser-ies of plates was characterized by the number and distribution ofcircular openings; a second one had non-circular opening(s) withdifferent shapes, distribution and position of opening(s). The nearfield at the centerline of the turbulent free jet at the outlet of thesystem was characterized by hot-wire anemometry in terms ofmean axial velocity, turbulence intensity, turbulence length scalesand corresponding Reynolds numbers. The multi circular jet seriesperform well in terms of achieving higher turbulent levels at a gi-
ven flow rate and preserving radial uniformity, although a spuriouspeak in the power spectrum in some cases could limit the range ofapplicability of such plates. In fact, our results suggest that lowaverage velocity with the circular openings at any radial positionor high average velocity with the circular openings at large radialpositions are required for the peaks to disappear. The non-circularjet series, and specifically the plate with a central-jet, shows themost promising results, with very high turbulence levels and excel-lent radial uniformity, in both average velocity and turbulenceintensity. The analysis of the power spectrum of the flow generatedby these plates shows some low frequency dynamics, which mayaffect some of the results in terms of integral length scales andthe corresponding Reynolds number. This effect, though, tends todisappear with increasing distance of the plate from the nozzle exitsection. As expected, for all the plates, the turbulence levels de-crease with the distance between the plate and the nozzle exit sec-tion. In general, the turbulence generation system is flexible, byallowing for independent change of the turbulent Reynolds num-bers and of the flow rate, through changes in simple geometricalparameters of the perforated plates. Turbulence generationthrough high-blockage perforated plates placed upstream a con-traction is a viable way to generate intense turbulent fields, as longas precautions are taken to avoid possible instabilities generatedby the plate opening(s), shape and position. This new turbulencegeneration scheme was recently applied to counterflow flames[37] and catapulted them into regimes of relevance to practicalsystems, well beyond the quasi-laminar conditions that have beenstudied to date.
1048 G. Coppola, A. Gomez / Experimental Thermal and Fluid Science 33 (2009) 1037–1048
Acknowledgments
The support of DARPA under Grant No. DAAD19-01-1-0664 (Dr.Richard J. Paur, Contract Monitor) is gratefully acknowledged. Weare indebted to Nick Bernardo for technical assistance in the con-struction of the hardware and to Dr. Kailasnath Purushothamanfor technical discussions.
References
[1] K.A. Thole, D.G. Bogard, J.L. Whantong, Generating high freestream turbulencelevels, Experiments in Fluids 17 (1994) 375–380.
[2] U. Shavit, N. Chigier, Development and evaluation of a new turbulencegenerator for atomization research, Experiments in Fluids 20 (1996) 291–301.
[3] P.K. Maciejewski, R.J. Moffat, Heat-transfer with very high free-streamturbulence. 1. Experimental-data, Journal of Heat Transfer – Transactions ofthe Asme 114 (1992) 827–833.
[4] L. Muniz, M.G. Mungal, Effects of heat release and buoyancy on flow structureand entrainment in turbulent nonpremixed flames, Combustion and Flame 126(2001) 1402–1420.
[5] D. Queiros-Conde, C. Vassilicos, Turbulent wakes of 3-D fractal grids, in: J.C.Vassilicos (Ed.), Intermittency in Turbulent Flows and other DynamicalSystems, Cambridge University Press, 2000.
[6] D. Hurst, J.C. Vassilicos, Scalings and decay of fractal-generated turbulence,Physics of Fluids 19 (2007).
[7] S.H. Kim, H. Pitsch, Mixing characteristics and structure of a turbulent jetdiffusion flame stabilized on a bluff-body, Physics of Fluids 18 (2006).
[8] R.K. Cheng, I.G. Shepherd, B. Bedat, L. Talbot, Premixed turbulent flamestructures in moderate and intense isotropic turbulence, Combustion Scienceand Technology 174 (2002) 29–59.
[9] L.W. Kostiuk, K.N.C. Bray, R.K. Cheng, Experimental-study of premixedturbulent combustion in opposed streams. 1. Nonreacting flow field,Combustion and Flame 92 (1993) 377–395.
[10] A. Kitajima, T. Ueda, A. Matsuo, M. Mizomoto, A comprehensive examination ofthe structure and extinction of turbulent nonpremixed flames formed in acounterflow, Combustion and Flame 121 (2000) 301–311.
[11] A. Yoshida, T. Igarashi, Y. Kotani, Extinction of turbulent diffusion flames byKolmogorov microscale turbulence, Combustion and Flame 109 (1997) 669–681.
[12] A. Yoshida, An opposed jet burner for the study of high-intensity combustion,Measurement Science and Technology 10 (1999) N149–N151.
[13] D. Geyer, A. Kempf, A. Dreizler, J. Janicka, Scalar dissipation rates in isothermaland reactive turbulent opposed-jets: 1-D-Raman/Rayleigh experimentssupported by LES, Proceedings of the Combustion Institute 30 (2005) 681–689.
[14] D. Geyer, A. Dreizler, J. Janicka, A.D. Permana, J.Y. Chen, Finite-rate chemistryeffects in turbulent opposed flows: comparison of Raman/Rayleighmeasurements and Monte Carlo PDF simulations, Proceedings of theCombustion Institute 30 (2005) 711–718.
[15] D. Geyer, A. Kempf, A. Dreizler, J. Janicka, Turbulent opposed-jet flames: acritical benchmark experiment for combustion LES, Combustion and Flame143 (2005) 524–548.
[16] A. Kempf, H. Forkel, J.Y. Chen, A. Sadiki, J. Janicka, Large-eddy simulation of acounterflow configuration with and without combustion, Proceedings of theCombustion Institute 28 (2000) 35–40.
[17] S.R. Turns, An Introduction to Combustion: Concepts and Applications, Seconded., McGraw-Hill, Boston, 2000.
[18] B.D. Videto, D.A. Santavicca, A turbulent-flow system for studying turbulentcombustion processes, Combustion Science and Technology 76 (1991) 159–164.
[19] B. Bedat, R.K. Cheng, Experimental-study of premixed flames in intenseisotropic turbulence, Combustion and Flame 100 (1995) 485–494.
[20] International Workshop on Measurement and Computation of TurbulentNonPremixed Flames, 2008. <http://www.ca.sandia.gov/TNF>.
[21] A.V. Oppenheim, R.W. Schafer, Discrete-Time Signal Processing, Prentice-Hall,Upper Saddle River, NJ, 1989.
[22] M.J. Barrett, D.K. Hollingsworth, On the calculation of length scales forturbulent heat transfer correlation, Journal of Heat Transfer – Transactions ofthe Asme 123 (2001) 878–883.
[23] J.O. Hinze, Turbulence, McGraw-Hill, 1975.[24] L.H. Benedict, R.D. Gould, Towards better uncertainty estimates for turbulence
statistics, Experiments in Fluids 22 (1996) 129–136.[25] F. Jorgensen, How to Measure Turbulence with Hot-Wire Anemometers (A
Practical Guide), Dantec Dynamics, Dantec Dynamics, 2002.[26] H.H. Bruun, Hot-Wire Anemometry: Principles and Signal Analysis, Oxford
University Press, London, 2000.[27] E. Villermaux, E.J. Hopfinger, Periodically arranged co-flowing jets, Journal of
Fluid Mechanics 263 (1994) 63–92.[28] T.J. Craft, B.E. Launder, On the spreading mechanism of the three-dimensional
turbulent wall jet, Journal of Fluid Mechanics 435 (2001) 305–326.[29] E. Villermaux, J. Sommeria, Y. Gagne, E.J. Hopfinger, Oscillatory instability and
genesis of turbulence behind a high solidity grid, European Journal ofMechanics B – Fluids 10 (1991) 427–439.
[30] E. Villermaux, E.J. Hopfinger, Self-sustained oscillations of a confined jet – acase-study for the nonlinear delayed saturation model, Physica D 72 (1994)230–243.
[31] P. Legal, I. Peschard, M.P. Chauve, Y. Takeda, Collective behavior of wakesdownstream a row of cylinders, Physics of Fluids 8 (1996) 2097–2106.
[32] B.C. Khoo, T.C. Chew, P.S. Heng, H.K. Kong, Turbulence characterization of aconfined jet using PIV, Experiments in Fluids 13 (1992) 350–356.
[33] J.S. Brown, B.C. Khoo, A.A. Sonin, Rate correlation for condensation of purevapor on turbulent, subcooled liquid, International Journal of Heat and MassTransfer 33 (1990) 2001–2018.
[34] A.A. Sonin, M.A. Shimko, J.H. Chun, Vapor condensation onto a turbulent liquid.1. The steady condensation rate as a function of liquid-side turbulence,International Journal of Heat and Mass Transfer 29 (1986) 1319–1332.
[35] K. Sardi, A.M.K.P. Taylor, J.H. Whitelaw, Extinction of turbulent counterflowflames under periodic strain, Combustion and Flame 120 (2000) 265–284.
[36] E. Korusoy, J.H. Whitelaw, Extinction and relight in opposed flames,Experiments in Fluids 33 (2002) 75–89.
[37] G. Coppola et al., Highly Turbulent Counterflow Flames: A Laboratory ScaleBenchmark for Practical Systems, Combustion and Flame (2009), doi:10.1016/j.combustflame.2009.03.017.