Embed Size (px)
Citation preview

Experimental investigation on influence of smoke venting velocity
and vent height on mechanical smoke exhaust efficiency
Ji Jiea, Li Kaiyuanb, Zhong Weic,*, Huo Rana
a State Key Laboratory of Fire Science, University of Science and Technology of Chin, Hefei 230026, China;
b Department of Civil and Natural Resources Engineering, University of Canterbury, Christchurch 8140, New Zealand
c School of chemical engineering, Zhengzhou University, Zhengzhou 450001, China
Abstract:
A set of burning experiments were conducted to investigate the influence of smoke
vent height and exhausting velocity on mechanical smoke exhausting efficiency.
Results have shown that the smoke exhausting process becomes more efficient due to
the increased smoke vent height and the decreased exhausting velocity, which
eliminate the plug-holing issue with fewer disturbances on the smoke layer interface.
For each certain exhausting velocity, there is a critical value of distance between the
vent and the bottom of the smoke layer. When the distance is less than the critical
value, the smoke exhausting is inefficient, and the efficiency decreases sharply as the
distance decreases. Contrarily, when the distance is greater than the critical value, a
good efficiency can be acquired and the exhausted smoke increased relatively slowly
as the distance increases. A critical Froude number, proposed by Hinkley to predict
the onset of plug-holing effect in gravity venting systems, was validated in the
experiments. However, the experimental results indicate that in the tests without the
plug-holing, the fresh air entrained due to smoke exhausting is up to 48% of the
mechanical exhausting rate.
Keywords: smoke exhausting efficiency; smoke vent height; exhausting velocity;
plug-holing
1. Introduction
Statistics showed that smoke and toxic gases, such as carbon monoxide, are the
most fatal hazard to the people in fires [1-3]. Therefore, when a fire occurs, it is very
important to stop the smoke and toxic gases from spreading by natural or mechanical
exhaust systems. As a result, the current building codes in China as well as lots of
former studies on smoke management have mainly focused on the smoke exhausting
rate and the proportion of fresh air within the smoke exhaust rate. However, except
for the maximum limit of smoke exhausting velocity, no specific concern on the
variation of exhausting velocity and smoke vent height is currently made in the
building codes [4-7]. Actually, these two parameters are very important, especially to
the spaces with less net height, such as the underground buildings (metro station,
shopping mall, etc.) where a more efficient smoke exhausting is required. Usually a
thin smoke layer is required for life safety in these places due to its height limit.
Under this condition, if the smoke exhausting velocity is too large, the ambient fresh
air beneath the smoke layer is easy to be directly (without mixing with smoke) or
indirectly (mixing with smoke firstly) exhausted, resulting in smoke exhausting
inefficiency. So, the study on these issues may benefit the current design of smoke
management system and complement the current codes.
Recently, several former studies had been carried out to investigate the influence
of the two factors on mechanical smoke exhausting efficiency. Shi et al.[8]
experimentally studied the mechanical exhaust efficiency in compartment fire and
claimed that when the exhausting vents were located near the smoke-air interface,
larger disturbance occurred, under which a large amount of fresh air were entrained
into upper smoke layer. Yi [9] conducted experiments to study the mechanical

exhausting efficiency in a full-scale atirum and concluded that as the smoke layer
below a smoke exhaust vent is relatively thin and the vent velocity is large enough,
the entrained air significantly diluted the smoke layer and took a big proportion of the
rated volume of smoke exhausting, which leaded to a poor mechanical smoke exhaust
efficiency. A lot of other experiments were conducted by Lougheed et al [10] in a
small scale atrium with a mechanical exhausting system. The results had shown that if
there was a well-developed smoke layer below the exhausting inlets, the measured
flow rate was comparable to the smoke generation rate, if not, the exhaust system
would entrained a relatively large amount of fresh air, up to 75% of the mechanical
exhausting capacity. Lougheed also claimed that the Froude number proposed by
Hinkley [11] for “Plug-holing” (i.e. the fresh air is drawn directly into the smoke
exhausting system from the lower layer) in natural smoke venting can be applied in
mechanical smoke exhausting. Vauquelin [12] also noticed the plug-holing in some of
the transverse smoke exhausting experiments in a small scale tunnel with less net
height. His conclusion was that in the cases with plug-holing, the smoke exhausting
efficiency had strongly decreased. However, in these former studies, delicate
quantitative analyses on how the exhausting velocity and smoke vent height influence
the mechanical smoke exhausting efficiency has rarely been addressed. The
disturbance of mechanical smoke exhausting on the smoke-air interface, which causes
different amount of fresh air exhausted directly and indirectly, leads to different
smoke exhausting efficiencies, has rarely been discussed. Actually, the influence in
the enclosures with less net height is more significant, due to a thin smoke layer
required for life safety. The Hinkley’s model also needs quantitatively validation for
mechanical smoke exhausting system, especially to the buildings with less net height.
In order to investigate the influence of these two factors on smoke exhausting

efficiency, a set of experiments were conducted. The CO concentration in the exhaust
duct, the smoke layer temperature and the smoke spilling rate are experimentally
measured. Meanwhile, the values predicted by Hinkley’s model are compared with
experimental results and some suggestions are proposed to achieve a excellent smoke
exhausting efficiency.
2. Theoretically analysis
The smoke exhausting process with a smoke layer below an exhausting vent is
shown in Figure 1. As shown in the figure, em is the smoke exhausting rate, sm is
the smoke proportion of the exhausting rate, am is the entrained fresh air due to the
mixture with smoke layer, pm is the exhausted fresh air drawn directly from the
lower layer due to the plug-holing effect. The correlation of these variables can be
expressed as
e s a pm m C m m (1)
where, C is a coefficient which is between 0 and 1. Theoretically, less aCm and pm
lead to better smoke exhausting efficiency. If the value of pm does not equal to zero,
plug-holing occurs, which might be avoided by ensuring the smoke layer below
smoke vent to be thick enough and an appropriate exhausting velocity.
As shown in Equation (1), it is implied that only part of the mixed air, aCm , is
exhausted by smoke vent, and the rest of it ( (1 ) aC m ) stays in the smoke layer and
keeps spreading along. Therefore, the increase of smoke under mechanical smoke
exhausting can be determined by
f e a pm m m m m (2)
where, fm is the mass flow rate of plume, as shown in the Figure 1, which is the
smoke induced solely by a fire (to make a distinction to the increase of smoke due to
the entrained fresh air induced by mechanical smoke exhausting) and can be estimated
by the plume entrainment models in literatures [14-16]. Under an ideal smoke
controlling condition, am and pm should be zero, and em should equal to fm .
Therefore, m equals to zero so that the smoke exhausting operates at the maximum
efficiency under which the smoke generated by the plume is totally exhausted without
any fresh air mixed in the smoke layer or entering into the vent.
Hinkley has proposed a modified Froude number to determine the occurrence of
plug-holing in natural venting systems [11], which is
1/ 2 5 / 20( / )
eu AF
g T T d
(3)
where, eu is the flow velocity at the smoke vent (m/s), A is the area of the smoke
vent (m2), d is the thickness of smoke layer (m), T is the average temperature
rise of the smoke layer (K), 0T is the ambient temperature (K), and g is the gravity
acceleration (m/s2). The physical meaning of F in Equation (3) is the ratio of the
inertia force to the gravity force which is relevant to the buoyant flows associated
with fires. For the occurrence of the plug-holing, there is a critical Froude number
named as criticalF . It can be inferred that when the Froude number under certain
condition is greater than criticalF , fresh air in the lower layer is drawn directly into the
mechanical vent. Former studies [13] have shown that criticalF of 1.5 is applicable for
vents closed to the center of the smoke reservoir and 1.1 is suitable to the vents near
the reservoir sides [12]. Lougheed concluded that the Froude number can be used to
determine the plug-holing in mechanical smoke exhausting atria [10]. However, a
further quantitatively validation is expected.

3. Experiments
The experimental set up is shown in Figure 2. It constitutes of two parts, the
burning cabin and the smoke filling cabin, as shown in Figure 2. Pool fires are burned
in the burning cabin to generate an initial stable smoke layer in the upper part of the
smoke filling cabin. The burning cabin is 4 m long, 2 m wide and 2.5 m high. Six
make-up air intakes with a length of 0.8 m and a height of 0.4 m are settled on both
sides of the cabin. The smoke filling cabin is a cube with a length of 4.2m, a width of
4.2m and a height of 4 m. Smoke curtains, with heights of 1.0m on the south side and
2.0m on the other three sides, are installed below the top of the cabin to maintain an
initial stable smoke layer. As shown in Figure 2, a 30cm×30cm smoke exhausting
vent is located at the ceiling of the smoke filling cabin. Five pieces of short mountable
ducts with a size of 30cm×30cm×20cm (depth) were used to vary the vent height
from 3.0m to 4.0m with an interval of 20cm. The rate of smoke exhausting is
adjustable within the range of 0-5000m3/h. As mentioned above, the mechanical fan
may suck a mixture of the smoke induced solely by the fire and the fresh air due to the
disturbance of mechanical smoke exhausting on the smoke-air interface.
As shown in Figure 2, two set of thermocouples were used to measure the
temperature in the smoke filling cabin and the spilling smoke from the south side
respectively. The thermocouples were setup with 0.25m spacing and the highest ones
were 3cm below ceiling. Two gauges with an accuracy of centimeter were installed
between the bottom of the smoke curtain and ground, to measure the height of the
smoke. Two KANOMAX hot-wire anemometers were located below the smoke
curtain on the south side, to measure the smoke spilling thickness and velocity
respectively. A Testo350XL gas analyzer with 3 CO sensors was used. The sensors
were put in the exhausting duct, below the south side smoke curtain and in the smoke
filling cabin to measure CO concentration at different places.
A total of 19 tests were conducted with a 30cm×30cm square pool fire. The
experimental data have been shown in Table 1. Gasoline was used as the fuel. Heat
release rate of the pool fire is determined by the mass loss rate measured by an
electronic balance and the heat value of the gasoline which is taken to be 46000 kJ/kg.
Factor of the burning efficiency is 0.8 [9]. As a result, the average steady state heat
release rate in the experiments is 120 kW.
In the experiments, all devices were operated for measurement at the time of
ignition. Several seconds later, a thick black layer formed in the burning cabin and
then the smoke flowed into the smoke filling cabin. At about 22s after the ignition, the
smoke reached the center of the smoke filling cabin where a thermocouple tree was
located, and gradually filled the hood until the smoke spilled out from the shortest
curtain on the south side. At about 120s after ignition, the smoke flow reached a
relatively steady state under which the depth of smoke layer was monitored with the
gauges. In the tests with smoke exhausting, the mechanical fan was operated at 180s.
4. Results and Discussion
4.1 Experimental results
The experimental data, including the smoke layer temperature and CO
concentration in the exhaust duct, are presented ahead of smoke exhaust efficiency
discussion.
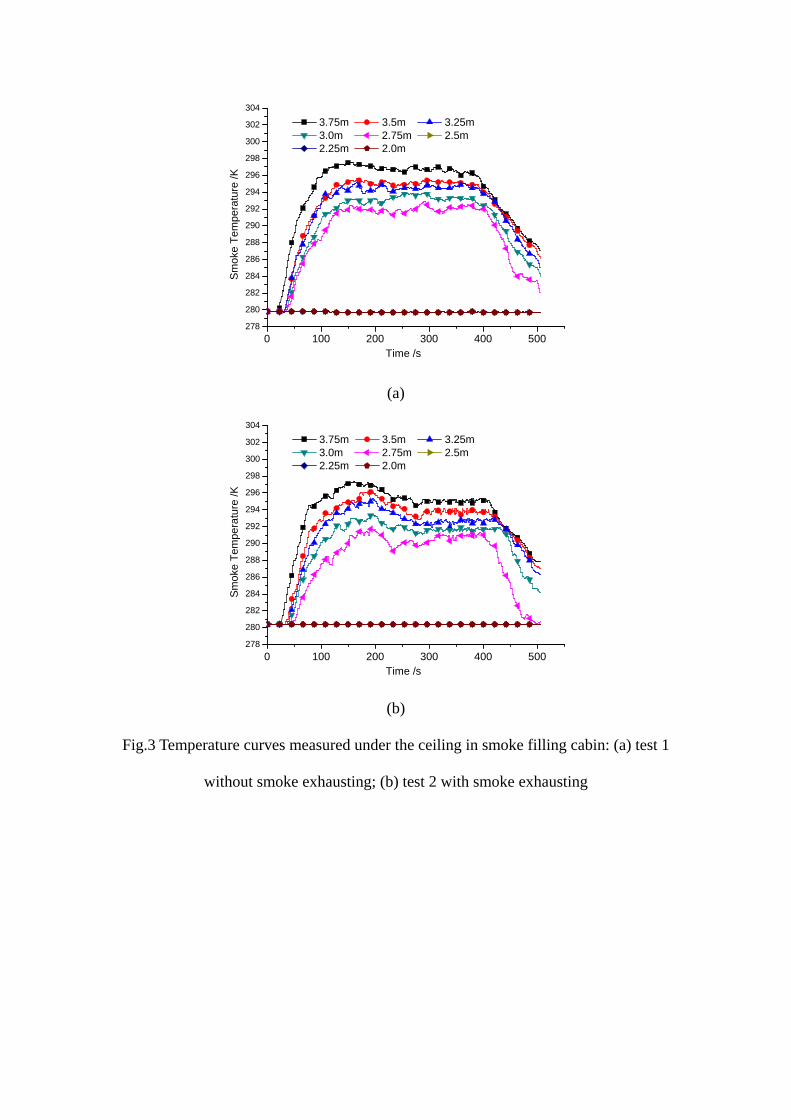
The temperatures measured in Test 1 and Test 2 are presented in Figure 3. The
recording interval for the thermocouples is 0.5s. The uncertainties for these
temperature measurements were estimated to be less than 1℃ [17]. It can be found in
Figure 3(a) that the temperature in the smoke filling cabin started to increase at about
22s, and remained a relatively steady state after 120s, The steady state lasted for 300s
in Test 1 which was running without smoke exhausting. In the tests with smoke
exhausting, the mechanical fan was operated at 180s. Then the smoke temperature
dropped at this moment and reached the other steady state at 270s as shown in Figure
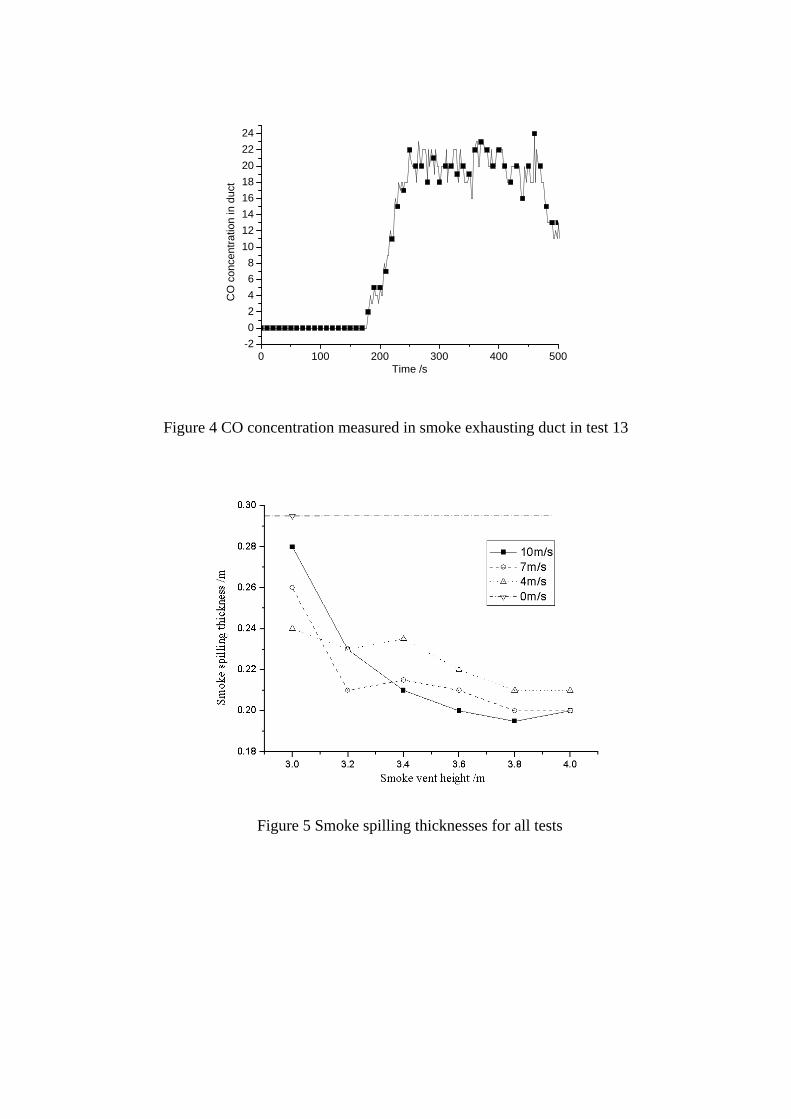
1(b). The fuel was running out at around 400s. The CO concentration measured in
smoke exhausting duct in one test is shown in Figure 4 in which a steady state phase
is found after 270s. The smoke temperature and the CO concentration were averaged
from the steady state and used in following sections.
4.2 Smoke spilling
The smoke started to spill out from the bottom edge of south smoke curtain after
the cabin was filled up. The thickness of the spilling smoke became stable when the
smoke temperature stabilized after 120s. The thickness is measured by the two gauges
and recorded every 10s. Then the time averaged value for the steady state was made
in all tests and plotted in Figure 5. Consequently, thickness of the smoke layer below
the vent is easily calculated by considering the smoke curtain height and the vent
height.
As shown in Figure 5, the smoke spilling thickness is 0.295m in Test 1 without
smoke exhausting, which is higher than the ones in the smoke exhausting tests. Under
certain exhausting velocity, the thickness of spilling smoke decreases as the vent
height increases. When the vent height increases from 3.0m to 3.2m for all three

exhausting velocities, the smoke spilling thickness has strongly decreased. However,
the vent height becomes less effective as it increases, which leads to the change of
spilling thicknesses becomes smaller and eventually tends to be zero. For instance,
under 10m/s exhausting velocity, the spilling thickness decreases 0.05m as the vent
height increases from 3.0m to 3.2m, but remains approximately constant when the
smoke vent moves up from 3.8m to 4.0m.
Under certain vent height, the change of smoke spilling thicknesses with different
exhausting velocities is more complicated. As the vent is relatively low, at the height
of 3.0m and 3.2m, the spilling smoke becomes thicker as the exhausting velocity
increases. However, when the smoke vent is relatively high, contrary results are found.
Actually, the different extents of disturbance of mechanical smoke exhausting on the
smoke-air interface, which causes different amount of fresh air exhausted directly and
indirectly, lead to different smoke exhaust efficiencies. At the tests with a lower vent,
the smoke layer below the vent is relatively thin so that a higher exhausting velocity
is much easier to cause more disturbances on the smoke-air interface. Therefore more
fresh air is entrained into smoke layer, which increases the smoke layer thickness. Part
of air entrainment ( aCm ) is exhausted while the rest of it stays in the smoke layer. On
the other hand, there is some fresh air exhausted directly by the vent due to the
plug-holing effect, which also reduces the exhausting efficiency. As a result, the
smaller exhausting process becomes more effective as the exhausting velocity
decreases. As the vent moves up, smoke layer below the vent becomes thicker so that
the disturbance of smoke exhausting is reduced. The plug-holing effect is then
avoided and therefore the air entrainment is reduced. Under this condition, more
smoke is exhausted as the exhausting velocity increases. As a result, thickness of the
spilling smoke decreases. As the vent height increases, the influence of smoke

exhausting on the smoke-air interface become less effective till ignorable since the
thick smoke layer prevents the fresh air being mixed in. Therefore, the smoke
exhausting efficiency becomes stable, which leads to the curves in Figure 5 tend to be
flat with increasing of vent height.
Based on smoke spilling thicknesses and velocities, the volumetric flow rates of
smoke spilling can be calculated, as shown in Figure 6, and thus the comparison of
the mechanical exhausting rate against the decrease of the volumetric spilling flow
rates is shown in Figure 7. As shown in Figure 6, for all exhausting velocities, the
volumetric flow rate of spilling smoke decreases as the velocities increase. Under
certain vent height, the volumetric flow rate decreases as the exhausting velocity
increases. In tests with vent height of 3.0m and 3.2m, even though the spilling smoke
with a higher exhausting velocity is thicker, the spilling velocity is lower.
Consequently, the volumetric flow rates of spilling smoke in tests with higher
exhausting velocities are less than those with lower velocities. For tests with 3.8m and
4.0m high vent, the volumetric flow rates of spilling smoke under the 10m/s
exhausting velocity are only half of those under 4m/s exhausting velocity, as shown in
Figure 6.
In theory, the decreases of spilling smoke flow should equal to the volumetric
smoke exhausting rate since the impact of the fresh air should not exist in an ideal
smoke exhausting process. One of our experiments objectives was to figure out the
conditions under which the smoke exhausting system was operating at maximum
efficiency. However, in terms of the experimental results, am always exists, more or
less. Therefore, even for Test 19 with highest vent and lowest exhausting velocity, the
decreasing volumetric flow rate of spilling smoke is still lower than volumetric
exhausting rate. Figure 7 indicates that the ratio of mechanical exhaust rate to the
decreasing volumetric flow rate of spilling smoke ranged from 1.4:1 to 3.6:1. And
with decreasing of the vent height, the ratio increases, indicating more fresh air
entrained into smoke.
4.3 CO concentration
The CO concentrations measured in the cabin and the exhaust duct is used to
provide further information on the fresh air entrainment, i.e. aCm . The average CO
concentration in smoke layer in Test 1 is 23ppm. The CO concentration averaged in
the exhausting duct in Test 2–19 are shown in Figure 8. For optimizing a smoke
exhausting process, the disturbance on the smoke-air interface by smoke exhausting
should be reduced to as little as possible. From this point of view, the CO
concentration measured in the duct should be comparable to 23ppm. In tests with vent
height of 3.6m-4m and a exhausting velocity of 4m/s, the CO concentration is 20ppm,
which is the maximum value got from the experiments. There is little fresh air being
entrained into the duct during these tests and the exhausted smoke is mainly from the
smoke layer in the cabin. For tests with higher exhausting velocity and thin smoke
layer below the vent, there is a significant decrease of CO concentration in the duct,
as shown in Figure 5, which indicates that the smoke was significantly diluted by air
entrained from the lower layer. In Test 2 with 3.0m high vent and 10m/s exhausting
velocity, the CO concentration eventually decreased to 11ppm due to the large amount
of fresh air exhausted into the duct, in other words, actually less than half of the
exhausting rate was used. These results are consistent with previous data. It can be
found in the figure that the maximum dilution multiple indicated from CO data is

approximately 2.09. It is also can be seen that under certain smoke exhausting
velocity, there is a transition zone for vent height. In tests with vent lower than the
transition zone, the smoke exhausting efficiency decreased significantly as shown in
Figure 5. Under 10m/s, 7m/s and 4m/s exhausting velocities, the transition zones are
3.4m-3.6m, 3.6m-3.8m and 3.6m-3.8m, respectively.
4.4 Comparison with Hinkley‘s model
As mentioned above, if the vent were located well above a critical height, the
vent height would have little impact on the exhausting efficiency. On the contrary, the
smoke exhausting efficiency decreases as the smoke vent moves downward.
According to the former studies [10-13], the plug-holing effect causes the significant
decrease of smoke exhausting efficiency, and in the natural venting systems, the
critical conditions of this effect is determined by Equation (1). However, Hinkley [11]
defines Equation (1) in terms of the smoke depth below the vents which has been
assumed to be located at the ceiling. In the following analysis, the smoke depth in
Equation (1) is replaced by the distance between the exhausting vent and the
smoke-air interface. Using Equation (1), the Froude numbers of all tests is obtained,
as shown in Figure 9, and the plug-holing effect is predicted. In the calculation, T
were taken as the average smoke temperature below the exhausting vent.
Comparing Figure 9 with Figure 8, it can be seen that the Froude numbers in the
tests with significantly low smoke exhausting efficiency, i.e. under the transition zone
in Figure 8, are all greater than the critical value for determining the onset of
plug-holing, 1.1. And, the Froude numbers in tests with relatively higher smoke
exhausting efficiency are all less than 1.1. There is a good agreement between model
prediction and the experimental results. The model could be used as a design guide

for engineers dealing with the plug-holing effect in a smoke management system.
However, it should be pointed out that the Hinkley‘s equation can only be used to
predict the significant decrease of smoke exhausting efficiency, and can’t account for
the influence of disturbances at the smoke layer interface on the smoke exhausting
effect.
As shown in Figure 7, the Hinkley‘s model is not enough for mechanical smoke
exhausting system design. The tests without the plug-holing (Test 13-19) are
discussed to evaluate the influence of the fresh air entrained due to the mixture with
smoke layer on the smoke exhausting efficiency. In these tests, pm equals to zero as
there is not plug-holing effect. In terms of Equation (2) and Figure 7, the volumetric
flow rates of the entrained fresh air due to the mixture with smoke layer, am , is
calculated. Meanwhile, the proportion of the entrained air, which is exhausted by the
smoke vent, is determined by comparing the CO concentration in Figure 8 to the
original value of 23ppm which has been measured in test 1. Therefore, a value of C is
acquired by comparing the exhausted proportion with the amount of entrained air. As
shown in Figure 3(a), the highest average temperature of smoke layer is calculated to
be 294 K. Based on which, a ratio of the ambient temperature over the smoke
temperature is calculated to be 95% which means the smoke temperature is very close
to the ambient temperature. As a result, the density difference between the smoke and
the fresh air, which actually leads to a variation of smoke volume, is ignored in the
calculation. The results are shown in Table 2. It can be seen that about half of the
fresh air entrained was exhausted by the mechanical fan and the rest stayed in the
smoke layer and kept spreading along. The fresh air exhausted is calculated up to 48%
(in Test 14) of the mechanical exhausting rate. Therefore, in order to achieve an
excellent smoke exhausting effect, the amount of fresh air entrained due to smoke

exhausting, ma, should be reduced to as less as possible.
5 Conclusions
In this study, a set of burning experiments was conducted to investigate the effect
of smoke vent height and exhausting velocity on mechanical smoke exhausting
efficiency. A high smoke vent as well as a low exhausting velocity can prevent the
plug-holing effect and reduce the disturbance acted on the smoke layer interface,
which eventually lead to an efficient smoke exhausting process. On the other hand, a
low smoke vent with a large exhausting velocity causes an inefficient smoke
exhausting process. Under certain exhausting velocity, there was a critical vent height
under which the smoke exhaust efficiency strongly decreases as the vent height
decreases. On the contrary, the exhausting efficiency won’t change much as the vent
height increases, which has been considered as the maximum efficiency under this
velocity. A Froude number, proposed by Hinkley to predict the plug-holing effect in
natural venting systems, is validated. The critical Froude number for plug-holing
effect predicted by Hinkley’s model agrees well with the experimental results, which
indicates that Hinkley’s model can be used as a basis criterion for designing the
mechanical smoke exhausting system.
Future work will focus on fire sources with higher heat release rate and the
accurate determination of related parameters. A lot more experiments will be
conducted to investigate the mechanism of the air entrainment process.

ACKNOWLEDGEMENT
This work was supported by Natural Science Foundation of China (NSFC) under
Grant No. 50904055. Kai-Yuan Li is currently the Arup Fire Post-doctorate Fellow at
the University of Canterbury.
Nomenclature
A area of the smoke vent (m2)
C1 coefficient
d thickness of smoke layer (m)
F Froude number
g is the gravity acceleration (m/s2)
am mass flow rate of entrained fresh air due to the mixture with smoke layer (kgs-1)
em smoke exhausting rate (kgs-1)
fm mass flow rate of fire plume (kgs-1)
sm mass flow rate of smoke proportion of the exhausting rate (kgs-1)
pm mass flow rate of exhausted fresh air drawn directly from the lower layer (kgs-1)
T average temperature rise of the smoke layer (K)
0T ambient temperature (K)
eu flow velocity (m/s)

References
[1] J. Hietaniemi, R. Kallonen, E. Mikkola, Burning Characteristics of Selected
Substances: Production of Heat, Smoke and Chemical Species, Fire Mater., 23(1999)
171–185.
[2] V. Babrauskas, R.G. Gann, B.C. Levin, M. Paabo, R.H. Harris, R.D. Peacock, S.
Yasa, A Methodology for Obtaining and Using Toxic Potency Data for Fire Hazard
Analysis, Fire Saf. J., 31(1998) 345–58.
[3] R. Besserre, P. Delort, Recent Studies Prove that the Main Cause Of Death During
Urban Fires is Poisoning by Smoke, Urgence Medicales, 16(1997) 77–80.
[4] The Ministry of Construction P.R.China, Code for Design of Subway (GB 50157),
2003 edition.
[5] The Ministry of Public Security of P.R.China, Code for Fire Protection Design of
Buildings (GBJ 16-87), 2001 edition.
[6] The Ministry of Public Security of P.R.China, Code for Fire Protection Design of
Tall Buildings (GB50045-95), 2001 edition.
[7] The Ministry of Public Security of P.R.China, Code for Fire Protection Design of
Civil Air Defence Works, 2001 edition.
[8] C.L. Shi, Y.Z. Li, R. Huo, Modeling and Experimental Studies on Mechanical
Exhaust Efficiency in Compartment Fire, Combust. Sci. Technol., 9(2003) 546-550.
[9] L. Yi, Study on Smoke Movement and Management in Atrium Building. PhD
dissertation, University of Science and Technology of China, Hefei, Anhui, China,
2005.
[10] G.D. Lougheed, G.V. Hadjisophocleous, The Smoke Hazard from a Fire in High
Spaces, ASHRAE Trans., 107(2001) 34–38.
[11] L.Y. Cooper, Smoke and heat venting, Chapter 3-9. SFPE Handbook of Fire

Protection Engineering (3rd ed.), Society of Fire Protection Engineers and National
Fire Protection Association, Boston, MA, USA, 2002.
[12] O. Vauquelin, Experimental Simulations of Fire-Induced Smoke Control in
Tunnels Using an “Air–Helium Reduced Scale Model”: Principle, Limitations,
Results and Future, Tunn. Undergr. Sp. Tech., 23 (2008) 171-178.
[13] H.P. Morgan, J.P. Gardiner, Design Principles for Smoke Ventilation in Enclosed
Shopping Centres, BR186, Building Research Establishment, Garston, U.K, 1990.
[14] B.J. McCaffrey, Momentum Implications for Buoyant Diffusion Flames.
Combust. Flame, 52(1983) 149-167.
[15] G. Heskestad, Engineering Relations for Fire Plumes, Fire Saf. J., 7(1984) 25-32.
[16] E. E. Zukoski, T. Kubota, B. Cegeten, Entrainment in Fire Plumes. Fire Saf. J.,
3(1980) 107-121.
[17] L.H. Hu, Y.Z. Li, R. Huo, L. Yi, W.K. Chow, Full-scale experimental studies on
mechanical smoke exhaust efficiency in an underground corridor, Build. Environ.,
41(2006) 1622-1630.

Table 1 Summary of tests
Test No. HRR
(kW)
Ambient
temperature (K)
Vent height
(m)
Vent velocity
(m/s)
Volume rate of
smoke exhaust (m3/s)
1 120 279.8 3 0 0
2 120 280.3 3 10 0.9
3 120 279.8 3 7 0.63
4 120 279.8 3 4 0.36
5 120 279.5 3.2 10 0.9
6 120 279.8 3.2 7 0.63
7 120 279.5 3.2 4 0.36
8 120 279.5 3.4 10 0.9
9 120 279.5 3.4 7 0.63
10 120 280 3.4 4 0.36
11 120 280 3.6 10 0.9
12 120 280 3.6 7 0.63
13 120 280 3.6 4 0.36
14 120 280.3 3.8 10 0.9
15 120 280 3.8 7 0.63
16 120 280.5 3.8 4 0.36
17 120 280 4.0 10 0.9
18 120 281 4.0 7 0.63
19 120 280.4 4.0 4 0.36
Table 2 Volume rate of entrained fresh air and C
Test
No.
Vent height
(m)
Vent velocity
(m/s)
Volume rate of
smoke exhaust (m3/s)
Volume rate of entrained fresh air(m3/s)
C
13 3.6 4 0.36 0.12 0.6
14 3.8 10 0.9 0.43 0.46
15 3.8 7 0.63 0.2 0.55
16 3.8 4 0.36 0.13 0.57
17 4.0 10 0.9 0.42 0.47
18 4.0 7 0.63 0.21 0.52
19 4.0 4 0.36 0.11 0.64

Fig.1 Flow field below exhaust vent
Figure 2 Schematic view of experimental apparatus
sm
am
(a)
em
(b)
em
sm
am
pm
fm fm
2m
4m 4.2m
4.2m 4m
2m
2.7m
3m
CO sensor
Gauges
smoke filling cabin Burning cabin
North
Velocity probe
Thermocouple tree
CO sensor
Vent
0 100 200 300 400 500278
280
282
284
286
288
290
292
294
296
298
300
302
304
Sm
oke
Tem
pera
ture
/K
Time /s
3.75m 3.5m 3.25m 3.0m 2.75m 2.5m 2.25m 2.0m
(a)
0 100 200 300 400 500278
280
282
284
286
288
290
292
294
296
298
300
302
304
Sm
oke
Tem
pera
ture
/K
Time /s
3.75m 3.5m 3.25m 3.0m 2.75m 2.5m 2.25m 2.0m
(b)
Fig.3 Temperature curves measured under the ceiling in smoke filling cabin: (a) test 1
without smoke exhausting; (b) test 2 with smoke exhausting
0 100 200 300 400 500-2
0
2
4
6
8
10
12
14
16
18
20
22
24
CO
con
cent
ratio
n in
duc
t
Time /s
Figure 4 CO concentration measured in smoke exhausting duct in test 13
Figure 5 Smoke spilling thicknesses for all tests

Figure 6 Volumetric flow rates of smoke spilling for all tests
Figure 7 Mechanical exhaust rates vs. decreased volumetric flow rates of smoke
spilling for all tests

Figure 8 CO concentration in exhaust duct in test 2-19
Figure 9 Comparison between Hinkley’s model and experimental results


![Simplex, MA [M] - NFPA · PDF filemaintenance of systems for the control, removal, or venting of heat or smoke from fires in buildings. ... An engineered, mechanical smoke exhaust](https://img.pdfslide.net/doc/110x75/5aac9e047f8b9aa9488d3a4f/simplex-ma-m-nfpa-of-systems-for-the-control-removal-or-venting-of-heat-or.jpg)