Embed Size (px)
Citation preview

Experimental Performance Evaluation of
TCP/IPv6 over IEEE 802.15.4 Wireless
Sensor Networks
by
Diandi Zhu
Thesis submitted to the
Faculty of Graduate and Postdoctoral Studies
In partial fulfillment of the requirements
For Master of Applied Science degree in
Electrical and Computer Engineering
School of Electrical Engineering and Computer Science
Faculty of Engineering
University of Ottawa
© Diandi Zhu, Ottawa, Canada, 2016.

Abstract
In order to implement wireless sensing and monitoring services at large scale, Internet
connection is highly desirable. Particularly, TCP is indispensable for end-to-end connection
orientated communication. It is well known that low power and low rate IEEE802.15.4 based
Wireless Sensor Networks (WSNs) are vulnerable to the interference from collocated Wireless
Local Area Networks (WLAN) utilizing the same un-licensed 2.4GHz frequency band. Such
coexistence interference seriously deteriorates the performance of TCP/IPv6 over WSN, resulting
in packet losses, disconnections, reduced throughput and so on. This thesis focuses on
experimental research on the performance evaluation and improvement of TCP/IPv6 over IEEE
802.15.4 based WSN. In this research, a versatile testbed has been developed and implemented,
which consists of off-the-selves and custom built hardware, open source and in-house developed
firmware and software. A periodical monitoring/sensing application that uses TCP to transmit data
over WSN has been developed and used for performance evaluation when there is various Wi-Fi
interference close by. Based on the observations and analysis of our experimental results, several
important parameters that impact the TCP packet transmission performance have been identified.
Performance improvement technique is proposed to effectively adjust these parameters so as to
support periodic monitoring/sensing application with substantial better performance. Extensive
experiments have been performed in the testbed to evaluate the performance of WSN packets
transmission via TCP over WSN when subjected to different Wi-Fi interference.
ii

Acknowledgement
I would like to express my deepest appreciation to my supervisor Prof. Hussein T. Mouftah
of his kindness, generosity, and patience. During the process of finishing my research project, I
have received a lot of guidance and advice from him, and he is always willing to offer help
whenever needed.
Also, I would like to thank Dr. Zhipeng Wang for his supervision, creative ideas and
outstanding professional work to help me with my research and thesis. He has provided me
numerous suggestions and helps in all the time of research and writing of this thesis.
I also thank my friends and colleagues in our research group for their encouragement and
their will to assist whenever I needed assistance.
Last but not least, I owe to express my special gratitude to my parents whose support and
love always gave me courage to face any challenges in my life.
iii

List of Acronyms
6LoWPAN IPv6 over Low power Wireless Personal Area Networks
ACK Acknowledgement
ACL Access Control List
ADAPT ADaptive Access Parameters Tuning
AODV Ad hoc On Demand Distance Vector
AP Access Point
AR Acknowledgement Request
ASIC Application Specific Integrated Circuit
A/D Analog to Digital
BE Backoff Exponent
BER Bit Error Rate
BLE Bluetooth Low Energy
BSS Basic Service Set
CAP Contention Access Period
CCA Clear Channel Assessment
CCAP Clear Channel Assessment Period
CCBM Channel Change Broadcast Message
CCK Complementary Code Keying
CFP Contention Free Period
CoAP Constrained Application Protocol
CPR Constant Packet Rate
iv

CRC Cyclic Redundancy Check
CS Carrier Sense
CSI Channel State Information
CSMA-CA Carrier Sense Multiple Access/Collision Avoidance
CTS Clear–To–Send
DCF Distributed Coordination Function
DIFS DCF Inter Frame Space
DNS Domain Name System
DSN Data Sequence Number
DSSS Direct Sequence Spread Spectrum
DTSN Distributed Transport for Sensor Network
D/A Digital to Analog
D-ITG Distributed Internet Traffic Generator
EAP Extensible Authentication Protocol
ED Energy Detection
EDCA Enhanced Distributed Channel Access
ER Edge Router
EIRP Equivalent Isotropically Radiated Power
EL Estimation of Length
EN External Node
ESS Extended Service Set
FCS Frame Check Sequence
FCC Federal Communication Commission
v

FFD Full-Function Device
FHSS Frequency Hopping Spread Spectrum
FTP File Transfer Protocol
GFSK Gaussian Frequency Shift Keying
GTS Guaranteed Time Slots
HART Wireless Highway Addressable Remote Transducer
HCCA HCF Controlled Channel Access
HCF Hybrid Coordination Function
HLIM Hop Limit
IAACCA Interference Aware Adaptive Clear Channel Assessment
IBSS Independent Basic Service Set
IDT Inter-Departure Time
IEEE Institute of Electrical and Electronics Engineers
IFS Inter–Frame Space
IO Input/Output
IoT Internet of Things
IP Internet Protocol
IPC Inter-Process Communication
IPT Inter-Packet Time
IPv4 Internet Protocol version 4
IPv6 Internet Protocol version 6
IR Infrared
ISA International Society of Automation
vi

ISM Industrial, Scientific, and Medical
LQI Link Quality Indication
LQE Link Quality Estimators
LTE Long Term Evolution
LwIP Lightweight IP
MAC Media Access Control
MCU Microcontroller Unit
MEMS Micro-Electro-Mechanical Systems
MIMO Multiple Input Multiple Output
MPDU MAC Protocol Data Unit
MTU Maximum Transmission Unit
NACK Negative Acknowledgement
NAT Network Address Translation
NDP Neighbor Discovery Protocol
NH Next Header
OFDM Orthogonal Frequency Division Multiplexing
OSI Open System Interconnection
PAN Personal Area Network
PCF Point Coordination Function
PCR Packet Collision Rate
PDR Packet Dropping Rate
PER Packet Error Rate
PHY Physical Layer
vii

PIFS PCF Inter Frame Space
PLR Packet Loss Rate
PPDU PHY Protocol Data Unit
PSDU PHY Service Data Unit
QoS Quality of Service
RF Radio Frequency
RFD Reduced-Function Device
RIPDS Reliable IPv6 Packet Delivery Scheme
RNACK Repair Negative Acknowledgment
RPL Routing Protocol for Low power and Lossy Networks
RTC Real-Time Clock
RTO Retransmission Timeout
RTS Request-To-Sent
RTT Round-Trip Time
RSSI Receiver Signal Strength Indicator
SCM Spatial Channel Model
SFFR Simple Frame Forwarding and Recovery
SIFS Short Inter Frame Space
SINR Signal-to-Interference-Plus-Noise Ratio
SNMP Simple Network Management Protocol
SS Spectrum Sensing
SYN Synchronise Packet in Transmission Control Protocol (TCP)
TCP Transmission Control Protocol
viii

TDMA Time Division Multiple Access
TN Terminal Node
TSCH Time-Slotted Channel Hopping
uIP Micro IP
UDP User Datagram Protocol
WBAN Wireless Body Area Network
WEP Wireless Equivalent Privacy
WiMAX Worldwide Interoperability for Microwave Access
WLAN Wireless Local Area Network
WMSN Wireless Multimedia Sensor Network
WPA Wireless Protected Access
WPAN Wireless Personal Area Network
WR Wireless Router
WSN Wireless Sensor Network
WSSN Wireless Smart Sensor Network
ZC ZigBee Coordinator
ZED ZigBee End Device
ZR ZigBee Router
ix

Table of Content
Abstract ........................................................................................................................................... ii
Acknowledgement ......................................................................................................................... iii
List of Acronyms ........................................................................................................................... iv
Table of Content ............................................................................................................................. x
List of Figures .............................................................................................................................. xiii
Chapter 1 Introduction ............................................................................................................... 1
1.1 Overview of Wireless Sensor Networks .......................................................................... 1
1.2 TCP/IPv6 over WSN ........................................................................................................ 2
1.3 Thesis Motivation ............................................................................................................. 3
1.4 Thesis Objectives ............................................................................................................. 5
1.5 Thesis Contributions ........................................................................................................ 5
1.6 Thesis Outline .................................................................................................................. 6
Chapter 2 Related Work on Coexistence Issues and TCP/IPv6 over WSN Techniques ........... 7
2.1 Study of Coexistence Issues between ZigBee/IEEE 802.15.4 WSNs and IEEE
802.11b/g/n WLANs ................................................................................................................... 8
2.1.1 IEEE 802.15.4 WSN and IEEE 802.11b/g/n WLAN Coexistence Issues ................ 8
2.1.2 Experimental and Simulative Study of Coexistence Issues ...................................... 8
2.2 Research Works on TCP/IPv6 over WSN...................................................................... 13
x

2.2.1 Introduction of 6LoWPAN ..................................................................................... 13
2.2.2 Related Research Works ......................................................................................... 15
2.3 Mechanisms for Interference Mitigation ........................................................................ 22
2.3.1 CCA/MAC Parameter Adjustment Mechanisms .................................................... 22
2.3.2 Frequency Agility Mechanisms .............................................................................. 26
2.3.3 Collaborative Coexistence Mechanisms ................................................................. 30
Chapter 3 Design and Development of TCP/IP over WSN Testbed ....................................... 33
3.1 Testbed Hardware .......................................................................................................... 33
3.2 Testbed Software ............................................................................................................ 42
3.3 Testbed Setup ................................................................................................................. 50
Chapter 4 Implementation and Optimization of High Packet Rate Periodic Monitoring Program
using TCP over IEEE 802.15.4 WSN ........................................................................................... 60
4.1 Implementation of Periodic Monitoring Application using TCP over IEEE 802.15.4 WSN
60
4.2 Optimization of the Periodic Monitoring Application using TCP over IEEE 802.15.4
WSN 67
4.3 Experimental Results...................................................................................................... 71
Chapter 5 Conclusions and Future Work ...................................................................................... 85
5.1 Concluding Remarks ...................................................................................................... 85
5.2 Future Work ................................................................................................................... 86
xi

References ..................................................................................................................................... 88
Appendix A Confidence Interval for the Mean .......................................................................... 105
Appendix B Existing WSN Embedded Operating Systems ....................................................... 106
Appendix C Wireless Sensor Networks Standards ..................................................................... 108
Appendix D Applications of Wireless Sensor Networks ............................................................ 111
3.1.2 Health monitoring ................................................................................................. 111
3.1.3 Smart grid.............................................................................................................. 112
3.1.4 Environment safety alert/monitoring .................................................................... 112
xii

List of Figures Figure 2.1 A typical testbed setup [50]. .......................................................................................... 9
Figure 2.2 Nodes distribution [50]. ............................................................................................... 18
Figure 2.3 End-to-end simple fragment forwarding and recovery [66]. ....................................... 19
Figure 2.4 6LoWPAN gateway architecture [67]. ........................................................................ 20
Figure 2.5 NACK-based repair mechanism [53]. ......................................................................... 21
Figure 2.6 Flowchart of: (a) interference detection and (b) interference avoidance [91]. ............ 30
Figure 3.1 General components of a wireless sensor node [7]. .................................................... 35
Figure 3.2 Architecture of the developed IEEE 802.15.4 sensor motes. ...................................... 36
Figure 3.3 Schematic circuit of power supply module. ................................................................ 38
Figure 3.4 Schematic circuit of USB to UART module. .............................................................. 39
Figure 3.5 Schematic circuit of MCU module. ............................................................................. 40
Figure 3.6 Schematic circuit of transceiver module. .................................................................... 41
Figure 3.7 Function diagram of the TCP client and server programs. .......................................... 49
Figure 3.8 Testbed setup for studying the performance of TCP/IPv6 over IEEE 802.15.4 WSN
under collocated Wi-Fi interference. ............................................................................................ 51
Figure 3.9 Bandwidth allocation of WLAN and IEEE 802.15.4 WSN at 2.4 GHz band. ............ 52
Figure 3.10 SYN message from client mote to server mote for establishing TCP connection. ... 53
Figure 3.11 SYN ACK message from server mote to client mote. ............................................... 54
Figure 3.12 Client mote sends an ACK to acknowledge SYN ACK message from server mote. 54
Figure 3.13 Data message packet. ................................................................................................. 58
Figure 3.14 Data message 6LoWPAN header. ............................................................................. 59
Figure 4.1 Process of TCP connection establishment. .................................................................. 61
xiii

Figure 4.2 Flowchart of TCP client program. ............................................................................... 63
Figure 4.3 Packet encapsulation process. ..................................................................................... 64
Figure 4.4 Flowchart of TCP server program. .............................................................................. 66
Figure 4.5 Process of termination and reconnection of a TCP connection. .................................. 70
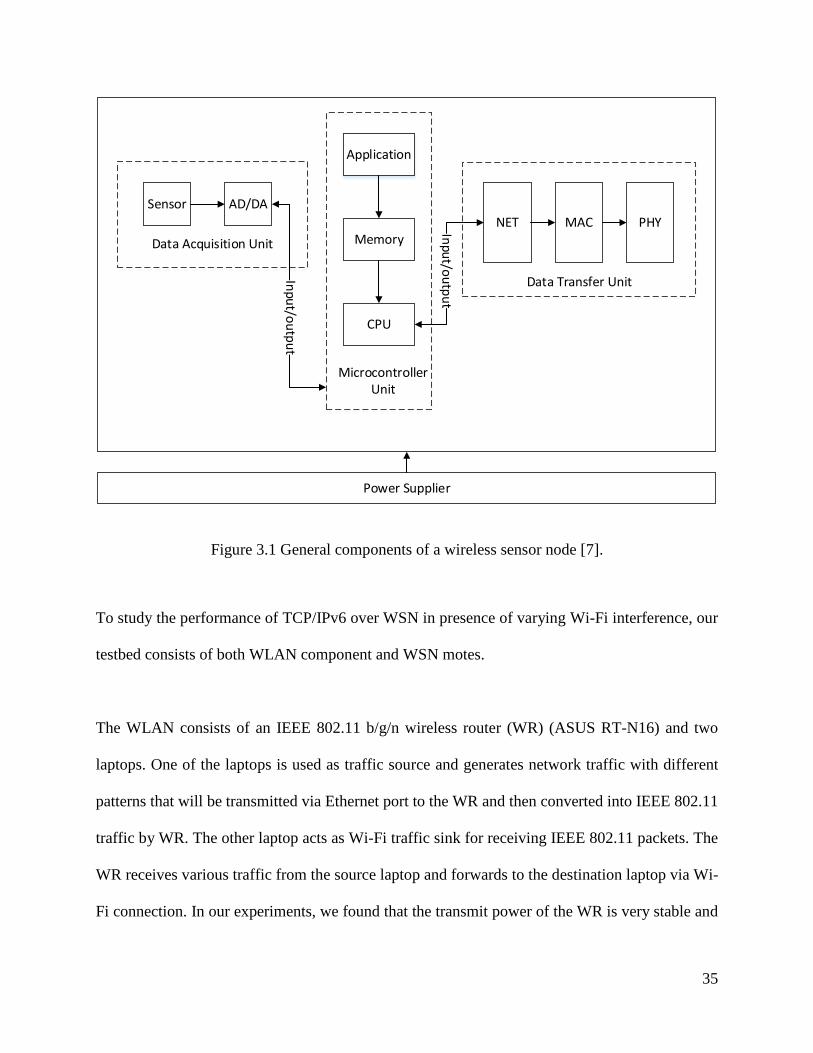
Figure 4.6 Interruption scenarios of termination and reconnection of a TCP connection. ........... 71
Figure 4.7 WSNs performance in terms of PLR under interfering traffic with different packet rates.
....................................................................................................................................................... 74
Figure 4.8 WSNs performance in terms of reconnections under interfering traffic with different
packet rates.................................................................................................................................... 75
Figure 4.9 WSNs performance in terms of total transmission time under interfering traffic with
different packet rates. .................................................................................................................... 75
Figure 4.10 WSNs performance in terms of throughput under interfering traffic with different
packet rates.................................................................................................................................... 76
Figure 4.11 WSNs performance in terms of PLR under interfering traffic with different packet
payload sizes. ................................................................................................................................ 77
Figure 4.12 WSNs performance in terms of reconnections under interfering traffic with different
packet payload sizes. ..................................................................................................................... 78
Figure 4.13 WSNs performance in terms of total transmission time under interfering traffic with
different packet payload sizes. ...................................................................................................... 78
Figure 4.14 WSNs performance in terms of throughput under interfering traffic with different
packet payload sizes. ..................................................................................................................... 79
Figure 4.15 WSNs performance in terms of PLR under interfering traffic with packet arrival rates
following four different random distributions. ............................................................................. 80
xiv

Figure 4.16 WSNs performance in terms of reconnections under interfering traffic with packet
arrival rates following four different random distributions .......................................................... 80
Figure 4.17 WSNs performance in terms of total time under interfering traffic with packet arrival
rates following four different random distributions. ..................................................................... 81
Figure 4.18 WSNs performance in terms of throughput under interfering traffic with packet arrival
rates following four different random distributions. ..................................................................... 81
Figure 4.19 WSNs performance in terms of PLR under interfering UDP traffic with payload sizes
following four different random distributions. ............................................................................. 82
Figure 4.20 WSNs performance in terms of reconnections under interfering UDP traffic with
payload sizes following four different random distributions. ....................................................... 83
Figure 4.21 WSNs performance in terms of total time under interfering UDP traffic with payload
sizes following four different random distributions...................................................................... 83
Figure 4.22 WSNs performance in terms of average throughput under interfering UDP traffic with
payload sizes following four different random distributions. ....................................................... 84
xv

Chapter 1 Introduction
1.1 Overview of Wireless Sensor Networks
With the needs of deploying a large number of senor nodes, monitoring or collecting physical and
environmental information, and sending measured data through a network to a base station or cloud
server surfacing, Wireless Sensor Network (WSN) is gaining increasing attention from both
industry and academia. Wireless Sensor Network consists of a large number of wireless sensor
devices that are small in size, low cost, with low power consumption and longer lifespan. The three
key features of WSN are Sensing, Processing, and Communications. WSN has been widely used
in smart environment/metering, security/emergency, retail, eHealth and home automation.
Although WSN enables unprecedented possibilities in various areas of applications, due to the
limitation of hardware and low cost, the WSN faces many new challenges such as integration of
Internet and WSN, wireless connectivity, energy efficiency and security. However, with the
development of embedded system, large scale integration circuit and radio technology, the price,
complexity, energy consumption and size of WSN devices are decreasing while the performance
and functions are getting better and better [1-5]. Comparing to traditional wireless networks such
as cellular networks and Wi-Fi wireless local area networks, Wireless Sensor Networks have the
following distinct characteristics [4] [7-8]: Large scale deployment [101-102], Self-healing [103],
Application-oriented, Dynamic and Self-organization [104].
1
1.2 TCP/IPv6 over WSN
WSN has many applications which need to pass data and information back and forth in between
peer nodes, end user and other terminals. Thus the communication between sensor networks and
other networks is getting more and more important. The de-facto networking standard protocol
suite is TCP/IP. Running TCP/IP on sensor nodes enables them to easily communicate from any
other TCP/IP compatible device with any single node [31-33] [132]. The Internet Protocol (IP) is
network layer protocol and is responsible for addressing hosts and for routing datagrams (packets)
from a source host to a destination host across one or more IP networks. IP only provides best
effort delivery and its service is characterized as connectionless and unreliable. All error conditions
in the network must be detected and compensated by the end nodes of a transmission. The upper
layer protocols (e.g. TCP) of the Internet protocol suite are responsible for resolving reliability
issues. TCP is a connection oriented and reliable protocol [35] which can provide reliable
connection. IPv6 address is 128-bit which supports a total of approximately 3.4×1038 addresses.
This huge amount of addresses makes it possible for WSN to operate without Network Address
Translation (NAT). In addition, the Autoconf and ICMPv6, included in IPv6, are useful to perform
network management in WSN after implementation, such as to route packets through each nodes
on the best path. The Anycast address mode of IPv6 suite is capable of increasing fault tolerance
in WSN. Grouping nodes with same characteristics and functions in similar address range can also
be efficiently achieved by using Anycast addressing. Utilizing IPv6, many useful WSN
mechanisms, such as sampled listening, collection routing, hop-by-hop feedback, and trickle-based
dissemination, can be easily achieved [37].
2

1.3 Thesis Motivation
As discussed in section 1.2, it is meaningful to implement TCP/IP over IEEE 802.15.4 based WSN.
The benefits of connecting both WSN and other Internet is beyond remote access. By using IPv6
128-bit address, it is possible for WSN to operate without NAT. And the TCP protocol provides
link reliability between two nodes/ends. However, due to the many limitations of WSN hardware
and their characteristics, WSN faces more challenges than traditional wireless networks (e.g. Wi-
Fi and Cellular networks) [3-5], such as Wireless connectivity [19], The integration of Internet and
WSN [5] [20-24], Energy efficiency [25-27] and Security [28-30]. It is well known that the low
power, low rate WSN is vulnerable for interference generated from collocated wireless devices
that are operating at the overlapping ISM band [45-47]. Particularly, Wi-Fi is now being deployed
almost everywhere (e.g. libraries, hospitals, schools, offices, restaurants, and homes), and mobile
devices (e.g. smart phones and tablets) with Wi-Fi adapter built in are becoming more and more
popular. One of the very common applications on these mobile devices are multimedia streaming.
This kind of applications involves a high volume of wireless traffic which makes the interference
even worse. WSN under Wi-Fi interference can have problems such as packet loss, disconnections,
delay, reduced throughput, etc. Therefore, it is essential to study the performance of TCP/IP over
WSN when there is interference from the collocated Wi-Fi network. In addition, one of the most
common application scenarios of WSN is periodic sensing/monitoring such as vital sign
monitoring, forest fire alarm, industrial processing control, and indoor/outdoor environment
monitoring. All these applications need sensing information to be constantly updated to
users/operators. For example, if the WSN nodes are deployed in forest, the sensor nodes can update
the ambient temperature periodically to the sink nodes, and sink nodes pass this information to end
3

users. If the temperature passes over a certain threshold, end users can know there might be a fire
alarm near the particular sensor node. Obviously, it is very beneficial and convenient if the WSN
can be seamlessly connected to Internet so that the sensed/measured data can be accessed by any
authorized devices that have Internet connection. Some of these sensing/monitoring applications
require fairly high throughput to provide near real time monitoring. For example, ECG signal
needs at least 12-bit accuracy with 250 Hz sample rate (3000 bytes per second) for only one
channel (electronode). Such monitoring applications require more reliable transmissions and
support of higher throughput, which is quite challenging when WSN is suffering coexistent
interference.
In the recent past, there are quite some researches on coexistence interference (e.g. [50 - 59]), and
TCP/IP over WSN (e.g. [60]- 68]). However, some of them (e.g. [66] and [68]) rely on simulations
or theoretic work that are not realistic and might miss or oversee some hidden factors that can
impact the performance; some (e.g. [50 - 59]) didn’t consider TCP; others (e.g. [60], [62], [67] and
[68]) only focused on TCP/IP over WSN implementations and optimizations without thoroughly
considering the collocated interference.
Motivated by these observations, in this thesis, we focus on experimentally evaluating the
performance of using TCP/IP over WSN for the periodic monitoring application under interference
from coexisting Wi-Fi devices, and design performance improvement techniques.
4

1.4 Thesis Objectives
We set the following objectives for this thesis research based on the discussions and motivations
presented in the previous sections.
• Establish a testbed using both off-the-selves and custom built hardware, open source
software and programs developed by ourselves for studying TCP/IP over WSN under
interference generated from collocated Wi-Fi devices.
• Implement a periodic monitoring/sensing application that uses TCP to transmit data
over WSN, which will also be used for performance evaluation.
• Perform extensive experiments to evaluate the performance of periodic monitoring
application when there is various Wi-Fi interference close by.
• Analyze the performance evaluation results to understand the various factors that
degrade the transmission of sensor data.
• Propose and implement effective techniques to improve the performance of TCP/IP
over WSN when subjected to Wi-Fi interference, and carry out extensive performance
evaluation experiments to validate the proposed techniques.
1.5 Thesis Contributions
Our experimental research on TCP/IP over WSN when subjected to various Wi-Fi interference has
achieved several contributions which are summarized as follows:
1. We established a versatile testbed for conducting experimental research on TCP/IP over
WSN under Wi-Fi interference.
5

2. In the testbed, we developed custom software that runs on the prototype WSN boards and
offers a wide range of functionalities such as configurations of various MAC/IP/TCP layer
parameters, WSN packet generation, packet statistics, and our proposed performance
improvement techniques.
3. We developed periodic monitoring application that transmits the data packets generated
periodically at the source node to the sink node via TCP.
4. We modified and improved TCP functions such as connection/reconnection, a variety of
timers and buffers to support periodic monitoring application with substantial better
performance.
5. We performed extensive experiments to evaluate the performance of WSN packets
transmission via TCP over WSN when subjected to different Wi-Fi interference.
1.6 Thesis Outline
The remaining chapters of this thesis are organized as follows: Chapter 2 gives a literature review
of the state of the art technology related to our research. Chapter 3 elaborates the design and
development of our testbed, the test environment, as well as our observation and analysis of the
TCP over WSN traffic for validating the testbed functionality. Chapter 4 presents the developed
periodic monitoring application using TCP over IEEE 802.15.4 WSN and optimization techniques,
then evaluates the performance of WSN packet transmission via TCP over WSN when subjected
to different Wi-Fi interference. Finally, the thesis is concluded and the future work is proposed in
Chapter 5.
6

Chapter 2 Related Work on Coexistence Issues and TCP/IPv6
over WSN Techniques Wireless communication network is growing in popularity and becomes more widespread with the
passing of time, due to its convenience of no wire and low cost. The IEEE 802.15.4 gradually gains
support and becomes the choice of WSN technology. IEEE 802.15.4 works at the 2.4 GHz ISM
band which is overlapped with the frequency band of the widely deployed Wi-Fi technology. IEEE
802.15.4 WSN is a low rate and low power network, it more tends to suffer from interference than
other high power wireless devices working in the overlapping frequency band. Therefore,
coexistence issues should be well considered when deploying different types of network in the
same area. The performance degradation in coexisting networks has been studied by researchers
for improving the current network standards and providing guidelines to design future standards.
Moreover, most WSNs appear in the form of large quantity of nodes. And TCP/IPv6 provides
convenient features to manage/control large amount of nodes while providing reliable connection
under environment with interference.
In this Chapter, a comprehensive literature review is presented regarding the coexistence issues
between IEEE 802.15.4 WSN and IEEE 802.11b/g/n WLAN, some important interference
mitigation techniques, and recent research work on IPv6 over WSN.
7

2.1 Study of Coexistence Issues between ZigBee/IEEE 802.15.4 WSNs and
IEEE 802.11b/g/n WLANs
In recent years, many researchers have investigated coexistence issues between different or same
kinds of wireless networks which operate in same or adjacent frequency bands, such as IEEE
802.15.4 WSN and IEEE 802.11b/g/n WLAN and yielded considerable amount of research work.
2.1.1 IEEE 802.15.4 WSN and IEEE 802.11b/g/n WLAN Coexistence Issues
The inherent characters of Wireless Sensor Networks make them vulnerable to radio interference.
WSNs are typically deployed in areas that are already crowded with same type of WSNs or devices
and appliances using different wireless technologies working at same frequency band[69]. And the
transmit power of WSNs is usually less than 1mW, which is very low compared to Wi-Fi’s 36dBm
(4 Watts) maximum Equivalent Isotropically Radiated Power (ERIP) [138]. If the IEEE 802.15.4
WSNs signal strength is too low when reaching the WSN receivers in the place Wi-Fi devices are
collocated, the IEEE 802.15.4 frames could be damaged by the high Wi-Fi power and the WSN
receivers would not be able to distinguish the signal from the interference and noise because the
SINR (signal-to-interference-plus-noise ratio) is too low to recover useful information[70].
2.1.2 Experimental and Simulative Study of Coexistence Issues
Many studies[69]-[71] have been done by a lot of researchers for investigating the Wi-Fi and WSN
coexistence problems and quite a few new techniques have been proposed to mitigate such mutual
interference recently. In the following subsections, a brief literature review is presented.
8

Implemented Testbeds
Testbeds are essential for experimentally studying the performance detriment of IEEE 802.15.4
networks under interference of collocated IEEE 802.11 WLANs. Many research works related to
such coexistence issues involve the use of testbeds. A minimal test environment can be set up by
two IEEE 802.15.4 nodes, one for transmitting packets and one for receiving, and two IEEE
802.11b/g/n devices, one for generating interfering traffic and the other one for receiving the traffic.
More complicated network can be deployed according to actual experiment needs. Optionally,
IEEE 802.15.4/ IEEE 802.11b/g sniffer and computers to collect data from IEEE 802.15.4 WSN
can be deployed to further analyze the performance. A typical testbed is depicted in Figure 2.1
[50].
Figure 2.1 A typical testbed setup [50].
In Figure 2.1, the distance between the IEEE 802.15.4 transmitter and the receiver is ds, and dr is
the distance between the IEEE 802.11b access point (AP) which is acting as an interfering source
9

and the IEEE 802.15.4 receiver. One TI-Chipcon CC2420 DK packet sniffer is used to capture
IEEE 802.15.4 packets in the air and log data for further analyze. A desktop computer connected
to the IEEE 802.11b AP acts as a FTP server, and a laptop with IEEE 802.11b WLAN adapter is
installed with FTP client software. The interfering traffic is generated by communications between
FTP server and client. All the data received by the IEEE 802.15.4 receiver are forwarded to a
laptop through a serial connection. Different topologies of these devices can be set to satisfy certain
objectives. More topologies can be found in [19] [51] [52] [53] [56].
Testbeds containing IEEE 802.11b/g WLAN and several IEEE 802.15.4 devices are established in
[57 - 59] to study Wi-Fi interference on a cluster of IEEE 802.15.4 devices and the interference
from collocated IEEE 802.15.4 peer devices. The effect of different angles and distance is studied
in [51] by introducing a testbed with moving IEEE 802.15.4 motes. In [50] and [59], microwave
oven [50] and Bluetooth [59] are added as interference sources in addition to IEEE 802.11b/g
WLAN.
Performance Evaluation of IEEE 802.15.4 WSN under Wi-Fi Interference
Many research works have been done to investigate the coexistence issues between IEEE 802.15.4
WSN and IEEE 802.11 WLAN. Most researchers used performance indicators such as packet loss
rate, throughput, and delay to reveal the mutual impacts between WSN and WLAN. Experiments
are conducted under various system parameters such as channel, packet size, packet rate, distance
and location between WLAN and WSN nodes. A summary of major findings classified according
to these system parameters are presented below.
10

Frequency Offset
[19], [50], [51], [54], [55] and [56] report what influence the frequency offset between the carriers
of IEEE 802.15.4 and IEEE 802.11 WLAN would have on their performance. Conclusions are
drawn from these studies that the smaller the center frequency offset is, the more interference is
applied on the collocated WSN nodes. Moreover, the out-of-band power emitted by Wi-Fi is high
enough to affect the IEEE 802.15.4 WSN nodes’ transmissions, even when the IEEE 802.15.4
WSN nodes are working at a frequency outside of the Wi-Fi operating channel [49].
Packet Rate
In [52], the authors set the IEEE 802.11n WLAN packet length at 63 KB and test with different
packet rates. They found the PLR increased significantly with the increase of the IEEE 802.11n
WLAN packet rate. Similar observations were made in [51] where, UDP traffic with 1472-byte
payload size (MTU 1500 bytes) was sent from the IEEE 802.11n/g AP with different data rates.
The reason for these phenomena is that there will be less interference-free time slots available for
IEEE 802.15.4 WSN nodes to transmit their packets when the packet rate of the coexisting Wi-Fi
devices increase. And this leads to poor service quality of IEEE 802.15.4 WSN nodes under high
packet rate Wi-Fi interference. [49] proposed a technique to mitigate this kind of interference by
reducing the duty cycle of WLAN. However, the maximum throughput of WLAN will decrease
due to lower duty cycle.
Packet Size
The IEEE 802.15.4 performance in terms of PLR worsens significantly with the increase of WLAN
packet size or WSN packet size [51]. The larger the WLAN or WSN packet, the longer the time
needed to transmit either packet. This can result in a higher possibility of collision between WLAN
and WSN packets.
11

SNR/SIN
[49] investigated the relationship between SINR and PLR. The experiments shows that PLR of
WSN can be very low, as long as SINR does not go below a certain threshold. According to the
author, this threshold can be experimentally determined by considering different polling window
which is the time interval reserved by the coordinator for communicating with one specific mote
on a collision free basis. In addition, the theoretical analysis in [53] showed that, an IEEE 802.15.4
packet could be successfully received with around 99% probability if the in-band SINR is not
smaller than 5-6 dB.
Distance
From the experimental results of [53], the authors concluded that the reliability of IEEE 802.15.4
WSN traffic can be obtained if the distance between IEEE 802.15.4 WSN nodes and IEEE 802.11
WLAN is far enough. Otherwise, the IEEE 802.15.4 WSN nodes cannot transmit packets reliably
under Wi-Fi interference. However, IEEE 802.15.4 WSN nodes typically have less impact on the
communications between Wi-Fi devices [57]. The same conclusion is drawn in [59] which states
that the IEEE 802.11 WLAN seems to be immune to the interference of IEEE 802.15.4
communications if two WLAN devices in communication are located less than 3 meters in between.
From the aforementioned aspects, we can safely conclude that Wi-Fi interference has severe
influence on IEEE 802.15.4 WSN and leads to performance deterioration of WSN. Thus,
techniques to mitigate or solve this issue are very important.
12

2.2 Research Works on TCP/IPv6 over WSN
2.2.1 Introduction of 6LoWPAN
6LoWPAN stands for IPv6 over Low-power Wireless Personal Area Networks. It is a protocol
that defines how to run IPv6 on top of IEEE 802.15.4 MAC and PHY layers [98]. It has four key
functionalities [97 - 100]: Fragment and reassemble: IPv6 requires the maximum transmission unit
(MTU) to be at least 1280 Bytes. In contrast, IEEE 802.15.4’s maximum frame size is 127 octets.
A maximum frame overhead of 25 octets spares 102 octets at the media access control layer. So
packets larger than one frame can fit have to be fragmented and reassembled at 6LoWPAN layer
to accommodate IPv6 MTU. Address management and assignment: The Neighbor Discovery
Protocol (NDP) is used in IPv6 and is responsible for address auto-configuration of nodes,
discovery of other nodes on the link, determining the link layer addresses of other nodes, duplicate
address detection, finding available routers and Domain Name System (DNS) servers, address
prefix discovery, and maintaining reachability information about the paths to other active neighbor
nodes [143]. However, IPv6 Neighbor Discovery was not designed for non-transitive wireless
links, as its reliance on the traditional IPv6 link concept and its heavy use of multicast make it
inefficient and sometimes impractical in a low-power and lossy network. 6LoWPAN did some
optimization to solve this problem [144]. Network management: Simple Network Management
Protocol (SNMP) is a widely deployed application protocol for network management and in
particular network monitoring. SNMP can be deployed in 6LoWPAN with some optimization.
Contiki operation system already has an implementation of SNMP [98]. Security: IEEE 802.15.4
nodes can operate in either secure mode or non-secure mode. Two security modes, namely Access
13

Control List (ACL) and Secure mode [142], are defined in the specification in order to achieve
different security objectives.
The IETF formed the 6LoWPAN working group to adapt IPv6 onto WSN devices using IEEE
802.15.4 MAC and PHY layer after seeing the possibility to run IP stacks on memory and
performance limited WSN hardware [34]. 6LoWPAN is an adaptation layer located between IPv6
and IEEE 802.15.4. The constrained payload of IEEE 802.15.4 and the increasing size of the IPv6
header constitute the key problem for encapsulating IPv6 packet into IEEE 802.15.4 frame.
6LoWPAN is designed to solve this problem by fragmenting and reassembling IPv6 datagrams. It
also has IPv6 header compression functions to reduce overhead, and header encoding to support
fragmentation. Instead of DHCP and NAT, Zero-Conf and Neighbor Discovery functions of IPv6
are used in 6LoWPAN to reduce memory consumption.
With the maturing of 6LoWPAN draft, several implementations have been materialized for
research or commercial purposes. 6lowpancli [38] is the first solution with rudimental set of
features. Main features of 6LoWPAN, such as fragmentation, header compression and IPv6
stateless configuration, have been implemented in the stack while only two higher level protocols,
ICMPv6 and UDP, are provided. Therefore, 6lowpancli supports ping and UDP datagram
exchanging, which are the author’s goal of this implementation. Without neighbor discovery and
routing mechanism, 6lowpancli requires manual configuration. Although 6lowpancli is a very
basic implementation, it has been integrated in TinyOS 2.x [38].
14

SICSlowpan [39] is another open source 6LoWPAN implementation. Researchers who designed
it also developed uIP and uIPv6. SICSlowpan supports not only ICMPv6 and neighbor discovery
but also mesh under. It is located between the uIPv6 and MAC layer and acts as relay and translator
between those two layers. SICSlowpan is the first 6LoWPAN implementation on Contiki OS [40].
Blip [38] is an open source 6LoWPAN implementation based on TinyOS, supporting UDP, ICMP,
neighbor discovery and mesh under routing. To realize an IPv6 connection, a daemon is included
in the sink node’s application, whose primary function is the creation of an IPv6 tunnel. Blip does
not have receiver side buffer, therefore new incoming data will be delivered to upper application
layer immediately if the upper layer is idle or be discarded directly. However, retransmitting
missing segments is supported by sender-side buffer in Blip. In the latest version of Blip, an
experimental TCP stack is also supported.
2.2.2 Related Research Works
Internet connection is highly desirable, in order to provide WSN services everywhere.
Transmission Control Protocol (TCP) can provide end to end transmission reliability and IPv6
gives a solution for addressing hundreds and thousands of WSN nodes, which makes it possible
for every node to directly access Internet. With the popularity of WSN growing, it becomes very
important to implement TCP/IPv6 over WSN.
However, these advantages do not come for free. The IPv6’s 40-byte header is twice the size of
IPv4 header (without option field). Considering the maximum physical layer payload of an IEEE
802.15.4 packet is only 127 bytes, 20 bytes extra for IP header is quite significant. Therefore, IPv6
15

need to be optimized for using in WSN. The first breakthrough was made by Dunkels in [34],
where he proposed Micro IP (uIP) and Lightweight IP (LwIP). The surfacing of uIP and LwIP
changed the common view of that the IP stack is too heavy to use in WSN nodes. uIP is a simplified
TCP/IP stack with absolute minimal set of features. It can handle only one network interface and
provides IP, ICMP, and TCP protocols. LwIP provides full set of features for TCP/IP stacks but
simplifies the implementation to make sure it can run on WSN nodes. TCP works very well on
both wired (e.g. Ethernet) and wireless networks (e.g. Wi-Fi). However, it has quite a few problems
when being used in WSN. The hardware performance of WSN cannot be on par with traditional
networks and the low power transceivers of the WSN nodes could have high bit error rate (BER)
[103]. One big issue for TCP running on top of WSN is that the TCP connection is maintained
between two ends of the communication. If an ACK from the receiver is lost and a timeout occurs
at sender or a duplicate ACK is received by sender, the sender then retransmits the original packet,
which will go through all the nodes in the path, even when the original packet has actually been
received by the receiver. This behaviour wastes the nodes’ energy by forcing expensive
retransmission on the whole path from sender to receiver. Another problem is whenever a packet
is lost, i.e. no acknowledgment is received for that particular packet and a timeout event is triggered,
this loss is believed to be due to congestion in the network. Consequently the sending rate is
reduced to avoid further segment losses. While this might be a good strategy in wired networks, it
certainly is not appropriate for Wireless Sensor Networks, where bit error rates are orders of
magnitude higher (up to double digit percentage package error rates [103]). Despite the fact that
the loss occurred due to bit errors, the sending rate is reduced nevertheless. This leads to a less
than ideal throughput [28] [30]. Therefore, it is essential to study the performance of TCP/IP over
WSN when there is interference from the collocated Wi-Fi network.
16

In [60], the authors designed a sensor node by using Atmega128L MCU and Chipcon CC2420
transceiver. They ported Tiny IPv6 onto their sensor node and developed a routing protocol for the
IPv6 stack. In addition, they designed a testbed to control home temperature based on the
temperature sensed by nodes. Although this testbed implementation meets some of the
experimental research needs, it is very primary and limited in functions.
[61] Investigated the influence of 6LoWPAN gateway channel allocation under Wi-Fi interference.
The authors performed a series of experiments with varying 6LoWPAN payload and different
distance of nodes from the gateway. Results show that the channel allocation has obvious impact
on the performance of 6LoWPAN gateway.
[62] presents an experimental study on TCP header compression in 6LoWPANs. The algorithm
proposed to send out only the part of the header that is different from the previous header and elide
the portion that contains the same information. Test results showed that the longer the distance
between two nodes, the more energy efficiency can be gained from the reduced traffic. The saving
can be up to 15% as the authors stated.
In [63], the authors studied the performance of Blip 2.0's Transmission Control Protocol (TCP)
under IEEE 802.11g Wi-Fi induced interference through experimentation and analysis. Some
software problems in Blip 2.0 were discovered and corrected. Two TCP layer parameters have
been adjusted and tested in their testbed. However, the implementation of 6LoWPAN in Blip 2.0
is very rudimental, which makes the testbed in [63] cannot provide performance and reliability as
we would expect for high packet rate periodic monitoring.
17

In [64], the authors proposes the Reliable IPv6 Packet Delivery Scheme (RIPDS), which S
achieves a high PDR by use of network coding to encode the fragments of an IPv6 packet into
multiple encoded packets, such that regardless of the loss of some encoded packets, the original
fragments and the original IPv6 packet can still be recovered by the node that receives some other
encoded packets. Simulation results show that RIPDS outperforms the existing routing schemes.
An experimental performance evaluation of TCP over multi-hop 6LoWPAN was conducted in
[65]. The locations of nodes are depicted in Figure 2.2. RA, RB, RC, and RD are relay nodes
which pass TCP packets generated by terminal node (TN) to edge router (ER). An external node
(EN) sends constant bit rate traffic to work as interferer. The TCP performance of 6LoWPAN in
terms of end-to-end-retransmission, throughput, and energy consumption was studied in one hop
and multi-hop cases, and with or without homogenous networks’ interference.
Figure 2.2 Nodes distribution [50].
18

In [66], the authors stated that the loss of one 6LoWPAN fragment greatly reduces the transmission
efficiency. So they proposed a simple frame forwarding and recovery (SFFR) mechanism in multi-
hop WSNs and evaluated the performance by simulation. SFFR implements a 32bit bitmap in
recoverable fragment acknowledgment and attaches an acknowledgment request (AR) in the last
fragment of the series. Once the receiver node receives an AR, it will send back an
acknowledgment with a bitmap which can be decoded for information of lost fragment at the
receiver. The retries happen in a round robin fashion, enabling the fragments on the way to be
finally received and acknowledged before the sender decides to resend them. An example is
depicted in Figure 2.3. Simulation results showed that this method can reduce end-to-end
retransmission largely and consequently improves energy efficiency a lot for both TCP and UDP
connections.
Figure 2.3 End-to-end simple fragment forwarding and recovery [66].
[67] proposed an OPENWRT system based gateway. The gateway can connect to IPv6 networks
with its onboard Ethernet port or Wi-Fi, and communicate with 6LoWPAN WSN through the sink
19

node plugged into its USB port. Figure 2.4 shows the architecture of the gateway. Several
performance indicators were tested in this paper including RTT, delay variance, packet loss, and
average throughput under various traffic payload. Test results showed that the performance of IPv6
over IEEE 802.15.4 WSN is seriously affected by interference. However, the TCP can provide a
reliable connection that makes this implementation usable in some circumstances.
Figure 2.4 6LoWPAN gateway architecture [67].
The authors of [68] proposed a cross-layer caching based optimization for wireless multimedia
sensor networks. This mechanism consists of two components: 1) NACK-based Repair
Mechanism: Unlike traditional protocol where lost packet is only detected in receiver, this
mechanism also detects lost packet in intermediate nodes. Once a packet lost is detected, a repair
negative acknowledgment (RNACK) is issued to the previous-hop node. If the previous node has
the lost packet in cache, this node will do a retransmission. If not, the RNACK will pass back
towards source until the lost packet is found and retransmitted. RNACK is issued every time when
an out-of-order sequence is detected. One example of this mechanism is depicted in Figure 2.5. 2)
Adaptive MAC Retry Limit Mechanism: this mechanism adaptively calculates the maximum
retransmission times based on the worst-case probability of successfully transmitting the packet in
r retransmission attempts between two nodes i and j. The minimum number of retransmission is
larger than 3. The retransmission times can be calculated by the following equation:
20

r𝑖𝑖 = �𝑙𝑙𝑙𝑙𝑙𝑙𝜋𝜋𝑖𝑖,𝑗𝑗−𝑙𝑙𝑙𝑙𝑙𝑙𝑝𝑝𝑖𝑖,𝑗𝑗𝑙𝑙𝑙𝑙𝑙𝑙𝑝𝑝𝑖𝑖,𝑗𝑗
� Equation 2.1
where 𝜋𝜋𝑖𝑖,𝑗𝑗 is the desired MAC-layer reliability and 𝑝𝑝𝑖𝑖,𝑗𝑗 can be detected by link quality indicator.
Simulation results showed that this cross-layer optimization not only increases throughput and
delay performance, but also improves the energy-efficiency. And it is generic enough to be adopted
in other WSN transport protocols because it can be implemented into basic Distributed Transport
for Sensor Network (DTSN) protocol.
Figure 2.5 NACK-based repair mechanism [53].
In [72], the authors designed MiMAC, which is a distributed MAC layer technique that can
perform channel hopping and is independent of upper layers such as uIP and 6LoWPAN. The
MiMAC is implemented by authors of Contiki and a full IPv6 stack including UDP, RPL and
6LoWPAN runs on top of MiMAC, which shows MiMAC is independent from other layers in the
21

protocol stack and feasible. This solves the problem of Time-Slotted Channel Hopping (TSCH),
which needs to connect to upper layers. MiMAC has four steps: (1) medium access; (2) finding
receiver’s wakeup-time and channel; (3) data transmission and acknowledgment; and (4) dealing
with losses/collisions. The performance evaluation experiments are carried out using a testbed
consisted of 97 TelosB nodes spanning in a three-floor office building. The author use the node #1
in the middle of the top floor as network root. And every other node sends a 64-byte payload
datagram to the root node every minute. The MAC wakeup frequency is set to be 8Hz, same as
Contiki MAC’s default value. The experiment results showed that the network needs about 10
minutes to initialize at the beginning and 30 minutes to reach a state of stable topology. Therefore,
this mechanism doesn’t suit for large throughput and frequently changing network topology.
However, in application cases (e.g. low-power, high external interference, low data rate, network
topology not changing) like the authors proposed, the reliability of WSN increases a lot.
2.3 Mechanisms for Interference Mitigation
2.3.1 CCA/MAC Parameter Adjustment Mechanisms
The authors of [73] proposed a technique with one additional carrier sensing. Before transmitting
any packet, two CCAs, CCA1 and CCA2, are performed. However, there is a special case that
node 3 performs CCA1 while node 1 has sent a data frame to node 2 and is waiting for its
acknowledgement. The CCA2 of node 3 will detect a busy channel slot if the information of node
1 is successfully delivered to node 2, because an acknowledgement is replied by the node 2 at the
same time. But after this kind of CCA2 failure, the data frame can still be transmitted in the next
time slot. Therefore, the authors proposed to perform a third CCA to see if the channel is clear.
22

This technique can save some energy by reducing the total number of CCA performed. However,
this technique only works for one special case of CCA2 failure. Consequently, the performance
improvement can be limited. In [74], similar method which increases CCA numbers was proposed.
Instead of performing two CCAs, an adaptively CCA increasing mechanism was developed to
better enhance the efficiency of the network under different conditions(e.g. the size of the network,
the intensity of the traffic, or the urgency of the traffic)
[75] proposed a cross-layer solution, ADaptive Access Parameters Tuning (ADAPT) algorithm.
The implementation of ADAPT is easy without modification of any original IEEE 802.15.4 MAC
standard. ADAPT automatically adjusts MAC parameters based on a pre-set tuning strategy and
estimates the real-time packet delivery ratio according to a control scheme. The delivery ratio is
the ratio between the number of message acknowledged by the target node and the number of
message sent by the source node. The tuning strategy exploited by ADAPT consists of changing
the MAC parameters in order to increase or decrease the delivery ratio, so that it remains in the
reliability region specified by the control scheme. And the delivery ratio control scheme is
performed at each communication period. An exponential moving average is applied to smooth
sudden variations of delivery ratio. On the basis of the reliability of desired delivery ratio, APAPT
derives two thresholds. If the threshold is above the upper boundary, the APAPT applies strategy
to decrease the delivery ratio to save power, otherwise APAPT tries to increase the delivery ratio.
Simulation results show that APAPT can improve both reliability and energy efficiency.
23

[76] proposed a method to tune ED thresholds of IEEE 802.15.4. The rate of abandoned packets
due to CCA failures is calculated and used as a guide for ED threshold adjustment. The adaptively
changing threshold can reduce inhibition loss caused by channel access failures effectively and
mitigate interference. However, threshold is difficult to set to a proper value, especially when the
interference is mediocre. The algorithm calculates the threshold based on inhibition packet loss.
Under low to medium interference, the inhibition packet loss change might not be large enough
for the algorithm to tell the difference. Moreover, the impacts of packet collision should also be
carefully considered. Because of the low rate of IEEE 802.15.4, the packet transmission time could
be much longer than that of IEEE 802.11 WLAN. Even the IEEE 802.15.4 CCA detects the
channel is clear, there is still a great chance that IEEE 802.15.4 packets collide with Wi-Fi packets.
In [19], the authors proposed a new Link Quality Estimators (LQE) - Packet Reception Rate with
Clear Channel Assessment - by merging the CCA count with the Packet Reception Rate. In
comparison to existing LQEs, results show that the new estimator distinguishes persistent IEEE
802.11 bgn traffic more robustly.
In [49], the authors proposed a method which decreases the duty cycle of Wi-Fi and increases the
IEEE 802.15.4 nodes’ polling window. Although this method can ensure the reliable
communications of collocated Wi-Fi and IEEE 802.15.4 networks, it sacrifices the throughput of
both network. This makes it unsuitable for many applications such as video and audio streaming
which require high data rate.
24

In [80], COG-MAC was proposed, a cognitive medium access control scheme (MAC) for IEEE
802.15.4-compliant WSNs that minimizes the energy cost for multi-hop communications, by
deriving energy-optimal packet lengths and single-hop transmission distances based on the
experienced interference from IEEE 802.11 WLANs. However, the performance evaluation of
COG-MAC is based on simulation result that are not realistic and might miss or oversee some
hidden factors that can impact the performance.
In [81], two mechanisms were implemented in MAC layer. To achieve better performance, one
mechanism adjusts the backoff exponent (BE) based on the combination results of CCA and the
packet transmission, the other mechanism shifts the range of backoff counters to reduce redundant
backoffs and CCAs by utilizing the CCA outcome.
In [78], the authors proposed an Adaptive Preamble Padding with Retransmission Control (APPRC)
technique for ZigBee devices to mitigate packets loss under interference, meet certain packet loss
rate (PLR) requirement, and improve packet transmission efficiency when they are suffering time
varying interference from the collocated WLAN. The experimental performance evaluation results
showed that APPRC technique can achieve higher transmission efficiency than packet
retransmission while satisfying PLR requirements of sensing applications.
In addition, [79] proposed a technique to reduce the possibility of collision occurrence between
Wi-Fi and WSN nodes. It extends the backoff time of IEEE 802.15.4 WSN nodes when the IEEE
802.15.4 device gets a successful first CCA and a failed second CCA in beacon enabled mode. By
reducing collision and CCA times, the energy efficiency and throughput are also improved.
25

As summarized in previous paragraphs, many mechanisms and techniques have been proposed to
solve the IEEE 802.15.4 WSN coexisting issues under Wi-Fi interference by improving, modifying,
changing and adding functions in MAC/PHY layer. These proposals all have merits in certain
environments and conditions.
2.3.2 Frequency Agility Mechanisms
Frequency agility mechanisms switch channels to avoid interference. Interference detection and
interference avoidance are the two essential functions of frequency agility mechanisms. The
mechanisms detect the interference first and then switch to a clear channel to avoid the interference.
2.1.2.1 Interference Detection
[82] presented an interference detection mechanism by counting frame error rate. The algorithm
adaptively allocates a channel to ZigBee communication devices considering the channel status.
If the frame error rate increased and became higher than a preset threshold, the algorithm will
assume the channel status is bad and change to another channel. Hence, the mutual interference
among different communication devices can be minimized. Moreover, the proposed algorithm can
reduce the power consumption of the whole system by turning off ZigBee communication devices
when the frame error rate continues to exceed the pre-determined threshold value in spite of
adaptively allocating channels during a given observation window.
26

In [83], the authors proposed to do additional signal processing in the physical layer (PHY) of an
IEEE 802.15.4 receiver. They performed signal analysis with Fourier transform of a demodulated
signal to detect interferer during reception before bit errors or collisions occur. Their algorithm
with a software radio were implemented as an extension the physical layer of IEEE 802.15.4
transceiver. Although they can detect mobile interference in real world environment, this approach
takes more time than traditional method.
[84] proposed an interference detection mechanism for heterogeneous network with different
functional devices. Depending on different device functions, this method uses a combination of
several interference detection algorithms including beacon-based, test frame-based, and
ACK/NACK-based algorithms. By counting NACKs, the coordinator sends out certain number of
beacon frames periodically, the receiver counts the number of NACKs. The more NACKs the
receiver counted, the stronger interference exists. The drawback of this mechanism is that every
beacon request should be answered. This will affect the throughput and waste a lot of energy.
Devices operating in the same frequency can receive interference notification from peer devices,
even they don’t detect any interference themselves.
In [85], a radio interference detection protocol to detect run-time radio interference among sensor
nodes was proposed. However, it emphasizes on interference from the same type of networks
rather than coexisting issue of Wi-Fi and WSN. [86] presented a scheme which detects the change
of throughput. If the throughput drops below a predefined threshold, it will perform a CCA
automatically. Channel interference is assumed to exist if the RSSI value calculated based on CCA
exceeds a preset acceptable value. In [88], the authors propose an Interference Aware Adaptive
27

Clear Channel Assessment (IAACCA) technique which can assess channel interference conditions
and the availability of time to support reliable packet transmission and then determine better timing
for transmitting ZigBee packets and adjust packet size or operating channel based on the
assessment. In [87], the authors derived a closed form expression for the average probability of
detection on the estimated channel state information(CSI). This expression unveils the dependence
of the probability of detection on the estimated CSI as well as the fading correlation function.
Using this dependence, the authors proposed an adaptive sensing-scheduling algorithm. The result
was verified by using simulations.
2.1.2.2 Interference Avoidance
In [89], an interference mediation mechanism for collocated IEEE 802.15.4 WSN and IEEE 802.11
WLAN was presented. This mechanism monitors the status of IEEE 802.15.4 channel currently in
use. Once interference is found, a mediation mechanism will scan the Wi-Fi channels and assign
IEEE 802.15.4 WSN nodes a channel that is not overlapping with any channel used by existing
Wi-Fi devices. Another mechanism in [84] proposes to generate a random number sequence for
channel selection. WSN node which detects interference will transmit a Channel Change Broadcast
Message (CCBM) to its neighbors. Once a node receives a CCBM, it will jump to the next channel
in the pre-defined sequence stored in each nodes. However, without considering other important
parameters such as the interference level and status of available channels, this mechanism is
primitive, inefficient and can affect the reliability of the network.
[90] studied a case that a number of ZigBee devices are collocated in an area and proposed to use
personal area network (PAN) priority to mitigate interference. Under interference, the coordinator
28

will instruct the node with low priority to jump to another free channel. The priority of nodes is
determined by the level of interference around the node. The higher interference the node is
exposed to, the lower priority this node has. If two nodes suffer the same level of interference, the
one with lower PAN ID has higher priority.
[91] and [92] proposed a mechanism in which the sender node measures its packet error rate (PER)
constantly. If the measured PER is higher than a pre-defined value, a notice will be sent to the
coordinator. After receiving the notice, the coordinator will perform a test to see the Link Quality
Indicator (LQI) value, which is a computed value based on the received signal strength as well as
the number of errors received. If LQI is too low, the coordinator will send a command to all WSN
nodes in the same PAN to perform an interference detection. The results of the interference
detections will be sent back to the coordinator, and the coordinator will then choose a channel that
can provide acceptable channel quality to most nodes. This mechanism utilizes both interference
detection and interference avoidance, reduces energy consumption, and mitigates interference. The
flowchart of this mechanism is depicted in Figure 2.6.
Frequency agility mechanisms are effective to mitigate interference and have their merits including
implementation simplicity and energy efficiency. However, the disadvantage of channel switching
cannot be neglected. Especially when there are many collocated Wi-Fi devices operating on
different channels, the switching time and delay can be increasing undesirably, and the stability of
WSN may decrease due to possible frequent channel hopping operations.
29

Figure 2.6 Flowchart of: (a) interference detection and (b) interference avoidance [91].
2.3.3 Collaborative Coexistence Mechanisms
In [93], the authors proposed a technique which introduces a gateway with both Wi-Fi and IEEE
802.15.4 transceivers. Before transmitting the actual WSN data traffic, the gateway sends
purposely made error message for a period of time to mute the coexisting Wi-Fi devices. Then the
IEEE 802.15.4 WSN nodes can transmit without Wi-Fi interference.
30

[94] presented a mechanism to enable heterogeneous wireless network interfaces working on a
single board. Because IEEE 802.11 WLAN and IEEE 802.15.4 WSN interfaces are on the same
board, the IEEE 802.15.4 interface can generate an interrupt to the MCU on board for a request of
active channel reservation, which is then forwarded by a synchronization unit to the IEEE 802.11
WLAN. WLAN reserves the channel as requested by using an RTS (Request To Send)/CTS (Clear
To Send) switching scheme. Thus, the IEEE 802.15.4 WSN can transmit without WLAN
interference.
In [95], the authors proposed a collaborative mechanism which uses channel utilization
information and RSSI Wi-Fi beacon frame to solve the collocated IEEE 802.15.4 WSN and Wi-Fi
interference problem. This mechanism has two modes. In active mode, the collocated Wi-Fi
devices always reserve a channel for IEEE 802.15.4 Guaranteed Time Slot (GTS) and beacons in
order to guarantee the reliable transmission of IEEE 802.15.4 WSN. And the number of GTS is
determined based on the data rate and PER of each IEEE 802.15.4 nodes. In scanning mode, the
coexisting WLAN station scans all overlapping channels and estimates channel status/condition
by the detected RSSI values.
The method proposed in [96] is a time sharing based mechanism. There is a coordinator specialized
in balancing the usage of bandwidth between Wi-Fi and IEEE802.15.4 WSN in the overlapping
channel. The two networks respectively use the contention free period and contention access
period of the superframe of IEEE802.15.4 WSN.
31

All these mechanisms mentioned above require a mediator to manage media access. This mediator
uses different functional devices to evaluate the status and conditions of the networks. Then the
mediator decides the operation of the whole coexisting networks and sends WSN nodes and Wi-
Fi APs commands to adjust their own parameters and running conditions, such as transmission
frequency, transmission time and transmission bandwidth based on the detection of current
network status, so as to adapt to the changing network status. However, this kind of mechanism
not only needs to modify the hardware and software implementations of both Wi-Fi and WSN
networks, but also significantly affects the performance of both networks. Moreover, in places
where many Wi-Fi APs and WSN nodes are deployed, it becomes a very costly task to modify the
many devices in the networks to implement such collaborative mechanism. In addition, due to the
very low transmission rate, the transmission time of IEEE 802.15.4 packets could be very long
compared to that of Wi-Fi packets, which means Wi-Fi devices have to hold the packet
transmission and wait while WSN is transmitting. This would considerably weaken Wi-Fi’s
performance and throughput. Thus, designing innovative mechanisms implemented only in WSN
nodes to mitigate Wi-Fi interference without the need of modifying Wi-Fi infrastructure or
mediators to arbitrate media access of the whole network is important and meaningful.
It is also noticed that none of the interference mitigation techniques reviewed in this section takes
upper protocol layers into consideration. To send a TCP/IPv6 packet over WSN involves several
upper layers, each layer has its own functions and these functions work together with lower layers
in communication. Therefore, the techniques without consideration of cooperating with upper
layers may not work properly when users want to send TCP/IPv6 packets over WSN.
32

Chapter 3 Design and Development of TCP/IP over WSN Testbed
It is well known that usually assumptions and simplified mathematical models are used in
theoretical analysis to reduce the analytical complexity, which inevitably compromises the
accuracy or credibility of analytical results. Although computer simulations might not depend on
such assumptions and models as heavily as theoretical analysis, there is still a great chance that
they overlook the impacts of some hidden factors such as the actual characteristics of
circuit/antenna design, inaccurate simulation models of signal propagation, channel impairments
or stochastic traffic behavior, and hidden protocol/algorithm interoperability mechanisms.
Realizing these limitations of theoretical analysis and computer simulation methods, our research
will be based on the actual hardware and software implementation of the techniques of interest and
extensive experimental performance evaluation in a testbed. The following sections provide the
details of the testbed hardware, software and setup.
3.1 Testbed Hardware
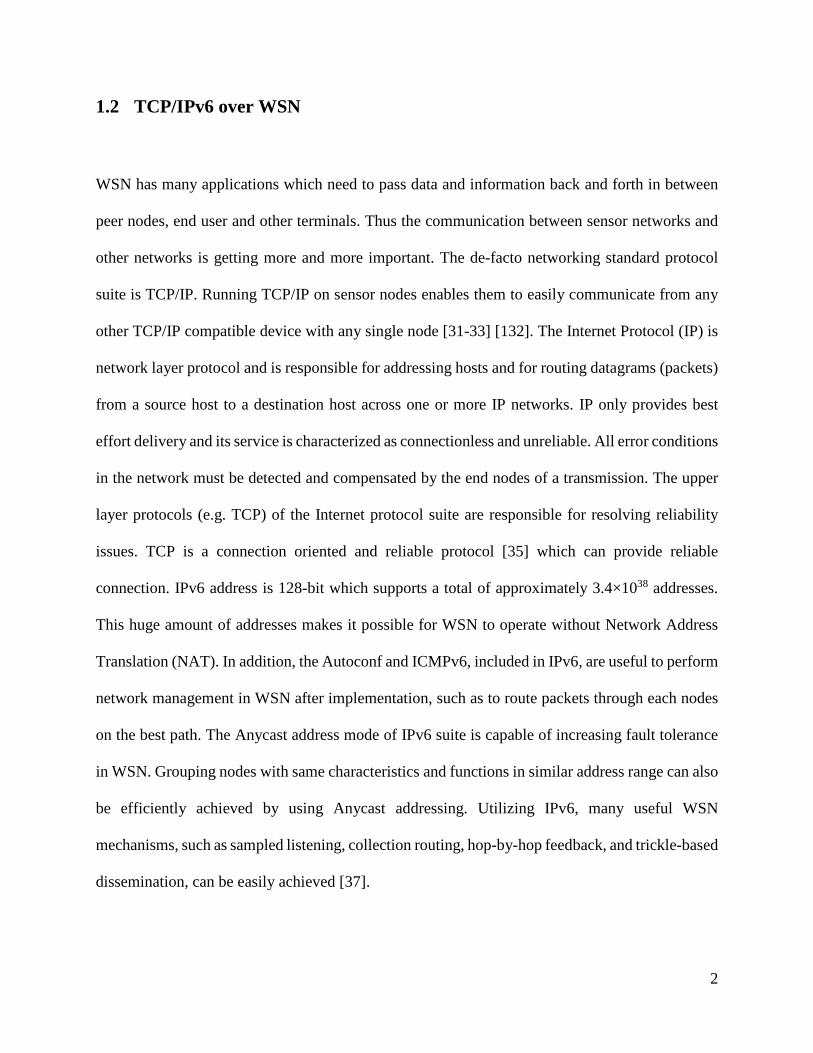
A WSN mote is usually composed of data acquisition (input/output) unit, microcontroller unit
(MCU), data transfer unit and power supply unit. Data acquisition unit generally has a bunch of
general purpose IOs that are connected to different sensors and several A/D and D/A converters to
control and collect data from other devices and sensors. A microcontroller unit has all the major
computer functions built on a single integrated circuit containing one or more processor core(s),
memory, and programmable input/output peripherals. Microcontrollers are widely used in
automatically controlled devices and products, such as automobile engine control systems,
33

implantable medical devices, remote controls, office machines, appliances, power tools, toys and
other embedded systems. In a wireless sensor node, the MCU acts as the brain of the sensor node,
it processes the collected data and runs the program. An embedded operating system (e.g. Contiki
[40]) can run on the MCU. With an operating system that comes with networking protocol stacks,
it is easier for programmers to develop multitask applications that can communicate with other
nodes using the same protocol stacks. Data transfer unit refers to transceivers which can be a
separate single chip or integrated on MCU. Power supply unit is usually in the form of a battery in
the case of WSN node. [6] - [9], [65].
The cost of WSN motes can be from several to hundreds of dollars depending on a number of
factors such as transmission range, power supply, operating environment, processing capability,
memory size, and sensors used on board. With limited size, power supply, and processing
capability, wireless sensor nodes normally have short transmission range in one hop. If one node
needs to communicate with other nodes that are outside of the coverage of its radio transmission
range, it will transmit data through a multi-hop route involving a number of intermediate nodes
[10]. Therefore, to complete the tasks of data collecting, signal processing and data exchanging,
two or more nodes may be involved to work collaboratively [6][7][11].
34
Application
Memory
CPU
Sensor AD/DA
Input/output
NET MAC PHYInput/output
Power Supplier
Data Acquisition Unit
Microcontroller Unit
Data Transfer Unit
Figure 3.1 General components of a wireless sensor node [7].
To study the performance of TCP/IPv6 over WSN in presence of varying Wi-Fi interference, our
testbed consists of both WLAN component and WSN motes.
The WLAN consists of an IEEE 802.11 b/g/n wireless router (WR) (ASUS RT-N16) and two
laptops. One of the laptops is used as traffic source and generates network traffic with different
patterns that will be transmitted via Ethernet port to the WR and then converted into IEEE 802.11
traffic by WR. The other laptop acts as Wi-Fi traffic sink for receiving IEEE 802.11 packets. The
WR receives various traffic from the source laptop and forwards to the destination laptop via Wi-
Fi connection. In our experiments, we found that the transmit power of the WR is very stable and
35

can be set at different power levels using third party firmware. Therefore, WR is used as the Wi-
Fi interference source in the WLAN.
The WSN consists of two IEEE 802.15.4 wireless sensor motes, which are connected to two
laptops using USB cables for displaying packet sending and receiving results in real-time. In
addition, another laptop is used in the testbed as a sniffer for capturing and analyzing the
transmitted Wi-Fi or IEEE 802.15.4 packets in either WLAN or WSN when needed. When used
as a sniffer for WLAN traffic, the laptop uses the built-in IEEE 802.11 b/g/n card and the installed
Wireshark software to monitor the Wi-Fi traffic. When used as a WSN sniffer, the laptop uses
USB cable to connect to an IEEE 802.15.4 mote flashed with sniffer firmware and runs Wireshark
for capturing and analyzing traffic between the sending and receiving motes. In order to make sure
that the Wi-Fi and IEEE 802.15.4 devices are working properly, a spectrum analyzer (Aeroflex
3252) which has a monitoring frequency range from 1 kHz to 8 GHz and a sweeping time of 10ms
is used to monitor the Wi-Fi and WSN operating channels and displays their power spectral content.
The architecture of the two wireless sensor motes we developed is shown in Figure 3.1.
Sensors: Light, temperature and humidity
Atmega RF231 transceiver
FT232 USB To serial chip
STM32F103RTC6 micro
controller unit
PC
POWER(LM1117 Voltage regulator)
IO/DATA BUS
USB to serial connection
Antenna
Figure 3.2 Architecture of the developed IEEE 802.15.4 sensor motes.
36

The microcontroller unit (MCU) we used is SMT32F103RTC6 [111]. It is an ARM 32-bit Cortex-
M3 CPU with 48KB RAM and 256KB flash and can run at a maximum frequency of 72MHz.
With various connectivity support such as I2C, SPI, and UART, this microcontroller has a lot of
flexibility to connect different kinds of sensors. Atmega AT86RF231 [112] is the transceiver used
for RF communications. It connects to the MCU via SPI bus. By setting different parameters in
Atmega AT86RF231’s registers, we can adjust/set RX sensitivity, TX power, operating channel,
hardware MAC acceleration function, and a bunch of other functions. The TX/RX pin of
AT86RF231 transceiver is connected to an 2.4Ghz PCB antenna [110] which has 80% typical
efficiency and 280Mhz bandwidth [109] [110]. The FT232 USB to serial chip is used as a bridge
between PC and MCU, providing communication between them via USB to serial connection.
Real time packet transmission between the two motes and related statistical results can then be
sent to PC and displayed using PUTTY [107] installed on PC. A LM1117 [113] 5v to 3.3v voltage
regulator supplies power for all the components on the board. The circuit design for major modules
are presented in the following sections.
1. Power supply module
As shown in Figure 3.2, in the power supply module, a TI LM1117MPX-3.3 regulator is used to
regulate the voltage from 5V USB to 3.3v VCC. A jumper (JP5) is designed for switching between
USB power source and internal battery power on the mote. C1 is the input bypass capacitor, 47uF
is sufficient for most of applications [113]. And C2 is a 10uF output capacitor. The value of C2 is
carefully chosen for low equivalent series resistance and enough capacitance to get a stable
37

feedback loop. And two smaller 100nF capacitors (C36 and C37) are connected for preventing
ripple from being amplified when the output voltage increases.
Figure 3.3 Schematic circuit of power supply module.
2. UART to USB module
This module (Figure 3.3) provides a serial interface between the mote and the computer. This serial
connection can be used to debug, interact with mote, and read out sensor data. A FTDI FT232RL
chip is used in this circuit. The TXD and RXD pins of FT232RL are used for data transmission
and reception, respectively.
38

Figure 3.4 Schematic circuit of USB to UART module.
3. MCU module
The schematic circuit design of the MCU module is shown in Figure 3.4. The MCU,
SMT32F103RTC6, requires an operating voltage of 2.0 V to 3.6 V (VDD). An embedded regulator
is used to supply the internal 1.8 V digital power. The real-time clock (RTC) and backup registers
can be powered from the VBAT (voltage for battery, PIN1 on MCU) when the main VDD supply
is powered off. An 8MHz crystal oscillator is used as a stable and accurate main clock source of
the board.
39

Figure 3.5 Schematic circuit of MCU module.
The crystal oscillator (Q1 in Figure 3.4) and the load capacitors are connected as close as possible
to the oscillator pins in order to minimize output distortion and start-up stabilization time. The load
capacitance values are chosen according to the crystal load capacitance which is 22pF. For C16
and C17, we use high-quality ceramic capacitors designed for high-frequency applications. Four
switches are also included in the circuit for users to interact with the mote as button input.
40

4. Transceiver module
Figure 3.6 Schematic circuit of transceiver module.
The schematic design of the AT86RF231 with an unbalanced antenna is shown in the Figure 3.5.
The 100Ω impedance differential RF signals on AT86RF231 are transformed to 50Ω single-ended
RF signals to antenna using balun B1. The capacitor C24 provides AC coupling of the RF signal
to the RF port on balun, and C25 - C30 are matching capacitors to improve antenna performance.
The power supply decoupling capacitors (C31 and C35) are connected to the external analog
supply pin (EVDD, pin 28) and external digital supply pin (DEVDD, pin 15). Capacitors C32 and
C39 are bypass capacitors for the integrated analog and digital voltage regulators to ensure stable
operation. All decoupling and bypass capacitors are placed as close as possible to the pins with
low-resistance and low-inductance connections to ground for achieving the best performance. The
16MHz crystal (Q3) and the two load capacitors (C33 and C34) connected to pins XTAL1 and
41

XTAL2 form the crystal oscillator, which provides accurate clock to the transceiver. Crystal lines
are routed away from digital I/O lines to achieve the best accuracy and stability of the reference
frequency.
3.2 Testbed Software
The software used in our testbed ranges from freely available open source operating system and
various tools to custom developed firmware programs. This section presents details of software in
the testbed.
For the WLAN part of our testbed, the software is listed below:
1. Distributed Internet Traffic Generator (D-ITG): The D-ITG [108] is a software package
designed by A. Botta, A. Dainotti and A. Pescapè to simulate traffic with different
deterministic or stochastic processes (e.g. exponential, uniform, Cauchy and normal) for
both Inter Departure Time (IDT) and packet size random variables. In our testbed, both
transmitting and receiving laptops in the WLAN are installed with D-ITG. It generates
UDP traffic in the source laptop that is connected to the wireless router. The WR converts
the incoming traffic into Wi-Fi traffic and sends packets to the sink laptop. Using different
command line parameters, the desired Wi-Fi interference with different packet size,
generating rates and stochastic processes can be generated.
2. DD-WRT Router Firmware: DD-WRT [135] is an open source firmware based on Linux.
It is compatible with a wide variety of Wi-Fi routers and embedded systems [109].
However, not all Wi-Fi routers can be installed with DD-WRT. The list of supported Wi-
42

Fi routers and devices can be found on DD-WRT’s router database [109]. DD-WRT
provides many features which are not included in stock firmware such as dynamic DNS,
OpenVPN, Quality of service, SNMP, Telnetd, transmit power adjustment, bandwidth
monitoring, etc. In our testbed, we mainly use it to set the transmit power of the WR at
different levels for controlling the interference strength applied to the WSN traffic.
For the WSN part of our testbed, we developed our own software based on the open source
operating system, Contiki, and implemented it in our wireless sensor motes. In the following, we
first introduce Contiki and then describe the functionalities of our custom software.
Contiki is an open source, multi-tasking network operating system for resource limited hardware.
Contiki is designed to run in small amount of memory. A typical system enabled full IPv6
networking with sleepy routers and RPL routing needs less than 10k RAM and 30k ROM. The
Contiki kernel, on top of which applications can be dynamically loaded and unloaded at run time,
is event-driven.
Contiki provides a full IP network stack, with standard IP protocols such as UDP, TCP, and HTTP,
in addition to the new low-power standards such as 6LoWPAN, RPL, and CoAP. Contiki’s IPv6
stack is developed by Cisco and Cisco continues to contribute to make the stack more stable and
bring more features into it. Contiki’s IPv6 stack is fully certified under the IPv6 Ready Logo
program [40]. The Contiki has 5 layers, i.e., application layer, uIP layer, 6LoWPAN layer, MAC
and PHY layer. Application layer is for users to develop various applications that generate data or
receive TCP/IPv6 packets from other nodes. uIP layer is a simplified TCP/IPv6 layer, which,
43

however, keeps most functions of the normal TCP/IP protocol. uIP stack has been widely used in
embedded system products by hundreds of companies [136]. SICSlowpan is the 6LoWPAN
implementation in Contiki. It acts as an adaptation layer to make IPv6 packets suitable for passing
over IEEE 802.15.4 MAC layer. When an IPv6 packet is passed down to 6LoWPAN layer,
SICSlowpan fragments it and compresses its IPv6 header to fit them into IEEE 802.15.4 MAC
frames. And the SICSlowpan at the receiving end reassembles all the fragments from MAC layer
and decompresses the IPv6 header contained in them. Many useful tools including a Contiki
simulator can be found on Instant Contiki for the convenience of researchers and developers [39],
[40]. Interaction with a network of Contiki sensors can be achieved with a Web browser, a text-
based shell interface, or dedicated software that stores and displays collected sensor data. The text-
based shell interface is inspired by the Unix command shell but provides special commands for
sensor network interaction and sensing. Contiki and its programs are written in C programing
language to ease development. Instant Contiki is a pre-installed environment image which can be
run on virtual machine. Many useful tools including a Contiki simulator can be found on Instant
Contiki for the convenience of researchers and developers. In order to provide a long sensor
network lifetime, Contiki provides a software-based power profiling mechanism that keeps track
of the energy expenditure of each sensor node to control and reduce power consumption of each
sensor node. Being software-based, the mechanism allows power profiling at the network scale
without any additional hardware. Contiki’s power profiling mechanism is used both as a research
tool for experimental evaluation of sensor network protocols, and as a way to estimate the lifetime
of a network of sensors. Contiki provides a flash-based file system, called Coffee, for storing data
inside the sensor network. The file system allows multiple files to coexist on the same physical
44

on-board flash memory and has a performance that is close to the raw data throughput of the flash
chip [39] [40].
We designed and developed a periodical monitoring program at the application layer of Contiki
operating system. The developed program establishes a connection between client and server
motes, and generate packets at a rate or size as we specified. The data encapsulated in packets can
be either generated by the program itself or collected from sensors onboard.
The developed periodical monitoring application consists of TCP client and TCP server, which are
installed on client mote and sever mote, respectively. The client application has the following
major functions:
1. Monitoring data message generation. The client application generates monitoring data
messages at the rate and length we specified. This feature allows us to easily control the
characteristics of the generated messages and investigate the performance of WSN in
handling such messages.
2. Establishing TCP connection with TCP server. Once the client mote is powered up, it
initiates a TCP connection to the server mote and checks the status of its TCP connection
periodically. The time interval for checking the status of TCP connection can be changed
as needed.
3. Sending TCP/IPv6 packets over IEEE 802.15.4 WSN to server mote. If the TCP connection
is successfully established, the client mote will send TCP/IPv6 packets, which are
generated from the monitoring data messages, over IEEE 802.15.4 WSN to the server mote.
For each experiment, we set a maximum number to limit the total messages to be sent to
45

the server. If the number of messages sent out reaches the predefined maximum number,
the client program will stop the packet transmission.
4. Connection release and re-establishment. If the maximum number of TCP retries are
reached, which might be due to external interference, communication link failures or
unresponsive server motes, the client will release the current TCP connection and try to
reconnect with the server after a period of time.
5. Statistical functions. The client program calculates a number of values for performance
evaluation purpose. The values include the total number of packets that have been sent, the
number of retransmitted packets/overflow packets/ACKs/SYNs, the number of 6LoWPAN
fragments, the number of reconnections, total transmission time, and so on.
6. Sending and displaying results on laptop. The client program provides real-time monitoring
of the experiments. The packets sent to the server mote and all statistical results are
forwarded by the serial to USB chips to the connected laptop and displayed in the serial
terminal software, PUTTY.
The server application is running on the server mote and has the following functions:
1. Listening to the specified TCP port. The TCP server program listens to a specified TCP
port at startup and also checks the TCP connection status periodically. If the connection is
aborted/closed, the program will re-listen to the specified port.
2. Establish TCP connection with client mote. The TCP connection establishment consists of
a three-way handshake procedure. After receiving the SYN segment from the client mote,
the server program will respond with SYN ACK for establishing a new connection.
46

3. Receive TCP/IPv6 packets from client mote. After the TCP connection is established, if
the new incoming packet is a data packet, the server program will check if the packet size
is correct and packet content is duplicate. If both checks are passed, the server will accept
the packet.
4. Statistical functions. The server program is responsible for calculating and recording the
values of several performance evaluation metrics. The values include the number of
received packets, duplicate packets, valid packets, ACKs, SYNs, the number of connection
aborts, and so on.
5. Sending and displaying results on laptop. Similar to the client program, the server program
has the functionality of sending the information of received packets and statistical results
to the laptop and displaying them in PUTTY.
In order to investigate the performance of TCP/IPv6 over WSN under Wi-Fi interference, some
parameters of uIP stack can be conveniently adjusted in our program and the most significant ones
are summarized below:
• Max TCP retries: This parameter defines the maximum number of TCP retransmissions
allowed. After the number of retries reaches this number, the current TCP connection will
be dropped and the client mote will try to establish a new TCP connection with the server
mote.
• Periodic timer of uIP (Tpoll): This timer specifies the time interval to poll uIP layer. The uIP
process checks the buffer for data messages to be sent out and current uIP status every Tpoll
seconds.
47

• CLOCK_CONF_SECOND: This value defines the timer granularity. For higher data
generation rate, the granularity should be tuned smaller for a more accurate estimation of
RTT and RTO.
• Countdown timer: Every TCP connection has its own countdown timer to keep track of
how much time left before a retransmission timeout. For the countdown timer, every tick
is equal to the polling interval. This value needs to be optimally adjusted in order to allow
sufficient but not too much time for connection establishment or packet transmission.
• TCP retransmission back off timer: This timer controls the time spent on backoffs after a
TCP packet transmission failure. In order to avoid excessive retransmission delay and
buffer overflow, the value for this timer should be adjusted to suit for the data message
generation rate of the monitoring application.
The functional diagram of the client and server programs are shown in Figure 3.6.
To verify the functionality of our testbed and the generated traffic meet our expectation, a sniffer
is used to capture packets from either WLAN or WSN. The captured packets are then passed to
the Wireshark running on the laptop for analyzing the packet and traffic pattern.
Wireshark is an open-source network protocol analyzer [106]. It allows browsing the network
traffic interactively by providing functionalities including network monitoring, analysis,
debugging, and development of communications protocol. This software is running on the sniffing
laptop to capture the transmitted Wi-Fi or IEEE 802.15.4 packets (with IEEE 802.11 b/g/n Wi-Fi
48

adaptor or IEEE 802.15.4 sniffing mote) for analysis and validation of their packet length, inter-
arrival time, etc.
Layer Client Server
Application
uIP
6LoWPAN
MAC
PHY
Generate data Receive data
Establish connection
Release and re-establish connection
Send TCP packet over WSN
Send and display results on laptop
Listen specified port
Statistical Funtions
MAX TCP retries
Periodic timer
CLOCK_CONF_SECOND
Count down timer
Fragment/Reassemble
MAX MAC retries
CSMA/CA
TX power
RX sensitivity
Channel Selection
Functions in both Client and Server
Figure 3.7 Function diagram of the TCP client and server programs.
The real-time operation information, such as the status of motes and TCP connections, debug
information, packets sent and received, and other statistical results, are sent from motes to the
monitoring laptops via serial ports and displayed on PuTTY. PuTTY is a free implementation of
49

Telnet and SSH for Windows and Unix platforms, along with an xterm terminal emulator [107].
In our testbed, it is used as a serial terminal.
3.3 Testbed Setup
As described before, the testbed consists of an IEEE 802.11 WLAN part and an IEEE 802.15.4
WSN part. In the WLAN, a laptop with D-ITG sender program running is used as Wi-Fi network
traffic source and connected to one of the Ethernet ports of the WR via Ethernet cable. The D-ITG
sender program generates UDP traffic with different packet payload, packet rate and inter-
departure time (IDT) distribution, and with the receiving laptop as its destination node. The
generated UDP traffic is subsequently fed into the WR. The WR receives the Ethernet traffic and
forwards it to the destination laptop using Wi-Fi. Thus the WR is used in our testbed as Wi-Fi
traffic source, transmitting various interfering Wi-Fi traffic. In our experiments, by observing the
power spectrum calculated and displayed by the Areoflex 3252 spectrum analyzer, we confirmed
that the signal transmitted by the WR can be set and kept at a very stable power level. In the WSN,
the client mote is transmitting TCP/IPv6 traffic with different message sizes and generation rates
over IEEE 802.15.4 WSN to the server mote. Each mote is connected via USB cable to a laptop
for real-time monitoring of its operation. Figure 3.7 illustrates the testbed setup used for studying
the performance of TCP/IPv6 over WSN under Wi-Fi interference. The distance between WR and
the client mote is 1.2m and the distance between the Wi-Fi sink laptop and the WR is 0.5m. There
is a strong line-of-sight path between the client mote and server mote, with a distance of 1.5m. The
Wi-Fi router uses transmitting power of 50mW and generates IEEE 802.11g traffic; the
transmitting mote sets the power to 0 dBm when sending out its IEEE 802.15.4 packets. It is noted
that even though in our testbed setup, the distance between the motes or the distance between the
50

WR and the motes is set at fixed values, by changing the transmit power of motes and WR, we can
evaluate the packet transmission performance that is equivalent to varying distances between these
devices.
D-ITG receiver laptopLaptop with sniffer
Laptop connected to server mote
Laptop connected to client mote
Ethernet connection
Wi-Fi connection
IEEE 802.15.4 wireless connections
USB to serialconnection
D-ITG sender laptop
1.5m 1.2m
0.5m
Wireless Router
Figure 3.8 Testbed setup for studying the performance of TCP/IPv6 over IEEE 802.15.4 WSN
under collocated Wi-Fi interference.
By scanning all the Wi-Fi channels, we determine that IEEE 802.15.4 channel 20 (2.449-
2.451GHz) is not “contaminated” by interference from any other Wi-Fi APs in the building. To
minimize the interference from other coexisting WLANs, IEEE 802.15.4 channel 20 is used as our
WSN operating channel. In addition, since IEEE 802.15.4 channel 20 is located within the range
of Wi-Fi’s channel 9 (2.441-2.463GHz) where the power spectral density is the strongest, Wi-Fi
51

channel 9 is used with the WR of our testbed to investigate the WSN packet transmission
performance in the worst case scenario.
2412 MHz
2 MHz
2452 MHz
ZigBee Ch20
2450 MHz
WLAN Channel 922 MHz
ZigBee
ZigBee Ch26 2 MHz
ZigBee Ch16 2 MHz
Figure 3.9 Bandwidth allocation of WLAN and IEEE 802.15.4 WSN at 2.4 GHz band.
As mentioned before, sniffer laptop is used to verify the operation of the testbed and whether the
network traffic is generated as specified. Figures 3.9 – 3.13 shows some typical packet exchanges
captured from the IEEE 802.15.4 WSN. The packet shown in Figure 3.9 is the SYN message sent
by client mote to the server mote for requesting a new TCP connection. In our testbed, the WSN
network prefix is set to aaaa::/64 and the client MAC address and server MAC address are
02:00:00:ff:fe:00:00:02 and 02:00:00:ff:fe:00:00:01 respectively. The IPv6 address is derived
from the combination of network prefix and MAC. And the 7th bit of MAC address is inverted in
the combination. It can be seen from this figure that the packet is recognized by Wireshark as a
TCP packet with source IPv6 address of aaaa::ff:fe00:02 and port of 1025, and destination address
of aaaa::ff:fe00:01and port of 1010. In the next figure, Figure 3.10, it can be seen that TCP server
listens to the port 1010 and successfully received the SYN packet (SYN message from the client
mote has a destination port number same as the port number the server mote is listening to). The
52

server then returns a SYN ACK packet with source port of 1010 and destination port of 1025.
Once the client mote receives the SYN ACK, it sends an ACK to the server mote, which is shown
in Figure 3.11. If this ACK is received by the server mote, the connection is established.
Figure 3.10 SYN message from client mote to server mote for establishing TCP connection.
53

Figure 3.11 SYN ACK message from server mote to client mote.
Figure 3.12 Client mote sends an ACK to acknowledge SYN ACK message from server mote.
54

The packet exchange process of TCP connection establishment is further explained as follows.
The client sends out a SYN message with a sequence number of 4294967266 (the sequence number
could be any value between 0 and 232), as shown in Figure 3.12. And the acknowledgement number
is zero, as there is not yet any outstanding packet to acknowledge.
Then the server responds to the client with a “SYN, ACK” message, shown in Figure 3.10, with a
sequence number of zero, as this is its first packet in this TCP session, and an acknowledgement
number of 4294967267. The acknowledgement number is set to 4294967267 to indicate the receipt
of the client’s SYN in the packet shown in Figure 3.12. It is noted that the acknowledgement
number has been increased by 1 although no payload data has yet been sent by the client. This is
because the presence of the SYN flag in the received packet triggers an increase of 1 in the
sequence. This does not interfere with the accounting of payload data, because packets with the
SYN flag set do not carry any payload.
After receiving the “SYN, ACK” from the server mote, the client responds to the server with
another ACK message. As in Figure 3.11, this message has an acknowledgement number of one,
since the “SYN, ACK” message has a sequence number of zero (see Figure 3.10). The client
includes its own sequence number of 4294967267 (incremented from 4294967266 of the SYN
packet shown in Figure 3.9) in this ACK message. At this point, the establishment of TCP
connection is done. The client can start to send data to the server.
55

Figures 3.9 – 3.11 illustrate the packets exchanged between client mote and server mote during
the process of three-way handshake for establishing a TCP connection. Figure 3.12 shows the
structure of a captured data message packet. The message is the 270th message from the client
which has 30 bytes content “Hello 00270 from the client” (including a “\r” for return and a “\n”
for line feed). It is encapsulated in a TCP/IPv6 packet and transmitted over IEEE 802.15.4 WSN.
From the Wireshark captured information, the first thing we can see is the 21-byte MAC header.
The 21-byte MAC header consists of frame control field, PAN ID, source and destination MAC
address. We can see from Figure 3.12 this header starts with 0xcc61, which means it’s a data type
frame. 0x77 is the sequence number 119 in hexadecimal format. And the following 16-byte is the
destination and source MAC address: 02:00:00ff:fe:0000:01 and 02:00:00ff:fe:0000:01. Next to
the MAC header is the 6LoWPAN header, the details of which is shown in Figure 3.13. As it can
be seen at the bottom part (packet bytes) of the captured data packet, the IP header is compressed
into the 6LoWPAN header, which is followed by the 20-byte TCP header and then the 30-byte
message. The upper part of Figure 3.12 shows the details of the packet headers.
The 6LoWPAN header consists of IPHC header, next header, source and destination IPv6
addresses, which is 35-byte in total. Normal IPv6 header consists of 4-bit for version, 1-byte for
class of traffic, 20-bit for flow label, 2-byte for payload length, 1-byte for next header, 1-byte for
hop limit and 16-byte for source and destination addresses. That is 40-byte in total for an IPv6
header if no optional header is included. In 6LoWPAN, LOWPAN_IPHC encoding is used to
reduce header size. As we can see in Figure 3.13 the first 3-bit “011” in IPHC header tells us it’s
an IPHC compressed header. Next 2-bit is TF (traffic class and flow label). In this example, the
value of it is “11”, which means we elided both traffic class and flow label. The next field in IPHC
56

header is NH (Next header). When the value of NH is 1, the next header is compressed and encoded
using LOWPAN_NHC. In Figure 3.13, the NH field equals 0 in this case because there is only
UDP compression specified in LOWPAN_NHC, and our experiments are over TCP connections.
The field that follows NH is HLIM, which defines the hop limit. The value shown in Figure 3.13
is “10”, indicating a hop limit of 64. Compared to the 1-byte hop limit field in IPv6 header, setting
HLIM field to “10” saves 6 bits. The 128-bit destination and source addresses are carried inline as
shown in Figure 3.8. IPv6 header can be decompressed from 6LoWPAN header, the length of it is
40-byte in our case (see Figure 3.12). Depending on how you configure the mote to compress the
IPv6 address and which transport layer protocol (TCP/UDP) it uses, it can achieve different
compression rate. Thus, the 6LoWPAN header length can vary.
57

Frame control fieldSequence Number
Destination PANDestination MAC addressSource MAC address
FCF
Sequence Number
Destination PAN Destination Address
Source Address
Figure 3.13 Data message packet.
58

21-byte MAC header 2-byte IPHC header Next header
Client addressServer address20-byte TCP header
The rest are data
Figure 3.14 Data message 6LoWPAN header.
59

Chapter 4 Implementation and Optimization of High Packet Rate
Periodic Monitoring Program using TCP over IEEE 802.15.4
WSN
4.1 Implementation of Periodic Monitoring Application using TCP over IEEE
802.15.4 WSN
To study the performance of sending periodic monitoring/sensing data using TCP over IEEE
802.15.4 WSN, we developed custom firmware programs that run on our test boards of both client
and server motes. The periodic monitoring/sensing application consists of TCP client and TCP
server, which are installed on the client mote and sever mote respectively.
Once the client mote is powered up, the periodic monitoring program on the client mote first
establishes TCP connection with the receiver program on the server mote. To do this, the client
mote sends a segment, SYN, to the receiving mote. The receiving mote returns a segment, SYN
ACK, to acknowledge the successful receipt of the SYN segment. The client mote sends another
ACK segment, then proceeds to send the data. The process of TCP connection establishment is
illustrated in Figure 4.1.
60

client server
Figure 4.1 Process of TCP connection establishment.
After establishing the TCP connection between client mote and server mote, the client program
generates sensing data at constant intervals. The generated data enters the buffer of the client mote
if the buffer has sufficient space to store the data. If the buffer is full, the oldest data segment in
the buffer will be dropped and the new data will be stored at the end of the buffer.
As introduced in Chapter 3, Contiki is the embedded operating system used in the WSN motes.
Contiki provides a full IP network stack, with standard IP protocols such as UDP, TCP, and HTTP,
in addition to the new low-power standards such as 6LoWPAN, RPL, and CoAP. Contiki’s IPv6
stack is developed by Cisco and Cisco continues to contribute to make the stack more stable and
bring more features into it. Contiki’s IPv6 stack is fully certified under the IPv6 Ready Logo
program [40]. Contiki has a simplified TCP/IPv6 layer called uIP, which, however, keeps most
61

functions of the normal TCP/IP protocol. uIP stack has been widely used in embedded system
products by hundreds of companies [136]. The developed periodic monitoring program utilizes the
uIP protocol and corresponding functions implemented in Contiki to realize the data transmission
functionality. The uIP process checks the buffer for data to be sent out and current uIP status every
Tpoll seconds, which is a preset value of a periodic timer of uIP. If uIP status is “Poll” and there
is data in the buffer to be sent, the program proceeds to send the first data segment in the buffer.
Different uIP status triggers different actions from client TCP program. The flowchart of TCP
client program is depicted in Figure 4.2.
As shown in Figure 4.2, the TCP client program starts with initiating uIP. After initialization, the
program tries to establish a TCP connection to the TCP server and checks if the connection is
successfully established. If not, the program will go back and try to re-establish the connection
until the link is successfully established. If the connection establishment check returns a TURE,
the program will proceed with two sub-processes, illustrated as two branches in Figure 4.2. The
branch on the right side is a background process performing operations on the client side TCP
buffer. If there is data in the buffer for transmission, it checks the uIP status, the value of which is
determined by various events such as successful packet transmission, packet loss, TCP
disconnected and so on. The uIP process checks and updates current uIP status every Tpoll seconds
and therefore the buffer is checked every Tpoll seconds. According to different uIP status, the
background process will take different actions, such as retransmitting current packet, sending next
packet, or posting an event to notify the application that the TCP connection is disconnected. The
sub-process on the left branch is for data generation. After the data is generated, the sub-process
checks the buffer. If the buffer is full, the sub-process will clear the oldest data in the buffer and
62

accepts the new data into the buffer. Otherwise, the newly generated data will directly enter the
buffer. Then the sub-process checks the TCP connection status. If the connection is still established,
the sub-process will wait 𝑇𝑇𝑑𝑑𝑑𝑑𝑑𝑑𝑑𝑑_𝑙𝑙𝑔𝑔𝑔𝑔 seconds and then generate a new data. If the connection is
aborted, the sub-process will try to re-establish the TCP connection.
Initiate uIP
(Re-) Establish TCP connection
Generate data
Drop the oldest packet
in buffer
Wait Tdata_gen
TCP connection established?
Buffer Full?
TCP disconnected
Check Buffer
Set uIP Poll Timer
Check Buffer
TCP Connected?
New data entering buffer
uIP status?
Clear current packet
Send next packet
Send current packet
Wait Tpoll
CloseAbortRetransmission TimeoutACK Poll
No
Yes
NoYes
Yes
No
Figure 4.2 Flowchart of TCP client program.
63

For sending data segment in the buffer, the data arrives at the transport layer, where it is
encapsulated into transport protocol data unit. The TCP data segment is passed down to the IPv6
layer, where the IPv6 protocol handles the segment by formatting it into IP datagrams. The IP
datagram will then be processed at the 6LoWPAN adaptation layer, prepared for delivery over
IEEE 802.15.4 WSN. The following figure shows the process of packet encapsulation.
application header user data
user data
TCP header application data
IP header TCP header application data
IEEE802.15.4 header
IP header TCP headerIEEE802.15.4
trailerapplication data
Application program
Operating system
application
TCP
IP
IEEE 802.15.4
TCP segment
6LoWPAN fragment
IEEE 802.15.4 frame
6LoWPAN header TCP header application data 6LoWPAN
IP datagram
Figure 4.3 Packet encapsulation process.
The TCP server, as shown in Figure 4.4, will listen to a specified TCP port at startup. The uIP
process checks the receiver buffer every Tpoll seconds. If there is data segment arrived, it first
verifies if data segment is for the listened port. After that, it will check to see what type of data
64

segment it receives. For SYN segment that is requesting a new TCP connection, the server program
will respond with SYN ACK for establishing a new connection. Since the resource-constrained
sensor motes can support a limited number of TCP connections, the server program needs to check
if there is sufficient resource for establishing a new TCP connection before sending SYN ACK
back. If the data segment is RESET, which indicates a request from client mote to close the current
TCP connection, the server program will then terminate the current TCP connection. If the data
segment is new data, the server program checks if the packet size is correct and the packet content
is duplicate. If both checks are passed, the packet is successfully transmitted to the server.
Otherwise, the packet will be abandoned. The results are printed to serial terminal for display.
It is noted that both flowcharts for the client and server programs of our periodic monitoring
application only illustrate essential functions and process without showing all the details. In
addition, statistic functionalities are implemented on both client and server programs for getting
performance evaluation results, which will be discussed later in section 4.3.
65

Initiate uIP
Listen Port
valid
Check Receiver Buffer
Sync? New data? Reset?
Spare connection?
UIP_SYN_RCVD, send SYN ACK
Check Packet sIze and content
Print received packet on
terminal and update statistics
Abandon packet
damaged
ACK received?
TCP connection established
Close current TCP connection
Destination port of incoming packet = listen port?
Wait t
Abandon packet
Yes
YesYes Yes
Yes
No
Yes
No
No
Figure 4.4 Flowchart of TCP server program.
66

4.2 Optimization of the Periodic Monitoring Application using TCP over IEEE
802.15.4 WSN
In our experimental performance evaluation of the developed periodic monitoring application
using TCP over IEEE 802.15.4 WSN, significant packet losses were observed when the data
segment generation rate was relatively high (e.g. 10 segments/second). With a close examination
of the uIP implementation in Contiki and analysis of acquired experimental results, it is determined
that a large amount of packet loss is due to the buffer overflow caused by the very slow packet
transmission.
The uIP in Contiki uses a simple “stop and wait” protocol. After transmitting one packet, the
transmitting mote waits for an ACK from the receiving mote before transmitting the next one. If
the transmitting mote doesn’t receive ACK for previous sent packet after a certain period of time,
the transmitting mote times out and retransmits that packet again. As it can be seen from Figure
4.2, the maximum TCP packet transmission rate is limited by the value of a periodic timer of uIP
(Tpoll), which controls the interval of checking the buffer and uIP status. The default Tpoll value of
0.5s is good for networks that have high data transmission speed and larger packet sizes because
the data stored in the buffer can be cleared out very fast when there is a chance for data transmission.
And obviously it is also good for network with very low data generation rate. However, it is not
suitable for applications with high data generation rate running on IEEE 802.15.4 WSN which has
a relatively low data rate of 250kbps and small packets with the maximum MAC frame size of 127
bytes. When Tpoll is larger than the data generation interval or the external interference prolongs
the data transmission, the data of the monitoring application, which is generated at a constant rate,
67

could eventually fill up the buffer and overflow, leading to packet losses. Although setting a small
value for the timer will put more stress on the processor and increase the power consumption of
the motes, such cost can be offset by the significantly reduced packet loss. Based on this
observation, we propose to reduce the value of Tpoll to support higher data generation rate of the
monitoring application. In Contiki, a clock tick is defined as 1/128 second. As an example in our
experiments, we set Tpoll to be 5 ticks, i.e., around 40ms, so that the periodic monitoring application
can support a fairly high packet generation rate of 20 packets/second.
It is noted that several other timers are assigned initial values as multiples of the above-mentioned
periodic timer, Tpoll, such as RTO values for connection/reconnection requests or packet
transmission/retransmission time out, and so on. Once the value of Tpoll is set to be smaller, all pre-
set initial timer values should be reconsidered. Each TCP connection has its own countdown timer
to keep track of how much time left before a retransmission timeout, which is assigned a value of
multiples of Tpoll. After each polling cycle, the countdown timer is reduced by 1. At the stage of
establishing a new TCP connection, the initial value of the countdown timer that control the
timeout of the connection request SYN segment should be set to be long enough to allow the server
sufficient time to accept connection request from the client and send back SYN ACK. If the value
is too small, the TCP connection request could experience frequent timeouts, resulting in failures
of establishing TCP connection. After the connection is established, the initial value of the
countdown timer is set to be an RTO value derived from the measured value of RTT, to ensure a
timely packet retransmission without waiting for ACK for too long and resulting in more data
overflow in the buffer before timeout.
68

It is observed in our experiments that the considerable amount of time consumed by both TCP
retransmissions and timer backoffs also resulted in packet drops due to buffer overflow. For
improving performance under high data generation rate, the maximum TCP retransmission retries
is set to one and the calculation of timer backoffs is modified. In uIP, backoff time will be doubled
each time until it reaches 16 RTO and the RTO has a fixed value of 3Tpoll, i.e., 1.5s. In our
implementation, we reduce the backoff time to be RTO with the latest updated value from RTT
measurement. When the timer counts down to zero, retransmission is triggered.
In addition to the timers, the implementation of TCP connection release and reconnection in uIP
should also be improved. In our experiments, when the client mote encountered heavy interference
that caused packet losses, TCP connection dropped (timeout or aborted) from time to time after
the TCP retries reached a pre-set maximum value. For closing the current TCP connection, the
client mote sends a RST segment to the server mote. When the server mote receives RST, the
current TCP connection will be closed successfully. This process is illustrated in Figure 4.5. In
order to maintain data transmission, the periodic monitoring program in the client mote will try to
reconnect to the server mote until a new TCP connection is established. The client mote sends a
SYN segment to the server mote, requesting a new TCP connection. After receiving the SYN, the
server mote will proceed to establish a new connection with the client mote as described before.
However, if the RST is lost because of the interference, the current TCP connection will remain
active in the server mote. Our experiments showed that these abandoned but still active TCP
connections will eventually exhaust the memory resource in the server mote, and then the server
will reject all TCP connection requests from the client mote. To solve this problem, we propose to
reuse the sending port of the dropped TCP connection in the client mote when initiating a new
69

TCP connection with the server mote after the current TCP connection being disconnected. When
using the same port for requesting a new TCP connection, if the TCP connection is still active in
the server mote, the server will find the newly arrived SYN segment matches an existing active
TCP connection, then treat the SYN as an out-of-order SYN and respond with a SYN ACK. Thus,
there won’t be unnecessary establishment of new TCP connections and abandoned active TCP
connections. There are more advantages to reuse the sending port when requesting a new TCP
connection from the server mote. As shown in Figure 4.6, the three-way handshake process for
establishing TCP connection can encounter interruption under interference. When reusing the
sending port, even when the ACK from the client mote fails to reach the server mote, the data
transmission can still proceed using the existing TCP connection. With such modifications, we
observed much less reconnections, packet losses and delay.
client server
RetransmissionTIMEOUT
TCP connection CLOSED
TCP reconnect
TCP connection established
Figure 4.5 Process of termination and reconnection of a TCP connection.
70
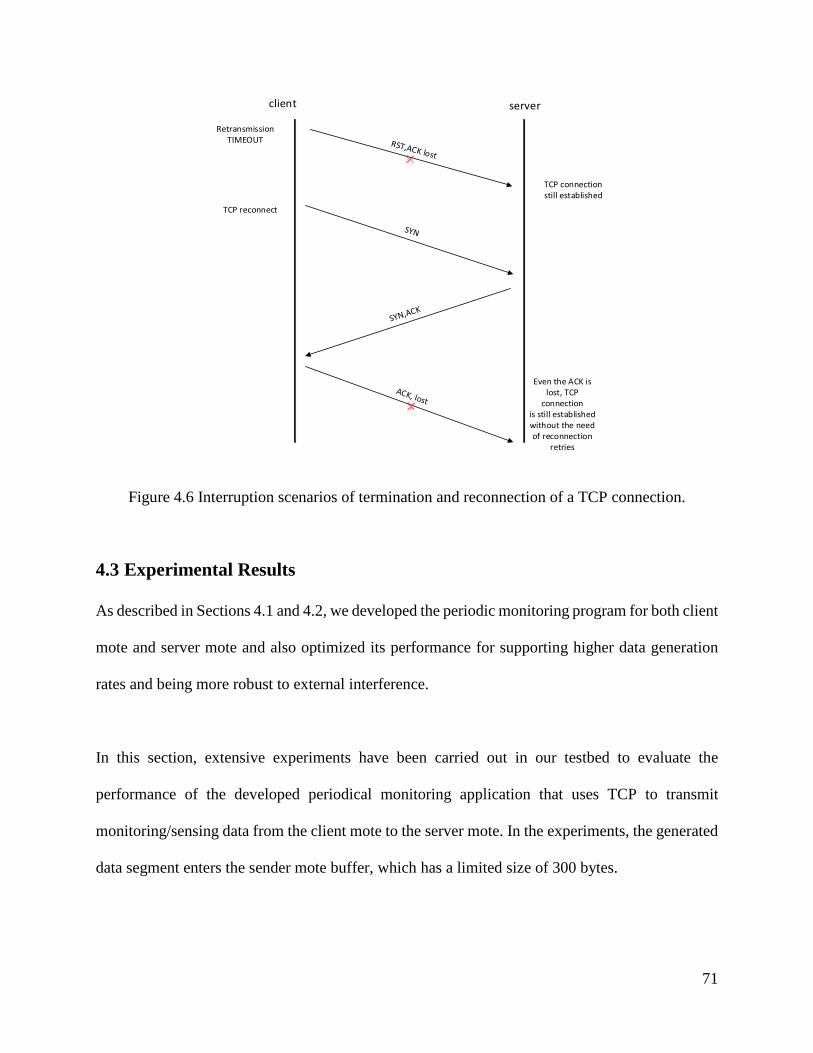
client server
RetransmissionTIMEOUT
TCP connection still established
TCP reconnect
Even the ACK is lost, TCP
connectionis still established without the need of reconnection
retries
Figure 4.6 Interruption scenarios of termination and reconnection of a TCP connection.
4.3 Experimental Results
As described in Sections 4.1 and 4.2, we developed the periodic monitoring program for both client
mote and server mote and also optimized its performance for supporting higher data generation
rates and being more robust to external interference.
In this section, extensive experiments have been carried out in our testbed to evaluate the
performance of the developed periodical monitoring application that uses TCP to transmit
monitoring/sensing data from the client mote to the server mote. In the experiments, the generated
data segment enters the sender mote buffer, which has a limited size of 300 bytes.
71

There could be some other factors in our testing environment such as noise and some hidden
interference sources that cause packet loss in the experiments. In order to evaluate the influence of
background noise and other interference sources on the performance of WSN data transmission
in our lab, we performed a set of experiments without our custom defined Wi-Fi
interference using the testbed shown in Figure 3.8. In all the experiments, we observed no packet
loss, which confirms the performance degradation in the following experiments is mainly due to
our custom defined Wi-Fi interference.
To compare and show the improved performance after optimization, we first conducted
experiments to evaluate the performance of periodical monitoring application implemented using
the stock uIP functions in Contiki without modification as discussed in Section 4.2. It was observed
that when the client mote suffered from collocated Wi-Fi interference, WSN packet transmissions
could fail from time to time, which sometimes resulted in TCP connection dropped after the TCP
packet retransmission reached a pre-set maximum value. Without the proposed method to address
the issue of lost RST packets because of interference, the abandoned but still active TCP
connections in the server mote quickly exhausted the memory resource. Consequently, the server
mote rejected all subsequent TCP connection requests from the client mote and the experiments
stopped there and could not go through. Another interesting observation is that even before the
experiments came to a stop, the reconnection time was visibly longer than that of the optimized
program. There are several reasons behind such performance improvement. The longer Tpoll used
in the stock uIP functions prolong the packet exchanges during the three-way handshake process,
especially when packet retransmissions are involved. The proposed method of reusing previous
active TCP connection and ports can avoid unnecessary operations for abandoning active TCP
72

connections and establishing new ones, and effectively deal with the possible loss of ACKs from
the client mote.
Furthermore, to make fair comparison, we implemented the proposed method for dealing with
TCP connection drops and re-establishments, and carried out experiments to evaluate the
performance of the periodical monitoring program using stock uIP functions. This time the
experiments were able to complete without stopping in the middle. After each TCP connection
drop, the client mote was able to re-establish TCP connection with the server mote and continued
the data transmissions. In the first set of experiments, the D-ITG traffic generator running on the
laptop generates interfering UDP traffic with packet payload size of 1000 bytes and packet rate of
1000 packets/second, which is then converted to IEEE 802.11g Wi-Fi interference by WR. When
the client mote was sending 30-byte data segment at 50ms interval, the packet loss rate reached
over 80%, which obviously is too high for the application to be useful. We then reduced the Wi-
Fi interference in the second set of experiments to have payload size of 500 bytes and packet rate
of 500 packets/second. When the client mote was using the same data generation rate, i.e., 30-byte
data segment at 50ms interval, the packet loss rate was still very high at over 60%. When the packet
generation rate of client mote was reduced to 10 packets/second, the packet loss rate was over 45%.
It is noted that the Wi-Fi interference is not very heavy in these experiments, but the packet loss
rates are too high to make the application useful. After applying all the optimizations presented in
Section 4.2, the periodic monitoring application achieved significantly better performance under
much heavier Wi-Fi interference. The following performance evaluation experiments were carried
out under heavier Wi-Fi interference and the experimental results demonstrated clear performance
improvements.
73

In Figures 4.7 – 4.10, the D-ITG traffic generator running on the laptop generates interfering UDP
traffic with packet payload size of 1000 bytes and different packet rates from 1800 to 2200
packets/second. The client mote generates 30-byte data segment at 50ms interval. Under different
Wi-Fi interference, WSNs performance was evaluated in terms of PLR, the number of
reconnections, the total time for transmitting the generated 10000 data segments, and the
throughput.
Figure 4.7 WSNs performance in terms of PLR under interfering traffic with different packet rates.
3.59%6.43%
8.89%
13.80%
25.18%
0%
5%
10%
15%
20%
25%
30%
1800 1900 2000 2100 2200
Pack
et lo
st ra
te
Packet per second
74
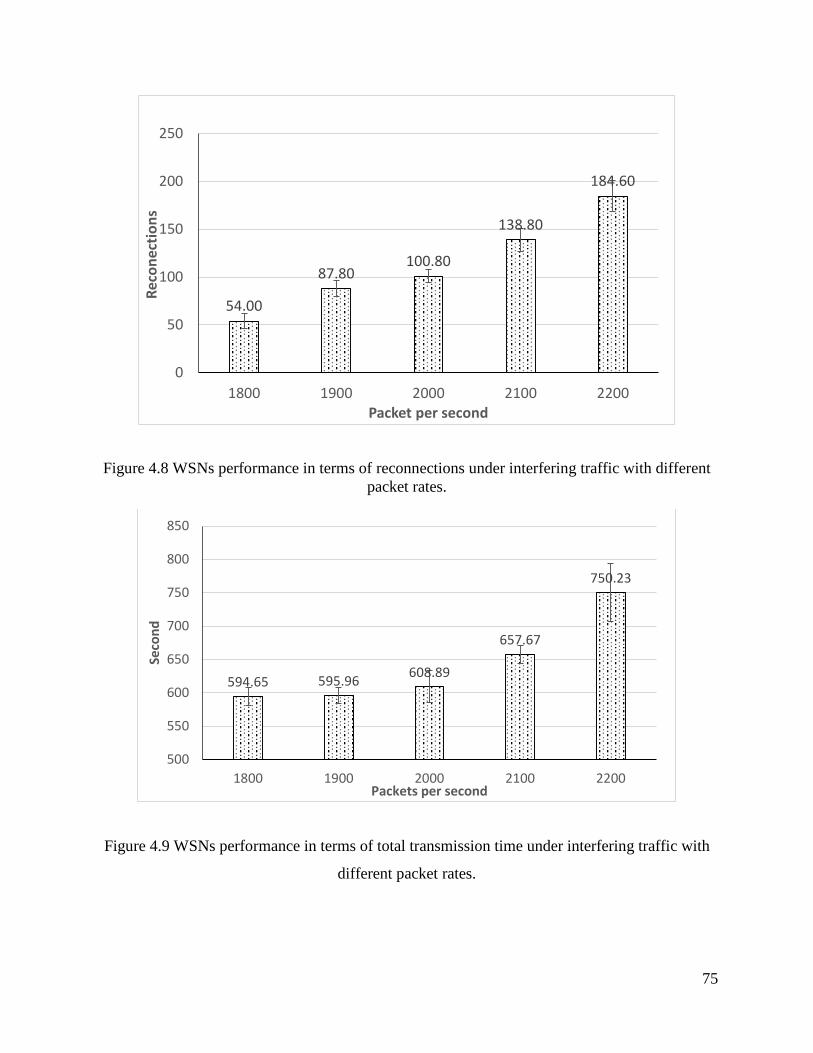
Figure 4.8 WSNs performance in terms of reconnections under interfering traffic with different packet rates.
Figure 4.9 WSNs performance in terms of total transmission time under interfering traffic with
different packet rates.
54.00
87.80100.80
138.80
184.60
0
50
100
150
200
250
1800 1900 2000 2100 2200
Reco
nect
ions
Packet per second
594.65 595.96 608.89
657.67
750.23
500
550
600
650
700
750
800
850
1800 1900 2000 2100 2200
Seco
nd
Packets per second
75

Figure 4.10 WSNs performance in terms of throughput under interfering traffic with different
packet rates.
The newly developed periodical monitoring program works as expected when experiencing
different Wi-Fi interference. The client mote sends TCP packets to the server mote continuously
until the end of the experiments. When the TCP connection drops, the client mote will re-establish
the connection. It can be seen in Figure 4.7, the PLR is increasing very fast when the interference
is getting heavier. As mentioned in Section 4.2, the TCP connection for the periodic monitoring
program will be dropped when the TCP retries reached a pre-set maximum value. Once TCP
disconnects, the program will try to re-establish the TCP connection and continue the data
transmission. Figure 4.8 shows the number of reconnections under different interference. It is
noted that the increasing number of reconnections causes longer transmission delay and larger
amount of packet loss. Obviously, the interference will delay data transmission and cause more
packet retransmission. Therefore, in Figure 4.8, we observed longer transmission time. Figure 4.9
shows that the interference also has significant impact on system throughput. When the
interference gets heavier, the throughput of WSN substantially reduced.
488.66 474.42452.58
397.64
304.39
200
250
300
350
400
450
500
550
1800 1900 2000 2100 2200
Byte
per
seco
nd
Packet per second
76
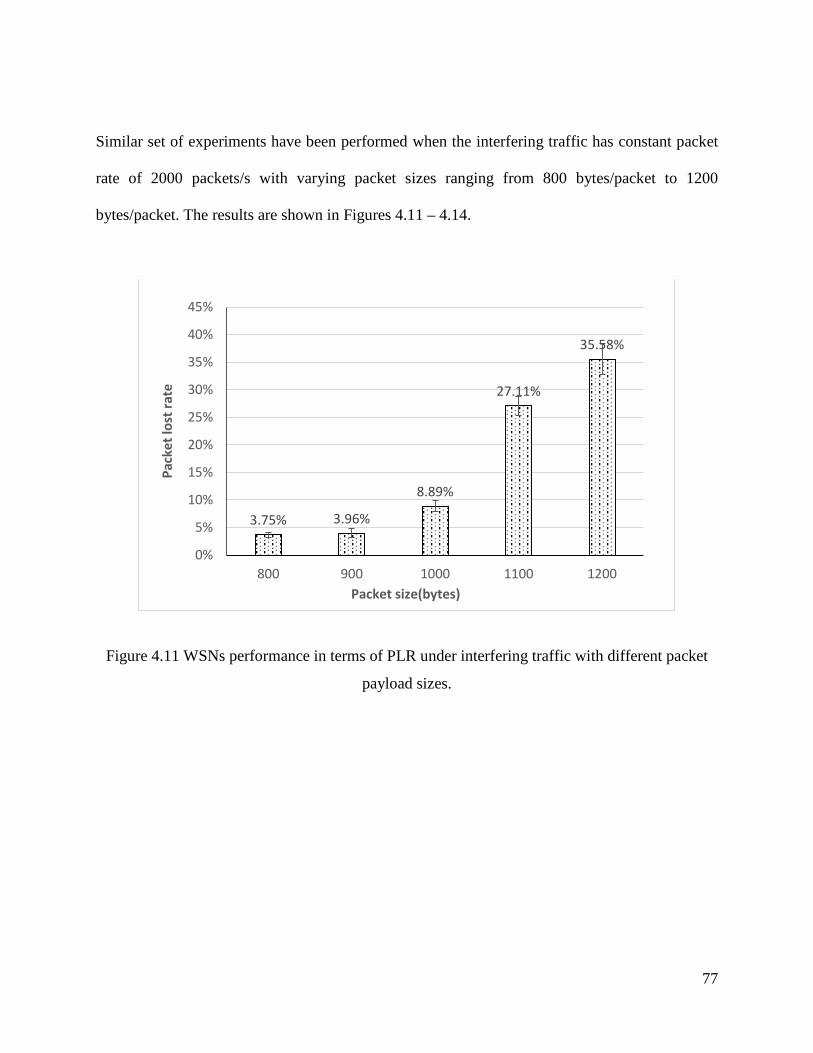
Similar set of experiments have been performed when the interfering traffic has constant packet
rate of 2000 packets/s with varying packet sizes ranging from 800 bytes/packet to 1200
bytes/packet. The results are shown in Figures 4.11 – 4.14.
Figure 4.11 WSNs performance in terms of PLR under interfering traffic with different packet
payload sizes.
3.75% 3.96%
8.89%
27.11%
35.58%
0%
5%
10%
15%
20%
25%
30%
35%
40%
45%
800 900 1000 1100 1200
Pack
et lo
st ra
te
Packet size(bytes)
77

Figure 4.12 WSNs performance in terms of reconnections under interfering traffic with different
packet payload sizes.
Figure 4.13 WSNs performance in terms of total transmission time under interfering traffic with
different packet payload sizes.
65.20 67.00100.80
192.40222.60
0
50
100
150
200
250
300
800 900 1000 1100 1200
Reco
nect
ions
Packet size(bytes)
596.09611.03 608.89
763.77788.62
500
550
600
650
700
750
800
850
900
800 900 1000 1100 1200
Seco
nd
Packet size(bytes)
78

Figure 4.14 WSNs performance in terms of throughput under interfering traffic with different
packet payload sizes.
In the following experiments, we randomized the distributions of packet payload sizes or packet
rates in order to study the performance of the developed periodic monitoring application program
under varying Wi-Fi interference. In Figures 4.15 – 4. 18, the packets generated by D-ITG have
the same payload size of 1200 bytes and the IDT following four different random distributions,
i.e., Uniform (Case 1), Exponential (Case 2), Normal (Case 3), and Poisson (Case 4) with mean
arrival rate of 2000 packets/second. More specifically, Uniform distributed traffic has a packet rate
between 1800 to 2200 packets/second and the IDT of the Normal distribution has a standard
deviation of 0.1 ms.
487.12 474.08452.58
291.22
250.22
200
250
300
350
400
450
500
550
1800 1900 2000 2100 2200
Byte
per
seco
nd
Packet size(bytes)
79

Figure 4.15 WSNs performance in terms of PLR under interfering traffic with packet arrival
rates following four different random distributions.
Figure 4.16 WSNs performance in terms of reconnections under interfering traffic with packet
arrival rates following four different random distributions
.
30.02% 27.55% 26.38%
55.65%
0%
10%
20%
30%
40%
50%
60%
70%
1 2 3 4
Pack
et lo
st ra
te
Case
217.40200.40
168.00
317.40
0
50
100
150
200
250
300
350
1 2 3 4
Reco
nnec
tions
Case
80

Figure 4.17 WSNs performance in terms of total time under interfering traffic with packet arrival
rates following four different random distributions.
Figure 4.18 WSNs performance in terms of throughput under interfering traffic with packet
arrival rates following four different random distributions.
For the tests shown in Figures 4.19 – 4.22, the packets generated by D-ITG have the same payload
rate of 2000 packets/s and the UDP packet’s payload size are following four different random
distributions, i.e., Uniform (Case 5), Exponential (Case 6), Normal (Case 7), and Poisson (Case
746.81 750.48 692.04
933.83
0
200
400
600
800
1000
1200
1 2 3 4
Tota
l tim
e (s
econ
ds)
Case
287.02 295.00323.83
142.25
0
50
100
150
200
250
300
350
1 2 3 4
Aver
age
thro
ugpu
t (b
ytes
per
seco
nd)
Case
81

8), with mean payload size of 1200 bytes. For the Uniform distribution, the UDP packet payload
size takes values between 1000 and 1400 bytes. Interfering UDP traffic with Normal distribution
has an expected payload size of 1200 bytes and standard deviation of 100 bytes.
The developed periodical monitoring program is quite stable and can handle varying Wi-Fi
interference.
Figure 4.19 WSNs performance in terms of PLR under interfering UDP traffic with payload
sizes following four different random distributions.
50.08%
67.65%
47.55% 46.43%
0%
10%
20%
30%
40%
50%
60%
70%
80%
1 2 3 4
Pack
et lo
st ra
te
Case
82

Figure 4.20 WSNs performance in terms of reconnections under interfering UDP traffic with
payload sizes following four different random distributions.
Figure 4.21 WSNs performance in terms of total time under interfering UDP traffic with payload
sizes following four different random distributions.
289.80
335.80
279.20 275.40
0
50
100
150
200
250
300
350
400
1 2 3 4
Reco
nnec
tions
Case
933.831,076.09
863.54 867.03
0
200
400
600
800
1000
1200
1400
1 2 3 4
Tora
l tim
e (s
econ
ds)
Case
83

Figure 4.22 WSNs performance in terms of average throughput under interfering UDP traffic
with payload sizes following four different random distributions.
165.98
96.34
188.25 191.20
0
50
100
150
200
250
1 2 3 4
Aver
age
thro
ugpu
t (by
tes p
er se
cond
)
Case
84

Chapter 5 Conclusions and Future Work
In this research, we developed and implemented an experimental testbed to study the performance
of TCP/IPv6 over IEEE 802.15.4 WSN when subjected to interference from the collocated IEEE
802.11g WLAN. An application that uses TCP/IPv6 to transmit monitoring/sensing data messages
periodically from the client mote to the server mote over IEEE 802.15.4 WSN has been developed.
Furthermore, several important parameters and factors that can affect the performance of
applications using TCP/IPv6 over WSN have been identified and optimized. The performance of
the developed and optimized periodical monitoring/sensing application has been evaluated through
extensive experiments in the testbed.
5.1 Concluding Remarks
Throughout this research, we have performed extensive experiments to study the performance of
TCP/IPv6 over IEEE 802.15.4 WSN under Wi-Fi interference and developed new performance
improvement techniques. The major contributions of the thesis are:
1. We successfully developed and implemented a testbed that is suitable for carrying out
research on TCP/IPv6 over WSN in presence of Wi-Fi or other RF interference. The testbed
also enables efficient performance evaluation of various newly proposed and developed
performance improvement techniques.
2. The developed hardware boards, custom firmware and application provide flexible
programming platform and software framework that can be used for future research and
development in Wireless Sensor Network techniques or applications using TCP/IPv6 over
IEEE 802.15.4 WSN.
85

3. A Wireless Sensor Network application that sends monitoring or sensing messages
periodically using TCP/IPv6 over IEEE 802.15.4 WSN has been developed based on the
Contiki operating system. This application consists of TCP client and server programs,
running on client mote and server mote, respectively. This periodical monitoring
application has features including flexibly adjustable parameters and various statistical
functions, which are very useful for research or as prototype for the development and
implementation of real world applications.
4. In order to support Wireless Sensor Network applications with higher data generation rate,
we identified several weaknesses of the TCP/IPv6 implementation in the low rate and
resource limited WSN and proposed to optimize the values of several key parameters. Our
experimental results verified the stable operations of the developed application with
optimized parameter values and provided performance evaluation.
5.2 Future Work
From the contributions and conclusions of this thesis summarized in Section 5.1, it is clear that
development of technology for improving the TCP/IPv6 packet transmission performance in an
IEEE 802.15.4 system subjected to severe interference from collocated Wi-Fi systems is a very
challenging task. However, the establishment of our testbed and the improved understanding of
the interworking between different layers of TCP/IP over WSN protocol stack, provided useful
knowledge for us to pursuit a number of meaningful topics for future research, a few of which are
suggested below.
1. Design and development of a more versatile testbed of larger scale.
86

The testbed developed in this research, although still primitive, lays a good foundation for
us to extend our work and design, develop and deploy a larger scale testbed, supporting
multiple topologies and versatile Wireless Sensor Network applications.
2. Study the performance of TCP/IPv6 over IEEE 802.15.4 WSN for applications with
different traffic characteristics and quality of service (QoS) requirements.
In this research, we focused on the very common periodical monitoring and sensing
application, which generates short data messages at constant time interval and doesn’t have
strict quality of service requirements for latency and packet loss rate. It is meaningful to
study the achievable performance for other applications such as data streaming, safety-
critical monitoring, industrial real-time control, file transfer, peer to peer data sharing, etc.
Novel techniques suited for different types of applications should be developed to achieve
better and satisfying performance.
3. Study the performance of TCP/IPv6 packet transmission in a more complex network
environment.
In real world implementation, WSN applications are likely to run in a much more
complicated environment. The complexity could come from different topologies of WSN
deployments, large variety of WSN applications with different QoS requirements, RF
interferences from various sources with time-varying characteristics and on the whole or
part of the transmission path, and so on. It is very useful to study the performance of
TCP/IPv6 packet transmission in such more complicated network environments. This
research could include congestion control, routing, multi-hop data caching, and so on.
87

References
[1] P. Rawat, K. D. Singh, H. Chaouchi and J.M. Bonnin, “Wireless sensor networks: a survey
on recent developments and potential synergies”, The Journal of Supercomputing, Vol. 68,
Issue 1, pp. 1-48, April 2014.
[2] V. Potdar, A. Sharif and E. Chang, “Wireless Sensor Networks: A Survey”, Proceedings of
IEEE International Conference on Advanced Information Networking and Applications
Workshops(WAINA), Bradford, pp. 636 – 641, 2009.
[3] D. Puccinelli and M. Haenggi, “Wireless sensor networks: applications and challenges of
ubiquitous sensing”, IEEE Circuits and Systems Magazine, Vol. 5, Issue 3, pp. 19-21, 2005.
[4] Y. Liu, S. Wu and X. Ning, “The Architecture and Characteristics of Wireless Sensor
network”, Proceedings of IEEE International Conference on Computer Technology and
Development(ICCTD), Kota Kinabalu, Vol. 1, pp. 561 – 565, 2009.
[5] N. Srivastava, “Challenges of Next-Generation Wireless Sensor Networks and its impact on
Society”, Journal of Telecommunications, Vol. 1, Issue 1, pp. 128-133, February 2010.
[6] P. Gajbhiye and A. Mahajan, “A Survey of Architecture and Node deployment in Wireless
Sensor Network”, Proceedings of IEEE 1st International Conference on the Applications of
Digital Information and Web Technologies(ICADIWT), Ostrava, pp. 426-430, August 2008.
[7] I. Akyildiz, W. Su, Y. Sankarasubramaniam and E. Cayirci, "A Survey on Sensor Networks",
IEEE Communications Magazine, pp. 102- 109, August 2002.
[8] H. Jin and W. Jiang, “Handbook of Research on Developments and Trends in Wireless
Sensor Networks: From Principle to Practice”, IGI Global, pp. 1-19, 2010.
[9] M. Aslam, S. Rea and D. Pesch, “A Vision for Wireless Sensor Networks: Hybrid
Architecture, Model Framework and Service based Systems”, Proceedings of IEEE 5th
International Conference on Digital Information Management(ICDIM), Thunder Bay, pp.
353-359, July 2010.
88

[10] S. Fedor and M. Collier, “On the problem of energy efficiency of multi-hop vs one-hop
routing in Wireless Sensor Networks”, Proceedings of IEEE 21st International Conference
on Advanced Information Networking and Applications Workshops, Niagara Falls, Ontario,
pp. 380 – 385, May 2007.
[11] Karl H and Willing A. “Protocols and Architectures for Wireless Sensor Networks”, Wiley,
New York, pp. 314−340, 2005.
[12] E. Kantarci and H. T. Mouftah, “Energy-Efficient Information and Communication
Infrastructures in the Smart Grid: A Survey on Interactions and Open Issues”, IEEE
Communications Surveys & Tutorials, Vol. 17, Issue 1, pp. 179-197, July 2014.
[13] R. V. P. Yerra, A.K. Bharathi and P. Rajalakshmi, U.B. Desai, “WSN based power
monitoring in smart grids”, Proceedings of IEEE 7th International Conference on Intelligent
Sensors, Sensor Networks and Information Processing (ISSNIP), Adelaide, pp. 401-406,
2011.
[14] W. Quan-fu, Z. Shen, Y. Yang andT. Liang, “The Application of Wireless Sensor Networks
in Coal Mine”, Proceedings of IEEE 7th International Conference on Information,
Communications and Signal Processing(ICICE), Macau, pp. 1-4, 2009.
[15] N. Salman, I. Rasool and A. Kemp, “Overview of the IEEE 802.15.4 standards family for
low Rate Wireless Personal Area Networks”, 7th International Symposium on Wireless
Communication Systems, York, pp. 701-705, 2010.
[16] J.A. Gutierrez, “On the use of IEEE 802.15.4 to enable wireless sensor networks in building
automation”, 15th IEEE International Symposium on Personal, Indoor and Mobile Radio
Communications, Vol. 3, pp. 1865-1869, 2004.
[17] L. Villasenor-Gonzalez, C. Portillo-Jimenez and J. Sanchez-Garcia, “A Performance Study
of the IEEE 802.11g PHY and MAC Layers over Heterogeneous and Homogeneous
WLANs”. Research and Technology, Mexico, Vol. 8, No. 1, pp. 45-57, March 2007.
89

[18] “Part 15.4: Wireless Medium Access Control (MAC) and Physical Layer (PHY)
Specifications for Low-Rate Wireless Personal Area Networks (WPANs)”,
http://standards.ieee.org/getieee802/download/802.15.4-2006.pdf, (Accessed: November 26,
2015).
[19] K. Shuaib, M. Boulmalf, F. Sallabi and A. Lakas, “Co-existence of ZigBee and WLAN, A
Performance Study”, IEEE Wireless Telecommunications Symposium, pp. 1-6, Pomana, CA,
April 2006.
[20] H. Zhou, Z. Huang and G. Zhao, “A service-centric solution for wireless sensor networks”,
Proceedings of IEEE 5th International Conference on Communications and Networking in
China (CHINACOM), Beijing, pp. 1-5, August 2010.
[21] W. Colitti, K. Steenhaut, N. De Caro, B. Buta and V. Dobrota, “REST Enabled Wireless
Sensor Networks for Seamless Integration with Web Applications”, Proceedings of IEEE
8th International Conference on Mobile Adhoc and Sensor Systems (MASS), Valencia, pp.
867-872, October 2011.
[22] L. Mainetti, L. Patrono and A. Vilei, “Evolution of wireless sensor networks towards the
Internet of Things: A survey”, Software, Proceedings of IEEE 19th International Conference
on Telecommunications and Computer Networks (SoftCOM), Split, pp. 1-6, September
2011.
[23] A.W. Nagpurkar and S.K. Jaiswal, “An overview of WSN and RFID network integration”,
Proceedings of IEEE 2nd International Conference on Electronics and Communication
Systems (ICECS), Coimbatore, pp. 497-502, February 2015.
[24] R. Yin, F. Zhang, M. Liu and F. Gui, “Communication model of embedded multi-protocol
gateway for MRO online monitoring system”, Proceedings of IEEE 19th International
Conference on Computer Supported Cooperative Work in Design (CSCWD), Calabria, pp.
97-102, May 2015.
90

[25] G. Horvat, Z. Krpic and D. Zagar, “Power consumption analysis and optimization of ARM
based WSN data aggregation node”, Proceedings of IEEE 38th International Conference on
Telecommunications and Signal Processing (TSP), Prague, pp. 1-5, July 2015.
[26] T. Mishra, A.R. Panda, M.R. Lenka, D. Mahapatra and A.R. Swain, “Energy Efficient
Coverage and Connectivity with Varying Energy Level in WSN”, Proceedings of IEEE
International Conference on Computational Intelligence and Networks (CINE), Odisha,
India, pp. 86-91, January 2015.
[27] S. Li, M. Liu and X. Li, “WSN data fusion approach based on improved BP algorithm and
clustering protocol”, Proceedings of IEEE 27th Chinese Control and Decision Conference
(CCDC), Qingdao, pp. 1450-1454, May 2015.
[28] A. Habib, “Sensor Network Security Issues at Network Layer”, Proceedings of IEEE 2nd
International Conference on Advances in Space Technologies, Islamabad, pp. 58-64,
November 2008.
[29] M. de los Angeles Cosio Leon, J. Hipolito and J. Garcia, “A Security and Privacy Survey
for WSN in e-Health Applications”, IEEE Electronics, Robotics and Automotive Mechanics
Conference(CERMA), 2009, Cuernavaca, Morelos, pp. 125-131, September 2009.
[30] R.K. Kodali, S.K. Gundabathula and L. Boppana, “Implementation of Toeplitz Hash based
RC-4 in WSN”, Proceedings of IEEE Conference on Signal Processing, Informatics,
Communication and Energy Systems (SPICES), Kozhikode, pp. 1-5, February 2015.
[31] X. Luo, K. Zheng, Y. Pan, and Z. Wu, “A TCP/IP implementation for wireless sensor
networks”, Proceedings of IEEE International Conference on Systems, Man, and
Cybernetics, pp. 6081-6086, October 2004.
[32] J. Rodrigue and P. Neves, “A survey on IP-based wireless sensor network solutions”,
International Journal of Communication Systems, Vol. 23, pp. 963-981, 2010.
[33] J. Hui and D. Culler, “IP is dead, long live IP for wireless sensor networks”, Proceedings of
6th ACM Confererce on Embedded Network Sensor System, pp. 15–28, November 2008.
91

[34] A. Dunkels, “Full TCP/IP for 8-bit architectures”, Proceedings of the 1st International
Conference on Mobile System Application and Services, pp. 85-98, May 2003.
[35] J. Postel, “TRANSMISSION CONTROL PROTOCOL”, RFC 793, September 1981.
[36] O. Gasser, “TCP/IP communication in a WSN”, Seminar SN SS2011, Network
Architectures and Services, pp. 75-82, July 2011.
[37] S. Deering and R. Hinden, “Internet Protocol, Version 6 (IPv6) Specification”, RFC2460,
December 1998.
[38] “BLIP Tutorial”, http://tinyos.stanford.edu/tinyos-wiki/index.php/BLIP_Tutorial,
(Accessed: November 26, 2015).
[39] “SICSLOWPAN - INTERNET FOR LOW-POWER, LOW-COST WIRELESS”,
https://www.sics.se/projects/sicslowpan-internet-for-low-power-low-cost-wireless,
(Accessed: November 26, 2015).
[40] Contiki Operating System, http://www.contiki-os.org/, (Accessed: November 26, 2015).
[41] TinyOS, http://www.tinyos.net/, (Accessed: November 26, 2015).
[42] F. Zhang and X. Zhang, “Transmission and encoding research on life status data in WSN
combined with OVTDM and CS”, IEEE 2nd International Symposium on Future
Information and Communication Technologies for Ubiquitous HealthCare (Ubi-
HealthTech), Beijing, pp. 1-4, May 2015.
[43] A. Dunkels , B. Gronvall and T. Voigt, “Contiki - A Lightweight and Flexible Operating
System for Tiny Networked Sensors”, Proceedings of the 29th Annual IEEE International
Conference on Local Computer Networks, pp. 455-462, November 2004.
[44] Riot Operating System, http://www.riot-os.org/, (Accessed: November 26, 2015).
[45] N. Torabi, K.Rostamzadeh and V.C.M Leung, “IEEE 802.15.4 Beaconing Strategy and the
Coexistence Problem in ISM Band”, IEEE Transactions on Smart Grid, Vol. 6, Issue 3, pp.
1463-1472, April 2015.
92

[46] A.Z. Rozali, R. Stewart and S. Kennedy, “Resource allocation to mitigate channel
interference in mobile wireless sensor networks”, Proceedings of IEEE Conference on
Wireless Sensor(ICWiSe), Melaka, Malaysia, pp. 46-51, August 2015.
[47] K. Staniec, “IEEE 802.15.4 (ZigBee) immunity to in-band interference and multipath
propagation”, IEEE Radio and Antenna Days of the Indian Ocean (RADIO), Belle Mare, pp.
1-2, September 2015.
[48] T.F. Wykret, L.H.A. Correia, D.F. Macedo and J.C. Giacomin, “Evaluation and avoidance
of interference in WSN: A multi-radio node prototype using Dynamic Spectrum Allocation”,
IEEE International Federation for Information Processing(IFIP), Wireless Days (WD),
Valencia, pp. 1-3, November 2013.
[49] L. Angrisani, M. Bertocco, G. Gamba and A. Sona, “Modeling the Performance of CSMA-
CA Based Wireless Networks Versus Interference Level”, Proceedings of IEEE
International Conference on Instrumentation and Measurement Technology Conference,
Victoria, pp. 376-381, 2008.
[50] H. Huo, Y. Xu, C. Bilen and H. Zhang, “Coexistence Issues of 2.4GHz Sensor Networks
with Other RF Devices at Home”, Proceedings of IEEE 3rd International Conference on
Sensor Technologies and Applications(SENSORCOMM), Athens, Glyfada, pp. 200-205,
2009.
[51] M. Petrova, L. Wu, P. Mahonen and J. Riihijarvi, “Interference Measurements on
Performance Degradation between Collocated IEEE 802.11g/n and IEEE 802.15.4
Networks”, Proceedings of IEEE 6th International Conference on Networking, Martinique
pp. 93-98, April 2007.
[52] B. Plepalli, W. Xie, D. Thngaraja, M. Goyal, H. Hosseini and Y. Bashir, “Impact of IEEE
802.11n Operation on IEEE 802.15.4 Operation”, Proceedings of IEEE International
Conference on Advanced Information Networking and Applications Workshops, Bradford,
pp. 328-333, 2009.
93

[53] W. Yuan, X. Wang and J. Linnartz, “A Coexistence Model of IEEE 802.15.4 and IEEE
802.11b/g”, IEEE 14th Symposium on Communications and Vehicular Technology, Delft,
pp. 1-5, November 2007.
[54] L. Tytgat, O. Yaron, S. Pollin and I. Moerman, “Analysis and Experimental Verification of
Frequency-Based Interference Avoidance Mechanisms in IEEE 802.15.4”, IEEE/ACM
Transactions on Networking, Vol. 23, Issue 2, pp. 369-382, April 2015.
[55] J. Neburka, Z. Tlamsa, V. Benes and L. Polak, “Study of the coexistence between ZigBee
and Wi-Fi IEEE 802.11b/g networks in the ISM band”, Proceedings of 25th International
Conference, Radioelektronika(RADIOELEKTRONIKA), Pardubice, pp. 106-109, April
2015.
[56] D. Yang, Y. Xu and M. Gidlund, “Coexistence of IEEE 802.15.4 based networks: A survey”,
Proceedings of IEEE 36th Annual Conference on Industrial Electronics Society(IECON),
Glendale, pp. 2107-2113, 2010.
[57] L. Angrisani, M. Bertocco, M. Fortin and D. Sona, “Experimental Study of Coexistence
Issues Between IEEE 802.11b and IEEE 802.15.4 Wireless Networks”, IEEE Transactions
on Instrumentation and Measurement, Vol. 57, Issue 8, pp. 1514-1523, August 2008.
[58] S. Y. Shin, H. S. Park and W. H. Kwon, “Mutual interference analysis of IEEE 802.15.4 and
IEEE 802.11b”, Computer Networks, Vol. 51, No. 12, pp. 3338-3353, August 2007.
[59] S. Shin and H. Park, “Packet Error Rate Analysis of ZigBee Under WLAN and Bluetooth
Interferences”, IEEE Transactions on Wireless Communications, Vol. 6, No. 8, pp. 2825-
2830, August 2007.
[60] H. Huo, H. Zhang, Y. Niu, S. Gao, Z. Li and S. Zhang, “MSRLab6: An IPv6 Wireless Sensor
Networks Testbed”, Proceedings of IEEE 8th International Conference on Signal Processing,
Beijing, Vol. 4, pp. 16-20 November 2006.
[61] R. Khoshdelniat, G.R. Sinniah, K.A. Bakar, M.H.M. Shaharil, Z. Suryaday and Sarwar,
“Performance evaluation of IEEE802.15.4 6LoWPAN gateway”, Proceedings of IEEE 17th
Asia-Pacific Conference on Communications (APCC), Sabah, pp. 253 – 258, October 2011.
94

[62] A. Ayadi, P. Maille, D. Ros, L. Toutain and T. Zheng, “Implementation and evaluation of a
TCP header compression for 6LoWPAN”, Proceedings of IEEE 7th International Wireless
Communications and Mobile Computing Conference (IWCMC), Istanbul, pp. 1359 – 1364,
July 2011.
[63] G. Ji, Z. Wang, D. Zhu, D. Makrakis and H.T. Mouftah, “Performance evaluation and
improvement of TCP/IPv6 over IEEE 802.15.4 under Wi-Fi interference”, Proceedings of
IEEE 28th Canadian Conference on Electrical and Computer Engineering (CCECE), Halifax,
NS, pp. 1095-1100, May 2015.
[64] Y. Zhu, K. Chi, X. Tian and V. Leung, “Network Coding Based Reliable IPv6 Packet
Delivery over IEEE 802.15.4 Wireless Personal Area Networks”, IEEE Transactions on
Vehicular Technology, Vol. PP, Issue 99, April 2015.
[65] T. Zheng, A. Ayadi and X. Jiang, “TCP over 6LoWPAN for Industrial Applications: An
Experimental Study”, Proceeding of 4th IFIP International Conference on New Technology,
Mobility and Security (NTMS), Paris, pp. 1-4, February 2011.
[66] A. Ayadi, P. Maille, D. Ros, L. Toutain and P. Thubert, “Energy-efficient fragment recovery
techniques for Low-Power and Lossy Networks”, Proceedings of IEEE 7th International
Wireless Communications and Mobile Computing Conference (IWCMC), Istanbul, pp. 601
– 606, July 2011.
[67] E. Bai and X. Zhang, “Performance Evaluation of 6LoWPAN Gateway Used in Actual
Network Environment”, Proceedings of IEEE International Conference on Control
Engineering and Communication Technology (ICCECT), Liaoning, pp. 1036 – 1039,
December 2012.
[68] N. M. C Tiglao and A.M. Grilo, “Cross-layer caching based optimization for wireless
multimedia sensor networks”, Proceedings of IEEE 8th International Conference on
Wireless and Mobile Computing, Networking and Communications (WiMob), Barcelona,
pp. 697 – 704, October 2012.
95

[69] M.A. Haron, S.K. Syed-Yusof, N. Fisal, S.H Syed-Arffin and A. Abdallah, “Performance
Study of the Coexistence of Wireless Sensor Networks (WSN) and Wireless Local Area
Networks (WLAN)”, Proceedings of IEEE 2nd Asia International Conference on Modeling
& Simulation(AICMS), Kuala Lumpar, pp. 475-479, May 2008.
[70] N. Azmi, L.M. Kamarudin, M. Mahmuddin, A. Zakaria, A.Y.M. Shakaff and S. Khatun,
“Interference issues and mitigation method in WSN 2.4GHz ISM band: A survey”,
Proceedings of 2nd International Conference on Electronic Design (ICED), Penang, pp. 402-
408, August 2014.
[71] T. Du, Z. Wang, D. Makrakis and H.T. Mouftah, “Protective Dummy-byte Preamble
Padding for improving ZigBee packet transmission under Wi-Fi interference”, Proceedings
of IEEE Wireless Communications and Networking Conference (WCNC), New Orleans, pp.
1918-1923, March 2015.
[72] B. Al Nahas, S. Duquennoy and T. Voigt, “Low-Power Listening Goes Multi-channel”,
Proceedings of IEEE International Conference on Distributed Computing in Sensor Systems
(DCOSS), Marina Del Rey, pp. 2-9 May 2014.
[73] C. Wong and W. Hsu, “An additional clear channel assessment for IEEE 802.15.4 slotted
CSMA/CA networks”, Proceedings of IEEE International Conference on Communication
Systems (ICCS), Singapore, pp. 62-66, 2010.
[74] M. Guennoun and H.T. Mouftah, “Semi-persistent CSMA/CA for efficient and reliable
communication in Wireless Sensor Networks”, Proceedings of IEEE 27th Canadian
Conference on Electrical and Computer Engineering (CCECE), Toronto, pp. 1-6, May 2014.
[75] M. Di Francesco, G. Anastasi, M. Conti, S. K. Das and V. Neri, “An adaptive algorithm for
dynamic tuning of MAC parameters in IEEE 802.15.4/ZigBee sensor networks”,
Proceedings of IEEE 8th International Conference on Pervasive Computing and
Communications Workshops (PERCOM Workshops), Mannheim, pp. 400-405, 2010.
96

[76] W. Yuan, J. P. M. G. Linnartz and I. G. M. M. Niemegeers, “Adaptive CCA for IEEE
802.15.4 Wireless Sensor Networks to Mitigate Interference”, Proceedings of IEEE Wireless
Communications and Networking Conference (WCNC), Sydney, pp. 1 -5, 2010.
[77] L.L. Cheng, M. Bolt, A. Syed, P. Ng, C. Goh and Y. Li, “Dynamic performance of IEEE
802.15.4 devices under persistent WiFi traffic”, Proceedings of IEEE international
Conference on Recent Advances in Internet of Things (RIoT), Singapore, pp. 1-6, April 2015.
[78] T. Du, Z. Wang, D. Makrakis and H.T. Mouftah, “Adaptive Preamble Padding with
Retransmission Control for ZigBee network under Wi-Fi interference”, Proceedings of IEEE
International Wireless Communications and Mobile Computing Conference (IWCMC),
Dubrovnik, pp. 981-986, August 2015.
[79] S. J. Bae, M. Y. Chung, H. J. Ki, T. J. Lee, S. Bae, H. Gi, M. Jeong and T. Lee, “Method for
recognizing available channel in IEEE 802.15.4 protocol CSMA/CA mechanism”, Patent
Number(s): US2009129353-A1; KR2009050913-A; KR942891-B1, May 2009.
[80] I. Glaropoulos, M. Lagana, V. Fodor and C. Petriodli, “Energy Efficient COGnitive-MAC
for Sensor Networks Under WLAN Co-existence”, IEEE Transactions on Wireless
Communications, Vol. 14 , Issue 7, pp. 4075-4089, July 2015.
[81] J. Y. Ha, T. H. Kim, H. S. Park, S. Choi and W. H. Kwon, “An Enhanced CSMA-CA
Algorithm for IEEE 802.15.4 LR-WPANs”, IEEE Communications Letters, Vol. 11, No. 5,
pp. 461-463, 2007.
[82] S. M. Kim, J. W. Chong, C. Y. Jung, T. H. Jeon, J. H. Park, Y. J. Kang, S. H. Jeong, M. J.
Kim and D. K. Sung, “Experiments on Interference and Coexistence between ZigBee and
WLAN Devices Operating in the 2.4 GHz ISM Band”, The Journal of Korean Institute of
Next Generation Computing, Vol. 1, No. 2, pp. 24 - 33, November 2005.
[83] E. Tim and H. Hellbrueck, “In-Band Interference Detection on Reception for IEEE 802.15.4
Transmissions”, Proceedings of 21th European Wireless Conference, Budapest, Hungary,
pp. 1-6, May 2015.
97

[84] M. Kang, J. Chong, H. Hyun, S. Kim, B. Jung and D. Sung, “Adaptive interference-aware
multi-channel clustering algorithm in a ZigBee network in the presence of WLAN
interference”, IEEE 2nd International Symposium on Wireless Pervasive Computing pp.
200–205, San Juan, February 2007.
[85] G. Zhou, T. He, J. Stankovic and T. Abdelzaber, “RID: Radio interference detection in
wireless sensor networks”, Proceedings of IEEE 24th International Conference on Computer
Communications, pp. 891–901(INFOCOM), 2005.
[86] C. Won, J. H. Youn, H. Ali, H. Sharif and J. Deogun, “Adaptive Radio Channel Allocation
for Supporting Coexistence of 802.15.4 and 802.11b”, Proceedings of IEEE 62nd Vehicular
Technology Conference(VTC), Vol 4, pp. 2522-2526, September 2005.
[87] A.Abu Alkheir and H.T. Mouftah, “An Improved Energy Detector Using Outdated Channel
State Information”, IEEE Communications Letters, Vol. 19, Issue 7, pp. 1237-1240, July
2015.
[88] Y. Tang, Z. Wang, D. Makrakis and H.T. Mouftah, “Interference Aware Adaptive Clear
Channel Assessment for improving ZigBee packet transmission under Wi-Fi interference”,
Proceedings of 10th Annual IEEE Communications Society Conference on Sensor, Mesh
and Ad Hoc Communications and Networks (SECON), New Orleans, pp 336-343, June 2013.
[89] B. H. Jung, J. W. Chong, C. Y. Jung, S. M. Kim and D. K. Sung, “Interference mediation
for coexistence of WLAN and ZigBee networks”, IEEE 19th International Symposium on
Personal, Indoor and Mobile Radio Communications (PIMRC), pp. 1-5, 2008.
[90] R. C. Shah and L. Nachman, “Interference detection and mitigation in IEEE 802.15.4
networks”, Proceedings of International Conference on Information Processing in Sensor
Networks (IPSN), Cannes, pp. 553–554, 2008.
[91] P. Yi, A. Iwayemi and C. Zhou, “Developing ZigBee Deployment Guideline Under WiFi
Interference for Smart Grid Applications”, IEEE Transaction on Smart Grid, pp. 110-120,
March 2011.
98

[92] P. Yi, A. Iwayemi and C. Zhou, “Frequency agility in a ZigBee network for smart grid
application”, IEEE Innovative Smart Grid Technologies (ISGT), Gaithersburg, pp. 1-6, 2010.
[93] J. Linnartz, P. Van Kooten and X. Wang, “A method for communicating in a network, a
system and a primary station therefor”, Patent Number(s): WO2010018505-A2;
WO2010018505-A3, February 2010.
[94] Y. H. Kim, Y. H. Shin, W. H. Kwon, S. Y. Shin, J. Y. Choi, J. W. Lee, J. Y. Ha and N. H.
Kim, “Coexistence system for integrating heterogeneous wireless devices use frequency
band into single board enabling a IEEE 802.11 WLAN and IEEE 802.15.4 LR-WPAN which
use frequency band, to work through active channel reservation technique”, Patent
Number(s): KR2007083321-A, August 2007.
[95] M. L. Huang and S. Park, “A WLAN and ZigBee coexistence mechanism for wearable health
monitoring system”, IEEE 9th International Symposium on Communications and
Information Technology(ISCIT), Incheon, pp. 555-559, September 2009.
[96] J. Espina, S. E. Boleko, F. Dalmases, T. Falck and S. Boleko, “Time-based coexistence
method for wireless communication”, Patent Number(s): WO2007015197-A2, EP1913737-
A2, CN101238687-A, US2008232345-A1, IN200801010-P4, JP2009504059-W, September
2008.
[97] X. Ma and W. Luo, “The Analysis of 6LoWPAN Technology”, IEEE Pacific-Asia
Workshop on Computational Intelligence and Industrial Application(PACIIA), Wuhan, Vol.
1, pp. 963 – 966, December 2008.
[98] N. Kushalnagar, G. Montenegro and C. Schumacher, “IPv6 over Low-Power Wireless
Personal Area Networks (6LoWPANs): Overview, Assumptions, Problem Statement, and
Goals”, RFC4919, 2007.
[99] K. Chi, Y. Zhu and Z. Cheng, “Network Coding Based Mesh-under Routing In 6LoWPAN
With High End-to-end Packet Delivery Rate”, Proceedings of IEEE 8th International
Conference on Mobile Ad-hoc and Sensor Networks(MSN), Chengdu, pp. 1-5, December
2012.
99

[100] Q. Yuan, R. Zhang, F. Chu and W. Dai, “ECIS, an Energy Conservation and Interconnection
Scheme between WSN and Internet based on the 6LoWPAN”, Proceedings of IEEE 16th
International Conference on Network-Based Information Systems(NBiS), Gwangju, pp. 565
– 570, September, 2013.
[101] L. Parra, S. Sendra, J. Lloret and J.J.P.C. Rodrigues, “Low cost wireless sensor network for
salinity monitoring in mangrove forests”, IEEE SENSORS, Valencia, pp. 126-129,
November 2014.
[102] R.R Patil and Suresha, “Deployment algorithms in WSN-A study”, Proceedings of IEEE
International Advance Computing Conference (IACC), Banglore, pp. 529-535, June 2015
[103] N. Al-Nabhan, M. Al-Rodhaan and A. Al-Dhelaan, “A distributed self-healing algorithm for
virtual backbone construction and maintenance in Wireless Sensor Networks”, Proceedings
of IEEE International Conference on Wireless for Space and Extreme Environments
(WiSEE), Baltimore, pp. 1-6, November 2013.
[104] J. Pope and R. Simon, “Managing Internet Protocol Routing for Low Power Lossy
Networks”, IEEE GLOBECOM Workshops (GC Workshops), pp. 642-647, December 2010.
[105] S. K. Gupta and P. Sinha, “Overview of Wireless Sensor Network: A Survey”, International
Journal of Advanced Research in Computer and Communication Engineering, Vol. 3, Issue
1, pp. 5201-5207, January 2014.
[106] Wire Shark, https://www.wireshark.org/, (Accessed: November 26, 2015).
[107] Putty, http://www.putty.org/, (Accessed: November 26, 2015).
[108] D-ITG, http://traffic.comics.unina.it/software/ITG/, (Accessed: November 26, 2015).
[109] “Antenna Selection Quick Guide DN035”,
http://www.ti.com.cn/cn/lit/an/swra351a/swra351a.pdf, (Accessed: November 26, 2015).
[110] “Design Note DN0007”, http://www.ti.com/lit/an/swru120b/swru120b.pdf, (Accessed:
November 26, 2015).
100

[111] “High-density performance line ARM®-based 32-bit MCU with 256 to 512KB”,
http://www.st.com/web/en/resource/technical/document/datasheet/CD00191185.pdf,
(Accessed: November 26, 2015).
[112] AT86RF231, http://www.atmel.com/images/doc8111.pdf, (Accessed: November 26, 2015).
[113] LM1117-N, http://www.ti.com/lit/ds/symlink/lm1117-n.pdf, (Accessed: November 26,
2015).
[114] M. Dohler, T. Watteyne, T. Winter and D. Barthel, “Routing Requirements for Urban Low-
Power and Lossy Networks”, RFC 5548, http://tools.ietf.org/html/rfc5548, May 2009.
[115] A.Alaiad, “Patients' Behavioral Intentions toward Using WSN Based Smart Home
Healthcare Systems: An Empirical Investigation”, Proceedings of IEEE on 48th Hawaii
International Conference on System Sciences (HICSS), Hawaii, pp. 824-833, January 2015.
[116] S. Otoum, M. Ahmed and H.T. Mouftah, “Sensor Medium Access Control (SMAC)-based
epilepsy patients monitoring system”, Proceedings of IEEE 28th Canadian Conference on
Electrical and Computer Engineering (CCECE), Halifax, pp. 1109-1114, May 2015.
[117] H. Alemdar and C. Ersoy, “Wireless sensor networks for healthcare: A survey”, Computer
Networks, Vol. 54, No. 15, pp. 2688–2710, Oct. 2010.
[118] J.A. Stankovic, Q. Cao, T. Doan, L. Fang, Z. He, R. Kiran, S. Lin, S. Son, R. Stoleru and A.
Wood, “Wireless sensor networks for in-home healthcare: potential and challenges”,
Proceedings of High Confidence Medical Device Software and Systems (HCMDSS)
Workshop, pp. 1-4, 2005.
[119] U.S. Department of Energy, “Assessment study on sensors and automation in the industries
of the future”, Office of Energy and Renewable Energy, pp. 28-36, 2004.
[120] M. Erol-Kantarci and H.T. Mouftah, ” Smart grid forensic science: applications, challenges,
and open issues “, IEEE Communications Magazine, Vol. 51 , Issue 1, pp. 68-74, January
2013.
101

[121] V. C. Gungor and F. C. Lambert, “A survey on communication networks for electric system
automation”, Computer Networks, Vol. 50, No. 7, pp. 877– 897, May 2006.
[122] V. C. Gungor and G. P. Hancke, “Industrial wireless sensor networks: Challenges, design
principles, and technical approaches”, IEEE Transaction on Industrial Electronics, Vol. 56,
No. 10, pp. 4258–4265, October 2009.
[123] T. Arampatzis, J. Lygeros, and S. Manesis, “A Survey of Applications of Wireless Sensors
and Wireless Sensor Networks”, Proceedings of 13th IEEE Mediterrean Conference on
Control and Automation, Limassol, pp. 719-724, 2005.
[124] K.S. Raju, “Implementation of a WSN system towards SHM of civil building structures”,
Proceedings of International Conference on Intelligent Systems and Control (ISCO),
Coimbatore, pp. 1-7, 9-10 January 2015
[125] ZigBee, http://www.zigbee.org/, (Accessed: November 26, 2015).
[126] Bluetooth Low Energy, http://www.bluetooth.com/Pages/low-energy-tech-info.aspx,
(Accessed: November 26, 2015).
[127] HART, http://en.hartcomm.org/hcf/org_mbr/documents/documents_spec_list.html,
(Accessed: November 26, 2015).
[128] ANT, http://www.thisisant.com/resources/ant-message-protocol-and-usage/, (Accessed:
November 26, 2015).
[129] ISA100: Wireless Systems for Industrial Automation-Developing a Reliable, Universal
Family of Wireless Standards, ISA, Standard 2007.
[130] ISA100.1 1a Release I Status, ISA 2008.
[131] Z-Wave, http://www.z-wave.com/what_is_z-wave, (Accessed: November 26, 2015).
[132] O. Gasser, “TCP/IP communication in a WSN”, Seminar SN SS2011, Network
Architectures and Services, pp. 75-82, July 2011.
102

[133] A. Ayadi, P. Maille and D. Ros. “TCP over low-power and lossy networks: tuning the
segment size to minimize energy consumption”, Proceedings of 4th IFIP International
Conference in New Technologies on Mobility and Security (NTMS), Paris, pp. 1–5., 2011.
[134] E. Baccelli, O. Hahm, M. Gunes and M. Wahlisch, “RIOT OS: Towards an OS for the
Internet of Things”, Proceedings of IEEE on Computer Communications
Workshops(INFOCOM), Turin, pp. 79-80, April 2013.
[135] DD-WRT, http://www.dd-wrt.com/site/index, (Accessed: November 26, 2015).
[136] J. Vasseur, A. Dunkels. “Interconnecting Smart Objects with IP: The Next Internet”, Morgan
Kaufmann, pp. 167-182, 2010.
[137] LM1117-N, http://www.ti.com/lit/ds/symlink/lm1117-n.pdf, (Accessed: November 26,
2015).
[138] http://www.air802.com/files/FCC-Rules-and-Regulations.pdf, (Accessed: November 26,
2015).
[139] Microwave Oven Radiation, http://www.fda.gov/Radiation-
EmittingProducts/ResourcesforYouRadiationEmittingProducts/ucm252762.htm, (Accessed:
November 26, 2015).
[140] “What’s The Difference Between IEEE 802.15.4 And ZigBee Wireless?”,
http://electronicdesign.com/what-s-difference-between/what-s-difference-between-ieee-
802154-and-zigbee-wireless, (Accessed: November 26, 2015).
[141] Liedtke and Jochen, “Towards Real Microkernels”, Communications of the ACM, Vol. 39,
Issue 9, pp. 70-77, September 1996.
[142] S. Park, “IPv6 over Low Power WPAN Security Analysis draft-daniel-6lowpan-security-
analysis-05”, http://tools.ietf.org/html/draft-daniel-6lowpan-security-analysis-05, March
2011, (Accessed: November 26, 2015).
103

[143] T. Narten, “Neighbor Discovery for IP version 6 (IPv6)”, https://tools.ietf.org/html/rfc4861,
September 2007, (Accessed: November 26, 2015).
[144] Z. Shelby, “Neighbor Discovery Optimization for Low Power and Lossy Networks”,
https://tools.ietf.org/html/draft-ietf-6lowpan-nd-21, August 2012 (Accessed: November 26,
2015).
[145] J. Schoenwaelder, “SNMP Optimizations for Constrained Devices”,
https://tools.ietf.org/html/draft-hamid-6lowpan-snmp-optimizations-03#page-27, October
2012, (Accessed: November 26, 2015).
[146] Confidence intervals, https://en.wikipedia.org/wiki/Confidence_interval, (Accessed:
January 02, 2016).
104

Appendix A Confidence Interval for the Mean A confidence interval is a type of interval estimate of a parameter determined by using data
obtained from a sample and by using the specific confidence level of the estimate. Three common
confidence intervals are used: the 90%, the 95%, and the 99% confidence intervals. [146]
When finding the confidence interval for the mean of a population, there are two different
situations that may exist. You will be given information that may have the population standard
deviation stated or it may be the sample standard deviation that is given. A different formula needs
to be used in each case.
Case 1: When the population standard deviation (σ) is known. The confidence interval of the
population mean (μ) is calculated using:
x� ± 𝑍𝑍𝛼𝛼/2𝜎𝜎√𝑔𝑔
(A.1)
Where the level of required confidence level is (1 − 𝛼𝛼) × 100%, ��𝑥 = sample mean, n = sample
size and σ = population standard deviation. Z is the normal distribution’s critical value for a
probability of α/2 in each tail.
Case 2: When the population standard deviation (σ) is unknown. The confidence interval of the
population mean (μ) is found using:
x� ± 𝑡𝑡𝛼𝛼2 ,𝑔𝑔−1
𝜎𝜎√𝑔𝑔
(A.2)
Where the level of required confidence level is (1 − 𝛼𝛼) × 100%, ��𝑥 = sample mean, n = sample
size and σ = population standard deviation. t is the critical value of the t distribution with n-1
degree of freedom and an area of α/2 in each tail. In our research, the formula of case 2 is used to
calculate a 95% confidence interval.
105

Appendix B Existing WSN Embedded Operating Systems
Contiki Operating System
Contiki is an open source, multi-tasking network operating system for resource limited hardware
[40]. Contiki is designed to run in small amount of memory. A typical system with full IPv6
networking with sleepy routers and RPL routing needs less than 10k RAM and 30k ROM. Contiki
processes use lightweight protothreads that provide a linear, thread-like programming style. In
addition to protothreads, Contiki also supports per-process optional preemptive multi-threading
and interprocess communication using message passing. The Contiki operating system consists of
an event-driven kernel, on top of which application programs can be dynamically loaded and
unloaded at run time. Contiki provides a full IP network stack, with standard IP protocols such as
UDP, TCP, and HTTP, in addition to the new low-power standards like 6loWPAN, RPL, and
CoAP. The Contiki’s IPv6 stack, developed and contributed to Contiki by Cisco, is fully certified
under the IPv6 Ready Logo program. uIP layer is a simplified TCP/IPv6 layer, but keeps most
functions of the standard IP protocol. Hundreds of companies use uIP stack in their embedded
system products [136]. SICSlowpan is the 6LoWPAN implementation in Contiki. It acts as an
adaption layer which encapsulates and compresses IPv6 packets to be suitable to pass over to IEEE
802.15.4 MAC layer.
TinyOS
TinyOS is an open source operating system designed for Internet of Things (IoT). It can be used
in a wide range of low-power wireless devices, such as those used in smart buildings, ubiquitous
computing, personal area networks, and smart meters [41]. TinyOS provides useful software
106

abstractions of the underlying device hardware: for example, TinyOS can present a flash storage
chip, which has blocks and sectors with certain erase/write properties, as a simple abstraction of a
circular log. Providing these useful abstractions greatly simplifies the job of application and system
developers. TinyOS link layers (single-hop communication) support low-power operation, and
TinyOS multihop protocols use these features. TinyOS also supports secure networking on some
radio chips and RPL. However, TinyOS hasn’t been updated by the authors for a long time, which
makes it lack of new features and community support.
RIOT
RIOT is an operating system designed for the particular requirements of IoT scenarios. These
requirements comprise a low memory footprint, high energy efficiency, real-time capabilities, a
modular and configurable communication stack, and support for a wide range of low-power
devices. RIOT provides a microkernel, utilities like cryptographic libraries, data structures (bloom
filters, hash tables, priority queues), a shell, different network stacks, and support for various
microcontrollers, radio drivers, sensors, and configurations for entire platforms, e.g. TelosB or
STM32 Discovery Boards.The microkernel itself comprises thread management, a priority-based
scheduler, a powerful API for inter-process communication (IPC), a system timer, and mutexes.
RIOT supports common protocols for Internet of Things such as 6LoWPAN, IPv6, RPL, TCP,
UDP, CoAP and CBOR [44][134]. However, on most mainstream processors, obtaining a service
is inherently more expensive in a microkernel-based system than in a monolithic system [141].
Performance and power consumption are therefore potential issues in RIOT.
107

Appendix C Wireless Sensor Networks Standards
In this section, some important standards for Wireless Sensor Network are briefly introduced.
IEEE 802.15.4
The IEEE 802.15.4 category is the most important standard for low-data-rate wireless sensor
networks [140]. It was developed for low-data-rate monitoring and control applications and
extended-life low-power-consumption uses. The IEEE 802.15.4 standard defines the physical
layer (PHY) and media access control (MAC) layer of the Open Systems Interconnection (OSI)
model of network operation. The goal of the standard is to provide a base format to which other
protocols and features could be added by way of the upper layers (layers 3 through 7). While three
frequency assignments: 868 MHz, 915 MHz and 2.4 GHz are available, the 2.4 GHz band is by
far the most widely used. Most available chips and modules use this popular ISM band. The
standard uses direct sequence spread spectrum (DSSS) modulation. It is highly tolerant of noise
and interference, and offers coding gain to improve link reliability. With regard to channel access,
IEEE 802.15.4 uses carrier sense multiple access with collision avoidance (CSMA-CA). This
multiplexing approach lets multiple users or nodes access the same channel at different times
without interference [15-18].
ZigBee
The ZigBee Alliance is a group of companies that develop and maintain the ZigBee standard.
ZigBee is a specification for a suite of high level communication protocols using low-power digital
radios based on IEEE 802.15.4. The technology defined by the ZigBee specification is intended to
be simpler and less expensive than other consumer WSN standards, such as Bluetooth. ZigBee is
108

targeted at radio-frequency (RF) applications that require a low data rate, long battery life, and
secure networking. The low cost allows the technology to be widely deployed in wireless control
and monitoring applications [125].
Bluetooth Low Energy
Bluetooth Low Energy (BLE) is a low-power variation of the original Bluetooth standard. BLE
still operates in the same ISM, license-free, 2.4- to 2.483-GHz frequency band as the standard
Bluetooth. However, it uses a different frequency-hopping spread-spectrum (FHSS) scheme.
Standard Bluetooth hops at a rate of 1600 hops per second over 79 1-MHz-wide channels. BLE
FHSS employs 40 2-MHz-wide channels to ensure greater reliability over longer distances.
Standard Bluetooth offers gross data rates of 1, 2, or 3 Mbits/s, while BLE’s maximum rate is 1
Mbits/s with a net throughput of 260 kbits/s. BLE also uses Gaussian frequency shift keying
(GFSK) modulation [126].
WirelessHART
WirelessHART is a mesh networking technology operating in the 2.4GHz ISM radio band. It
utilizes IEEE 802.15.4 compatible DSSS radios with channel hopping on a packet by packet basis.
Communication is performed using Time Division Multiple Access (TDMA) technology to
arbitrate and coordinate communications between network devices. The TDMA Data Link Layer
establishes links specifying the time slot and frequency to be used for communication between
devices [97]. These links are organized into superframe that periodically repeats to support both
cyclic and acyclic communication traffic. A link may be dedicated or shared to allow elastic
utilization of communications bandwidth to assure processing data with minimal latency [127].
109

ISA-100
ISA-100 is the brainchild of the Instrumentation, Systems, and Automation Society (ISA). This
standard aims to enable a single, integrated wireless infrastructure platform for plants and delivers
a family of standards defining wireless systems for industrial automation and control applications
[99]. The ISA-100 standard adheres to a comprehensive coexistence strategy, which provides “the
ability of wireless networks to perform their tasks in an environment where there are other wireless
networks that may or may not be based on the same standard” [130].
Z-Wave
The Z-Wave wireless mesh networking technology enables any node to talk to other adjacent
nodes directly or indirectly through available relays. A master controller node controls any
additional nodes. The nodes communicate directly with one another if they’re within range. If two
nodes that want to communicate aren’t within range, they can link with another node that both can
access and exchange information. This standard is not open [131].
ANT
ANT represents another ultra-low-power, short-range wireless technology designed for sensor
networks and similar applications. It uses the 2.4-GHz ISM band. So far, its primary application
is in the sports and fitness fields to implement wireless personal area networks (WPANs) for
performance and health monitoring [128].
Among these standards, ZigBee is the most prominent and comprehensively implemented WSN
standard.
110

Appendix D Applications of Wireless Sensor Networks
A large number of different sensors, including sound, optical, electrical, magnetic, and temperature
sensors, can be used in WSN. These sensors, along with wireless communication ability, promise
a variety of new application areas. The following three are among the most prominent application
areas and there are many more that have already been discussed extensively in previous
publications (e.g. [3]-[5]).
3.1.1 Health monitoring
Physiological data are vital for doctors to diagnose or monitor patients’ conditions. Traditional
monitoring equipment are usually bulky and heavy, thus quite often patients are required to stay
in bed for proper monitoring. WSN technology is very suitable for developing wearable telehealth
monitoring devices. WSN nodes are usually very small. The very low power consumption allows
the use of small batteries while achieving long usage time. Wireless technology enables free
movements of patients when wearing the devices, which greatly improves the comfort and life
quality of patients[115] [116].
In addition, the growing number of elderlies increases the demands on the public healthcare system,
as well as on medical and social services. Recent research [117] has shown that the key is in the
exploitation and integration of wireless sensing and consumer electronic technologies into the
common practices of healthcare, which would allow people to be constantly monitored in their
usual living places. Constant monitoring will enable early detection of emergency conditions and
111

diseases for at risk patients and also provide wide range of healthcare services for people with
various degrees of cognitive and physical disabilities [118].
3.1.2 Smart grid
A smart grid is an electrical grid that can automate its behavior based on information collected
from various sources. These information can be relationship between suppliers and consumers,
grid load, equipment healthiness, and so on. Traditionally, industrial automation/monitoring
systems are realized through wired communications. However, the wired systems require
expensive communication cables to be installed and regularly maintained, and thus, they are not
widely implemented in industrial plants because of their high cost [119][120]. Therefore, there is
an urgent need for cost-effective wireless automation systems that enable significant savings and
reduce air-pollutant emissions by optimizing the management of power plant and electrical grid
[121] [122]. WSN can be used to perform information gathering, fault detection/diagnosis, and
even self-healing of the grid to improve reliability, economy, sustainability and efficiency [12]
[13].
3.1.3 Environment safety alert/monitoring
Environmental monitoring applications can be broadly categorized into indoor and outdoor
monitoring [123]. Indoor monitoring applications typically include buildings and offices
monitoring. These applications involve sensing temperature, light, humidity, and air quality. Other
important indoor applications may include fire and civil structures deformations detection[124].
Outdoor monitoring applications include chemical hazardous detection, habitat monitoring, traffic
monitoring, earthquake detection, volcano eruption detection, flooding detection and weather
112

forecasting. Sensor nodes also have found their applicability in agriculture. Soil moisture and
temperature monitoring is one of the most important applications of WSNs in agriculture. For
mining industry, temperature of air, wind speed of roadway, gas concentration, and mine drainage
are important safety parameters of a coal mine. While traditional optical fiber network has many
merits and is effective in most areas of a coal mine, it has serious limitations when dealing with
complex terrain such as mine face and goaf. WSN does not rely on cable wiring to communicate.
Therefore, the frequent moving and changing of the mine face won’t affect the data collecting and
transmitting. And sufficient amount of WSN nodes can be easily deployed in important areas like
mine face to gather enough safety information [14].
113


![TCP/IP Network Experimental Programming [IPv6 에 의한 통신 실험 ]](https://img.pdfslide.net/doc/110x75/568148f6550346895db615eb/tcpip-network-experimental-programming-ipv6-.jpg)