Embed Size (px)
Citation preview

EXPERIMENTAL STUDY OF BEAMS WITH WEB OPENINGS
by
KUO-SHU CHENG
Diploma, Taipei Institute of Technology,Taiwan, China, 1965
A MASTER'S THESIS
submitted in partial fulfillment of the
requirements for the degree
MASTER OF SCIENCE
Department of Civil Engineering
KANSAS STATE UNIVERSITYManhattan, Kansas
1969
Approved by
leiU h' C-ct^a.Major Professor

i-J> „
/%?
TABLE OF CONTENTS
ABSTRACT
Page
INTRODUCTION 1
1. Introduction 1
2. Objectives 1
3. Scope 2
LITERATURE SURVEY 3
1. Analytical Solutions 3
2. Experimental Studies 4
EXPERIMENTAL PROGRAM 7
1. Introduction 7
2. Determination of Beam Dimensionsand Physical Properties 7
3. Test Program 8
4. Test Beam Fabrication 9
5. Photostress Measurements 9
a. Principle of Photostress Measurements 9
b. General Procedure for PhotoscressReadings 10
c. Procedure for Fringe Order BetweenZero and One 11
d. Preparation of Specimen 11
6. Electrical Resistance Strain GageMeasurements 12
7. Deflection Measurements 12
8. Test Set-up 13
9. Test Procedure 13
TEST RESULTS 14
1. Introduction 14
2. Deflections 14
a. Elastic Range 14
b. Ultimate Load Test 16
3. Electrical Resistance Strain Gage Readings4. Photostress Readings
a. Calculation of One Fringe Valueb. Calibration of Full Wave Plate 22
c. Correction of Residual BirefringenceReading 23
d. Shear Difference Mechod 23
COMPARISON OF THE RESULTS AND DISCUSSION 27
CONCLUSIONS 30
RECOMMENDATIONS FOR FURTHER STUDY 31
162020

Page
ACKNOWLEDGEMENTS 32
TABLES AND FIGURES 33
NOTATION 74
REFERENCES 76
APPENDICES 78A. Flow Diagram for Computer Program 78B. Vierendeel Method of Analysis 81
1. Introduction 812. Assumptions 813. Analysis 824. Calculations for this Investigation 83

LIST OF TABLES
Tables
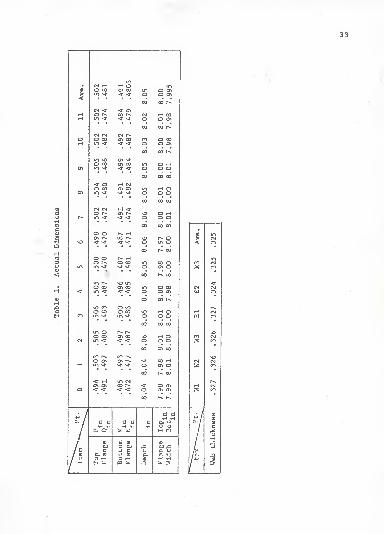
1 Actual Dimensions
2 Results of Tensile Coupon Tests
3 Actual and Nominal Properties of 8 WF 35 Beam
4 Comparison of Theoretical and ExperimentalDeflections - Cases II and III (elastic range)
5 Strain Gage Readings - Case II
6 Strain Gage Readings - Case III
7 Calculation of Stresses from Strain Gages
at Load 16 Kips - Case II
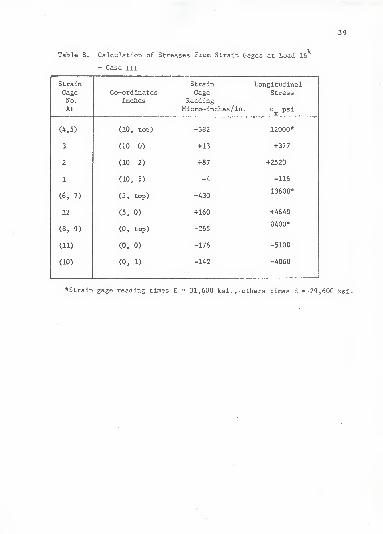
8 Calculation of Stresses from Strain Gages
at Load 16 Kips - Case III
9 Isoclinic Angles and Isochroma tic Readings -
Case II
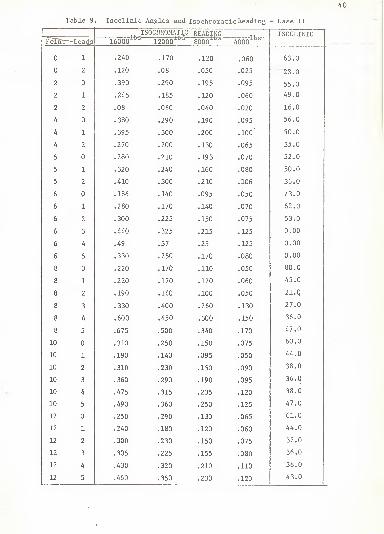
10 Isoclinic Angles and Isochromatic Readings -
Case III
11 Normal Stress Calculation Along VerticalSection 5 at Load 12 Kips - Case II
12 Calculation for Normal Stress AlongVertical Section "10" - Case II
13 Calculation for Normal Stress AlongVertical Section "10" - Case III
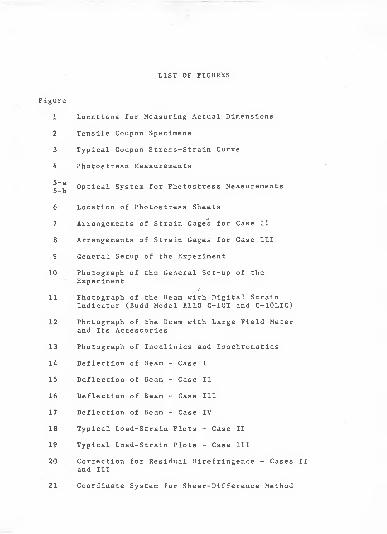
LIST OF FIGURES
Figure
1 Locations for Measuring Actual Dimensions
2 Tensile Coupon Specimens
3 Typical Coupon Stress-Strain Curve
4 Photostress Measurements
5-a"1
, Optical System for Photostress Measurements
6 Location of Photostress Sheets
7 Arrangements of Strain Gages for Case II
8 Arrangements of Strain Gages for Case III
9 General Secup of the Experiment
10 Photograph of the General Set-up of theExperiment
11 Photograph of the Beam with Digital StrainIndicator (Budd Model A110 C-10T and C-10LTC)
12 Photograph of the Beam with Large Field Meterand Its Accessories
13 Photograph of Iscclinics and Inochromatics
14 Deflection of Beam - Case I
15 Deflection of Beam - Case II
16 Deflection of Beam - Case III
17 Deflection of Beam - Case IV
18 Typical Load-Strain Plots - Case II
19 Typical Load-Strain Plots - Case III
20 Correction for Residual Birefringence - Cases IIand III
21 Coordinate System for Shear-Difference Method
LIST OF FIGURES (cont.)
Figure
22 Two Possible Constructions of Mohr's Circlefor the Same Given (a <-a )
23 Relative Magnitudes of a and ax y
24 Bending Stresses Along Vertical Section"0" - Case II
25 Bending Stresses Along Vertical Section"5" - Case II
26 Bending Stresses Along Vertical Section"10" - Case II
27 Shear Stresses Along Vertical Section"5" - Case II
28 Bending Stresses Along' Vertical Section"0" - Case III
29 Bending Stresses Along Vertical Section"5" - Case III
,
30 Bending Stresses Along Vertical Section"10" - Case III
31 Shear Stresses Along Vertical Section"5" - Case III

INTRODUCTION
1, In t roduction
In the construction of buildings, ship bulkheads, and
aircraft, holes through the webs of structural members are
frequently necessary for the passage of pipes, electric
cables, ventilation duces, and for other purposes. In the
past few years, web openings in beams have been studied by
several researchers; however, additional data on the stress
distribution adjacent to the hole is still needed. The purpose
of the study described in this thesis was to investigate the
effect of a rectangular hole with round corners on the elastic
stresses In a wide-flange beam subjected to combined bending
and shear.
The photos tress method in conjunction with electrical
resistance strain gages was used for experimental measure-
ments in the investigation. The so-called Vierendeel Method
w?.s used to calculate theoretical stresses around the hole
in the web.
2 • Objectives
The objectives of this investigation were:
1, To compare the results of experimental stress analysis
around the hole using the Photoelastic Method and electrical
resistance strain gages with predictions based on the Vierendeel
Method of analysis.
2. To study the effect of the web opening on beam
deflections in the elastic and inelastic ranges.

3c Scope
This study was limited to tests on an 8 in. deep A36
steel WF beam with a weight of 35 lbs. per foot (8 WF 35).
Elastic strains were measured around the periphery of the
opening and over the adjacent regions of the web. Two rectangu-
lar openings, located at the 1/4 point of the span, were tested.
Both openings were unreinforced and were centered on the
centroidal axis of the beam. The corners of the opening were
rounded with a radius of 1/2".
In testing the beam, simple supports were used at the
end and a concentrated load was applied at the center of the
span. After elastic stress had been measured, the specimen
was subjected to an ultimate load test.

.
LITERATURE SURVEY
1, Analytical Solutions
•s
In 1932, Muskhe lishvili introduced several methods to
develop stress equations to solve elasticity problems based
on the fundamentals of differential and integral calculus and
on the elementary theory of functions of a complex variable,
2Heller, Block and Bart , in 1962, Investigated the stress
around a rectangular opening with rounded corners in the web
of a beam. This investigation was based on the complex variable
method associated with Kuskhellshvill and a conformal mapping
technique. The effects of varying the corner radius and the
aspect ratio of the opening (ratio of depth to width of
opening) on the stress distribution in a beam were included
in the study,
3Bower , also using the theory of elasticity techniques
associated with Kuskhelishvili , investigated the stresses
around an elliptical hole in a wide-flange beam subjected to
a uniform loading. Although the analysis is similar to that
of Heller et al. , Bower's solution in addition permits stresses
at any other point in the web to be determined. From this
investigation, it was concluded that (1) the applicability of
the analysis depends on the size of the web hole and the
magnitude of the moment-shear ratio at the hole; (2) the
stress distributions near elliptic holes in uniformly loaded
beams are widely different in magnitude and in appearance
from the distributions occurring in beams without holes; and
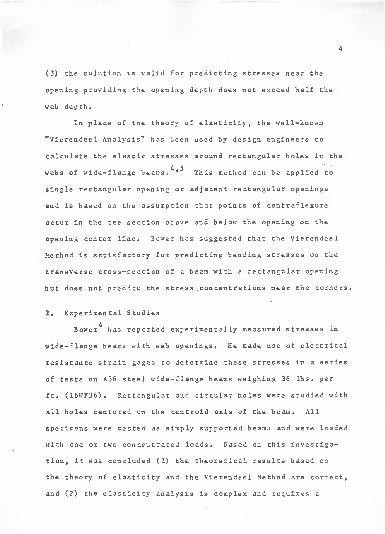
(3) the solution is valid for predicting stresses near the
opening providing the opening depth does not exceed half the
web depth.
In place of the theory of elasticity, the well-known
"Vierendeel Analysis" has been used by design engineers to
calculate the elastic stresses around rectangular holes in the
4 5webs of wide-flange beams, ' This method can be applied to
single rectangular opening or adjacent rectangular openings
and is based on the assumption that points of contraf lexure
occur in the tee section above and below the opening on the
opening center line. Bower has suggested that the Vierendeel
Method is satisfactory for predicting bending stresses on the
transverse cross-section of a beam with a rectangular opening
but does not predict the stress , concent rations near the corners.
2, Experimental Studies
4Bower has reported experimentally measured stresses in
wide-flange beans with web openings. He made use of electrical
resistance strain gages to determine these stresses in a series
of tests on A36 steel wide-flange beams weighing 36 lbs, per
ft. (16KF36). Rectangular and circular holes were studied with
all holes cantered on the centroid axis of the beam. All
specimens were tested as simply supported beams and were loaded
with one or two concentrated loads. Based on this investiga-
tion, it was concluded (1) the theoretical results based on
the theory of elasticity and the Vierendeel Method are correct,
and (2) the elasticity analysis is complex and requires a
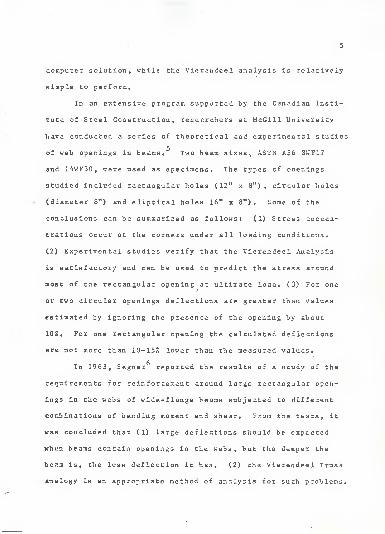
computer solution, while the Vierendeel analysis is relatively
simple to perform.
In an extensive program supported by the Canadian Insti-
tute of Steel Construction, researchers at McGili University
have conducted a series of theoretical and experimental studies
of web openings in beams* Two beam sizp.s, ASTM A36 SWF17
and 14WF30, were used as specimens. The types of openings
studied included rectangular holes (12" x 3"), circular holes
(diameter 8") and eliptical holes 16" x 8"). Some of Che
conclusions can be summarized as follows: (1) Stress concen-
trations occur at the corners under all loading conditions.
(2) Experimental studies verify that the Vierendeel Analysis
is satisfactory and can be used to predict the stress around
most of the rectangular opening at ultimate load. (3) For one
or two circular openings deflections are greater than values
estimated by ignoring the presence of the opening by about
10%. For one rectangular opening the calculated deflections
are not more than 10-15% lower than the measured values.
In 1963, Segner reported the results of a study of the
requirements for reinforcement around large rectangular open-
ings in the webs of wide-flange beams subjected to different
combinations of bending moment and shear. From the tests, it
was concluded that (1) large deflections should be expected
when beams contain openings in the webs, but the deeper the
beam is, the less deflection it has, (2) the Vierendeel Truss
analogy is an appropriate method of analysis for such problems.
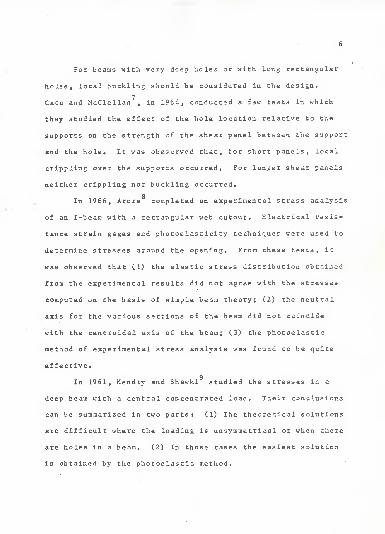
For beams with very deep holes or with long rectangular
holes, local buckling should be considered in the design.
Cato and McClellan , in 1964, conducted a few tests in which
they studied the effect of the hole location relative to the
supports on the strength of the shear panel between the support
and the hole. It was obaserved that, for short panels, local
crippling over the supports occurred. For longer shear panels
neither crippling nor buckling occurred.
aIn 1966, Arora completed an experimental stress analysis
of an I-beam with a rectangular web cutout. Electrical resis-
tance strain gages and photoelasticity techniques were used to
determine stresses around the opening. From these tests, it
was observed that (1) the elastic stress distribution obtained
from the experimental results did not agree with the stressesr
computed on the basis of simple beam theory; (2) the neutral
axis for the various sections of the beam did not coincide
with the centroidal axis of the beam; (3) the phctoelastic
method of experimental stress analysis was found to be quite
effective.
9In 1961, Hendry and Shawki studied the stresses in a
deep beam with a central concentrated load. Their conclusions
can be summarized in two parts: (1) The theoretical solutions
are difficult where the loading Is unsymmetrical or when there
are holes in a beam, (2) In those cases the easiest solution
is obtained by the photoelastic method.
EXPERIMENTAL PROGRAM
1, Introduction
The purpose of this investigation was to determine
experimentally the stresses in a wide-flange bean with a web
opening, and to compare these experimental stresses with those
predicted by theory. The entire experimental program, in-
cluding the determination of beam dimensions and physical
properties, the design of the test program, the design of the
test beam and set up, the instrumentation, and the test pro-
cedure, were planned to achieve this purpose.
2. Determination of Beam Dimensions and Physical Properties
It was anticipated that the actual dimensions of the
wide-flange specimen would vary somewhat from the nominal
dimensions, and that the actual physical properties would be
different from the nominal values specified for ASTM A36 steel.
For an accurate calculation of theoretical values of stresses
and deflections, it was necessary to determine the actual cross-
section dimensions and physical properties of the test beam.
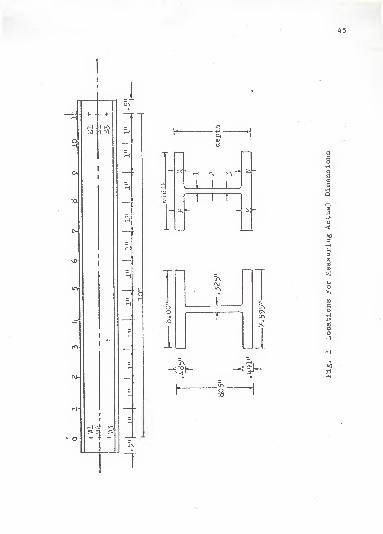
In determining the actual cross-section dimensions, the
beam was laid out in twelve sections as shown in Fig. 1. At
each of these sections, the flange width and beam depth were
measured. The thickness of the top and bottom flanges were
measured at two points on each of the twelve cross sections,
and the web thickness was determined at three points at each
end of the beam. These measured dimensions are presented in

8
Table 1, The average values, also shown in the table, were
used in all subsequent calculations.
For the purpose of determining the actual physical
properties, six tensile coupons were taken from a section
or the test beam after all tests had been completed, Two
coupons were cut from each flange and two from the web of
this section, as shown in Figure 2,
The dimensions of all the tensile coupons were bfised on
ASTM standards for physical and mechanical testing of material
and are shown in Fig. 2, The coupon test: results are listed
in Table 2, and are compared with the nominal values iii Table 3.
A typical stress-strain diagram is shown in Fig, 3, The results
indicate that the yielrf stress, ultimate tensile strength and
the modulus of elasticity of the flanges were a little different
from those of the web.
11
3, Test Program
The testing program was divided into four parts. Ini-
tially, for Case I, the beam was tested without a web opening.
The deflections of the beam were recorded for 3 different
loads, ranging from 0-16000 lbs, in 2000 lb, increments.
For Case II, a 2" x A" opening with 1/2" radius rounded
corners was cut in the web at the quarte rpoir.t of the span.
Leads were applied in 4000 lb, increments up to the maximum
load of 16000 lbs. Strain gage, deflection and photostress
readings were taken at each load.

For Case III, the opening was enlarged to 4" x 6" with
the same size corner fillets as Case II. The same loading
range and measuring procedures were employed as in Case II.
For Case IV, the beam was painted with a whitewash
coating and was then subjected to an ultimate strength test.
4. Test Beam Fabrication
The experimental phase of this study was conducted on an
ASTM A36 wide-flange beam having a depth of 8" and a weight of
35 lbs. per ft. (8WF35), with a rectangular opening in the web.
For Case II, the rectangular opening in the web was cut to the
dimensions of 2" x 6" at the quarterpoint of the span with
the corners of the opening rounded with 1/2" fillet. The
opening was fabricated by first using a high speed drill to
drill 1" diameter holes at the four corners of the opening,
then using a high speed vibrating saw to cut out the sides of
the opening. The final finishing work was done with sand
paper, polishing the rough sides of the opening and the web
near the opening to facilitate the attachment of the strain
gages and photostress coating.
5. Photostress Measurements
a. Principle of Photostress Measurements
The principal purpose of photostress measurements
is to determine the direction, magnitude and sign of the prin-
cipal strains at any point on the surface of a structural
member. For this investigation , a large Field Meter (LF/M)
10
with Its accessories was used to determine isoclinics and
isochroraatics from point to point for the purpose described
above. The term "Isoclinic" is defined as a locus of points
along which the directions of the principle strains are constant.
"Isochromatic" is defined as a locus of points along which the
magnitude of the principle strain difference is a constant.
b. General Procedure for Photostress Readings
The Large Field Meter consists of a polarizer and
analyzer arranged so that the light from the polarizer strikes
the photostress plastic sheet and is reflected back to the
analyzer as shown in Fig. 4. The Analyzer consists of a
quarter wave plate and an analyzer ring with a scale for measur-
ing the isochroraatics. The polarizer consists of a quarter
wave plate which is coupled together with the analyzer so thati
they can be rotated simultaneously, and the different isoclinic
angles can be read on the isoclinic scale. Fig. 5a illustrates
the optical system used In this LF/M. The Quarter Wave Plate
Is not used in the system for setting the LF/M with plane
polarized light (Fig. 5a) , and the analyzer handle is rotated
either clockwise or counterclockwise in order to produce aa
isoclinic which is parallel to the direction of principle
strain e. at a particular point of interest. The LF/M is
then changed to circular polarized light (Fig. 5b) so that
the isoclinics are removed, and isochromatic readings are
recorded by rotating the analyzer ring either clockwise or
counterclockwise until a fringe falls exactly on the same
particular point*

11
c. Procedure for Fringe Order Between Zero and One
For the present case, since there was a large open-
ing in the web, sufficient load could not be applied to develop
a full fringe at many points on the plastic sheet. Therefore,
the Full Wave Plate and Compensator were mounted on the
analyzer Quarter Wave Plate. The Compensator was used to deter-
mine between which two fringes the point of interest lay and
the full wave plate was used for analysis between zero and the
first fringe. For using the Full Wave Plate and Compensator,
it was necessary to note that the compensator and the Full Wave
Plate were added only when the analyzer handle and the direction
of the major principle stress were parallel. With the Compen-
sator parallel to the direction of the major principle strain,
a zero fringe should appear at the point of interest. Thus the
compensator was used to distinguish whether the zero fringe
appeared or not. If the zero fringe appeared, the analyzer
handle was parallel to e. , otherwise it was not. If it was not
parallel to e .. , the analyzer handle was rotated clockwise or
counterclockwise through 90° from its original position. After
the direction of principle stress had been determined, an
accurate measurement could be made by use of the Tardy
w „. . 8,15,16Method. '
d. Preparation of Specimen
Budd Type S photostress sheet plastic was selected
and cut to the required dimensions by using a special model
making kit. Budd Photostress RCT (S&A) reflective cement,
resin and hardener were used to fasten the plastic sheet to
12
the web of the beam. The bonding agent was poured and brushed
uniformly on the web surface approximately 1/16" thick. Cel-
lophane tape was used to hold the plastic sheet in position
during curing, with no pressure being applied. The bonding
was complete after 24 hours at a temperature of 75°F. Figure
6 shows the location of the plastic sheet on the web of test
beam for Cases II and III.
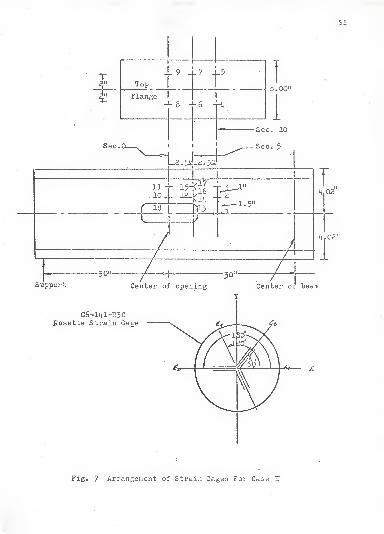
6. Electrical Resistance Strain Gage Measurements
Budd Metal film C6-141-R3C, C6-141 and C6-141B gages,
which are temperature compensated for steel, were used in this
investigation. These gages were mounted at the locations shown
in Figs. 7 and 8 with Eastman 910 cement. C6-141 and C6-141B
gages were used to measure longitudinal strains, while the
rosette gages (C6-161-R3C) were used to measure both longitud-
inal strains and shearing strains. Eooke's law was used to
convert the strains to stresses using the values of the modulus
of elasticity and Poisson's ratio given in Table 3. The strain
gages were connected to a Budd Model A 110 D strain indicator
used in conjunction with a Budd Model C-101-C switch and
balance unit. An automatic printer was also used for facilitat-
ing the handling of the data.
7. Deflection Measurements
In Cases I, II, and III, dial gages with 1/2" stroke
were used at the quar terpcints and midspan of the beam to meas-
ure deflections (see Fig. 9) in the elastic range. In Case IV,
a -dial gage with a 2" stroke was used at midspan to measure the

13
deflection from the elastic range until the ultimate load was
attained. The locations of the dial gages for Cases I, II,
and IV, are shown in Figs. 9 and 10.
8. Test Setup
For all the tests, the beam was loaded as a simple sup-
ported beam with one concentrated load at midspan. The load
was applied through a steel block which was placed on the center
line of the top flange. A 20 ton screw type testing machine
was used to apply the load. The beam was aligned as closely
as possible with the testing machine and supports so as to
avoid any twisting. A sketch of the test set-up is shown in
Fig. 9 and a photograph is shown in Fig. 10.
9. Test Procedure ,
After recording the readings of all the instruments at
zero load, a load increment was applied and held while a second
set of readings was taken and recorded. Additional load incre-
ments were applied and held for measurements until the maximum
load of the test was reached. For Case IV, the test was con-
tinued into the inelastic range until the ultimate load was
attained, with visual observations of the behavior of the beam
and the mode of the failure being recorded during this portion
of the test.

14
TEST RESULTS
J , In troclucf. ion
Figures 14 through 31 present graphically the data taken
during the test program. Ar. analysis of this data, which in-
cludes deflections, electrical resistance strain gage readings
,
and photostress readings, is presented in this section.
2, Deflections
a. Elastic Range
As shown in Figs, 9 and 10;
the deflections were
measured with 3 dial gages located at the quarter points and
at midspan. The experimental and theoretical values of the
deflections cf the test be->; without a web opening are given
ill Fig, 14 while those for Cases II and III (with an opening)
are given in Figs, 15 and 16, respectively.
The theoretical elastic deflections were calculated using
the. following equations. Equation 1 was used to calculate the
deflection of the test beam without the opening; Eq, 2 was
used for t h e beam with an opening.
*. -I £f d, f ,
ACdx (1)
X. f >!m A I. t Ml116 " L, « dX + k ^-TT < X + y
i~b
,VV Ak — d xAG
): (a- a, )Gdx (2)

15
where I = moment of inertia of the gross beam, I = moment of
inertia of a section through the opening, A = area of the
gross beam, and A = area of a section through the opening.
All of these section properties were calculated from measured
cross section dimensions. A value of E = 2.96 x 10 psi was
obtained from the coupon tests, and a value of G 11.15 x 10
psi was obtained by assuming Poisson's ratio u = 0.3. In
Eqs. 1 and 2, k is the shear shape factor and is approximately
equal to the ratio of the total area to the web area for wide-
*i v 12flange beams.
Comparing the theoretical and experimental deflections
of Case I as shown in Fig. 14, it was found that the theoretical
values calculated using Eq. 1 agreed quite well with the dial
gage readings, with a 1% difference at midspan and a 0.5% dif-
ference at the quarter points. These small differences may be
attributed to factors such as the web of the beam being slightly
inclined, the two ends of the machine table bending slightly
due to the applied load, or a small twisting stress developing
due to slightly non-parallel flanges on the test beam.
The deflections for Cases II and III are shown in Figs.
15 and 16. The differences betx^een the theoretical values
calculated using Eq. 2 and the experimental data are summarized
in Table 4. From the table, it can be seen that the deflections
of a beam with a web opening are substantially larger than the
beam without an opening. Since the experimental and theoretical
deflections were in close agreement, it has been demonstrated

16
that Eq. 2 is a very good tool for determining the deflections
of a beam with a large web opening in the elastic range.
b. Ultimate Load Test
Experimental and theoretical load deflection curves
from the ultimate load test are given in Fig. 17. The theor-
etical curve was calculated using simple plastic theory in
the inelastic range and using Eq. 2 in the elastic range.
From Fig. 17, it is evident that the experimentally deter-
mined load-deflection curve is quite close to the idealized
load deflection curve calculated by plastic theory. The
theoretical ultimate load based on simple plastic theory and
the yield point determined from the tensile coupon tests was
43.5 kips. The experimental value of the ultimate load at the
beginning of the yield plateau was about 44.5 kips. As further
deflection was imposed on the specimen, the load increased
slightly, probably due to strain-hardening in the extreme fibers
of the cross section. The ultimate load test was terminated
when the midspan deflection was about five times the maximum
elastic deflection.
3. Electrical Resistance Strain Gage Readings
The linear relationship between uniaxial stress and
strain which exists within the elastic range of a material is
well known. Hence, the bending and shearing stresses in the
test beam could be determined experimentally by using strain
gages oriented in the direction of the desired stresses. As
previously mentioned, 12 Budd C6-141-B strain gages and 2

17
Budd C6-161-R3C rosette gages were used in the present inves-
tigation to investigate bending stresses along the vertical
sections "0", "5", and "10", and shearing stresses along
vertical section "5", as shown in Figs. 7 and 8.
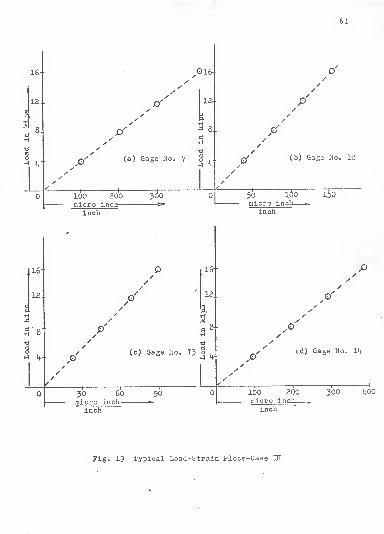
The strain gage readings were recorded for four different
load levels during the Case II and Case III tests. These
readings are presented in Tables 5 and 6 for Cases II and III,
respectively. Typical load-strain curves for one flange gage
(No. 4) and one rosette (Gage Nos. 12, 13, and 14) are shown
in Figs. 18 and 19 for the two cases. From these figures and
other similar plots which are not shown here, it was found that
all the strain gages yielded data which was linearly related
to the applied load.
The normal bending stresses were calculated using Eq. 3
and are given in Table 7 for Case II and In Table 8 for Case III.
c E • £x
(3)
where o normal bending stress; E - Young's modulusx
3{29.6 x 10 ksi) and e = strain gage reading.
For measuring shear stresses along vertical section "5",
2 Budd C6-141-R3C strain rosette gages were used with the three
measuring grids arranged 120° apart. (See Figs. 7 and 8).
In order to determine the shear strains, substitution of the
data into the following general strain equation was necessary.
e +e_* Y.
e -e_* Z cos 29 - xv sin 20 (4)
18
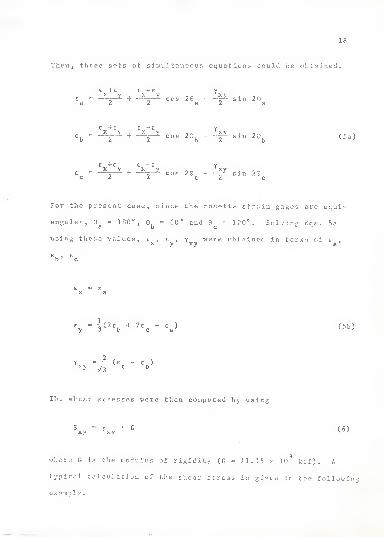
Then, three sets of simultaneous equations could be obtained.
e » * y .«- * y cos 20 ^- sin 2a 2 2 a 2 a
e +e e -e. x y 4. -JL—
v
cos 20Y xv .
b 2- sin 20, (5a)
E +e £ -e ye » -~~-£ + * y cos 20 1£ sin 20c 2 2 c 2 c
For the present: case, since the rosette strain gages arc equi-
angular, = 180°, 0, = 60° and = 120°. Solving Eos. 5aa d c ci
using the so values, e
b c
x y 'xyy viere obtained in terms of £ ,
£ - Ex a
£ = -r(2e, + 2e -e)y 3 b c a
(5b)
>y ^ c b
The shear stresses were then computed by using
S «= y • Gxy xy (6)
where G is the modulus of rigidity (G •» 11.15 x 10" ksi). A
typical calculation of the shear stress is given in the following
examp 1 a
.

19
Example
:
The No. 12-13-14 rosette gage was located 1/2 Inch above
the opening along vertical section "5" (see Fig. 7) and
j i j j _l jj •in/ -»o irto , Micro-inches..yielded the readings e +104, e, » -78, e » -r308 ( ; -
)1 6 a 'be inch
due to a midspan load of 1600 lbs.
e -+104 9 « 180°a a
e, » -78 V = 60°D
e = +308 9 - 120°c c
e e = 104 (micro-inches/inch)x a
c * -|[2(308-78)-104] = 119y 3
Y - -[308-(-78)3 =2 X ? 86 = 446^ /3 /3
For normal bending stresses
C - E-e = 29.6 x 106
x 104 x 10~ 6= 3020 psixx r
S - Y *G = 446 x 10~ 6x 11.15 x 10
6= 4980 psixy xy r
The shear stresses along vertical section "5" calculated
from Eqs. 5b and 6 were 4.12 ksi and 4.98 ksi for the rosettes
located 1 1/2 in. and 1/2 in., respectively, above the opening
of Case II. For Case III, the corresponding maximum shear
20
stress was 6.45 ksi for the rosette located 1/2 in. above the
opening
.
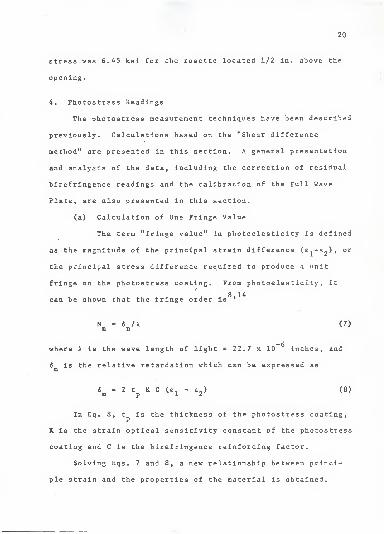
4. Photostress Readings
The photostress measurement techniques have been described
previously. Calculations based on the "Shear difference
method" are presented in this section. A general presentation
and analysis of the data, including the correction of residual
birefringence readings and the calibration of the Full Wave
Plate, are also presented in this section.
(a) Calculation of One Fringe Value
The term "fringe value" in photoelas ticlty is defined
as the magnitude of the principal strain difference (e.-e-), or
the principal stress difference required to produce a unit
fringe on the photostress coating. From photoelas ticity , it
can be shown that the fringe order is8,14
N 6 An (7)
-6where X is the wave length of light 22.7 x 10 inches, and
6 is the relative retardation which can be expressed asn r
6 n - 2 t K C (e. - e,)n p l /
(8)
In Eq. 8, t is the thickness of the photostress coating,
K is the strain optical sensitivity constant of the photostress
coating and C is the birefringence reinforcing factor.
Solving Eqs. 7 and 8, a new relationship between princi-
ple strain and the properties of the material is obtained.

21
(e. - e ) - X N /2t K-C1 z n p
(9a)
(£1 " e 2> ' f ' N
n(9b)
where f is the fringe value (_ ' . ) and N is the fringe order2. t kg n
P(isochromatic reading).
For the present investigation, since a photostress coating
of type S was selected, the properties of the material were
given in Budd Bulletin BN 8002 and therefore:
t .118 inchesP
K = .085
C was taken equal to 1, since there was no bending in
the plane of the plastic sheet ' * . From £qs. 9a
and 9b,
f - X/2t «K*CP
(22.7 x 10" 6)/2x«118x- .085
1200micro-inches
inch
Assuming N = 1
(c. - e_) « f-N = 1200 x 1 = 1200 m^ro-inches12 n inch
Converting this principle strain difference into a principle
stress difference.

22
(al " °2 }
= (£1
e2)E/(l+y) (10)
Assuming v " 0.3 (Poisson's ratio for ;;teel) and using E =
329.6 x 10 ksi fro;.: the tensile coupon tests,
(o - o2
) = 1200 x 10~ 6x 1296 x 10
6)/(l+0.3)
- 27200 psi
This means that 27.2 x 10 psi is required to produce one fringe
of birefringence in the type S plastic, sheet.
b. Calibration of Full Wave Plate
As described previously, sufficient load could not
be applied to develop one fringe or more at most points on the
photostress coating in the two test cases, since there was a
large unreinforced opening in the web of the beam. Therefore,
the Compensator and Full Wave Plate were needed to observe the
biref i ingence between zero and the first fringe. However, the
Full Wave Plate usually has some initial errors and must be
calibrated with the compensator. The. calibration procedure con-
sists of two steps:
S_£e.2 1. Polish a very smooth surface along the opening
and observe this uncoated reflective surface through the Full
Wave Plate.
Sj^ep__2. Rotate the analyzer ring clockwise or counter-
clockwise until a purple color appears, called the tint of
passage .
For the present case, the tint of passage appeared at a
reading of ,03 with a counterclockwise rotation of the analyzer

23
ring. Since all the isochromatic readings were measured with
a clockwise rotation of the analyzer ring, all of these iso-
chromatic readings were increased by .03.
c. Correction of Residual Birefringence Readings
Since some residual birefringence was present in
the photostress coating, a zero load correction was necessary.
With increases in the load, it was found that the isoclinics
did not change much. Therefore, it was possible to add and
subtract the zero load readings to obtain corrected readings.
The birefringence readings at each point for four different
loads were taken. A straight line graph was then drawn to
see if the straight line passed through the origin. If the
line did pass through the origin, there was no residual bire-
fringence at that point; otherwise, a parallel straight line
was drawn through the origin to correct for residual birefrin-
gence. Some of these graphs are shown in Fig. 20. The cor-
rected isoclinic and isochromatic readings for each point in
Cases II and III are given in Tables 9 and 10, respectively.
8 1 fi
(d) Shear Difference Method »
A convenient method to determine the normal stresses
8 16at interior points on the web is the shear-difference method '
This method is based on the equations of equilibrium, which,
when applied to the two dimensional stress problem, reduce to
3o3
ax
ss
3y(11)
3o}
9y
as
dx- (12)

24
Equation 11 can be integrated along the x-axis (Fig. 21),
according to the relation
i
x 3o x 3S
axdx + dx
This equation can be evaluated by applying the Finite-Difference
Method, where the partial differences are replaced by the
stress differences as shown below,
/
x. So
O
/x, 3S1 xy A~* d:
3x
AS= [—EL] . t1
AJ x +x, x
y o l
AS
and therefore Eq. 11 can be formed as Eq. 13.
AS
x 1 x o A
xv(13)
If the procedure is continued stepwise, as indicated in Eq. 13,
all of the a -values can be determined all along a line seg-
ment.
AS{a )= (o ) -I —^ A
x 1 x o A x
(0,) 2- U^- l^K
AS( °x>3 " (o
x }2
" ZJEXA x7

25
The value of the transverse stress, o , for any point can
be computed from Mohr's circles of stress (Figs. 22 and 23)
and is given by the following equation:
a - a ± /(a ,-a„) 2 - 4S 2v x 12 xy (14)
Ihe normal bending stress at a point along any vertical
section can also be found in a similar fashion by summing up
forces in the vertical direction. Starting from any point
along a horizontal section, and either going up or down from
there, the transverse stress, a , is given by
ASa « (o ) - I _-*£y y 4 a x
(15)
a can also be obtained by applying Mohr's circle;
o - ax y
* /(o ,-o.) 2 - 4S 2
J. 2 xy (16)
From Fig. 22, the shear stress at any point in the
two dimensional stress plane can be determined from Mohr's
circle.
Sxy "
2( °1 ~ °2 ) S±n 2G (17)
In this investigation, the isochronatic readings, iso-
clinic angles and the properties of the phctostress coating
were punched on IBM cards, so that much of the stress calcula-

26
tion could be performed on the 1620 digital computer. The
computer program used for determining the shear stresses and
some of the quantities required for the normal stress calcu-
lations are shown in Appendix A. A sample of the input data
for the computer program is given in Appendix Table Al, and
a sample output is given in Table A2.
The procedures for calculating normal stresses a and a
are described in greater detail in Ref. 8. For the present
investigation, an example of the calculation of the normal
stresses o and o , based on Eqs. 15 and 16, the proceduresxy n
of calculation described in Ref. 8, and some data from the out-
put of the computer program, are shown in Tables 11 and 12, for
Case II, in Table 13 for Case III.
I

27
COMPARISON OF THE RESULTS AND DISCUSSION
Figures 24 through 31 present a comparison of the stresses
obtained from the strain gage data, the photostress data and
from a theoretical analysis based on the "Vierendeel Method",
which is described in Appendix B.
The normal bending stresses, o , along vertical section
"0" are shown in Figs. 24 and 28 for Cases II and III, respec-
tively. For the two cases, the strain gage readings on the
web and the average value of two strain gage readings on the
flange have been plotted with circles in these figures. Since
the isoclinic and iscchromatic readings were not measured at
the left side of section "0", there is no photostress data
shown in these figures. The theoretical values calculated
from the "Vierendeel Analysis" have been plotted with a solid
line in the figures for the two cases and indicate very good
agreement with the strain gage data.
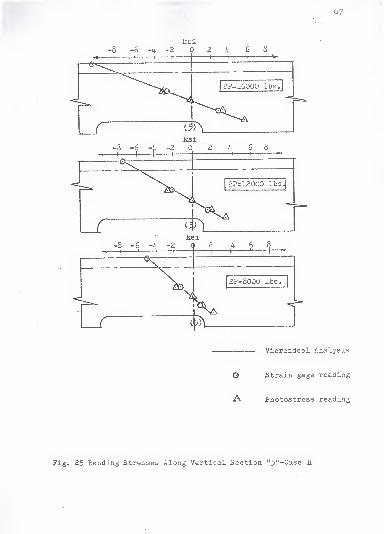
The normal stresses along vertical section "5" are shown
in Figs. 25 and 29 for Case II and III, respectively. The
strain gage data and theoretical values (Vierendeel Analysis)
have been plotted in the figures, in the same manner as des-
cribed above, while the photostress readings along this section
are shown with the triangular points.
Along section "5", the experimental data from the photo-
stress and strain gage readings agree reasonably well with
each other and also are in good agreement with the predictions
based on the Vierendeel Analysis. Thus it can be concluded

28
that the "Vierendeel Analysis" gives a good estimate of the
normal stress distribution in the region above, the web
opening
.
The experimentally measured normal stresses along vertical
section "10" are shown in Figs. 26 and 30 for Case II and III,
respectively, using the method described above, and are compared
MYwith simple beam theory (a = -=-) , which is plotted as a solid
line.
From these figures, it can be seen that the photostress
readings agree quite well with the strain gage readings at all
of the points along this section. However, the experimental
data does not agree with the theoretical values calculated
using simple beam theory. This difference may be explained by
the fact that vertical section "10" is located in the region
which is affected by the stress concentrations caused by the
large web opening. This can be seen by comparing the normal
stresses at the point (10,0), where the experimental values
are large compressive stresses In Case II (Fig. 26). For Case
III, a small tension stress occurred at the same point when
the opening was enlarged to within 1/2 Inch below the point
shown in Fig. 30. Hence, it may be concluded that the normal
stress distribution is non-linear, and simple beam theory
is not suitable for determining the stresses in certain areas
influenced by the stress concentration pattern. Generally
speaking, these areas may cover the range from the edge of
the opening to a distance about equal to the depth of the
opening from the boundary of the opening.

29
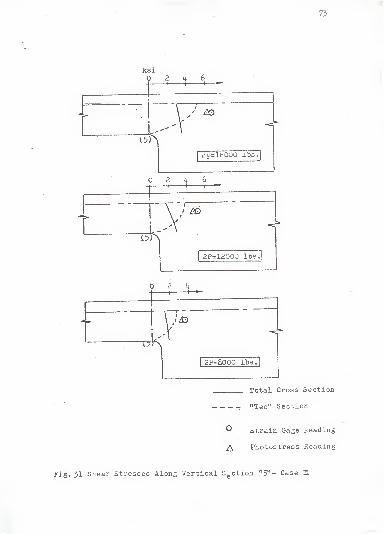
Shear stresses along vertical section "5" are shown in
Figs. 27 and 31 for Cases II and III, respectively. For
both cases, the rosette strain gage readings agree quite well
with the photostress readings. The theoretical values calcu-
VQlated from simple beam theory, S * =?•, have been plotted inv J xy Id
"
the figures. The solid lines are for shear stress calculated
assuming that the total net cross section (gross section minus
web opening) is effective in resisting the total shear force
V P , while the broken line is based on the assumption that
the "Tee" section between the top cf the opening and the top
flange resists one-half of the total shear force. Comparing
the theoretical values x^ith the experimental data, it was found
that the experimental data at points close to the boundary of
the opening such as point (5,2) for Case II and point (5,0)
for Case III, gave higher shear stresses, than the theoretical
values. This may be attributed to the influence of the stress
concentrations at the corners of the opening. Finally, it can
be concluded that, due to the large shear stresses near the
web opening, cracks could develop at the corners before the
load capacity of the beam is attained.

30
CONCLUSIONS
From the comparison of the experimental and theoretical
values obtained in this investigation, the following conclu-
sions can be formulated:
1. Larger deflecr.ions are to be expected in a beam with
a large opening in the web . Equation 2 has been demcnstraced
to be a good tool for determining the deflections of a beam
with a large web opening.
2. For rectangular openings, the so-called "Vierendeel
Method" provides a very good prediction of the normal stresses
above or below the web opening.
3. The normal bending stress distribution is non-linear
in a region extending from the edge of the opening a distance
about equal to the depth of the beam from the opening, and
simple beam theory can not be used to predict normal stresses
in this region.
4. Greater shear stresses occur near the web opening than
are predicted by beam theory.
5. The photostress method of experimental stress
analysis and the electrical resistance strain gage techniques
were found to be quite effective for determining stresses in
the test beam.
6. The "Shear-difference" method was demons trated to
be an excellent method for computing the stresses at the
interior points of a structure.

31
RECOMMENDATIONS FOR FURTHER STUDY
This study could be extended to investigate the stress
distribution and deflections of a beam with different loading
positions or different shapes of openings such as circles,
ellipses, pentagons, hexagons, octogons, etc. Moreover, a
theoretical solution for the stress distribution in the area
where simple beam theory can not be applied should be developed
Another important topic for further study is the deter-
mination of economical reinforcement requirements for beams
with web openings.

32
ACKNOWLEDGMENTS
The author expresses his sincere appreciation to Dr.
Peter B. Cooper, Associate Professor of Civil Engineering
at Kansas State University, for his valuable guidance in
the research and constant encouragement during the writing
of this thesis. Without his efforts this research would
not have been possible.
Thanks are also extended to Dr. Jack B. Blackburn,
Head of the Civil Engineering Department, Dr. Robert R.
t
Snell, and Dr. Harry D. Knostman for serving on the advisory
committee.
Appreciation is also due to Mr. S. H. Hunter and Mr.
W, M. Johnston for helping the author with the experimental
portion of this investigation, and to Mrs. Linda Bailey fori
her valuable assistance in typing the manuscript of this
thesis. „
33
CD
co
CD
sa)
e
rHCC
*->
O
rH
a)
rH
H
ai
1
CM rHO COm <•
mrH Ooi co-3- sr
ino
ino cnO Cn
00 co r*.
rHi-l
CM -*O r-»3 a\co r^ cno
00
<-i 00O cn
oo r~
OrH
CM CMO COm <•
cm r^a> oo-3- -tf
CIoCO
o 00o cn
co r*»
C\
m voO COm -3-en oo
oCO
O Ho oco oo
CO
<r oO COin <
<-i CMen oo-* -3- o
co
rH OO O00 00
r^
CM CMO l*«m -3-
en r^ oo00
O f-iO Ooo oo
vo
oo o<r -3-
r» <-h
oo r-»-3" -3-
vOoCO
cn or-» oo
mO 00O r-.
m <*co oo-3- -3-
moCO
oo oc\ or-s oo
-*O COm -J-
vo men co< -3- o
CO
o oo
oo r*
CO
VO COO COm •<*
O voo ooin -3-
vOo00
h oo oco co
CM
m oO COm -a-
r-~ r-.
CTi 00-3- <•
^oo00
o ooo oo
!-i
co r»O o\co r-»
en r>»-3- -*
<*o00
CO rHcn or^ oo
o en en-3- «5f
m cmoo r»-3- vr O
00
oo ena\ cn
w /Cm /
/ «/ •
|J
/ M
c a c c•H -H
Cl-
in
•H .-H
a. wo o
cu
cP. t«
O rHH fa
E a)O 60•M C4-1 cfl
O rHm fa
4J
a,<u
a
a)
G *>CO T3rH -Hfa 3
•
a> in> CM< CO
•
mCO CMW CO
•
-3-
CM CMfa CO
•
r^H CMfa CO
•
sOCO CMS CO
"
vOC-i CM& CO
•
r^rH CM3 CO
. /CO
4J / coP-l / a)
/ GI X1 aI •H/ r3J 4-1
/e/CU ,o/ ^ V/m 5B

34
Table 2. Results, of Tensile Coupon Tests
fc
cwc
in
ay
au E
xo6
ss
in in KSI KSI % per 2in
TBI .5030 .4930 .248 36.0 66.2 31.3 42.2%
TB2 .5035 .4835 .243 36.1 65.6 30.9 39.8%
TT1 .5000 .493 .246 35.7 65.9 31.9 38%
TT2 .5030 .486 .245 36.3 65.05 31.3 40.6%
TW1 .4985 .3270 .163 46.8 69.5 32.1 34%
TW2 .4995 .3260 .1625 51.00 70.0 28.3 ' 31.2%
Table 3. Actual and Nominal Properties of 8W35 Beam
-
DlHENSION. PHYSICAL PROPERTIESSECTION
PROPERTIESREFERENCE
LOADS
d b Cf
Cw E fj cy
au
s z Py Pu
UNITS in. in. in. in. ksi ksi ksi in m kip kip
NominalValues
8.12 8.027 .493 .315 29,000 .30 . .36 60 31.1 34.7 36 41.7
ActualValues
8.05 8.00 .485 .32531^400* .,n29,600
" JU 36.2 66.2 31.77 36.07 40 43.5
1
*E - 51,400 ksi for the flanges and 29,400 ksifor the web.

35
Table 4. Comparison of Theoretical and. Experimental Deflections -
Cases II and III (Elastic Range)
.
^ ITEMS
CASES X.
EXPTL.
(in.)
Theory, Eq.
J
data Difference(in • ) %
Theory, Eq . 2
data Difference(in.) %
** .1985 .1802 + 9.1 .196 + 1.26
II Aw .1470 .1260 + 14.3 .143 + 2.5
*e .1381
.2041
.1260
.1820
+ 9.5
+ 11.0
.136 + 1.45
.202 + 0.9A<
m Aw .147 .1260 + 14.4 .145 + 1.36
Ae .142 .1260 + 11.7 .1425 + 1.03
At-J
AJ>

36
Table 5. Strain Gage Readings - Case II
Strain
GageNo.
Strain gage readings in micro-inches /inch
4000lbs
8000lbS
12000lbS
l6000lbS
1 -2 -4 -6 -8
2 +5 +9 +12 +17
3 -30 -60 -90 -120
4 -86 -169 -253 -338
5 -86 -167 -253 -337
6. -87 -169 -254 -339
7 -85 -168 -255 -342
8 -68 -131 -196 -262
9 -65 -129 -196 -262
10 -25 - 49 -74 -99
11 -43 -84 -124 -168
12 +27 +53 • +78 +104
13 -18 -38 -60 -78
14 +77 +152 +228 +308
15 -27 -56 -84 -112
16 -22 -44 -66 -88
17 +52 +102 +154 +206
18 -17 -34 -52 -68

37
Table 6. Strain Gage Readings - Case III
StrainGageNo.
Strain gage readings in micro-inches/inch
4000lbS
8000lbS
12000lbS
16000lbS
1 -1 -2 -3 -4
2 +21 +41 +63 +37
3 +3 +6 +9 +13
4 -95 -192 -290 -384
5 -92 -187 -285 -380
6 -106 -214 -322 -429
7 -104 -212 -315 -431
8 -67 -133 -199 -264
9 -62 -125 -196 -265
.10 -35 -71 -109 -140
11 -43 -90 -136 -176
12 +40 +80 ,+120 +160
13 -25 -50 -75 -100
14 +100 +200 +300 +400

38
Table 7. Calculation of Stresses From Strain Gages at Load 16
. Case II.
Strain
Gageat
No.
Co-ordinatesinches
StrainGage
ReadingMicro-inches/ in
.
LongitudinalStress
cx psi
UpperFlange(4, 5) (10, top) -338 10700*
3 (10, 0) -120 -3480
2 (10, 2) +017 +494
1 (10, 5) -8 -232
(6, 7) (5, top) -340 10762*
15 (5, 0) -112 -3250
12 (5, 2) +104 +3020
(8, 5) (0, top) -262 8270*
11 (0, 0) -168 -4870
10 (0, 2) -99'
-2870
18 (0, 3) -68 -1988
* Strain gage reading times EL = 31,600 ksi., others times E = 29,600 ksi
39
Table 8. Calculation of Stresses From Strain Gages at Load 16
- Case III
Strain
GageNo.
At
Co-ordinatesinches
StrainGage
ReadingMicro-inches / in
.
LongitudinalStress
a psi
(A, 5) (10, top) -382 12000*
3 (10 0) +13 +377
2 (10 2) +87 +2520
1 (10, 5) -4 -116
(6, 7) (5, top) -43013600*
12 (5, 0) +160 +4640
(8, 9) (0, top) -2653400*
(ID (0, 0) -176 -5100
(10) (0, 1) -142 -4060
*Strain gage reading times E = 31,600 ksi., others times E =-29,600 ksi.
40
Table 9. Isoclinic Angles and Isochromatic Reading - Case II
,oads 16000
ISOCHROMATICifers- , ^IfrS—
READING12000' 8000 4000
tt«-ISOCLINIC
1
2
2
2 1
2 2
4
4 1
4 2
5
5 1
5 2
6
6 1
6 2
6 3
6 4
6 5
8
8 1
8 2
8 3
8 4
8 5
10
10 1
10 2
10 3
10 4
10 5
12
12 1
12 2
12 3
12 4
12 5
.240
.120
.390
.245
.08
.380
.395
.270
.280
.320
.410
.186
.280
.300
.440
.49
.330
.220
.220
.190
.330
.600
.675
.310
.190
.310
.360
.475
.490
.250
.240
.300
.305
.430
.460
.170
.08
.290
.185
.060
.290
.300
.200
.210
.240
.300
.140
.170
.225
.325
.37
.250
.170
.170
.140
.400
.450
.500
.250
.140
.230
.290
.315
.360
.290
.180
.230
.225
.320
.350
.120
.050
.195
.120
.040
.190
.200
.130
.193
.160
.210
.095
.140
.150
.215
.25
.170
.110
.120
.100
.260
.300
.340
.150
.095
.150
.190
.235
.250
.130
.120
.150
.155
.210
.230
.060
.025
.095
.060
.020
.095
.100
.065
.070
.080
.106
.050
.070
.075
.125
.125
.080
.050
.060
.050
.130
.150
.170
.075
.050
.090
.095
.120
.125
.065
.060
.075
.080
.110
.120
63.0
28.0
55.0
49.0
16.0
56.0
50.0
35.0
52.0
50.0
36.0
73.0
62.0
53.0
0.00
0.00
0.00
80.0
45.0
21.0
27.0
36.0
47.0
60.0
44.0
38.0
36.
q
38.
Q
47.0
61.0
44.0
32.0
36.0
38.0
43.0

Table 10. Iscclinic Angles and Isochromatic Readings - Case III,
^Ml| - ISOCHROMATIC READING ISOCLINIC
Point-IiOads
16000lbs
12000lbS lbs
8000S
4C00lbs degree
2 .29 .22 .15 .07 20,0
2 1 .30 .23 .15 .06 0.0
4 .40 .32 .22 .12 26.0
4 1 .80 .60 .40 .20 0.0
5 .41 .30 .20 .10 30,0
5 1 1.85 1.40 .95 .48 0.0
6 .16 .12 .08 .04 0.0
6 1 .90 .70 .45 .25 40.0
6 2 1.10 .81 .53 .28 40.0
6 3 .30 .20 .15 .10 0.0
6 4 .20 .15 .10 .05 0.0
6 5 .20 .15 .09 .05 0.0
6 6 .19 .14 .08 .04 0.0
8 .20 .15 .09 .05 10.0
8 1 .39 .29 .20 .10 12.0
8 2 .24 .18 .12 .06 26.0
8 3 .27 .20 .14 .07 42.0
8 4 .21 .15 .11 .06 43.0
8 5 .16 .12 .08 .04 51.0
8 6 .16 .12 ' .08 .04 53.0
10 .19 .14 .09 .05 10.0
10 1 .24 .18 .12 .06 16.0
10 2 .25 .19 .13 .06 23.0
10 3 .32 .24 .16 .08 42.0
10 4 .30 .22 .15 .07 44.0
10 5 .31 .23 .15 .08 44.0
10 6 .26 .20 .13 .07 50.0
12 .12 .09 .06 .03 30.0
12 1 .22 .17 .12 .06 32.0
12 2 .20 .15 .10 .05 33.0
12 3 .28 .21 ;i4 .07 36.0
12 4 .26 .19 .13 .07 40.0
12 5 .26 .19 .13 .07 45.0
12 6 .14 .11 .07 .04 50.0

s)
IT)
eo•r!
uo0)
c/>
CO
y•HUMCD
>60CO
co•H •
CO M3•J
rHct) CJO
I
CO05 CO
qj c
toCMH H
ct)
e -oH CO
o o2: -i
-2CtJ
H
CM>.Xco<*
1
CMy~»CMD1 O 1-^
t> O tocoCN
C7> CM
sr vO
++
COCM
+1 + 1
tse>
II
KD
CM:>>
XCO«*
1 o o vD CMCM o m CN m/N ^o vO co coCM CO rH
11
rHD
sr
o vO o> r-^
>> CTi CM coX rO O r-»
CO m •* CO
CMt> o o sf vO1 o in o o
XI n CO r-.
rH co rH CO r-*
D H
in
oenrH
+
m m^ CM r^
TCTi
1
x! ^<|<j o in oo CO o o
>s CO C-.
ir> vrX rH r—
i
GJ\ r—i
co 1 1 + +<
"» CO CM ^ OM U~l IO tf"| m
42

43
0)
TO
CO
u
eo
•UOSJ
w
crj
U
ri
>N)
o
ao
Pc3
rH3CJ
rH
O
ra
u
o
/~\
CO
w+1 ro o O a\
/-s _ r~ o rH om lT| co rHCO vO CN 1
r-l 1 1
II 1
5^O
^\r^
/—* x-' ro o o vOco 1 r-^ r^ H oN.X •~-\ m r-i CN en
cO CO in ro CN>^ >-hs.
o o O Oro <r r--
co v£> HCM -cr r-~ 01
-~-v >> CT\ ^-t CMr» X <f CO <rv—' CO cr. CN CO
<r <r co COCM rH r-i
CM o/—
\
o O o oCM o cO o CM
<-N D <1- ro CTn oVO 1 o -cr CTN CMW rH CM CN rH r-»
D CM Cvl r-1 COV si- CO CO i-h
oc r-. r-- «*iH cg r-i rH
o 1** 3 m^-v >> o\ .-a r-~m x 00 CO t-»n_' CO r>» CO m
CM/-s Q CO o O r-i
sr f-» CN m r-i>-/
i m cO r-i G\co O CO r-i
rH rH ^H H rHD
^-n !«! O o O Oe> o o O o*—
'
<rr-i
I
c£> coCM+
•-v <|<I o O OCM o O O^ >-. <r o CM
X r-i CN CMco | 1<
•-> <r <r -cr <r•-»»
t-4^s
M vO CO o CM
.
<H r-i
ONr-- o c-. rH r-i o
X co o o m o\ CNo ^o CN CO 00 o
•
i-H
I
+ + rH+
rH1
-cr
1
CO
-o
ro O o> H CT, OCN r-i r-i r-i rH CNCT\ CN r-i CO H o
CO ro -CT rH r-l
O OCO -cr o CN 00 CMo co co rH rH Hro r-. ^o m r*» O!*« rH 00 00 r- roro CO —1 St ro rHro CN CO r-l en HCO s0 o LO o ro
cr* m co
o o Oo o CM p% CO CO-cr Cft CO CO \0 Hcc o CO in \0 cr.
CN r-i sr CO ffi LOCN rH m ro CO CTN
<r CO o r^ m rHa: r* o ro CJ <rrH rH —
1
r- <r -cr
O O <r ro —. Or— CO ^D —
1
O Hr- CO l*> !>. 3% COkO CO -r ro CM CO
co O r» h. r-i 'J0
r*. m CN CO r^ -cr
m rH o m ro oro ro o 00 cC CDrH rH rH
»"> O a O O oo rH H H CO rH ow' r-i CO CT\ ON C rH>>, CM CN r-i CN CO r-l
D 1 1 1 1 1ro
1
O CN © o oO rH m m oin co + 1 r-i
1
m CO CM

44
/"N00
+ 1 o H n rH/> ri <r to CO CMOn D m A r» CM^ in + i rH
M 1 l 1MM tnD
a)CO
<*»
i
m s-\ ^^ o H m CM00 1 -a- O CO rH
C Vw' ^-x m o CNo vO m HH >»•4J s.u<uCO o CM OH cM ON m vOa) /~N
ttm in CO
4J f> o m vOC ^ co CO vO 00o sr CO en !-H
N rH r» m•HV>
OK00 cMc >—
s
CM St p» 00o CM oo —
1
<n ON1-1 /-v D m sO in r-»
< vO 1 rH CM o oo>—
•
r-i ON sr en vOa D vO vo r-» ooO N—
/
O ON <n rHiH CO H r» mUtS
rH3 /"N
IfO CO r-i r-i
U lO VO a\ OiH N-^ CO rH CM vO(0 CM <r coCJ
CO
CO
a> CNri D4-1 ^\ O CM n CMCO *T 1 sT CO CO O
>w^ m <r eg CMiH r-i m <r r~a DBo55
o o o o\• ^N X m in O
CO CO D I •<r CMH V*.rI rH
<U1
rHJ3CO
HMl >>
*-\<3|<I O o oCM h m o -3-
**s
CO<
-* 00
/"-\ •"3 UO in in ini-H^x
M vO CO o CMrH
DO
CO
U
co
o
00
cd
otH•U
M
>BOSo
CD
en
a>
>H
UCO
r(
o
<4H
O
otHurr)
rH3arHcrj
a
/-N00\s
+1*^S O ON O en vO CO
cs> >N m CO c en m rHD -* CM CN rH CN vO
•\»^I ] CM en en r-i
1 + + + +XD
/^\r-
/*
\
•v^ m m CN r^- rH oo00 1 oo CM o co O -r\~s /~. CM r-- CO CM rH o
vO r^ -Cf m COv—
/
s.
CM CO en or- CO vO r~- CO r~
CM m C-J r-i en o CM/~\
& m o r^ vO en COr^ m CO en ^r O-N m**s C/> vO ON CO CO CM r~»
-T CO CO en m CM Hr*> sO vO CM H r-l
CN^^ r*. m a-. CO CM COCM CO KT o rH CM o
•-^. D m o o CN r»» CMvO
! vc n o m n CON»r* rH CO m r» a\ r-» 1—i
D r^ o in H rH l~»\w/ CO CT. 00 <r <r o
r^- vO r^ St <r CM
•-v ? rH CM 00 o en r-im CJ\ m r~~ <c* in CMv^** CO CM r-i a\ in r^ CO
sr
o
en CM rH r-l
^—
V
•
y-N CM p> o <r CO CO CO<r O oo rH vO <r vO VON*-r*
1 m CO CO vO sr mf-i 00 CO CO vO vO <rDN^
m <f CTN <r -cr ON/~\ bs co CN VO m <r vOon D r» ON o r-i rH CO*W
I 1 rH1
r-i
1
r-i
1
r^1
•—* <3]< o ON in n o mCN >s m m r»» CO o CM%.•
CO<
CM a r-i rH
/—
N
•-> m <t en CM r-i OrH*W
M o o o O O orH rH r-i i-i r-i rH
45
0»
xx
vl>
IfV
K\
tu-
•--*
r-i ( J rA3 :-4
i
i
H c\l rA
!A
I _
CH
i
i]
_
1
Lf>
1
X)+X
1
Ok
IA
-13
h
ft
H OJ IA.
J_ 1 I
t t t
j1—
C\J
; 1 >
o•
t50
1
LAONTV
J
3-
aoHCO
a©a
a
o<haa•H
CO
•T3
Qas
'**
ncoHcC
o
60H

46
-4-&J* ^"p^tY77-
bfcED \fcz^fS
t17'"
<
120"jEE
cut lin cut lines
TT1
TBI
TB2
4.75"
v"1/2"
j /h y^22i _j
-e
—
eh^e
r,W zz>"Less taan ij>0
T3/4"-
JL-»*J
J?'ig. 2 Tensile Coupon Specimens

47
' L 3".. 1".. T'j^-
1 B i
less than Lj.j? inches
1 T B
2"-1.iozj.
'. fe^"1.(Loo ' .Jio ' rfc-1 feur
strain fiS.'in.'
Fig. 3 i-ypical 'Coupon Stress-Strain Cur ve

48
0)
o
td H3 o
po
O ©o >
O I
CO fH
Q)
+> -Pc uto 3•H 2
l I Iill*I I I *4
CO^>
a
!h
<3
CD
3ro
1)
!^
PDO
O
o

49
oft '-N
O CO ©o a ftCO o o•H H oU -P CO
cO O •HH (D hO (4 CO
ft-rl H-o O
«» ftS '=0
© a 0JP H aCO (-i CO
>» 3 HtQ CO ft
CO *w*
<H 0)
O H <\J
-P ^ VO
3 O dO <M c
c0
• ftft 3 H• 1 s'l
3= P• a> 'M& CO o
c0
=Ph 3 f-<
O s cO
o •H r-
(0 X 3•H CO USh s fH
CO HH Vi oO o x^*
ft
^-p
c Mj^
s CD J
© S p™
PCO
©ty
>> 3 fl
CO (0 •HCO cO
© f*
-c; =: P —
s
p CO ©fn ft
a O H O•H =<- CO o
ft CO
• ft •H Hft 3 o b
• 1 a co
4-> •H rH• 0) u o
<y co ft ft
apcaSCD
u3CO
05
©a(0
CO
CD
UPco
opo-Cft
faof*i
pCOHft
s©pQ
CD CD>>
o > CQ
3 £h 3 r-H
05
u•HPftO
O U <DCO CO ^N'H 0)
+» >> !h -PX3H Cd in S=0 CO r-l CO ©•H fl O 3 .H^ <$ a< o*> LT\
iii*ii i t <: i
i i i _} i
f=J «$ Oh ^-^ ft
&
^mT\^w\\wiTnimm ^iiiniiMnTTrn

T
if. 02pn
Centerof web
.51>\
10
(a) Case IE
I
2
3k
-v
y
50
-M,5f* 6.y i -
if.02'«
Centerof web
1y
_10_
! f
6 *
-3.5"
V
(b) Case HE
Fig. 6 Locations Of Photostress Sheets
51
Support
Top
flange
9-1-7 -4-5
• a •
6 Tk
10.00"
I
SecJ i i
L—
p cii p enC- • •'*•»» C- • •"•
•Sec. 10
Sec. 5
k. 02"
Center of opening Center or beam
C6-141-S3CRosette Strain Gage
Fig. 7 Arrangement of Strain Gages For Case U.

52
Support
Top
flange
--9
-8
!
./,.
Sec.—2.
T8.00'
1*-£.
Sec. 10Sec. 5
10
11.. 12 n3
H -J-3 i
2 1*>
M
-30'»-
I
Center of opening
:Qn.
T.4*02
4,02
Center of beam
C6-lifl-R3CRosette Strain Gage
Fig. 8 Arrangement Of Strain Gages For Case HE

53
a(D
aHUOCh
'A
0)
Xi
Oft
pa03
r-i
4
aca
ON
H

54
Fig. 10 Photograph of the General Set-up of the experiment

55
Fig. 11 Photograph of The Beam With Digital Strain indicator
I Budd Model A11Q C-lot And C-10 Ltc )

%
fig. 12 Photograph of The Beam With Large field
Meter And Its Accessories

57
(a; Case iI-( 30)
(b) CaseIII-(45 )
Fig. 13 Photograph of Isoclinics - Case jI arid Case HI

58
1/1} span defl.
1/2 span defl—
CO
p._8.
•H
3 *
Theoretical value
Dial gsge reading
.2
Deflections in inches
Fig. lif Deflections Of Beam-Case I
Theoretical deflectionsEq. 2)entral dial gage reading
-v (web opening)1/if span dial gage readiv.
(no web opening)
.2
Deflections in incnes
Fig. 15 Deflections Of Bear;.-Case E

59
retical value (Eq. 2)
span dial gage reading
(web opening)span dial gage reading
(no web opening
.SP00
.1 .2
Deflections in inches
J?"ig. 16 Deflections Of Beam-Case EL
© o 6e © o © o o e o © ©
O
simple plastic theory
Dial gage reading
+ +l.o 1.5
Deflections in inches
2.0 2.5
Fig. 17 Deflections of Beam-Case 3V

60
16
12-1
s 8{•H
OS
5 44
©'
//
.0' (a) Gage No. ^
+100 200. micro inch
inch
300
12.CO
ft
G•H
ajo-I
/,G
8.
* ,0'
P'
(b) Gage No. 12
—3bmicro men
inch
"ICCT
J
12p<
5
55
O
ft
G
P
/
(c) Gage No. 13
+50 loo
micro inchinch
c
ft•H
X)as
O
16
12-
a--
k--
/•
/ (d) Gage No. ll*
P
10b 2do 300micro inch
lhcn
i-'ig. 18 Typical Load-Strain Plots-Case IE
61
16-
Ci
a•H
12..
8..
o^ 41
//
X/
^
X
0l6-
12
Pi•H
3 84-
•H
-Ci
CO(a) Gage No. ? § ...
-5 V
+ +100 200micro inch
—
30*0
inch
/
P/
d
& (b) Gage No. 12
—
i
50Eiicro in
155 "T5b
inch
16-
/
//
12. o'aa
//
•H t
s /
5 8' P'•
x» /at so3 k- ,o'
(c) Gage No. Tb
s/
//
30micro in
60ch-
90o-
16"
12
sj
PiH
•H
xs03
X
.0•
td) Gage No. 1^
/
100 200micro inch
300 400
inch incn
Fig. 19 Typical Load-strain Plots-Case IE

62
.*il
O
to a
• 3-
.2.
fa
-H
Case IE
a. Point l\-Z
/>
/S
/.O
//
s'0
/
«•
/•
i "3 nLoad in kips
IT
—O—experimental
.4
.3
©oc© bOwj aa -h•H -Oh C3
© U
•Ha
:i
Case IE
Corrected
O— experimental
—
r
-
4 T —r-
12—i
—
16
Load in kips"
jrig. 20a Correction ror Residual Birefringence

63
i
bO
d•Ha40)
4
od
d•H
ft-
;h
Hq
.30--
20--
10
Case HL
i.Point 8-5 I
o
.80
;60_.
d•H-a
«j
• ^° =
o
dO
d•H
£ .20-
Hcq
4 8
Load in kips12 16
Case IE
b.Point /+-!' P/
//
/
o•
/o
/
TT
.0'
/
/
/ + ± ±k 8 12
Load in kips
IT
Corrected
Lxperimental
Experimental
Fig. 20b Correction For Residual Birefringence

64
illA*
—=>-
V— A
a. General Case
Jvr
s 10
b» Test Beam Case
6*f(3 j
<0 5
12
5" 0"x (4.8J
6xy(35jQx^.e; = Oi m,7; + (S^s; -6*r<3jJ
-£1
j.'ig . 21 Coordinate System For Shear-difference Method

1'
aCircle A
/ —
1
Circle £. X ' y
-5L-i / Sm=2 /
NN^ O lit—a -a,
2
^^
/
SxV N.
1 i
\ i
\ i
\ i
/ x >/ • 1
i
/
\i/ i
?i—
i
H*. —v\.
65
Fig. 2.2. Two Possible Constructions Of ilohr's
Circle For The Sane Given (Ol-O**), 0*<> GV
Shear
diagonal
Circle A (CXx^OV)
ay
Circle B (Gy>Ox)
Fig. 23 Relative Magnitudes Of' CTr And ijy

66
-8 -6 -h -2ksi
2 k 6 8
-8 -6 -*t -2k£
I 2 ^68^1 i :p i i —j- -
•
2P=12000 lbs.
r Tf. \
— Vierendeel Analysis
Strain gage reading
Fig. 2/i Normal Bending Stresses Along Vertical bection "C'i-Case H
67
ksi_S -6-4-2 o 2 Zj 6 8
-8 -6 -fc -2 2 4 6 8
Vierendeel Analysis
G Strain gage reading
Photostress reading-
Fig. 25 Bending Stresses Along Vertical Section "5"-Case H

68
ksi-15 -10 -5 o 5 10 15
(10';
simple beau theory
strain gage reading
A .rhotostress reading
Fig. 26 Bending Stresses Along Vertical Section "10"-Case II

69
(ksi)
1 i
\GA
.P=16000 lbs.1
^0 2
1 4 k.
,' <&
2P=S000 lbs.
Total Cross lection
~ -r~—""—
"H "Tee" Section
O strain Gage Reading
A Photos tress Reading
Fig. 27 Shear Stresses Along Vertical Section "S"-Case H

ksi-8 -6 -k 2. Q 2^6 8
70
ksi-6 -k -2 2 4 6
-» 1——»-
f
~t ! 1-
2P=ii000 lbs,
Tfe7
Vierendeel Analysis
strain gage reading
Fig. 28 Eending Stresses Along Vertical section "0"-Uase IE

71
ksi-12 -9 -6 -3 6 9 li
ksi•9, -6, -?, y 3 6 9
|2P=~12000 lbo,
ksi
|2P=6000 lbs.
Vierendeel Analysis
Strain gage reading
A .Fhotostress reading
yig'#''.'29 Bending Stresses Along Vertical Section "5"-Case±m

ksi 72
ks5_
-6 -k -2 2 if 6— 1 1 1 ,1 1 <r
£ flpTgOOO lbs.
Simple beam theory
O Strain gage reading
A Pnotostress reading
Fig. :.jq Bending Stresses Along Vertical Section "10"- (Case HE]);
T
73
ksi2 i+ 6-< -» H
^D
Js2p=lb0U0 lbs,
4 6H 1 h
' £D
T5H2P=12000 lbs
2 if
/*>
t4
2P--800Q lbs.|
Total Cross Section
. _ "Tee" Section
® strain Gage Heading
A Photostress Reading
*ig. 31 Shear Stresses Along Vertical S ction "5"- Case 2.
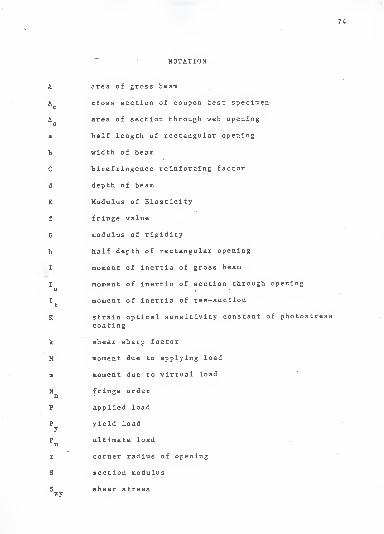
74
NOTATION
A area of gross beam
A cross section of coupon test specimenc
A area of section through web openingo
a half length of rectangular opening
b width of beam
C birefringence reinforcing factor
d depth of beam
E Modulus of Elasticity
f fringe value
G modulus of rigidity
h half depth of rectangular opening
I moment of inertia of gross beam
I moment of inertia of section through openingo
I moment of inertia of tee-section
K strain optical sensitivity constant of photostresscoating
k shear sharp factor
M moment due to applying load
m moment due to virtual load
N fringe ordern
P applied load
P yield loady
P ultimate loadu
r corner radius of opening
S section modulus
S shear stressxy

75
wc
x» y
thickness of coupon test specimen
thickness of beam flange
thickness of photostress coating
thickness of beam web
shear force due to applied load
shear force due to virtual load
width of coupon test specimen
coordinate system
transverse distance from centroid of beam
distance from boundary of opening to centroidof tee-section
distance from center of opening
plastic modulus
normal stress in x-direction
normal stress in y-direction
(°l~ a j) principle stress difference
6
6i
A
e
X
elongation of coupon test specimen in two inches
relative retardation
deflection of beam
strain gage reading
(e,-e_) principle strain difference
wave length of light
isoclinic angle

76
REFERENCES
1. Muskhelishvili, N. I., Some Basic Problems of the
Mathematical Theory of Elasticity ,2nd Edition,
P. Noorhoff, Ltd., Croningen, The Netherlands, 1963.
2. Heller, Brock and Bart, "The stresses Around Rectangular
Openings with Rounded Corners in a Beam Subjected to
Bending with Shear," Proc., Ath National Congress of
Applied Mechanics, 1962.
3. Bower, J. E., "Elastic Stresses Around Holes in Wide-
Flange Beams," Journal of the Structural Division ,
ASCE, Vol. 92, No. ST2, April, 1966.
4. Bower, J. E., "Experimental Stresses in Wide Flange
Beams with Holes," Journal of Structural Division ,
ASCE, Vol. 92, No. ST5, Oct., 1966.
5. Redwood, R. G. , and J. 0. McCutcheon, "Wide-Flange
Beams Containing Large Unreinforced Web Openings,''
S tructure Mechanics Series, No. 2 , McGill University,
Montreal, Canada, Sept., 1967.
6. Segner, Edmund, F., "Reinforcement Requirements for
Girder Web Openings," Journal of the Structural
Division , ASCE, Vol. 90, No. ST3, June, 1964.
7. Cato, S. L., "Web Buckling Failure of Built-up Girder
with Rectangular Holes," M.S. thesis , Oregon State
University, June, 1964.
8. Arora, J., "Experimental Stress Analysis of an I-5eam
with a Rectangular Web Cutout," M.S . thesi s, Kansas
State University, 1967.

77
9. Hendry, A. W. , "The Stress Distribution of a Simply
Supported Beam of I-Section Carrying A Central
Load," Proc . , Society for Exp. Stresses Analysis, VII,
No. 2, 1950.
10. American Institute of Steel Construction. Steel
Construction Manual , 6th Edition, New York, 1963.
1 1
.
ASTM Standards for Physical and Mechanical Testing of
Material . Part 31, May, 1967.
12. Michalos, James, Structural Mechanics and Analysis ,
The MacMillan Co., New York, 1965.
13. Beedle, Lynn S., Plastic Design of Steel Structures ,
John Wiley & Sons, 1961.
14. Singer, Ferdinand L., Strength of Material s, Second
Edition, Kapper & Publishers, 1962.
15. Budd Company"Instruraent Division," Phoenixville
,
Pennsylvania.
(a) Instruction Manual for Photostress LF/M and its
Accessories
( b
)
Instruction Manual for Digital Strain Indicator
(Model A-110) .
16. Dove, Richard C, Paul H. Adams, Experimental Stress
Analysis and Motion Measurement , Charles E. Morril
Books, Inc., Columbus, Ohio, 1964.
17. Holister, G. S., Experimental Stress Analysis , Cambridge
University Press, Cambridge, England, 1967.
18. Roark, R. J., "Formulas for Stress and Strain," Third
Edition, McGraw-Hill Book Co., New York, 1954.

Appendix A, Flow Diagram for Computer Program78
Start
/ Read I, J
F(l), F(2),F(3), F(4)
Compute FF(K)
FF2(K), FF3(K),
AA(K), Sxy(K)
SQ(K), AS(K)
Punch I, J,
FF(K) FF3(K)
AA(K) A(K) Sxy
X) AS(K)

79
Table A-l. Sample Input Data for Computer Program
A Sample of Input Data for the Computer Program No. 2 - Case III
I J F(l) F(2) F(3) F(4) A
8 .20 .15 .09 .05 10.0
8 1 .39 .29 .20 .10 12.0
8 2 .24 .18 .12 .06 26.0
8 3 .27 .20 .14 .07 42.0
8 4 .21 .15 .11 .06 43.0
8 5 .16 .12 .08 .04 51.0
Table A-2. Output of Computer Program
J I O -01 2
(w 24Sxy Sxy SinZ6 e F(K) (arc
2)
285.
,n 2-4Sxy
5 10 8587.0 73736537.0 73655572.0 4291.1 .99945 44.0 .310
5 10 6371.0 40589663.0 40545052.0 3183.8 .99945 44.0 .230 211.
5 10 4155.0 17264017.0 17245078.0 2076.4 .99945 44.0 .150 138.
5 10 2216.0 4910655.5 4905263.2 1107.4 .99945 44.0 .030 73.
4 10 8310.0 69056045.0 68980288.0 4152.7 .99945 44.0 .300 275.
4 10 6094.0 37136838.0 37096061.0 3045.3 .99945 44.0 .220 202.
4 10 4155.0 17264017.0 17245078.0 2067.4 .99945 44.0 .150 138.
4 10 1939.0 .3759723.5 3755595.2 969.0 .99945 44.0 .070 64.
3 10 8864.0 78570509.0 63327316.0 3978.9 .89777 42.0 .320 3300.
3 10 664S.0 44195918.0 35621621.0 2984.2 .89777 42.0 .240 2928.
3 10 4432.0 19642614.0 15831835.0 1989.5 .89777 42.0 .160 1952.
3 10 2216.0 4910655.5 3957956.2 994.7 .89777 42.0 .080 976.
2 10 6648.0 44195918.0 25821637.0 2540.8 .76437 23.0 .240 4287.
2 10 4986.0 24860182.0 145246S8.0 1905.6 .76437 23.0 .180 3215.
2 10 3324.0 11048972.0 6455418.0 1270.4 .76437 23.0 .120 2143.
2 10 1662.0 2762244.1 1613855.1 635.2 .76437 23.0 .060 1072.
1 10 6648.0 44195918.0 12293083.0 1753.1 .52740 16.0 .240 5101.
1 10 4986.0 24860182.0 6914860.4 1314.8 .52740 16.0 .180 4236.
1 10 3324.0 1104897s. 3073268.9 876.5 .52740 16.0 .120 2824.
1 10 1662.0 2762244.1 763317.5 438.3 .52740 16.0 .060 1412.
10 5263.0 27699142.0 3183256.7 892.1 .33900 10.0 .190 3048.
10 3878.0 15038888.0 1728306.1 657.3 .33900 10.0 .140 2251.
10 2493.0 6215047.8 714248.6 422.6 .33900 10.0 .090 1523.
10 1385.0 1918225.2 220447.2 234.8 .33900 10.0 .050 741.
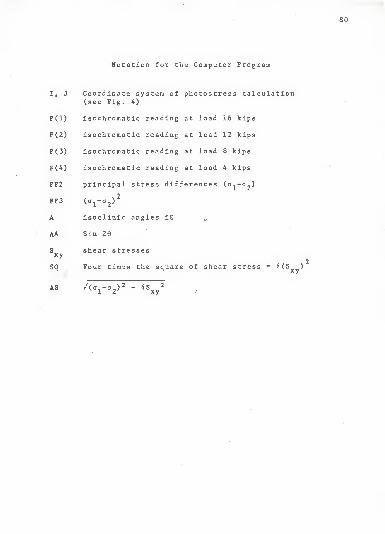
Notation for the Computer Program
80
I, J
F(l)
F(2)
F(3)
F(4)
FF2
FF3
A
AA
Sxy
SQ
AS
Coordinate system of photostress calculation(see Fig. 4)
isochromatic reading at load 16 kips
isochromatic reading at load 12 kips
isochromatic reading at load 8 kips
isochromatic reading at load 4 kips
principal stress differences (o^-o~)
2
^°l~a 2^
isoclinic angles i0
Sin 20
shear stresses
Four tiroas the square of shear stress = 4(S )xy
/(o1-a
2)2 - 4!
xy
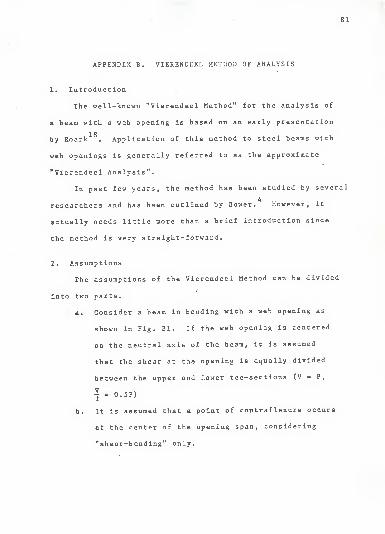
81
APPENDIX B. VIERENDEEL METHOD OF ANALYSIS
1. Introduction
The well-known "Vierendeel Method" for the analysis of
a beam with a web opening is based on an early presentation
18by Roark . Application of this method to steel beams with
web openings is generally referred to as the approximate
"Vierendeel Analysis".
In past few years, the method has been studied by several
4researchers and has been outlined by Bower. However, it
actually needs little more than a brief introduction since
the method is very straight-forward.
2. Assumptions
The assumptions of the Vierendeel Method can be divided
into two parts.
a. Consider a beam in bending with a web opening as
shown in Fig. Bl. If the web opening is centered
on the neutral axis of the beam, it is assumed
that the shear at the opening is equally divided
between the upper and lower tee-sections (V = P,
| = 0.5P)
b. It is assumed that a point of contraf lexure occurs
at the center of the opening span, considering
"shear-bending" only.
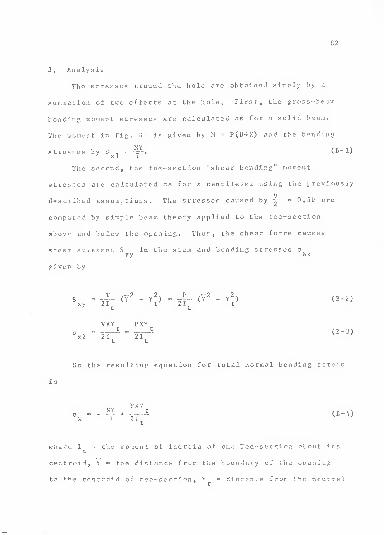
82
3 t Analysis
The stresses around the hole are obtained simply by a
summation of two effects at the hole. First, the gross-beam
bonding moment stresses are calculated as for a solid beam.
The moment in Fig. Bl is given by M = P(IH-X) and the bending
MYstresses by a , - -=r-«
X J i-
(B-l)
The second, the tee-section "shear bending" moment
stresses are calculated as for a cantilever using the previously
Vdescribed assumptions. The stresses caused by -r ~ 0.5F are
computed by simple beam theory applied to the tee-section
above and below the opening. Thus, the shear force causes
shear stresses S in the stem and bending stresses a ,xy x/I
giver by
xyV
21.(Y
2 P —2 ?(B~2)
VXY
x2K
2TT
PXY(B-3)
So the resulting equation for total normal bending Stress
MYPX1
(B-4)
where I » the moment of inertia of ou^ Tee-section about its
ceatroid, X •-- the distance from the boundary of the opening
to the ccntrcid of tee- section, Y = distance frorc the neutral

83
axis of the tee-section (Y is positive for points between
the hole and the neutral axis of the tee-section), I - the
moment of inertia of the net beam about its centroidal axis
and Y = transverse distance from the centroid.
4. Calculations for This Investigation
Fig, B02 shows the dimensions of the tee-sections used
in the Vierendeel Analysis of Cases II and III, The system
of coordinates for the calculations is shov?n in Figs. E3 and
B4, The calculations of the normal bending stresses a , alonj
vertical sections "0" and "5", which are based on Eqs, Bl and
B3 are summarized in Tables Bl and B2, The total normal,
stresses for Case:: II and III are given in Table B3 and were
obtained by summing the values in Tables Bl and B2 , Table B4
.shows numerical values of the total normal stresses for
Cases II and III, These total bending stresses are also
presented graphically for the two cases for a load of 16 kips
in Fig, B5 t Soma other plots of the stresses resulting from
the Vierendeel Analysis are shown in Figs, 24, 25, 2 8 and 29,
and are compared with the experimental values elsewhere in
this thesis.

Table B-l. Theoretical Bending Stresses Determined by theVierendeel Method - Gross Beam
84
(a) Case 11
Point M Y In
MYIn
Al
32. 5P 1.00 120.4 -.265P
B,X
it 1.50 -.398P
Cl
it 2.50 -.665P
Dl
ii 4.03 -1.070P
El
30. OP 1.00 - -.242P
Hl
ti .4.03 -.975P
(b) Case III
Point
H.
M
32. 5P 2.000
32. 5P 2.625
32. 5P 3.125
32. 5P 4.030
30. 5P 2.000
30. OP 4.030
124.6
MYT~n
•.517P
•.680P
•.807P
•.104P
•.477P
-.960P
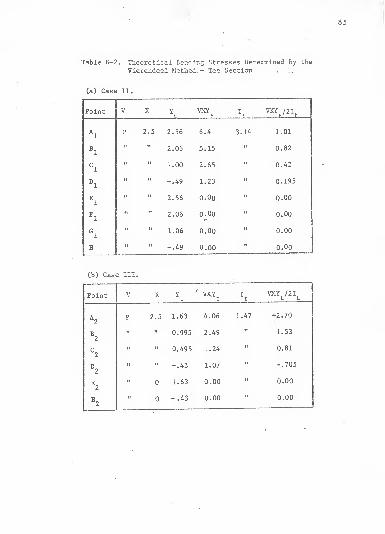
Table B-2. Theoretical Bending Stresses Determined by the
Vierendeel Method.- Tee Section
85
(a) Case ! II.
Point V Y Yr
VXYt
VXY /21
Al
P 2.5 2.56 6.4 3.14 1.01
Bl
it ii
2.06 5.15 n 0.82
Cl
ii ii
1.00 2.65 it 0.42
Dl
ti M -.49 1.23ii 0.195
El
ii ii 2.56 O.Oo n 0.00
Fl
n n2.06 o.oo ii 0.00
Gl
ii ii
1.06 0.00ti
o.oo
H n ii -.49 0.00ii o.oo
(b) Case III.
Point VXY
2.5 1.63 4.06
M 0.995 2.49
ii 0.495 1.24
ii -.43 1.07
1.63 0.00
-.43 0.00
1.47
VXY /2I
+2.70
1.53
0.81
-.705
0.00
0.00

86
Table B-3. Total Theoretical Bending Stresses Determined by the
Vierendeel Method.
(a) Case II
j
PointMY
I
VXYt
MY VXYfr + t
Ti 2It
u 11
Al
-.265P +1.00P 0.73P
Bl
-.398P +0.82P 0.42P
C.l
-.664P +0.421P -.22P
Dl
-1.070P -0.195P -1.265P
El
-.242P 0.000 -0.242P
Hl
-.975P 0.000 -0.975P
1
(b) Case III
PointMYI
VXYt
IT
MYLVXY
^ 1 "IR -It
A2
-.517P +2.670P 2.150P
B2
-.680P +1.530P 0.850P
C2
-.807P +0.810P 0.003P
D2
-1.040P -0.705P -1.700P
El
-All? 0.00 -0.477P
.
Hl
-.960P 0.00 -0.960P

87
Table B-4. Theoretical Stress Calculation Using the Virendeel Method.
(a) Casfi II
Point °x 2P=16000 2P=12000 2P=8000 2P=4000
Al
0.730P +95800 +4360 +2900 +1450
Bl
0.420P +3360 +2520 +1680 +840
Cl
-0.220P -1760 -1320 -880 -440
Dl
-1.265P -10100 -7550 -5050 2525
El
-0.242P -1930 -1450 -965 -483
Hl
-0.975P -7800 -5800 -3900 -1950
(b) Cas<i III-
Point °x 2P-16000 2P=12000 2P=8000 2P=4000
A2
+2. 15OP 17200 12900 8620 4310
B2
+0.850P +6780 '+5100 +3400 +1700
C2
+0.003P +24 +18 +12 +6
D2
-1.700P -13600 -10200 -6800 -3400
E2
-0.477P -3820 -2860 -1910 -955
«2 -0.960P -9660 -5775 -4830 -2415

88
][1/2 P
j M=P(30+x)
I\ 1/2 P
Fig. Bl Schematic Viev/ Of Bean And Stresses
In Vierendeel Analysis
h o.v -J H S.C
.185'
3.025
I
•tt
( Case It )
H3.^5
2.025
1".325
( Case 3H )
Fig. B2 Dimension Of Tee Sections .tor Cases H and EI

89
Sec."0"Sec. "5*
Support
r
30"
5? . 5"
P
-^
1
s a. 425"L25"
)2"
Fig. B3 Coordinate System For The Calculation Of
Bending Stress Of Vierendeel Analysis (Case ID.)
Sec. "0linn
Sec, "f"
Fig. Bk Coordinate System For The Calculation Of
Shearing Stresses Of Vierendeel Analysis (.Case IBJ
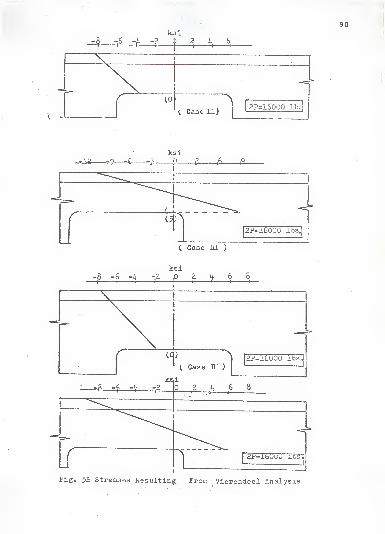
90
=§ i6
-fr-?
ksi2 if 6
ksi
( Case Bl )
_Z8-J^iksi
-2 2 ^ 6 8H 1 1 S-
"F(, Case IL.)
a -f -v—
*
ksi
2P=16000 lbs,
2 z». 6 8;, ' T+1 i H-
Fig. 5£ Stresses Resulting From Vierendeel Analysis

EXPERIMENTAL STUDY OF BEAMS WITH WEB OPENINGS
ty
KUO-SKU CHENG
Diploma, Taipei Institute of TechnologyTaiwan, China, 1965
AN ABSTRACT OF A MASTER'S THESIS
submitted in partial fulfillment of the
requirements for the degree
MASTER OF SCIENCE
Department of Civil Engineering
KANSAS STATE UNIVERSITYManhattan, Kansas
1969

ABSTRACT
This investigation presents the results of an experi-
mental study of a WF beam (8 WF 35) with a large unrelnforced
web opening subjected to bending and shear stresses. The
purpose of the study was to investigate the stresses in the
vicinity of the opening using photostress and electrical strain
gage measurements. The results are compared with values calcu-
lated by the so-called "Vierendeel Analysis",
The test beam was an ASTM A36 steel WF beam (8 WF 35)
with a rectangular web opening at the quarterpoint of the span,
and was tested as a simply supported beam with a concentrated
load at mid-span. Tests were initially conducted on the beam
without a web opening, then with a 2" x 6" rectangular opening
and a larger 4" X 6" rectangular opening, and finally the beam
was subjected to an ultimate load test. The openings were
centered on the centroidal axis of the beam and all corners
had 1/2" radius fillets.
The results indicated that the beam with a large unreln-
forced web opening will have stress concentrations at the
corners of the opening, resulting in a non-linear bending
stress distribution in a region adjacent to the boundary of the
opening. The "Vierendeel Analysis" provided a reasonable pre-
diction of the normal stresses above and below the opening.
Finally, it is concluded that an experimental analysis using
photostress and strain gage measurements can be quite effective
in determining the stresses in a beam with a web opening if
proper experimental techniques are used.