Embed Size (px)
Citation preview
Draft
Experimental Study of Dynamic Bending Failure of
Laurentian Granite: Loading Rate and Pre-Load Effects
Journal: Canadian Geotechnical Journal
Manuscript ID cgj-2017-0707.R2
Manuscript Type: Article
Date Submitted by the Author: 05-Apr-2018
Complete List of Authors: Yao, Wei; University of Toronto, Department of Civil Engineering Xia, Kaiwen; University of Toronto, Department of Civil Engineering Jha, Ajay ; International center of Excellence - Mining Technology, EMIL, Aditya Birla group
Keyword: Flexural tensile strength, Pre-load, SHPB, SCB, Non-local theory
Is the invited manuscript for
consideration in a Special Issue? :
N/A
https://mc06.manuscriptcentral.com/cgj-pubs
Canadian Geotechnical Journal
Draft
1
Experimental Study of Dynamic Bending Failure of
Laurentian Granite: Loading Rate and Pre-Load
Effects
Wei Yao 1, Kaiwen Xia
1,*, Ajay Kumar Jha
2
1. Department of Civil Engineering, University of Toronto, Toronto, Ontario, Canada M5S 1A4
2. International center of Excellence-Mining Technology, EMIL, Aditya Birla group, Kolkata,
India
Wei Yao. Department of Civil Engineering, University of Toronto, Toronto, Ontario, Canada M5S 1A4.
E-mail: [email protected].
Kaiwen Xia. Department of Civil Engineering, University of Toronto, Toronto, Ontario, Canada M5S 1A4.
E-mail: [email protected].
Ajay Kumar Jha. Vice President and Head. International center of Excellence-Mining Technology, EMIL,
Aditya Birla group, Kolkata, India. E-mail: [email protected].
* Corresponding author: Kaiwen Xia, E-mail address: [email protected]. Tel: +1-416-978-5942
Fax:+1- 416-978-6813.
Page 1 of 34
https://mc06.manuscriptcentral.com/cgj-pubs
Canadian Geotechnical Journal
Draft
2
ABSTRACT: In deep underground rock engineering projects, rocks are under static
pre-load and they may further experience dynamic load due to earthquakes or production
blasts. It is thus desirable to consider dynamic failure of rocks subjected to static pre-load.
Besides, bending load is commonly encountered near underground openings. Therefore,
this study considers the effect of the pre-load on the dynamic bending strength of
Laurentian granite (LG). Using a modified split Hopkinson pressure bar system, the
semi-circular bend (SCB) method is applied to carry out the bending tests. Five groups of
SCB specimens are tested under different pre-loads and loading rates. The results show
that under a given pre-load, the flexural tensile strength of LG increases with the loading
rate, and decreases with the static pre-load at a given loading rate. The total flexural
tensile strength is roughly independent of the pre-load. An empirical equation is used to
represent the effects of the loading rate and the pre-load force on the dynamic flexural
tensile strength. Furthermore, the flexural tensile strengths measured from SCB tests have
higher values than the tensile strengths measured using the Brazilian disc method for the
same rock. A non-local failure theory is utilized to quantitatively interpret this
discrepancy.
Keywords: Flexural tensile strength, Pre-load, SHPB, SCB, Non-local theory
Page 2 of 34
https://mc06.manuscriptcentral.com/cgj-pubs
Canadian Geotechnical Journal
Draft
3
Introduction
The operation depth in rock engineering has been increasing and thus it is necessary
to consider the effect of the static pre-load due to in situ stresses on the mechanical
properties of underground rocks (Carter 1992; Chen et al. 2016; Wu et al. 2015).
Meanwhile, underground rocks may further be exposed to dynamic loads caused by
rockburst, blasting and earthquake (Dadfar et al. 2017; Kan et al. 2016; Tang et al. 2010).
In this case, the rock dynamic properties superposed on a static pre-load are needed to be
addressed (Chen et al. 2016; Li et al. 2008).
There have been many studies on the issue of dynamic strengths and fracture
properties for rocks subjected to static pre-loads (Chen et al. 2016, Gong et al. 2010, Li et
al. 2008, Zhou et al. 2014). Li et al. (2008) tested the rock specimen subjected to a
coupled axial static pre-stress and axial impact load by using a modified split Hopkinson
pressure bar (SHPB) system. It showed that the compressive strength of the specimens
under coupling loads is higher than their corresponding static or dynamic compressive
strength. With a constant axial pre-load stress and increasing impact load, the
compressive strength of rock increases initially and then reaches a constant maximum
value. Chen et al. (2016) investigated the fracture initiation toughness of rocks subjected
to coupled static and dynamic loads by using the notched semi-circular bend (NSCB)
method. The results revealed that the dynamic rock fracture toughness decreases with the
Page 3 of 34
https://mc06.manuscriptcentral.com/cgj-pubs
Canadian Geotechnical Journal

Draft
4
static pre-load at a given loading rate. The total fracture toughness, defined as the sum of
the dynamic fracture toughness and the initial stress intensity factor calculated from the
pre-load, increases with the pre-load at a given loading rate. Zhou et al. (2014) conducted
impact tests on rock Brazilian disc (BD) samples under static pre-tensions. They
concluded that the dynamic tensile strength of rock-like materials decreases with the
increase of the static pre-tension. Wu et al. (2015) adopted the BD method to measure the
dynamic tensile strength of rock-like materials under pre-tension. The results showed that
the rock dynamic tensile strength decreases with the increase of the pre-tension. It was
also observed that under the same pre-tension stress, the dynamic tensile strength
increases with the loading rate. However, the total tensile strength of the rock is roughly
independent of the pre-tension.
Despite of the existing research efforts on the effect of the pre-load on the dynamic
mechanical properties of rocks, the influence of the pre-load on the dynamic flexural
tensile strength of rocks remains unknown. However due to in situ stresses, bending load
is common near underground openings, e.g. flexural tensile stresses are induced at the
roof of an underground opening and the failure mode is thus dominated by the flexural
tensile failure. It is also worth noting that the flexural tensile strength of rocks is usually
higher than the tensile strength obtained from direct tensile tests (Xia et al. 2017; Zhang
and Zhao 2013). Hence for the structures subjected to bending load, the safety design
based on the tensile strength is too conservative.
Page 4 of 34
https://mc06.manuscriptcentral.com/cgj-pubs
Canadian Geotechnical Journal

Draft
5
Moreover, because the core-based semi-circular bend (SCB) specimen is easier to
make and the SCB flexure tests are easily conducted and relatively inexpensive, a large
database of rock flexural tensile strength measured from the SCB method for both
quasi-static (Coviello et al. 2005) and dynamic loads (Dai et al. 2008; Dai et al. 2010; Dai
et al. 2013; Dai and Xia 2010) is widely used in rock engineering and mining industry.
Therefore, it is desirable to investigate the dynamic flexural tensile failure of rock-like
materials under static pre-load by using the SCB method.
In this study, a modified SHPB system was utilized to perform dynamic flexural
tensile strength tests on the rock specimens under five different pre-load conditions. The
SCB specimens were employed to investigate the dynamic flexural tensile strength. In
addition, the flexural tensile strength measured from SCB-SHPB test with pre-load is
compared with the tensile strength measured from the BD method with the pre-load under
similar loading rates. For all different pre-load conditions, the discrepancy between the
dynamic flexural tensile strength and tensile strength is quantitatively interpreted by
using a non-local failure theory.
This paper is organized as follows. After the introduction, Section 2 introduces the
experimental methodology and the results along with discussions are presented in Section
3. Section 4 summarizes the entire paper.
Page 5 of 34
https://mc06.manuscriptcentral.com/cgj-pubs
Canadian Geotechnical Journal

Draft
6
Methodology
Pre-load SHPB System and Specimen Preparation
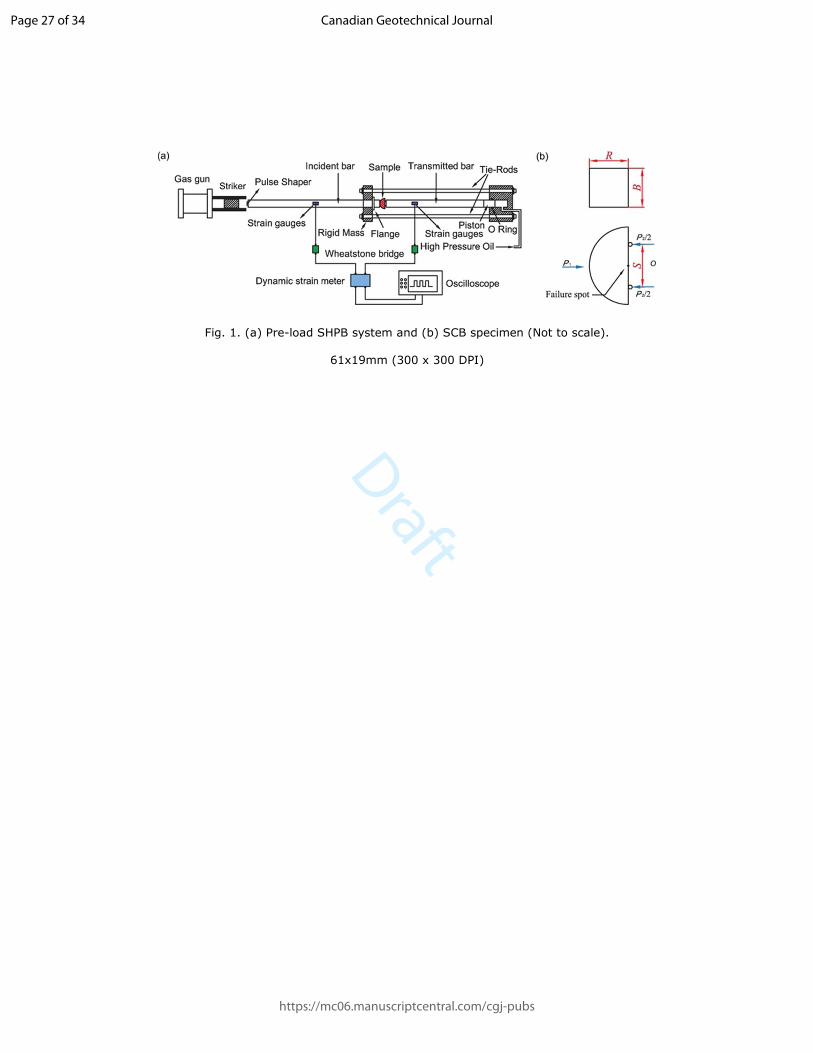
A modified SHPB system is used to perform the dynamic SCB tests with a static
pre-load. As shown in Fig. 1a, this modified SHPB system consists of a traditional SHPB
system and the pre-load system. The traditional SHPB system includes a striker bar, an
incident bar and a transmitted bar (Zhou et al. 2012). The specimen is sandwiched
between the incident bar and the transmitted bar, and the striker bar is launched by a gas
gun. The pre-load system developed by Wu et al. (2015) was utilized in this study. The
pre-load system is mainly composed of a pressure chamber and a rigid mass at the
incident bar end. Two tie-rods are used to connect the chamber and the rigid mass. The
pressure chamber is connected to the hydraulic control system through a high-pressure
pipeline. High hydraulic pressure derived from oil in the chamber provides an axial
pre-load to the piston and the axial pre-load is then transmitted into the bar and specimen.
The pre-load is controlled by the hydraulic pressure. Compared with the pre-load systems
innovated by other researchers (Chen et al. 2016; Frew et al. 2010; Zhou et al. 2014), the
main advantage of the pre-load system in this study is that the total length of the
compressed bars is much shorter and thus less prone to buckling (Wu et al. 2015).
The recording system includes strain gauges, a dynamic strain meter and an
oscilloscope. Two sets of strain gauges are mounted on the incident bar and transmitted
Page 6 of 34
https://mc06.manuscriptcentral.com/cgj-pubs
Canadian Geotechnical Journal

Draft
7
bar, respectively. The history of strain gauge signals during the dynamic SCB test is
recorded by a digital oscilloscope from the Wheatstone bridge circuits after amplification.
Insert Fig. 1 here.
The SCB specimen was used in the dynamic flexural strength tests with a static
pre-load. The configuration of the SCB specimen is shown in Fig. 1b, where R is the
radius of the half disk and B is the thickness of the rock disc. The span between two
supporting pins is S = 27.5 mm. Failure is initiated at the failure spot O on the specimen
due to dynamic bending load.
In order to prepare the SCB specimen, rock cores with a nominal diameter of 50 mm
(2R) are first directly drilled from the same rock block and then sliced into disk-shaped
specimens with an average thickness of B = 25 mm. All discs are polished to a length
variation better than 0.5% of their thickness (Zhou et al. 2012). Thereafter the discs are
cut into semicircular specimens for dynamic SCB tests.
The SCB specimens are made of Laurentian granite (LG), which is taken from the
Laurentian region of Quebec City, Canada. The dominant minerals in LG are feldspar
(60%), quartz (33%) and biotite (3-5%). The mineral grain size of LG varies from 0.2 to
2 mm. The average grain size of feldspar, quartz and biotite and is 0.4 mm, 0.5 mm and
0.3 mm, respectively. The physical and mechanical properties of LG are summarized in
Table 1 (Dai et al. 2010; Nasseri and Mohanty, 2008; Xia et al. 2017).
Page 7 of 34
https://mc06.manuscriptcentral.com/cgj-pubs
Canadian Geotechnical Journal

Draft
8
Measurement Principles
The rigid mass and the pressure chamber are first connected through two tie-rods,
and the hydraulic chamber is then pressurized to the desired value. The pressure is
transmitted to the bar system and the static pre-load is applied to the SCB specimen
because the rigid mass constrains the leftward axial motion of the bars through a flange
on the incident bar (Fig. 1a). When the desired pre-load is achieved in the SCB specimen,
the impact of striker bar on the free end of the incident bar generates the dynamic loading
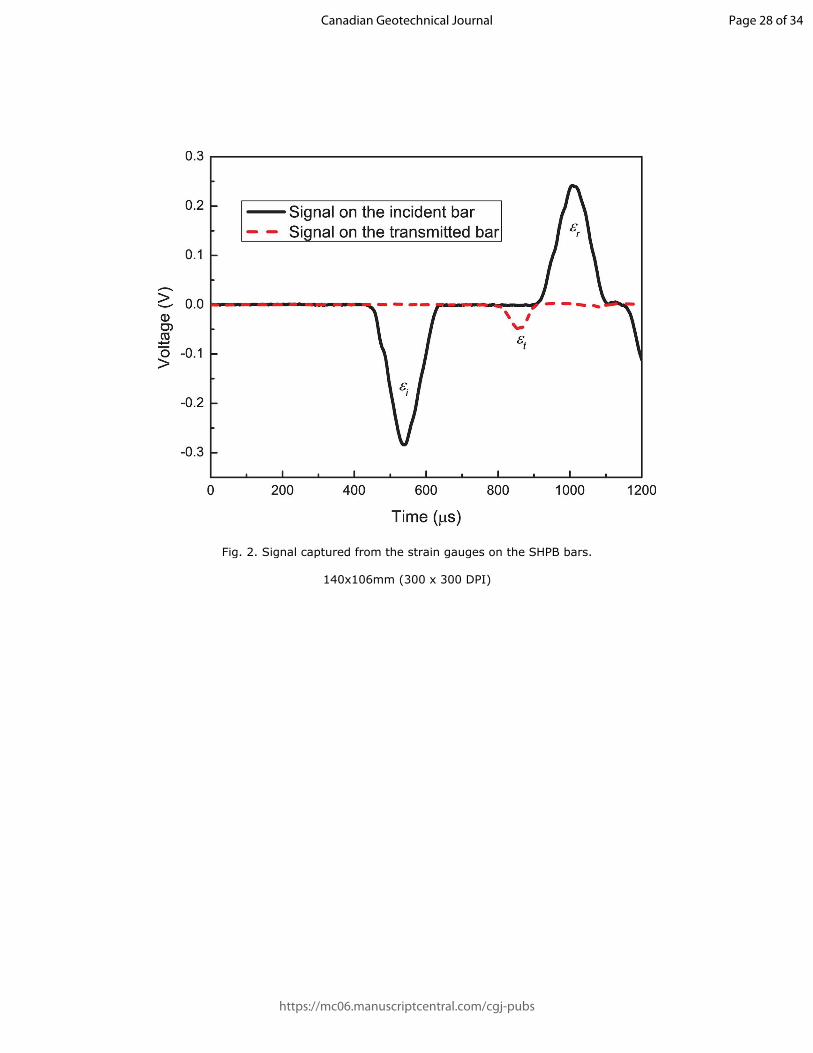
in the incident bar. The incident stress wave εi propagates along the incident bar before it
reaches the flange. The stress wave propagation is not affected by the flange since the
impact motion of the bars is rightward (Wu et al. 2015). When the incident stress wave
arrives at the specimen, a reflected stress wave εr and a transmitted stress wave εt are
produced. These three waves are captured by the strain gauges on the incident and
transmitted bar surfaces (Fig. 2). Since the oscilloscope channels for the strain gauges are
set to AC coupling in our tests, only the strain change could be measured, i.e., the strain
caused by the static pre-load in the transmitted bar is not recorded in the signal during the
dynamic tests (Chen et al. 2016). The solid line in Fig. 2 represents the signal of the
incident wave and reflected wave and the dash line delineates the signal of the
transmitted wave. The voltage of the signal on the transmitted bar starts from zero, which
indicates that the strain caused by the pre-load is not included in the signal.
Page 8 of 34
https://mc06.manuscriptcentral.com/cgj-pubs
Canadian Geotechnical Journal

Draft
9
Insert Fig. 2 here.
Determination of the dynamic flexural tensile strength requires the calculation of the
normal forces on two ends of the specimen. Those forces in the incident end (P1) and the
transmitted end (P2) can be determined (Zhou et al. 2012):
( ) ( ) ( ) ( )[ ] σεε AttAEPtPtP rid ++=+= 011 (1)
( ) ( ) ( ) σε AtAEPtPtP td +=+= 022 (2)
where P0 is the static force on the bars due to the pre-load; Pd1 and Pd2 are the dynamic
force history on the bars; A and E are the cross-sectional area and Young’s modulus of the
bars, respectively; σ is the static pressure on the bars caused by the pre-load. Since only
the stress change was measured, the static force (P0 = Aσ) on the bars was not recorded in
the signal and the forces on two ends of specimen recorded by the strain gauges are Pd1
and Pd2.
According to the suggested method by the International Society for Rock Mechanics
(ISRM), the pulse shaping technique placed at the free end of the incident bar (Fig. 1a)
was applied to achieve the dynamic force balance (Dai et al. 2008; Zhou et al. 2012).
Based on Eqs. (1) and (2) and the AC coupling used in the signal record, the force
balance condition (P1(t) ≈ P2(t)) for dynamic SCB tests should be written as:
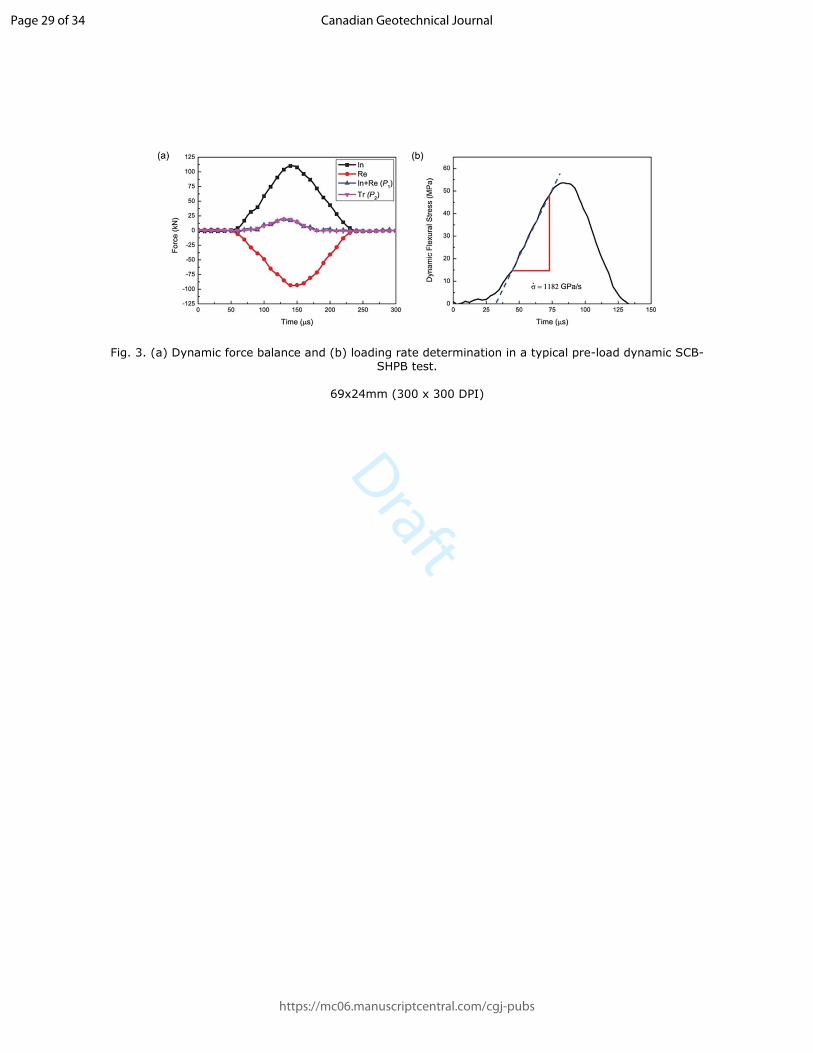
( ) ( )[ ] ( )tAEttAE tri εεε ≈+ . Figure 3a shows the forces on both ends of the SCB
specimen in a typical pre-load dynamic SCB-SHPB test. The forces (P1 and P2) on both
Page 9 of 34
https://mc06.manuscriptcentral.com/cgj-pubs
Canadian Geotechnical Journal
Draft
10
ends of the specimen are approximately equal during the whole dynamic loading period
(Fig. 3a), which is the same as the traditional SCB-SHPB test (Chen et al. 2016).
Consequently, the dynamic force balance on both loading ends of specimen is achieved,
i.e. P1 ≈ P2. The dynamic force balance has been critically assessed for all pre-load
dynamic SCB-SHPB tests in this study.
Insert Fig. 3 here.
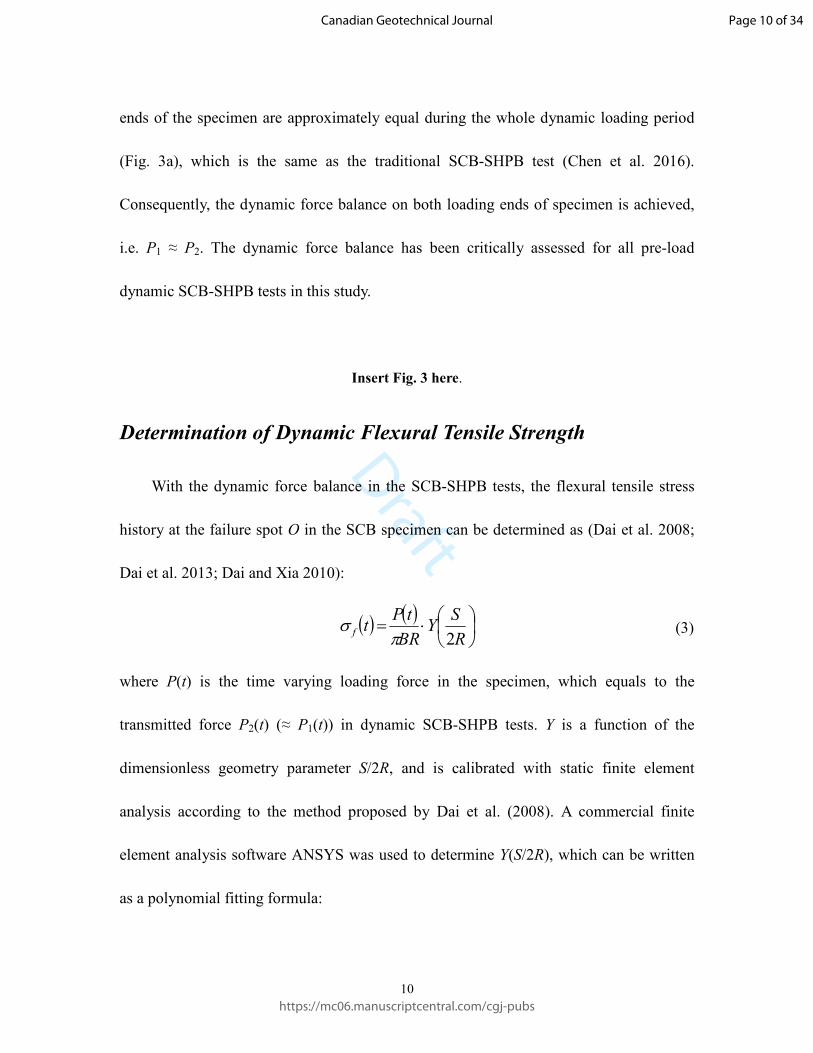
Determination of Dynamic Flexural Tensile Strength
With the dynamic force balance in the SCB-SHPB tests, the flexural tensile stress
history at the failure spot O in the SCB specimen can be determined as (Dai et al. 2008;
Dai et al. 2013; Dai and Xia 2010):
( ) ( )
⋅=R
SY
BR
tPtf
2πσ (3)
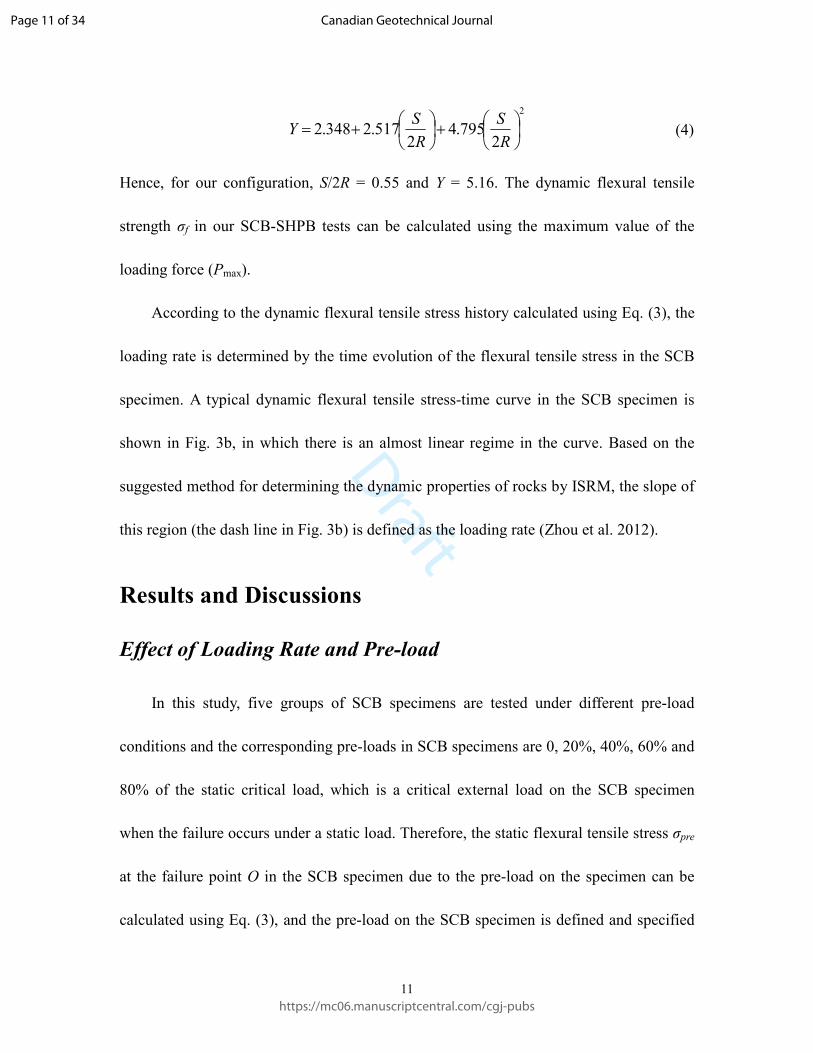
where P(t) is the time varying loading force in the specimen, which equals to the
transmitted force P2(t) (≈ P1(t)) in dynamic SCB-SHPB tests. Y is a function of the
dimensionless geometry parameter S/2R, and is calibrated with static finite element
analysis according to the method proposed by Dai et al. (2008). A commercial finite
element analysis software ANSYS was used to determine Y(S/2R), which can be written
as a polynomial fitting formula:
Page 10 of 34
https://mc06.manuscriptcentral.com/cgj-pubs
Canadian Geotechnical Journal
Draft
11
2
2795.4
2517.2348.2
+
+=R
S
R
SY (4)
Hence, for our configuration, S/2R = 0.55 and Y = 5.16. The dynamic flexural tensile
strength σf in our SCB-SHPB tests can be calculated using the maximum value of the
loading force (Pmax).
According to the dynamic flexural tensile stress history calculated using Eq. (3), the
loading rate is determined by the time evolution of the flexural tensile stress in the SCB
specimen. A typical dynamic flexural tensile stress-time curve in the SCB specimen is
shown in Fig. 3b, in which there is an almost linear regime in the curve. Based on the
suggested method for determining the dynamic properties of rocks by ISRM, the slope of
this region (the dash line in Fig. 3b) is defined as the loading rate (Zhou et al. 2012).
Results and Discussions
Effect of Loading Rate and Pre-load
In this study, five groups of SCB specimens are tested under different pre-load
conditions and the corresponding pre-loads in SCB specimens are 0, 20%, 40%, 60% and
80% of the static critical load, which is a critical external load on the SCB specimen
when the failure occurs under a static load. Therefore, the static flexural tensile stress σpre
at the failure point O in the SCB specimen due to the pre-load on the specimen can be
calculated using Eq. (3), and the pre-load on the SCB specimen is defined and specified
Page 11 of 34
https://mc06.manuscriptcentral.com/cgj-pubs
Canadian Geotechnical Journal

Draft
12
via the σpre value. The σpre values of SCB specimens in this study are 0 MPa, 5.24 MPa,
10.48 MPa, 15.72 MPa and 20.96 MPa, respectively.
There are two types of flexural tensile strength considered in this study: the dynamic
flexural tensile strength σf_Dynamic of rocks (which is directly derived from dynamic
loading force in SCB-SHPB tests), and the total flexural tensile strength σf_Total (which is
the summation of the dynamic flexural tensile strength and the flexural tensile stress σpre
due to the pre-load stress). The loading force used in Eq. (3) for calculating σf_Dynamic is
the dynamic force PDyanmic, and σf_Total = σf_Dynamic + σpre. Therefore σf_Dynamic represents the
dynamic loading capacity of a rock specimen under a certain static pre-load while σf_Total
indicates the total loading capacity
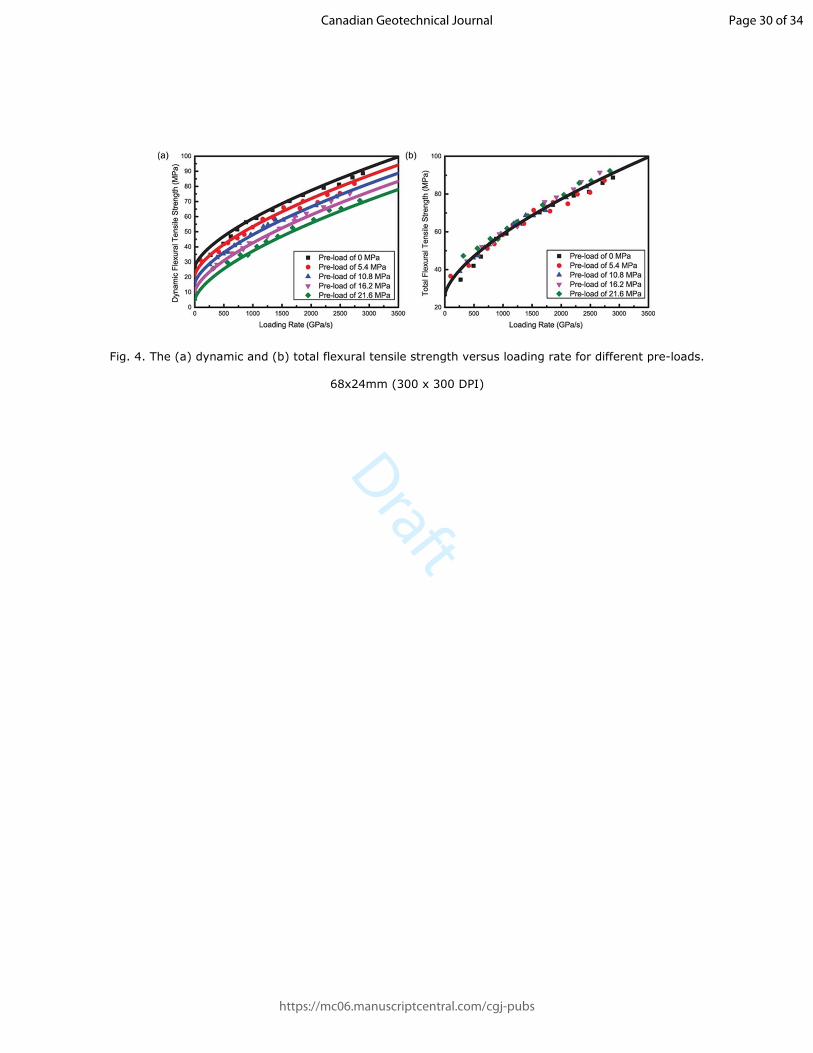
Figure 4a and b illustrate σf_Dynamic and σf_Total versus loading rate under different
pre-loads, respectively. It is obvious that both σf_Dynamic and σf_Total increase with the
loading rate, revealing the phenomenon of rate dependency that is common for rock-like
materials, including rocks (Chen et al. 2016; Wu et al. 2015; Xia and Yao 2015; Zhang
and Zhao 2013), concretes (Cusatis 2011, Fujikake et al. 2006; Yao et al. 2017) and
ceramics (Brar et al. 1988; Field et al. 2004).
Insert Fig. 4 here.
Apart from the rate dependency discussed above, Figure 4a also shows that the
σf_Dynamic of LG decreases with the increase of the pre-load at the same loading rate. For
Page 12 of 34
https://mc06.manuscriptcentral.com/cgj-pubs
Canadian Geotechnical Journal
Draft
13
example, when the loading rate is approximately 1400 GPa/s, the σf_Dynamic of LG is 64.37
MPa if the SCB specimen does not have a pre-load. However, the σf_Dynamic of LG at the
similar loading rate are 58.9 MPa with 5.24 MPa pre-load, 57.86 MPa with 10.48 MPa
pre-load, 52.23 MPa with 15.72 MPa pre-load, 46.85 MPa with 20.96 MPa pre-load. This
phenomenon is consistent with the results reported by Wu et al. (2015) for dynamic
tensile strength of the same rock subjected to pre-load. The decrease of dynamic flexural
tensile strength can be attributed to the opening of microcracks when the specimen bears
the pre-load stress.
Figure 4b shows that the σf_Total of LG are almost the same under the same loading
rate regardless of the magnitude of the pre-load applied to the SCB specimen. The similar
phenomenon was reported for dynamic tensile strength of LG under the static pre-tension
using BD specimens (Wu et al. 2015). This may be caused by more microcracks
generated and activated under higher pre-loads. The increase of activated microcracks
leads to a more viscous material that is more sensitive to the loading rate. The pre-load
weakening effect is offset by this increased rate sensitivity and thus the total flexural
tensile strength is roughly independent of the pre-load (Wu et al. 2015).
Failure Pattern of the SCB Specimens
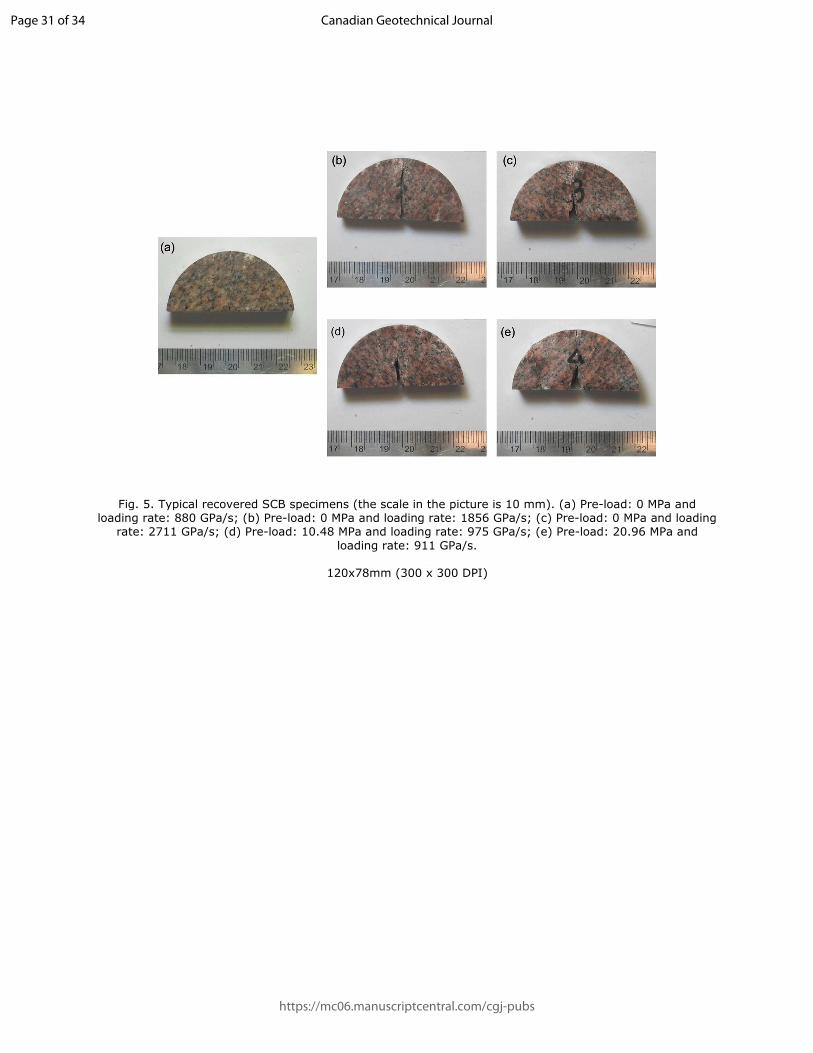
Figure 5 compares five typical recovered SCB specimens from dynamic SCB-SHPB
tests. The specimen in Fig. 5a was damaged at a pre-load of 0 MPa and 880 GPa/s. The
Page 13 of 34
https://mc06.manuscriptcentral.com/cgj-pubs
Canadian Geotechnical Journal

Draft
14
specimens in Fig. 5b and c were impacted with loading rates of 1856 GPa/s and 2711
GPa/s respectively without a pre-load. These three specimens were completely split into
two roughly identical halves by a damage zone enclosing the main crack. It can be seen
that the width of damage zone increases with the increase of the loading rate. This
phenomenon may be explained as follows. The higher the loading rate is, the less time the
microcracks have for propagation and coalescence until failure. As a result, more and
more microcracks are involved in the dynamic fragmentation process with the increase of
loading rate, resulting in the increase of the damage zone. This phenomenon is consistent
with the results of other rock-like materials reported in the literature (Dai et al. 2008; Dai
et al. 2013).
In addition, the specimen in Fig. 5d was loaded by a pre-load of 10.48 MPa before
the impact with a loading rate of 975 GPa/s and the specimen in Fig. 5e was impacted
with loading rate of 911 GPa/s under a pre-load of 20.96 MPa. These two specimens were
also completely split into two roughly identical halves by a damage zone enclosing the
main crack. Furthermore, the specimens in Fig. 5a, d and e are at the almost same loading
rate. It indicates that at the almost same loading rate, the damage zone of the SCB
specimen increases with the pre-load. More microcracks activated by the increased
pre-load are available to be involved in the fragmentation process, leading to the increase
of the damage zone.
Insert Fig. 5 here.
Page 14 of 34
https://mc06.manuscriptcentral.com/cgj-pubs
Canadian Geotechnical Journal
Draft
15
Empirical Model for Flexural Strength Based on Loading Rate
and Pre-Load Effects
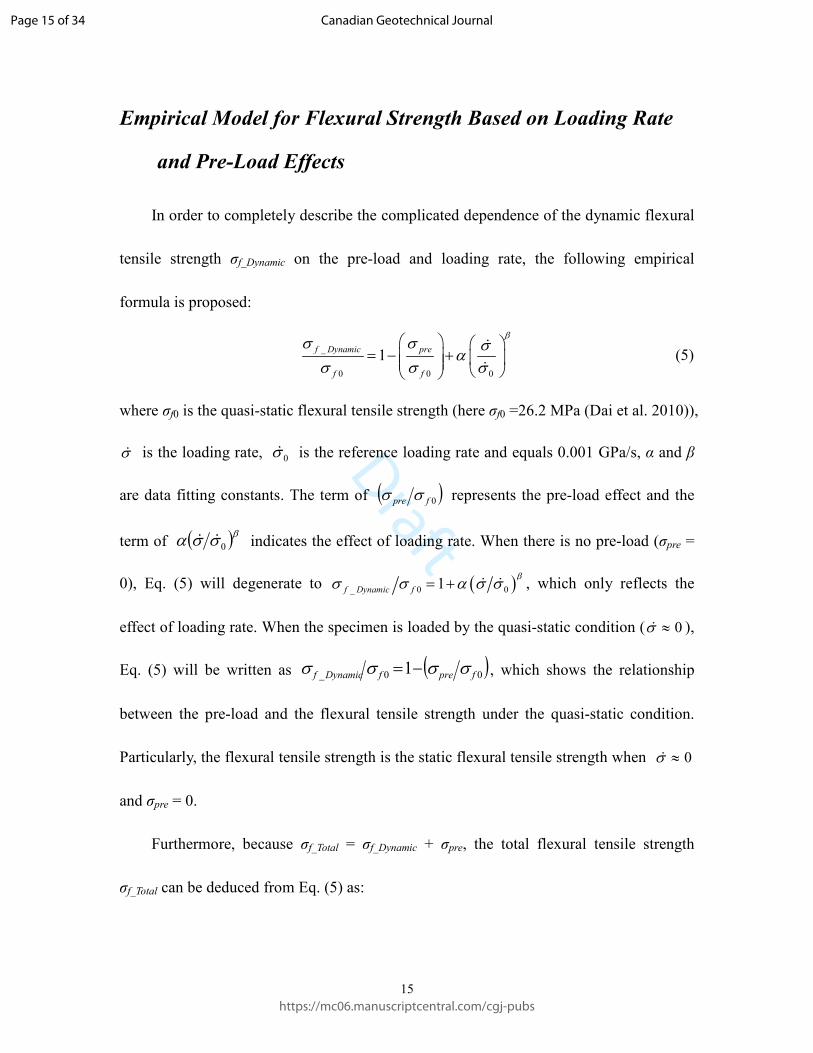
In order to completely describe the complicated dependence of the dynamic flexural
tensile strength σf_Dynamic on the pre-load and loading rate, the following empirical
formula is proposed:
_
0 0 0
1f Dynamic pre
f f
βσ σ σ
ασ σ σ
= − +
&
& (5)
where σf0 is the quasi-static flexural tensile strength (here σf0 =26.2 MPa (Dai et al. 2010)),
σ& is the loading rate, 0σ& is the reference loading rate and equals 0.001 GPa/s, α and β
are data fitting constants. The term of ( )0fpre σσ represents the pre-load effect and the
term of ( )βσσα 0&& indicates the effect of loading rate. When there is no pre-load (σpre =
0), Eq. (5) will degenerate to ( )_ 0 01f Dynamic f
βσ σ α σ σ= + & & , which only reflects the
effect of loading rate. When the specimen is loaded by the quasi-static condition ( 0≈σ& ),
Eq. (5) will be written as ( )00_ 1 fprefDynamicf σσσσ −= , which shows the relationship
between the pre-load and the flexural tensile strength under the quasi-static condition.
Particularly, the flexural tensile strength is the static flexural tensile strength when 0≈σ&
and σpre = 0.
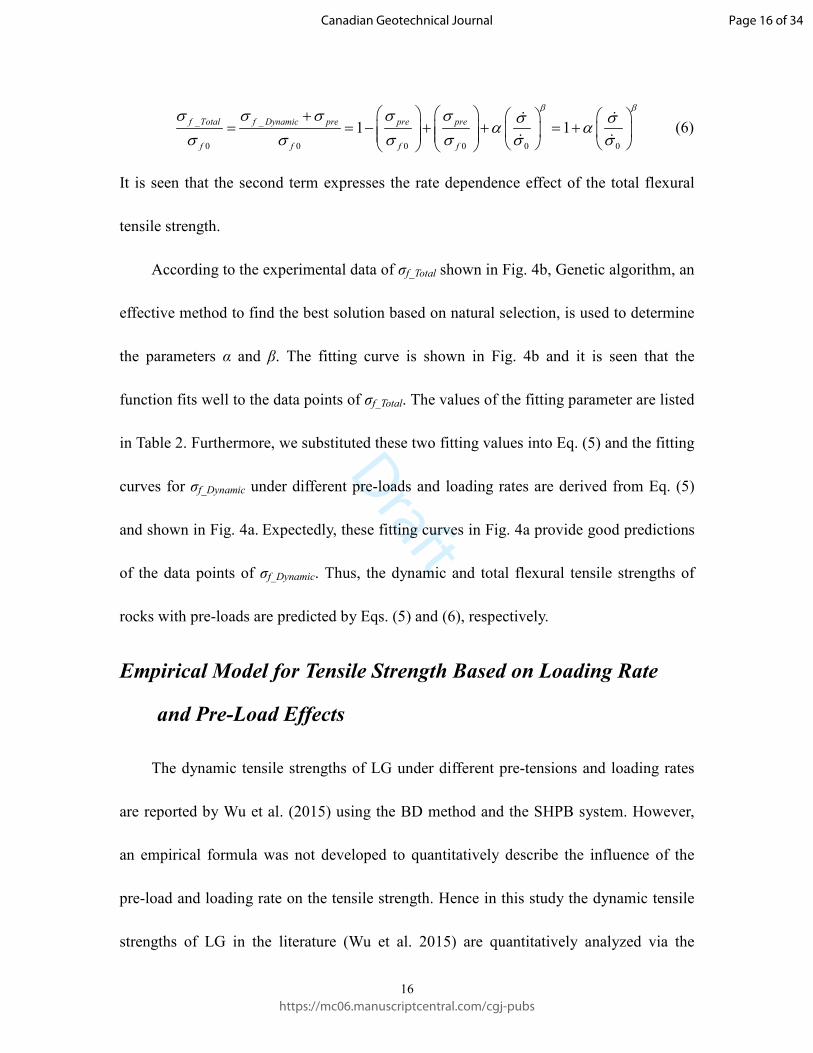
Furthermore, because σf_Total = σf_Dynamic + σpre, the total flexural tensile strength
σf_Total can be deduced from Eq. (5) as:
Page 15 of 34
https://mc06.manuscriptcentral.com/cgj-pubs
Canadian Geotechnical Journal
Draft
16
_ _
0 0 0 0 0 0
1 1f Total f Dynamic pre pre pre
f f f f
β βσ σ σ σ σ σ σ
α ασ σ σ σ σ σ
+ = = − + + = +
& &
& & (6)
It is seen that the second term expresses the rate dependence effect of the total flexural
tensile strength.
According to the experimental data of σf_Total shown in Fig. 4b, Genetic algorithm, an
effective method to find the best solution based on natural selection, is used to determine
the parameters α and β. The fitting curve is shown in Fig. 4b and it is seen that the
function fits well to the data points of σf_Total. The values of the fitting parameter are listed
in Table 2. Furthermore, we substituted these two fitting values into Eq. (5) and the fitting
curves for σf_Dynamic under different pre-loads and loading rates are derived from Eq. (5)
and shown in Fig. 4a. Expectedly, these fitting curves in Fig. 4a provide good predictions
of the data points of σf_Dynamic. Thus, the dynamic and total flexural tensile strengths of
rocks with pre-loads are predicted by Eqs. (5) and (6), respectively.
Empirical Model for Tensile Strength Based on Loading Rate
and Pre-Load Effects
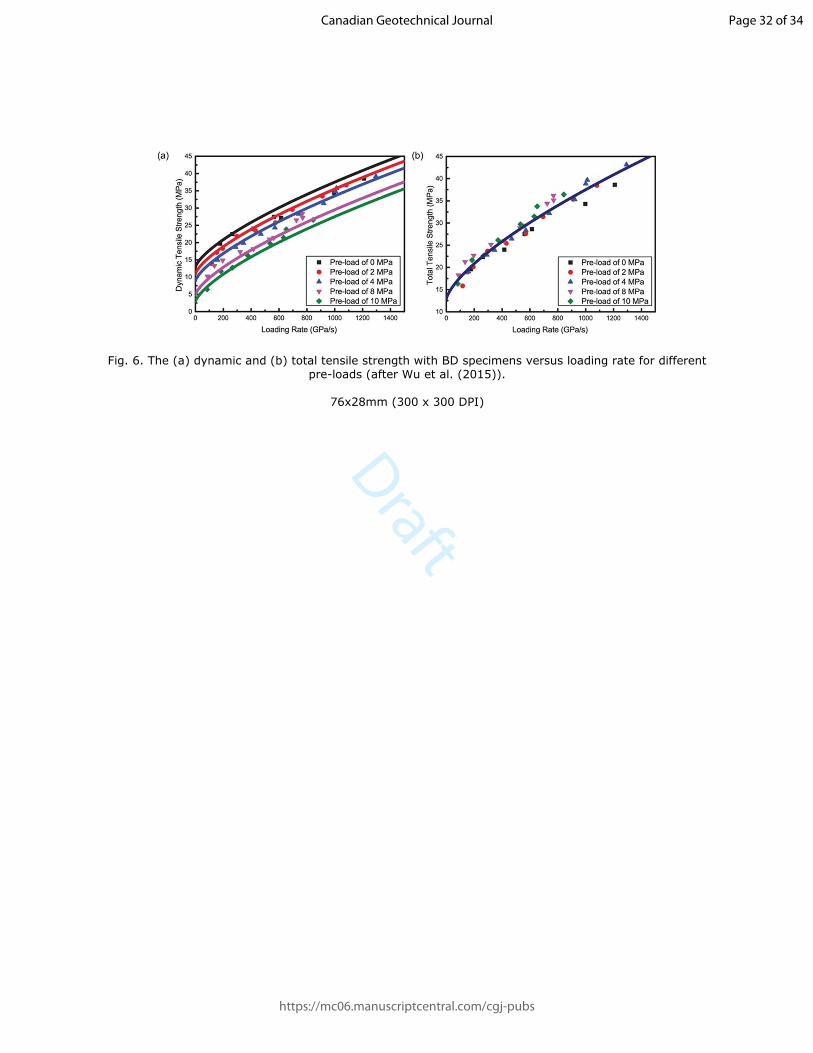
The dynamic tensile strengths of LG under different pre-tensions and loading rates
are reported by Wu et al. (2015) using the BD method and the SHPB system. However,
an empirical formula was not developed to quantitatively describe the influence of the
pre-load and loading rate on the tensile strength. Hence in this study the dynamic tensile
strengths of LG in the literature (Wu et al. 2015) are quantitatively analyzed via the
Page 16 of 34
https://mc06.manuscriptcentral.com/cgj-pubs
Canadian Geotechnical Journal

Draft
17
similar empirical formula and the complicated dependence of the dynamic tensile
strength on the pre-load and loading rate is also completely described by the following
equation:
_ _
0 0 0
1t Dynamic t pre
t t
βσ σ σ
ασ σ σ
= − +
&
& (7)
where σt_Dynamic is the dynamic tensile strength, σt0 is the quasi-static tensile strength (here
σt0 = 12.8 MPa (Wu et al. 2015)), σt_pre is the pre-tension at the center of the BD specimen,
σ& is the loading rate, 0σ& is the reference loading rate and equals 0.001 GPa/s, α and β
are data fitting constants. Similarly, the pre-load effect is described by the term of
( )_ 0t pre tσ σ and the loading rate dependence is represented through the term of
( )βσσα 0&& . When σt_pre = 0, the loading rate dependence is written as
( )_ 0 01t Dynamic t
βσ σ α σ σ= + & & . The relationship between the pre-load and the static tensile
strength is expressed as ( )_ 0 _ 01t Dynamic t t pre tσ σ σ σ= − when 0≈σ& .
Moreover, similar to the dynamic SCB tests, the total tensile strength σt_Total of LG
from the BD method is the sum of σt_Dynamic and σt_pre. The total tensile strength σt_Total of
LG in function of the pre-load and loading rate can be deduced from Eq. (7):
_ _ _ _ _
0 0 0 0 0 0
1 1t Total t Dynamic t pre t pre t pre
t t t t
β βσ σ σ σ σ σ σ
α ασ σ σ σ σ σ
+ = = − + + = +
& &
& & (8)
In the above equation, the second term expresses the loading rate dependence of the
total tensile strength. Similarly, when there is no dynamic loading, the total tensile
strength of rocks is the quasi-static tensile strength. Based on the experimental results of
Page 17 of 34
https://mc06.manuscriptcentral.com/cgj-pubs
Canadian Geotechnical Journal

Draft
18
total tensile strength in Fig. 6b, the values of α and β for BD tests are obtained from the
data fitting and tabulated in Table 2. Figure 6b illustrates the fitting curve and it is
obvious that the function fits well to the data points of σt_Total. In addition, we substituted
these fitting values of α and β into Eq. (7) and the fitting curves for σt_Dynamic under
different pre-loads and loading rates are derived from Eq. (7) and shown in Fig. 6a.
Expectedly, these fitting curves in Fig. 6a provide good predictions of the data points of
σt_Dynamic. Thus, both the dynamic and total tensile strengths of rocks under different
pre-loads and loading rates are predicted by Eqs. (7) and (8), respectively.
Insert Fig. 6 here.
Reconciliation of Flexural Tensile Strength with Tensile Strength
The total flexural tensile strengths and the total tensile strengths of LG under
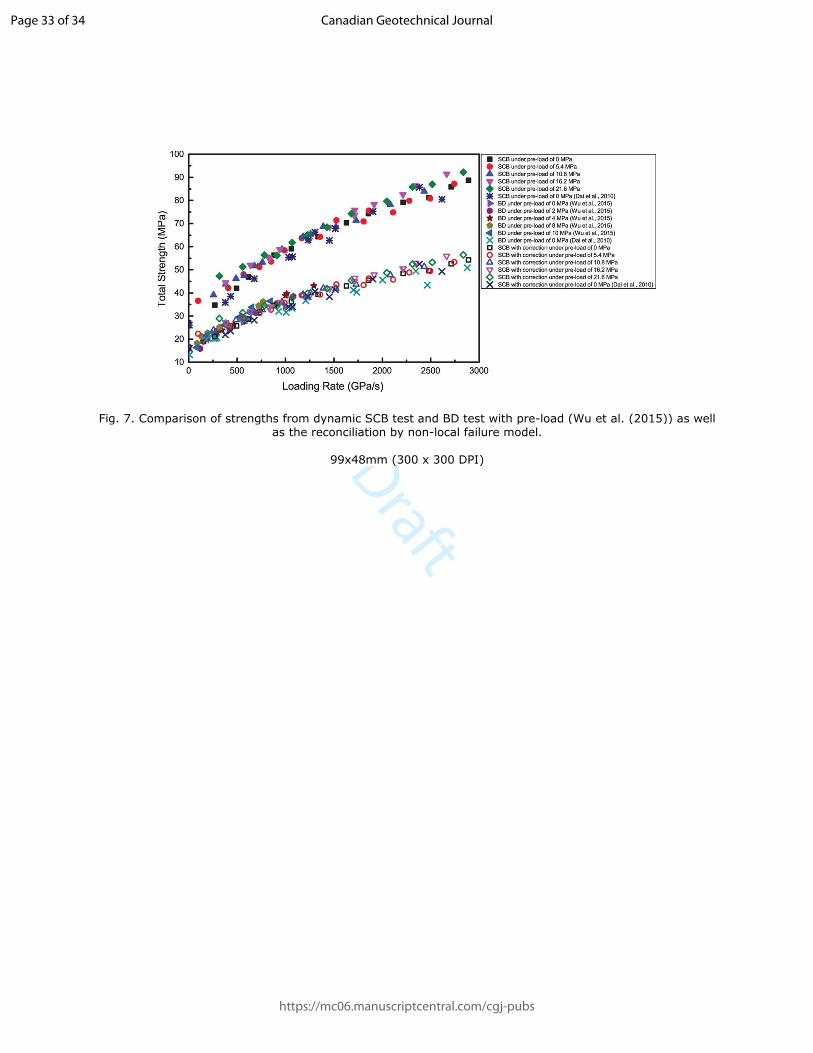
different loading rates and pre-loads are compared in Fig. 7. It is obvious that under all
pre-loads, the total flexural tensile strength measured through the SCB method is higher
than the total tensile strength measured through the BD method for a given loading rate.
This phenomenon has also been observed in the static tensile measurements with a stress
gradient around the potential failure spot (Coviello et al. 2005; Hudson et al. 1972; Lajtai
1972; Mellor and Hawkes 1971). Moreover, Zhao and Li (2000) reported the higher value
of dynamic strength from their three-point flexural test as compared to that obtained by
the BD test. Xia et al. (2017) and Dai et al. (2013) found the dynamic flexural tensile
Page 18 of 34
https://mc06.manuscriptcentral.com/cgj-pubs
Canadian Geotechnical Journal
Draft
19
strength of LG is higher than dynamic tensile strength from the BD test, and proposed a
theoretical model to reconcile this difference.
Insert Fig. 7 here.
In this study, due to the achievement of dynamic equilibrium in the SCB specimen, a
non-local failure model can be applied to reconcile the discrepancy between the measured
total flexural tensile strengths from SCB tests and the measured total tensile strengths
from BD tests (Carter 1992; Lajtai 1972; Van de Steen and Vervoort 2001). The details of
the non-local failure model can be found in references (Carter 1992; Lajtai 1972; Van de
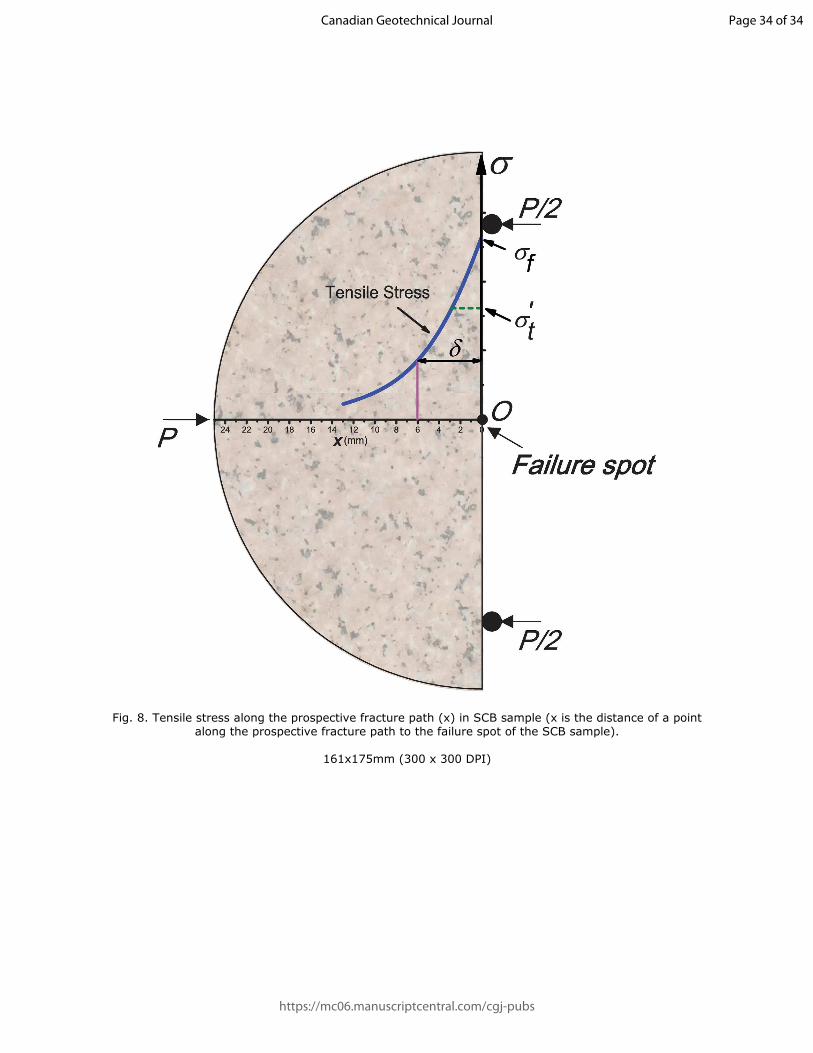
Steen and Vervoort 2001). In this theory, the failure of materials occurs when the average
local stress over a characteristic material length δ along the prospective fracture path
equals to the tensile strength of materials. The relationship between the flexural tensile
strength σf (stress at the failure spot when the specimen fails) and the resulting tensile
strength tσ ′ is determined as 6345.1=′tf σσ by using a characteristic material length δ
(as shown in Fig. 8). The characteristic material length is related to the characteristic
length of material microscopic structures and cannot be directly measured (Carter 1992;
Dai et al. 2010; Lajtai 1972; Van de Steen and Vervoort 2001; Xia et al. 2017), thus we
assume δ = 6 mm in this study as suggested for the same rock in the earlier work (Dai et
al. 2010; Van de Steen and Vervoort 2001).
Insert Fig. 8 here.
Page 19 of 34
https://mc06.manuscriptcentral.com/cgj-pubs
Canadian Geotechnical Journal
Draft
20
Similar to early work, the strength is corrected by using the non-local theory, while
it is unnecessary to convert the loading rate because the failure in the SCB specimen is at
the center of the original disc (i.e., point O in Fig. 1b) and the loading rate derived from
the stress history at this point is valid (Dai et al. 2010; Xia et al. 2017). Hence, the
corrected total tensile strength Totalt _σ ′ for all pre-loads can be deduced from the
measured total flexural tensile strength σf_Total. The results are also shown in Fig. 7. It can
be seen that the corrected total tensile strengths from the total flexural tensile strengths
are consistent with those measured from BD tests.
Conclusions
In this work, we utilized a pre-load SHPB system with a SCB specimen to measure
the dynamic flexural tensile strength of rocks subjected to different pre-loads. Five
groups of SCB specimens are tested under a pre-load of 0, 20%, 40%, 60% and 80% of
the maximum static load and with the loading rate ranging from 0 to 2750 GPa/s.
Pulse shaping technique was used in all dynamic SCB-SHPB tests to facilitate
dynamic force equilibrium. Finite element method was employed to obtain equations
calculating flexural tensile strength. The results indicate that, under a given pre-load,
there is a significant enhancement in dynamic flexural tensile strength with the increase
of the loading rate. The dynamic flexural tensile strength decreases with the increase of
the pre-load stress at a given loading rate due to the opening of microcracks by the
Page 20 of 34
https://mc06.manuscriptcentral.com/cgj-pubs
Canadian Geotechnical Journal

Draft
21
pre-load. It is worth noting that the total flexural tensile strength of the rock specimen,
defined as the sum of the dynamic flexural tensile strength and initial flexural tensile
stress calculated from the pre-load, is roughly independent of the pre-load.
An empirical equation is proposed to represent the effect of loading rates and
pre-loads, and the results show that the equation can depict the trend of the experimental
data from both SCB and BD tests. Furthermore, the total flexural tensile strength
measured from SCB tests has a higher value than the total tensile strength measured using
the BD method under similar loading rates. A non-local failure theory is used to
quantitatively rationalize this discrepancy. The corrected total tensile strengths from the
total flexural strengths are consistent with those measured from BD tests.
Acknowledgements
This research was supported by the Natural Sciences and Engineering Research Council
of Canada (NSERC) through the Discovery Grant # 72031326. This work was supported
by Mitacs through the Mitacs Accelerate program.
References
Brar, N., Bless, S., and Rosenberg, Z. 1988. Brittle failure of ceramic rods under dynamic compression. Le
Journal de Physique Colloques, 49(C3): C3-607-C3-612.
Carter, B. J. 1992. Size and stress gradient effects on fracture around cavities. Rock Mechanics and Rock
Engineering, 25(3): 167-186.
Chen, R., Li, K., Xia, K., Lin, Y., Yao, W., and Lu, F. 2016. Dynamic fracture properties of rocks subjected
Page 21 of 34
https://mc06.manuscriptcentral.com/cgj-pubs
Canadian Geotechnical Journal
Draft
22
to static pre-load using notched semi-circular bend method. Rock Mechanics and Rock Engineering,
49(10): 3865-3872.
Coviello, A., Lagioia, R., and Nova, R. 2005. On the measurement of the tensile strength of soft rocks.
Rock Mechanics and Rock Engineering, 38(4): 251-273.
Cusatis, G. 2011. Strain-rate effects on concrete behavior. International Journal of Impact Engineering,
38(4): 162-170.
Dadfar, B., El Naggar, M. H., and Nastev, M. 2017. Quantifying exposure of linear infrastructures to
earthquake-triggered transverse landslides in permafrost thawing slopes. Canadian Geotechnical Journal,
54(7): 1002-1012.
Dai, F., Xia, K., and Luo, S. N. 2008. Semicircular bend testing with split Hopkinson pressure bar for
measuring dynamic tensile strength of brittle solids. Review of Scientific Instruments, 79(12):
123903-6.
Dai, F., Xia, K., and Tang, L. 2010. Rate dependence of the flexural tensile strength of Laurentian granite.
International Journal of Rock Mechanics and Mining Sciences, 47(3): 469-475.
Dai, F., Xia, K., Zuo, J. P., Zhang, R., and Xu, N. W. 2013. Static and dynamic flexural strength anisotropy
of Barre granite. Rock Mechanics and Rock Engineering, 46(6): 1-14.
Dai, F., and Xia, K. W. 2010. Loading rate dependence of tensile strength anisotropy of Barre granite. Pure
and Applied Geophysics, 167(11): 1419-1432.
Field, J. E., Walley, S. M., Proud, W. G., Goldrein, H. T., and Siviour, C. R. 2004. Review of experimental
techniques for high rate deformation and shock studies. International Journal of Impact Engineering,
30(7): 725-775.
Frew, D. J., Akers, S. A., Chen, W., and Green, M. L. 2010. Development of a dynamic triaxial Kolsky bar.
Measurement Science and Technology, 21(10): 105704.
Fujikake, K., Senga, T., Ueda, N., Ohno, T., and Katagiri, M. 2006. Effects of strain rate on tensile behavior
of reactive powder concrete. Journal of Advanced Concrete Technology, 4(1): 79-84.
Gong, F., Li, X., and Liu, X. 2010. Experimental study of dynamic characteristics of sandstone under
one-dimensional coupled static and dynamic loads. Chinese Journal of Rock Mechanics and
Engineering, 29(10): 2076-2085.
Hudson, J., Brown, E., and Rummel, F. 1972. The controlled failure of rock discs and rings loaded in
diametral compression. International Journal of Rock Mechanics and Mining Sciences & Geomechanics
Abstracts, 9(2): 241-248.
Page 22 of 34
https://mc06.manuscriptcentral.com/cgj-pubs
Canadian Geotechnical Journal
Draft
23
Kan, M. E., Taiebat, H. A., and Taiebat, M. 2016. Framework to assess Newmark-type simplified methods
for evaluation of earthquake-induced deformation of embankments. Canadian Geotechnical Journal,
54(3): 392-404.
Lajtai, E. Z. 1972. Effect of tensile stress gradient on brittle fracture initiation. International Journal of
Rock Mechanics and Mining Sciences & Geomechanics Abstracts, 9(5): 569-578.
Li, X. B., Zhou, Z. L., Lok, T. S., Hong, L., and Yin, T. B. 2008. Innovative testing technique of rock
subjected to coupled static and dynamic loads. International Journal of Rock Mechanics and Mining
Sciences, 45(5): 739-748.
Mellor, M., and Hawkes, I. 1971. Measurement of tensile strength by diametral compression of discs and
annuli. Engineering Geology, 5(3): 173-225.
Nasseri, M. H. B., and Mohanty, B. 2008. Fracture toughness anisotropy in granitic rocks. International
Journal of Rock Mechanics and Mining Sciences, 45(2): 167-193.
Tang, C., Zhu, J., and Qi, X. 2010. Landslide hazard assessment of the 2008 Wenchuan earthquake: a case
study in Beichuan area. Canadian Geotechnical Journal, 48(1): 128-145.
Van de Steen, B., and Vervoort, A. 2001. Non-local stress approach to fracture initiation in laboratory
experiments with a tensile stress gradient. Mechanics of Materials, 33(12): 729-740.
Wu, B., Chen, R., and Xia, K. 2015. Dynamic tensile failure of rocks under static pre-tension. International
Journal of Rock Mechanics and Mining Sciences, 80: 12-18.
Xia, K., and Yao, W. 2015. Dynamic rock tests using split Hopkinson (Kolsky) bar system-A review.
Journal of Rock Mechanics and Geotechnical Engineering, 7(1): 27-59.
Xia, K., Yao, W., and Wu, B. 2017. Dynamic rock tensile strengths of Laurentian granite: Experimental
observation and micromechanical model. Journal of Rock Mechanics and Geotechnical Engineering,
9(1): 116-124.
Yao, W., Xu, Y., Liu, H.-W., and Xia, K. 2017. Quantification of thermally induced damage and its effect on
dynamic fracture toughness of two mortars. Engineering Fracture Mechanics, 169: 74-88.
Zhang, Q. B., and Zhao, J. 2013. A review of dynamic experimental techniques and mechanical behaviour
of rock materials. Rock Mechanics and Rock Engineering, 47(4): 1411-1478.
Zhao, J., and Li, H. B. 2000. Experimental determination of dynamic tensile properties of a granite.
International Journal of Rock Mechanics and Mining Sciences, 37(5): 861-866.
Zhou, Y. X., Xia, K., Li, X. B., Li, H. B., Ma, G. W., Zhao, J., Zhou, Z. L., and Dai, F. 2012. Suggested
Page 23 of 34
https://mc06.manuscriptcentral.com/cgj-pubs
Canadian Geotechnical Journal

Draft
24
methods for determining the dynamic strength parameters and mode-I fracture toughness of rock
materials. International Journal of Rock Mechanics and Mining Sciences, 49: 105-112.
Zhou, Z., Li, X., Zou, Y., Jiang, Y., and Li, G. 2014. Dynamic brazilian tests of granite under coupled static
and dynamic loads. Rock Mechanics and Rock Engineering, 47(2): 495-505.
Page 24 of 34
https://mc06.manuscriptcentral.com/cgj-pubs
Canadian Geotechnical Journal
Draft
25
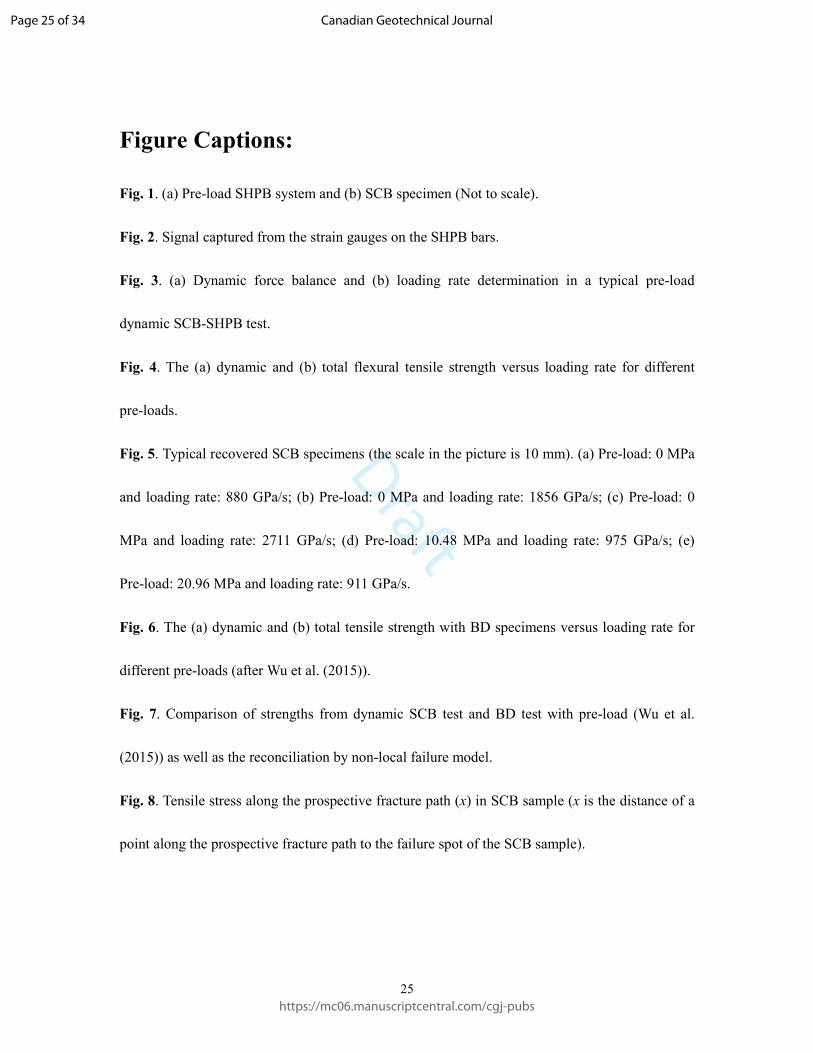
Figure Captions:
Fig. 1. (a) Pre-load SHPB system and (b) SCB specimen (Not to scale).
Fig. 2. Signal captured from the strain gauges on the SHPB bars.
Fig. 3. (a) Dynamic force balance and (b) loading rate determination in a typical pre-load
dynamic SCB-SHPB test.
Fig. 4. The (a) dynamic and (b) total flexural tensile strength versus loading rate for different
pre-loads.
Fig. 5. Typical recovered SCB specimens (the scale in the picture is 10 mm). (a) Pre-load: 0 MPa
and loading rate: 880 GPa/s; (b) Pre-load: 0 MPa and loading rate: 1856 GPa/s; (c) Pre-load: 0
MPa and loading rate: 2711 GPa/s; (d) Pre-load: 10.48 MPa and loading rate: 975 GPa/s; (e)
Pre-load: 20.96 MPa and loading rate: 911 GPa/s.
Fig. 6. The (a) dynamic and (b) total tensile strength with BD specimens versus loading rate for
different pre-loads (after Wu et al. (2015)).
Fig. 7. Comparison of strengths from dynamic SCB test and BD test with pre-load (Wu et al.
(2015)) as well as the reconciliation by non-local failure model.
Fig. 8. Tensile stress along the prospective fracture path (x) in SCB sample (x is the distance of a
point along the prospective fracture path to the failure spot of the SCB sample).
Page 25 of 34
https://mc06.manuscriptcentral.com/cgj-pubs
Canadian Geotechnical Journal
Draft
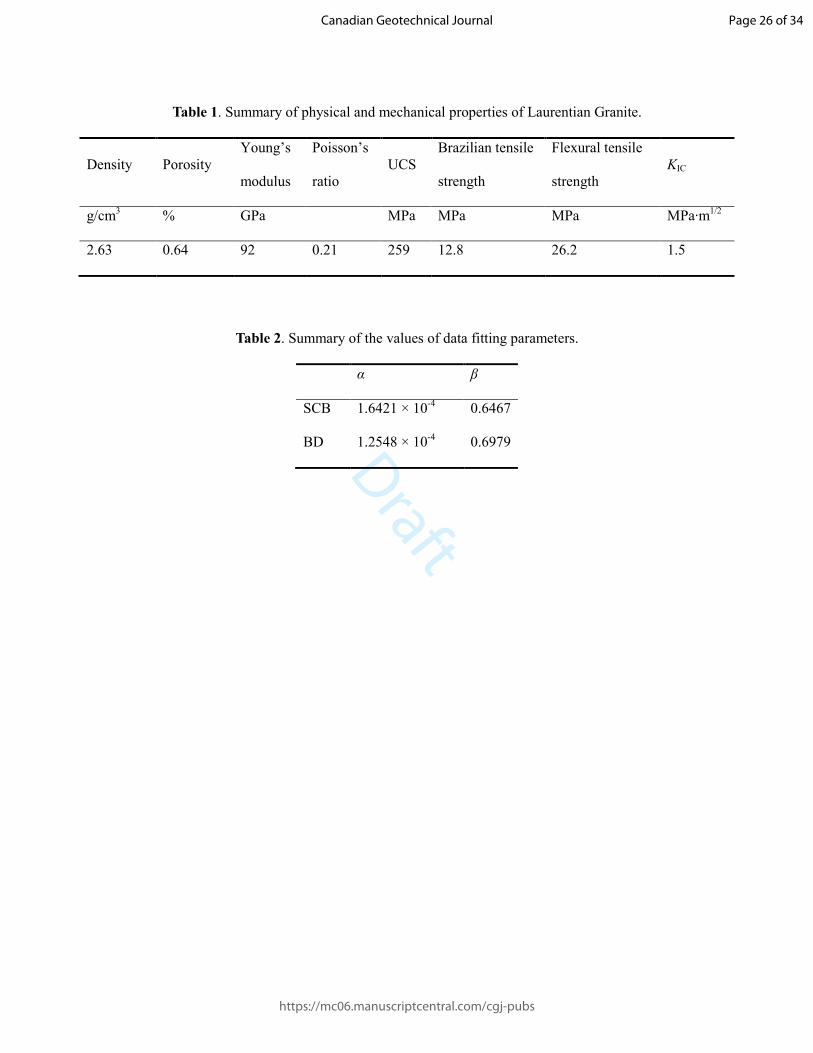
Table 1. Summary of physical and mechanical properties of Laurentian Granite.
Density Porosity
Young’s
modulus
Poisson’s
ratio
UCS
Brazilian tensile
strength
Flexural tensile
strength
KIC
g/cm3 % GPa MPa MPa MPa MPa·m
1/2
2.63 0.64 92 0.21 259 12.8 26.2 1.5
Table 2. Summary of the values of data fitting parameters.
α β
SCB 1.6421 × 10⁻⁴ 0.6467
BD 1.2548 × 10⁻⁴ 0.6979
Page 26 of 34
https://mc06.manuscriptcentral.com/cgj-pubs
Canadian Geotechnical Journal
Draft
Fig. 1. (a) Pre-load SHPB system and (b) SCB specimen (Not to scale).
61x19mm (300 x 300 DPI)
Page 27 of 34
https://mc06.manuscriptcentral.com/cgj-pubs
Canadian Geotechnical Journal
Draft
Fig. 2. Signal captured from the strain gauges on the SHPB bars.
140x106mm (300 x 300 DPI)
Page 28 of 34
https://mc06.manuscriptcentral.com/cgj-pubs
Canadian Geotechnical Journal
Draft
Fig. 3. (a) Dynamic force balance and (b) loading rate determination in a typical pre-load dynamic SCB-SHPB test.
69x24mm (300 x 300 DPI)
Page 29 of 34
https://mc06.manuscriptcentral.com/cgj-pubs
Canadian Geotechnical Journal
Draft
Fig. 4. The (a) dynamic and (b) total flexural tensile strength versus loading rate for different pre-loads.
68x24mm (300 x 300 DPI)
Page 30 of 34
https://mc06.manuscriptcentral.com/cgj-pubs
Canadian Geotechnical Journal
Draft
Fig. 5. Typical recovered SCB specimens (the scale in the picture is 10 mm). (a) Pre-load: 0 MPa and
loading rate: 880 GPa/s; (b) Pre-load: 0 MPa and loading rate: 1856 GPa/s; (c) Pre-load: 0 MPa and loading
rate: 2711 GPa/s; (d) Pre-load: 10.48 MPa and loading rate: 975 GPa/s; (e) Pre-load: 20.96 MPa and
loading rate: 911 GPa/s.
120x78mm (300 x 300 DPI)
Page 31 of 34
https://mc06.manuscriptcentral.com/cgj-pubs
Canadian Geotechnical Journal
Draft
Fig. 6. The (a) dynamic and (b) total tensile strength with BD specimens versus loading rate for different pre-loads (after Wu et al. (2015)).
76x28mm (300 x 300 DPI)
Page 32 of 34
https://mc06.manuscriptcentral.com/cgj-pubs
Canadian Geotechnical Journal
Draft
Fig. 7. Comparison of strengths from dynamic SCB test and BD test with pre-load (Wu et al. (2015)) as well as the reconciliation by non-local failure model.
99x48mm (300 x 300 DPI)
Page 33 of 34
https://mc06.manuscriptcentral.com/cgj-pubs
Canadian Geotechnical Journal
Draft
Fig. 8. Tensile stress along the prospective fracture path (x) in SCB sample (x is the distance of a point along the prospective fracture path to the failure spot of the SCB sample).
161x175mm (300 x 300 DPI)
Page 34 of 34
https://mc06.manuscriptcentral.com/cgj-pubs
Canadian Geotechnical Journal