Embed Size (px)
Citation preview

HAL Id: hal-00951512https://hal.archives-ouvertes.fr/hal-00951512
Submitted on 24 Feb 2014
HAL is a multi-disciplinary open accessarchive for the deposit and dissemination of sci-entific research documents, whether they are pub-lished or not. The documents may come fromteaching and research institutions in France orabroad, or from public or private research centers.
L’archive ouverte pluridisciplinaire HAL, estdestinée au dépôt et à la diffusion de documentsscientifiques de niveau recherche, publiés ou non,émanant des établissements d’enseignement et derecherche français ou étrangers, des laboratoirespublics ou privés.
Experimental study of the effect of sodium chloride ondrying of porous media: The crusty-patchy efflorescence
transitionHouda Eloukabi, Nour Sghaier-Ben Chiekh, Sassi Ben Nasrallah, Marc Prat
To cite this version:Houda Eloukabi, Nour Sghaier-Ben Chiekh, Sassi Ben Nasrallah, Marc Prat. Experimental studyof the effect of sodium chloride on drying of porous media: The crusty-patchy efflorescence tran-sition. International Journal of Heat and Mass Transfer, Elsevier, 2013, vol. 56, pp. 80-93.�10.1016/j.ijheatmasstransfer.2012.09.045�. �hal-00951512�
Open Archive TOULOUSE Archive Ouverte (OATAO) OATAO is an open access repository that collects the work of Toulouse researchers and makes it freely available over the web where possible.
This is an author-deposited version published in : http://oatao.univ-toulouse.fr/ Eprints ID : 11022
To link to this article : DOI:10.1016/j.ijheatmasstransfer.2012.09.045URL : http://dx.doi.org/10.1016/j.ijheatmasstransfer.2012.09.045
To cite this version : Eloukabi, Houda and Sghaier-Ben Chiekh, Nour and Ben Nasrallah, Sassi and Prat, Marc Experimental study of the effect of sodium chloride on drying of porous media: The crusty–patchy efflorescence transition. (2013) International Journal of Heat and Mass Transfer, vol. 56 (n° 1-2). pp. 80-93. ISSN 0017-9310
Any correspondance concerning this service should be sent to the repository
administrator: [email protected]
Experimental study of the effect of sodium chloride on drying of porous media:The crusty–patchy efflorescence transition
H. Eloukabi a, N. Sghaier a, S. Ben Nasrallah a, M. Prat b,c,⇑a Laboratoire d’Eudes des Systèmes Thermiques et Energétiques de Monastir, École nationale d’Ingénieurs de Monastir, 5000 Monastir, Tunisiab INPT, UPS, IMFT (Institut de Mécanique des Fluides de Toulouse), Université de Toulouse, Allée Camille Soula, F-31400 Toulouse, Francec CNRS, IMFT, F-31400 Toulouse, France
Keywords:DryingPorous mediumSalt crystallizationEfflorescence
a b s t r a c t
We present an experimental study of drying in the presence of dissolved sodium chloride. The process ischaracterized by the formation of a crystallized salt layer, referred to as efflorescence, at the evaporativesurface of the porous medium. By varying the average size of the beads forming the porous medium, weshow that the formation of the crystal layer does not affect significantly the drying process and can evenenhance the drying rate when the beads are sufficiently large. By contrast, the crystal layer can greatlyaffect the drying process and even blocks or severely limit the evaporation process for sufficiently smallbeads. We therefore show the existence of two regimes, namely the blocking regime and the enhanceddrying rate regime. It is shown that the two regimes correspond to two different types of efflorescence,referred to as crusty and patchy, respectively. Then by varying the initial salt concentration for a givenbead size, we show that the interplay between drying and the efflorescence formation leads to a non-monotonous variation of the drying rate with the initial salt concentration when the efflorescence is pat-chy but not when the efflorescence is crusty. The crusty–patchy transition is finally discussed from a sim-ple model of capillary rise in the efflorescence.
1. Introduction
Evaporation in porous media in the presence of dissolved salt isof interest in relation with at least three important applications:soil physics and related issues, e.g. [1] and references therein,injection of CO2 in aquifer [2] and civil engineering owing to themajor damages that can be induced by the salt crystallization pro-cess, e.g. [3,4]. Despite the importance of these various fields, theimpact of the presence of salt on the evaporation process is stillpoorly understood. This is mainly so because the evaporation pro-cess in the presence of salt usually leads to the formation of saltcrystals and to complex interactions between the crystallized re-gions and the various transport phenomena involved in the pro-cess. The crystals can form at the surface of the porous mediumand are then called efflorescence or within the porous medium,where they form subflorescence. In the present paper, we will con-sider sodium chloride as dissolved salt, a salt known for its ten-dency to form efflorescence [5]. As explained in several previouspapers, e.g. [6–8], the equation governing the dissolved salt trans-port with the porous structure during drying is a transient convec-
tion–diffusion equation. Under usual evaporation conditions theconvection effect is sufficient to induce greater concentration atthe porous surface, which therefore is the expected location ofcrystal formation since the salt crystal begins to form when theconcentration reaches a sufficiently high concentration. In the caseof sodium chloride, this crystallization concentration is expected tobe the saturation concentration since supersaturation effects areusually negligible with NaCl [9,10].
According to the available literature, the effect on efflorescenceformation on drying process could appear as a controversial issue.For example, several studies, e.g. [1,11] and references therein, re-port that the efflorescence forms a crust, whose net effect is to se-verely limit the evaporation. On the other hand, other studies [12–16] do not report a significant blocking effect, at least as long as theefflorescence is hydraulically connected to the aqueous solutionpresent within the porous medium. On the contrary, it is even ob-served that the efflorescence formation can even enhance the dry-ing rate [12,13]. Furthermore, there are also important differencesin the analysis of the mechanisms controlling the efflorescencegrowth. In [12–16], the efflorescence is seen as a set of isolatedporous structures saturated by the aqueous solution and growingas a result of salt precipitation at the outer surface of efflorescencestructures where evaporation takes place. Growth stops when theefflorescence ceases to be hydraulically connected to the aqueous
⇑ Corresponding author at: INPT, UPS, IMFT (Institut de Mécanique des Fluides deToulouse), Université de Toulouse, Allée Camille Soula, F-31400 Toulouse, France.
E-mail address: [email protected] (M. Prat).
solution in the porous medium. This analysis is supported by imbi-bition experiments on dry efflorescence, which indeed show thatthe efflorescence is porous, X-ray tomography images, which con-firm the internal porous nature of efflorescence, and visualizationexperiments with micromodels, which allows to see accuratelywhen the efflorescence ceases to be connected to the underlyingaqueous solution. Although not directly supported by experimen-tal evidences, a completely different analysis was proposed in[11], with a strong emphasis on transport of water in vapor phasedue to salt hygroscopic effects. According to this analysis, the efflo-rescence would grow from salt precipitation at its bottom (porousmedium/efflorescence interface) rather than precipitation at theefflorescence outer surface. This analysis is not consistent withthe experiments reported in [12–15] but might be relevant in thecase of blocking crust formation, which is the case considered in[11]. This short review clearly illustrates that much remains tobe done to fully understand the factors controlling the formation,growth and properties of efflorescence.
In this context, the present experimental study brings two newelements, which illustrate the complex interactions induced by theefflorescence formation. First, it is shown that both the blockingcrust formation and the enhanced drying rate efflorescence canform under about the same evaporation condition simply bychanging the average pore size of the medium. This leads to iden-tify two main types of efflorescence referred to as crusty (= block-ing) and patchy, respectively. Second, it is shown that the meanevaporation rate in the first phase of drying, where the efflores-cence is hydraulically connected to the underlying aqueous
solution, varies very differently with the initial salt concentrationdepending on the type of efflorescence. The mean evaporation rateincreases monotonously with the initial concentration when theefflorescence is crusty whereas the variation is non-monotonouswhen the efflorescence is patchy. Since the activity of the solutionis a decreasing function of the salt concentration, this non-monot-onous variation is attributed to the complex interplay between theevaporation process and the efflorescence formation and growth.
The paper is organized as follows. The experimental set-up isdescribed in Section 2. Then we present and discuss the results ob-tained by varying the average pore size under similar evaporationcondition. Results on the influence of initial salt concentration arealso presented in this section. A simple phenomenological model ofefflorescence is proposed in Section 4. We close the article by offer-ing a conclusion in which we summarize the main findings.
2. Experimental set-up
Drying experiments are performed for porous samples consist-ing of packing of approximately spherical glass beads initially sat-urated with a NaCl aqueous solution. Six ranges of bead diameterswere used (5–50 lm), (50–62 lm), (100–160 lm), (200–250 lm),(250–270 lm), 300 lm. These various ranges are referred to asrange #1, #2, #3, #4, #5 and #6, respectively.
A sample is prepared by mixing the beads with a sodium-chlo-ride aqueous solution of given concentration in a container to ob-tain a saturated viscous paste. Then this paste is poured in acylindrical vessel (diameter 2 cm; depth 1 cm). The vessel is
Nomenclature
a mean distance between patches (m)aw water activityA top surface area (m2)b numerical factorB Bond numberc numerical factorC dissolved salt mass fraction (%)Ca capillary numberCsat saturation mass fraction (%)C0 dissolved salt initial mass fraction (%)d bead diameter (m)de diameter of efflorescence structure (m)Ds salt molecular diffusion coefficient (m2/s)D�s salt effective diffusion coefficient (m2/s)F fraction of water evaporated from the sample at the end
of dryingg gravitational acceleration (m/s2)he height of efflorescence structure (m)j evaporation flux (kg/m2/s)je evaporation flux at the top of efflorescence structure
(kg/m2/s)j0 prefactorJ evaporation rate (kg/m2/s)Ke permeability of salt structure (m2)L height of the porous sample (m)msalt mass of salt (g)mw the total mass of liquid evaporated at the end of drying
(g)mw0 mass of liquid water present initially in the system (g)n unit vector normal to the considered surfacepv(C) vapor pressure for a NaCl aqueous solution (Pa)pv0 vapor pressure for pure water (Pa)pv1 vapor pressure in the regulated chamber (Pa)
Patm atmospheric pressure (Pa)Pce capillary pressure on top of the efflorescence structure
(Pa)Pcpm capillary pressure of the porous medium (Pa)Pe Peclet numberPe(he) pressure in the liquid at the top of the efflorescence
structure (Pa)Pe(0) pressure in the liquid at the bottom of the efflorescence
structure (Pa)Q mass flow rate induces within the efflorescence struc-
turer radial distance from the middle of the porous surfacerc radius of the cylinderRH1 relative humidity (%)S liquid saturationt time (s)T temperature (K)U average interstitial velocity of the solution (m/s)Uz velocity component normal to the porous medium sur-
face (m/s)V volume of waterVp volume of the pore space within the porous medium
Greek symbolsde efflorescence mean pore size (m)e porosity of the porous mediumee porosity of salt structurel solution viscosity (Pa s)q solution density (kg/m3)r surface tension (N/m)s dimensionless crystallization time
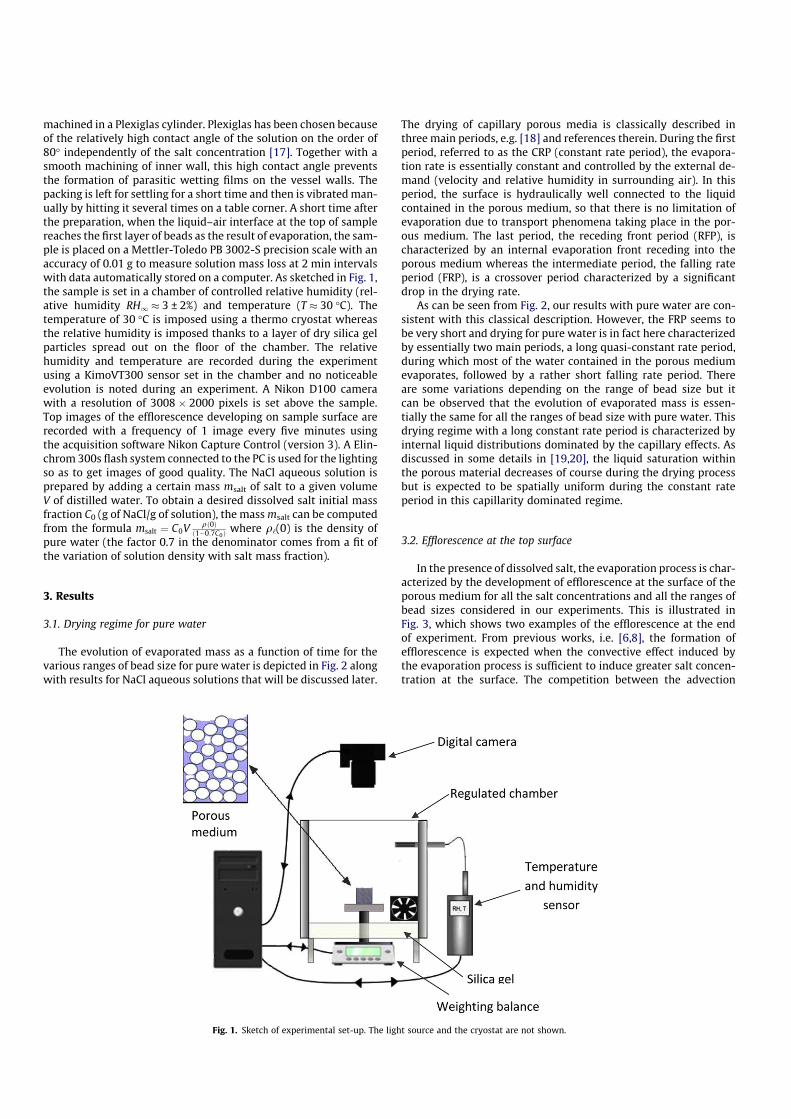
machined in a Plexiglas cylinder. Plexiglas has been chosen becauseof the relatively high contact angle of the solution on the order of80� independently of the salt concentration [17]. Together with asmooth machining of inner wall, this high contact angle preventsthe formation of parasitic wetting films on the vessel walls. Thepacking is left for settling for a short time and then is vibrated man-ually by hitting it several times on a table corner. A short time afterthe preparation, when the liquid–air interface at the top of samplereaches the first layer of beads as the result of evaporation, the sam-ple is placed on a Mettler-Toledo PB 3002-S precision scale with anaccuracy of 0.01 g to measure solution mass loss at 2 min intervalswith data automatically stored on a computer. As sketched in Fig. 1,the sample is set in a chamber of controlled relative humidity (rel-ative humidity RH1 � 3 ± 2%) and temperature (T � 30 �C). Thetemperature of 30 �C is imposed using a thermo cryostat whereasthe relative humidity is imposed thanks to a layer of dry silica gelparticles spread out on the floor of the chamber. The relativehumidity and temperature are recorded during the experimentusing a KimoVT300 sensor set in the chamber and no noticeableevolution is noted during an experiment. A Nikon D100 camerawith a resolution of 3008 � 2000 pixels is set above the sample.Top images of the efflorescence developing on sample surface arerecorded with a frequency of 1 image every five minutes usingthe acquisition software Nikon Capture Control (version 3). A Elin-chrom 300s flash system connected to the PC is used for the lightingso as to get images of good quality. The NaCl aqueous solution isprepared by adding a certain mass msalt of salt to a given volumeV of distilled water. To obtain a desired dissolved salt initial massfraction C0 (g of NaCl/g of solution), the mass msalt can be computedfrom the formula msalt ¼ C0V qð0Þ
ð1�0:7C0Þwhere q‘(0) is the density of
pure water (the factor 0.7 in the denominator comes from a fit ofthe variation of solution density with salt mass fraction).
3. Results
3.1. Drying regime for pure water
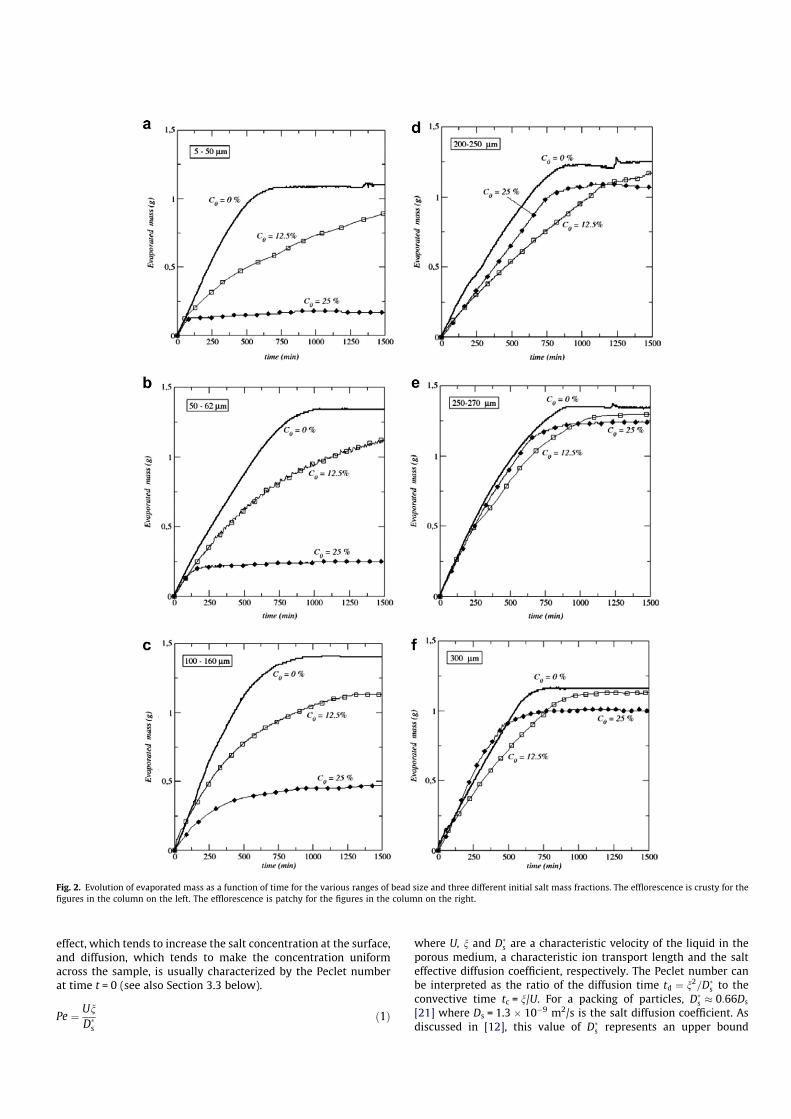
The evolution of evaporated mass as a function of time for thevarious ranges of bead size for pure water is depicted in Fig. 2 alongwith results for NaCl aqueous solutions that will be discussed later.
The drying of capillary porous media is classically described inthree main periods, e.g. [18] and references therein. During the firstperiod, referred to as the CRP (constant rate period), the evapora-tion rate is essentially constant and controlled by the external de-mand (velocity and relative humidity in surrounding air). In thisperiod, the surface is hydraulically well connected to the liquidcontained in the porous medium, so that there is no limitation ofevaporation due to transport phenomena taking place in the por-ous medium. The last period, the receding front period (RFP), ischaracterized by an internal evaporation front receding into theporous medium whereas the intermediate period, the falling rateperiod (FRP), is a crossover period characterized by a significantdrop in the drying rate.
As can be seen from Fig. 2, our results with pure water are con-sistent with this classical description. However, the FRP seems tobe very short and drying for pure water is in fact here characterizedby essentially two main periods, a long quasi-constant rate period,during which most of the water contained in the porous mediumevaporates, followed by a rather short falling rate period. Thereare some variations depending on the range of bead size but itcan be observed that the evolution of evaporated mass is essen-tially the same for all the ranges of bead size with pure water. Thisdrying regime with a long constant rate period is characterized byinternal liquid distributions dominated by the capillary effects. Asdiscussed in some details in [19,20], the liquid saturation withinthe porous material decreases of course during the drying processbut is expected to be spatially uniform during the constant rateperiod in this capillarity dominated regime.
3.2. Efflorescence at the top surface
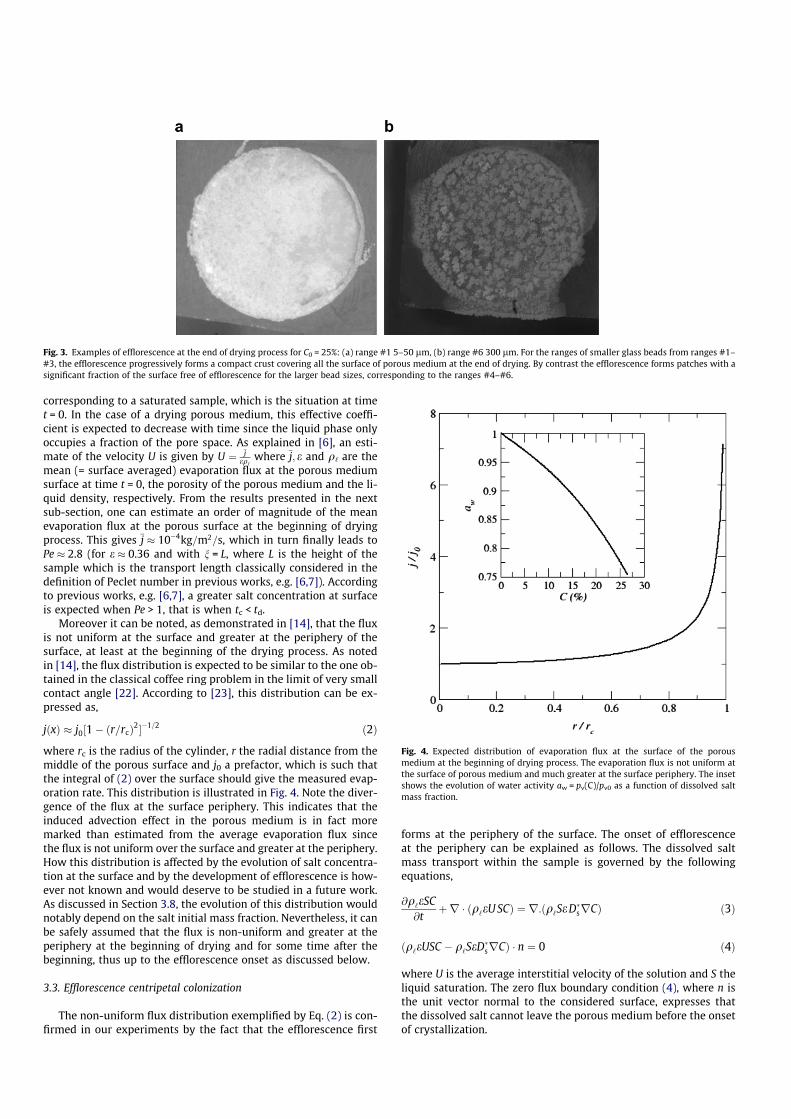
In the presence of dissolved salt, the evaporation process is char-acterized by the development of efflorescence at the surface of theporous medium for all the salt concentrations and all the ranges ofbead sizes considered in our experiments. This is illustrated inFig. 3, which shows two examples of the efflorescence at the endof experiment. From previous works, i.e. [6,8], the formation ofefflorescence is expected when the convective effect induced bythe evaporation process is sufficient to induce greater salt concen-tration at the surface. The competition between the advection
Fig. 1. Sketch of experimental set-up. The light source and the cryostat are not shown.
effect, which tends to increase the salt concentration at the surface,and diffusion, which tends to make the concentration uniformacross the sample, is usually characterized by the Peclet numberat time t = 0 (see also Section 3.3 below).
Pe ¼ UnD�s
ð1Þ
where U, n and D�s are a characteristic velocity of the liquid in theporous medium, a characteristic ion transport length and the salteffective diffusion coefficient, respectively. The Peclet number canbe interpreted as the ratio of the diffusion time td ¼ n2=D�s to theconvective time tc = n/U. For a packing of particles, D�s � 0:66Ds
[21] where Ds = 1.3 � 10�9 m2/s is the salt diffusion coefficient. Asdiscussed in [12], this value of D�s represents an upper bound
Fig. 2. Evolution of evaporated mass as a function of time for the various ranges of bead size and three different initial salt mass fractions. The efflorescence is crusty for thefigures in the column on the left. The efflorescence is patchy for the figures in the column on the right.
corresponding to a saturated sample, which is the situation at timet = 0. In the case of a drying porous medium, this effective coeffi-cient is expected to decrease with time since the liquid phase onlyoccupies a fraction of the pore space. As explained in [6], an esti-mate of the velocity U is given by U ¼ �j
eq‘where �j; e and q‘ are the
mean (= surface averaged) evaporation flux at the porous mediumsurface at time t = 0, the porosity of the porous medium and the li-quid density, respectively. From the results presented in the nextsub-section, one can estimate an order of magnitude of the meanevaporation flux at the porous surface at the beginning of dryingprocess. This gives �j � 10�4kg=m2=s, which in turn finally leads toPe � 2.8 (for e � 0.36 and with n = L, where L is the height of thesample which is the transport length classically considered in thedefinition of Peclet number in previous works, e.g. [6,7]). Accordingto previous works, e.g. [6,7], a greater salt concentration at surfaceis expected when Pe > 1, that is when tc < td.
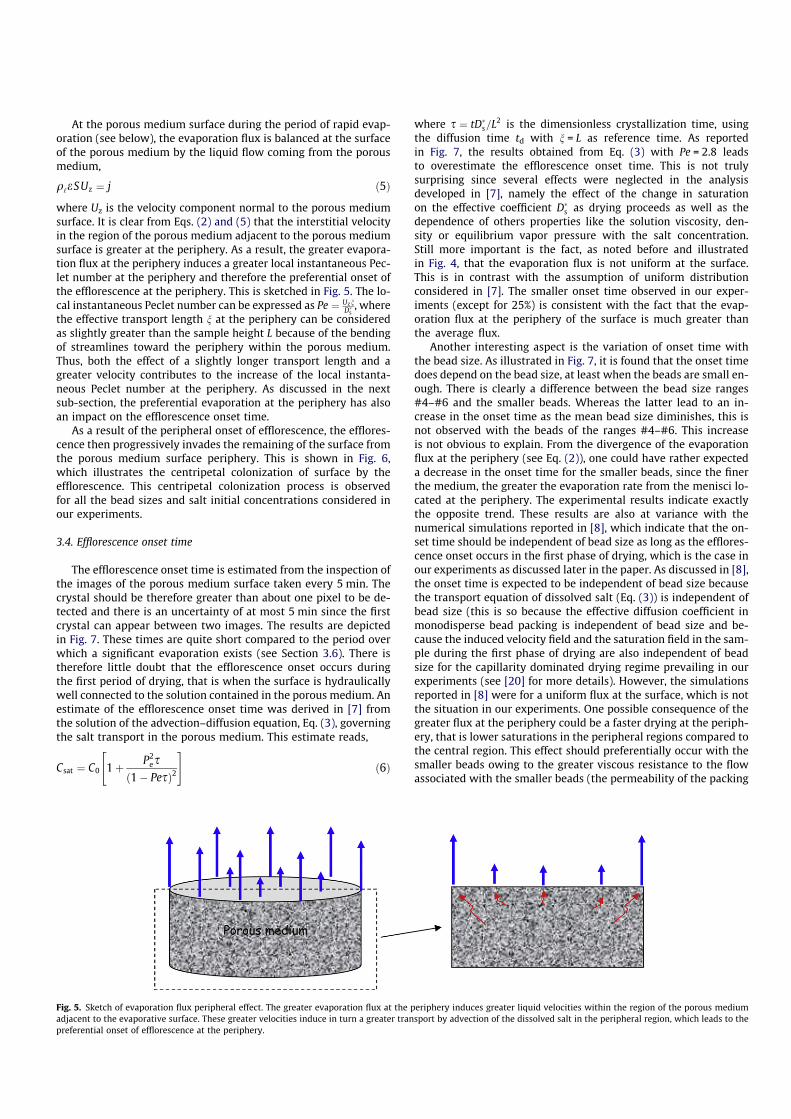
Moreover it can be noted, as demonstrated in [14], that the fluxis not uniform at the surface and greater at the periphery of thesurface, at least at the beginning of the drying process. As notedin [14], the flux distribution is expected to be similar to the one ob-tained in the classical coffee ring problem in the limit of very smallcontact angle [22]. According to [23], this distribution can be ex-pressed as,
jðxÞ � j0½1� ðr=rcÞ2��1=2 ð2Þ
where rc is the radius of the cylinder, r the radial distance from themiddle of the porous surface and j0 a prefactor, which is such thatthe integral of (2) over the surface should give the measured evap-oration rate. This distribution is illustrated in Fig. 4. Note the diver-gence of the flux at the surface periphery. This indicates that theinduced advection effect in the porous medium is in fact moremarked than estimated from the average evaporation flux sincethe flux is not uniform over the surface and greater at the periphery.How this distribution is affected by the evolution of salt concentra-tion at the surface and by the development of efflorescence is how-ever not known and would deserve to be studied in a future work.As discussed in Section 3.8, the evolution of this distribution wouldnotably depend on the salt initial mass fraction. Nevertheless, it canbe safely assumed that the flux is non-uniform and greater at theperiphery at the beginning of drying and for some time after thebeginning, thus up to the efflorescence onset as discussed below.
3.3. Efflorescence centripetal colonization
The non-uniform flux distribution exemplified by Eq. (2) is con-firmed in our experiments by the fact that the efflorescence first
forms at the periphery of the surface. The onset of efflorescenceat the periphery can be explained as follows. The dissolved saltmass transport within the sample is governed by the followingequations,
@q‘eSC@t
þr � ðq‘eU SCÞ ¼ r:ðq‘SeD�srCÞ ð3Þ
ðq‘eUSC � q‘SeD�srCÞ � n ¼ 0 ð4Þ
where U is the average interstitial velocity of the solution and S theliquid saturation. The zero flux boundary condition (4), where n isthe unit vector normal to the considered surface, expresses thatthe dissolved salt cannot leave the porous medium before the onsetof crystallization.
Fig. 3. Examples of efflorescence at the end of drying process for C0 = 25%: (a) range #1 5–50 lm, (b) range #6 300 lm. For the ranges of smaller glass beads from ranges #1–#3, the efflorescence progressively forms a compact crust covering all the surface of porous medium at the end of drying. By contrast the efflorescence forms patches with asignificant fraction of the surface free of efflorescence for the larger bead sizes, corresponding to the ranges #4–#6.
Fig. 4. Expected distribution of evaporation flux at the surface of the porousmedium at the beginning of drying process. The evaporation flux is not uniform atthe surface of porous medium and much greater at the surface periphery. The insetshows the evolution of water activity aw = pv(C)/pv0 as a function of dissolved saltmass fraction.
At the porous medium surface during the period of rapid evap-oration (see below), the evaporation flux is balanced at the surfaceof the porous medium by the liquid flow coming from the porousmedium,
q‘eSUz ¼ j ð5Þ
where Uz is the velocity component normal to the porous mediumsurface. It is clear from Eqs. (2) and (5) that the interstitial velocityin the region of the porous medium adjacent to the porous mediumsurface is greater at the periphery. As a result, the greater evapora-tion flux at the periphery induces a greater local instantaneous Pec-let number at the periphery and therefore the preferential onset ofthe efflorescence at the periphery. This is sketched in Fig. 5. The lo-cal instantaneous Peclet number can be expressed as Pe ¼ Uzn
D�s, where
the effective transport length n at the periphery can be consideredas slightly greater than the sample height L because of the bendingof streamlines toward the periphery within the porous medium.Thus, both the effect of a slightly longer transport length and agreater velocity contributes to the increase of the local instanta-neous Peclet number at the periphery. As discussed in the nextsub-section, the preferential evaporation at the periphery has alsoan impact on the efflorescence onset time.
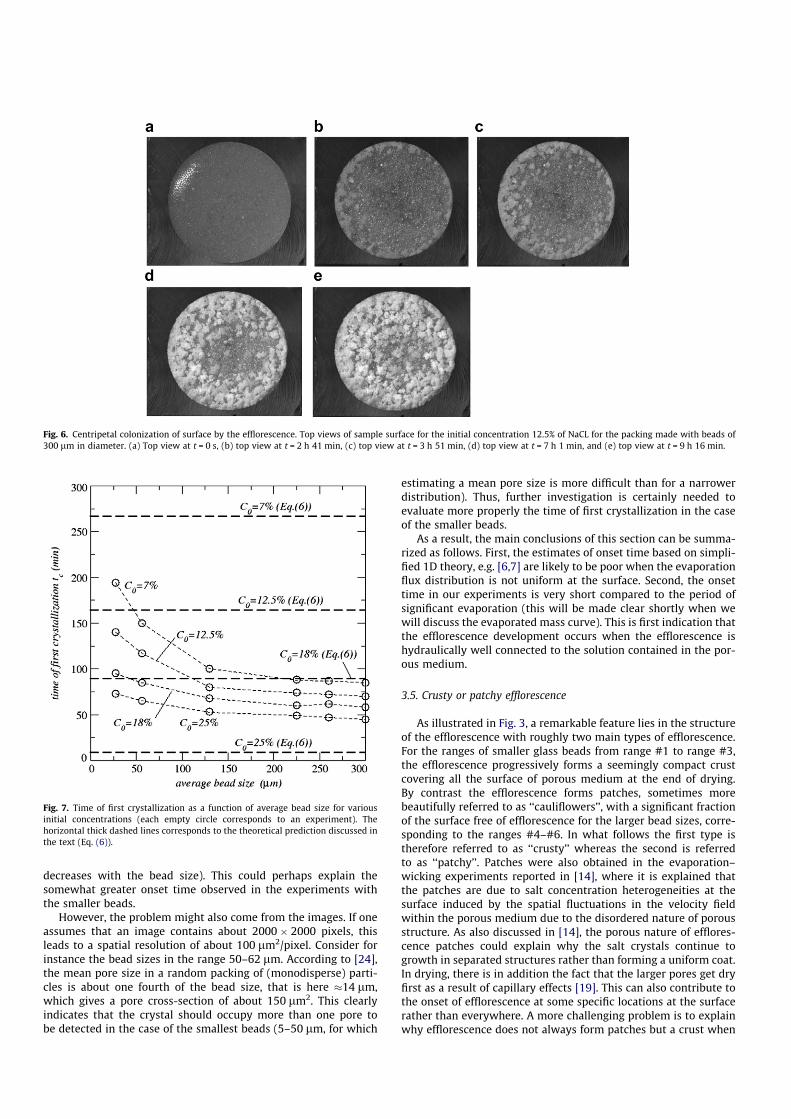
As a result of the peripheral onset of efflorescence, the efflores-cence then progressively invades the remaining of the surface fromthe porous medium surface periphery. This is shown in Fig. 6,which illustrates the centripetal colonization of surface by theefflorescence. This centripetal colonization process is observedfor all the bead sizes and salt initial concentrations considered inour experiments.
3.4. Efflorescence onset time
The efflorescence onset time is estimated from the inspection ofthe images of the porous medium surface taken every 5 min. Thecrystal should be therefore greater than about one pixel to be de-tected and there is an uncertainty of at most 5 min since the firstcrystal can appear between two images. The results are depictedin Fig. 7. These times are quite short compared to the period overwhich a significant evaporation exists (see Section 3.6). There istherefore little doubt that the efflorescence onset occurs duringthe first period of drying, that is when the surface is hydraulicallywell connected to the solution contained in the porous medium. Anestimate of the efflorescence onset time was derived in [7] fromthe solution of the advection–diffusion equation, Eq. (3), governingthe salt transport in the porous medium. This estimate reads,
Csat ¼ C0 1þ P2es
ð1� PesÞ2
" #ð6Þ
where s ¼ tD�s=L2 is the dimensionless crystallization time, usingthe diffusion time td with n = L as reference time. As reportedin Fig. 7, the results obtained from Eq. (3) with Pe = 2.8 leadsto overestimate the efflorescence onset time. This is not trulysurprising since several effects were neglected in the analysisdeveloped in [7], namely the effect of the change in saturationon the effective coefficient D�s as drying proceeds as well as thedependence of others properties like the solution viscosity, den-sity or equilibrium vapor pressure with the salt concentration.Still more important is the fact, as noted before and illustratedin Fig. 4, that the evaporation flux is not uniform at the surface.This is in contrast with the assumption of uniform distributionconsidered in [7]. The smaller onset time observed in our exper-iments (except for 25%) is consistent with the fact that the evap-oration flux at the periphery of the surface is much greater thanthe average flux.
Another interesting aspect is the variation of onset time withthe bead size. As illustrated in Fig. 7, it is found that the onset timedoes depend on the bead size, at least when the beads are small en-ough. There is clearly a difference between the bead size ranges#4–#6 and the smaller beads. Whereas the latter lead to an in-crease in the onset time as the mean bead size diminishes, this isnot observed with the beads of the ranges #4–#6. This increaseis not obvious to explain. From the divergence of the evaporationflux at the periphery (see Eq. (2)), one could have rather expecteda decrease in the onset time for the smaller beads, since the finerthe medium, the greater the evaporation rate from the menisci lo-cated at the periphery. The experimental results indicate exactlythe opposite trend. These results are also at variance with thenumerical simulations reported in [8], which indicate that the on-set time should be independent of bead size as long as the efflores-cence onset occurs in the first phase of drying, which is the case inour experiments as discussed later in the paper. As discussed in [8],the onset time is expected to be independent of bead size becausethe transport equation of dissolved salt (Eq. (3)) is independent ofbead size (this is so because the effective diffusion coefficient inmonodisperse bead packing is independent of bead size and be-cause the induced velocity field and the saturation field in the sam-ple during the first phase of drying are also independent of beadsize for the capillarity dominated drying regime prevailing in ourexperiments (see [20] for more details). However, the simulationsreported in [8] were for a uniform flux at the surface, which is notthe situation in our experiments. One possible consequence of thegreater flux at the periphery could be a faster drying at the periph-ery, that is lower saturations in the peripheral regions compared tothe central region. This effect should preferentially occur with thesmaller beads owing to the greater viscous resistance to the flowassociated with the smaller beads (the permeability of the packing
Fig. 5. Sketch of evaporation flux peripheral effect. The greater evaporation flux at the periphery induces greater liquid velocities within the region of the porous mediumadjacent to the evaporative surface. These greater velocities induce in turn a greater transport by advection of the dissolved salt in the peripheral region, which leads to thepreferential onset of efflorescence at the periphery.
decreases with the bead size). This could perhaps explain thesomewhat greater onset time observed in the experiments withthe smaller beads.
However, the problem might also come from the images. If oneassumes that an image contains about 2000 � 2000 pixels, thisleads to a spatial resolution of about 100 lm2/pixel. Consider forinstance the bead sizes in the range 50–62 lm. According to [24],the mean pore size in a random packing of (monodisperse) parti-cles is about one fourth of the bead size, that is here �14 lm,which gives a pore cross-section of about 150 lm2. This clearlyindicates that the crystal should occupy more than one pore tobe detected in the case of the smallest beads (5–50 lm, for which
estimating a mean pore size is more difficult than for a narrowerdistribution). Thus, further investigation is certainly needed toevaluate more properly the time of first crystallization in the caseof the smaller beads.
As a result, the main conclusions of this section can be summa-rized as follows. First, the estimates of onset time based on simpli-fied 1D theory, e.g. [6,7] are likely to be poor when the evaporationflux distribution is not uniform at the surface. Second, the onsettime in our experiments is very short compared to the period ofsignificant evaporation (this will be made clear shortly when wewill discuss the evaporated mass curve). This is first indication thatthe efflorescence development occurs when the efflorescence ishydraulically well connected to the solution contained in the por-ous medium.
3.5. Crusty or patchy efflorescence
As illustrated in Fig. 3, a remarkable feature lies in the structureof the efflorescence with roughly two main types of efflorescence.For the ranges of smaller glass beads from range #1 to range #3,the efflorescence progressively forms a seemingly compact crustcovering all the surface of porous medium at the end of drying.By contrast the efflorescence forms patches, sometimes morebeautifully referred to as ‘‘cauliflowers’’, with a significant fractionof the surface free of efflorescence for the larger bead sizes, corre-sponding to the ranges #4–#6. In what follows the first type istherefore referred to as ‘‘crusty’’ whereas the second is referredto as ‘‘patchy’’. Patches were also obtained in the evaporation–wicking experiments reported in [14], where it is explained thatthe patches are due to salt concentration heterogeneities at thesurface induced by the spatial fluctuations in the velocity fieldwithin the porous medium due to the disordered nature of porousstructure. As also discussed in [14], the porous nature of efflores-cence patches could explain why the salt crystals continue togrowth in separated structures rather than forming a uniform coat.In drying, there is in addition the fact that the larger pores get dryfirst as a result of capillary effects [19]. This can also contribute tothe onset of efflorescence at some specific locations at the surfacerather than everywhere. A more challenging problem is to explainwhy efflorescence does not always form patches but a crust when
Fig. 6. Centripetal colonization of surface by the efflorescence. Top views of sample surface for the initial concentration 12.5% of NaCL for the packing made with beads of300 lm in diameter. (a) Top view at t = 0 s, (b) top view at t = 2 h 41 min, (c) top view at t = 3 h 51 min, (d) top view at t = 7 h 1 min, and (e) top view at t = 9 h 16 min.
Fig. 7. Time of first crystallization as a function of average bead size for variousinitial concentrations (each empty circle corresponds to an experiment). Thehorizontal thick dashed lines corresponds to the theoretical prediction discussed inthe text (Eq. (6)).
the beads are sufficiently small. First insights into this point areprovided in Section 4 through the consideration of a simple modelof capillary rise in the efflorescence structures.
Before closing this section, it can be noted that the destructiveinspection of samples at the end of each experiments did not showthe formation of significant subflorescence. Thus it can be safelyassumed that most of crystallized salt is found in the efflorescence.
Let us now look at the effect of efflorescence on drying.
3.6. Crust/patch transition and its impact on water recovery rate byevaporation
In this sub-section, the influence of bead size on drying in thepresence of salt is explored. Drying experiments for the variousranges of bead sizes were performed for three initial salt mass frac-tions, namely 0% (pure water), 12.5% and 25%. It can be noted thatthe mass fraction 25% is close to the saturation mass fraction Csat,which is 26.6% for NaCl at 30 �C. The evolution of evaporated massas a function of time for the various ranges of bead size and thethree salt mass fractions is depicted in Fig. 2.
Let us first consider the case of the highest initial salt initialmass fraction (C0 = 25%). In contrast with pure water, the evapo-rated mass curve for the initial concentration 25% strongly dependson bead size. One can distinguish two main situations. The first sit-uation corresponds to the three smaller bead sizes, namely theranges #1–#3. As can be seen from Fig. 2a–c, the evaporation ratebecomes rapidly very small for these ranges and the total mass losswhen the experiment is stopped is much smaller than for purewater. As shown in Fig. 2d–f, the second situation, which is ob-served with the three larger bead sizes, is completely differentwith evaporated mass curves much more similar to the pure watercurves. In contrast with the first situation, the results depicted inFig. 2d–f suggest that all the liquid water present initially has evap-orated at the end of experiment. This can be confirmed by estimat-ing the mass of liquid water present initially in the system. Thismass is given by mw0 (C0) = (1�C0) q‘(C0) Vp, where Vp is the vol-ume of the pore space within the porous medium. Vp can be esti-mated from the total mass of liquid evaporated when the liquidis pure water: Vp = mw0 (0)/q‘(0). This gives
mw0ðC0Þ ¼ ð1� C0Þq‘ðC0Þmw0ð0Þ=q‘ð0Þ ð7Þ
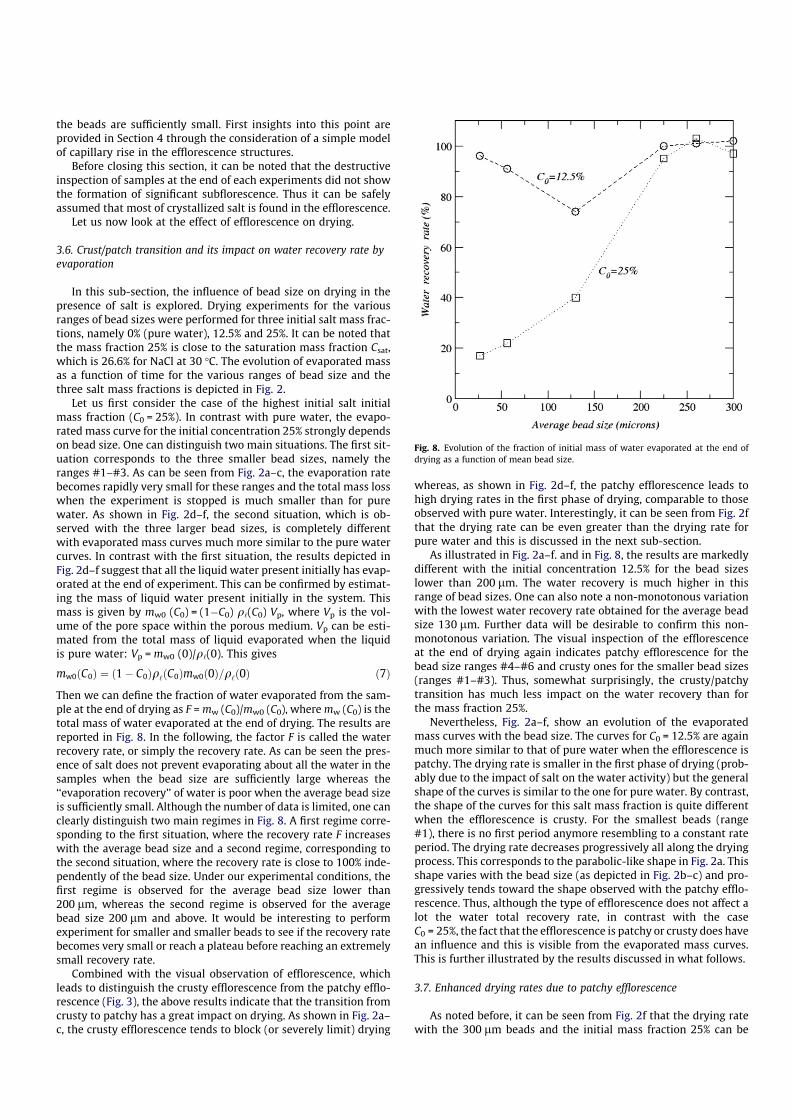
Then we can define the fraction of water evaporated from the sam-ple at the end of drying as F = mw (C0)/mw0 (C0), where mw (C0) is thetotal mass of water evaporated at the end of drying. The results arereported in Fig. 8. In the following, the factor F is called the waterrecovery rate, or simply the recovery rate. As can be seen the pres-ence of salt does not prevent evaporating about all the water in thesamples when the bead size are sufficiently large whereas the‘‘evaporation recovery’’ of water is poor when the average bead sizeis sufficiently small. Although the number of data is limited, one canclearly distinguish two main regimes in Fig. 8. A first regime corre-sponding to the first situation, where the recovery rate F increaseswith the average bead size and a second regime, corresponding tothe second situation, where the recovery rate is close to 100% inde-pendently of the bead size. Under our experimental conditions, thefirst regime is observed for the average bead size lower than200 lm, whereas the second regime is observed for the averagebead size 200 lm and above. It would be interesting to performexperiment for smaller and smaller beads to see if the recovery ratebecomes very small or reach a plateau before reaching an extremelysmall recovery rate.
Combined with the visual observation of efflorescence, whichleads to distinguish the crusty efflorescence from the patchy efflo-rescence (Fig. 3), the above results indicate that the transition fromcrusty to patchy has a great impact on drying. As shown in Fig. 2a–c, the crusty efflorescence tends to block (or severely limit) drying
whereas, as shown in Fig. 2d–f, the patchy efflorescence leads tohigh drying rates in the first phase of drying, comparable to thoseobserved with pure water. Interestingly, it can be seen from Fig. 2fthat the drying rate can be even greater than the drying rate forpure water and this is discussed in the next sub-section.
As illustrated in Fig. 2a–f. and in Fig. 8, the results are markedlydifferent with the initial concentration 12.5% for the bead sizeslower than 200 lm. The water recovery is much higher in thisrange of bead sizes. One can also note a non-monotonous variationwith the lowest water recovery rate obtained for the average beadsize 130 lm. Further data will be desirable to confirm this non-monotonous variation. The visual inspection of the efflorescenceat the end of drying again indicates patchy efflorescence for thebead size ranges #4–#6 and crusty ones for the smaller bead sizes(ranges #1–#3). Thus, somewhat surprisingly, the crusty/patchytransition has much less impact on the water recovery than forthe mass fraction 25%.
Nevertheless, Fig. 2a–f, show an evolution of the evaporatedmass curves with the bead size. The curves for C0 = 12.5% are againmuch more similar to that of pure water when the efflorescence ispatchy. The drying rate is smaller in the first phase of drying (prob-ably due to the impact of salt on the water activity) but the generalshape of the curves is similar to the one for pure water. By contrast,the shape of the curves for this salt mass fraction is quite differentwhen the efflorescence is crusty. For the smallest beads (range#1), there is no first period anymore resembling to a constant rateperiod. The drying rate decreases progressively all along the dryingprocess. This corresponds to the parabolic-like shape in Fig. 2a. Thisshape varies with the bead size (as depicted in Fig. 2b–c) and pro-gressively tends toward the shape observed with the patchy efflo-rescence. Thus, although the type of efflorescence does not affect alot the water total recovery rate, in contrast with the caseC0 = 25%, the fact that the efflorescence is patchy or crusty does havean influence and this is visible from the evaporated mass curves.This is further illustrated by the results discussed in what follows.
3.7. Enhanced drying rates due to patchy efflorescence
As noted before, it can be seen from Fig. 2f that the drying ratewith the 300 lm beads and the initial mass fraction 25% can be
Fig. 8. Evolution of the fraction of initial mass of water evaporated at the end ofdrying as a function of mean bead size.
even greater than the drying rate for pure water. This result is com-pletely counter-intuitive since the water activity aw (aw = pv(C)/pv0,where pv (C) and pv0 are the vapor pressure for a NaCl aqueoussolution and the vapor pressure for pure water, respectively), is re-duced in the presence of salts [25]. As depicted in the inset in Fig. 4,the water vapor pressure at the surface of an aqueous solution is adecreasing function of salt mass fraction. For the salt mass fractionof 25%, the vapor pressure is about 75% of the vapor pressure forpure water. In our drying experiments, evaporation is driven bymass transfer. Thus the evaporation rate J is proportional to(pv(C)–pv1) where pv(C) and pv1 are the equilibrium vapor pres-sure at the surface of a liquid/gas interface and the vapor pressurein the regulated chamber, respectively. Thus, compared to purewater, the evaporation rate in the first phase of drying is expectedto be reduced by a factor awðCÞpv0�pv1
pv0�pv1¼ awðCÞpv0�RH1pv0
pv0�RH1pv0. For C = 25%, this
gives J (C)/J(0) � 74%, thus a reduction by a factor 25% compared topure water. However, as mentioned before, the evaporation ratefor C = 25% in Fig. 2f in the first phase of drying is not reducedbut on the contrary enhanced compared to pure water. A similarobservation was reported in [12] from experiments with modelporous media obtained by sandwiching a monolayer of glass beadsbetween two glass plates. The explanation was that the efflores-cence is porous, pumps by capillarity the aqueous solution, andforms an enhanced exchange surface between the porous mediumand the surrounding air. The enhanced exchange surface associ-ated with the efflorescence thus overcompensates the reductionin the equilibrium vapor pressure due to the presence of salt. Webelieve that basically the same phenomenon occurs when the beadsize is sufficiently large. Note that the effect can be due in part tothe creeping (see [26]) of the salt along the walls adjacent to theporous sample surface. The creeping, which is visible in Fig. 3bfor example, also increases the exchange surface between the sys-tem and the surrounding air. Creeping around the sample surfacewas observed for the experiment with the range of bead size #6for which a drying rate greater than with pure water is observed.
3.8. Influence of initial salt concentration on drying with patchyefflorescence
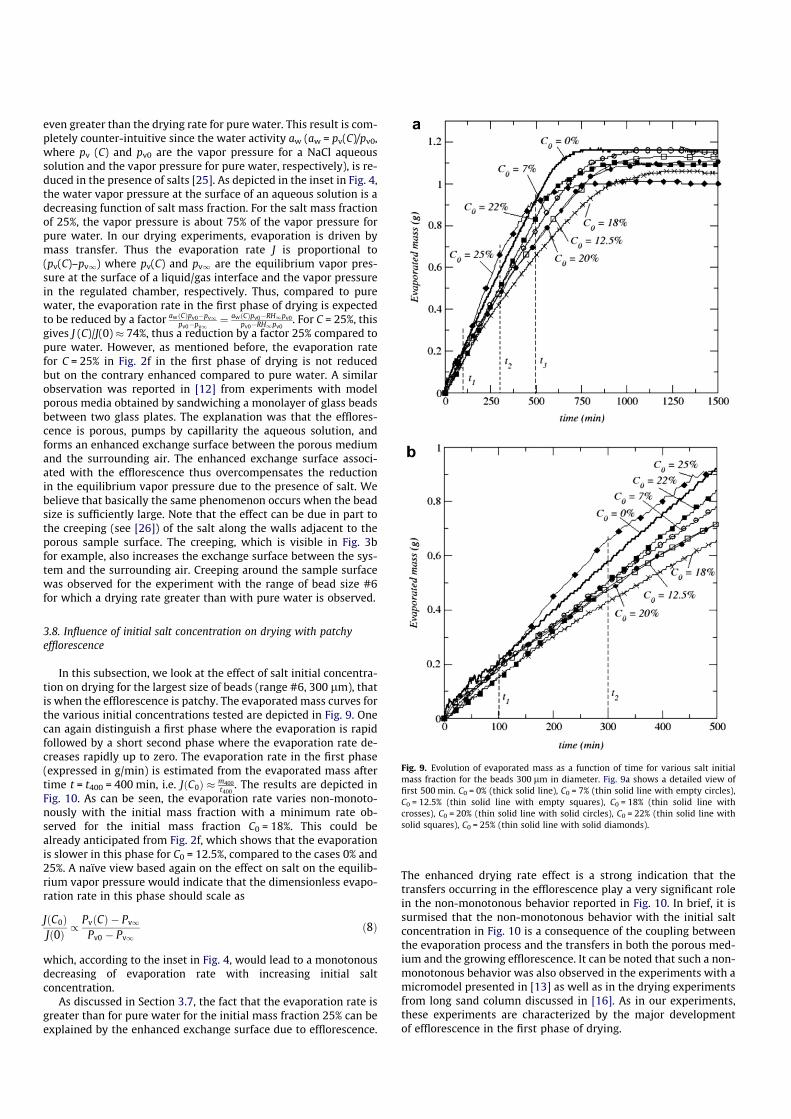
In this subsection, we look at the effect of salt initial concentra-tion on drying for the largest size of beads (range #6, 300 lm), thatis when the efflorescence is patchy. The evaporated mass curves forthe various initial concentrations tested are depicted in Fig. 9. Onecan again distinguish a first phase where the evaporation is rapidfollowed by a short second phase where the evaporation rate de-creases rapidly up to zero. The evaporation rate in the first phase(expressed in g/min) is estimated from the evaporated mass aftertime t = t400 = 400 min, i.e. JðC0Þ � m400
t400. The results are depicted in
Fig. 10. As can be seen, the evaporation rate varies non-monoto-nously with the initial mass fraction with a minimum rate ob-served for the initial mass fraction C0 = 18%. This could bealready anticipated from Fig. 2f, which shows that the evaporationis slower in this phase for C0 = 12.5%, compared to the cases 0% and25%. A naïve view based again on the effect on salt on the equilib-rium vapor pressure would indicate that the dimensionless evapo-ration rate in this phase should scale as
JðC0ÞJð0Þ /
PvðCÞ � Pv1
Pv0 � Pv1ð8Þ
which, according to the inset in Fig. 4, would lead to a monotonousdecreasing of evaporation rate with increasing initial saltconcentration.
As discussed in Section 3.7, the fact that the evaporation rate isgreater than for pure water for the initial mass fraction 25% can beexplained by the enhanced exchange surface due to efflorescence.
The enhanced drying rate effect is a strong indication that thetransfers occurring in the efflorescence play a very significant rolein the non-monotonous behavior reported in Fig. 10. In brief, it issurmised that the non-monotonous behavior with the initial saltconcentration in Fig. 10 is a consequence of the coupling betweenthe evaporation process and the transfers in both the porous med-ium and the growing efflorescence. It can be noted that such a non-monotonous behavior was also observed in the experiments with amicromodel presented in [13] as well as in the drying experimentsfrom long sand column discussed in [16]. As in our experiments,these experiments are characterized by the major developmentof efflorescence in the first phase of drying.
Fig. 9. Evolution of evaporated mass as a function of time for various salt initialmass fraction for the beads 300 lm in diameter. Fig. 9a shows a detailed view offirst 500 min. C0 = 0% (thick solid line), C0 = 7% (thin solid line with empty circles),C0 = 12.5% (thin solid line with empty squares), C0 = 18% (thin solid line withcrosses), C0 = 20% (thin solid line with solid circles), C0 = 22% (thin solid line withsolid squares), C0 = 25% (thin solid line with solid diamonds).
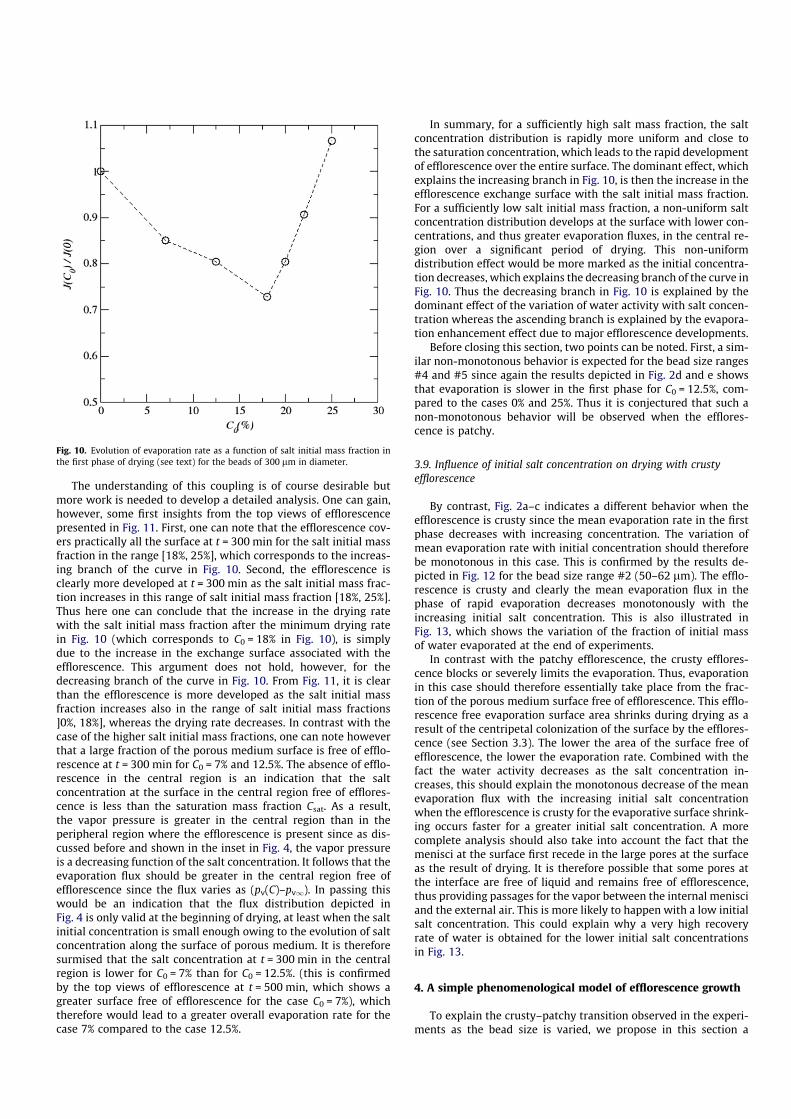
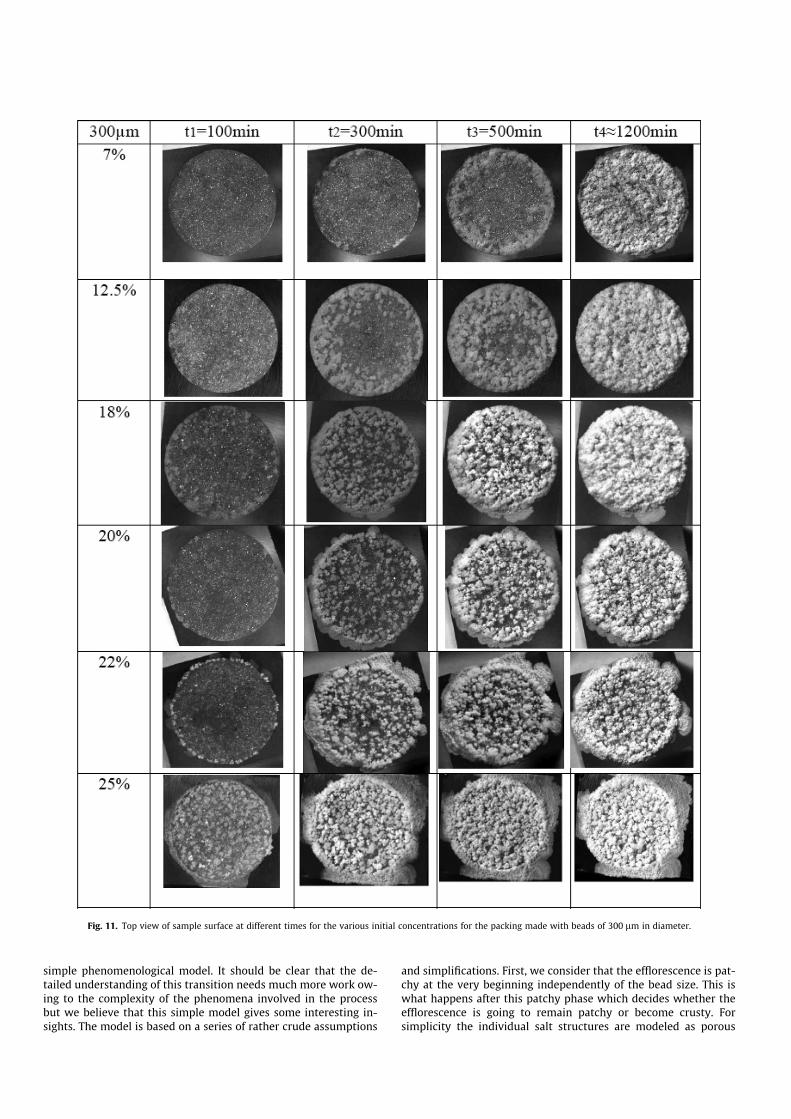
The understanding of this coupling is of course desirable butmore work is needed to develop a detailed analysis. One can gain,however, some first insights from the top views of efflorescencepresented in Fig. 11. First, one can note that the efflorescence cov-ers practically all the surface at t = 300 min for the salt initial massfraction in the range [18%, 25%], which corresponds to the increas-ing branch of the curve in Fig. 10. Second, the efflorescence isclearly more developed at t = 300 min as the salt initial mass frac-tion increases in this range of salt initial mass fraction [18%, 25%].Thus here one can conclude that the increase in the drying ratewith the salt initial mass fraction after the minimum drying ratein Fig. 10 (which corresponds to C0 = 18% in Fig. 10), is simplydue to the increase in the exchange surface associated with theefflorescence. This argument does not hold, however, for thedecreasing branch of the curve in Fig. 10. From Fig. 11, it is clearthan the efflorescence is more developed as the salt initial massfraction increases also in the range of salt initial mass fractions]0%, 18%], whereas the drying rate decreases. In contrast with thecase of the higher salt initial mass fractions, one can note howeverthat a large fraction of the porous medium surface is free of efflo-rescence at t = 300 min for C0 = 7% and 12.5%. The absence of efflo-rescence in the central region is an indication that the saltconcentration at the surface in the central region free of efflores-cence is less than the saturation mass fraction Csat. As a result,the vapor pressure is greater in the central region than in theperipheral region where the efflorescence is present since as dis-cussed before and shown in the inset in Fig. 4, the vapor pressureis a decreasing function of the salt concentration. It follows that theevaporation flux should be greater in the central region free ofefflorescence since the flux varies as (pv(C)–pv1). In passing thiswould be an indication that the flux distribution depicted inFig. 4 is only valid at the beginning of drying, at least when the saltinitial concentration is small enough owing to the evolution of saltconcentration along the surface of porous medium. It is thereforesurmised that the salt concentration at t = 300 min in the centralregion is lower for C0 = 7% than for C0 = 12.5%. (this is confirmedby the top views of efflorescence at t = 500 min, which shows agreater surface free of efflorescence for the case C0 = 7%), whichtherefore would lead to a greater overall evaporation rate for thecase 7% compared to the case 12.5%.
In summary, for a sufficiently high salt mass fraction, the saltconcentration distribution is rapidly more uniform and close tothe saturation concentration, which leads to the rapid developmentof efflorescence over the entire surface. The dominant effect, whichexplains the increasing branch in Fig. 10, is then the increase in theefflorescence exchange surface with the salt initial mass fraction.For a sufficiently low salt initial mass fraction, a non-uniform saltconcentration distribution develops at the surface with lower con-centrations, and thus greater evaporation fluxes, in the central re-gion over a significant period of drying. This non-uniformdistribution effect would be more marked as the initial concentra-tion decreases, which explains the decreasing branch of the curve inFig. 10. Thus the decreasing branch in Fig. 10 is explained by thedominant effect of the variation of water activity with salt concen-tration whereas the ascending branch is explained by the evapora-tion enhancement effect due to major efflorescence developments.
Before closing this section, two points can be noted. First, a sim-ilar non-monotonous behavior is expected for the bead size ranges#4 and #5 since again the results depicted in Fig. 2d and e showsthat evaporation is slower in the first phase for C0 = 12.5%, com-pared to the cases 0% and 25%. Thus it is conjectured that such anon-monotonous behavior will be observed when the efflores-cence is patchy.
3.9. Influence of initial salt concentration on drying with crustyefflorescence
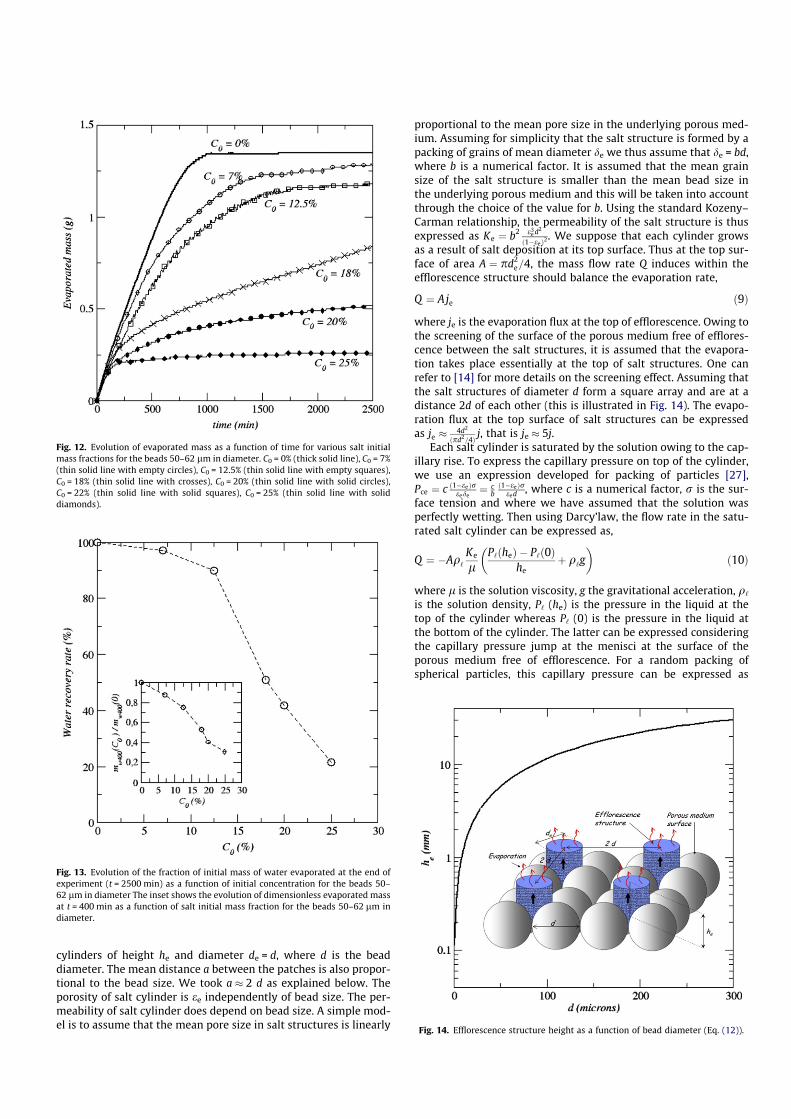
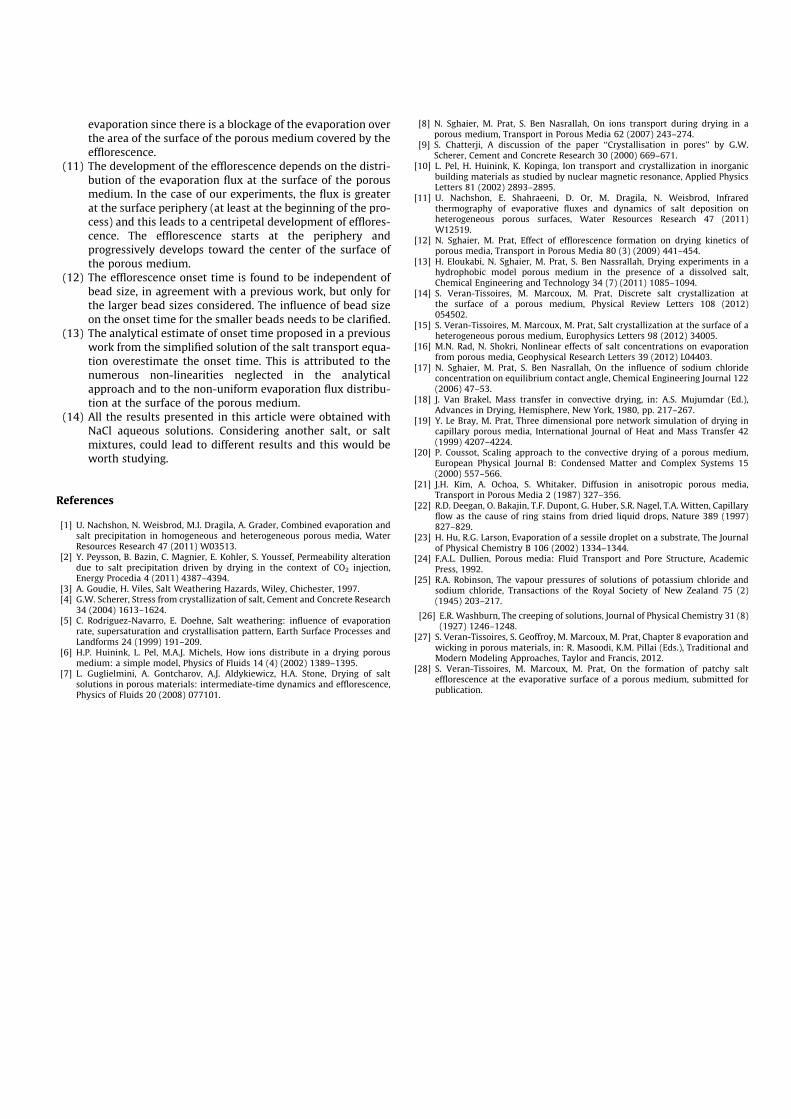
By contrast, Fig. 2a–c indicates a different behavior when theefflorescence is crusty since the mean evaporation rate in the firstphase decreases with increasing concentration. The variation ofmean evaporation rate with initial concentration should thereforebe monotonous in this case. This is confirmed by the results de-picted in Fig. 12 for the bead size range #2 (50–62 lm). The efflo-rescence is crusty and clearly the mean evaporation flux in thephase of rapid evaporation decreases monotonously with theincreasing initial salt concentration. This is also illustrated inFig. 13, which shows the variation of the fraction of initial massof water evaporated at the end of experiments.
In contrast with the patchy efflorescence, the crusty efflores-cence blocks or severely limits the evaporation. Thus, evaporationin this case should therefore essentially take place from the frac-tion of the porous medium surface free of efflorescence. This efflo-rescence free evaporation surface area shrinks during drying as aresult of the centripetal colonization of the surface by the efflores-cence (see Section 3.3). The lower the area of the surface free ofefflorescence, the lower the evaporation rate. Combined with thefact the water activity decreases as the salt concentration in-creases, this should explain the monotonous decrease of the meanevaporation flux with the increasing initial salt concentrationwhen the efflorescence is crusty for the evaporative surface shrink-ing occurs faster for a greater initial salt concentration. A morecomplete analysis should also take into account the fact that themenisci at the surface first recede in the large pores at the surfaceas the result of drying. It is therefore possible that some pores atthe interface are free of liquid and remains free of efflorescence,thus providing passages for the vapor between the internal menisciand the external air. This is more likely to happen with a low initialsalt concentration. This could explain why a very high recoveryrate of water is obtained for the lower initial salt concentrationsin Fig. 13.
4. A simple phenomenological model of efflorescence growth
To explain the crusty–patchy transition observed in the experi-ments as the bead size is varied, we propose in this section a
Fig. 10. Evolution of evaporation rate as a function of salt initial mass fraction inthe first phase of drying (see text) for the beads of 300 lm in diameter.
simple phenomenological model. It should be clear that the de-tailed understanding of this transition needs much more work ow-ing to the complexity of the phenomena involved in the processbut we believe that this simple model gives some interesting in-sights. The model is based on a series of rather crude assumptions
and simplifications. First, we consider that the efflorescence is pat-chy at the very beginning independently of the bead size. This iswhat happens after this patchy phase which decides whether theefflorescence is going to remain patchy or become crusty. Forsimplicity the individual salt structures are modeled as porous
Fig. 11. Top view of sample surface at different times for the various initial concentrations for the packing made with beads of 300 lm in diameter.
cylinders of height he and diameter de = d, where d is the beaddiameter. The mean distance a between the patches is also propor-tional to the bead size. We took a � 2 d as explained below. Theporosity of salt cylinder is ee independently of bead size. The per-meability of salt cylinder does depend on bead size. A simple mod-el is to assume that the mean pore size in salt structures is linearly
proportional to the mean pore size in the underlying porous med-ium. Assuming for simplicity that the salt structure is formed by apacking of grains of mean diameter de we thus assume that de = bd,where b is a numerical factor. It is assumed that the mean grainsize of the salt structure is smaller than the mean bead size inthe underlying porous medium and this will be taken into accountthrough the choice of the value for b. Using the standard Kozeny–Carman relationship, the permeability of the salt structure is thusexpressed as Ke ¼ b2 e3
e d2
ð1�eeÞ2. We suppose that each cylinder grows
as a result of salt deposition at its top surface. Thus at the top sur-face of area A ¼ pd2
e=4, the mass flow rate Q induces within theefflorescence structure should balance the evaporation rate,
Q ¼ Aje ð9Þ
where je is the evaporation flux at the top of efflorescence. Owing tothe screening of the surface of the porous medium free of efflores-cence between the salt structures, it is assumed that the evapora-tion takes place essentially at the top of salt structures. One canrefer to [14] for more details on the screening effect. Assuming thatthe salt structures of diameter d form a square array and are at adistance 2d of each other (this is illustrated in Fig. 14). The evapo-ration flux at the top surface of salt structures can be expressedas je � 4d2
ðpd2=4Þj, that is je � 5j.
Each salt cylinder is saturated by the solution owing to the cap-illary rise. To express the capillary pressure on top of the cylinder,we use an expression developed for packing of particles [27],Pce ¼ c ð1�eeÞr
eede¼ c
bð1�eeÞr
eed , where c is a numerical factor, r is the sur-face tension and where we have assumed that the solution wasperfectly wetting. Then using Darcy’law, the flow rate in the satu-rated salt cylinder can be expressed as,
Q ¼ �Aq‘
Ke
lP‘ðheÞ � P‘ð0Þ
heþ q‘g
� �ð10Þ
where l is the solution viscosity, g the gravitational acceleration, q‘is the solution density, P‘ (he) is the pressure in the liquid at thetop of the cylinder whereas P‘ (0) is the pressure in the liquid atthe bottom of the cylinder. The latter can be expressed consideringthe capillary pressure jump at the menisci at the surface of theporous medium free of efflorescence. For a random packing ofspherical particles, this capillary pressure can be expressed as
Fig. 12. Evolution of evaporated mass as a function of time for various salt initialmass fractions for the beads 50–62 lm in diameter. C0 = 0% (thick solid line), C0 = 7%(thin solid line with empty circles), C0 = 12.5% (thin solid line with empty squares),C0 = 18% (thin solid line with crosses), C0 = 20% (thin solid line with solid circles),C0 = 22% (thin solid line with solid squares), C0 = 25% (thin solid line with soliddiamonds).
Fig. 13. Evolution of the fraction of initial mass of water evaporated at the end ofexperiment (t = 2500 min) as a function of initial concentration for the beads 50–62 lm in diameter The inset shows the evolution of dimensionless evaporated massat t = 400 min as a function of salt initial mass fraction for the beads 50–62 lm indiameter.
Fig. 14. Efflorescence structure height as a function of bead diameter (Eq. (12)).

Pcpm ¼ 6ð1�eÞred ¼ Patm � P‘ð0Þ [27], where e is the porosity of the por-
ous medium. At the top of the cylinder, we have a similar expression,Pce ¼ c
bð1�eeÞr
eed ¼ Patm � P‘ðheÞ. Combining the above equations leadsto
je ¼ �q‘
Ke
lPcpm � Pce
heþ q‘ g
� �ð11Þ
from which one can obtain an estimate of the maximum height ofeach cylinder as,
he ¼ rdcb
1�eeee� 6 1�e
e
q‘gd2 þ jemð1�eeÞ2
b2e3e
0B@
1CA ð12Þ
where m is the kinematic viscosity of the solution. This equation canbe expressed in dimensionless form as
he
d¼
cb
1�eeee� 6 1�e
e
Bþ Ca
!ð13Þ
where B ¼ q‘gd2
r is the Bond number, which characterizes the compe-tition between capillary and gravity effects in the salt structure,whereas Ca ¼ jemð1�eeÞ2
b2e3er
is the capillary number, which characterizesthe competition between capillary and viscous effects in the saltstructure. Thus, Eq. (13) expresses that the efflorescence structurescannot exceed a certain height given by Eq. (13). This maximumheight is directly related to the capillary rise in the salt structure.As for classical wicking problems in porous media [27] the risecan be limited by gravity effects, viscous effects or both.
The variation of the salt structures height he with the beaddiameter has been computed using Eq. (12) with the following val-ues of the parameters: j � 10�4 kg/m2/s (which is representative ofour experiments), ee = 0.04, emp = 0.36, c = 6 � 10�2, b = 10�2.(which corresponds to a mean pore size in the salt structure 100times smaller than the mean pore size in the underlying packingof beads). The results are plotted in Fig. 14. As can be seen, theheight for the larger beads is centimetric whereas the maximumheight decreases sharply for the bead size lower than about100 lm. For the size 26 lm (range #1), the maximum height inFig. 14 is on the order of 2–3 mm. These orders of magnitude areconsistent with the experimental observations.
Nevertheless, we are not of course claiming that this simplemodel can lead to truly quantitative predictions since the valueschosen for the parameters can be certainly questioned as long asthe many assumptions. For example we have implicitly assumedthe self-similarity of the salt structures with the bead size. Thereality is probably more complex. Also, we have neglected the Kel-vin’s effect, i.e. the reduction of water activity due to high curva-ture of menisci in sufficiently small pores, whereas a somewhatmore sophisticated version of the model for the simpler case ofwicking–evaporation indicates that it is more consistent to takeit into account [28]. The essential merit of this simple model israther to suggest the following scenario. For sufficiently large beadsizes the efflorescence structures can grow upward up to a signif-icant height and this leads to the patchy efflorescence. By contrast,the upward growth of salt structures would be rapidly limited ow-ing to the combined action of gravity and viscous effects (and Kel-vin’s effect) when the bead size is sufficiently small. As the results,the incipient patches would grow laterally rather than vertically,coalescing rapidly with each other to form a crust.
This simple model also suggests that the patchy–crusty transi-tion should also occur for a given bead size when the evaporationflux is sufficiently varied. In the case of our experiments, the efflo-rescence could become crusty with the larger bead sizes if theevaporation flux is sufficiently increased (by using a blower for in-stance or by increasing the temperature) or could become patchy
with the smaller beads if the evaporation flux is sufficiently re-duced (by increasing the relative humidity in the chamber forexample). We have performed preliminary experiments that seemin agreement with these ideas but more work is needed to confirmthese qualitative predictions.
5. Conclusion
Understanding and modeling the drying process of a porousmedium in the presence of salt is an exciting challenge. As reportedin this article, many questions are still widely open. We hope thatthe findings reported in the present article will stimulate furtherworks. These findings can be summarized as follows:
(1) The presence of the salt can have a great impact on the dry-ing of a porous medium.
(2) Two main types of efflorescence, referred to as crusty andpatchy have been identified.
(3) The evaporated mass curves are quite different dependingon whether the efflorescence is patchy or crusty.
(4) When the efflorescence is crusty, the crystal crust that formsat the surface of the porous medium can severely limit theevaporation. The blocking of evaporation due to the forma-tion of a crystallized salt crust at the surface of the porousmedium can be very effective with only a small fraction ofthe water initially present in the medium evaporating.
(5) When patches form the evaporation is not significantly lim-ited by the presence of the crystallized salt at the surface ofthe porous medium. All the water initially present in themedium can evaporate. The evaporation rate can be in facteven greater than with pure water owing to the enhancedevaporation surface corresponding to the outer surface ofsalt structures.
(6) The two situations, referred to as patchy and crusty, can beobserved for the same evaporation condition. The crustyefflorescence is observed for a sufficiently finer porous med-ium whereas the patchy efflorescence is observed for a suf-ficiently coarse porous medium. This has been observed inour experiments by varying the average size of the beadsforming the porous medium.
(7) According to our experiments, the occurrence of a patchy (ora crusty) efflorescence does not depend on the initial con-centration for a given bead size and for given evaporationcondition; at least as long as a significant efflorescencedevelops at the surface (very low initial salt concentrationshave not been tested).
(8) A simple qualitative model of efflorescence based on theassumption that the efflorescence behaves as a porous wicksuggests that the crusty–patchy transition should be alsoobserved for a given porous medium by varying the evapo-ration rate.
(9) When the efflorescence is patchy, the evaporation rate in thephase of rapid evaporation where the surface of the porousmedium is hydraulically well connected to the solution pres-ent in the pore space is a non-monotonous function of theinitial salt concentration. This is attributed to the complexinterplay between the efflorescence development and thevarious transport phenomena taking place within the porousmedium, the efflorescence structures and the gas phase.
(10) When the efflorescence is crusty, such a non-monotonousvariation is not observed anymore. The mean evaporationrate decreases monotonously with the initial salt concentra-tion. This is a consequence of the combined effect of thereduction in water activity with the salt concentration andthe reduction of the porous medium surface available for
evaporation since there is a blockage of the evaporation overthe area of the surface of the porous medium covered by theefflorescence.
(11) The development of the efflorescence depends on the distri-bution of the evaporation flux at the surface of the porousmedium. In the case of our experiments, the flux is greaterat the surface periphery (at least at the beginning of the pro-cess) and this leads to a centripetal development of efflores-cence. The efflorescence starts at the periphery andprogressively develops toward the center of the surface ofthe porous medium.
(12) The efflorescence onset time is found to be independent ofbead size, in agreement with a previous work, but only forthe larger bead sizes considered. The influence of bead sizeon the onset time for the smaller beads needs to be clarified.
(13) The analytical estimate of onset time proposed in a previouswork from the simplified solution of the salt transport equa-tion overestimate the onset time. This is attributed to thenumerous non-linearities neglected in the analyticalapproach and to the non-uniform evaporation flux distribu-tion at the surface of the porous medium.
(14) All the results presented in this article were obtained withNaCl aqueous solutions. Considering another salt, or saltmixtures, could lead to different results and this would beworth studying.
References
[1] U. Nachshon, N. Weisbrod, M.I. Dragila, A. Grader, Combined evaporation andsalt precipitation in homogeneous and heterogeneous porous media, WaterResources Research 47 (2011) W03513.
[2] Y. Peysson, B. Bazin, C. Magnier, E. Kohler, S. Youssef, Permeability alterationdue to salt precipitation driven by drying in the context of CO2 injection,Energy Procedia 4 (2011) 4387–4394.
[3] A. Goudie, H. Viles, Salt Weathering Hazards, Wiley, Chichester, 1997.[4] G.W. Scherer, Stress from crystallization of salt, Cement and Concrete Research
34 (2004) 1613–1624.[5] C. Rodriguez-Navarro, E. Doehne, Salt weathering: influence of evaporation
rate, supersaturation and crystallisation pattern, Earth Surface Processes andLandforms 24 (1999) 191–209.
[6] H.P. Huinink, L. Pel, M.A.J. Michels, How ions distribute in a drying porousmedium: a simple model, Physics of Fluids 14 (4) (2002) 1389–1395.
[7] L. Guglielmini, A. Gontcharov, A.J. Aldykiewicz, H.A. Stone, Drying of saltsolutions in porous materials: intermediate-time dynamics and efflorescence,Physics of Fluids 20 (2008) 077101.
[8] N. Sghaier, M. Prat, S. Ben Nasrallah, On ions transport during drying in aporous medium, Transport in Porous Media 62 (2007) 243–274.
[9] S. Chatterji, A discussion of the paper ‘‘Crystallisation in pores’’ by G.W.Scherer, Cement and Concrete Research 30 (2000) 669–671.
[10] L. Pel, H. Huinink, K. Kopinga, Ion transport and crystallization in inorganicbuilding materials as studied by nuclear magnetic resonance, Applied PhysicsLetters 81 (2002) 2893–2895.
[11] U. Nachshon, E. Shahraeeni, D. Or, M. Dragila, N. Weisbrod, Infraredthermography of evaporative fluxes and dynamics of salt deposition onheterogeneous porous surfaces, Water Resources Research 47 (2011)W12519.
[12] N. Sghaier, M. Prat, Effect of efflorescence formation on drying kinetics ofporous media, Transport in Porous Media 80 (3) (2009) 441–454.
[13] H. Eloukabi, N. Sghaier, M. Prat, S. Ben Nassrallah, Drying experiments in ahydrophobic model porous medium in the presence of a dissolved salt,Chemical Engineering and Technology 34 (7) (2011) 1085–1094.
[14] S. Veran-Tissoires, M. Marcoux, M. Prat, Discrete salt crystallization atthe surface of a porous medium, Physical Review Letters 108 (2012)054502.
[15] S. Veran-Tissoires, M. Marcoux, M. Prat, Salt crystallization at the surface of aheterogeneous porous medium, Europhysics Letters 98 (2012) 34005.
[16] M.N. Rad, N. Shokri, Nonlinear effects of salt concentrations on evaporationfrom porous media, Geophysical Research Letters 39 (2012) L04403.
[17] N. Sghaier, M. Prat, S. Ben Nasrallah, On the influence of sodium chlorideconcentration on equilibrium contact angle, Chemical Engineering Journal 122(2006) 47–53.
[18] J. Van Brakel, Mass transfer in convective drying, in: A.S. Mujumdar (Ed.),Advances in Drying, Hemisphere, New York, 1980, pp. 217–267.
[19] Y. Le Bray, M. Prat, Three dimensional pore network simulation of drying incapillary porous media, International Journal of Heat and Mass Transfer 42(1999) 4207–4224.
[20] P. Coussot, Scaling approach to the convective drying of a porous medium,European Physical Journal B: Condensed Matter and Complex Systems 15(2000) 557–566.
[21] J.H. Kim, A. Ochoa, S. Whitaker, Diffusion in anisotropic porous media,Transport in Porous Media 2 (1987) 327–356.
[22] R.D. Deegan, O. Bakajin, T.F. Dupont, G. Huber, S.R. Nagel, T.A. Witten, Capillaryflow as the cause of ring stains from dried liquid drops, Nature 389 (1997)827–829.
[23] H. Hu, R.G. Larson, Evaporation of a sessile droplet on a substrate, The Journalof Physical Chemistry B 106 (2002) 1334–1344.
[24] F.A.L. Dullien, Porous media: Fluid Transport and Pore Structure, AcademicPress, 1992.
[25] R.A. Robinson, The vapour pressures of solutions of potassium chloride andsodium chloride, Transactions of the Royal Society of New Zealand 75 (2)(1945) 203–217.
[26] E.R. Washburn, The creeping of solutions, Journal of Physical Chemistry 31 (8)(1927) 1246–1248.
[27] S. Veran-Tissoires, S. Geoffroy, M. Marcoux, M. Prat, Chapter 8 evaporation andwicking in porous materials, in: R. Masoodi, K.M. Pillai (Eds.), Traditional andModern Modeling Approaches, Taylor and Francis, 2012.
[28] S. Veran-Tissoires, M. Marcoux, M. Prat, On the formation of patchy saltefflorescence at the evaporative surface of a porous medium, submitted forpublication.