Embed Size (px)
Citation preview

Abstract—Rise velocity of bubble and light weight particles
in the bubble column are studied. The investigation was carried out in a bubble column characterized by an aspect ratio equal to four. The column was made up of Plexiglas, equipped with sparger and a spherical plate with steel bowl and lid for the second experimentation. The top of the column was open to atmosphere. The liquids used for the experimentation were deionised water, glycerin (50%) and butanol (1.5%). the gas phase was atmospheric air for all the runs. A high speed digital video camera is employed for the measurement of rise velocity of bubbles and light weight particles. The recorded images are also used to obtain an insight into the coalescence/breakage mechanisms occurring during bubble formation at the vicinity of the sparger and accurate rise velocity of light weight particles. The average gas holdup is estimated by the bed expansion. The uncertainty of the measurement is estimated to be less than 10%.
Index Terms—Bubble column; light weight particles; gas hold up; rising velocity; viscosity; flow regimes
I. INTRODUCTION Bubble Columns are widely used in chemical,
petrochemical, pharmaceutical, metallurgical industries as multiphase reactors and contactors because of their simple construction and ease of operation. The bubble column have no moving parts as compare with the conventional stirred tank reactors, the contact between two or more phases are more effective in bubble columns as compare to stirred tank reactors. The energy efficiency in bubble columns is high. However, their design and scale up is still a difficult task, due to the complex structure of the multiphase flow encountered in this type of equipment. The fluid dynamics of multiphase reactors is very complex and is usually described in terms of single parameters and phenomena, namely off bottom particle suspension, power consumption, mixing time of the liquid, solids distribution inside the column and efficiency of sample withdrawal for solid liquid systems and overall and local gas hold-up, ventilated cavities at the rear of the impeller blades, bubble size and bubble size distribution, liquid mixing time, gas distribution in the vessel for gas-liquid systems [1].
Much less attention has been devoted to the behavior of solid particles in the bubble columns, the exception being studies on solids drawdown and particle distribution [2].
Despite the extensive and long lasting study of bubble column performance many basic questions about the effect
Manuscript Received December 3, 2011; revised February 10, 2012. The authors are with the Department of Chemical Engineering, Bharati
Vidyapeeth College of Engineering, Navi Mumbai (MS), India. (e-mail: [email protected])
of important operational parameters remain unanswered. For example bubble column characteristics have been extensively studied in the past few decades, there is still considerable uncertainty concerning the prevailing mechanisms of the bubble formation as well as the most appropriate correlations for practical applications. It is generally accepted that, depending on the gas flow rate, two main flow regimes can be readily observed in bubble columns, i.e., the homogeneous bubbly flow regimes encountered at low gas velocities and characterized by a narrow bubble size distribution and radially uniform gas holdup; and the heterogeneous (churn turbulent flow) regime observed at higher gas velocities and characterized by the appearance of large bubbles, formed by coalescence of the small bubbles and bearing a higher rise velocity hence leading to relatively lower gas holdup values [3]. The two regimes differ from one another in their hydrodynamic and transport characteristics. Depending on the type of the gas distributor and the properties of the liquid phase, both regimes can be obtained in the same equipment by varying the gas input flow rate.
Various types’ gas spargers, the most common of which are perforated plates, membrane and fine porous plate are in use. Among the above sparger types, the perforated plate requires a minimum gas velocity in order to produce a uniform bubble distribution over the whole sparger area. On the other hand, bubble columns equipped with porous spargers offer a greater gas/liquid contact area for efficient mass and heat transfer, because the bubbles created by this type of gas distributor are numerous and far smaller [4], and the membrane which is able to maintain a homogeneous flow up to greater flow rates, generates a greater pressure drop [5].
Though the knowledge about the fluid dynamics of multiphase systems has significantly advanced in the last decade, many aspects are still to be fully understood – rise velocity of bubbles is compared with the rise velocity of light weight particle (thermocole) in bubble column being the most relevant one addressed in this paper.
The purpose of this paper is to compare rise velocity of bubbles with the rise velocity of light weight particles in bubble column. The investigation is based on the measurement of the rising velocity of the bubbles. The study has been performed in a column of high aspect ratio.
II. EXPERIMENTAL SET-UP AND CONDITIONS The investigation was carried out in a bubble column
(diameter T=23 cm, volume V=41.54 litre) characterised by an aspect ratio H/T=4 – identical to those used in previous studies [6]. The experimental setup is illustrated in Fig.1 and it consists of a column made of Plexiglas, was equipped with
Experimental Study on Comparison of Rising Velocity of Bubbles and Light Weight Particles in the Bubble Column
S. M. Walke and Vivek S. Sathe
International Journal of Chemical Engineering and Applications, Vol. 3, No. 1, February 2012
25
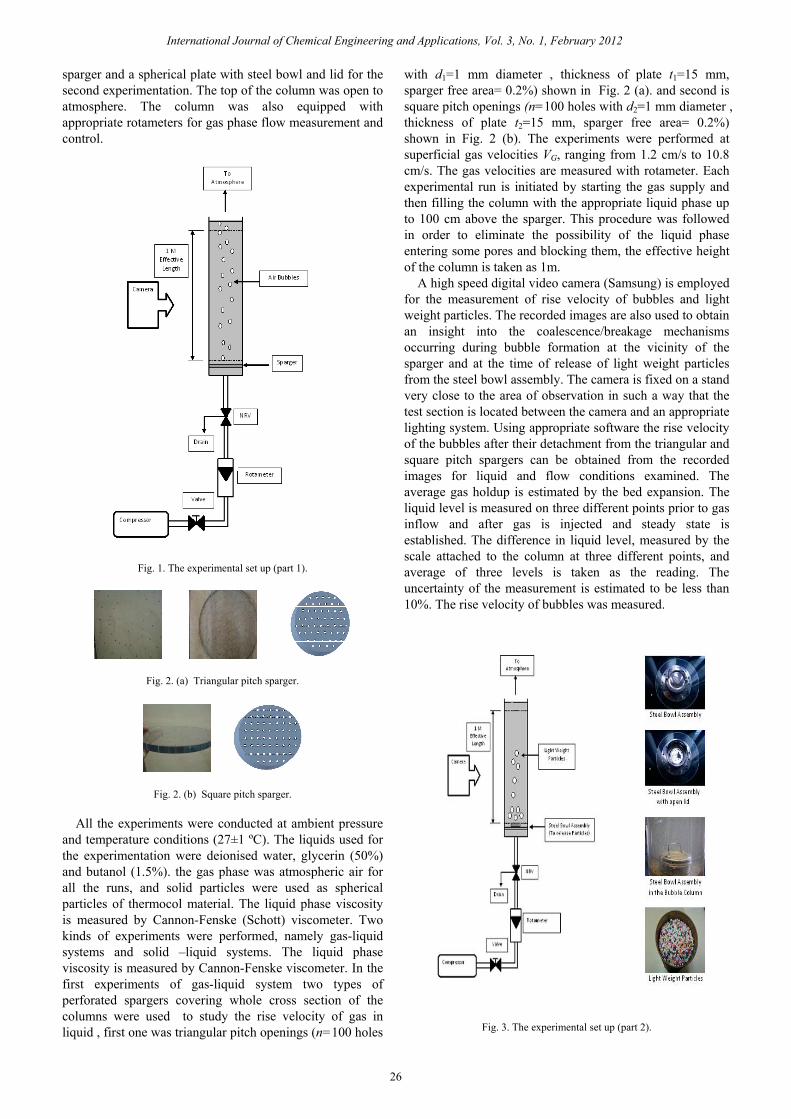
sparger and a spherical plate with steel bowl and lid for the second experimentation. The top of the column was open to atmosphere. The column was also equipped with appropriate rotameters for gas phase flow measurement and control.
Fig. 1. The experimental set up (part 1).
Fig. 2. (a) Triangular pitch sparger.
Fig. 2. (b) Square pitch sparger.
All the experiments were conducted at ambient pressure and temperature conditions (27±1 ºC). The liquids used for the experimentation were deionised water, glycerin (50%) and butanol (1.5%). the gas phase was atmospheric air for all the runs, and solid particles were used as spherical particles of thermocol material. The liquid phase viscosity is measured by Cannon-Fenske (Schott) viscometer. Two kinds of experiments were performed, namely gas-liquid systems and solid –liquid systems. The liquid phase viscosity is measured by Cannon-Fenske viscometer. In the first experiments of gas-liquid system two types of perforated spargers covering whole cross section of the columns were used to study the rise velocity of gas in liquid , first one was triangular pitch openings (n=100 holes
with d1=1 mm diameter , thickness of plate t1=15 mm, sparger free area= 0.2%) shown in Fig. 2 (a). and second is square pitch openings (n=100 holes with d2=1 mm diameter , thickness of plate t2=15 mm, sparger free area= 0.2%) shown in Fig. 2 (b). The experiments were performed at superficial gas velocities VG, ranging from 1.2 cm/s to 10.8 cm/s. The gas velocities are measured with rotameter. Each experimental run is initiated by starting the gas supply and then filling the column with the appropriate liquid phase up to 100 cm above the sparger. This procedure was followed in order to eliminate the possibility of the liquid phase entering some pores and blocking them, the effective height of the column is taken as 1m.
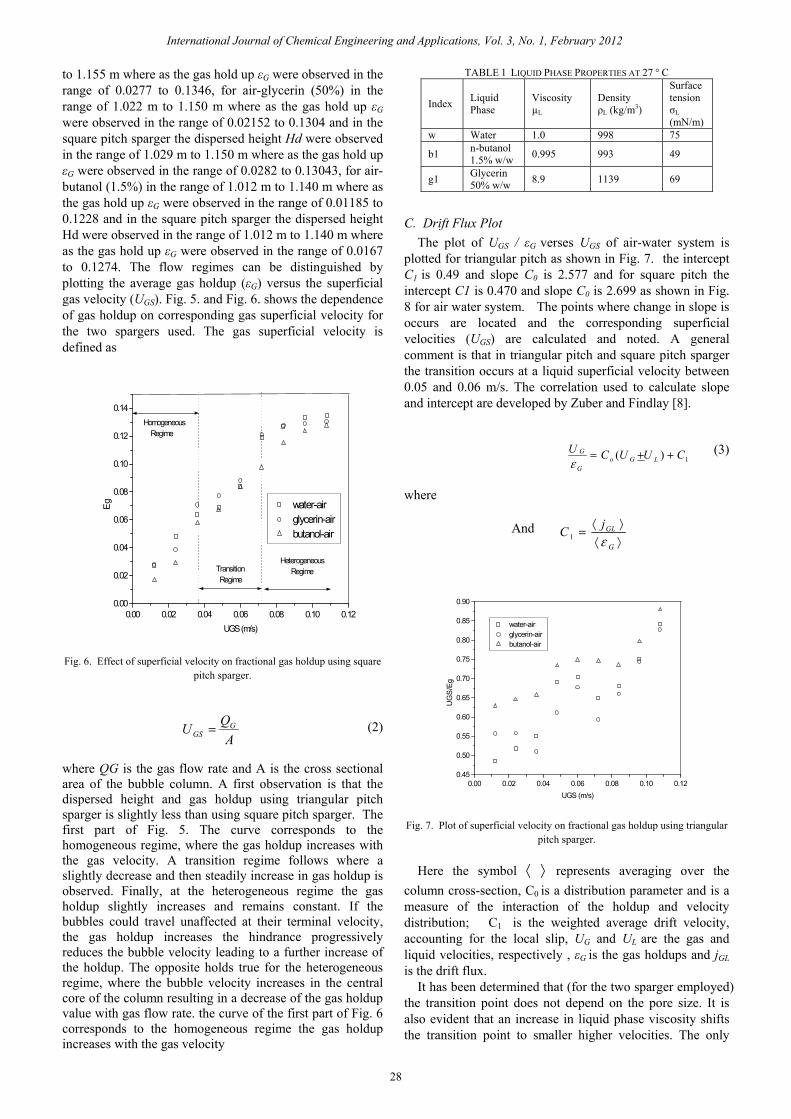
A high speed digital video camera (Samsung) is employed for the measurement of rise velocity of bubbles and light weight particles. The recorded images are also used to obtain an insight into the coalescence/breakage mechanisms occurring during bubble formation at the vicinity of the sparger and at the time of release of light weight particles from the steel bowl assembly. The camera is fixed on a stand very close to the area of observation in such a way that the test section is located between the camera and an appropriate lighting system. Using appropriate software the rise velocity of the bubbles after their detachment from the triangular and square pitch spargers can be obtained from the recorded images for liquid and flow conditions examined. The average gas holdup is estimated by the bed expansion. The liquid level is measured on three different points prior to gas inflow and after gas is injected and steady state is established. The difference in liquid level, measured by the scale attached to the column at three different points, and average of three levels is taken as the reading. The uncertainty of the measurement is estimated to be less than 10%. The rise velocity of bubbles was measured.
Fig. 3. The experimental set up (part 2).
International Journal of Chemical Engineering and Applications, Vol. 3, No. 1, February 2012
26
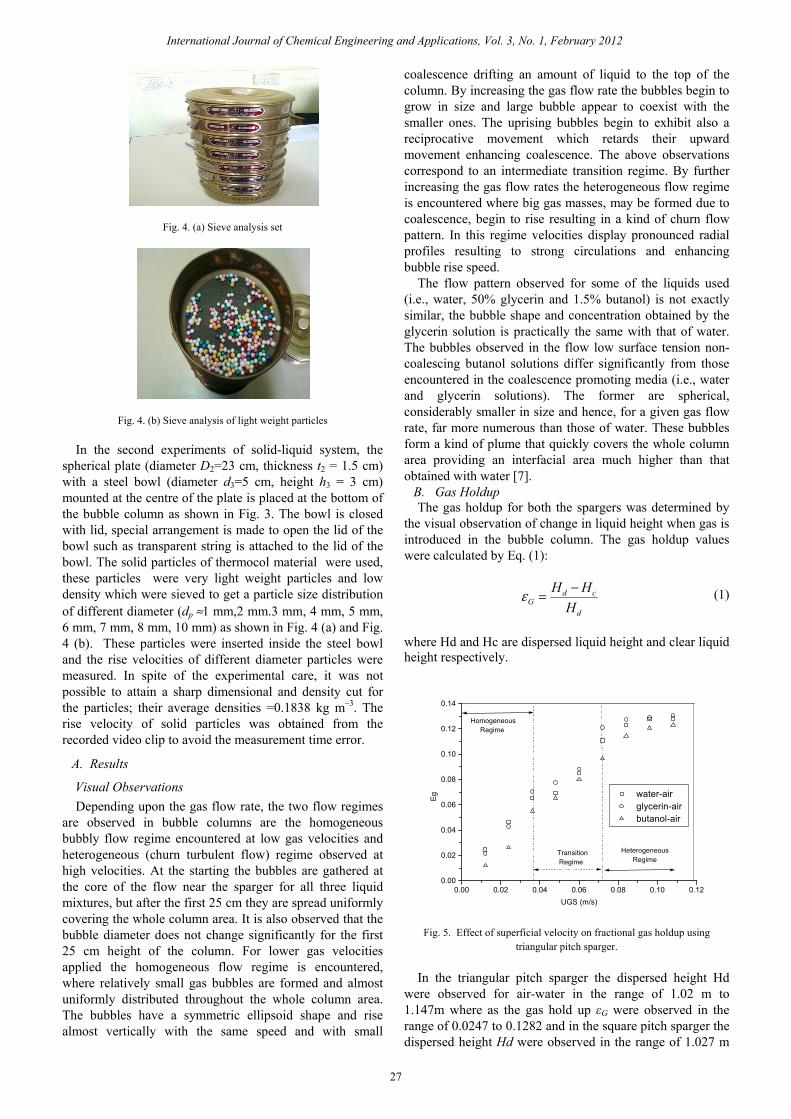
Fig. 4. (a) Sieve analysis set
Fig. 4. (b) Sieve analysis of light weight particles
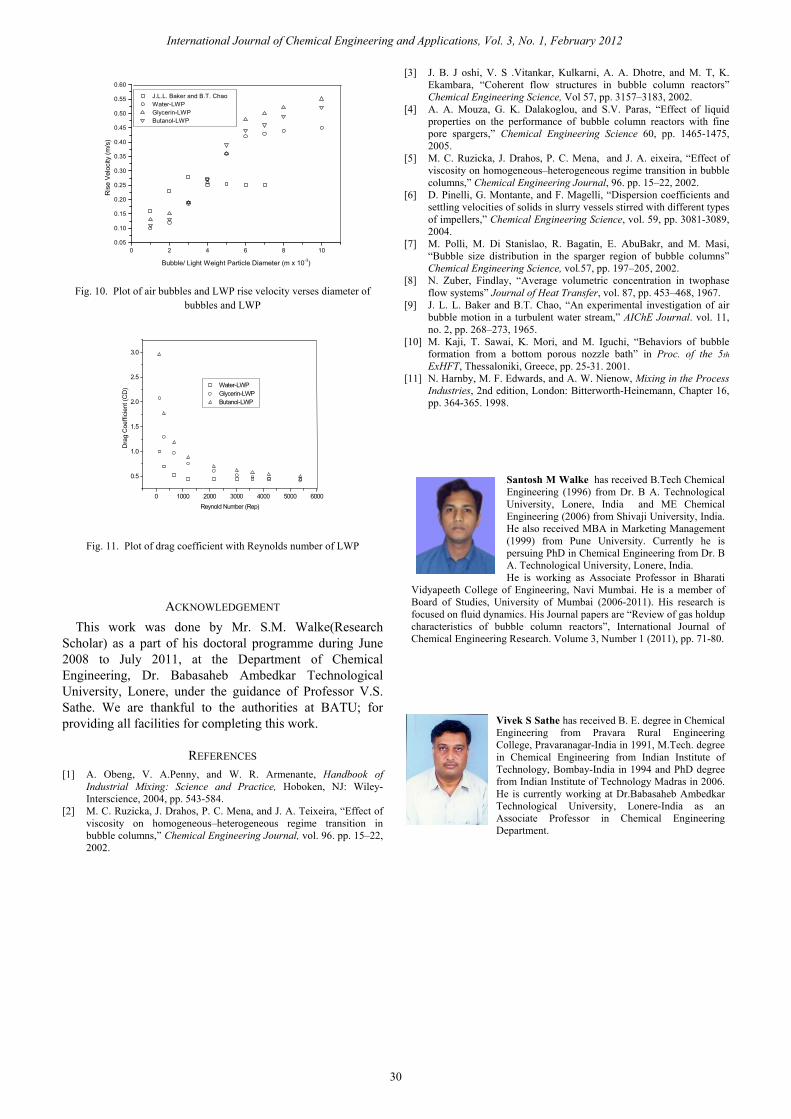
In the second experiments of solid-liquid system, the spherical plate (diameter D2=23 cm, thickness t2 = 1.5 cm) with a steel bowl (diameter d3=5 cm, height h3 = 3 cm) mounted at the centre of the plate is placed at the bottom of the bubble column as shown in Fig. 3. The bowl is closed with lid, special arrangement is made to open the lid of the bowl such as transparent string is attached to the lid of the bowl. The solid particles of thermocol material were used, these particles were very light weight particles and low density which were sieved to get a particle size distribution of different diameter (dp ≈1 mm,2 mm.3 mm, 4 mm, 5 mm, 6 mm, 7 mm, 8 mm, 10 mm) as shown in Fig. 4 (a) and Fig. 4 (b). These particles were inserted inside the steel bowl and the rise velocities of different diameter particles were measured. In spite of the experimental care, it was not possible to attain a sharp dimensional and density cut for the particles; their average densities =0.1838 kg m–3. The rise velocity of solid particles was obtained from the recorded video clip to avoid the measurement time error.
A. Results
Visual Observations Depending upon the gas flow rate, the two flow regimes
are observed in bubble columns are the homogeneous bubbly flow regime encountered at low gas velocities and heterogeneous (churn turbulent flow) regime observed at high velocities. At the starting the bubbles are gathered at the core of the flow near the sparger for all three liquid mixtures, but after the first 25 cm they are spread uniformly covering the whole column area. It is also observed that the bubble diameter does not change significantly for the first 25 cm height of the column. For lower gas velocities applied the homogeneous flow regime is encountered, where relatively small gas bubbles are formed and almost uniformly distributed throughout the whole column area. The bubbles have a symmetric ellipsoid shape and rise almost vertically with the same speed and with small
coalescence drifting an amount of liquid to the top of the column. By increasing the gas flow rate the bubbles begin to grow in size and large bubble appear to coexist with the smaller ones. The uprising bubbles begin to exhibit also a reciprocative movement which retards their upward movement enhancing coalescence. The above observations correspond to an intermediate transition regime. By further increasing the gas flow rates the heterogeneous flow regime is encountered where big gas masses, may be formed due to coalescence, begin to rise resulting in a kind of churn flow pattern. In this regime velocities display pronounced radial profiles resulting to strong circulations and enhancing bubble rise speed.
The flow pattern observed for some of the liquids used (i.e., water, 50% glycerin and 1.5% butanol) is not exactly similar, the bubble shape and concentration obtained by the glycerin solution is practically the same with that of water. The bubbles observed in the flow low surface tension non-coalescing butanol solutions differ significantly from those encountered in the coalescence promoting media (i.e., water and glycerin solutions). The former are spherical, considerably smaller in size and hence, for a given gas flow rate, far more numerous than those of water. These bubbles form a kind of plume that quickly covers the whole column area providing an interfacial area much higher than that obtained with water [7]. B. Gas Holdup
The gas holdup for both the spargers was determined by the visual observation of change in liquid height when gas is introduced in the bubble column. The gas holdup values were calculated by Eq. (1):
d
cdG H
HH −=ε (1)
where Hd and Hc are dispersed liquid height and clear liquid height respectively.
0.00 0.02 0.04 0.06 0.08 0.10 0.120.00
0.02
0.04
0.06
0.08
0.10
0.12
0.14
Transition Regime
Heterogeneous Regime
Homogeneous Regime
Eg water-air
glycerin-air butanol-air
UGS (m/s)
Fig. 5. Effect of superficial velocity on fractional gas holdup using
triangular pitch sparger.
In the triangular pitch sparger the dispersed height Hd were observed for air-water in the range of 1.02 m to 1.147m where as the gas hold up εG were observed in the range of 0.0247 to 0.1282 and in the square pitch sparger the dispersed height Hd were observed in the range of 1.027 m
International Journal of Chemical Engineering and Applications, Vol. 3, No. 1, February 2012
27
to 1.155 m where as the gas hold up εG were observed in the range of 0.0277 to 0.1346, for air-glycerin (50%) in the range of 1.022 m to 1.150 m where as the gas hold up εG were observed in the range of 0.02152 to 0.1304 and in the square pitch sparger the dispersed height Hd were observed in the range of 1.029 m to 1.150 m where as the gas hold up εG were observed in the range of 0.0282 to 0.13043, for air-butanol (1.5%) in the range of 1.012 m to 1.140 m where as the gas hold up εG were observed in the range of 0.01185 to 0.1228 and in the square pitch sparger the dispersed height Hd were observed in the range of 1.012 m to 1.140 m where as the gas hold up εG were observed in the range of 0.0167 to 0.1274. The flow regimes can be distinguished by plotting the average gas holdup (εG) versus the superficial gas velocity (UGS). Fig. 5. and Fig. 6. shows the dependence of gas holdup on corresponding gas superficial velocity for the two spargers used. The gas superficial velocity is defined as
0.00 0.02 0.04 0.06 0.08 0.10 0.120.00
0.02
0.04
0.06
0.08
0.10
0.12
0.14
Heterogeneous RegimeTransition
Regime
Homogeneous Regime
water-air glycerin-air butanol-air
Eg
UGS (m/s)
Fig. 6. Effect of superficial velocity on fractional gas holdup using square
pitch sparger.
AQU G
GS = (2)
where QG is the gas flow rate and A is the cross sectional area of the bubble column. A first observation is that the dispersed height and gas holdup using triangular pitch sparger is slightly less than using square pitch sparger. The first part of Fig. 5. The curve corresponds to the homogeneous regime, where the gas holdup increases with the gas velocity. A transition regime follows where a slightly decrease and then steadily increase in gas holdup is observed. Finally, at the heterogeneous regime the gas holdup slightly increases and remains constant. If the bubbles could travel unaffected at their terminal velocity, the gas holdup increases the hindrance progressively reduces the bubble velocity leading to a further increase of the holdup. The opposite holds true for the heterogeneous regime, where the bubble velocity increases in the central core of the column resulting in a decrease of the gas holdup value with gas flow rate. the curve of the first part of Fig. 6 corresponds to the homogeneous regime the gas holdup increases with the gas velocity
TABLE 1 LIQUID PHASE PROPERTIES AT 27 ° C
Index Liquid Phase
Viscosity µL
Density ρL (kg/m3)
Surface tension σL (mN/m)
w Water 1.0 998 75
b1 n-butanol 1.5% w/w 0.995 993 49
g1 Glycerin 50% w/w 8.9 1139 69
C. Drift Flux Plot The plot of UGS / εG verses UGS of air-water system is
plotted for triangular pitch as shown in Fig. 7. the intercept C1 is 0.49 and slope C0 is 2.577 and for square pitch the intercept C1 is 0.470 and slope C0 is 2.699 as shown in Fig. 8 for air water system. The points where change in slope is occurs are located and the corresponding superficial velocities (UGS) are calculated and noted. A general comment is that in triangular pitch and square pitch sparger the transition occurs at a liquid superficial velocity between 0.05 and 0.06 m/s. The correlation used to calculate slope and intercept are developed by Zuber and Findlay [8].
1)( CUUCU
LGoG
G ++=ε
(3)
where
And ⟩⟨⟩⟨=
G
GLjCε1
0.00 0.02 0.04 0.06 0.08 0.10 0.120.45
0.50
0.55
0.60
0.65
0.70
0.75
0.80
0.85
0.90
water-air glycerin-air butanol-air
UG
S/Eg
UGS (m/s)
Fig. 7. Plot of superficial velocity on fractional gas holdup using triangular
pitch sparger.
Here the symbol ⟨ ⟩ represents averaging over the column cross-section, C0 is a distribution parameter and is a measure of the interaction of the holdup and velocity distribution; C1 is the weighted average drift velocity, accounting for the local slip, UG and UL are the gas and liquid velocities, respectively , εG is the gas holdups and jGL is the drift flux.
It has been determined that (for the two sparger employed) the transition point does not depend on the pore size. It is also evident that an increase in liquid phase viscosity shifts the transition point to smaller higher velocities. The only
International Journal of Chemical Engineering and Applications, Vol. 3, No. 1, February 2012
28

exception is water whose transition velocity is lower than of butanol solutions despite its higher viscosity. This behavior can be attributed to the simultaneous effects of both relatively low viscosity and high surface tension. The difference between calculated transition velocities and the ones reported in the literature is not expected since it has been reported that difference in size and type of the distributor shifts the limit of the homogenous regime. The rise velocity of light weight particles decreases with increase in viscosity of the liquid.
0.00 0.02 0.04 0.06 0.08 0.10 0.12
0.40
0.45
0.50
0.55
0.60
0.65
0.70
0.75
0.80
0.85
water-air glycerin-air butanol-air
UG
S/Eg
UGS (m/s)
Fig. 8. Plot of superficial velocity on fractional gas holdup using square
pitch sparger.
III. RESULT INTERPRETATION When air bubbles travel through a bed of water and light
weight particles travel through a bed of different liquids such as water, butanol (1.5%) and glycerin (50%) its rise velocity depends on the diameter, as the diameter increases the air bubble become flattened ellipsoids or may oscillate from oblate to prolate form. The drag coefficient increases with Reynolds number, and the terminal velocity may go through a maximum with increasing diameter in both the cases. This is shown in Fig. 10 for air bubbles and light weight particles moving through quiescent liquid such as water, butanol (1.5%) and glycerin (50%). The relative velocities are said to be slightly lower than those for turbulently flowing liquids. Various published results, however, for single air bubbles in water do not agree well with one another, probably because of differences in water purity, wall effects, and measurement techniques. A stream of bubbles formed in rapid succession at a sparger rises more rapidly than a single bubble, since the bubbles cause an upward flow of liquid in the central region. A similar effect is found for bubbles formed at a vertical electrode in an electrolysis cell. Bubbles in a swarm distributed uniformly over the cross section of the apparatus generally rise more slowly than single bubbles because of the hindered settling effect. Light weight particles when released at bottom section of bubble column its rise velocity is low as compared to air bubbles, but when it travels to the middle section of bubble column rise velocity increases sharply and again in the top section it become steady. This may be because of drag exerted by the liquid on the light weight particles and the diameter is not changing like air
bubbles. In some cases higher average velocities have been found for swarms of bubbles in a small column, but this may have been due to occasional large bubbles or slugs of gas rising up the center. The drag exerted by the liquid on the light weight particles decreases as the Reynolds number increases [9].
IV. CONCLUSION In bubble column reactor design the homogeneous flow
regime is usually the most desirable, because it enhances theefficiency of the equipment by providing a greater gas–liquid interfacial area. For this regime new data concerning average gas holdup values, bubble size distributions and Sauter diameters are given for a number of liquids covering a range of surface tension and viscosity values. It was found that bubble rise velocity depends on the gas flow rate and is affected by the liquid properties and that an increase in gas flow rate increases bubble collision probability resulting in decreased bubble rise velocity. An increase in liquid viscosity favors larger bubble formation by decreasing turbulence, a fact that both promotes bubble coalescence and hinders breakage. On the other hand, an increase in liquid surface tension favors small bubble formation by promoting breakage and demoting coalescence. The bubble size distribution data are generally unimodal. Only for the relatively high-viscosity liquids a second peak arises as a result of bubble coalescence, and therefore the data are best fitted by the summation of two normal distribution functions [10], [11]. It is found that for the light weight particles rise velocity increases with diameter (up to 10 mm) . An attempt was made to formulate that would permit the prediction of rise velocity, a variable that greatly affect the bubble column operation. From the visual observations and the careful inspection of the experimental results (from various investigators) it can be concluded that the rise velocity value is the result of the interaction of several parameters, the most important of which are the superficial velocity, the physical properties of the liquid phase (i.e., surface tension, viscosity)and the column cross .
Consequently, future experimental work must be focused on the phenomena occurring onto the sparger surface with the intention to gain mechanisms.
Fig. 9. Rise velocity of air bubbles in water [source j.l.l. baker and B.T. chao, aiche J., 11:268]
International Journal of Chemical Engineering and Applications, Vol. 3, No. 1, February 2012
29
0 2 4 6 8 100.05
0.10
0.15
0.20
0.25
0.30
0.35
0.40
0.45
0.50
0.55
0.60
J.L.L. Baker and B.T. Chao Water-LWP Glycerin-LWP Butanol-LWP
Ris
e V
eloc
ity (m
/s)
Bubble/ Light Weight Particle Diameter (m x 10-3)
Fig. 10. Plot of air bubbles and LWP rise velocity verses diameter of
bubbles and LWP
0 1000 2000 3000 4000 5000 6000
0.5
1.0
1.5
2.0
2.5
3.0
Water-LWP Glycerin-LWP Butanol-LWP
Dra
g C
oeffi
cien
t (C
D)
Reynold Number (Rep)
Fig. 11. Plot of drag coefficient with Reynolds number of LWP
ACKNOWLEDGEMENT This work was done by Mr. S.M. Walke(Research
Scholar) as a part of his doctoral programme during June 2008 to July 2011, at the Department of Chemical Engineering, Dr. Babasaheb Ambedkar Technological University, Lonere, under the guidance of Professor V.S. Sathe. We are thankful to the authorities at BATU; for providing all facilities for completing this work.
REFERENCES [1] A. Obeng, V. A.Penny, and W. R. Armenante, Handbook of
Industrial Mixing: Science and Practice, Hoboken, NJ: Wiley-Interscience, 2004, pp. 543-584.
[2] M. C. Ruzicka, J. Drahos, P. C. Mena, and J. A. Teixeira, “Effect of viscosity on homogeneous–heterogeneous regime transition in bubble columns,” Chemical Engineering Journal, vol. 96. pp. 15–22, 2002.
[3] J. B. J oshi, V. S .Vitankar, Kulkarni, A. A. Dhotre, and M. T, K. Ekambara, “Coherent flow structures in bubble column reactors” Chemical Engineering Science, Vol 57, pp. 3157–3183, 2002.
[4] A. A. Mouza, G. K. Dalakoglou, and S.V. Paras, “Effect of liquid properties on the performance of bubble column reactors with fine pore spargers,” Chemical Engineering Science 60, pp. 1465-1475, 2005.
[5] M. C. Ruzicka, J. Drahos, P. C. Mena, and J. A. eixeira, “Effect of viscosity on homogeneous–heterogeneous regime transition in bubble columns,” Chemical Engineering Journal, 96. pp. 15–22, 2002.
[6] D. Pinelli, G. Montante, and F. Magelli, “Dispersion coefficients and settling velocities of solids in slurry vessels stirred with different types of impellers,” Chemical Engineering Science, vol. 59, pp. 3081-3089, 2004.
[7] M. Polli, M. Di Stanislao, R. Bagatin, E. AbuBakr, and M. Masi, “Bubble size distribution in the sparger region of bubble columns” Chemical Engineering Science, vol.57, pp. 197–205, 2002.
[8] N. Zuber, Findlay, “Average volumetric concentration in twophase flow systems” Journal of Heat Transfer, vol. 87, pp. 453–468, 1967.
[9] J. L. L. Baker and B.T. Chao, “An experimental investigation of air bubble motion in a turbulent water stream,” AIChE Journal. vol. 11, no. 2, pp. 268–273, 1965.
[10] M. Kaji, T. Sawai, K. Mori, and M. Iguchi, “Behaviors of bubble formation from a bottom porous nozzle bath” in Proc. of the 5th ExHFT, Thessaloniki, Greece, pp. 25-31. 2001.
[11] N. Harnby, M. F. Edwards, and A. W. Nienow, Mixing in the Process Industries, 2nd edition, London: Bitterworth-Heinemann, Chapter 16, pp. 364-365. 1998.
Santosh M Walke has received B.Tech Chemical Engineering (1996) from Dr. B A. Technological University, Lonere, India and ME Chemical Engineering (2006) from Shivaji University, India. He also received MBA in Marketing Management (1999) from Pune University. Currently he is persuing PhD in Chemical Engineering from Dr. B A. Technological University, Lonere, India. He is working as Associate Professor in Bharati
Vidyapeeth College of Engineering, Navi Mumbai. He is a member of Board of Studies, University of Mumbai (2006-2011). His research is focused on fluid dynamics. His Journal papers are “Review of gas holdup characteristics of bubble column reactors”, International Journal of Chemical Engineering Research. Volume 3, Number 1 (2011), pp. 71-80.
Vivek S Sathe has received B. E. degree in Chemical Engineering from Pravara Rural Engineering College, Pravaranagar-India in 1991, M.Tech. degree in Chemical Engineering from Indian Institute of Technology, Bombay-India in 1994 and PhD degree from Indian Institute of Technology Madras in 2006. He is currently working at Dr.Babasaheb Ambedkar Technological University, Lonere-India as an Associate Professor in Chemical Engineering Department.
International Journal of Chemical Engineering and Applications, Vol. 3, No. 1, February 2012
30