Embed Size (px)
Citation preview
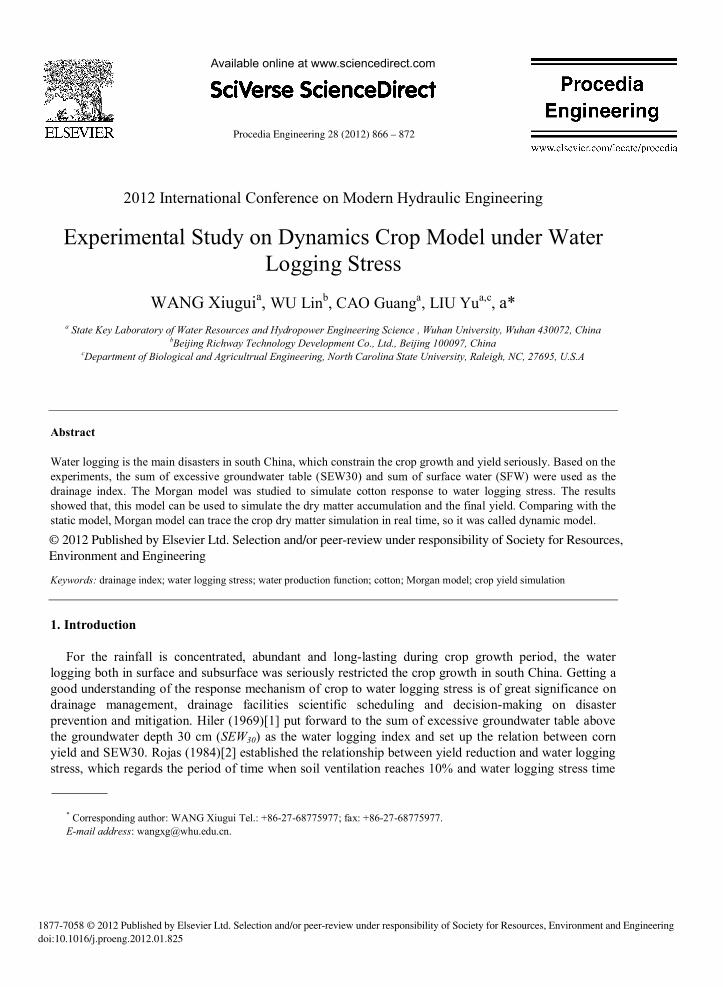
Procedia Engineering 28 (2012) 866 – 872
1877-7058 © 2012 Published by Elsevier Ltd. Selection and/or peer-review under responsibility of Society for Resources, Environment and Engineering doi:10.1016/j.proeng.2012.01.825
Available online at www.sciencedirect.com
Procedia
Engineering Procedia Engineering 00 (2011) 000–000
www.elsevier.com/locate/procedia
2012 International Conference on Modern Hydraulic Engineering
Experimental Study on Dynamics Crop Model under Water Logging Stress
WANG Xiuguia, WU Linb, CAO Guanga, LIU Yua,c, a* a State Key Laboratory of Water Resources and Hydropower Engineering Science , Wuhan University, Wuhan 430072, China
bBeijing Richway Technology Development Co., Ltd., Beijing 100097, China cDepartment of Biological and Agricultrual Engineering, North Carolina State University, Raleigh, NC, 27695, U.S.A
Abstract
Water logging is the main disasters in south China, which constrain the crop growth and yield seriously. Based on the experiments, the sum of excessive groundwater table (SEW30) and sum of surface water (SFW) were used as the drainage index. The Morgan model was studied to simulate cotton response to water logging stress. The results showed that, this model can be used to simulate the dry matter accumulation and the final yield. Comparing with the static model, Morgan model can trace the crop dry matter simulation in real time, so it was called dynamic model. © 2011 Published by Elsevier Ltd. Keywords: drainage index; water logging stress; water production function; cotton; Morgan model; crop yield simulation
1. Introduction
For the rainfall is concentrated, abundant and long-lasting during crop growth period, the water logging both in surface and subsurface was seriously restricted the crop growth in south China. Getting a good understanding of the response mechanism of crop to water logging stress is of great significance on drainage management, drainage facilities scientific scheduling and decision-making on disaster prevention and mitigation. Hiler (1969)[1] put forward to the sum of excessive groundwater table above the groundwater depth 30 cm (SEW30) as the water logging index and set up the relation between corn yield and SEW30. Rojas (1984)[2] established the relationship between yield reduction and water logging stress, which regards the period of time when soil ventilation reaches 10% and water logging stress time
* Corresponding author: WANG Xiugui Tel.: +86-27-68775977; fax: +86-27-68775977. E-mail address: [email protected].
© 2012 Published by Elsevier Ltd. Selection and/or peer-review under responsibility of Society for Resources, Environment and Engineering
867WANG Xiugui et al. / Procedia Engineering 28 (2012) 866 – 8722 Wang Xiugui, et al/ Procedia Engineering 00 (2011) 000–000
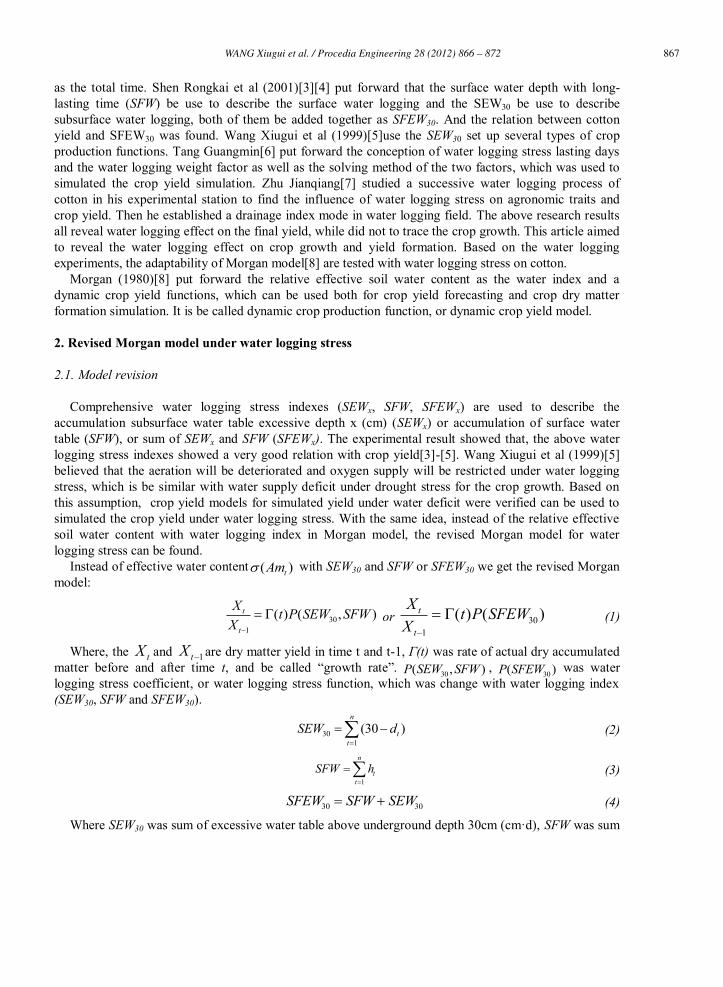
as the total time. Shen Rongkai et al (2001)[3][4] put forward that the surface water depth with long-lasting time (SFW) be use to describe the surface water logging and the SEW30 be use to describe subsurface water logging, both of them be added together as SFEW30. And the relation between cotton yield and SFEW30 was found. Wang Xiugui et al (1999)[5]use the SEW30 set up several types of crop production functions. Tang Guangmin[6] put forward the conception of water logging stress lasting days and the water logging weight factor as well as the solving method of the two factors, which was used to simulated the crop yield simulation. Zhu Jianqiang[7] studied a successive water logging process of cotton in his experimental station to find the influence of water logging stress on agronomic traits and crop yield. Then he established a drainage index mode in water logging field. The above research results all reveal water logging effect on the final yield, while did not to trace the crop growth. This article aimed to reveal the water logging effect on crop growth and yield formation. Based on the water logging experiments, the adaptability of Morgan model[8] are tested with water logging stress on cotton.
Morgan (1980)[8] put forward the relative effective soil water content as the water index and a dynamic crop yield functions, which can be used both for crop yield forecasting and crop dry matter formation simulation. It is be called dynamic crop production function, or dynamic crop yield model.
2. Revised Morgan model under water logging stress
2.1. Model revision
Comprehensive water logging stress indexes (SEWx, SFW, SFEWx) are used to describe the accumulation subsurface water table excessive depth x (cm) (SEWx) or accumulation of surface water table (SFW), or sum of SEWx and SFW (SFEWx). The experimental result showed that, the above water logging stress indexes showed a very good relation with crop yield[3]-[5]. Wang Xiugui et al (1999)[5] believed that the aeration will be deteriorated and oxygen supply will be restricted under water logging stress, which is be similar with water supply deficit under drought stress for the crop growth. Based on this assumption, crop yield models for simulated yield under water deficit were verified can be used to simulated the crop yield under water logging stress. With the same idea, instead of the relative effective soil water content with water logging index in Morgan model, the revised Morgan model for water logging stress can be found.
Instead of effective water content ( )tAm with SEW30 and SFW or SFEW30 we get the revised Morgan model:
301
( ) ( , )t
t
X t P SEW SFWX
or 301
( ) ( )t
t
X t P SFEWX
(1)
Where, the tX and 1tX are dry matter yield in time t and t-1, Γ(t) was rate of actual dry accumulated matter before and after time t, and be called “growth rate”. 30( , )P SEW SFW ,
30( )P SFEW was water logging stress coefficient, or water logging stress function, which was change with water logging index (SEW30, SFW and SFEW30).
301
(30 )n
tt
SEW d
(2)
1
n
tt
SFW h
(3)
30 30SFEW SFW SEW (4)
Where SEW30 was sum of excessive water table above underground depth 30cm (cm·d), SFW was sum
868 WANG Xiugui et al. / Procedia Engineering 28 (2012) 866 – 872 Wang Xiugui, et al/ Procedia Engineering 00 (2011) 000–000 3
of surface water table (cm·d), SFEW30 was sum of SEW30 and SFW. n was study period (d);ht was average surface water depth in the t day (cm), dt was the groundwater depth in water logging period (cm), dt=30 cm, when dt﹥30cm;dt=0 when dt=0. SFEW30 was comprehensive water logging accumulating depth (cm).
The constrain of 30( , )P SEW SFW and 30( )P SFEW are: (1) single increase. (2) 30( , )P SEW SFW =1, 30( )P SFEW =1;when SEW30=0, SFW=0 or SFEW30=0.
The final crop dry mater can be expressed with the following general formulas:
30 01
( ) ( ) ( , )n
Dt
X D T t P SEW SFW X
(5)
30 01
( ) ( ) ( )n
Dt
X D T t P SFEW X
(6)
Where t is the crop stage or observation stage.
2.2. Determination of 30( , )P SEW SFW and 30( )P SFEW
From the above analysis it can be found that: with 30( , )P SEW SFW and
30( )P SFEW , the water logging
can be related to the crop dry matter. While the Γ(t) 30( , )P SEW SFW and 30( )P SFEW and their relation should be determined in specific form. The following power functions were assumed:
30( , ) ( )P SEW SFW t (7)
30( ) ( )P SFEW t (8)
The was assumed with following liner functions:
30( , ) 1SEW SFW (9)
30( ) 1SFEW (10)
where:
30 30( , )SEW SFW aSEW bSFW c (11)
' '30 30( )SFEW a SFEW b (12)
The above formulas were put into (5) and (6), the following formula can be gotten:
30( , )0
1
( ) ( )n
SEW SFWD
t
X D T t X
(13)
30( )0
1
( ) ( )n
SFEWD
t
X D T t X
(14)
Where: SEW30, SFW and SFEW30 can be obtained with daily water table observation. 30( , )SEW SFW and 30( )SFEW are water logging response functions. Formula (13) was revised Morgan model with both surface and subsurface water logging indexes (SEW30, SFW), and formula (14) was revised Morgan model with comprehensive water logging index (SFEW30).
3. Materials and methods
869WANG Xiugui et al. / Procedia Engineering 28 (2012) 866 – 8724 Wang Xiugui, et al/ Procedia Engineering 00 (2011) 000–000
Experiments were carried out in 22 lysimeters at Irrigation and Drainage Comprehensive Experimental Station in Wuhan University from year 2008 to 2009. There is a net area of 4m2 (2m × 2m) with a depth of 3.0m for each lysimeters, including 0.3m of filter layer in the bottom of the lysimeter, while the remaining 2.7m space are filled with disturbed light loam soil with the dry bulk density of 1.41g/cm3. The soil surface is about 0.1m away from the top of lysimeter sleeve.Cotton is the study plant, they are transplanted into every lysimeter in late May, and there are 6 plants in each lysimeter.
3.1. The water logging treats
Two soil moisture conditions are considered in the present study, which are surface water logging and subsurface water logging. In this experiment, different water logging stress treatments were carried out in different lysimeters. All treatments to lysimeters in the year 2008 and 2009 are presented in Table.1. The „surface‟ column in the table represents the lasting days where there is 10-cm surface water in relative lysimeters. And the „subsurface‟ column represents the lasting days where the water table is in the depth of 20-cm from the soil surface. After that, the water table will be lowered to depth of 80-cm from the soil surface.
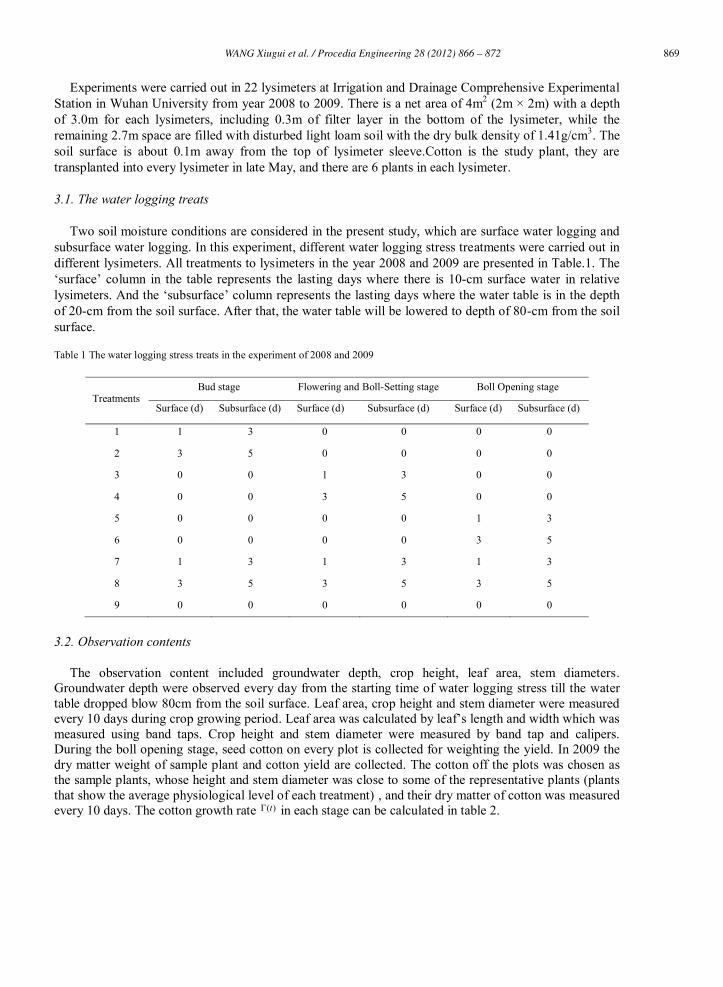
Table 1 The water logging stress treats in the experiment of 2008 and 2009
Treatments Bud stage Flowering and Boll-Setting stage Boll Opening stage
Surface (d) Subsurface (d) Surface (d) Subsurface (d) Surface (d) Subsurface (d)
1 1 3 0 0 0 0
2 3 5 0 0 0 0
3 0 0 1 3 0 0
4 0 0 3 5 0 0
5 0 0 0 0 1 3
6 0 0 0 0 3 5
7 1 3 1 3 1 3
8 3 5 3 5 3 5
9 0 0 0 0 0 0
3.2. Observation contents
The observation content included groundwater depth, crop height, leaf area, stem diameters. Groundwater depth were observed every day from the starting time of water logging stress till the water table dropped blow 80cm from the soil surface. Leaf area, crop height and stem diameter were measured every 10 days during crop growing period. Leaf area was calculated by leaf‟s length and width which was measured using band taps. Crop height and stem diameter were measured by band tap and calipers. During the boll opening stage, seed cotton on every plot is collected for weighting the yield. In 2009 the dry matter weight of sample plant and cotton yield are collected. The cotton off the plots was chosen as the sample plants, whose height and stem diameter was close to some of the representative plants (plants that show the average physiological level of each treatment) , and their dry matter of cotton was measured every 10 days. The cotton growth rate ( )t in each stage can be calculated in table 2.
870 WANG Xiugui et al. / Procedia Engineering 28 (2012) 866 – 872 Wang Xiugui, et al/ Procedia Engineering 00 (2011) 000–000 5
Table 2 the cotton growth rate Г(t) in 2009
Г(1) Г(2) Г(3) Г(4) Г(5) Г(6) Г(7) Г(8)
2.076 1.899 1.737 1.657 1.441 1.318 1.223 1.105
3.3. Model calibration
In revised Morgan model both (13) and (14), the parameters should be estimated. First, based on the daily water table both surface and subsurface, the daily SEW30, SFW and SFEW30
should be calculated with formula (2), (3) and (4), and get vale of SEW30, SFW and SFEW30 in each stage of crop.
Then, taking the logarithm in equation (13) and (14), the following lineal form can be gotten:
30 301 1
( , ) ln ( ) ( ) ln ( )n n
ii
SEW SFW t aSEW bSFW c t
(15)
30 301 1
( ) ln ( ) ( ) ln ( )n n
ii
SFEW t a SFEW b t
(16)
Based on the experimental data, the parameters a, b, c, a’and b’ can be gotten with multiple regression method.
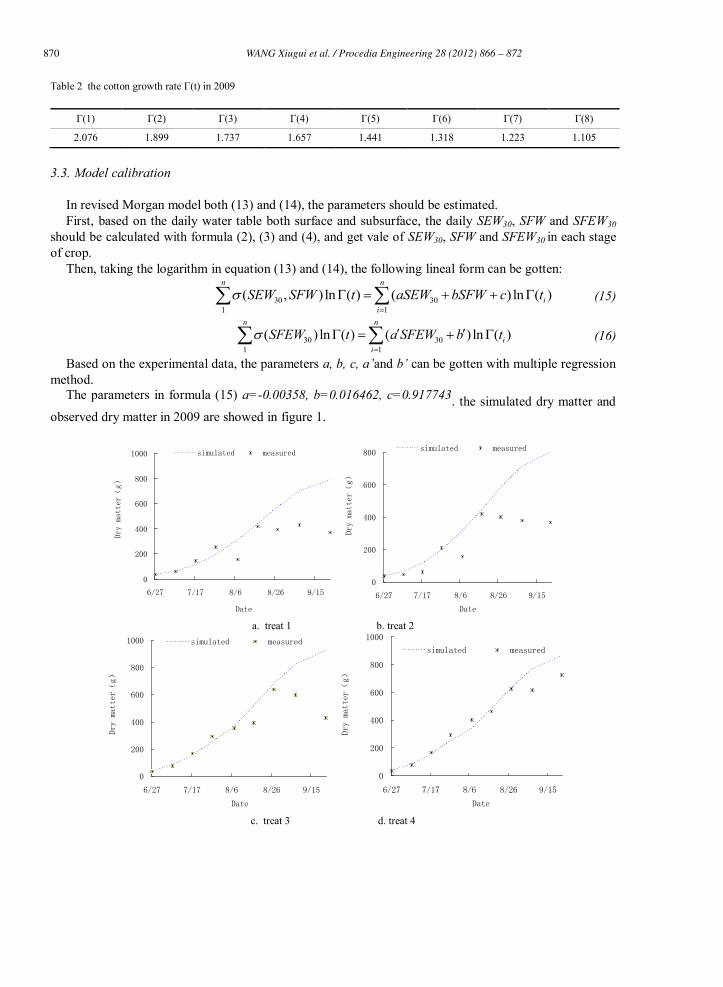
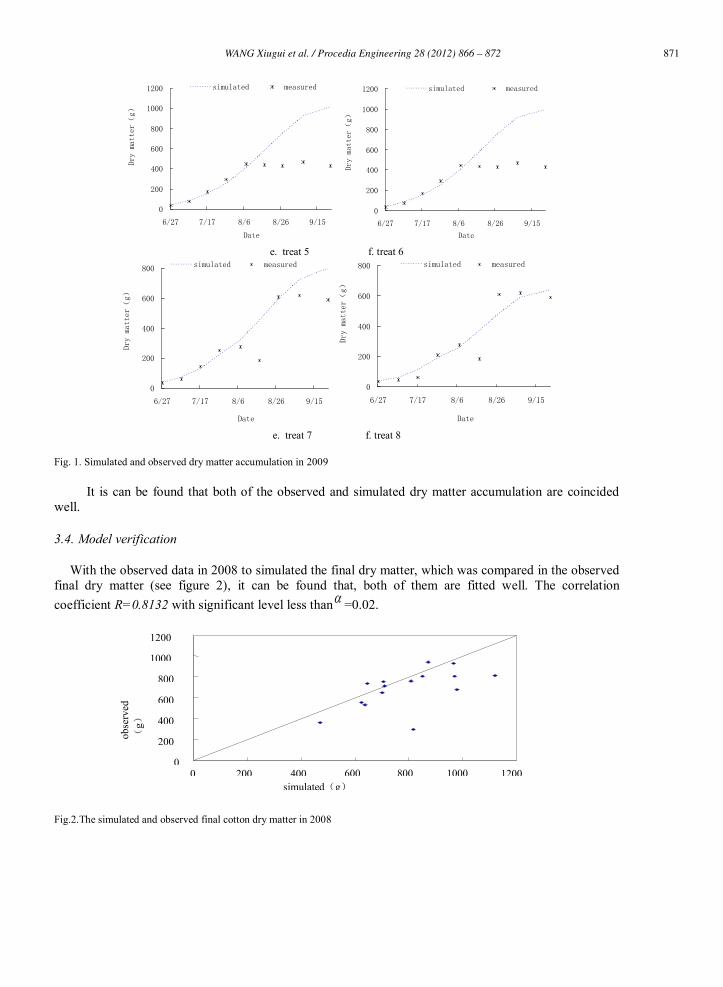
The parameters in formula (15) a=-0.00358, b=0.016462, c=0.917743. the simulated dry matter and observed dry matter in 2009 are showed in figure 1.
0
200
400
600
800
1000
6/27 7/17 8/6 8/26 9/15
Date
Dry matter(g)
simulated measured
0
200
400
600
800
6/27 7/17 8/6 8/26 9/15
Date
Dry matter(g)
simulated measured
a. treat 1 b. treat 2
0
200
400
600
800
1000
6/27 7/17 8/6 8/26 9/15
Date
Dry matter(g)
simulated measured
0
200
400
600
800
1000
6/27 7/17 8/6 8/26 9/15
Date
Dry matter(g)
simulated measured
c. treat 3 d. treat 4
871WANG Xiugui et al. / Procedia Engineering 28 (2012) 866 – 8726 Wang Xiugui, et al/ Procedia Engineering 00 (2011) 000–000
0
200
400
600
800
1000
1200
6/27 7/17 8/6 8/26 9/15
Date
Dry matter(g)
simulated measured
0
200
400
600
800
1000
1200
6/27 7/17 8/6 8/26 9/15
Date
Dry matter(g)
simulated measured
e. treat 5 f. treat 6
0
200
400
600
800
6/27 7/17 8/6 8/26 9/15
Date
Dry matter(g)
simulated measured
0
200
400
600
800
6/27 7/17 8/6 8/26 9/15
Date
Dry matter(g)
simulated measured
e. treat 7 f. treat 8
Fig. 1. Simulated and observed dry matter accumulation in 2009
It is can be found that both of the observed and simulated dry matter accumulation are coincided well.
3.4. Model verification
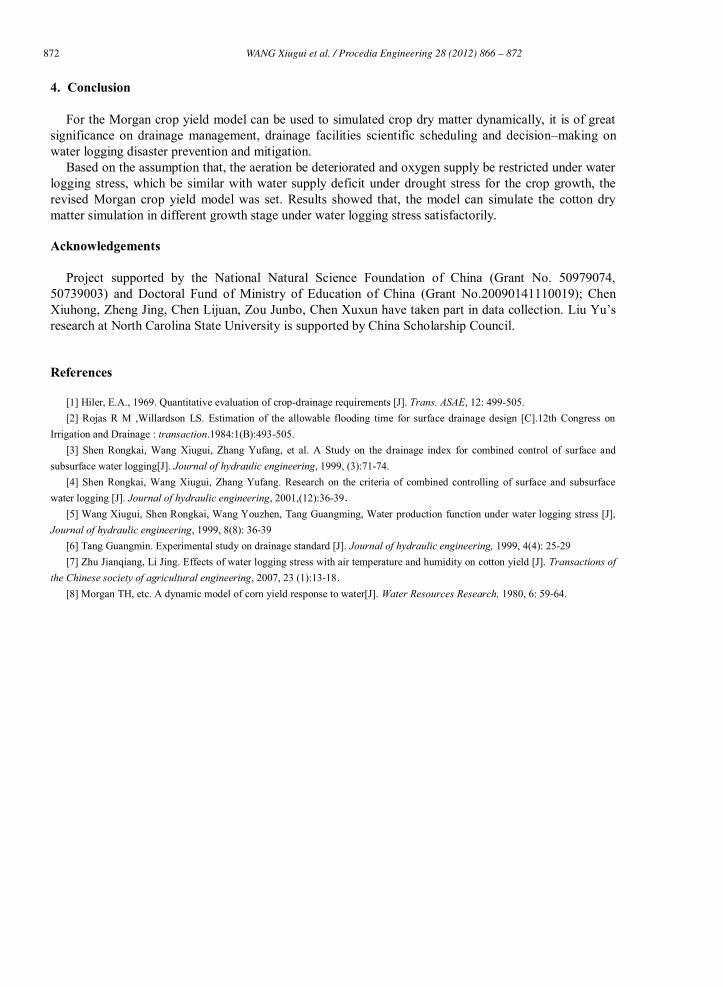
With the observed data in 2008 to simulated the final dry matter, which was compared in the observed final dry matter (see figure 2), it can be found that, both of them are fitted well. The correlation coefficient R=0.8132 with significant level less than =0.02.
Fig.2.The simulated and observed final cotton dry matter in 2008
600 800
0 200
0 200 400 1200
400
1000 1200
obse
rved
(g)
800 simulated(g)
600 1000
872 WANG Xiugui et al. / Procedia Engineering 28 (2012) 866 – 872 Wang Xiugui, et al/ Procedia Engineering 00 (2011) 000–000 7
4. Conclusion
For the Morgan crop yield model can be used to simulated crop dry matter dynamically, it is of great significance on drainage management, drainage facilities scientific scheduling and decision–making on water logging disaster prevention and mitigation.
Based on the assumption that, the aeration be deteriorated and oxygen supply be restricted under water logging stress, which be similar with water supply deficit under drought stress for the crop growth, the revised Morgan crop yield model was set. Results showed that, the model can simulate the cotton dry matter simulation in different growth stage under water logging stress satisfactorily.
Acknowledgements
Project supported by the National Natural Science Foundation of China (Grant No. 50979074, 50739003) and Doctoral Fund of Ministry of Education of China (Grant No.20090141110019); Chen Xiuhong, Zheng Jing, Chen Lijuan, Zou Junbo, Chen Xuxun have taken part in data collection. Liu Yu‟s research at North Carolina State University is supported by China Scholarship Council.
References
[1] Hiler, E.A., 1969. Quantitative evaluation of crop-drainage requirements [J]. Trans. ASAE, 12: 499-505. [2] Rojas R M ,Willardson LS. Estimation of the allowable flooding time for surface drainage design [C].12th Congress on
Irrigation and Drainage : transaction.1984:1(B):493-505. [3] Shen Rongkai, Wang Xiugui, Zhang Yufang, et al. A Study on the drainage index for combined control of surface and
subsurface water logging[J]. Journal of hydraulic engineering, 1999, (3):71-74. [4] Shen Rongkai, Wang Xiugui, Zhang Yufang. Research on the criteria of combined controlling of surface and subsurface
water logging [J]. Journal of hydraulic engineering, 2001,(12):36-39. [5] Wang Xiugui, Shen Rongkai, Wang Youzhen, Tang Guangming, Water production function under water logging stress [J],
Journal of hydraulic engineering, 1999, 8(8): 36-39 [6] Tang Guangmin. Experimental study on drainage standard [J]. Journal of hydraulic engineering, 1999, 4(4): 25-29 [7] Zhu Jianqiang, Li Jing. Effects of water logging stress with air temperature and humidity on cotton yield [J]. Transactions of
the Chinese society of agricultural engineering, 2007, 23 (1):13-18. [8] Morgan TH, etc. A dynamic model of corn yield response to water[J]. Water Resources Research, 1980, 6: 59-64.