Embed Size (px)
Citation preview

J. Cent. South Univ. (2015) 22: 4396−4413 DOI: 10.1007/s11771-015-2988-6
Experimental study on seismic behaviors of steel−concrete composite frames
QI Jing-jing(戚菁菁)1, JIANG Li-zhong(蒋丽忠)2
1. School of Civil Engineering, Hunan University of Science and Technology, Xiangtan 411201, China; 2. Department of Civil Engineering and Architecture, Central South University, Changsha 410075, China
© Central South University Press and Springer-Verlag Berlin Heidelberg 2015
Abstract: Steel−concrete composite frames are seeing increased use in earthquake region because of their excellent structural characteristics, including high strength, stiffness, and good ductility. However, there exist gaps in the knowledge of seismic behavior and the design provisions for these structures. In order to better understand the seismic behaviors of composite frame systems, eight steel−concrete composite frames were designed. These composite frames were composed of steel−concrete composite beams and concrete filled steel tube columns. The axial compression ratio of column, slenderness ratio and linear stiffness ratio of beam to column were selected as main design parameters. The low reversed cyclic loading tests of composite frame system were carried out. Based on test results, the seismic behaviors of composite frames such as failure mode, hysteresis curve, strength degradation, rigidity degradation, ductility and energy dissipation were studied. Known from the test phenomenon, the main cause of damage is the out-of-plane deformation of steel beam and the yielding destruction of column heel. The hysteretic loops of composite frame appear a spindle shape and no obvious pinch phenomenon. The results demonstrate that this type of composite frame has favorable seismic behaviors. Furthermore, the effects of design parameters on seismic behaviors were also discussed. The results of the experiment show that the different design parameter has different influence rule on seismic behaviors of composite frame. Key words: composite frame; steel−concrete composite beam; concrete filled steel tube column; seismic behavior; axial compression ratio; slenderness ratio; linear stiffness ratio
1 Introduction
At present, with the deepening of experimental study and the improvement of design method of concrete filled steel tubular components and steel−concrete composite structures, the composite frame systems composed of concrete filled steel tubular components and steel−concrete composite structures have been spread and applied to multi-story and high-rise buildings. For example, two buildings in England Southampton University adopted semi-rigid composite frame structures. In China, there are also many composite frame buildings, such as Dongguan Youth Activity Center, Zhuhai Chuangye Building, Changsha Jinxiu Huatian Hotel. Known from domestic and overseas research results, the composite frame has many advantages: factory production, prefabricated construction, short construction time, high bearing capacity, good ductility, preventing and fighting natural adversities, good comprehensive economic performance etc.
A significant amount of theoretical and experimental research on composite members (such as steel−concrete composite beam, concrete-filled steel tube
columns) has been performed over the past several decades [1−5]. These studies have demonstrated the excellent seismic behavior of composite members and have been used in the development of current design provisions. Then, the researchers have gradually developed the seismic behavior research on steel− concrete composite frame systems and obtained a series of results. CUONG and KIM [6] proposed a fiber-hinge beam-column element considering geometric and material nonlinearities for modeling steel−concrete composite structures. CHIOREAN [7] presented an efficient computer method for nonlinear inelastic analysis of three-dimensional composite steel-concrete framework. The proposed formulation is intended to model the geometrically nonlinear inelastic behavior of composite frame elements using only one element per physical member. CHELLINI et al [8] used finite element model updating procedures based on vibration measurements to detect, assess and quantify the structural damage of a high ductile steel−concrete composite frame subjected to increasing seismic damage. NIE et al [9] presented a mixed finite-element model combining the fibered beam and layered shell elements using the general finite-element program MSC.MARC
Foundation item: Project(12K104) supported by Scientific Research Fund of Hunan Provincial Education Department, China; Project(E51254) supported by
Scientific Research Foundation for the Doctoral Program of Hunan University of Science and Technology, China Received date: 2014−09−29; Accepted date: 2015−06−20 Corresponding author: QI Jing-jing, PhD; Tel: +86−731−58290384; E-mail: [email protected]

J. Cent. South Univ. (2015) 22: 4396−4413
4397
(2005r2). The proposed modeling procedure was intended for integrated elasto-plastic analysis of fully connected steel−concrete composite frames subjected to the combined action of gravity and monotonic lateral loads. WANG et al [10] developed a steel−concrete composite fiber beam-column model. The composite fiber beam-column model consists of a preprocessor program that is used to divide a composite section into fibers and a group of uniaxial hysteretic material constitutive models coded in the user defined subprogram UMAT in ABAQUS. QI and JIANG [11] established the stiffness matrix of semi-rigidly connected composite beams considering interface slip and derived calculation method for elastic seismic response of composite frame. Based on the calculation programs, the effects of interface slip and semi rigid joint on dynamic characteristics and seismic response were analyzed.
So far, the researchers have conducted several seismic experiments of composite systems. BRACONI et al [12] presented a large experimental campaign carried out on ten steel-concrete composite beam-to-column sub- assemblages and a composite frame. Seismic behavior of specimens in terms of dissipated energy, ductility, over- strength and equivalent viscous damping was executed. XU [13] conducted low cycle reversed horizontal load experiment on a two-span three-layer concrete-filled steel tube column and steel beam plane frame. The experimental results showed that the CFST frame designed according to the current codes may form the beam-hinged failure mechanism under lateral cyclic loads, and its deformation capacity, bearing capacity, ductility and energy dissipation may meet the requirement for seismic design, in which the effective ductility factor of the model frame reached 7.54 and was far greater than the required value of the ordinary ductile frame. WANG et al [14] presented an experiment of a piece of concrete-filled rectangular steel tube frame under low reversed cyclic loading, hysteresis behavior, ductility, energy dissipation and rigidity degeneration were studied systematically. WANG [15] carried out the experimental research on four groups of single-storey single-span composite plane frames (total 12 frames) under both constant axial force and horizontal cyclic loads. The composite plane frames undergoing tests were composed of concrete-filled rectangular steel tube columns and steel beams. HE [16] conducted a pseudo-dynamic test, a quasi-static and a static pushover test on a two-story and one and a half bay frame utilizing sub-structure methodology, with composite steel beams and concrete filled steel tube(CFST) columns connected by high-strength bolts and end plates. The 4:7 scale sub-assemblage frame simulated a portion of a 10-story and 3-span plane frame. Seismic performance of the CFST composite frame including failure pattern,
displacement response, hysteretic behavior and energy dissipation capability was investigated.
In reviewing previous studies on composite frames, it can be seen that the steel−concrete composite frame systems take diversified forms. Most of researchers concentrated their studies on the composite frames composed of concrete filled steel tube column and steel beam. And the quantity and the changed parameters of seismic test specimen are unsystematic. However, the research conducted by both domestic and overseas researchers on seismic behaviors of composite frame composed of CFST and steel−concrete composite beam is rare. Steel−concrete composite beam is a kind of beam which consists of concrete slab and steel beam together through studs. It has been verified that steel−concrete composite beam has more favorable seismic behavior comparing with steel beam. Thus, it is expected that the composite frame composed of CFST and steel−concrete composite beam would have better seismic behavior than that composed of CFST and steel beam. In order to study deeply the seismic behavior of this type composite frame in a wider reference range, eight composite frame structures (composed of concrete filled steel tube column and steel−concrete composite beam) were designed in this work. In this test, the axial compression ratio of column (n), slenderness ratio (λ) and linear stiffness ratio of beam to column (i) were considered main parameters. The low reversed cyclic loading tests of composite frame system were carried out. This work seeks to investigate all kinds of seismic behaviors, such as failure mode, hysteresis curve, strength degradation, rigidity degradation, ductility and energy dissipation of this kind of composite frame. 2 Experiment
A 1/2 reduced scale single-storey single-span frame model was considered in this test because of the following two reasons: Firstly, single-storey single-span frame is the basic element of frame systems. It is simple and representative. Secondly, the reduced scale model is used out of considerations for test equipment capability and economic aspect. The design of structure model should satisfy the similar demands of physics, geometry and boundary conditions. Based on structural mechanics, the similar relationship is established according to basic equations. The similar parameters are listed in Table 1. Abided by the earthquake-proof requirements of strong column and weak beam as well as strong joint and weak component, the test model was designed according to specification for design and construction of concrete- filled steel tubular structures CECS28:90 [17], specification for design of steel−concrete composite structure DL/T 5085—1999 [18] and code for seismic

J. Cent. South Univ. (2015) 22: 4396−4413
4398
design of buildings GB 50011—2010 [19]. Table 1 Similarity relations of test model
Physical property Physical parameter Similarity relation
Geometric relation
Length 1/2
Linear displacement 1/2
Area 1/4
Angular displacement 1
Strain 1
Material relation
Strength 1
Elastic modulus 1
Stress 1
Load relation
Concentrated load 1/4
Linear load 1/2
Area load 1
Moment 1/8
Shear force 1/4
The detailed information of eight frames in this test
is listed in Table 2. The frame model, its component section, joint and pedestal are shown in Figs. 1−4.
In this test, C30 concrete was used in composite beam and concrete filled steel tubular column. The gradeⅡ rebar was used as longitudinal reinforcement in concrete slab of composite beam, and the diameter was 8 mm. The hoop reinforcements adopt grade Ⅰrebar and the diameter was 6 mm. There were two kinds of Q235 seamless steel tubes chosen for concrete filled steel
tubular column: d219 mm×6 mm and d245 mm×8 mm. The d13 mm×50 mm stud was used in composite beam as shown in Fig. 2(d). I40 steel beam was used as foundation beam. The foundation beam was connected with heel by high-strength bolts, and fixed on laboratory geosyncline by anchor bolts.
Before making the specimen, the material properties of all the used materials including steel tube, steel beam, steel reinforcement and concrete were tested. Three concrete cube specimens of 150 mm×150 mm×150 mm were made. After 28 d curing, the cubic compressive strength was measured. The elastic modulus of concrete was calculated according to empirical formula in code for design of concrete structures GB 50010—2010 [20] as listed in Table 3. The measured values of material properties of reinforcement bar and steel are listed in Table 4 and Table 5.
This test was carried out on the hydraulic servo structure experiment system in structure laboratory of Central South University. The frame was connected with foundation by anchor bolts. Through the horizontal hydraulic actuator fixed on the reaction wall, the horizontal load was applied to the center line along the beam at column top joint. In order to transfer the hydraulic actuator horizontal load to specimen, there are two ordinary ways: the first way is to transfer the horizontal load through splint and tension rod; the other way is to make the top beam at the top of specimen, then the horizontal load is transferred to specimen through embedded steel pole in the top beam. The first way was
Table 2 Test parameters of frames
Frame
number Component type
Frame dimension Linear stiffness
ratio, i
Axial compression
ratio, n Slenderness ratio, l
Section dimension/mm Length/mm
CSCKJ1 Beam 80×140×9.1×5.5 3750
2.8 0.3 34.7 Column d219×6 1900
CSCKJ2 Beam 80×140×9.1×5.5 3750
1.8 0.3 34.7 Column d245×8 2125
CSCKJ3 Beam 100×200×11.4×7 3750
3.3 0.3 34.7 Column d219×6 1900
CSCKJ4 Beam 80×140×9.1×5.5 3750
2.8 0.5 34.7 Column d219×6 1900
CSCKJ5 Beam 80×140×9.1×5.5 3750
2.8 0.7 34.7 Column d219×6 1900
CSCKJ6 Beam 80×140×9.1×5.5 1500
2.8 0.3 20.0 Column d219×6 1365
CSCKJ7 Beam 80×140×9.1×5.5 3750
2.8 0.3 45.7 Column d219×6 2800
CSCKJ8 Beam 80×140×9.1×5.5 3750
2.8 0.3 52.0 Column d219×6 3549

J. Cent. South Univ. (2015) 22: 4396−4413
4399
Fig. 1 Test model: (a) Elevation view; (b) Field experiment
Fig. 2 Cross section of composite frame components and bar arrangement drawing of concrete slab in composite beam (Unit: mm):
(a) Column section; (b) Steel beam section; (c) Steel−concrete composite beam section; (d) Bar arrangement drawing of concrete slab
in composite beam
chosen in this test. The steel pole was installed along the beam centerline to guarantee the horizontal cyclic reverse loading to transfer effectively. In order to prevent the eccentricity caused by frame lateral sway, the vertical load on column top was exerted by hydraulic jack shown in Figs. 5−6. The 150-mm height cantilevered end at the column top was made so as to eliminate the constraint
caused by vertical load transposition to joint rotation as shown in Fig. 7.
In this test, the following load program was adopted: the vertical compressive force was applied to the top of two columns and the horizontal low cyclic reverse load was exerted gradationally at an end of beam.
1) Loading system of vertical loads.

J. Cent. South Univ. (2015) 22: 4396−4413
4400
Fig. 3 Heel diagram: (a) Plan view; (b) Elevation view
Fig. 4 Heel and joint of test model: (a) Heel; (b) Composite enforced loop joint Table 3 Measure value of C30 concrete strength
Specimen
number
Specimen
dimension/mm3 Peak value of force/kN
Cubic compressive strength/MPa Elastic modulus, Ec/MPa
Measured Average Measured Average
C1 150×150×150 711.41 31.618
31.344
30326
30238 C2 150×150×150 699.05 31.069 30149
C3 150×150×150 705.28 31.346 30239
Table 4 Measured value of reinforcement bar strength
Diameter/mm Yield strength/MPa Ultimate strength/MPa Elastic modulus/MPa
8 556.833 562.566 2.00×10⁵
6 444.512 508.731 1.98×10⁵
Firstly, required vertical load was calculated in accordance with ratio of axial compression stress to strength. It was worth noting that if the deadweight of loading beam was included in calculated axial compression force, it should be deducted from axial compression force when loading. In order to obtain better test results and eliminate the nonuniformity of component interior tissue, firstly, 40% full load was repeatedly exerted twice. Then the required vertical load was applied in three steps. It stopped for 2−3 min after each load step and then the next load step continued.
2) Loading system of horizontal loads. According to Specifications of Testing Methods for
Earthquake Resistant Building (JGJ101—96) [21], load− displacement mix control loading method was adopted. Namely, before specimen yielding (elastic stage), load control was adopted and gradation loading was chosen. After specimen yielding (elastic-plastic stage), displacement control was adopted. The maximum horizontal displacement of specimen column top was selected and its multiple was used as range to control loading. The number of times which the repetitive load is

J. Cent. South Univ. (2015) 22: 4396−4413
4401
Table 5 Material property test of steel (Steel beam, steel tube, steel plate)
Specimen type Specimen number
Dimension (L×b×t)/mm3
Yield strength/MPa
Average value of yield strength/MPa
Ultimate strength/MPa
Average value of ultimate strength/MPa
I14 steel beam
S1-1 200×30×6.30 306.806
290.499
408.661
397.545 S1-2 200×30×6.60 276.712 384.783
S1-3 200×30×6.50 287.949 399.190
I20 steel beam
S2-1 200×30×7.56 298.836
296.448
428.250
403.575 S2-2 200×30×8.00 290.396 382.767
S2-3 200×30×7.80 300.111 399.709
10 steel plate S3-1 200×30×9.70 316.738
312.531 423.069
420.514 S3-2 200×30×10.0 308.323 417.960
219 steel tube
S4-1 200×30×6.00 325.817
335.516
414.944
413.058 S4-2 200×30×6.00 336.611 411.994
S4-3 200×30×6.00 334.121 412.234
245 steel tube
S5-1 200×30×8.40 288.095
301.271
437.301
463.069 S5-2 200×30×8.30 293.976 458.699
S5-3 200×30×8.34 321.742 493.205
Note: S1, S2 are I14 steel beam and I20 steel beam, respectively; S3 is the 10-mm thickness steel plate; S4 is the 219-mm diameter, 6-mm thickness steel tube; S5 is the 245-mm diameter, 8-mm thickness steel tube.
Fig. 5 Loading device of single layer single span frame (Unit: mm)
Fig. 6 Test site
Fig. 7 Vertical loading device

J. Cent. South Univ. (2015) 22: 4396−4413
4402
exerted was determined in accordance with test objective: in elastic stage, each load step circulated positively and negatively once; in elastic-plastic stage, each displacement step circulated positively and negatively thrice. The loading system is shown in Fig. 8.
Fig. 8 Loading system of horizontal load
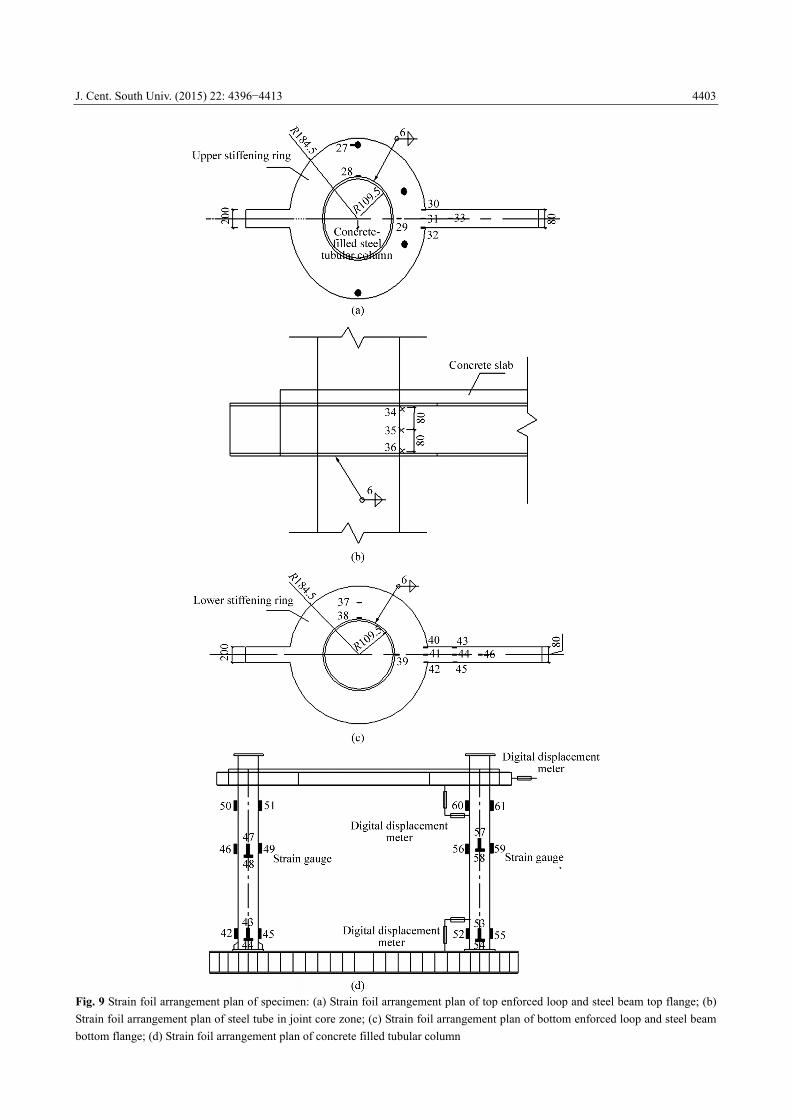
The observation content in this test includes: horizontal load of each circulation, horizontal displacement of column top, strain of enforced loop joint, strain of peg in composite beam concrete slab, strain of steel beam, strain of longitudinal reinforcement in concrete slab, strain of concrete filled tubular column, crack generation and characteristic description etc. The strains of steel−concrete composite beam, concrete filled tubular column and enforced loop joint were collected by DH3815 static strain acquisition system; the horizontal load and its corresponding displacement were obtained directly from hydraulic loading system; the horizontal displacement of column top and other displacements were picked up by displacement meter.
1) Strain of steel reinforcements. For the purpose of measuring the strain of steel
reinforcements in concrete slab, two strain foils whose spacing interval is 100 mm were arranged at both ends of each longitudinal reinforcement (six longitudinal reinforcements in all). Close to the beam end, there were two pegs on which two strain foils were arranged separately. There were 26 strain foils in concrete slab altogether.
2) Strain of steel beam. There were five strain foils on steel beam. One of
them which numbered 33 was arranged on the top flange and 100 mm away from outward flange of enforced loop (shown in Fig. 9(a)). The others were arranged on the bottom flange of steel beam and numbered from 43 to 46. The strain foils 43 to 45 were 100 mm away from outward flange of enforced loop but the 46 strain foil was 200 mm away from it.
3) Strain of concrete filled tubular column (shown in Figs. 9(b)−(d)).
Figure 9(b) shows strain foil arrangement plan of steel tube in joint core zone.
4) Strain of enforced loop. The strain foil arrangement plan of top enforced
loop is shown in Fig. 9(a). The strain foil arrangement plan of bottom enforced loop is shown in Fig. 9(c). 3 Test results and analysis 3.1 Failure mode of composite frame
Because the bearing capacity of specimen CSCKJ-6 exceeded the measuring range of actuator, the specimen was not destroyed. All the other specimens have finished the test successfully. Seven specimens all developed strong column and weak beam failure mode, namely beam-hinge failure.
The destructive process of CSCKJ1, CSCKJ3 and CSCKJ4 described briefly below: Fracture of pegs on frame beam→separation of concrete slab and steel beam →out of plane deformation of steel beam→plumped up of heel steel tube→plumped up slightly of column top steel tube. The main cause of damage was the out-of- plane deformation of frame beam. With the increase of deformation, the frame is failure, as shown in Fig. 10.
The destructive process of CSCKJ2, CSCKJ5, CSCKJ7 and CSCKJ8 described briefly below: Fracture of pegs on frame beam→separation of concrete slab and steel beam→out of plane deformation of steel beam→ plumped up of heel steel tube→plumped up slightly of column top steel tube→cracked at the plump area of heel steel tube. The main cause of damage was the out-of-plane deformation of steel beam and the yielding destruction of heel. Due to the smaller linear rigidity ratio of beam to column, the constraint of beam to column was comparative small. Thus, the heel developed yielding failure, as shown in Fig. 11. 3.2 Horizontal load−displacement hysteretic curve of
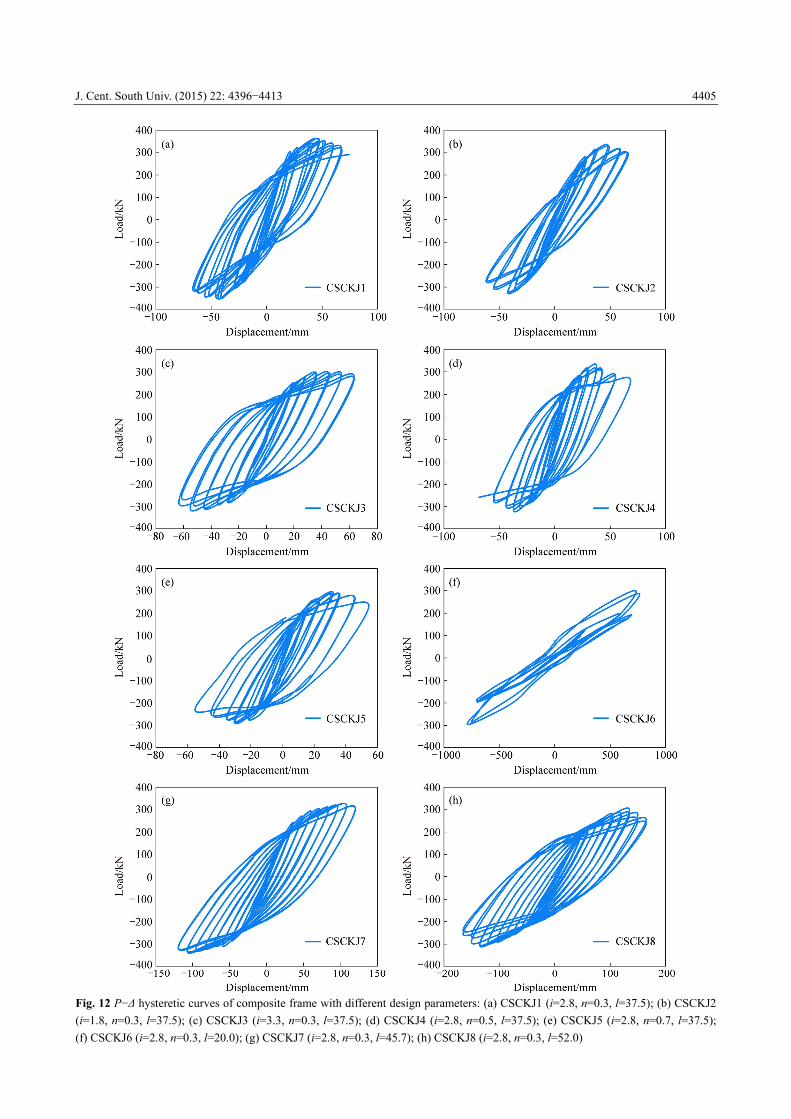
composite frame The horizontal load−displacement (P−Δ) hysteretic
curves of eight composite frames are shown in Fig. 12. It is known from above hysteretic curves of
composite frame with different design parameters: 1) Except for the unfinished frame CSCKJ6, the
hysteretic loops of the other composite frames are comparatively plump. The hysteretic loops appear a spindle shape and no obvious pinch phenomenon. Due to the constraint of steel tube to internal concrete, the crushing and flaking of concrete are restricted effectively. Better energy dissipation of steel−concrete composite frame is proofed, thus it is a predominant earthquake resistant structure.
2) As linear rigidity ratio increases, the hysteresis loops become plumper and the including areas get larger. It demonstrates that the increase of linear rigidity ratio improves the frame energy dissipation. With the increase
J. Cent. South Univ. (2015) 22: 4396−4413
4403
Fig. 9 Strain foil arrangement plan of specimen: (a) Strain foil arrangement plan of top enforced loop and steel beam top flange; (b)
Strain foil arrangement plan of steel tube in joint core zone; (c) Strain foil arrangement plan of bottom enforced loop and steel beam
bottom flange; (d) Strain foil arrangement plan of concrete filled tubular column

J. Cent. South Univ. (2015) 22: 4396−4413
4404
Fig. 10 CSCKJ4 structure failure diagram: (a) Composite beam
interface; (b) Column heel
Fig. 11 CSCKJ7 structure failure diagram: (a) Column top; (b)
Column heel
of linear rigidity ratio, the rigidity degeneration decreases. It means that the more the constraint of beam to column, the smaller the rigidity degeneration.
3) With the increase of column axial compression ratio, the horizontal bearing capacity of frame shows a downward tendency and the area within hysteresis loops
decreases evidently. This shows that the increase of column axial compression ratio will reduce the horizontal bearing capacity and energy dissipation of frame.
4) The horizontal ultimate bearing capacities decline with the increase of slenderness ratio. Under the circumstances, the bearing capacities do not decline significantly, the cycle index by that the structure could suffer increases, the limiting displacements and the energy dissipations augment. Along with the dropping slenderness ratio, the declining speed of horizontal limiting capacity gradually decreases. 3.3 Horizontal load−displacement skeleton curves of
composite frame To join the average peak points of each load or
displacement step on the hysteretic curves, the enveloping curves (namely skeleton curve) are obtained. In this test, the skeleton curves are shown in Fig. 13.
The results of test show that: 1) The skeleton curve shapes of all specimens are
similar to the single loading load−displacement curves and in shape of S. This reflects that the composite frames under low cyclic reversed loading experience three stages, elastic, plastic and ultimate failure.
2) With the increase of linear rigidity ratio, the composite frame has higher bearing capacity and rigidity. As axial compression ratio increases, the descending branch of skeleton curve becomes more obvious. At the same time, the ductility and ultimate bearing capacity of composite frame are dropping. However, the axial compression ratio has no significant influence on elastic rigidity. The ultimate bearing capacity and elastic rigidity of composite frame reduce gradually with the increase of slenderness ratio. After the appearance of ultimate load, as slenderness ratio increases, the descending branch of skeleton curve becomes increasingly apparent. 3.4 Horizontal load−strain hysteretic curve of
composite frame The horizontal load−displacement curves of frame
could reflect its ductility, bearing capacity and energy dissipation macroscopically. However, the horizontal load−strain curves demonstrate the strain change law at different locations in loading process.
1) Strain hysteretic curves of column pedestal. Figure 14 shows the strain hysteretic curves of
column pedestal. Known from Fig. 14, in the whole loading process, the strains of column pedestal at elastic stage develop slowly. But after the plastic stage, the strains have a speed development. With the increase of linear rigidity ratio, the positive and negative maximum strains of column pedestal both increase. The negative strain grows firstly, then the positive strain. As the axial
J. Cent. South Univ. (2015) 22: 4396−4413
4405
Fig. 12 P−Δ hysteretic curves of composite frame with different design parameters: (a) CSCKJ1 (i=2.8, n=0.3, l=37.5); (b) CSCKJ2
(i=1.8, n=0.3, l=37.5); (c) CSCKJ3 (i=3.3, n=0.3, l=37.5); (d) CSCKJ4 (i=2.8, n=0.5, l=37.5); (e) CSCKJ5 (i=2.8, n=0.7, l=37.5);
(f) CSCKJ6 (i=2.8, n=0.3, l=20.0); (g) CSCKJ7 (i=2.8, n=0.3, l=45.7); (h) CSCKJ8 (i=2.8, n=0.3, l=52.0)

J. Cent. South Univ. (2015) 22: 4396−4413
4406
Fig. 13 Effects of different parameters on horizontal
load−displacement skeleton curves of composite frame: (a)
Linear rigidity ratio; (b) Slenderness ratio; (c) Axial
compression ratio compression ratio increases, the yielding strain of column pedestal appears ahead of time and the compressive strain grows quickly. The strain curve of whole column pedestal demonstrates that the inelastic strain is skewed toward the compressive strain gradually.
2) Strain hysteretic curves of beam end. Figure 15 shows the strain hysteretic curves of
beam end. It can be seen from Fig. 15 that the strains of beam bottom flange present linear change. When entering
Fig. 14 Strain hysteretic curves of column pedestal: (a)
CSCKJ1; (b) CSCKJ4; (c) CSCKJ5 into the plastic stage, the strains develop fast. With the increase of axial compression ratio, the strains of beam end emerge a tendency of decline. In the process of repetitive loading, the strain curves offset to compressive end. The maximum strain of steel beam reduces as linear rigidity ratio increases. The primary cause is that the larger the linear rigidity ratio, the stronger the beam relative to column. When the load is the same, the deformation of larger linear rigidity ratio frame is smaller.
3) Strain hysteretic curves of steel reinforcement.

J. Cent. South Univ. (2015) 22: 4396−4413
4407
Fig. 15 Strain hysteretic curves of beam end: (a) CSCKJ1;
(b) CSCKJ4; (c) CSCKJ5
The strain hysteretic curves of steel reinforcement
are shown in Fig. 16. Known from Fig. 16, when the positive loading reinforcement is in tension, the hysteretic loops become plump. When the negative loading reinforcement is in compression, the hysteretic loops start to pinch. Experimental results show that the longitudinal reinforcements of beam present tensile yield. Before specimens yielding, the strain of beam end reinforcement changes slightly. After specimens yielding, the strain develops quickly.
4) Strain hysteretic curves of joint. The strain hysteretic curves of joint are shown in
Fig. 16 Strain hysteretic curves of steel reinforcement: (a)
CSCKJ1; (b) CSCKJ4; (c) CSCKJ5
Fig. 17. The measuring point is located at the end of steel tube column in joint core zone and the strain here increases constantly towards positive direction when loading. The each loop of strain curve of frame CSCKJ1, whose linear rigidity ratio is 2.8, runs parallel with the ordinate axis. The load−strain curve of frame CSCKJ3 of which linear rigidity ratio is 3.3 shows evidently circular shape. The strain of frame CSCKJ5 who has larger axial compression ratio shows a sudden increase. The hysteretic loops of frame CSCKJ8 are comparative plump and move to the right continuously with the increase of loading times.

J. Cent. South Univ. (2015) 22: 4396−4413
4408
4 Seismic behavior analysis of composite
frame 4.1 Ductility of composite frame
The yield displacements, corresponding displacements of maximum load, ultimate displacements
and displacement ductility factors of seven composite frames are shown in Table 6.
As seen from Table 6, in this test, when reaching their ultimate bearing capacities, the displacement ductility factors of seven composite frames are between 3.52 and 4.88. Thus, the ductility of composite frames composed of steel−concrete composite beams, concrete
Fig. 17 Strain hysteretic curves of joint: (a) CSCKJ1; (b) CSCKJ3; (c) CSCKJ5; (d) CSCKJ8 Table 6 Feature values of frame P−Δ curve
Stage of loading Yield state Ultimate state Failure state Ductility factor, μ Specimen Loading Py/kN Δy/mm Pm/kN Δm/mm Pu/kN Δu
CSCKJ1 Positive 257.5 16.8 350 46.8 297.5 72.9 4.34
Negative −247.6 −17.2 −347.6 −46.19 −312 −66.5 3.86
CSCKJ2 Positive 234.83 18.75 326.6 47.66 295 64.94 3.46
Negative −230 −16.42 −326.1 −42.53 −275.38 −62.03 3.78
CSCKJ3 Positive 269.52 14.72 374 44.83 345 63.28 4.30
Negative −262.35 −13.03 −381 −45.46 −358 −63.55 4.88
CSCKJ4 Positive 247.2 15.85 322.3 37.5 273.3 62.2 3.92
Negative −245.2 −15.85 −313.1 −37.4 −266.05 −60.1 3.79
CSCKJ5 Positive 209.6 14.9 288 31.77 244.8 50.9 3.56
Negative −210.2 −15 −287.3 30 −244.2 49.9 3.52
CSCKJ7 Positive 184.96 31.50 316.84 108.20 274.82 132.45 4.20
Negative −186.50 −31.90 −333.04 −107.90 −255.02 −131.80 4.13
CSCKJ8 Positive 176.40 41.50 298.70 134.50 240.49 165.10 3.99
Negative −175.50 −41.80 −303.85 −135.00 −237.21 −165.10 3.95

J. Cent. South Univ. (2015) 22: 4396−4413
4409
filled tubular columns and enforced loop joints is good and higher than that of composite frame (the displacement ductility is 3.2) [22] composed of reinforced concrete beams, concrete filled tubular columns and welding joints. It indicates that the seismic behavior of composite frame in this test is superior to that frame in literature [22]. With the increase of linear rigidity ratio, the horizontal bearing capacity and ductility of composite frame grow correspondingly. As the axial compression ratio increase, the yield displacement y of structure shows a tendency of decrease. This reflects along with increase of axial compression ratio, the yield displacement shifts to an earlier date and the ultimate bearing capacity is in decline. Slenderness ratio has great effect on ductility of composite frame. With the increase of slenderness ratio, the ductility factor of column decreases gradually and the change speed of ductility factor becomes faster. 4.2 Strength degradation of composite frame
The strength degradation is the phenomenon that when the displacement amplitude remains the same, the bearing capacity of structure presents a tendency of decline with the increase of loading times. In order to investigate the strength degradation of specimen under each load step, strength degradation factor λi is introduced (Code for Seismic Design of Buildings GB50011—2010) [19]:
1
ij
i ij
F
F
(1)
where i
jF and 1ijF are the ith, (i−1)th load values of
circle peak when the displacement ductility factor is j, respectively. The calculated strength degradation contrast curves are shown in Fig. 18. As seen from Fig. 18, axial compression ratio, slenderness ratio and linear rigidity ratio have no significant effects on strength degradation. 4.3 Rigidity degeneration of composite frame
The rigidity degeneration is the phenomenon that the structure rigidity reduces constantly with the increase of cycle index and close to limiting value of the displacement. The recommended secant rigidity Ki in Code for Seismic Design of Buildings (GB 50011—2010) [19] is adopted.
i ii
i i
F FK
X X
(2)
where Fi is the ith peak point load; Xi is the ith peak point displacement.
The rigidity degeneration curves in this test are shown in Fig. 19. It can be seen from Fig. 19, as regards
the same frame, the rigidity degeneration curve is comparative steep before reaching ultimate load. It means that the rigidity of frame degenerates quickly. The main cause is that the concrete in steel tube crackes and crushes gradually with the increase of cycle index before ultimate load appears. The damage is obvious. After reaching ultimate load, the rigidity degeneration curves become gentle. It indicates that the rigidity degeneration tends towards stability by degrees. At this stage, the frame consumes a large amount of energy depending upon its plastic deformation. Thus, it can be concluded that the composite frame has better energy dissipation and the superiority of seismic behavior of composite frame is demonstrated.
The axial compression ratio has no appreciable effect on rigidity degeneration of composite frame. With the increase of slenderness ratio, the slope of rigidity degeneration curves declines. But the slope grows as the linear rigidity ratio increases. 4.4 Energy dissipation of composite frame
Energy dissipation coefficient E and equivalent viscous damping coefficient he are used to study the energy dissipation of composite frame.
1) Energy dissipation coefficient E. E is defined as the ratio of the area bounded by
hysteresis loop of certain cycle to the triangle area between unloading segmentation of hysteresis loop and horizontal ordinate, as shown in Fig. 20. The formula is (Code for Seismic Design of Buildings GB50011—2010) [19]
ABC CDA
OBE ODF
S SE
S S
(3)
where SABC is the area of ΔABC; SCDA is the area of ΔCDA; SOBE is the area of ΔOBE; SODF is the area of ΔSODF.
Figure 21 displays the relation curves between energy dissipation coefficient E and Δ/Δy of composite frames with different parameters. It can be seen from that the energy dissipation coefficient of composite frame increases with the increasing of displacement. It demonstrates that with the augment of horizontal displacement, the energy dissipation capacity is enhanced. When the column axial compression ratio changes, the distinction of energy dissipation capacity in loading initial stage is not apparent. When the column axial compression ratio is greater than 0.5, the energy dissipation reduces with the increasing of displacement. After the displacement reaching 2Δy, with the increase of linear rigidity ratio, the energy dissipation capacity is improved. With the increasing of slenderness ratio, the frame energy dissipation capacity is strengthened.

J. Cent. South Univ. (2015) 22: 4396−4413
4410
Fig. 18 Strength degradation curves of composite frame: (a, b) Different axial compression ratios; (c, d) Different slenderness ratios;
(e, f) Different linear rigidity ratios
2) Equivalent viscous damping coefficient he.
e 2π
Eh (4)
Table 7 displays the energy dissipation coefficient E
and equivalent viscous damping coefficient he. It can be seen from the table that the energy dissipation coefficient E is within the scope of 1.46−2.29 and the equivalent viscous damping coefficient he is within the scope of
0.23−0.36. With the increase of linear rigidity ratio, E and he both increased. When i changed from 1.8 to 3.3, the energy dissipation coefficient E increased by 30%. With the increase of axial compression ratio, the total energy dissipation of composite frame shows a decrease tendency. However, the energy dissipation coefficient and equivalent viscous damping coefficient present the increment trend. The slenderness ratio has no significant effects on energy dissipation of composite frame.

J. Cent. South Univ. (2015) 22: 4396−4413
4411
Fig. 19 Rigidity degeneration curves of composite frame: (a)
Different axial compression ratios; (b) Different slenderness
ratios; (c) Different linear rigidity ratios
Fig. 20 Calculating chart of energy dissipation coefficient
Fig. 21 Energy dissipation coefficients E−Δ/Δy curve of composite
frame: (a) Different axial compression ratios; (b) Different
linear rigidity ratios; (c) Different slenderness ratios
Table 7 Energy dissipation index of composite frame
Specimen number
Energy dissipation coefficient, E
Equivalent viscous damping coefficient, he
CSCKJ1 1.73 0.28
CSCKJ2 1.46 0.23
CSCKJ3 1.90 0.30
CSCKJ4 2.23 0.35
CSCKJ5 2.29 0.36
CSCKJ7 1.72 0.27
CSCKJ8 1.80 0.29

J. Cent. South Univ. (2015) 22: 4396−4413
4412
5 Conclusions
1) The destructive process of steel−concrete composite frame is described briefly below: Fracture of pegs on frame beam→separation of concrete slab and steel beam→out of plane deformation of steel beam→ plumped up of heel steel tube→plumped up slightly of column top steel tube. The main cause of damage is the out-of-plane deformation of steel beam and the yielding destruction of heel.
2) The hysteretic loops of composite frames are comparatively plump. The hysteretic loops show a spindle shape and no obvious pinch phenomenon. As linear rigidity ratio increases, the hysteretic loops become plumper. With the increase of column axial compression ratio, the area within hysteresis loops decreases evidently. The cycle index that the structure could suffer increases with the increasing of slenderness ratio.
3) With the increase of linear rigidity ratio, the positive and negative maximum strains of column pedestal both increase and the maximum strain of steel beam decreases. As the axial compression ratio increases, the yielding strain of column pedestal appears ahead of time and the compressive strain grows quickly. The inelastic strain is skewed toward the compressive strain gradually. The strains of beam end emerge a tendency of decline. In the process of repetitive loading, the strain curves offset to compressive end.
4) With the increase of linear rigidity ratio, the energy dissipation capacity of composite frame is enhanced. The restraint degree of beam to column is strengthened and the rigidity degeneration decreases. With the increase of column axial compression ratio, the horizontal bearing capacity and the energy dissipation capacity of composite frame decline significantly. Although the horizontal bearing capacity of composite frame decreases with the increase of slenderness ratio, the energy dissipation capacity is improved.
5) The ductility of composite frames composed of steel−concrete composite beams, concrete filled tubular columns and enforced loop joints is good. With the increase of linear rigidity ratio, the horizontal bearing capacity and ductility of composite frame grow correspondingly. As the axial compression ratio increases, the yield displacement y of structure shows a tendency of decrease. With the increase of slenderness ratio, the ductility factor of column decreases gradually and the changing speed of ductility factor becomes faster.
6) As axial compression ratio increases, the rigidity of strain hardening stage reduces and the descending branch of skeleton curve becomes more obvious. With the increase of linear rigidity ratio, the maximum bearing
capacity increases but not apparently. The descending branches of skeleton curves are roughly the same. The ultimate bearing capacity and elastic rigidity of composite frame reduce gradually with the increase of slenderness ratio. References [1] LU Yi-yan, LI Na, LI Shan, LIANG Hong-jun. Experimental
investigation of axially loaded steel fiber reinforced high strength
concrete-filled steel tube columns [J]. Journal of Central South
University, 2015, 22: 2287−2296.
[2] ZONA A, RANZI G. Shear connection slip demand in composite
steel-concrete beams with solid slabs [J]. Journal of Constructional
Steel Research, 2014, 102: 266−281.
[3] LAI M H, HO J C M. Confinement effect of ring-confined
concrete-filled-steel-tube columns under uni-axial load [J].
Engineering Structures, 2014, 67: 123−141.
[4] NIE Jian-guo, WANG Yu-hang, FAN Jian-sheng. Experimental
study on seismic behavior of concrete filled steel tube columns under
pure torsion and compression-torsion cyclic load [J]. Journal of
Constructional Steel Research, 2012, 79: 115−126.
[5] NAZARGAH M L. An isogeometric approach for the analysis of
composite steel-concrete beams [J]. Thin-Walled Structures, 2014,
84: 406−415.
[6] CUONG N H, KIM S E. Practical nonlinear analysis of
steel-concrete composite frames using fiber-hinge method [J].
Journal of Constructional Steel Research, 2012, 74: 90−97.
[7] CHIOREAN C G. A computer method for nonlinear inelastic
analysis of 3D composite steel-concrete frame structures[J].
Engineering Structures, 2013, 57: 125−152.
[8] CHELLINI D, ROECK G D, NARDINI L, SALVATORE W.
Damage analysis of a steel-concrete composite frame by finite
element model updation [J]. Journal of Constructional Steel Research,
2010, 66: 398−411.
[9] NIE Jian-guo, TAO Mu-xuan, CAI C S, CHEN Ge. Modeling and
investigation of elasto-plastic behavior of steel-concrete composite
frame systems [J]. Journal of Constructional Steel Research, 2011, 67:
1973−1984.
[10] WANG Yu-hang, NIE Jian-guo, CAI C S. Numerical modeling on
concrete structures and steel-concrete composite frame structures [J].
Composites: Part B, 2013, 51: 58−67.
[11] QI Jing-jing, JIANG Li-zhong. Effects of interface slip and
semi-rigid joint on elastic seismic response of steel-concrete
composite frames [J]. Journal of Central South University, 2010,
17(6): 1327−1375.
[12] BRACONI A, ELAMARY A, SALVATORE W. Seismic behaviour
of beam-to-column partical-strength joints for steel-concrete
composite frames [J]. Journal of Constructional Steel Research, 2010,
66: 1431−1444.
[13] XU Cheng-xiang. Experimental and theoretical research on seismic
behavior of concrete- filled steel tubular frame [D]. Tianjin: Tianjin
University, 2003. (in Chinese)
[14] WANG Lai, WANG Tie-cheng, CHEN Qian. Experimental study on
seismic performance of concrete-filled rectangular tubular frame
under low-reversed cyclic loading [J]. Earthquake Engineering and
Engineering Vibration, 2003, 23(3): 114−117. (in Chinese)
[15] WANG Wen-da. Behavior of steel beam to concrete-filled steel
tubular columns frames [D]. Fuzhou: Fuzhou University, 2006. (in
Chinese)

J. Cent. South Univ. (2015) 22: 4396−4413
4413
[16] HE Wen-hui, FAN Yun-lei, XIAO Yan. GUO Yu-rong. Seismic
behaviors of high-strength bolted end-plate connected composite
steel beam and square concrete filled steel tube column frames [J].
Journal of Building Structures, 2009, 30(4): 18−29.
[17] CECS28: 90—1992. Specification for design and construction of
concrete-filled steel tubular structures [S]. (in Chinese)
[18] DL/T 5085 — 1999. Specification for design of steel-concrete
composite structure [S]. (in Chinese)
[19] GB50011—2010. Code for seismic design of buildings [S]. (in
Chinese)
[20] GB50010—2010. Code for design of concrete structures [S]. (in
Chinese)
[21] JGJ101 — 96. Specifications of testing methods for earthquake
resistant building [S]. (in Chinese)
[22] LI Bing. Research of the concrete-filled steel tube structure [D].
Xi’an: Xi’an University of Architecture & Technology, 2005. (in
Chinese)
(Edited by YANG Hua)