Embed Size (px)
Citation preview
970563
Experimental Testing of a 1994 Ford Taurus for NADSdyna Validation
Jeffrey P. Chrstos
JPC Engineering
Paul A. Grygier
Vehicle Research & Test Center, NHTSA ABSTRACT As part of the National Advanced Driving Simulator (NADS) program, the Vehicle Research and Test Center (VRTC) in East Liberty, Ohio is evaluating the NADS vehicle dynamics software. As part of VRTC’s effort, an extensive vehicle testing program to provide data for the simulation evaluation was performed. This paper describes VRTC’s testing of a 1994 Ford Taurus GL passenger car. Each of the test maneuvers run by the Taurus are described, along with instrumentation setup, control actuation, test conditions, and driver procedures. The test data reduction and processing are detailed. Sample results of the testing and an analysis of test repeatablility and measurement noise are also presented. INTRODUCTION Starting in 1989, the National Highway Traffic Safety Administration (NHTSA) began researching the use and construction of a new state-of-the-art driving simulator, the National Advanced Driving Simulator (NADS) [1]. A site selection competition among United States universities was conducted, and in 1992, the University of Iowa was selected. As part of the University of Iowa’s cost sharing, they contributed the core vehicle dynamics software for the NADS. This software program, called the Real Time Recursive Dynamics (RTRD) [2], is a minimum coordinate set, multi-body dynamics program that breaks the vehicle chassis and suspension system into a tree topology by cutting closed kinematic loops. This tree topology allows the multi-body system to be solved on parallel computers in real time. After winning the NADS site selection competition, the University of Iowa supplemented the core vehicle dynamics (RTRD) with a collection of sub-modules that model portions of the vehicle such as the powertrain, tires, brakes, steering system, and aerodynamics that cannot be modeled using multi-body dynamics. The RTRD program containing these sub-modules is called NADSdyna [3]. NHTSA’s Vehicle Research and Test Center (VRTC) in East Liberty, Ohio, is evaluating the NADSdyna vehicle dynamics software, developing vehicle parameter sets for NADSdyna, and enhancing various aspects of NADSdyna. As part of VRTC’s effort, an extensive vehicle testing program to provide “benchmark” data for the simulation evaluation was performed. This paper describes VRTC’s testing of a 1994 Ford Taurus GL passenger car. A similar testing program for an articulated tractor-semitrailer will be described in a later report from VRTC.
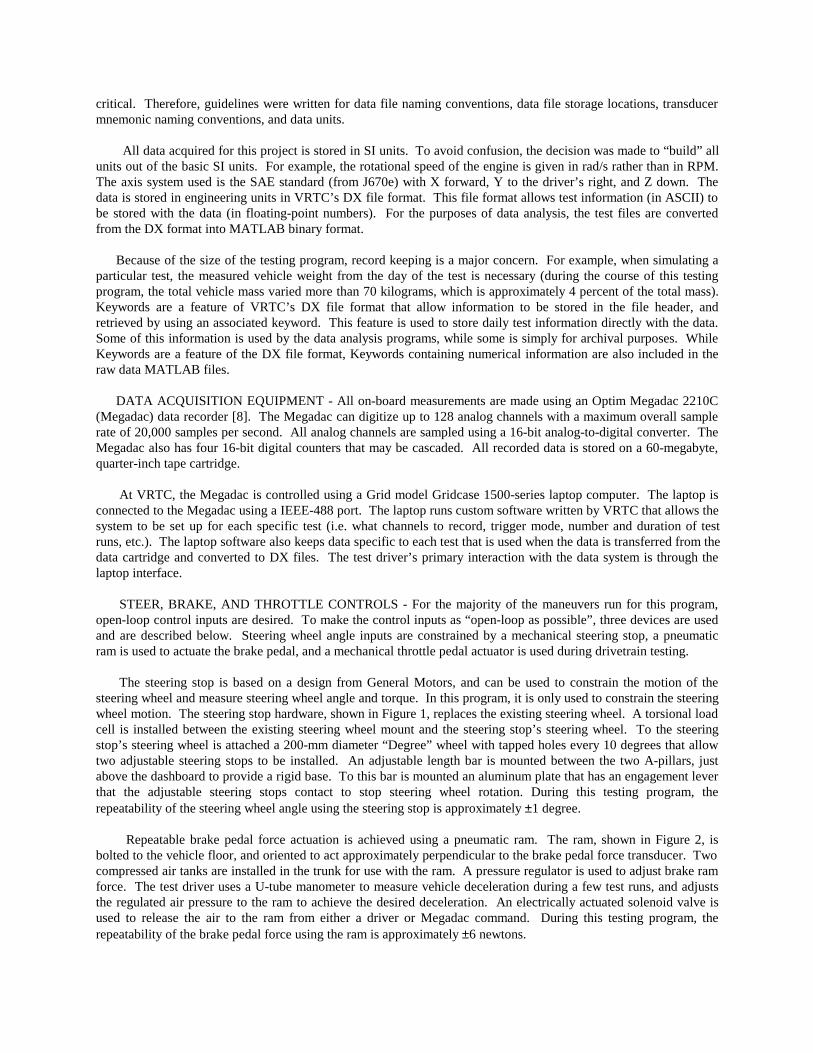
NADS is intended to be the most advanced driving simulator in the world when it is operational in the late 1990’s. It is designed to be a research facility that will allow crash avoidance maneuvers and other high severity or dangerous driving situations to be safely studied. The broad scope of the NADS intended uses requires that the vehicle simulation be able to simulate vehicle ride, cornering, driving acceleration, and braking with a high degree of realism. VRTC’s task of evaluating this simulation, therefore, requires a broad testing program covering both mild and severe vehicle ride, cornering, driving acceleration, and braking. The simulation evaluation methodology used is based on past simulation programs at VRTC [4, 5]. VRTC performed this testing program to provide the data needed to evaluate the NADSdyna software. However, there is very little publicly available instrumented vehicle handling and braking test data. One of the purposes of this paper therefore is to make this test data available to other researchers. Electronic versions of the test data described in this paper can be obtained be contacting W. Riley Garrott at VRTC, P. O. Box 37, East Liberty, Ohio, 43319, or via telephone at (937) 666-4511. The test vehicle used for this project is a 1994 Ford Taurus GL. The Taurus VIN number is 1FALP5249RA164396. The Taurus has a 3.8-liter V6 engine, four-speed automatic transmission, speed sensitive power rack and pinion steering, and four wheel anti-lock brakes. General Ameri-tech 205/65R15 tires with a cold inflation pressure of 35 psi are used for all testing. The tires were purchased together, and are from the same production batch. Force and moment test data for these tires (from the same batch) can be found in reference [6]. INSTRUMENTATION AND DATA RECORDING This section briefly describes the transducers and data system used for the test program. Table 1 lists the data channels, the types of sensors used, and the units in which the data is stored. A more detailed description of the experimental setup and data storage system can be found in Reference [7].
Table 1. Data Channels
Data Channel Sensor (units) Vehicle accelerations in X, Y, and Z-axes Accelerometers (m/s2) Vehicle angular rates about X, Y, and Z-axes Rate sensors (rad/s) Power steering rack pressures Pressure transducers (kPa) Optical event Optical trigger (V) Chassis height Ultrasonic distance sensors (m) Brake line pressures Pressure transducers (kPa) Tie rod forces Strain gages (N) Vehicle speed Tachometer generator (m/s) Distance traveled Fifth wheel (m) Brake pedal force Force transducer (N) Transmission gearshift selector Engine control module (V) Engine speed Engine control module (rad/s) Gear transmission is in Engine control module (V) Wheel rotational velocities ABS wheel sensors (rad/s) Handwheel angle Potentiometer (rad) Handwheel rotational velocity Tachometer generator (rad/s) Handwheel torque Strain gages (N-m) Throttle position Engine control module (%) Strut accelerations along strut axis Accelerometers (m/s2) Strut lengths Potentiometers (m) DATA ORGANIZATION - Because of the size and scope of this vehicle testing project (more than 40 transducers, 75 maneuver types and conditions, and nearly 600 individual test runs), data organization is very
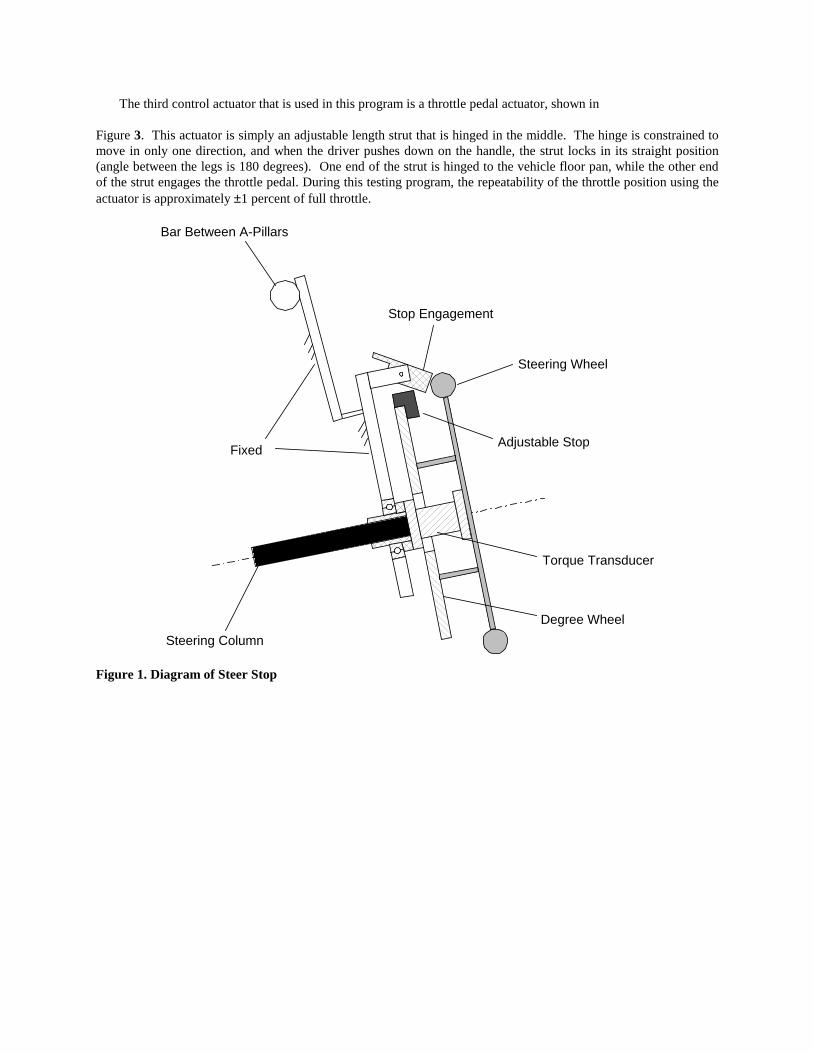
critical. Therefore, guidelines were written for data file naming conventions, data file storage locations, transducer mnemonic naming conventions, and data units. All data acquired for this project is stored in SI units. To avoid confusion, the decision was made to “build” all units out of the basic SI units. For example, the rotational speed of the engine is given in rad/s rather than in RPM. The axis system used is the SAE standard (from J670e) with X forward, Y to the driver’s right, and Z down. The data is stored in engineering units in VRTC’s DX file format. This file format allows test information (in ASCII) to be stored with the data (in floating-point numbers). For the purposes of data analysis, the test files are converted from the DX format into MATLAB binary format. Because of the size of the testing program, record keeping is a major concern. For example, when simulating a particular test, the measured vehicle weight from the day of the test is necessary (during the course of this testing program, the total vehicle mass varied more than 70 kilograms, which is approximately 4 percent of the total mass). Keywords are a feature of VRTC’s DX file format that allow information to be stored in the file header, and retrieved by using an associated keyword. This feature is used to store daily test information directly with the data. Some of this information is used by the data analysis programs, while some is simply for archival purposes. While Keywords are a feature of the DX file format, Keywords containing numerical information are also included in the raw data MATLAB files. DATA ACQUISITION EQUIPMENT - All on-board measurements are made using an Optim Megadac 2210C (Megadac) data recorder [8]. The Megadac can digitize up to 128 analog channels with a maximum overall sample rate of 20,000 samples per second. All analog channels are sampled using a 16-bit analog-to-digital converter. The Megadac also has four 16-bit digital counters that may be cascaded. All recorded data is stored on a 60-megabyte, quarter-inch tape cartridge. At VRTC, the Megadac is controlled using a Grid model Gridcase 1500-series laptop computer. The laptop is connected to the Megadac using a IEEE-488 port. The laptop runs custom software written by VRTC that allows the system to be set up for each specific test (i.e. what channels to record, trigger mode, number and duration of test runs, etc.). The laptop software also keeps data specific to each test that is used when the data is transferred from the data cartridge and converted to DX files. The test driver’s primary interaction with the data system is through the laptop interface. STEER, BRAKE, AND THROTTLE CONTROLS - For the majority of the maneuvers run for this program, open-loop control inputs are desired. To make the control inputs as “open-loop as possible”, three devices are used and are described below. Steering wheel angle inputs are constrained by a mechanical steering stop, a pneumatic ram is used to actuate the brake pedal, and a mechanical throttle pedal actuator is used during drivetrain testing. The steering stop is based on a design from General Motors, and can be used to constrain the motion of the steering wheel and measure steering wheel angle and torque. In this program, it is only used to constrain the steering wheel motion. The steering stop hardware, shown in Figure 1, replaces the existing steering wheel. A torsional load cell is installed between the existing steering wheel mount and the steering stop’s steering wheel. To the steering stop’s steering wheel is attached a 200-mm diameter “Degree” wheel with tapped holes every 10 degrees that allow two adjustable steering stops to be installed. An adjustable length bar is mounted between the two A-pillars, just above the dashboard to provide a rigid base. To this bar is mounted an aluminum plate that has an engagement lever that the adjustable steering stops contact to stop steering wheel rotation. During this testing program, the repeatability of the steering wheel angle using the steering stop is approximately ±1 degree. Repeatable brake pedal force actuation is achieved using a pneumatic ram. The ram, shown in Figure 2, is bolted to the vehicle floor, and oriented to act approximately perpendicular to the brake pedal force transducer. Two compressed air tanks are installed in the trunk for use with the ram. A pressure regulator is used to adjust brake ram force. The test driver uses a U-tube manometer to measure vehicle deceleration during a few test runs, and adjusts the regulated air pressure to the ram to achieve the desired deceleration. An electrically actuated solenoid valve is used to release the air to the ram from either a driver or Megadac command. During this testing program, the repeatability of the brake pedal force using the ram is approximately ±6 newtons.
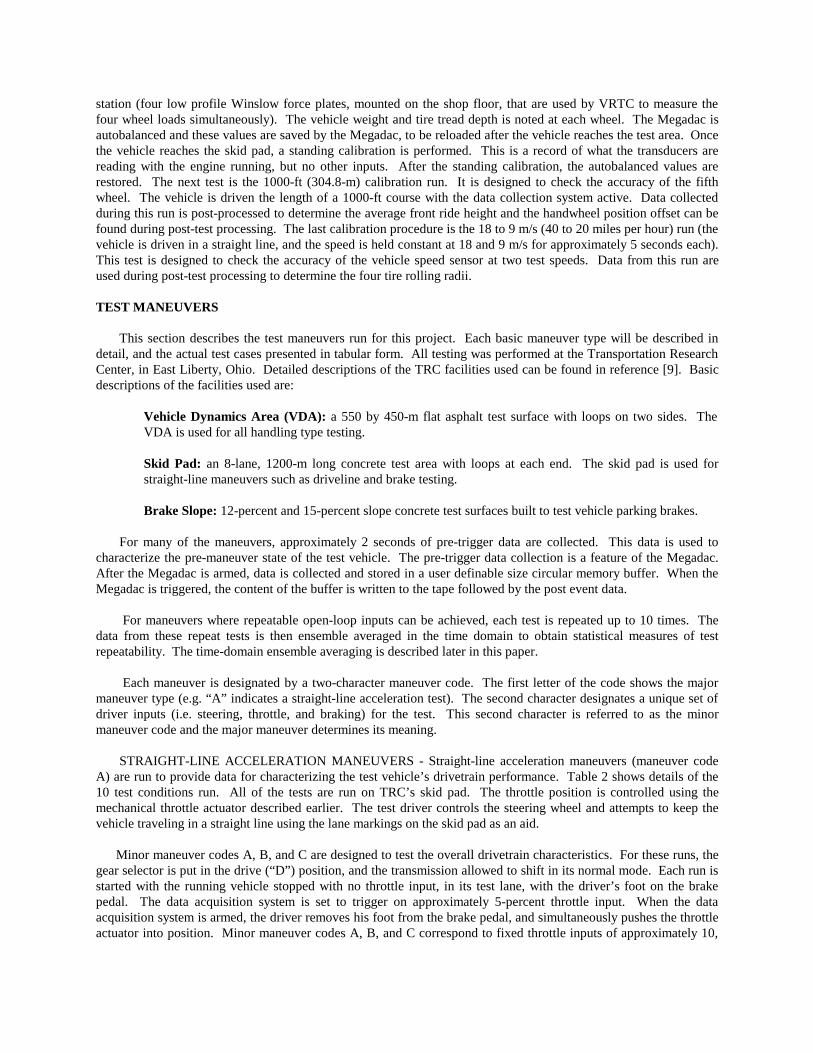
The third control actuator that is used in this program is a throttle pedal actuator, shown in Figure 3. This actuator is simply an adjustable length strut that is hinged in the middle. The hinge is constrained to move in only one direction, and when the driver pushes down on the handle, the strut locks in its straight position (angle between the legs is 180 degrees). One end of the strut is hinged to the vehicle floor pan, while the other end of the strut engages the throttle pedal. During this testing program, the repeatability of the throttle position using the actuator is approximately ±1 percent of full throttle.
Steering Column
Bar Between A-Pillars
Steering Wheel
Torque Transducer
Degree Wheel
Adjustable Stop
Stop Engagement
Fixed
Figure 1. Diagram of Steer Stop
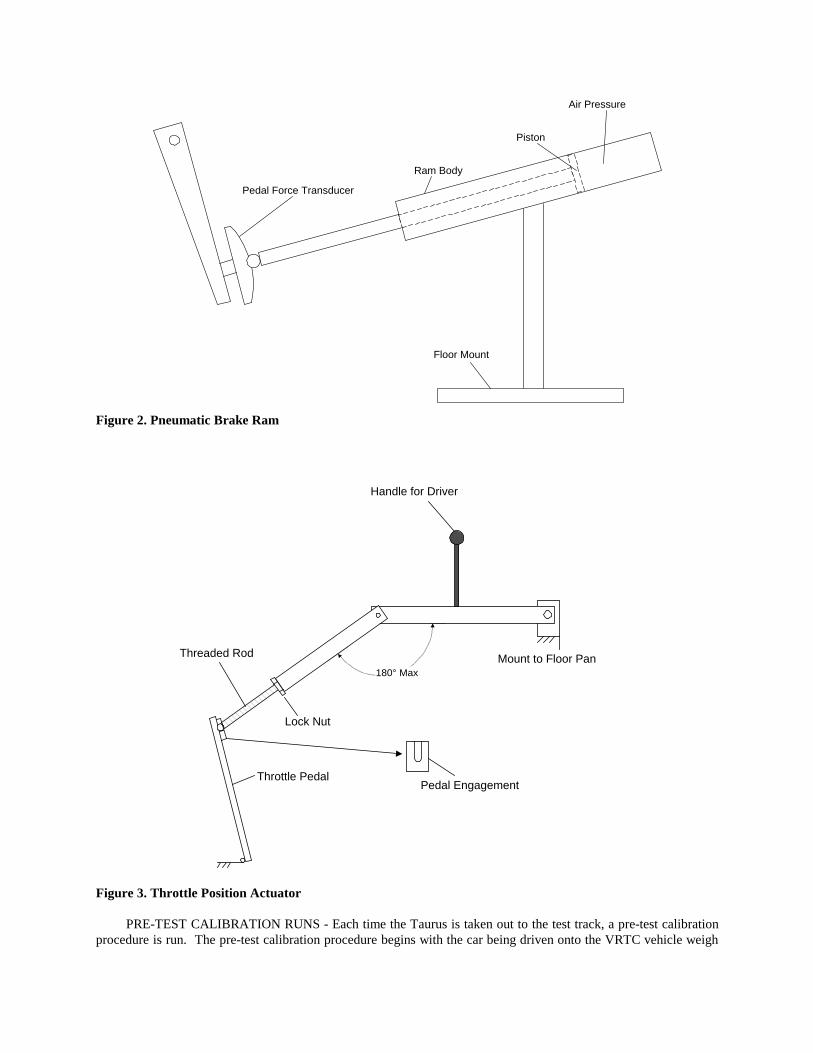
Air Pressure
Piston
Ram Body
Pedal Force Transducer
Floor Mount
Figure 2. Pneumatic Brake Ram
Throttle Pedal
Threaded Rod
Lock Nut
Mount to Floor Pan180° Max
Handle for Driver
Pedal Engagement
Figure 3. Throttle Position Actuator
PRE-TEST CALIBRATION RUNS - Each time the Taurus is taken out to the test track, a pre-test calibration procedure is run. The pre-test calibration procedure begins with the car being driven onto the VRTC vehicle weigh
station (four low profile Winslow force plates, mounted on the shop floor, that are used by VRTC to measure the four wheel loads simultaneously). The vehicle weight and tire tread depth is noted at each wheel. The Megadac is autobalanced and these values are saved by the Megadac, to be reloaded after the vehicle reaches the test area. Once the vehicle reaches the skid pad, a standing calibration is performed. This is a record of what the transducers are reading with the engine running, but no other inputs. After the standing calibration, the autobalanced values are restored. The next test is the 1000-ft (304.8-m) calibration run. It is designed to check the accuracy of the fifth wheel. The vehicle is driven the length of a 1000-ft course with the data collection system active. Data collected during this run is post-processed to determine the average front ride height and the handwheel position offset can be found during post-test processing. The last calibration procedure is the 18 to 9 m/s (40 to 20 miles per hour) run (the vehicle is driven in a straight line, and the speed is held constant at 18 and 9 m/s for approximately 5 seconds each). This test is designed to check the accuracy of the vehicle speed sensor at two test speeds. Data from this run are used during post-test processing to determine the four tire rolling radii. TEST MANEUVERS This section describes the test maneuvers run for this project. Each basic maneuver type will be described in detail, and the actual test cases presented in tabular form. All testing was performed at the Transportation Research Center, in East Liberty, Ohio. Detailed descriptions of the TRC facilities used can be found in reference [9]. Basic descriptions of the facilities used are: Vehicle Dynamics Area (VDA): a 550 by 450-m flat asphalt test surface with loops on two sides. The
VDA is used for all handling type testing. Skid Pad: an 8-lane, 1200-m long concrete test area with loops at each end. The skid pad is used for
straight-line maneuvers such as driveline and brake testing. Brake Slope: 12-percent and 15-percent slope concrete test surfaces built to test vehicle parking brakes. For many of the maneuvers, approximately 2 seconds of pre-trigger data are collected. This data is used to characterize the pre-maneuver state of the test vehicle. The pre-trigger data collection is a feature of the Megadac. After the Megadac is armed, data is collected and stored in a user definable size circular memory buffer. When the Megadac is triggered, the content of the buffer is written to the tape followed by the post event data. For maneuvers where repeatable open-loop inputs can be achieved, each test is repeated up to 10 times. The data from these repeat tests is then ensemble averaged in the time domain to obtain statistical measures of test repeatability. The time-domain ensemble averaging is described later in this paper. Each maneuver is designated by a two-character maneuver code. The first letter of the code shows the major maneuver type (e.g. “A” indicates a straight-line acceleration test). The second character designates a unique set of driver inputs (i.e. steering, throttle, and braking) for the test. This second character is referred to as the minor maneuver code and the major maneuver determines its meaning. STRAIGHT-LINE ACCELERATION MANEUVERS - Straight-line acceleration maneuvers (maneuver code A) are run to provide data for characterizing the test vehicle’s drivetrain performance. Table 2 shows details of the 10 test conditions run. All of the tests are run on TRC’s skid pad. The throttle position is controlled using the mechanical throttle actuator described earlier. The test driver controls the steering wheel and attempts to keep the vehicle traveling in a straight line using the lane markings on the skid pad as an aid. Minor maneuver codes A, B, and C are designed to test the overall drivetrain characteristics. For these runs, the gear selector is put in the drive (“D”) position, and the transmission allowed to shift in its normal mode. Each run is started with the running vehicle stopped with no throttle input, in its test lane, with the driver’s foot on the brake pedal. The data acquisition system is set to trigger on approximately 5-percent throttle input. When the data acquisition system is armed, the driver removes his foot from the brake pedal, and simultaneously pushes the throttle actuator into position. Minor maneuver codes A, B, and C correspond to fixed throttle inputs of approximately 10,
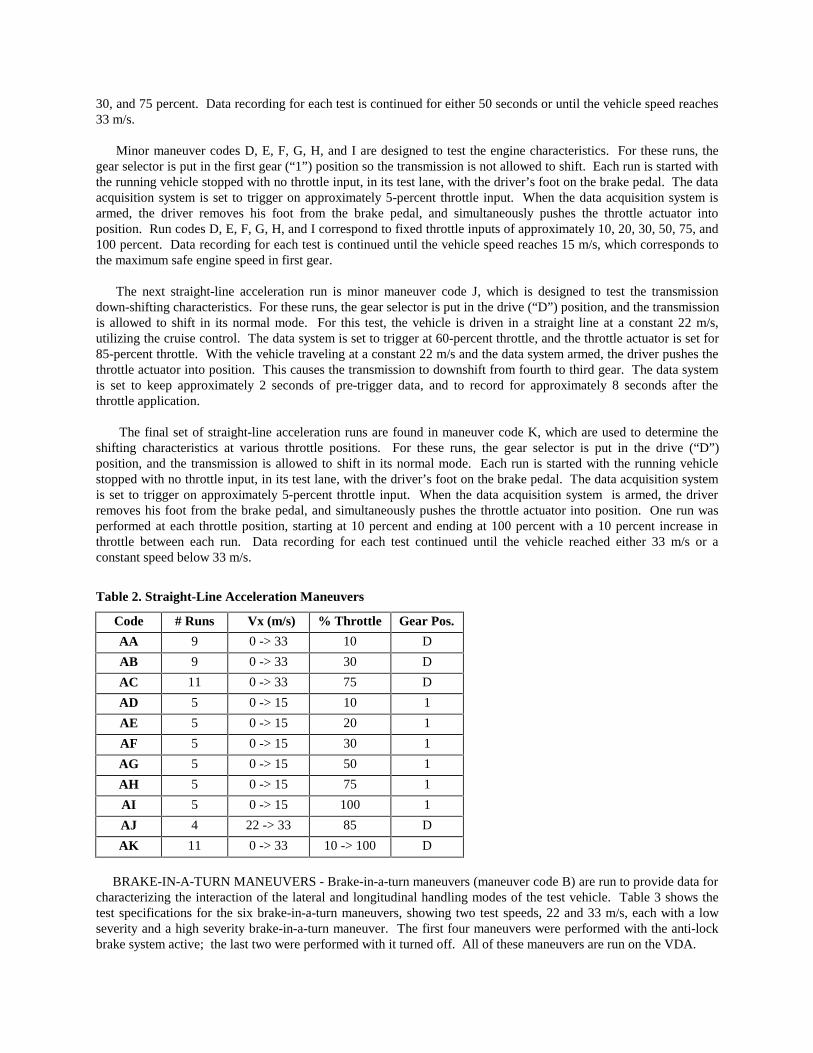
30, and 75 percent. Data recording for each test is continued for either 50 seconds or until the vehicle speed reaches 33 m/s. Minor maneuver codes D, E, F, G, H, and I are designed to test the engine characteristics. For these runs, the gear selector is put in the first gear (“1”) position so the transmission is not allowed to shift. Each run is started with the running vehicle stopped with no throttle input, in its test lane, with the driver’s foot on the brake pedal. The data acquisition system is set to trigger on approximately 5-percent throttle input. When the data acquisition system is armed, the driver removes his foot from the brake pedal, and simultaneously pushes the throttle actuator into position. Run codes D, E, F, G, H, and I correspond to fixed throttle inputs of approximately 10, 20, 30, 50, 75, and 100 percent. Data recording for each test is continued until the vehicle speed reaches 15 m/s, which corresponds to the maximum safe engine speed in first gear.
The next straight-line acceleration run is minor maneuver code J, which is designed to test the transmission down-shifting characteristics. For these runs, the gear selector is put in the drive (“D”) position, and the transmission is allowed to shift in its normal mode. For this test, the vehicle is driven in a straight line at a constant 22 m/s, utilizing the cruise control. The data system is set to trigger at 60-percent throttle, and the throttle actuator is set for 85-percent throttle. With the vehicle traveling at a constant 22 m/s and the data system armed, the driver pushes the throttle actuator into position. This causes the transmission to downshift from fourth to third gear. The data system is set to keep approximately 2 seconds of pre-trigger data, and to record for approximately 8 seconds after the throttle application. The final set of straight-line acceleration runs are found in maneuver code K, which are used to determine the shifting characteristics at various throttle positions. For these runs, the gear selector is put in the drive (“D”) position, and the transmission is allowed to shift in its normal mode. Each run is started with the running vehicle stopped with no throttle input, in its test lane, with the driver’s foot on the brake pedal. The data acquisition system is set to trigger on approximately 5-percent throttle input. When the data acquisition system is armed, the driver removes his foot from the brake pedal, and simultaneously pushes the throttle actuator into position. One run was performed at each throttle position, starting at 10 percent and ending at 100 percent with a 10 percent increase in throttle between each run. Data recording for each test continued until the vehicle reached either 33 m/s or a constant speed below 33 m/s.
Table 2. Straight-Line Acceleration Maneuvers
Code # Runs Vx (m/s) % Throttle Gear Pos.
AA 9 0 -> 33 10 D
AB 9 0 -> 33 30 D
AC 11 0 -> 33 75 D
AD 5 0 -> 15 10 1
AE 5 0 -> 15 20 1
AF 5 0 -> 15 30 1
AG 5 0 -> 15 50 1
AH 5 0 -> 15 75 1
AI 5 0 -> 15 100 1
AJ 4 22 -> 33 85 D
AK 11 0 -> 33 10 -> 100 D
BRAKE-IN-A-TURN MANEUVERS - Brake-in-a-turn maneuvers (maneuver code B) are run to provide data for characterizing the interaction of the lateral and longitudinal handling modes of the test vehicle. Table 3 shows the test specifications for the six brake-in-a-turn maneuvers, showing two test speeds, 22 and 33 m/s, each with a low severity and a high severity brake-in-a-turn maneuver. The first four maneuvers were performed with the anti-lock brake system active; the last two were performed with it turned off. All of these maneuvers are run on the VDA.
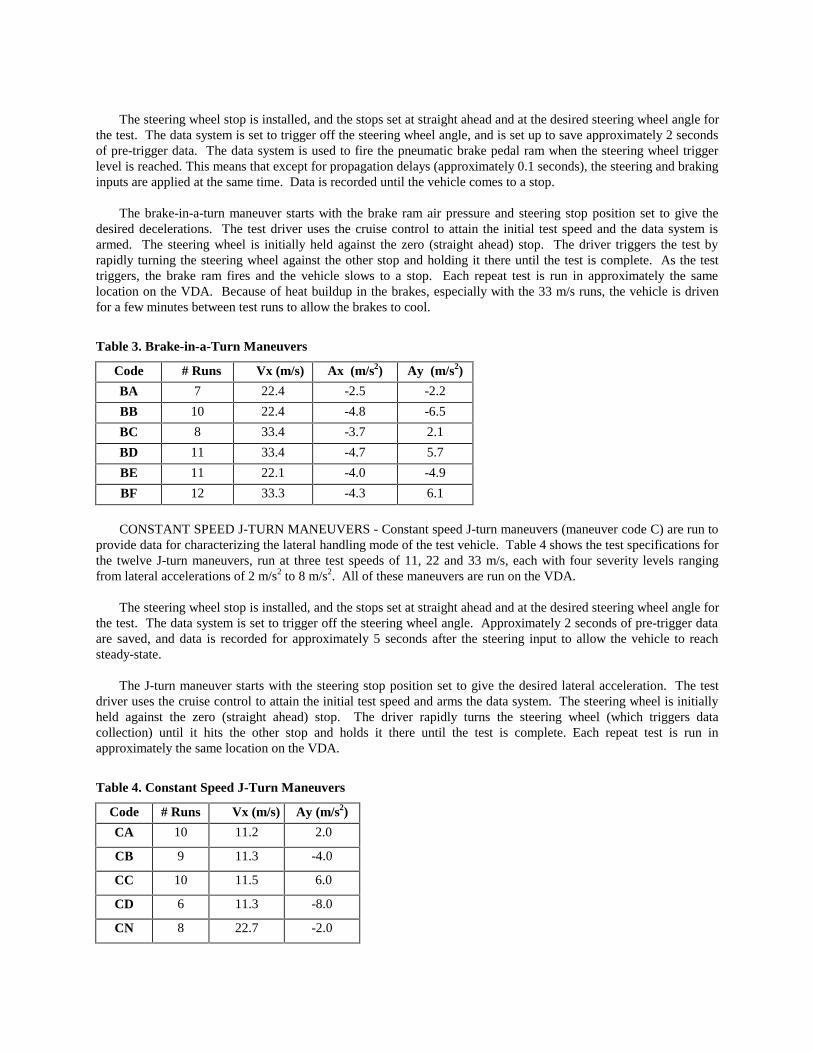
The steering wheel stop is installed, and the stops set at straight ahead and at the desired steering wheel angle for the test. The data system is set to trigger off the steering wheel angle, and is set up to save approximately 2 seconds of pre-trigger data. The data system is used to fire the pneumatic brake pedal ram when the steering wheel trigger level is reached. This means that except for propagation delays (approximately 0.1 seconds), the steering and braking inputs are applied at the same time. Data is recorded until the vehicle comes to a stop. The brake-in-a-turn maneuver starts with the brake ram air pressure and steering stop position set to give the desired decelerations. The test driver uses the cruise control to attain the initial test speed and the data system is armed. The steering wheel is initially held against the zero (straight ahead) stop. The driver triggers the test by rapidly turning the steering wheel against the other stop and holding it there until the test is complete. As the test triggers, the brake ram fires and the vehicle slows to a stop. Each repeat test is run in approximately the same location on the VDA. Because of heat buildup in the brakes, especially with the 33 m/s runs, the vehicle is driven for a few minutes between test runs to allow the brakes to cool.
Table 3. Brake-in-a-Turn Maneuvers
Code # Runs Vx (m/s) Ax (m/s2) Ay (m/s2)
BA 7 22.4 -2.5 -2.2
BB 10 22.4 -4.8 -6.5
BC 8 33.4 -3.7 2.1
BD 11 33.4 -4.7 5.7
BE 11 22.1 -4.0 -4.9
BF 12 33.3 -4.3 6.1
CONSTANT SPEED J-TURN MANEUVERS - Constant speed J-turn maneuvers (maneuver code C) are run to provide data for characterizing the lateral handling mode of the test vehicle. Table 4 shows the test specifications for the twelve J-turn maneuvers, run at three test speeds of 11, 22 and 33 m/s, each with four severity levels ranging from lateral accelerations of 2 m/s2 to 8 m/s2. All of these maneuvers are run on the VDA. The steering wheel stop is installed, and the stops set at straight ahead and at the desired steering wheel angle for the test. The data system is set to trigger off the steering wheel angle. Approximately 2 seconds of pre-trigger data are saved, and data is recorded for approximately 5 seconds after the steering input to allow the vehicle to reach steady-state.
The J-turn maneuver starts with the steering stop position set to give the desired lateral acceleration. The test driver uses the cruise control to attain the initial test speed and arms the data system. The steering wheel is initially held against the zero (straight ahead) stop. The driver rapidly turns the steering wheel (which triggers data collection) until it hits the other stop and holds it there until the test is complete. Each repeat test is run in approximately the same location on the VDA.
Table 4. Constant Speed J-Turn Maneuvers
Code # Runs Vx (m/s) Ay (m/s2)
CA 10 11.2 2.0
CB 9 11.3 -4.0
CC 10 11.5 6.0
CD 6 11.3 -8.0
CN 8 22.7 -2.0
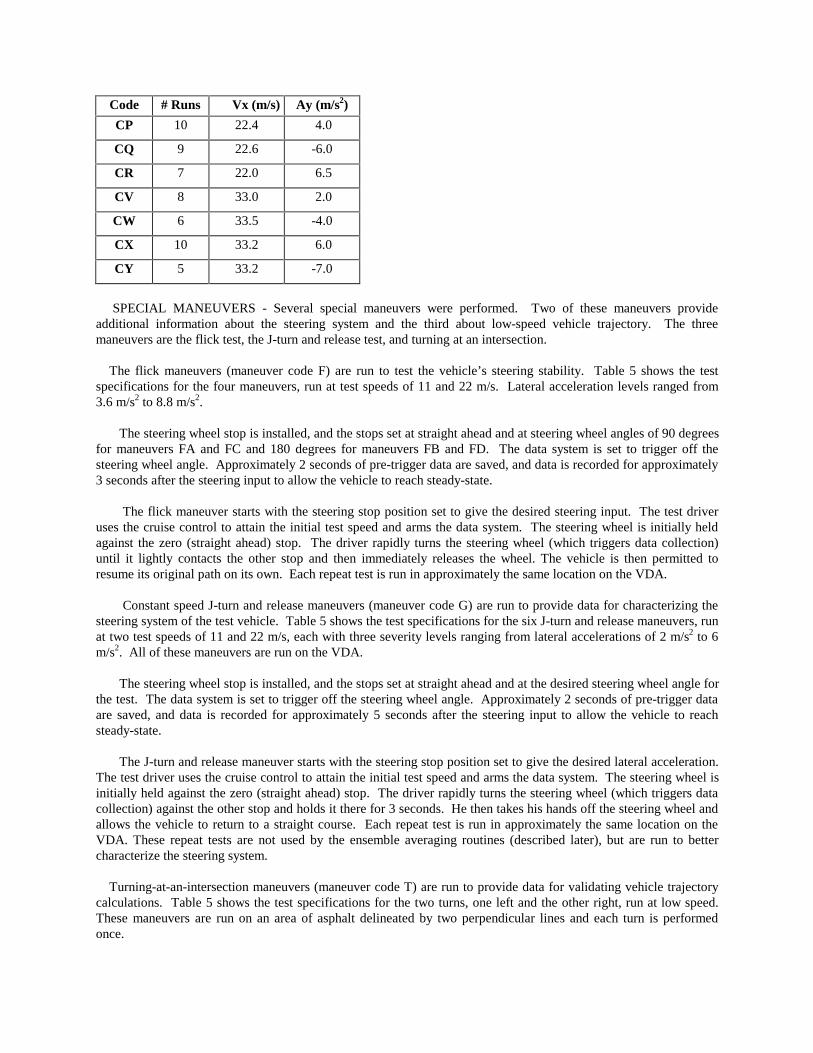
Code # Runs Vx (m/s) Ay (m/s2)
CP 10 22.4 4.0
CQ 9 22.6 -6.0
CR 7 22.0 6.5
CV 8 33.0 2.0
CW 6 33.5 -4.0
CX 10 33.2 6.0
CY 5 33.2 -7.0
SPECIAL MANEUVERS - Several special maneuvers were performed. Two of these maneuvers provide additional information about the steering system and the third about low-speed vehicle trajectory. The three maneuvers are the flick test, the J-turn and release test, and turning at an intersection. The flick maneuvers (maneuver code F) are run to test the vehicle’s steering stability. Table 5 shows the test specifications for the four maneuvers, run at test speeds of 11 and 22 m/s. Lateral acceleration levels ranged from 3.6 m/s2 to 8.8 m/s2. The steering wheel stop is installed, and the stops set at straight ahead and at steering wheel angles of 90 degrees for maneuvers FA and FC and 180 degrees for maneuvers FB and FD. The data system is set to trigger off the steering wheel angle. Approximately 2 seconds of pre-trigger data are saved, and data is recorded for approximately 3 seconds after the steering input to allow the vehicle to reach steady-state.
The flick maneuver starts with the steering stop position set to give the desired steering input. The test driver uses the cruise control to attain the initial test speed and arms the data system. The steering wheel is initially held against the zero (straight ahead) stop. The driver rapidly turns the steering wheel (which triggers data collection) until it lightly contacts the other stop and then immediately releases the wheel. The vehicle is then permitted to resume its original path on its own. Each repeat test is run in approximately the same location on the VDA.
Constant speed J-turn and release maneuvers (maneuver code G) are run to provide data for characterizing the steering system of the test vehicle. Table 5 shows the test specifications for the six J-turn and release maneuvers, run at two test speeds of 11 and 22 m/s, each with three severity levels ranging from lateral accelerations of 2 m/s2 to 6 m/s2. All of these maneuvers are run on the VDA. The steering wheel stop is installed, and the stops set at straight ahead and at the desired steering wheel angle for the test. The data system is set to trigger off the steering wheel angle. Approximately 2 seconds of pre-trigger data are saved, and data is recorded for approximately 5 seconds after the steering input to allow the vehicle to reach steady-state.
The J-turn and release maneuver starts with the steering stop position set to give the desired lateral acceleration. The test driver uses the cruise control to attain the initial test speed and arms the data system. The steering wheel is initially held against the zero (straight ahead) stop. The driver rapidly turns the steering wheel (which triggers data collection) against the other stop and holds it there for 3 seconds. He then takes his hands off the steering wheel and allows the vehicle to return to a straight course. Each repeat test is run in approximately the same location on the VDA. These repeat tests are not used by the ensemble averaging routines (described later), but are run to better characterize the steering system. Turning-at-an-intersection maneuvers (maneuver code T) are run to provide data for validating vehicle trajectory calculations. Table 5 shows the test specifications for the two turns, one left and the other right, run at low speed. These maneuvers are run on an area of asphalt delineated by two perpendicular lines and each turn is performed once.
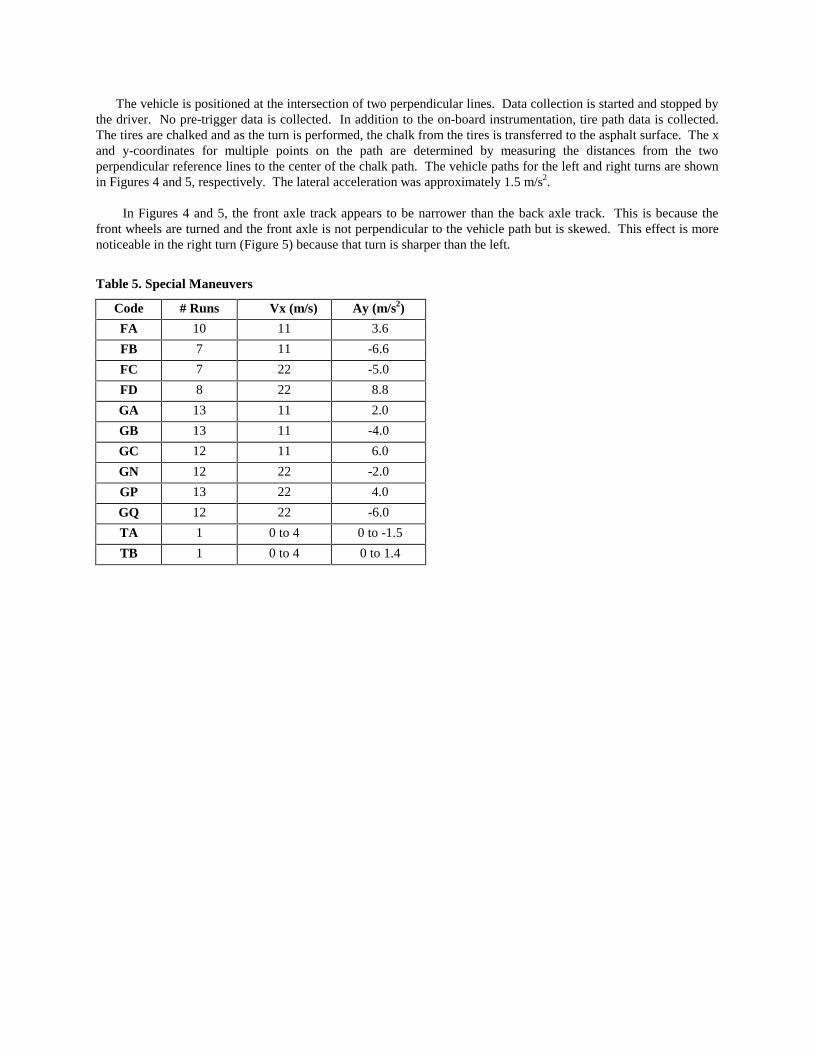
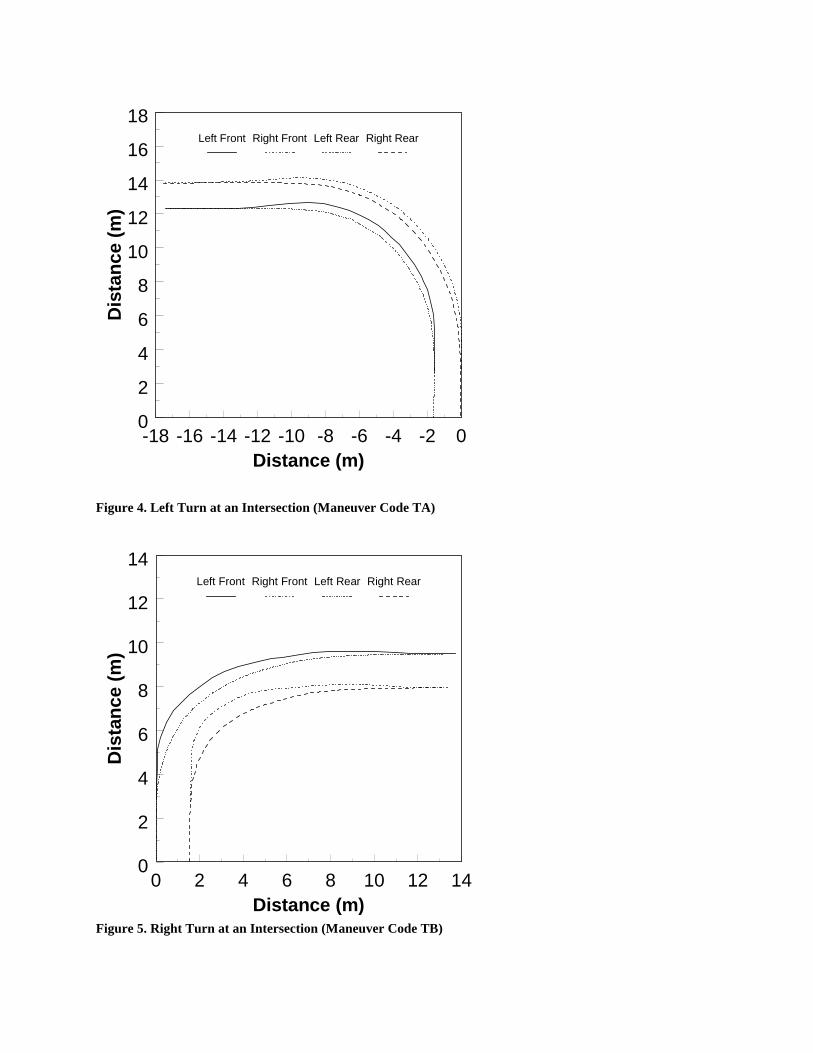
The vehicle is positioned at the intersection of two perpendicular lines. Data collection is started and stopped by the driver. No pre-trigger data is collected. In addition to the on-board instrumentation, tire path data is collected. The tires are chalked and as the turn is performed, the chalk from the tires is transferred to the asphalt surface. The x and y-coordinates for multiple points on the path are determined by measuring the distances from the two perpendicular reference lines to the center of the chalk path. The vehicle paths for the left and right turns are shown in Figures 4 and 5, respectively. The lateral acceleration was approximately 1.5 m/s2. In Figures 4 and 5, the front axle track appears to be narrower than the back axle track. This is because the front wheels are turned and the front axle is not perpendicular to the vehicle path but is skewed. This effect is more noticeable in the right turn (Figure 5) because that turn is sharper than the left.
Table 5. Special Maneuvers
Code # Runs Vx (m/s) Ay (m/s2)
FA 10 11 3.6
FB 7 11 -6.6
FC 7 22 -5.0
FD 8 22 8.8
GA 13 11 2.0
GB 13 11 -4.0
GC 12 11 6.0
GN 12 22 -2.0
GP 13 22 4.0
GQ 12 22 -6.0
TA 1 0 to 4 0 to -1.5
TB 1 0 to 4 0 to 1.4
-18 -16 -14 -12 -10 -8 -6 -4 -2 00
2
4
6
8
10
12
14
16
18
Distance (m)
Dis
tan
ce (
m)
Left Front Right Front Left Rear Right Rear
Figure 4. Left Turn at an Intersection (Maneuver Code TA)
0 2 4 6 8 10 12 140
2
4
6
8
10
12
14
Distance (m)
Dis
tan
ce (
m)
Left Front Right Front Left Rear Right Rear
Figure 5. Right Turn at an Intersection (Maneuver Code TB)
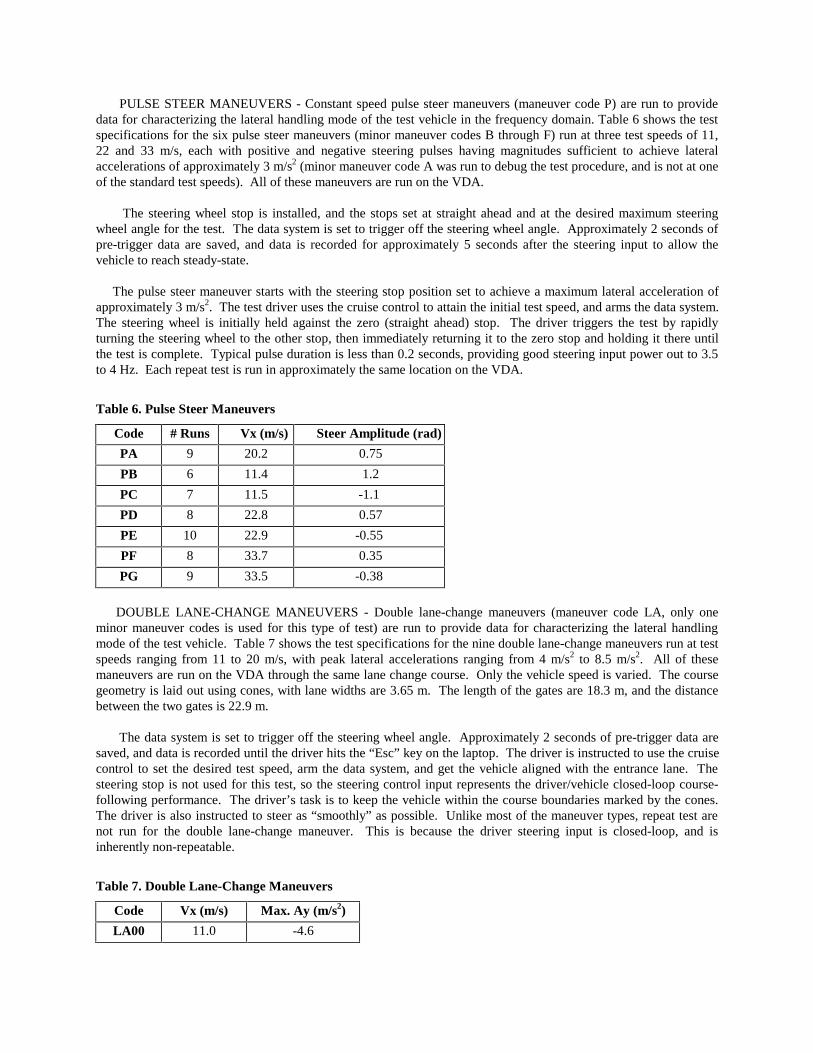
PULSE STEER MANEUVERS - Constant speed pulse steer maneuvers (maneuver code P) are run to provide data for characterizing the lateral handling mode of the test vehicle in the frequency domain. Table 6 shows the test specifications for the six pulse steer maneuvers (minor maneuver codes B through F) run at three test speeds of 11, 22 and 33 m/s, each with positive and negative steering pulses having magnitudes sufficient to achieve lateral accelerations of approximately 3 m/s2 (minor maneuver code A was run to debug the test procedure, and is not at one of the standard test speeds). All of these maneuvers are run on the VDA. The steering wheel stop is installed, and the stops set at straight ahead and at the desired maximum steering wheel angle for the test. The data system is set to trigger off the steering wheel angle. Approximately 2 seconds of pre-trigger data are saved, and data is recorded for approximately 5 seconds after the steering input to allow the vehicle to reach steady-state.
The pulse steer maneuver starts with the steering stop position set to achieve a maximum lateral acceleration of approximately 3 m/s2. The test driver uses the cruise control to attain the initial test speed, and arms the data system. The steering wheel is initially held against the zero (straight ahead) stop. The driver triggers the test by rapidly turning the steering wheel to the other stop, then immediately returning it to the zero stop and holding it there until the test is complete. Typical pulse duration is less than 0.2 seconds, providing good steering input power out to 3.5 to 4 Hz. Each repeat test is run in approximately the same location on the VDA.
Table 6. Pulse Steer Maneuvers
Code # Runs Vx (m/s) Steer Amplitude (rad)
PA 9 20.2 0.75
PB 6 11.4 1.2
PC 7 11.5 -1.1
PD 8 22.8 0.57
PE 10 22.9 -0.55
PF 8 33.7 0.35
PG 9 33.5 -0.38
DOUBLE LANE-CHANGE MANEUVERS - Double lane-change maneuvers (maneuver code LA, only one minor maneuver codes is used for this type of test) are run to provide data for characterizing the lateral handling mode of the test vehicle. Table 7 shows the test specifications for the nine double lane-change maneuvers run at test speeds ranging from 11 to 20 m/s, with peak lateral accelerations ranging from 4 m/s2 to 8.5 m/s2. All of these maneuvers are run on the VDA through the same lane change course. Only the vehicle speed is varied. The course geometry is laid out using cones, with lane widths are 3.65 m. The length of the gates are 18.3 m, and the distance between the two gates is 22.9 m. The data system is set to trigger off the steering wheel angle. Approximately 2 seconds of pre-trigger data are saved, and data is recorded until the driver hits the “Esc” key on the laptop. The driver is instructed to use the cruise control to set the desired test speed, arm the data system, and get the vehicle aligned with the entrance lane. The steering stop is not used for this test, so the steering control input represents the driver/vehicle closed-loop course-following performance. The driver’s task is to keep the vehicle within the course boundaries marked by the cones. The driver is also instructed to steer as “smoothly” as possible. Unlike most of the maneuver types, repeat test are not run for the double lane-change maneuver. This is because the driver steering input is closed-loop, and is inherently non-repeatable.
Table 7. Double Lane-Change Maneuvers
Code Vx (m/s) Max. Ay (m/s2)
LA00 11.0 -4.6
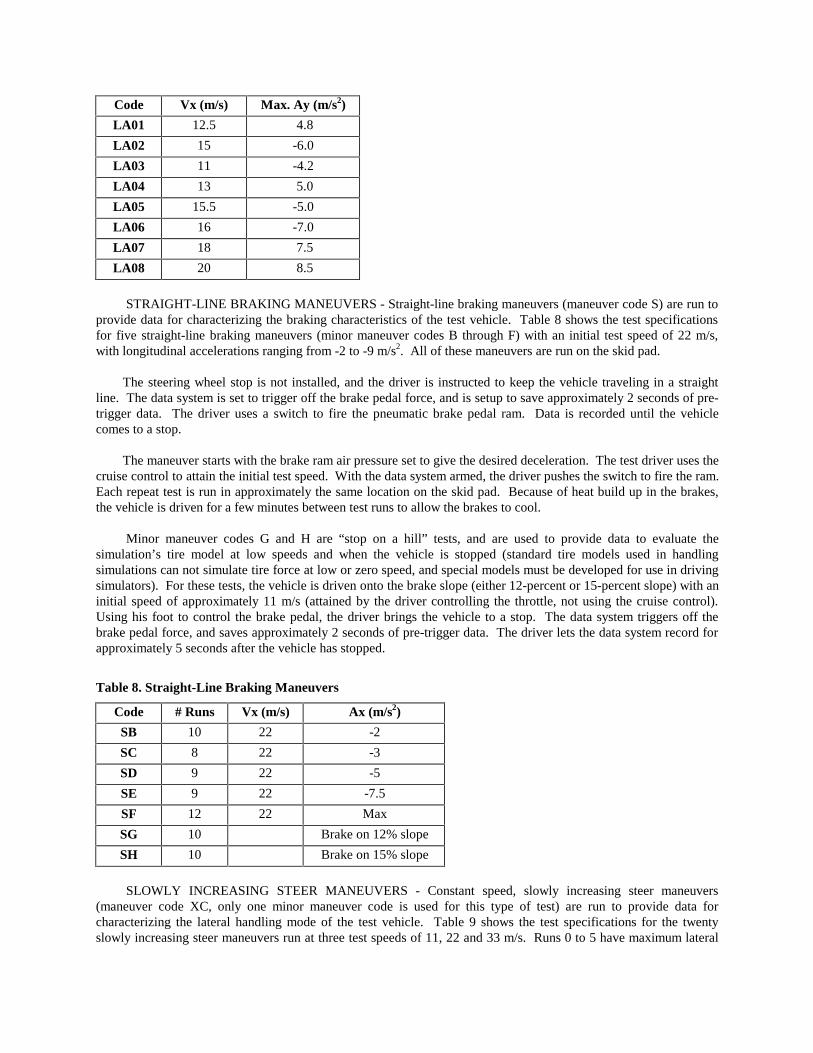
Code Vx (m/s) Max. Ay (m/s2)
LA01 12.5 4.8
LA02 15 -6.0
LA03 11 -4.2
LA04 13 5.0
LA05 15.5 -5.0
LA06 16 -7.0
LA07 18 7.5
LA08 20 8.5
STRAIGHT-LINE BRAKING MANEUVERS - Straight-line braking maneuvers (maneuver code S) are run to provide data for characterizing the braking characteristics of the test vehicle. Table 8 shows the test specifications for five straight-line braking maneuvers (minor maneuver codes B through F) with an initial test speed of 22 m/s, with longitudinal accelerations ranging from -2 to -9 m/s2. All of these maneuvers are run on the skid pad. The steering wheel stop is not installed, and the driver is instructed to keep the vehicle traveling in a straight line. The data system is set to trigger off the brake pedal force, and is setup to save approximately 2 seconds of pre-trigger data. The driver uses a switch to fire the pneumatic brake pedal ram. Data is recorded until the vehicle comes to a stop.
The maneuver starts with the brake ram air pressure set to give the desired deceleration. The test driver uses the cruise control to attain the initial test speed. With the data system armed, the driver pushes the switch to fire the ram. Each repeat test is run in approximately the same location on the skid pad. Because of heat build up in the brakes, the vehicle is driven for a few minutes between test runs to allow the brakes to cool.
Minor maneuver codes G and H are “stop on a hill” tests, and are used to provide data to evaluate the simulation’s tire model at low speeds and when the vehicle is stopped (standard tire models used in handling simulations can not simulate tire force at low or zero speed, and special models must be developed for use in driving simulators). For these tests, the vehicle is driven onto the brake slope (either 12-percent or 15-percent slope) with an initial speed of approximately 11 m/s (attained by the driver controlling the throttle, not using the cruise control). Using his foot to control the brake pedal, the driver brings the vehicle to a stop. The data system triggers off the brake pedal force, and saves approximately 2 seconds of pre-trigger data. The driver lets the data system record for approximately 5 seconds after the vehicle has stopped.
Table 8. Straight-Line Braking Maneuvers
Code # Runs Vx (m/s) Ax (m/s2)
SB 10 22 -2
SC 8 22 -3
SD 9 22 -5
SE 9 22 -7.5
SF 12 22 Max
SG 10 Brake on 12% slope
SH 10 Brake on 15% slope
SLOWLY INCREASING STEER MANEUVERS - Constant speed, slowly increasing steer maneuvers (maneuver code XC, only one minor maneuver code is used for this type of test) are run to provide data for characterizing the lateral handling mode of the test vehicle. Table 9 shows the test specifications for the twenty slowly increasing steer maneuvers run at three test speeds of 11, 22 and 33 m/s. Runs 0 to 5 have maximum lateral
accelerations of approximately 4 m/s2, while runs 6 to 19 are run to the vehicle’s maximum lateral acceleration (approximately 8 m/s2). All these maneuvers are run on the VDA. The steering wheel stop is not installed for these tests, with the driver attempting to input a slow ramp input to the steering wheel. The data system is set to trigger off the steering wheel angle. No pre-trigger data is saved, and data is recorded until the driver manually stops the recording.
The maneuver starts with the test driver using the cruise control to attain the desired test speed. With the data system armed, and the vehicle traveling in a straight line, the driver starts the data recording. After a few seconds, the driver slowly starts to steer in the specified direction, trying to input a constant rate steering wheel angle ramp input. When the desired maximum lateral acceleration is reached, the driver stops the data recording, and brings the vehicle to a stop. At all test speeds, the maneuvers are run with both positive and negative steering inputs to characterize any vehicle asymmetries.
While this is a closed-loop steering maneuver, each vehicle speed/steering direction combination is repeated two or three times. These repeat tests are not used by the ensemble averaging routines, but are run to better characterize the vehicle steady-state limit performance. COAST-DOWN MANEUVERS - Coast-down maneuvers (maneuver code XF, only one minor maneuver code is used for this type of test) are run to provide data for characterizing the aerodynamic and rolling drag of the test vehicle. Table 9 shows the test specifications for the 10 coast-down runs, all of which start at 33 m/s. All of these runs are done on the skid pad. The steering wheel stop is not installed for these tests, with the driver attempting to keep the vehicle traveling in a straight line with as little steering as possible. The data system is triggered manually by the test driver. No pre-trigger data is saved, and data is recorded until the vehicle speed drops below approximately 6.5 m/s.
The maneuver starts with the test driver using the cruise control to attain the desired test speed. With the data system armed and the vehicle traveling in a straight line, the driver shifts the transmission into neutral, then starts the data system. The driver’s task now is to keep the vehicle in its lane using as few steering corrections as possible. ON-CENTER WEAVE MANEUVERS - On-center weave maneuvers (maneuver code XH, only one minor maneuver code is used for this type of test) are run to provide data for characterizing the on-center handling and steering system of the test vehicle. A detailed description of this test can be found in reference [10]. Table 9 shows the test specifications for the 25 on-center weave runs, which are run at speeds of 13, 22, and 33 m/s. All these runs are done on the VDA. The steering wheel stop is not installed for these tests, with the driver attempting to input a 0.2-Hz sinusoidal steering input with an amplitude to produce a maximum lateral acceleration of 2 m/s2. The data system is triggered manually by the test driver. No pre-trigger data is saved, and data is recorded until the driver manually stops the data system.
The maneuver starts with the test driver using the cruise control to attain the desired test speed. With the data system armed, and the vehicle traveling in a straight line, the driver starts the data system. The drivers task now is to input a 0.2-Hz sinusoidal steering input with an amplitude to produce a maximum lateral acceleration of 2 m/s2. The driver inputs one-and-a-half to two full cycles, then returns the steering wheel to zero (straight ahead), and turns off the data system.
While this is a closed-loop steering maneuver, each test is repeated approximately six times. These repeat tests are not used by the ensemble averaging routines, but are run to better characterize the vehicle steering system. ON-CENTER TRANSITION MANEUVERS - On-center transition maneuvers (maneuver code XI, only one minor maneuver code is used for this type of test) are run to provide data for characterizing the on-center handling and steering system of the test vehicle. A detailed description of this test can be found in reference [10]. Table 9
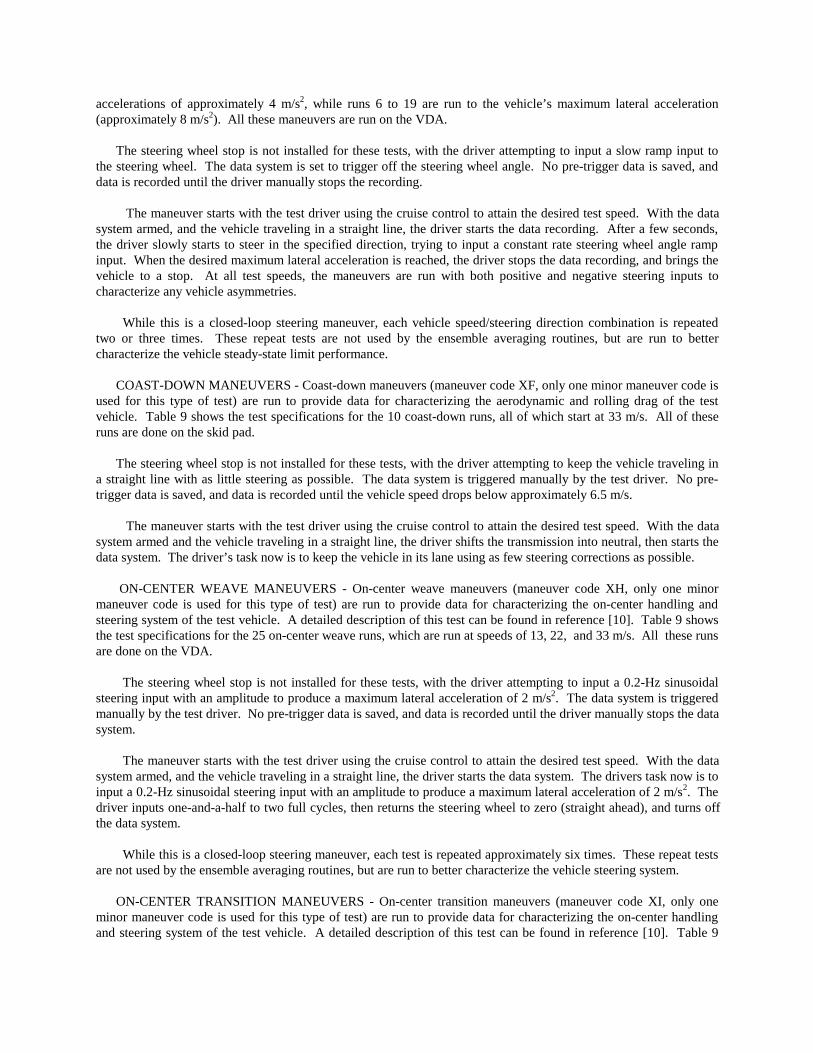
shows the test specifications for the 49 on-center transition runs, which are run at speeds of 13, 22, 33 m/s. At each test speed, runs with positive and negative steering inputs are run. All these runs are done on the VDA. The steering wheel stop is not installed for these tests, with the driver attempting to gradually move the steering wheel from a “hands off” straight ahead condition to a low-g cornering condition. The data system is triggered manually by the test driver. No pre-trigger data is saved, and data is recorded until the driver manually stops the data system.
The maneuver starts with the test driver using the cruise control to attain the desired test speed. With the data system armed and the vehicle traveling in a straight line with his hands off the steering wheel, the driver starts the data system. The driver’s task now is to lightly place his palms on the steering wheel, and slowly turn it either clockwise or counterclockwise. The driver turns the wheel until the vehicle is cornering at 1 to 2 m/s2, then turns off the data system.
While this is a closed-loop steering maneuver, each test is repeated approximately six times in each steering direction. These repeat tests are not used by the ensemble averaging routines, but are run to better characterize the steering system. COAST-TO-STOP ON SLOPE MANEUVERS - Coast-to-stop on slope maneuvers (maneuver code XP and XQ) are run to provide data for characterizing the low speed tire models used with driving simulators. Table 9 shows the test specifications for tests done on 12 and 15-percent slopes. All of these runs are done on the brake slope facility. These tests are very similar to tests SG and SH, (described earlier) except rather than braking to a stop, the slope is used to stop the vehicle, before the brakes are applied. The data system is triggered manually by the test driver. No pre-trigger data is saved, and data is recorded until the driver manually stops the data system.
The maneuver starts with the test driver approaching the brake slope at approximately 10 m/s. Before the beginning of the brake slope, the data system is manually triggered, and the throttle released. When the vehicle comes to a stop on the slope, the driver pushes the brake pedal to keep the vehicle from rolling back down the slope. After waiting a few seconds, the driver manually turns off the data system.
Table 9. Miscellaneous Maneuvers
Code Description # Runs Vx (m/s)
XC00 Slowly Increasing Steer - negative 1 12
XC01 Slowly Increasing Steer - negative 1 22
XC02 Slowly Increasing Steer - negative 1 32
XC03 Slowly Increasing Steer - positive 1 11
XC04 Slowly Increasing Steer - positive 1 23
XC05 Slowly Increasing Steer - positive 1 33
XC06-07 Slowly Increasing Steer - negative 2 11
XC08-09 Slowly Increasing Steer - positive 2 11
XC10-11 Slowly Increasing Steer - negative 2 22
XC12-13 Slowly Increasing Steer - positive 2 22
XC14-15 Slowly Increasing Steer - negative 2 33
XC16-19 Slowly Increasing Steer - positive 4 33
XF Coast-Down 10 33
XH01-7 On-Center: Weave 7 22
XH08-12 On-Center: Weave 5 13
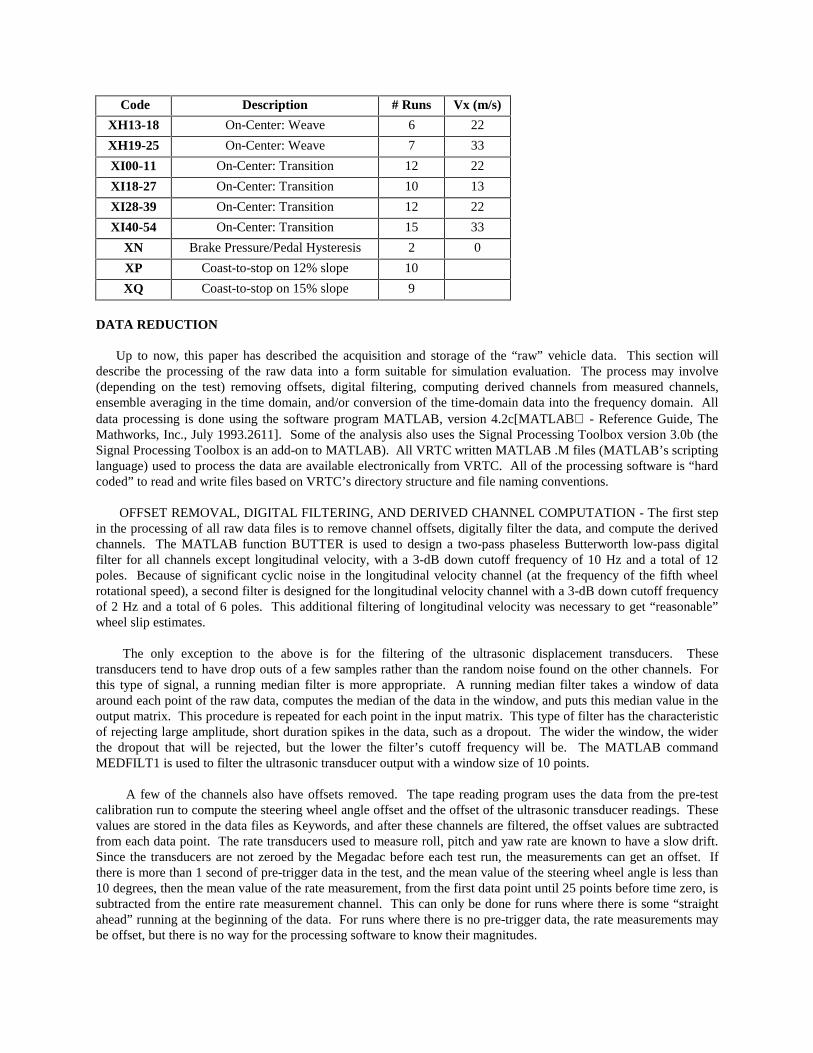
Code Description # Runs Vx (m/s)
XH13-18 On-Center: Weave 6 22
XH19-25 On-Center: Weave 7 33
XI00-11 On-Center: Transition 12 22
XI18-27 On-Center: Transition 10 13
XI28-39 On-Center: Transition 12 22
XI40-54 On-Center: Transition 15 33
XN Brake Pressure/Pedal Hysteresis 2 0
XP Coast-to-stop on 12% slope 10
XQ Coast-to-stop on 15% slope 9
DATA REDUCTION Up to now, this paper has described the acquisition and storage of the “raw” vehicle data. This section will describe the processing of the raw data into a form suitable for simulation evaluation. The process may involve (depending on the test) removing offsets, digital filtering, computing derived channels from measured channels, ensemble averaging in the time domain, and/or conversion of the time-domain data into the frequency domain. All data processing is done using the software program MATLAB, version 4.2c[MATLAB - Reference Guide, The Mathworks, Inc., July 1993.2611]. Some of the analysis also uses the Signal Processing Toolbox version 3.0b (the Signal Processing Toolbox is an add-on to MATLAB). All VRTC written MATLAB .M files (MATLAB’s scripting language) used to process the data are available electronically from VRTC. All of the processing software is “hard coded” to read and write files based on VRTC’s directory structure and file naming conventions.
OFFSET REMOVAL, DIGITAL FILTERING, AND DERIVED CHANNEL COMPUTATION - The first step in the processing of all raw data files is to remove channel offsets, digitally filter the data, and compute the derived channels. The MATLAB function BUTTER is used to design a two-pass phaseless Butterworth low-pass digital filter for all channels except longitudinal velocity, with a 3-dB down cutoff frequency of 10 Hz and a total of 12 poles. Because of significant cyclic noise in the longitudinal velocity channel (at the frequency of the fifth wheel rotational speed), a second filter is designed for the longitudinal velocity channel with a 3-dB down cutoff frequency of 2 Hz and a total of 6 poles. This additional filtering of longitudinal velocity was necessary to get “reasonable” wheel slip estimates.
The only exception to the above is for the filtering of the ultrasonic displacement transducers. These transducers tend to have drop outs of a few samples rather than the random noise found on the other channels. For this type of signal, a running median filter is more appropriate. A running median filter takes a window of data around each point of the raw data, computes the median of the data in the window, and puts this median value in the output matrix. This procedure is repeated for each point in the input matrix. This type of filter has the characteristic of rejecting large amplitude, short duration spikes in the data, such as a dropout. The wider the window, the wider the dropout that will be rejected, but the lower the filter’s cutoff frequency will be. The MATLAB command MEDFILT1 is used to filter the ultrasonic transducer output with a window size of 10 points.
A few of the channels also have offsets removed. The tape reading program uses the data from the pre-test calibration run to compute the steering wheel angle offset and the offset of the ultrasonic transducer readings. These values are stored in the data files as Keywords, and after these channels are filtered, the offset values are subtracted from each data point. The rate transducers used to measure roll, pitch and yaw rate are known to have a slow drift. Since the transducers are not zeroed by the Megadac before each test run, the measurements can get an offset. If there is more than 1 second of pre-trigger data in the test, and the mean value of the steering wheel angle is less than 10 degrees, then the mean value of the rate measurement, from the first data point until 25 points before time zero, is subtracted from the entire rate measurement channel. This can only be done for runs where there is some “straight ahead” running at the beginning of the data. For runs where there is no pre-trigger data, the rate measurements may be offset, but there is no way for the processing software to know their magnitudes.
A number of “derived” channels are also computed and included in the output file. Derived channels are channels computed by combining other channels, for example chassis roll angle, which is computed from the difference between the two ultrasonic ride height measurements. The derived channels are front and rear strut lengths, average steering wheel torque, steering rack position, power steering assist force, transmission gear number, chassis roll and pitch angles, and longitudinal wheel slip ratios. TIME-DOMAIN ENSEMBLE AVERAGING - In the late 1980’s, VRTC conducted a large simulation evaluation project [4, 5] whose aim was to rank NHTSA’s vehicle dynamics simulations. Much of the methodology developed during that project has been used in the current project. One development of the earlier project was to measure random experimental error by running repeat tests, and ensemble averaging each data channel in the time domain. There are two significant benefits to this procedure. First, by repeating each test (typically 10 times at VRTC), the influence of unmeasureable disturbances is greatly reduced (a wind gust, or a small area of the test surface with reduced friction for example). Secondly, it provides a measure of experimental uncertainty. It is VRTC’s opinion that when comparing simulation predictions to experimental measurements, that the required accuracy of the simulation predictions can only be assessed within the experimental uncertainty (e.g. if experimentally, the uncertainty of the chassis roll angle measurement is ±1 degree, then if the simulation’s roll angle prediction is within 1 degree of the experiment, it is accurate to within the uncertainty of the experiment). This section describes the time-domain ensemble averaging of the test data. For each channel (measured and derived) in the filtered data files, the mean value and the 95-percent confidence interval of the mean are computed as a function of time. The interpretation of the confidence limits is that given the number of experiments, the mean value of the data is within the confidence interval to within 95-percent confidence (it does not say that the data will fall within the confidence interval to within 95-percent confidence, just that the actual mean of the data is within the interval). The 95-percent confidence interval round the mean is computed by:
ε α= ⋅−ts
nn/ ,2 1 (1)
where ε is the distance from the mean to the upper or lower boundary of the confidence interval, t nα / ,2 1− defines the
spread of the Gaussian distribution using the student t-distribution, s is the standard deviation of the data normalized by n-1 (computed using the MATLAB function std), and n is the number of runs used to compute the mean (see references 4 and 5 for a more complete explanation). COMPUTATION OF VEHICLE FREQUENCY RESPONSES - The filtering and ensemble averaging procedures described in the previous two sections prepare the experimental data for use with time-domain simulation evaluation methods. At VRTC, simulation evaluation is also performed in the frequency domain. Vehicle frequency responses to steering inputs are computed from the pulse steer (maneuver code P) tests for lateral acceleration, yaw rate, roll rate, and roll angle. The method used to compute the frequency responses is described in detail in [12], and the mathematics are not repeated here. The frequency responses are computed based on repeat pulse steer runs. The test matrix defines both positive and negative steering angle pulse inputs at each of the three test speeds, and frequency responses are computed for each of the six conditions. For each run, the Power Spectral Density (PSD) of the steering wheel angle, the Cross Spectral Density (CSD) between lateral acceleration, yaw rate, roll rate, and roll angle and steering wheel angle, and the coherence between lateral acceleration, yaw rate, roll rate, and roll angle and steering wheel angle are computed. The MATLAB functions PSD, CSD, and COHERE are used to compute the PSD, CSD, and coherence. These functions are from the signal processing toolbox. All three functions use Welch's averaged periodogram method, which averages overlapping windowed (Hanning window) segments of the input vectors. The segments are 256 points long with a 128-point overlap. After the PSD’s, CSD’s, and coherences have been computed for each run, for each frequency response to be computed, the mean value of the PSD, CSD, and coherence is computed (refer to reference [12] for details). The mean value of the frequency response is then computed by dividing the mean PSD by the mean CSD. The
magnitude and phase angle of the complex result are found using MATLAB’s abs and angle commands. The 95-percent confidence interval is computed using the equation
( )
( )
( )ε
γ
γf
f
P
f
io
n
io
=−
−−
−cos 1
2
2
2
11
1 (2)
where ( )ε f is the confidence as a function of frequency f, ( )io
f2γ is the computed coherence, n is the number of
runs used, and P is the confidence level (in this case P=0.95). SAMPLE RESULTS This section presents a sample of the experimental measurements in both its raw and processed form. Issues of both experimental noise and repeatability are discussed. Computed vehicle frequency responses are also shown. While the repeat testing and ensemble averaging performed at VRTC reduces the effects of random measurement noise, it is still important to keep the noise levels low. The term “measurement noise” is used here to represent the random variations in the data from transducer uncertainty, electrical and digitizing uncertainty, road roughness, variations in the tire/road friction, wind noise, other vibrations from the car itself, etc. This list is meant to represent everything in the physical measurement process and the vehicle that is not modeled by the vehicle dynamics simulations. The simulations represent idealized, deterministic vehicles operating on smooth, constant friction roads. The actual vehicle/road/measurement system is a stochastic process, operating in the presence of unknown disturbances.
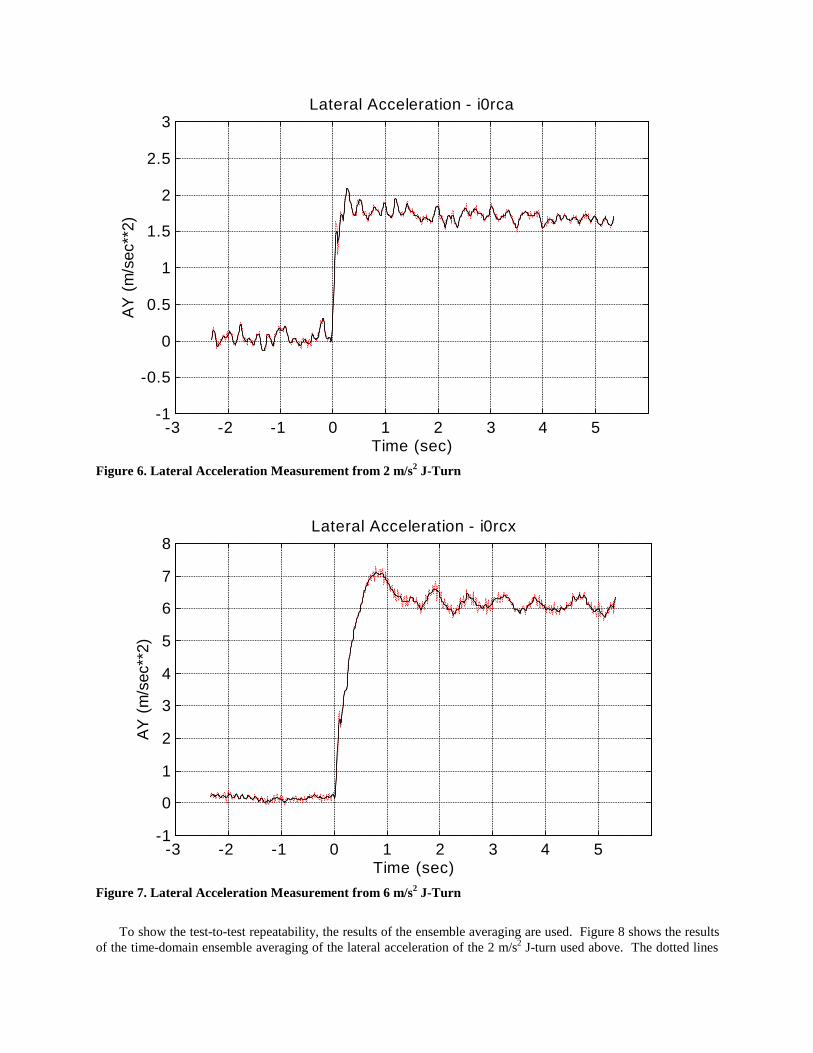
To demonstrate the nominal levels of measurement noise, Figure 6 shows the lateral acceleration measurement from an 11 m/s longitudinal velocity, 2 m/s2 lateral acceleration J-Turn run (V0RCA05). The dotted line is the raw data, and the solid line is the digitally filtered data. In the time range of 2 to 5 seconds, the vehicle is in steady-state (from a vehicle handling point of view). Using the raw data in this time period, the mean lateral acceleration is 1.69 m/s2, and the standard deviation is 0.067 m/s2. Using two standard deviations around the mean to contain 95 percent of the data, for this run, 95 percent of the measured data is within 8 percent of the mean. Figure 7 shows the lateral acceleration measurement from a 33 m/s longitudinal velocity, 6 m/s2 lateral acceleration J-Turn run (V0RCX06). For this run, the mean lateral acceleration is 6.11 m/s2, and the standard deviation is 0.195 ms2, so 95 percent of the measured data was within about 6 percent of the mean.
-3 -2 -1 0 1 2 3 4 5-1
-0.5
0
0.5
1
1.5
2
2.5
3
Time (sec)
AY
(m
/sec
**2)
Lateral Acceleration - i0rca
Figure 6. Lateral Acceleration Measurement from 2 m/s2 J-Turn
-3 -2 -1 0 1 2 3 4 5-1
0
1
2
3
4
5
6
7
8
Time (sec)
AY
(m
/sec
**2)
Lateral Acceleration - i0rcx
Figure 7. Lateral Acceleration Measurement from 6 m/s2 J-Turn
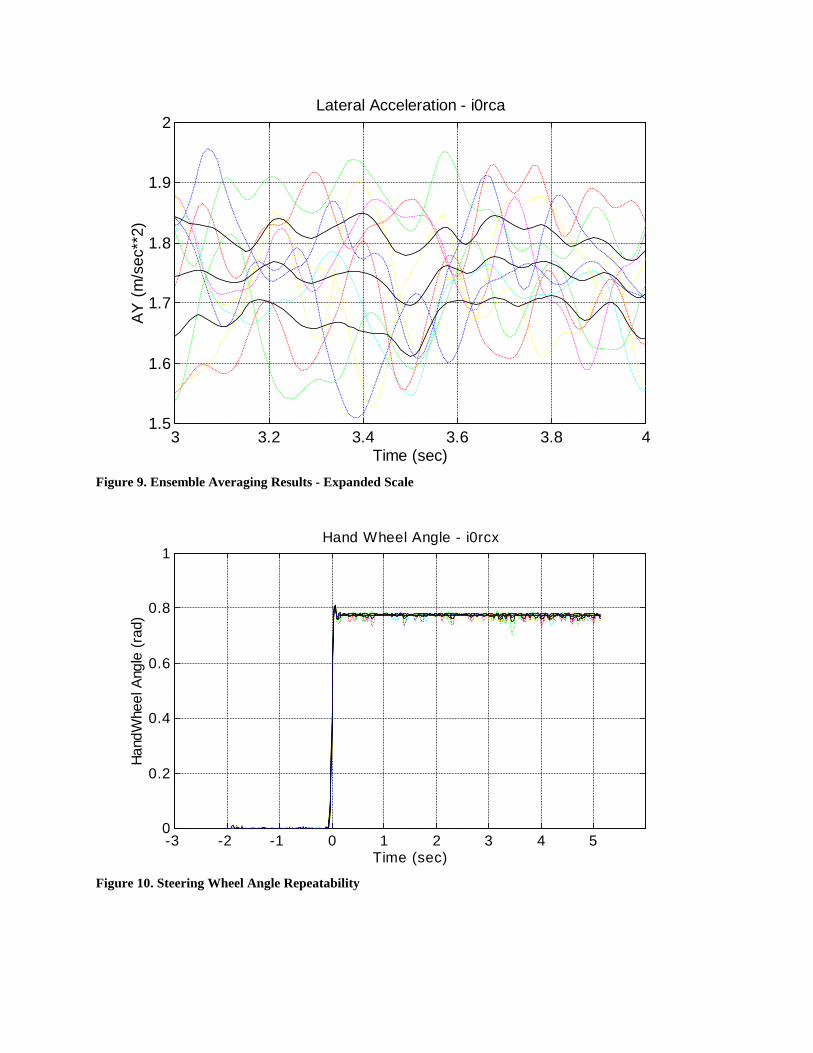
To show the test-to-test repeatability, the results of the ensemble averaging are used. Figure 8 shows the results of the time-domain ensemble averaging of the lateral acceleration of the 2 m/s2 J-turn used above. The dotted lines
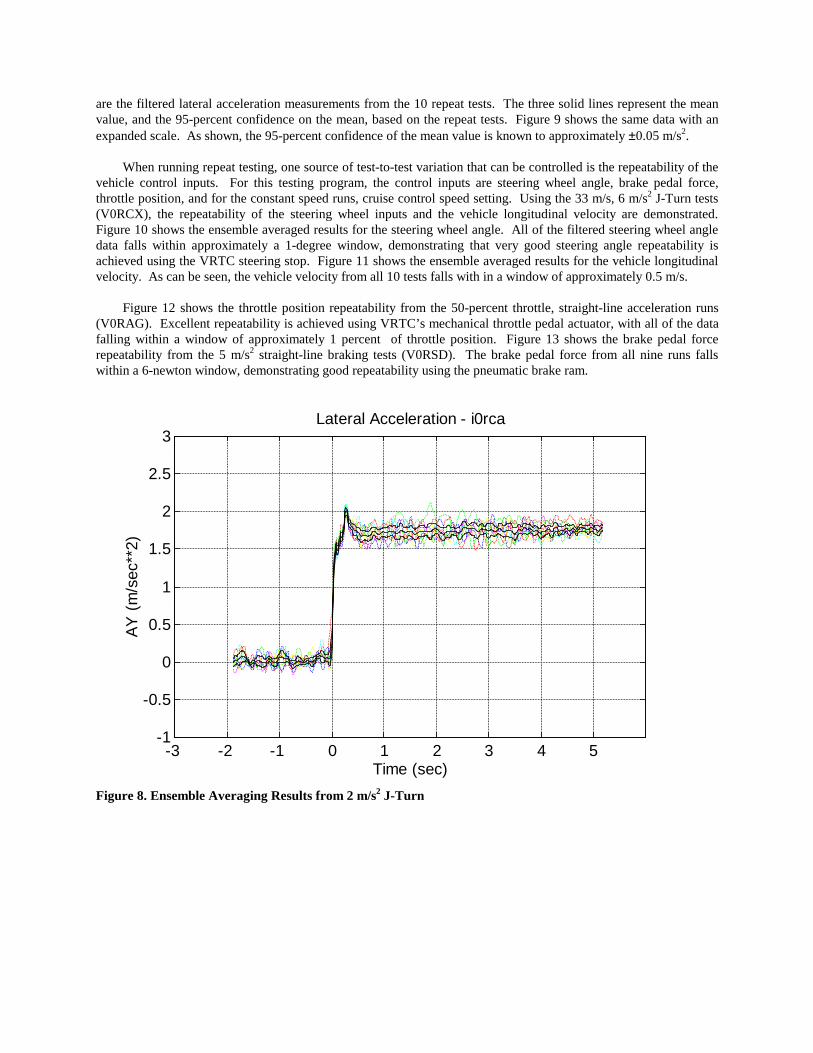
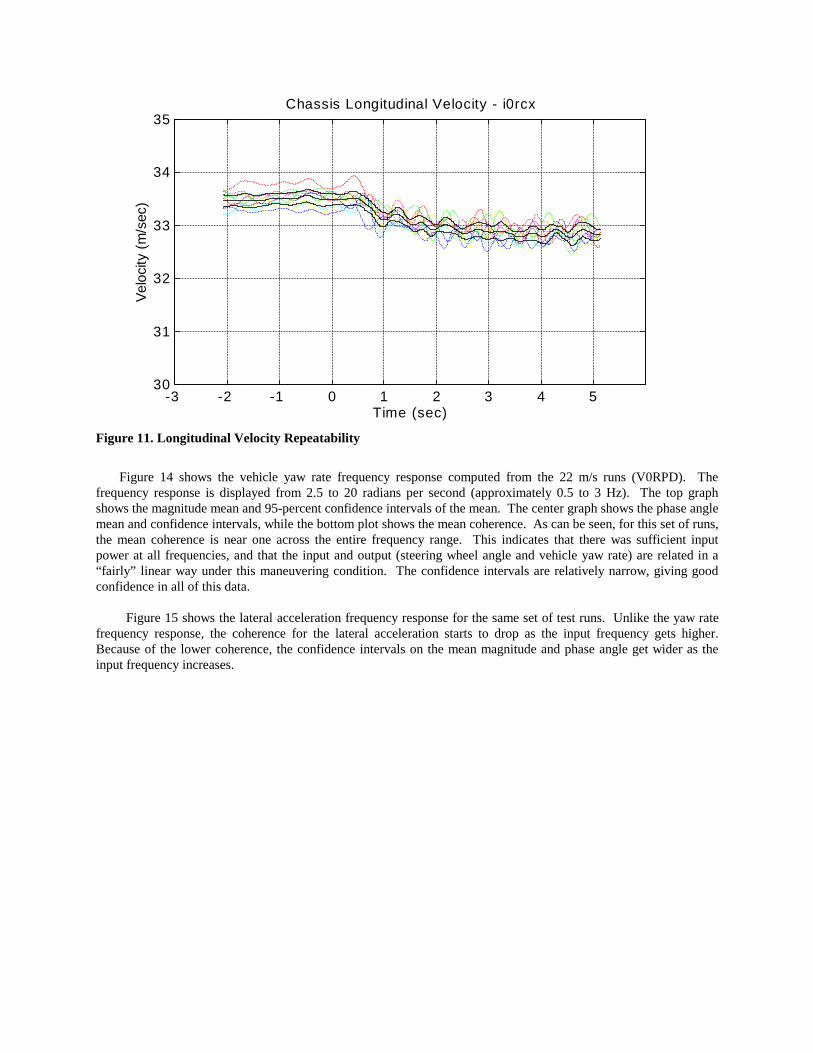
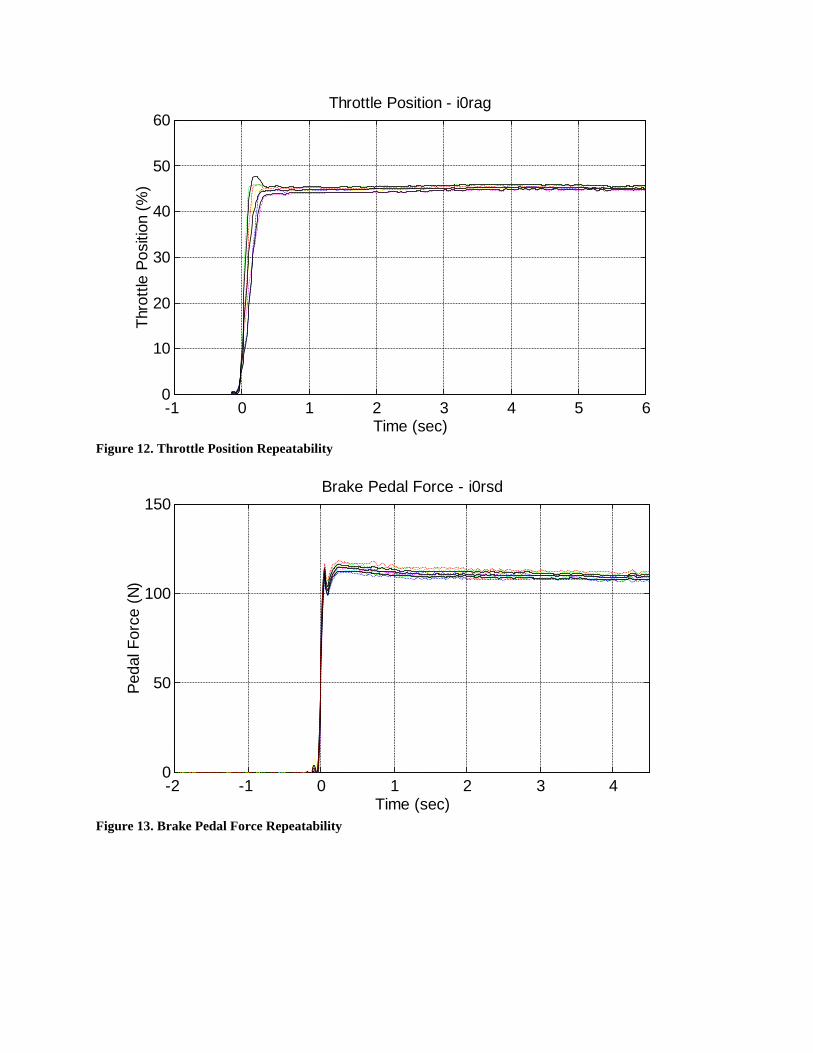
are the filtered lateral acceleration measurements from the 10 repeat tests. The three solid lines represent the mean value, and the 95-percent confidence on the mean, based on the repeat tests. Figure 9 shows the same data with an expanded scale. As shown, the 95-percent confidence of the mean value is known to approximately ±0.05 m/s2. When running repeat testing, one source of test-to-test variation that can be controlled is the repeatability of the vehicle control inputs. For this testing program, the control inputs are steering wheel angle, brake pedal force, throttle position, and for the constant speed runs, cruise control speed setting. Using the 33 m/s, 6 m/s2 J-Turn tests (V0RCX), the repeatability of the steering wheel inputs and the vehicle longitudinal velocity are demonstrated. Figure 10 shows the ensemble averaged results for the steering wheel angle. All of the filtered steering wheel angle data falls within approximately a 1-degree window, demonstrating that very good steering angle repeatability is achieved using the VRTC steering stop. Figure 11 shows the ensemble averaged results for the vehicle longitudinal velocity. As can be seen, the vehicle velocity from all 10 tests falls with in a window of approximately 0.5 m/s. Figure 12 shows the throttle position repeatability from the 50-percent throttle, straight-line acceleration runs (V0RAG). Excellent repeatability is achieved using VRTC’s mechanical throttle pedal actuator, with all of the data falling within a window of approximately 1 percent of throttle position. Figure 13 shows the brake pedal force repeatability from the 5 m/s2 straight-line braking tests (V0RSD). The brake pedal force from all nine runs falls within a 6-newton window, demonstrating good repeatability using the pneumatic brake ram.
-3 -2 -1 0 1 2 3 4 5-1
-0.5
0
0.5
1
1.5
2
2.5
3
Time (sec)
AY
(m
/sec
**2)
Lateral Acceleration - i0rca
Figure 8. Ensemble Averaging Results from 2 m/s2 J-Turn
3 3.2 3.4 3.6 3.8 41.5
1.6
1.7
1.8
1.9
2
Time (sec)
AY
(m
/sec
**2)
Lateral Acceleration - i0rca
Figure 9. Ensemble Averaging Results - Expanded Scale
-3 -2 -1 0 1 2 3 4 50
0.2
0.4
0.6
0.8
1
Time (sec)
Han
dWhe
el A
ngle
(ra
d)
Hand Wheel Angle - i0rcx
Figure 10. Steering Wheel Angle Repeatability
-3 -2 -1 0 1 2 3 4 530
31
32
33
34
35
Time (sec)
Vel
ocity
(m
/sec
)
Chassis Longitudinal Velocity - i0rcx
Figure 11. Longitudinal Velocity Repeatability
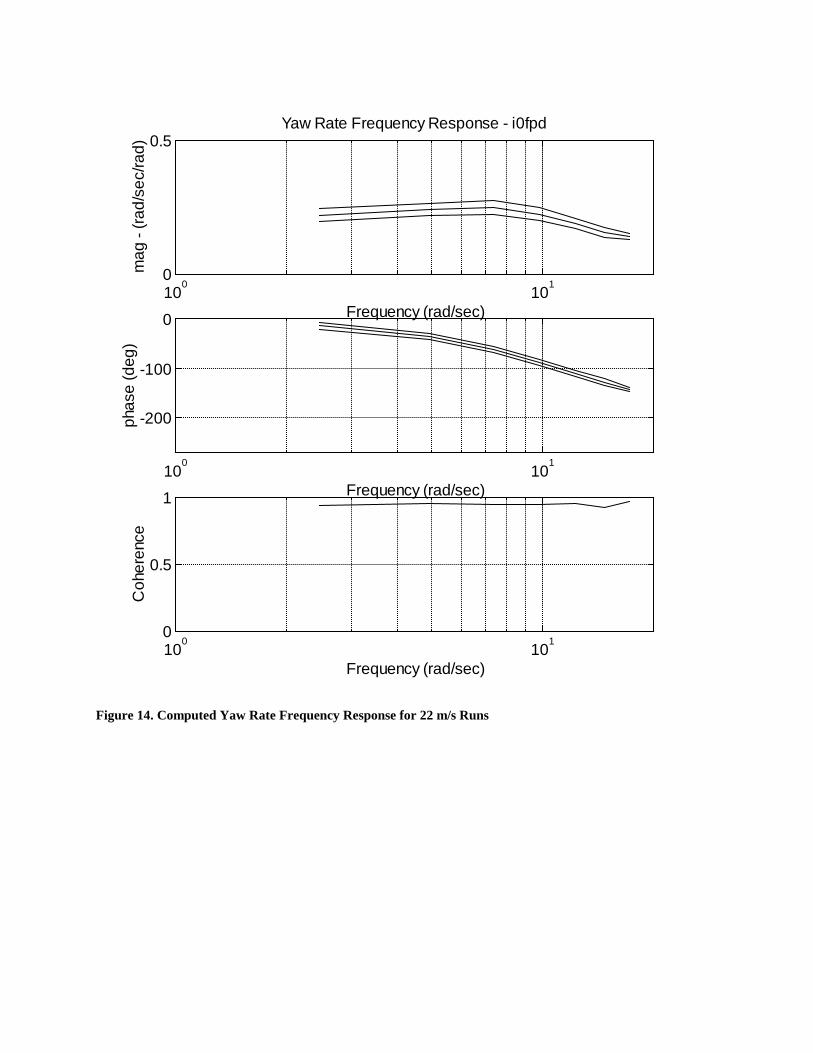
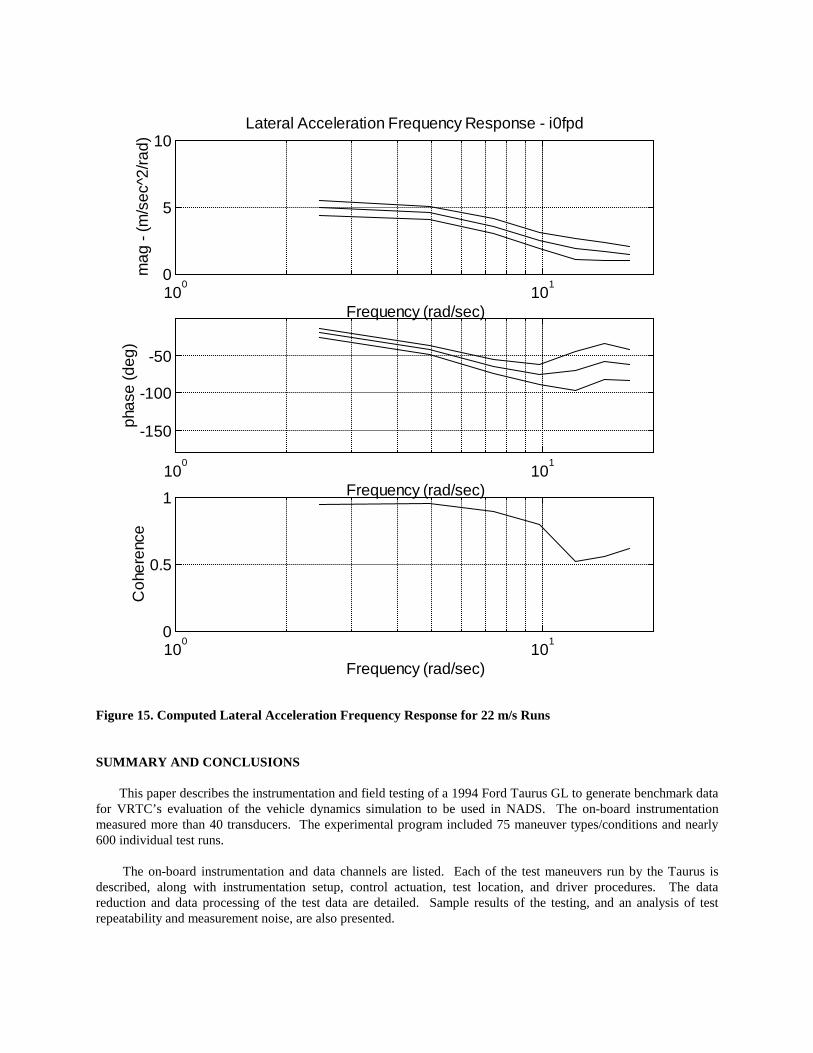
Figure 14 shows the vehicle yaw rate frequency response computed from the 22 m/s runs (V0RPD). The frequency response is displayed from 2.5 to 20 radians per second (approximately 0.5 to 3 Hz). The top graph shows the magnitude mean and 95-percent confidence intervals of the mean. The center graph shows the phase angle mean and confidence intervals, while the bottom plot shows the mean coherence. As can be seen, for this set of runs, the mean coherence is near one across the entire frequency range. This indicates that there was sufficient input power at all frequencies, and that the input and output (steering wheel angle and vehicle yaw rate) are related in a “fairly” linear way under this maneuvering condition. The confidence intervals are relatively narrow, giving good confidence in all of this data. Figure 15 shows the lateral acceleration frequency response for the same set of test runs. Unlike the yaw rate frequency response, the coherence for the lateral acceleration starts to drop as the input frequency gets higher. Because of the lower coherence, the confidence intervals on the mean magnitude and phase angle get wider as the input frequency increases.
-1 0 1 2 3 4 5 60
10
20
30
40
50
60
Time (sec)
Thr
ottle
Pos
ition
(%
)
Throttle Position - i0rag
Figure 12. Throttle Position Repeatability
-2 -1 0 1 2 3 40
50
100
150
Time (sec)
Ped
al F
orce
(N
)
Brake Pedal Force - i0rsd
Figure 13. Brake Pedal Force Repeatability
100
101
0
0.5
Frequency (rad/sec)
mag
- (r
ad/s
ec/ra
d)Yaw Rate Frequency Response - i0fpd
100
101
-200
-100
0
Frequency (rad/sec)
phas
e (d
eg)
100
101
0
0.5
1
Frequency (rad/sec)
Coh
eren
ce
Figure 14. Computed Yaw Rate Frequency Response for 22 m/s Runs
100
101
-150
-100
-50
Frequency (rad/sec)
phas
e (d
eg)
100
101
0
0.5
1
Frequency (rad/sec)
Coh
eren
ce
100
101
0
5
10
Frequency (rad/sec)
mag
- (m
/sec
^2/ra
d)Lateral Acceleration Frequency Response - i0fpd
Figure 15. Computed Lateral Acceleration Frequency Response for 22 m/s Runs
SUMMARY AND CONCLUSIONS This paper describes the instrumentation and field testing of a 1994 Ford Taurus GL to generate benchmark data for VRTC’s evaluation of the vehicle dynamics simulation to be used in NADS. The on-board instrumentation measured more than 40 transducers. The experimental program included 75 maneuver types/conditions and nearly 600 individual test runs. The on-board instrumentation and data channels are listed. Each of the test maneuvers run by the Taurus is described, along with instrumentation setup, control actuation, test location, and driver procedures. The data reduction and data processing of the test data are detailed. Sample results of the testing, and an analysis of test repeatability and measurement noise, are also presented.
VRTC performed this testing program to provide the data needed to evaluate the NADSdyna software. However, there is very little publicly available instrumented vehicle handling and braking test data, especially from a test program as comprehensive as the one described here. One of the purposes of this paper therefore is to make this test data available to other researchers. Electronic versions of the test data described in this paper can be obtained be contacting W. Riley Garrott at the Vehicle Research and Test Center at P. O. Box 37, East Liberty, Ohio, 43319, or via telephone at (937) 666-4511.
Future reports from the VRTC will describe the simulation parameter measurement and computation for the Taurus, and the simulation evaluation methodology and results. A similar program at VRTC will be performed using a Volvo-Fruehauf tractor-semitrailer, with reports and data to follow. REFERENCES 1. Haug, E. J., et. al., “Feasibility Study and Conceptual Design of a National Advanced Driving Simulator”,
NHTSA Contract DTNH22-89-07352, Report No. DOT-HS-807-597, March 1990. 2. Tsai, F. F. and Haug, E. J., “Automated Methods for High Speed Simulation for Multibody Dynamic Systems”,
Technical Report R047, Center for Computer Aided Design, The University of Iowa, 1989. 3. “NADS Vehicle Dynamics Software - Release 4”, Center for Computer Aided Design, The University of Iowa,
August 1995. 4. Heydinger, G. J., “Improved Simulation and Validation of Road Vehicle Handling Dynamics”, Ph.D.
Dissertation, The Ohio State University, Columbus, Ohio, 1990. 5. Heydinger, G. J., Garrott, W. R., Chrstos, J. P., and Guenther, D. A., “A Methodology for Validating Vehicle
Dynamics Simulations”, SAE Paper 900128, 1990. 6. Lee, S., “Development of a New Dynamic Tire Model for Improved Vehicle Dynamics Simulation”, Ph.D.
Dissertation, The Ohio State University, Columbus, Ohio, 1994. 7. Chrstos, J. P. and Grygier, P. A., “Instrumentation and field Testing of 1994 Ford Taurus GL for NADSdyna
Evaluation”, DOT report in progress. 8. Technical Manual for the Megadac Series 2000; Release 3.1, November 1986, Optim Corporation,
Germantown, MD 9. Transportation Research Center Services & Facilities, Transportation Research Center Inc., East Liberty, Ohio. 10. Farrer, D. G., “An Objective Measurement Technique for the Quantification of On-Centre Handling Quality”,
SAE Paper No. 930827, 1993. 11. MATLAB - Reference Guide, The Mathworks, Inc., July 1993. 12. Heydinger, G. J., Grygier, P. A., and Lee, S., “Pulse Testing Techniques Applied to Vehicle Handling
Dynamics”, SAE Paper 930828, 1993.