Embed Size (px)
Citation preview
Experimental tests and Computational Fluid Dynamics (CFD) simulations of barriers installed around open storage piles of raw materials I. Diego, J. Toraño, S. Torno & B. García GIMOC, Mining Engineering and Civil Works Research Group, Oviedo School of Mines, University of Oviedo, Spain
Abstract
The international commerce of raw materials is growing every year at a high rate. Hugh amounts of granular materials are moved around the world and thus increase the need of storage space. Usually the stockage yards where the materials lay are installed in an open air, so the potential to create dust emissions due to wind blows is high, then generating operative and environmental problems. In order to quantify these emissions a series of scaled experiments to simulate air flows and dust emission around conical shaped piles of granulated materials stored in open areas have been developed. These experiments are then used to validate CFD models of the phenomena. In a first phase the experiments gave the possibility to effectively measure the flow patterns and the dust emission around conical material piles. A Lagrangian Multiphase model was implemented in CFD commercial code Ansys CFX 10.0, that successfully simulated the emission of dust as compared to experimental data. In the second phase, to be shown in this paper, metallic barriers are installed surrounding the piles, and flow characteristics and dust emission are measured through the use of hot-wire anemometers and light scattering instruments as well as simulated in the CFD package. The paper shows how k-epsilon turbulence models are accurate enough to simulate the air flow in affordable mesh resolutions and computing times. The superficial velocity contours over the cone face are also studied in order to obtain the degree of dust emission diminishing expected due to the barrier installation. These studies have been done in the framework of the Research Project CTM2005-00187/TECNO, “Prediction models and prevention systems in the particle atmospheric contamination in an industrial environment” of the Spanish National R+D Plan of the Ministry of Education and Science, 2004-2007 period. Keywords: storage piles, wind tunnel, CFD Lagrangian methods, turbulence.
© 2008 WIT PressWIT Transactions on Engineering Sciences, Vol 59, www.witpress.com, ISSN 1743-3533 (on-line)
Advances in Fluid Mechanics VII 101
doi:10.2495/AFM080101
1 Introduction
The research group of Mining Engineering and Civil Works of the University of Oviedo, based in the School of Mines of Oviedo (Spain) is developing a research project granted by the Spanish Ministry of Education and Science. One of the project goals is to develop and study dust emission factors in several industrial situations, from quarries blasts to ship unloading or loading facilities. The researches and simulations have been very successful in several fields obtaining interesting results in the case of dust coming from quarries blasts, both using CFD [1] and classical dispersion methods, [2], and comparing results for different pile shape configurations, [3] and [4]. Now the next step has been taken, trying to evaluate the mitigation of emissions using solid barriers that are installed surrounding the piles. These barriers can be porous or non-porous and there are several references where PIV (Particle Image Velocimetry) methods are used in order to evaluate flow around pile-shaped flow obstacles, [5] and [6]. Instead using PIV methods, indirect methods will be used to measure air velocities and dust concentrations in scaled tests. Light scattering instruments are used to measure dust clouds and hot wire anemometers in case of measuring air velocities. 1:10 scaled tests were conducted simulating a cone shaped pile surrounded by a solid barrier. In order to create the flow a mine ventilation fan is used, obtaining flows up to 16 m/s. Velocity values are measured in 64 points and dust concentrations are measured in two locations. A measured quantity of dust is homogeneously disseminated over the metallic cone surface, repeating the experiment in case of 3 different materials: coal, cement and limestone. These measurements are then used to validate CFD (Computational Fluid Dynamics) models, in a first stage one phase models where air movements are simulated and in a second stage Lagrangian multiphase models where dust movement is represented. The main goal is to check the amounts of dust injected in the surrounding as compared to the calculations done by the North American standard EPA [7]. This paper will show how the CFD calculations can effectively simulate the air movement in these experimental setups. Later papers will use the dust concentration data to validate multiphase CFD simulations.
2 Measurements and 1:10 scaled tests
The scaled tests were conducted in the tailings dam area of the coal concentration plant installed in a coal mine in Asturias, northern Spain (see attached figure 1). The initial intention was to install the piles and the fans in one side of the dam and the dust sensors on the other side, 30 meters away, in order to evaluate just the dust floating in the air, as the dust falling to the dam will be trapped there. Unfortunately dust levels at a distance of 30 meters from the emission area were null, so all the experimental setup was changed and adjusted several times until dust concentration levels were correctly measured.
© 2008 WIT PressWIT Transactions on Engineering Sciences, Vol 59, www.witpress.com, ISSN 1743-3533 (on-line)
102 Advances in Fluid Mechanics VII
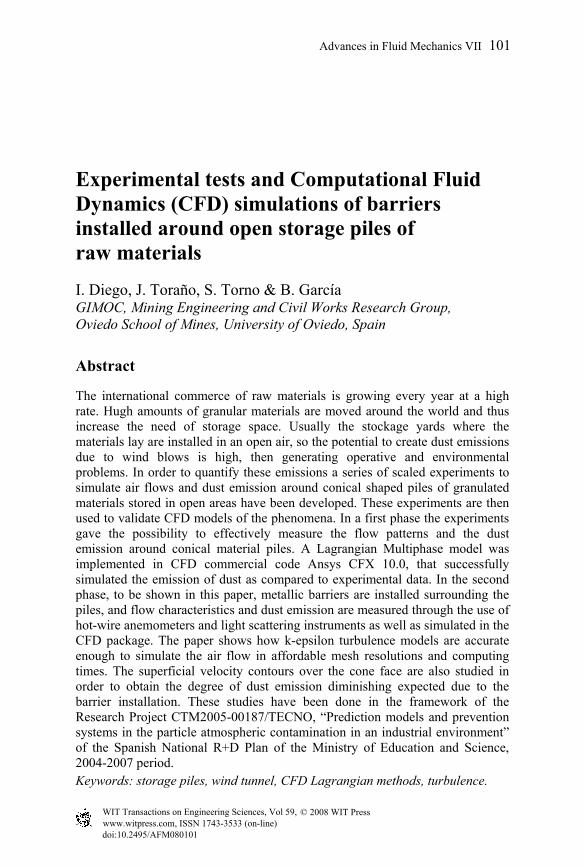
The final experimental setup is shown below: a metallic cone blown by air coming out of a 300 mm pipe where a 12 kW fan, compressed air powered, is connected. The cone is installed 50 cm apart from the pipe outlet, which its axes installed at the height of the cone apex. The cone surface is then homogeneously covered by dust and once the fan is started a dust cloud is created by the pick-up of the dust particles places in certain areas of the cone.
Figure 1: Coal stockage area and experimental setup.
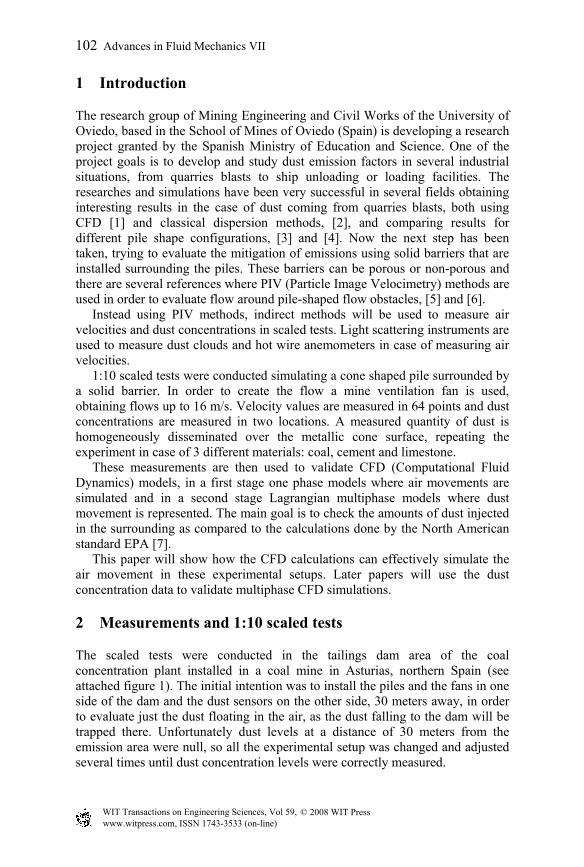
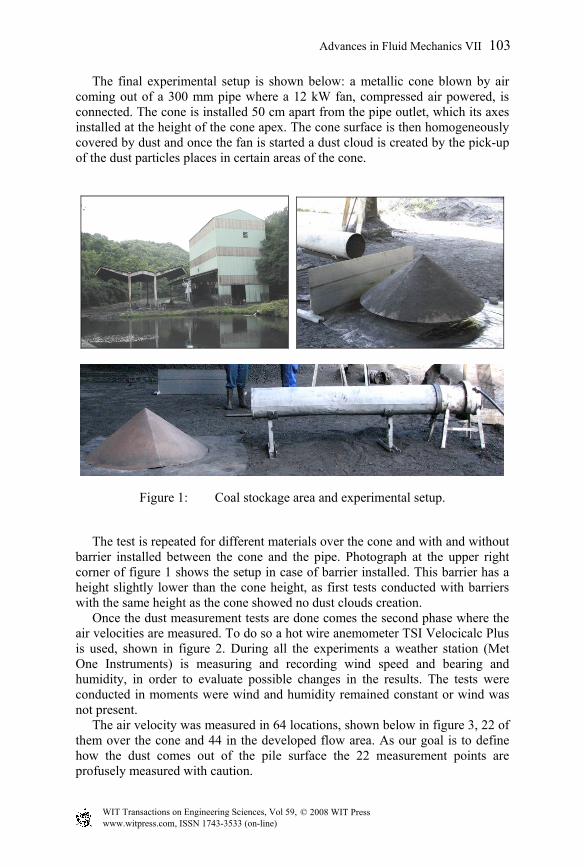
The test is repeated for different materials over the cone and with and without barrier installed between the cone and the pipe. Photograph at the upper right corner of figure 1 shows the setup in case of barrier installed. This barrier has a height slightly lower than the cone height, as first tests conducted with barriers with the same height as the cone showed no dust clouds creation. Once the dust measurement tests are done comes the second phase where the air velocities are measured. To do so a hot wire anemometer TSI Velocicalc Plus is used, shown in figure 2. During all the experiments a weather station (Met One Instruments) is measuring and recording wind speed and bearing and humidity, in order to evaluate possible changes in the results. The tests were conducted in moments were wind and humidity remained constant or wind was not present. The air velocity was measured in 64 locations, shown below in figure 3, 22 of them over the cone and 44 in the developed flow area. As our goal is to define how the dust comes out of the pile surface the 22 measurement points are profusely measured with caution.
© 2008 WIT PressWIT Transactions on Engineering Sciences, Vol 59, www.witpress.com, ISSN 1743-3533 (on-line)
Advances in Fluid Mechanics VII 103
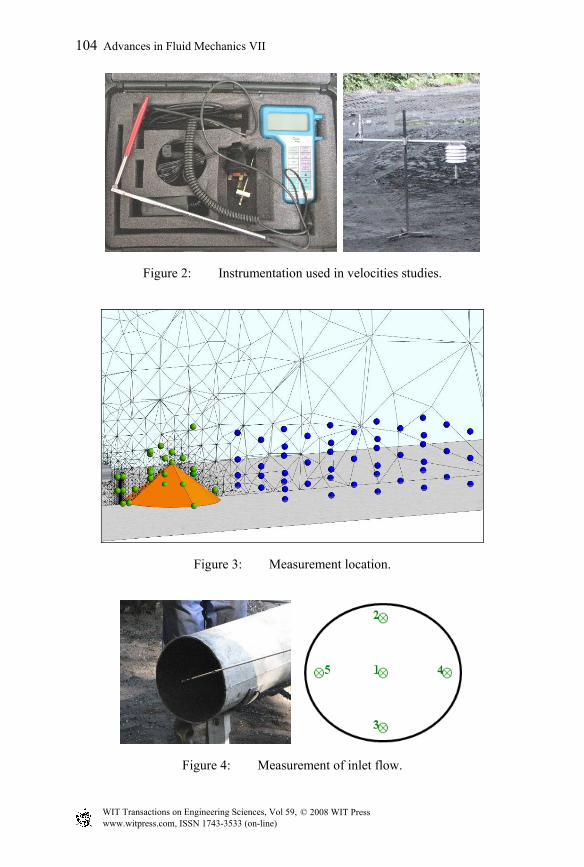
Figure 2: Instrumentation used in velocities studies.
Figure 3: Measurement location.
Figure 4: Measurement of inlet flow.
© 2008 WIT PressWIT Transactions on Engineering Sciences, Vol 59, www.witpress.com, ISSN 1743-3533 (on-line)
104 Advances in Fluid Mechanics VII
The air coming out of the pipe was also controlled (figure 4), observing a high difference between the several points of the pipe that were measured. Despite the expected difference between the points near the wall and the points in the axe of the pipe there are also quite big differences among opposite sides of the pipe. This is, the flow is not symmetrical, probably due to the swirl given to the air by the fan and by the fact that the pipe length is not long enough to stabilize this swirl caused by the fan blades. The velocity values in the pipe outlet are shown in table 1.
Table 1: Values of inlet flow.
Velocity values at Pipe outlet 1 2 3 4 5
12.2 m/s 10.8 m/s 15.7 m/s 12.3 m/s 13.5 m/s
3 CFD simulation
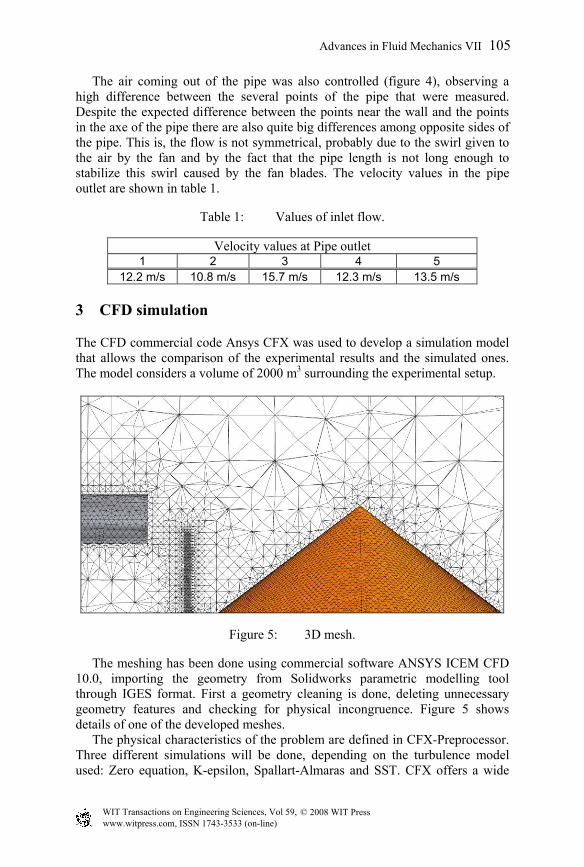
The CFD commercial code Ansys CFX was used to develop a simulation model that allows the comparison of the experimental results and the simulated ones. The model considers a volume of 2000 m3 surrounding the experimental setup.
Figure 5: 3D mesh.
The meshing has been done using commercial software ANSYS ICEM CFD 10.0, importing the geometry from Solidworks parametric modelling tool through IGES format. First a geometry cleaning is done, deleting unnecessary geometry features and checking for physical incongruence. Figure 5 shows details of one of the developed meshes. The physical characteristics of the problem are defined in CFX-Preprocessor. Three different simulations will be done, depending on the turbulence model used: Zero equation, K-epsilon, Spallart-Almaras and SST. CFX offers a wide
© 2008 WIT PressWIT Transactions on Engineering Sciences, Vol 59, www.witpress.com, ISSN 1743-3533 (on-line)
Advances in Fluid Mechanics VII 105
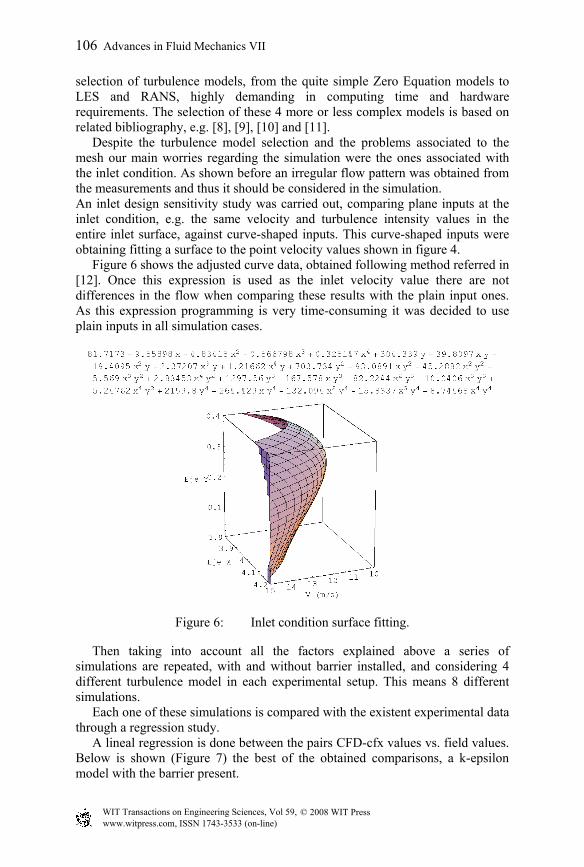
selection of turbulence models, from the quite simple Zero Equation models to LES and RANS, highly demanding in computing time and hardware requirements. The selection of these 4 more or less complex models is based on related bibliography, e.g. [8], [9], [10] and [11]. Despite the turbulence model selection and the problems associated to the mesh our main worries regarding the simulation were the ones associated with the inlet condition. As shown before an irregular flow pattern was obtained from the measurements and thus it should be considered in the simulation. An inlet design sensitivity study was carried out, comparing plane inputs at the inlet condition, e.g. the same velocity and turbulence intensity values in the entire inlet surface, against curve-shaped inputs. This curve-shaped inputs were obtaining fitting a surface to the point velocity values shown in figure 4. Figure 6 shows the adjusted curve data, obtained following method referred in [12]. Once this expression is used as the inlet velocity value there are not differences in the flow when comparing these results with the plain input ones. As this expression programming is very time-consuming it was decided to use plain inputs in all simulation cases.
Figure 6: Inlet condition surface fitting.
Then taking into account all the factors explained above a series of simulations are repeated, with and without barrier installed, and considering 4 different turbulence model in each experimental setup. This means 8 different simulations. Each one of these simulations is compared with the existent experimental data through a regression study. A lineal regression is done between the pairs CFD-cfx values vs. field values. Below is shown (Figure 7) the best of the obtained comparisons, a k-epsilon model with the barrier present.
© 2008 WIT PressWIT Transactions on Engineering Sciences, Vol 59, www.witpress.com, ISSN 1743-3533 (on-line)
106 Advances in Fluid Mechanics VII
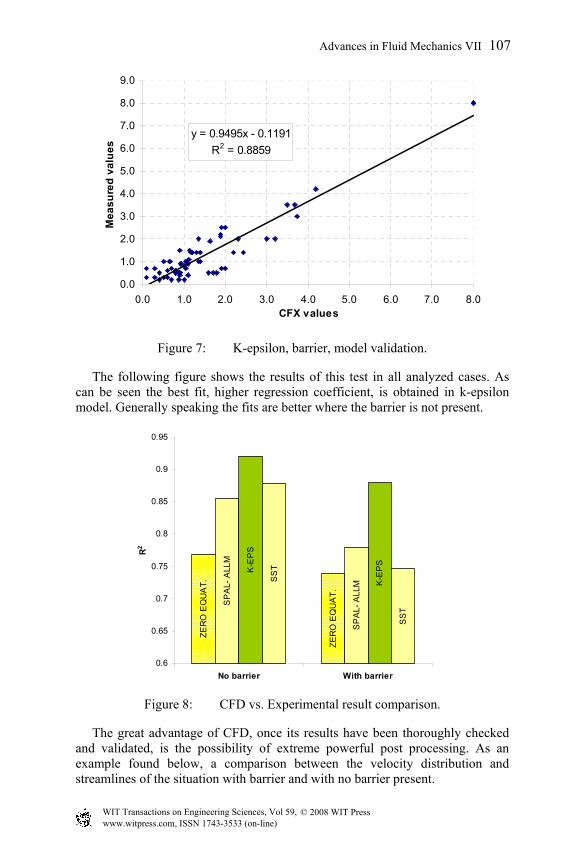
y = 0.9495x - 0.1191R2 = 0.8859
0.0
1.0
2.0
3.0
4.0
5.0
6.0
7.0
8.0
9.0
0.0 1.0 2.0 3.0 4.0 5.0 6.0 7.0 8.0CFX values
Mea
sure
d va
lues
Figure 7: K-epsilon, barrier, model validation.
The following figure shows the results of this test in all analyzed cases. As can be seen the best fit, higher regression coefficient, is obtained in k-epsilon model. Generally speaking the fits are better where the barrier is not present.
ZER
O E
QU
AT.
ZER
O E
QU
AT.
SP
AL-
ALL
M
SP
AL-
ALL
M
K-E
PS
K-E
PS
SS
T
SS
T
0.6
0.65
0.7
0.75
0.8
0.85
0.9
0.95
No barrier With barrier
R2
Figure 8: CFD vs. Experimental result comparison.
The great advantage of CFD, once its results have been thoroughly checked and validated, is the possibility of extreme powerful post processing. As an example found below, a comparison between the velocity distribution and streamlines of the situation with barrier and with no barrier present.
© 2008 WIT PressWIT Transactions on Engineering Sciences, Vol 59, www.witpress.com, ISSN 1743-3533 (on-line)
Advances in Fluid Mechanics VII 107
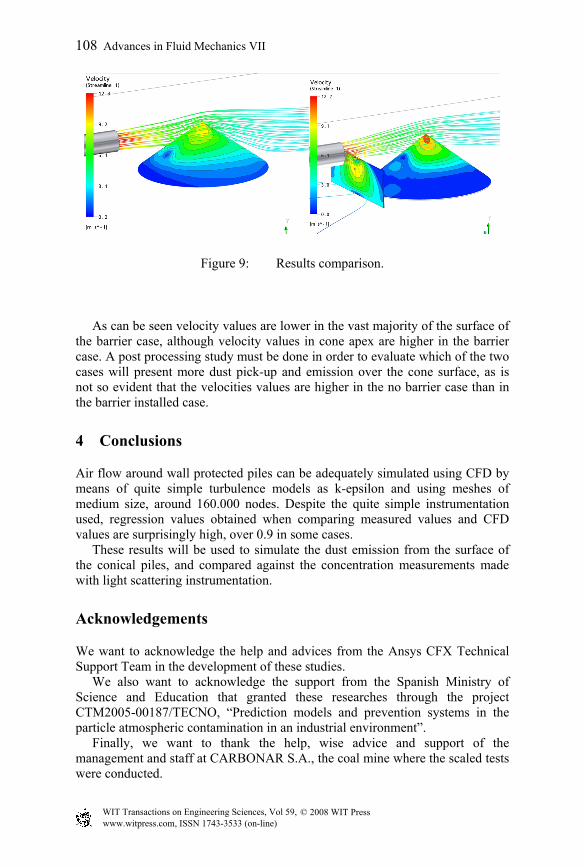
Figure 9: Results comparison.
As can be seen velocity values are lower in the vast majority of the surface of the barrier case, although velocity values in cone apex are higher in the barrier case. A post processing study must be done in order to evaluate which of the two cases will present more dust pick-up and emission over the cone surface, as is not so evident that the velocities values are higher in the no barrier case than in the barrier installed case.
4 Conclusions
Air flow around wall protected piles can be adequately simulated using CFD by means of quite simple turbulence models as k-epsilon and using meshes of medium size, around 160.000 nodes. Despite the quite simple instrumentation used, regression values obtained when comparing measured values and CFD values are surprisingly high, over 0.9 in some cases. These results will be used to simulate the dust emission from the surface of the conical piles, and compared against the concentration measurements made with light scattering instrumentation.
Acknowledgements
We want to acknowledge the help and advices from the Ansys CFX Technical Support Team in the development of these studies. We also want to acknowledge the support from the Spanish Ministry of Science and Education that granted these researches through the project CTM2005-00187/TECNO, “Prediction models and prevention systems in the particle atmospheric contamination in an industrial environment”. Finally, we want to thank the help, wise advice and support of the management and staff at CARBONAR S.A., the coal mine where the scaled tests were conducted.
© 2008 WIT PressWIT Transactions on Engineering Sciences, Vol 59, www.witpress.com, ISSN 1743-3533 (on-line)
108 Advances in Fluid Mechanics VII
References
[1] J.Toraño et al - A CFD Lagrangian particle model to analyze the dust dispersion problem in quarries blasts. Capítulo del libro «Computational methods in Multiphse Flow IV». 2007. ISBN: 9781-84564-079-8.
[2] J. Toraño, R. Rodriguez, I. Diego and A. Pelegry, “Contamination by particulated material in blasts: analysis, application and adaptation of the existent calculation formulas and software”. Environmental Health Risk III, pp. 209–219, (2004)Sd.
[3] I. Diego; R. Rodríguez; J.Toraño. ECCOMAS 2006. Capítulo de libro: Surface velocity contour analysis in the airborne dust generation due to open storage piles. Páginas, inicial: 1 final: 12Fecha: 2006. ISBN: 84-89925-70-4. Editorial (si libro): CIMNE (Centro Internacional de Métodos Numéricos en Ingeniería). España.Sd.
[4] J. Toraño, R. Rodríguez, I. Diego, A. Pelegry.Influence of the Pile Shape on Wind Erosion. CFD Emission Simulation. Applied Mathematical Modelling. ISSN: 0167-6105. Páginas, inicial: 1 final: 23. Fecha: 2006.Lugar de publicación: Reino Unido.Sd.
[5] Wind tunnel observations about the shelter effect of porous fences on the sand particle movements. Sang-Joon Lee, Ki-Chul Parkb, Cheol-Woo Parka. Atmospheric Environment 36 (2002) 1453–1463.
[6] Laboratory measurements of velocity and turbulence field behind porous fences. Sang-Joon Le*, Hyoung-Bum Kim. Journal of Wind Engineering and Industrial Aerodynamics 80 (1999) 311Ð326.
[7] Update Of Fugitive Dust Emissions Factors In AP-42 Section 11.2 — Wind Erosion, MRI No. 8985-K, Midwest Research Institute, Kansas City, MO, 1988.
[8] K. W. Moloney, I. S. Lowndes and G. K. Hargrave, “Analysis of flow patterns in drivages with auxiliary ventilation”, Trans. Instn Min. Metall. 108, pp 17–26 (1999).
[9] A. Wala, J. Jacob, J. Brown and G. Huang, “New approaches to mine-face ventilation”, Mining engineering, March 2003, pp 25-30. (2003).
[10] K.W. Moloney and I.S. Lowndes, “Comparison of measured underground air velocities and air flows simulated by computational fluid dynamics”, Trans. Instn Min. Metall. 108, pp 105–114 (1999).
[11] S. A. Silvester, I. S. Lowndes and S. W. Kingman, “The ventilation of an underground crushing plant”, Mining Technology (Trans. Inst. Min. Metall. A), Vol. 113, pp. 201–214 (2004).
[12] “Fitting a Surface to Scattered x-y-z Data Points”. Web link http://amath.colorado.edu/computing/Mathematica/Fit/ accessed 15/11/07.
© 2008 WIT PressWIT Transactions on Engineering Sciences, Vol 59, www.witpress.com, ISSN 1743-3533 (on-line)
Advances in Fluid Mechanics VII 109


![[PPT]Computational Fluid Dynamics: An Introductionuser.engineering.uiowa.edu/~fluids/posting/home/CFD/CFD... · Web viewIntroduction to Computational Fluid Dynamics (CFD) Maysam Mousaviraad,](https://img.pdfslide.net/doc/110x75/5aedbf837f8b9a90319017cb/pptcomputational-fluid-dynamics-an-fluidspostinghomecfdcfdweb-viewintroduction.jpg)