Embed Size (px)
Citation preview
Experimental Thermal and Fluid Science 44 (2013) 147–160
Contents lists available at SciVerse ScienceDirect
Experimental Thermal and Fluid Science
journal homepage: www.elsevier .com/locate /et fs
Measurement of heat flux in dense air-mist cooling: Part I – A novelsteady-state technique
Constantin A. Hernández-Bocanegra a,1, A. Humberto Castillejos E. a,⇑, Francisco A. Acosta-González a,1,Xiaoxu Zhou b,c,1,2, Brian G. Thomas b,c,2
a Department of Metallurgical Engineering, Centre for Research and Advanced Studies, CINVESTAV - Unidad Saltillo, Carr. Saltillo-Monterrey Km. 13.5, Ramos Arizpe,Coahuila 25900, Mexicob Department of Mechanical Science and Engineering, University of Illinois at Urbana-Champaign, 1206 West Green Street, Urbana, IL 61801, USAc Research & Development Department, SSAB Iowa Inc., 1755 Bill Sharp Blvd., Muscatine, IA 52761, USA
a r t i c l e i n f o
Article history:Received 28 June 2011Received in revised form 13 April 2012Accepted 14 June 2012Available online 2 July 2012
Keywords:Spray coolingSteady-state methodBoiling heat flux measurementDense air mistsInduction heating
0894-1777/$ - see front matter � 2012 Elsevier Inc. Ahttp://dx.doi.org/10.1016/j.expthermflusci.2012.06.01
⇑ Corresponding author. Tel.: +52 844 438 9600x96E-mail addresses: constantin.hernandez@cinvesta
Bocanegra), [email protected]@cinvestav.edu.mx (F.A. Acosta-González), xzhssab.com (X. Zhou), [email protected] (B.G. Thoma
1 Tel.: +52 844 438 9600x9666; fax: +52 844 438 962 Tel.: +1 217 333 6919; fax: +1 217 244 6534.
a b s t r a c t
This work presents a technique for characterizing water air-mist cooling of surfaces at temperatures from200–1200 �C while subjected to intense spraying conditions, so that the heat flux could reach values inexcess of 10 MW/m2. In this new steady-state method, a local region of an air-mist/spray impinges uponthe exposed surface of a hot Pt-disk (8 mm £ by 2.5 mm thickness) which is surrounded by an inductioncoil while both are embedded in a cast ceramic monolith. A digital controller adjusts the output power ofa high-frequency generator to balance the induction heating of the Pt-specimen with the heat removedby the boiling of the spray droplets impinging on its active surface, in order to maintain the control tem-perature of the sample at the predetermined set-point. Measurement of the RMS current flowing throughthe coil to maintain this temperature, together with the solution of a two-dimensional axi-symmetriccomputational model of the electromagnetic field and heat conduction equations, enabled estimationof the heat extracted locally by the mist. A rigorous experimental procedure was performed to determinethe boiling curves from 200 �C to 1200 �C and then back to 200 �C. The curves for both trajectoriesrevealed that strong boiling hysteresis occurred in the nucleate and transition boiling regimes and thatthis was almost absent in the stable film boiling regime. On the other hand, hysteresis was not presentin thermal loops involving surface temperatures only between 600 and 1200 �C. The existence of hyster-esis, in a certain temperature interval, points out the importance of considering the thermal history ofactual cooling processes when simulating them in the laboratory. The ability of the new technique tomaintain the sample temperature for prolonged periods, e.g., hours, enables future studies to improvethe understanding of boiling phenomena during intense heat-removal processes. In Part II of this article,the effects that the mist droplet size, droplet velocity and water impact density have on the heatextracted under steady-state conditions from a surface with large superheat are investigated for a widevariety of those characteristics.
� 2012 Elsevier Inc. All rights reserved.
1. Introduction
Spray cooling occurs when a dispersion of fine droplets impactsthe surface of a hot body to remove large amounts of heat byvaporization and/or by single phase convection [2,3]. Dependingon the system, the surface temperature, Tw, of the body can exceed
ll rights reserved.5
66; fax: +52 844 438 9610.v.edu.mx (C.A. Hernández-
(A.H. Castillejos E), [email protected], xiaoxu.zhou@s).00.
markedly the saturation temperature, Ts, of the cooling liquid or beslightly above or below it. Hence, any or all of the cooling regimesof a conventional boiling curve [4] can appear. Water-spray coolingtechnology has found widespread use since it offers a good balanceof high heat removal capability, surface temperature uniformityand fluid efficiency. Cases with large surface superheat, i.e., withlarge Tw–Ts, appear in metallurgical processes (e.g., in continuouscasting of steel [5,6] and heat treatment of alloys [7,8]), in safetysystems for emergency cooling and pressure control of nuclearreactors [9–11] and in fire suppression/control systems of electri-cal transformers and flammable material storage tanks [12,13],among many other applications. In more recent times, spray cool-ing has attracted great interest for the removal of high heat fluxesfrom surfaces with small superheats, such as the surface of elec-
Nomenclature
A operating air flow rate of the nozzle (NL/s)CHF critical heat flux (MW/m2)ds differential surface area in electric conductors (m2)dd, d30 drop diameter; volume mean diameter (lm)f current frequency (Hz)Gr Grashof number, gbDTL3/mo, in Table 1hc, hcoil, hf heat transfer coefficients: for combined boiling convec-
tion plus radiation; for forced convection to the water inthe coil tube; for natural convection to the environmentsurrounding the ceramic body (W/m2 K)
|I|, Im, Ic magnitude of time-harmonic electric current; measuredRoot Mean Square (RMS) electric current passingthrough the coil; computed RMS current (A)
j imaginary unit number ( =p�1)
J; J!
magnitude of time-harmonic current density; currentdensity vector (A/m2)
kPt, kCu, kc
thermal conductivities of Pt; coil; and ceramic (W/mK)l, r letters denoting temperature lowering, rising paths in a
sample thermal loopL length of discretized closed circuit (m)M mutual inductance (H)N direction normal to the internal surface of the coil tubeNu Nusselt number hD/k, in Table 1pa, pw manometric air inlet; water inlet pressures (k Pa)Pr Prandtl number, in Table 1�q, �qc boiling convection heat flux; combined boiling convec-
tion plus radiation heat flux from exposed surface(MW/m2)
Qv heat source resulting from induced current density (W/m3)
ri,k separation distance between differential length ele-ments of circuits i and k in conductors, (m)
r, z axi-symmetrical coordinates measured from the metal-lic disk center in Fig. 2 (m)
Re Reynolds number in Table 1
S total cross section area for current flow in each conduc-tor (m2)
T, Tc, Tm temperature; computed control; measured control tem-peratures (�C)
TL, Ts, Tw, T1, Tf Leidenfrost; saturation; surface; surrounding ofsample active surface; surrounding of ceramic bodytemperatures (�C)
uzs, uz,v drop velocity; normal volume weighted mean velocity(m/s)
V external voltage applied to a closed circuit (V)w local water impact density (L/m2 s)W operating water flow rate of the nozzle (L/s)x, y, z rectangular coordinates with origin at center of nozzle
orifice (m)xi independent variables in Table 2
Greekd skin depth (m)dxi measurement error of independent variable xi
e emissivityl, lR absolute (H/m); relative, l/lo, magnetic permeabilitieslo magnetic permeability of free space, 4p � 10�7 (H/m)p constant, 3.14159264. . .
q density (kg/m3)r, rr electric conductivity (mho/m); Stefan–Boltzmann con-
stant, 5.669 � 10�8 (W/m2 K4)x current frequency, 2pf (radians/s)
Subindexi integer denoting a discretized current circuitI, R imaginary; real parts of a complex numberk integer denoting a discretized electric circuit within a
conductor/ angular direction in cylindrical coordinates
148 C.A. Hernández-Bocanegra et al. / Experimental Thermal and Fluid Science 44 (2013) 147–160
tronic devices [14,15] or human skin [16,17] and from surfaceswith negative superheat [15,18]. The wide scope of applicationsentails a huge spectrum of the values of the parameters and prop-erties affecting heat transfer in boiling and this has demanded thedevelopment and use of good experimental methods for studyingthe governing mechanisms of this very complex process.
The heat transfer performance of droplet streams, water spraysand air-mists has been experimentally investigated using bothsteady- and unsteady-state methods. In the steady-state methods,a specimen is heated by a thermal power source, Qv, while simulta-neously being spray cooled to remove a heat flux, �q, to maintain aconstant temperature distribution throughout [3,15,19–35]. Hence,the surface temperature, Tw, and the associated heat transfer coef-ficient, h, are evaluated using Fouriers law of heat conduction andNewton’s law of convection. On the other hand, the transientmethods are based on exposing the surface of a hot test-specimento the spray and simultaneously recording its temperature–timehistory at specific locations near its surface while it cools[16,17,25,28,34–41]. Estimation of Tw and h requires the numericalcalculation of the transient heat flux, through the solution of an in-verse heat conduction problem. From the literature, it is clear thattransient methods allow measurements over all of the different re-gimes of the conventional boiling curve, i.e., stable film boiling,transition boiling, nucleate boiling and single phase convection,across broad ranges of Tw and under low and high water impactdensity, w, values. On the other hand, the reported steady-stateexperimental tests have been mostly restricted to temperatures in
the single phase convection regime [3,15,18], the lower part ofthe nucleate boiling regime [29–31] and to very narrow tempera-ture intervals in the film boiling regime [21,23,25,27,29,30,33],i.e., to low temperatures and to regions where the boiling heat fluxvaries little with temperature. Fewer studies have included thetransition boiling regime where the heat flux varies appreciablywith Tw. These last studies have involved streams with low dropletfrequencies [19,20] and sprays with w in general smaller than 5 L/m2 s and Tw less than 500 �C [22,26,32,34].
Only a few comparisons between steady and unsteady proce-dures have been reported. In a study involving a plane water jetimpinging on a hot surface, Ishigai et al. [23] found that in thenucleate boiling regime the two methods led to different heat fluxesand the discrepancy was attributed to inaccuracies in their unstea-dy method, while in the film boiling regime both techniquesmatched reasonably well. Olden et al. [34] found that the two meth-ods compared well in the transition regime for w = 2 L/m2 s andtemperatures within 200–500 �C, but not in the nucleate boiling re-gime. However, the comparison did not involve strictly similarspraying conditions. Investigators have reported pros and cons ofboth methods. Thus, it has been claimed [33] that steady methodsare more convenient for determining the dependence of h on nozzleoperating conditions in the film boiling regime, and that transienttechniques are better suited for studying the dependence of h withTw, particularly in the transition boiling regime. Also, it has beenargued that steady-state methods are faster than unsteady ones[27,33] and additionally, that they have the inherent advantage of
C.A. Hernández-Bocanegra et al. / Experimental Thermal and Fluid Science 44 (2013) 147–160 149
being independent of the response time of the thermocouples andthe data acquisition system [33]; the first assertion however wasnot substantiated. The application of steady-state methods hasbeen limited by the maximum attainable power densities, whichrestrains the size of the test-specimen, the water impact flux thatcan impinge upon it, the maximum specimen temperature andthe time that the steady-state can be maintained. Schmidt and Boye[30] reported a steady-state apparatus where Tw could be held con-stant for a period of 10–60 s at w 6 2.5 L/m2 s. Ciofalo et al. [37,38]claimed that for samples with cross section areas of 0.04 � 0.05 and0.075 � 0.075 m2 and a few millimeters thickness, the electric pow-ers required to keep them at constant temperature would be pro-hibitive if the probes (i.e., if the devices designed to investigatethe heat transfer) were subjected to a heat flux extraction of10 MW/m2. Furthermore, the investigators [37,38] indicated thata control system would be unable to maintain steady-state condi-tions in the transition boiling regime. The measuring apparatus ofOlden et al. [34], which used a flame burner as the heating source,was confined to temperatures between 70 and 500 �C and to a max-imum w of 2 L/m2 s when operating in steady mode, but it did nothave these limitations in transient mode.
In past literature, different types of heating sources have beenused to investigate boiling heat transfer coefficients with sprays.In steady-state test rigs, the type of heating source is critical sinceit must provide sufficient power to balance the heat extracted bythe spray through the active surface(s) of the body plus the heat lostthrough the other faces. Also, the heating device must neither inter-fere with the spray, nor cause hazardous conditions and should beable to undergo automatic control. Heating methods have involveddirect resistance heating [3,20,23,25,27,30,32], electrical resistancecartridges, bands or plates [15,18,19,21,22,24,26,31] and gas burn-ers [29,33–35]. Direct electrical resistance heating involves passingcurrent through a thin test-plate to heat it by the Ohmic resistanceof the test material itself. The same Ohmic effect heats up the elec-trical-resistance elements, which in turn are mounted in watertightintimate contact with the test-specimen to heat it by conduction.Direct resistance heating methods have been applied for 2.5 6 w(L/m2 s) 6 33.3 and over a narrow range of surface temperaturesin the film boiling regime, 900–1000 �C [25,27]. Toda [22] usedelectrical heating elements to study the air-mist cooling of a metal-lic surface, at up to 300 �C, while subjected to a water flux in therange of 3.4 6w (L/m2 s) 6 14.3. Other works employing electricalrod elements have studied mist cooling of surfaces at temperaturesbelow the normal boiling point of the cooling liquid [15,18] or ofsurfaces held between 200 and 900 �C while impinged by streamsof drops with a frequency of 0.5–3.0 drops/s [20]. Jenkins et al.[33] studied air-mist cooling of a surface at 800 �C with water-fluxes between 0.51 and 16 L/m2 s, employing a gas flame as theheating source. The use of induction heating in steady-state appara-tuses, to measure boiling heat transfer coefficients with sprays, hasnot yet found application. It has been claimed that the coil wrappedaround the test-specimen would interfere with the flow of waterfrom the spray [29]. The advantages of induction heating have beenexploited in a transient technique [38].
The maximum heat fluxes measured by steady-state methodshave been a fraction [18,29,32] or at most a few MW/m2
[3,19,21,22,26,31]. Mudawar and Valentine [26] reported criticalheat fluxes close to 6 MW/m2, at 122 �C, for water sprayingconditions involving w = 5 L/m2 s and drops with mass mediandiameters and average velocities between 763 and 1872 lm and11.7–18.1 m/s, respectively.
From the classic pool boiling investigation carried out by Nukiy-ama [42], the type of control, i.e., power or temperature control,used in steady-state heat flux measuring methods has been foundto affect the form of the typical boiling curve. Methods that controlthe power supplied to the hot body leave the surface temperature
to vary as the dependent variable, while in methods which controlthe temperature, the power is dependent. Commonly, it is believedthat in steady-state experiments under temperature control, theheat-flux variation with surface superheat DT is univocal; i.e., fora given DT, the heat�q extracted from the surface reaches a uniqueequilibrium power [43,44]. As Tw rises above Ts, the heat flux �qincreases along the single phase convection and nucleate boilingregimes until reaching a maximum critical heat flux, CHF. Furtherincrease in Tw leads to a decrease in �q along the transition boilingregime until reaching a minimum at the Leidenfrost temperature,TL. Above this temperature, �q increases again in the film boilingregime. From high to low temperatures – with temperature control– the evolution of �q with DT was foretold by Nukiyama [42] tosimply reverse its path along the same boiling regimes. This behav-ior has been later found in some works involving low boiling pointorganic liquids [45,46]. Differently from this behavior, with powercontrol, increasing the power to above CHF causes the transitionboiling regime and the lower portion (with �q 6 CHF) of the stablefilm boiling regime to be bypassed due to an abrupt increase insurface temperature, that equilibrates the power supplied with acorresponding film-boiling heat flux greater than CHF. Returningfrom high to low power – with power control – the film boiling re-gime of the classic curve will be followed. Then, upon reaching TL,further decrease in power will cause an abrupt drop in surface tem-perature bypassing the transition boiling regime and the portion ofthe nucleate boiling regime with surface heat flux above the valuecorresponding to TL [42]. The departure from the classical boilingcurve appearing at the burnout (during heating) and Leidenfrost(during cooling) points constitutes a hysteresis type that intrinsi-cally accompanies the power-controlled methods. In addition,nucleation hysteresis and several other types of hysteresis havebeen reported for liquid jet [47] and pool [48] boiling systems oper-ating under power control. Hysteresis becomes more pronouncedin systems involving highly wetting liquids and porous surfaces.
It has been found that even in temperature controlled systems,boiling hysteresis may be present. The analysis of Witte and Lien-hard [49] of pool-boiling heat-flux measurements with organic liq-uids [50,51] supports the idea of a non-univocal relationshipbetween �q and DT, while passing through the transition boilingregime following increasing and decreasing temperature paths. Ra-jab and Winterton [52] carried out steady- and unsteady-stateexperiments using deionized water and an organic liquid. In theirsteady-state tests with both temperature-rising and temperature-lowering paths, the nucleate boiling, film boiling and most of thetransition boiling regimes were present. Although the curves fromboth paths overlapped in the nucleate and film boiling regimes, thedetermined part of the curves corresponding to transition boilingregime differed, revealing hysteresis in agreement with Witteand Lienhard [49]. The heat flux at a given DT during temperaturerising was higher than that measured along the temperature low-ering path. The independent measurement of solid–liquid contactindicated that liquid–surface interaction was higher on heatingthan on cooling in the temperature range of transition boiling, thusexplaining the higher values of �q obtained during the heatingpath [52]. The contradictory findings revealing the non-existence[45,46] and existence [49,52] of different transition boiling curvesfor heating and cooling paths indicate that further study of boilingis needed [53], even in pool boiling systems that have been studiedmore than spray cooling.
From this literature review, it is clear that previous experimen-tal investigations using steady-state methods have studied sprayconditions involving moderate heat fluxes and low surface temper-atures (<500 �C) or a narrow range of higher temperatures. Themost commonly reported spray characteristic is water impact flux,w, which has been usually smaller than 5 L/m2 s. In contrast tothese conditions, the secondary cooling of continuously cast steel,
150 C.A. Hernández-Bocanegra et al. / Experimental Thermal and Fluid Science 44 (2013) 147–160
which is the motivation behind this work, involves surfacetemperatures and water impact densities that are considerablyhigher. The surface temperatures typically range from 1200 to750 �C, and for practical nozzle operating conditions, w typicallyvaries from 10–90 L/m2 s, over a large fraction of the mist footprintareas. These conditions have been appropriately handled by atransient heat-flux measuring method, to obtain heat transfer cor-relations [5,41] to mathematically model the cooling and solidifica-tion of thin steel slabs [5,54,55]. However, with the transient freecooling technique, the cooling of the test-specimen occurs so fastthat it is difficult to observe the boiling phenomena, and it is impos-sible to study time-related effects such as hysteresis or the forma-tion of surface deposits on heat extraction. Therefore, as a firststep towards investigating these aspects of spray cooling, this workpresents a novel steady-state technique based on balancing the heatextracted from the sample surface by the boiling water droplets,with the heat supplied by electromagnetic induction. In this tech-nique, the measurement of the RMS current, Im, flowing throughthe coil to maintain a desired sample temperature, Tm, together withthe solution of a two-dimensional axi-symmetric computationalmodel of the electromagnetic field and heat conduction equationshas enabled estimation of the heat extracted by spray cooling. Thetechnique falls in the category of temperature controlled techniques[43,44,53] and our results indicate that the steady-state techniquepresented here enables the precise and systematic measurementof entire boiling curves under the intense spraying conditions usedin processes involving surfaces with large superheat.
2. Experimental techniques
2.1. Test rig and conditions
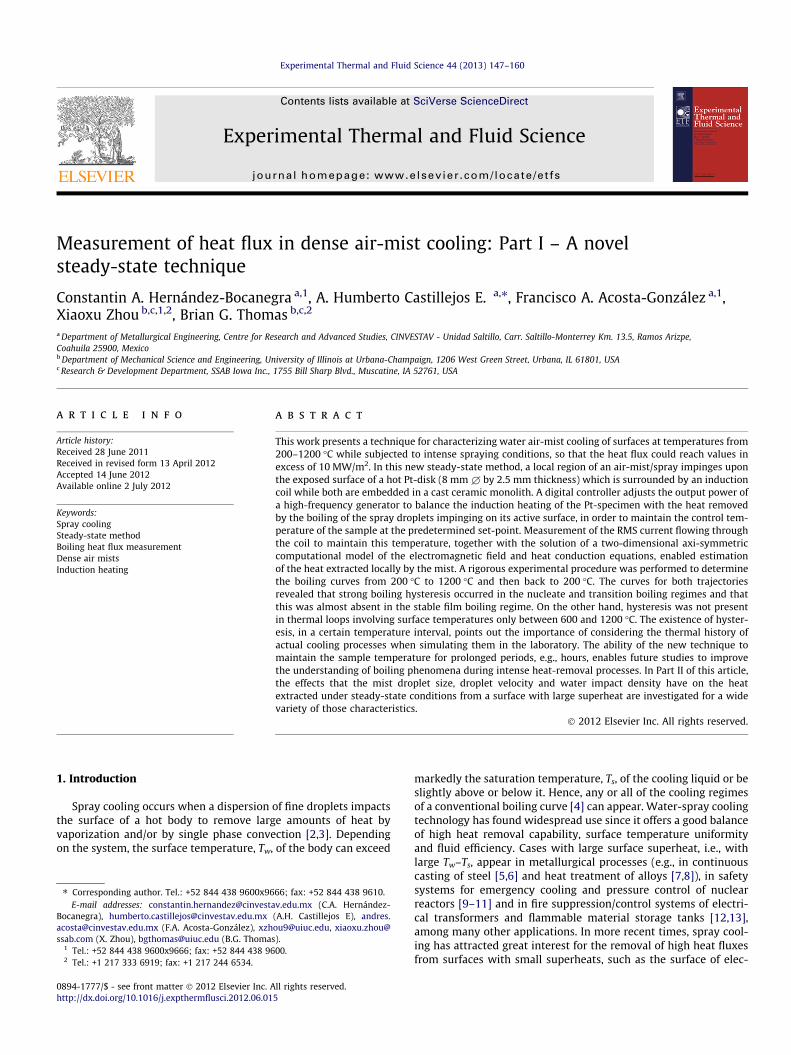
As indicated above, the steady-state measuring method devel-oped here to quantify boiling heat transfer is based on equalizingthe induction heating of a metallic sample with the heat removedby the boiling of spray droplets that impinge upon the uncoveredsurface of the test-sample. To accomplish these measurements,the following equipment was used: (a) a generator with enoughoutput power to compensate the sample heat losses; (b) a coil withthe required design and shape near the surface of the specimen toensure its fast heating; (c) a digital controller to maintain the spec-imen at the desired set-point temperature; (d) water and air sup-ply systems capable of delivering constant flow rates to thenozzle and to maintain steady spraying of the sample; (e) a tra-versing mechanism for moving the nozzle and exposing the speci-men to different locations of the spray cross-section and hence todifferent water impact densities, droplet diameters and dropletvelocities; and (f) an acquisition and computer system for data log-ging and data processing. Fig. 1 shows the test rig made-up of allthese components.
The high frequency 50–450 kHz generator (Luzars URF-5, ASEP-SA S.A. de C.V., QRO, Mexico) had a nominal output power of 5 kW,and a maximum RMS output current of 60 A. The generator in-cluded a port for external control through the application of a volt-age input in the range of 0–5 VDC, for 100% of the output powerrange. A PID (proportional–differential–integral) digital controller(A5AK-AA2-500, Omron Corp., Kyoto, Japan) provided this inputvoltage. The controller measured the temperature of the thermo-couple welded in the back face of the sample and compared it tothe specified set-point value. Based on their difference and thedefined PID gains, the controller adjusted the voltage to providethe required output power of the generator. Additionally, thegenerator was instrumented with a high frequency ammeter(TRC-4000, ASEPSA S.A. de C.V., QRO, Mexico) designed and builtfor the specific coil configuration. Basically, this ammeter is a cur-
rent transformer that measures the AC RMS current passingthrough the coil by converting it to a proportional DC output signal.The AC current can be up to 1000 A at 400 kHz and is transformed toDC signals in the ranges of 0–10 V, 0–20 mA, or 4–20 mA. Theammeter circuit was calibrated by applying known AC signals andmeasuring the DC output current. The error limits of the ammeterwere ±0.8% at 200–500 A and 250 ± 10 kHz, which include the cur-rent and frequency intervals found in the present experiments.
Water for the air-mist nozzle was supplied from a reservoirusing an immersion pump and the line was instrumented with adigital turbine flow-meter, a valve, a digital pressure gauge andan immersion thermocouple. For the experiments, well waterwas softened to minimize the deposition of a crust of calciumand magnesium sulfates on the surface of the Pt-specimen. Aftertreatment, the concentrations of the main ions in the water wereas follows: Ca2+ < 0.25 mg/L, Mg2+ �50 mg/L and Na+ �600 mg/L.The air was provided by a compressor and the line included anautomatically controlled valve, to minimize flow rate variations,a mass flow-meter and a digital manometer. The capacity of bothlines could handle the flow specifications of a wide variety of sprayand air-mist nozzles used for secondary cooling in the continuouscasting of steel. Selection of the x–y–z position of the Pt- specimenwith respect to the center of the nozzle orifice was achieved via atraversing mechanism on which the nozzle was mounted. The noz-zle orifice was held at a specified setback distance, zs, from the sur-face of the platinum disk, and the transverse x-position varied aty = 0; as shown in the coordinate system in Fig. 1, the origin is lo-cated at the center of the nozzle orifice. As appreciated from thefigure the nozzles were of the fan discharge type. Part II of thiswork reports the setback distance, the angle of expansion of thefan jets, and the relationship between the flow rates (W and A)and operating pressures (pw and pa) of the water and air in thepneumatic nozzles [1]. The nozzles investigated were: W19822(Delavan Inc., Monroe, NC), Casterjet 1/2–5–60 and Casterjet 1/2–6.5–90 (Spraying Systems Co. Chicago, IL), but this article (Part I)presents representative results only for W19822 nozzles. Dataacquisition was accomplished by a SCXI-1000-NI system drivenby LabView (National Instruments Corp., Austin, TX). The datasampled by the system were: the output power of the generator,the coil RMS current and current frequency, the specimen controltemperature, the water temperatures at the entrance and exit ofthe coil, the temperature of the water fed to the nozzle and thewater and air flow rates and pressures in the nozzle. The watertemperature was measured with K-type thermocouples.
2.2. Measuring probe
The test specimen shown in Fig. 1 consisted of a platinum disk(8 mm £, 2.5 mm thickness) instrumented with an R-type thermo-couple (0.5 mm £) that was welded to the center of its back sur-face. This specimen was wrapped around by a hollow copper coil,and all were encased in insulating SiO2 castable ceramic to forma monolith. Care was taken to ensure that, in its as-cast state, theceramic completely filled the gaps between the specimen and thecoil and established an intimate union with both of them, leavingno crevices in between. As seen in the figure, the monolith wasplaced inside a Plexiglas tube and its front was covered by a quartzwindow having a central hole. This probe or test-assembly left onlythe frontal face of the Pt-disk exposed to the impingement of thespray water droplets.
The thermocouple at the back of the disk registered what iscalled the sample or control temperature Tm. As shown in Fig. 1,the terminals of the coil exited through holes in the Plexiglas tubeand the thermocouple was withdrawn through a small orifice onthe back cover. For additional protection against water, the ceramicbody was coated with waterproof paint. As shown in the figure, the
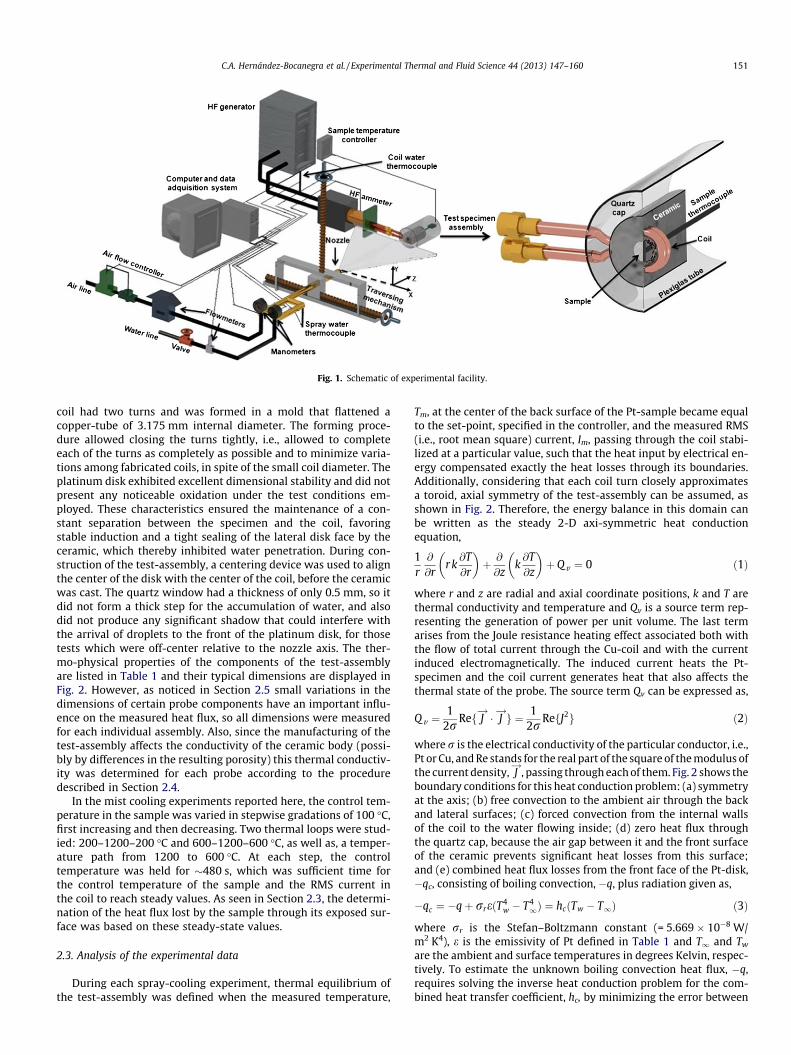
Fig. 1. Schematic of experimental facility.
C.A. Hernández-Bocanegra et al. / Experimental Thermal and Fluid Science 44 (2013) 147–160 151
coil had two turns and was formed in a mold that flattened acopper-tube of 3.175 mm internal diameter. The forming proce-dure allowed closing the turns tightly, i.e., allowed to completeeach of the turns as completely as possible and to minimize varia-tions among fabricated coils, in spite of the small coil diameter. Theplatinum disk exhibited excellent dimensional stability and did notpresent any noticeable oxidation under the test conditions em-ployed. These characteristics ensured the maintenance of a con-stant separation between the specimen and the coil, favoringstable induction and a tight sealing of the lateral disk face by theceramic, which thereby inhibited water penetration. During con-struction of the test-assembly, a centering device was used to alignthe center of the disk with the center of the coil, before the ceramicwas cast. The quartz window had a thickness of only 0.5 mm, so itdid not form a thick step for the accumulation of water, and alsodid not produce any significant shadow that could interfere withthe arrival of droplets to the front of the platinum disk, for thosetests which were off-center relative to the nozzle axis. The ther-mo-physical properties of the components of the test-assemblyare listed in Table 1 and their typical dimensions are displayed inFig. 2. However, as noticed in Section 2.5 small variations in thedimensions of certain probe components have an important influ-ence on the measured heat flux, so all dimensions were measuredfor each individual assembly. Also, since the manufacturing of thetest-assembly affects the conductivity of the ceramic body (possi-bly by differences in the resulting porosity) this thermal conductiv-ity was determined for each probe according to the proceduredescribed in Section 2.4.
In the mist cooling experiments reported here, the control tem-perature in the sample was varied in stepwise gradations of 100 �C,first increasing and then decreasing. Two thermal loops were stud-ied: 200–1200–200 �C and 600–1200–600 �C, as well as, a temper-ature path from 1200 to 600 �C. At each step, the controltemperature was held for �480 s, which was sufficient time forthe control temperature of the sample and the RMS current inthe coil to reach steady values. As seen in Section 2.3, the determi-nation of the heat flux lost by the sample through its exposed sur-face was based on these steady-state values.
2.3. Analysis of the experimental data
During each spray-cooling experiment, thermal equilibrium ofthe test-assembly was defined when the measured temperature,
Tm, at the center of the back surface of the Pt-sample became equalto the set-point, specified in the controller, and the measured RMS(i.e., root mean square) current, Im, passing through the coil stabi-lized at a particular value, such that the heat input by electrical en-ergy compensated exactly the heat losses through its boundaries.Additionally, considering that each coil turn closely approximatesa toroid, axial symmetry of the test-assembly can be assumed, asshown in Fig. 2. Therefore, the energy balance in this domain canbe written as the steady 2-D axi-symmetric heat conductionequation,
1r@
@rr k@T@r
� �þ @
@zk@T@z
� �þ Qv ¼ 0 ð1Þ
where r and z are radial and axial coordinate positions, k and T arethermal conductivity and temperature and Qv is a source term rep-resenting the generation of power per unit volume. The last termarises from the Joule resistance heating effect associated both withthe flow of total current through the Cu-coil and with the currentinduced electromagnetically. The induced current heats the Pt-specimen and the coil current generates heat that also affects thethermal state of the probe. The source term Qv can be expressed as,
Qv ¼1
2rRef J!� J!g ¼ 1
2rRefJ2g ð2Þ
where r is the electrical conductivity of the particular conductor, i.e.,Pt or Cu, and Re stands for the real part of the square of the modulus ofthe current density, J
!, passing through each of them. Fig. 2 shows the
boundary conditions for this heat conduction problem: (a) symmetryat the axis; (b) free convection to the ambient air through the backand lateral surfaces; (c) forced convection from the internal wallsof the coil to the water flowing inside; (d) zero heat flux throughthe quartz cap, because the air gap between it and the front surfaceof the ceramic prevents significant heat losses from this surface;and (e) combined heat flux losses from the front face of the Pt-disk,�qc, consisting of boiling convection, �q, plus radiation given as,
�qc ¼ �qþ rreðT4w � T4
1Þ ¼ hcðTw � T1Þ ð3Þ
where rr is the Stefan–Boltzmann constant (= 5.669 � 10�8 W/m2 K4), e is the emissivity of Pt defined in Table 1 and T1 and Tw
are the ambient and surface temperatures in degrees Kelvin, respec-tively. To estimate the unknown boiling convection heat flux, �q,requires solving the inverse heat conduction problem for the com-bined heat transfer coefficient, hc, by minimizing the error between
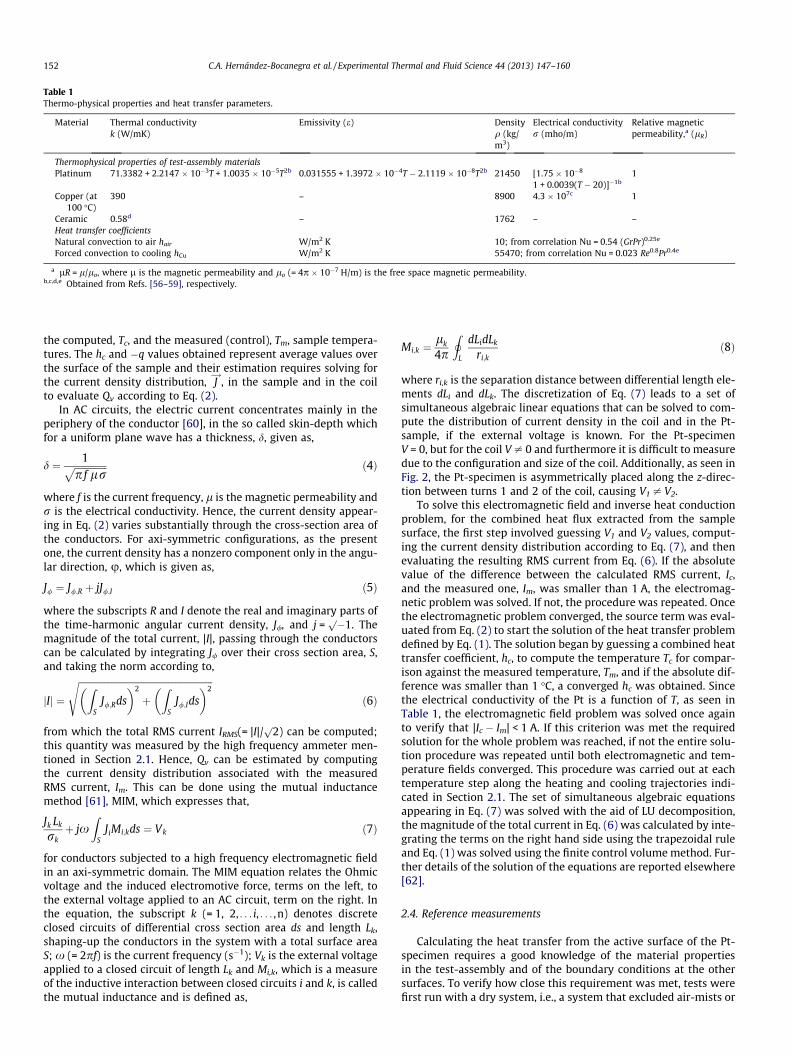
Table 1Thermo-physical properties and heat transfer parameters.
Material Thermal conductivityk (W/mK)
Emissivity (e) Densityq (kg/m3)
Electrical conductivityr (mho/m)
Relative magneticpermeability,a (lR)
Thermophysical properties of test-assembly materialsPlatinum 71.3382 + 2.2147 � 10�3T + 1.0035 � 10�5T2b 0.031555 + 1.3972 � 10�4T � 2.1119 � 10�8T2b 21450 [1.75 � 10�8
1 + 0.0039(T � 20)]�1b1
Copper (at100 �C)
390 – 8900 4.3 � 107c 1
Ceramic 0.58d – 1762 – –Heat transfer coefficientsNatural convection to air hair W/m2 K 10; from correlation Nu = 0.54 (GrPr)0.25e
Forced convection to cooling hCu W/m2 K 55470; from correlation Nu = 0.023 Re0.8Pr0.4e
a lR = l/lo, where l is the magnetic permeability and lo (= 4p � 10�7 H/m) is the free space magnetic permeability.b,c,d,e Obtained from Refs. [56–59], respectively.
152 C.A. Hernández-Bocanegra et al. / Experimental Thermal and Fluid Science 44 (2013) 147–160
the computed, Tc, and the measured (control), Tm, sample tempera-tures. The hc and �q values obtained represent average values overthe surface of the sample and their estimation requires solving forthe current density distribution, J
!, in the sample and in the coil
to evaluate Qv according to Eq. (2).In AC circuits, the electric current concentrates mainly in the
periphery of the conductor [60], in the so called skin-depth whichfor a uniform plane wave has a thickness, d, given as,
d ¼ 1ffiffiffiffiffiffiffiffiffiffiffiffiffiffip f lr
p ð4Þ
where f is the current frequency, l is the magnetic permeability andr is the electrical conductivity. Hence, the current density appear-ing in Eq. (2) varies substantially through the cross-section area ofthe conductors. For axi-symmetric configurations, as the presentone, the current density has a nonzero component only in the angu-lar direction, u, which is given as,
J/ ¼ J/;R þ jJ/;I ð5Þ
where the subscripts R and I denote the real and imaginary parts ofthe time-harmonic angular current density, J/, and j =
p�1. Themagnitude of the total current, |I|, passing through the conductorscan be calculated by integrating J/ over their cross section area, S,and taking the norm according to,
jIj ¼
ffiffiffiffiffiffiffiffiffiffiffiffiffiffiffiffiffiffiffiffiffiffiffiffiffiffiffiffiffiffiffiffiffiffiffiffiffiffiffiffiffiffiffiffiffiffiffiffiffiffiffiffiffiffiffiffiffiffiZS
J/;Rds� �2
þZ
SJ/;Ids
� �2s
ð6Þ
from which the total RMS current IRMS(= |I|/p
2) can be computed;this quantity was measured by the high frequency ammeter men-tioned in Section 2.1. Hence, Qv can be estimated by computingthe current density distribution associated with the measuredRMS current, Im. This can be done using the mutual inductancemethod [61], MIM, which expresses that,
Jk Lk
rkþ jx
ZS
JiMi;kds ¼ Vk ð7Þ
for conductors subjected to a high frequency electromagnetic fieldin an axi-symmetric domain. The MIM equation relates the Ohmicvoltage and the induced electromotive force, terms on the left, tothe external voltage applied to an AC circuit, term on the right. Inthe equation, the subscript k (= 1, 2, . . . i, . . . ,n) denotes discreteclosed circuits of differential cross section area ds and length Lk,shaping-up the conductors in the system with a total surface areaS; x (= 2pf) is the current frequency (s�1); Vk is the external voltageapplied to a closed circuit of length Lk and Mi,k, which is a measureof the inductive interaction between closed circuits i and k, is calledthe mutual inductance and is defined as,
Mi;k ¼lk
4p
IL
dLidLk
ri;kð8Þ
where ri,k is the separation distance between differential length ele-ments dLi and dLk. The discretization of Eq. (7) leads to a set ofsimultaneous algebraic linear equations that can be solved to com-pute the distribution of current density in the coil and in the Pt-sample, if the external voltage is known. For the Pt-specimenV = 0, but for the coil V – 0 and furthermore it is difficult to measuredue to the configuration and size of the coil. Additionally, as seen inFig. 2, the Pt-specimen is asymmetrically placed along the z-direc-tion between turns 1 and 2 of the coil, causing V1 – V2.
To solve this electromagnetic field and inverse heat conductionproblem, for the combined heat flux extracted from the samplesurface, the first step involved guessing V1 and V2 values, comput-ing the current density distribution according to Eq. (7), and thenevaluating the resulting RMS current from Eq. (6). If the absolutevalue of the difference between the calculated RMS current, Ic,and the measured one, Im, was smaller than 1 A, the electromag-netic problem was solved. If not, the procedure was repeated. Oncethe electromagnetic problem converged, the source term was eval-uated from Eq. (2) to start the solution of the heat transfer problemdefined by Eq. (1). The solution began by guessing a combined heattransfer coefficient, hc, to compute the temperature Tc for compar-ison against the measured temperature, Tm, and if the absolute dif-ference was smaller than 1 �C, a converged hc was obtained. Sincethe electrical conductivity of the Pt is a function of T, as seen inTable 1, the electromagnetic field problem was solved once againto verify that |Ic � Im| < 1 A. If this criterion was met the requiredsolution for the whole problem was reached, if not the entire solu-tion procedure was repeated until both electromagnetic and tem-perature fields converged. This procedure was carried out at eachtemperature step along the heating and cooling trajectories indi-cated in Section 2.1. The set of simultaneous algebraic equationsappearing in Eq. (7) was solved with the aid of LU decomposition,the magnitude of the total current in Eq. (6) was calculated by inte-grating the terms on the right hand side using the trapezoidal ruleand Eq. (1) was solved using the finite control volume method. Fur-ther details of the solution of the equations are reported elsewhere[62].
2.4. Reference measurements
Calculating the heat transfer from the active surface of the Pt-specimen requires a good knowledge of the material propertiesin the test-assembly and of the boundary conditions at the othersurfaces. To verify how close this requirement was met, tests werefirst run with a dry system, i.e., a system that excluded air-mists or
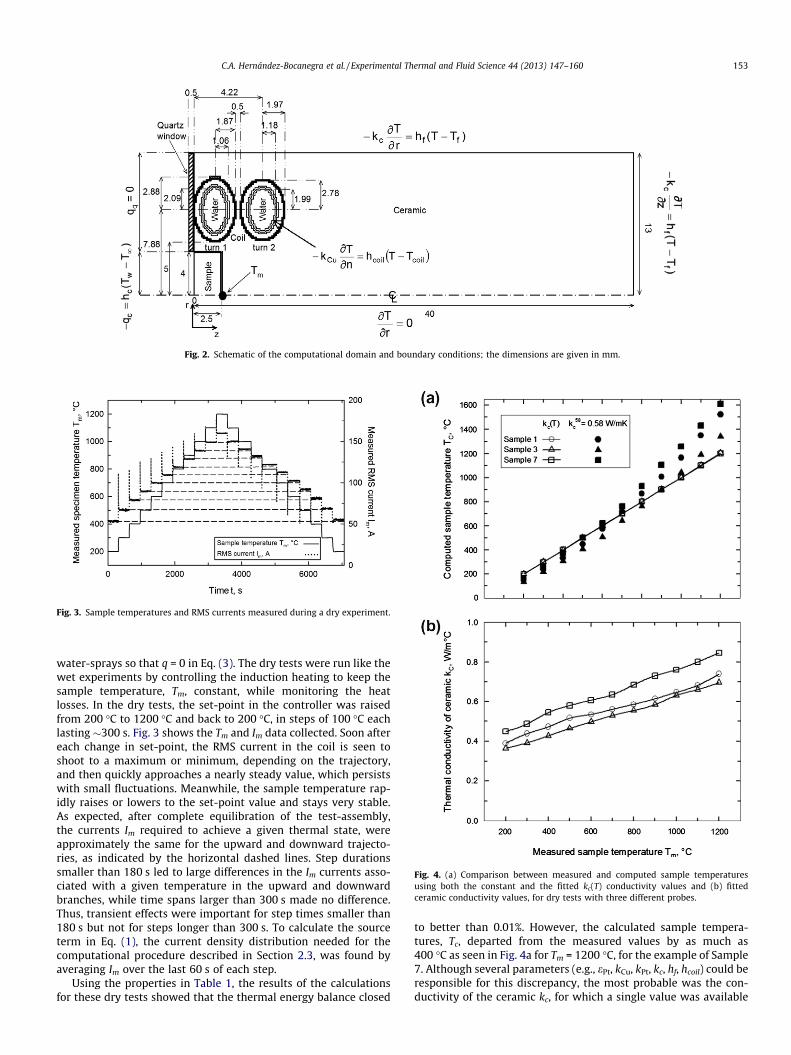
Fig. 3. Sample temperatures and RMS currents measured during a dry experiment.
Fig. 4. (a) Comparison between measured and computed sample temperaturesusing both the constant and the fitted kc(T) conductivity values and (b) fittedceramic conductivity values, for dry tests with three different probes.
Fig. 2. Schematic of the computational domain and boundary conditions; the dimensions are given in mm.
C.A. Hernández-Bocanegra et al. / Experimental Thermal and Fluid Science 44 (2013) 147–160 153
water-sprays so that q = 0 in Eq. (3). The dry tests were run like thewet experiments by controlling the induction heating to keep thesample temperature, Tm, constant, while monitoring the heatlosses. In the dry tests, the set-point in the controller was raisedfrom 200 �C to 1200 �C and back to 200 �C, in steps of 100 �C eachlasting �300 s. Fig. 3 shows the Tm and Im data collected. Soon aftereach change in set-point, the RMS current in the coil is seen toshoot to a maximum or minimum, depending on the trajectory,and then quickly approaches a nearly steady value, which persistswith small fluctuations. Meanwhile, the sample temperature rap-idly raises or lowers to the set-point value and stays very stable.As expected, after complete equilibration of the test-assembly,the currents Im required to achieve a given thermal state, wereapproximately the same for the upward and downward trajecto-ries, as indicated by the horizontal dashed lines. Step durationssmaller than 180 s led to large differences in the Im currents asso-ciated with a given temperature in the upward and downwardbranches, while time spans larger than 300 s made no difference.Thus, transient effects were important for step times smaller than180 s but not for steps longer than 300 s. To calculate the sourceterm in Eq. (1), the current density distribution needed for thecomputational procedure described in Section 2.3, was found byaveraging Im over the last 60 s of each step.
Using the properties in Table 1, the results of the calculationsfor these dry tests showed that the thermal energy balance closed
to better than 0.01%. However, the calculated sample tempera-tures, Tc, departed from the measured values by as much as400 �C as seen in Fig. 4a for Tm = 1200 �C, for the example of Sample7. Although several parameters (e.g., ePt, kCu, kPt, kc, hf, hcoil) could beresponsible for this discrepancy, the most probable was the con-ductivity of the ceramic kc, for which a single value was available
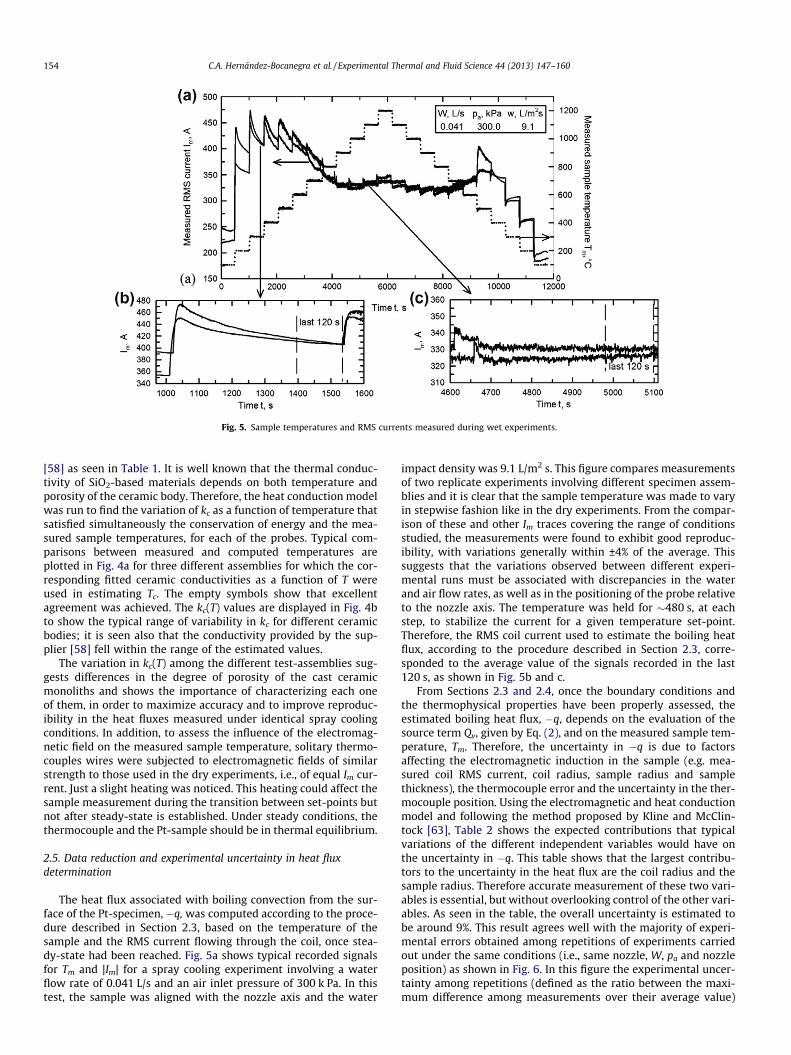
Fig. 5. Sample temperatures and RMS currents measured during wet experiments.
154 C.A. Hernández-Bocanegra et al. / Experimental Thermal and Fluid Science 44 (2013) 147–160
[58] as seen in Table 1. It is well known that the thermal conduc-tivity of SiO2-based materials depends on both temperature andporosity of the ceramic body. Therefore, the heat conduction modelwas run to find the variation of kc as a function of temperature thatsatisfied simultaneously the conservation of energy and the mea-sured sample temperatures, for each of the probes. Typical com-parisons between measured and computed temperatures areplotted in Fig. 4a for three different assemblies for which the cor-responding fitted ceramic conductivities as a function of T wereused in estimating Tc. The empty symbols show that excellentagreement was achieved. The kc(T) values are displayed in Fig. 4bto show the typical range of variability in kc for different ceramicbodies; it is seen also that the conductivity provided by the sup-plier [58] fell within the range of the estimated values.
The variation in kc(T) among the different test-assemblies sug-gests differences in the degree of porosity of the cast ceramicmonoliths and shows the importance of characterizing each oneof them, in order to maximize accuracy and to improve reproduc-ibility in the heat fluxes measured under identical spray coolingconditions. In addition, to assess the influence of the electromag-netic field on the measured sample temperature, solitary thermo-couples wires were subjected to electromagnetic fields of similarstrength to those used in the dry experiments, i.e., of equal Im cur-rent. Just a slight heating was noticed. This heating could affect thesample measurement during the transition between set-points butnot after steady-state is established. Under steady conditions, thethermocouple and the Pt-sample should be in thermal equilibrium.
2.5. Data reduction and experimental uncertainty in heat fluxdetermination
The heat flux associated with boiling convection from the sur-face of the Pt-specimen, �q, was computed according to the proce-dure described in Section 2.3, based on the temperature of thesample and the RMS current flowing through the coil, once stea-dy-state had been reached. Fig. 5a shows typical recorded signalsfor Tm and |Im| for a spray cooling experiment involving a waterflow rate of 0.041 L/s and an air inlet pressure of 300 k Pa. In thistest, the sample was aligned with the nozzle axis and the water
impact density was 9.1 L/m2 s. This figure compares measurementsof two replicate experiments involving different specimen assem-blies and it is clear that the sample temperature was made to varyin stepwise fashion like in the dry experiments. From the compar-ison of these and other Im traces covering the range of conditionsstudied, the measurements were found to exhibit good reproduc-ibility, with variations generally within ±4% of the average. Thissuggests that the variations observed between different experi-mental runs must be associated with discrepancies in the waterand air flow rates, as well as in the positioning of the probe relativeto the nozzle axis. The temperature was held for �480 s, at eachstep, to stabilize the current for a given temperature set-point.Therefore, the RMS coil current used to estimate the boiling heatflux, according to the procedure described in Section 2.3, corre-sponded to the average value of the signals recorded in the last120 s, as shown in Fig. 5b and c.
From Sections 2.3 and 2.4, once the boundary conditions andthe thermophysical properties have been properly assessed, theestimated boiling heat flux, �q, depends on the evaluation of thesource term Qv, given by Eq. (2), and on the measured sample tem-perature, Tm. Therefore, the uncertainty in �q is due to factorsaffecting the electromagnetic induction in the sample (e.g. mea-sured coil RMS current, coil radius, sample radius and samplethickness), the thermocouple error and the uncertainty in the ther-mocouple position. Using the electromagnetic and heat conductionmodel and following the method proposed by Kline and McClin-tock [63], Table 2 shows the expected contributions that typicalvariations of the different independent variables would have onthe uncertainty in �q. This table shows that the largest contribu-tors to the uncertainty in the heat flux are the coil radius and thesample radius. Therefore accurate measurement of these two vari-ables is essential, but without overlooking control of the other vari-ables. As seen in the table, the overall uncertainty is estimated tobe around 9%. This result agrees well with the majority of experi-mental errors obtained among repetitions of experiments carriedout under the same conditions (i.e., same nozzle, W, pa and nozzleposition) as shown in Fig. 6. In this figure the experimental uncer-tainty among repetitions (defined as the ratio between the maxi-mum difference among measurements over their average value)
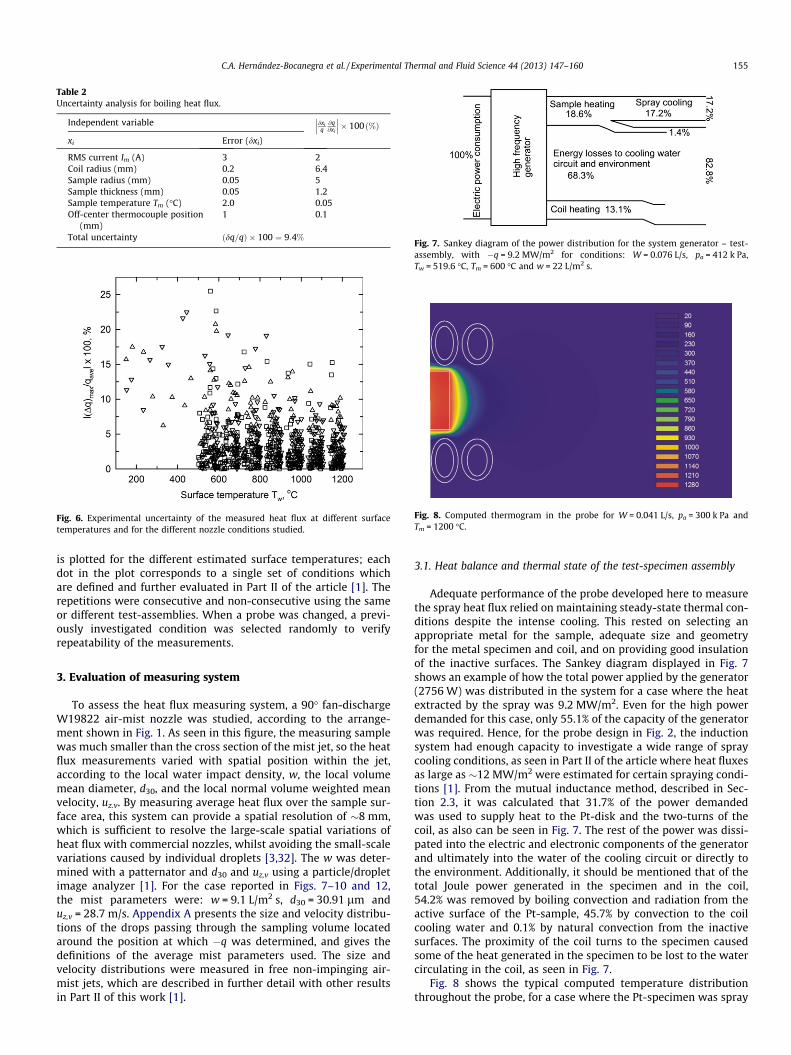
Fig. 7. Sankey diagram of the power distribution for the system generator – test-assembly, with �q = 9.2 MW/m2 for conditions: W = 0.076 L/s, pa = 412 k Pa,Tw = 519.6 �C, Tm = 600 �C and w = 22 L/m2 s.
Fig. 8. Computed thermogram in the probe for W = 0.041 L/s, pa = 300 k Pa andTm = 1200 �C.
Fig. 6. Experimental uncertainty of the measured heat flux at different surfacetemperatures and for the different nozzle conditions studied.
Table 2Uncertainty analysis for boiling heat flux.
Independent variable dxiq@q@xi
��� ���� 100 ð%Þxi Error (dxi)
RMS current Im (A) 3 2Coil radius (mm) 0.2 6.4Sample radius (mm) 0.05 5Sample thickness (mm) 0.05 1.2Sample temperature Tm (�C) 2.0 0.05Off-center thermocouple position
(mm)1 0.1
Total uncertainty ðdq=qÞ � 100 ¼ 9:4%
C.A. Hernández-Bocanegra et al. / Experimental Thermal and Fluid Science 44 (2013) 147–160 155
is plotted for the different estimated surface temperatures; eachdot in the plot corresponds to a single set of conditions whichare defined and further evaluated in Part II of the article [1]. Therepetitions were consecutive and non-consecutive using the sameor different test-assemblies. When a probe was changed, a previ-ously investigated condition was selected randomly to verifyrepeatability of the measurements.
3. Evaluation of measuring system
To assess the heat flux measuring system, a 90� fan-dischargeW19822 air-mist nozzle was studied, according to the arrange-ment shown in Fig. 1. As seen in this figure, the measuring samplewas much smaller than the cross section of the mist jet, so the heatflux measurements varied with spatial position within the jet,according to the local water impact density, w, the local volumemean diameter, d30, and the local normal volume weighted meanvelocity, uz.v. By measuring average heat flux over the sample sur-face area, this system can provide a spatial resolution of �8 mm,which is sufficient to resolve the large-scale spatial variations ofheat flux with commercial nozzles, whilst avoiding the small-scalevariations caused by individual droplets [3,32]. The w was deter-mined with a patternator and d30 and uz,v using a particle/dropletimage analyzer [1]. For the case reported in Figs. 7–10 and 12,the mist parameters were: w = 9.1 L/m2 s, d30 = 30.91 lm anduz,v = 28.7 m/s. Appendix A presents the size and velocity distribu-tions of the drops passing through the sampling volume locatedaround the position at which �q was determined, and gives thedefinitions of the average mist parameters used. The size andvelocity distributions were measured in free non-impinging air-mist jets, which are described in further detail with other resultsin Part II of this work [1].
3.1. Heat balance and thermal state of the test-specimen assembly
Adequate performance of the probe developed here to measurethe spray heat flux relied on maintaining steady-state thermal con-ditions despite the intense cooling. This rested on selecting anappropriate metal for the sample, adequate size and geometryfor the metal specimen and coil, and on providing good insulationof the inactive surfaces. The Sankey diagram displayed in Fig. 7shows an example of how the total power applied by the generator(2756 W) was distributed in the system for a case where the heatextracted by the spray was 9.2 MW/m2. Even for the high powerdemanded for this case, only 55.1% of the capacity of the generatorwas required. Hence, for the probe design in Fig. 2, the inductionsystem had enough capacity to investigate a wide range of spraycooling conditions, as seen in Part II of the article where heat fluxesas large as �12 MW/m2 were estimated for certain spraying condi-tions [1]. From the mutual inductance method, described in Sec-tion 2.3, it was calculated that 31.7% of the power demandedwas used to supply heat to the Pt-disk and the two-turns of thecoil, as also can be seen in Fig. 7. The rest of the power was dissi-pated into the electric and electronic components of the generatorand ultimately into the water of the cooling circuit or directly tothe environment. Additionally, it should be mentioned that of thetotal Joule power generated in the specimen and in the coil,54.2% was removed by boiling convection and radiation from theactive surface of the Pt-sample, 45.7% by convection to the coilcooling water and 0.1% by natural convection from the inactivesurfaces. The proximity of the coil turns to the specimen causedsome of the heat generated in the specimen to be lost to the watercirculating in the coil, as seen in Fig. 7.
Fig. 8 shows the typical computed temperature distributionthroughout the probe, for a case where the Pt-specimen was spray
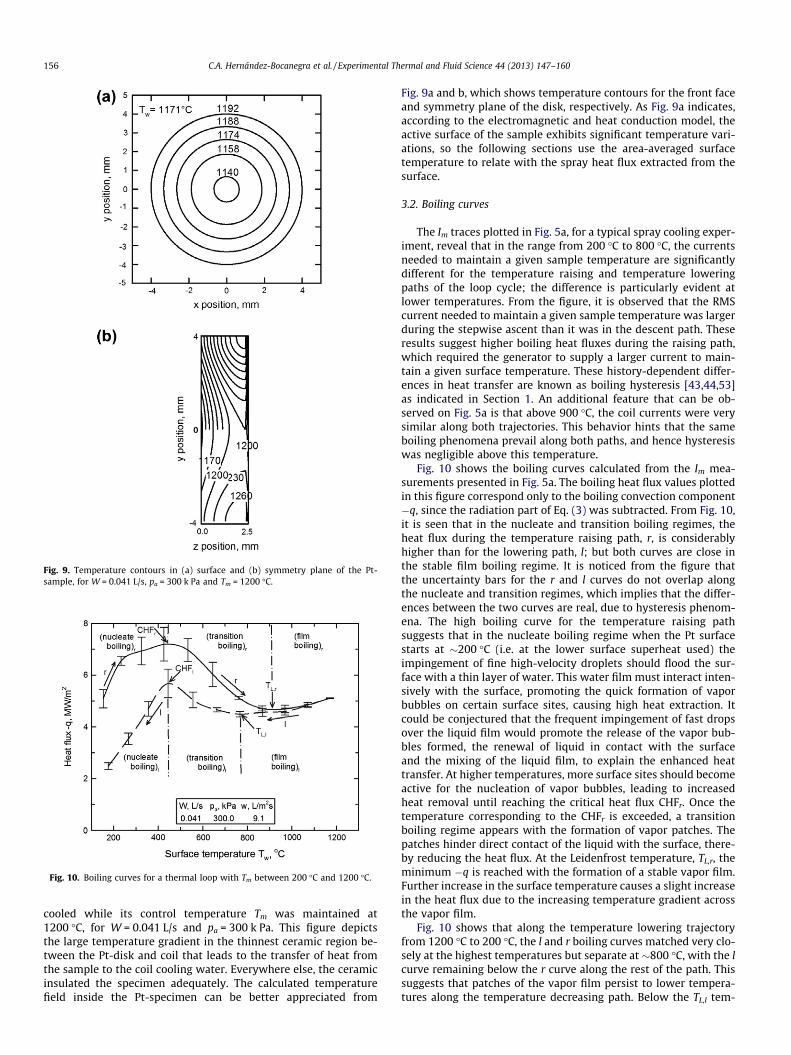
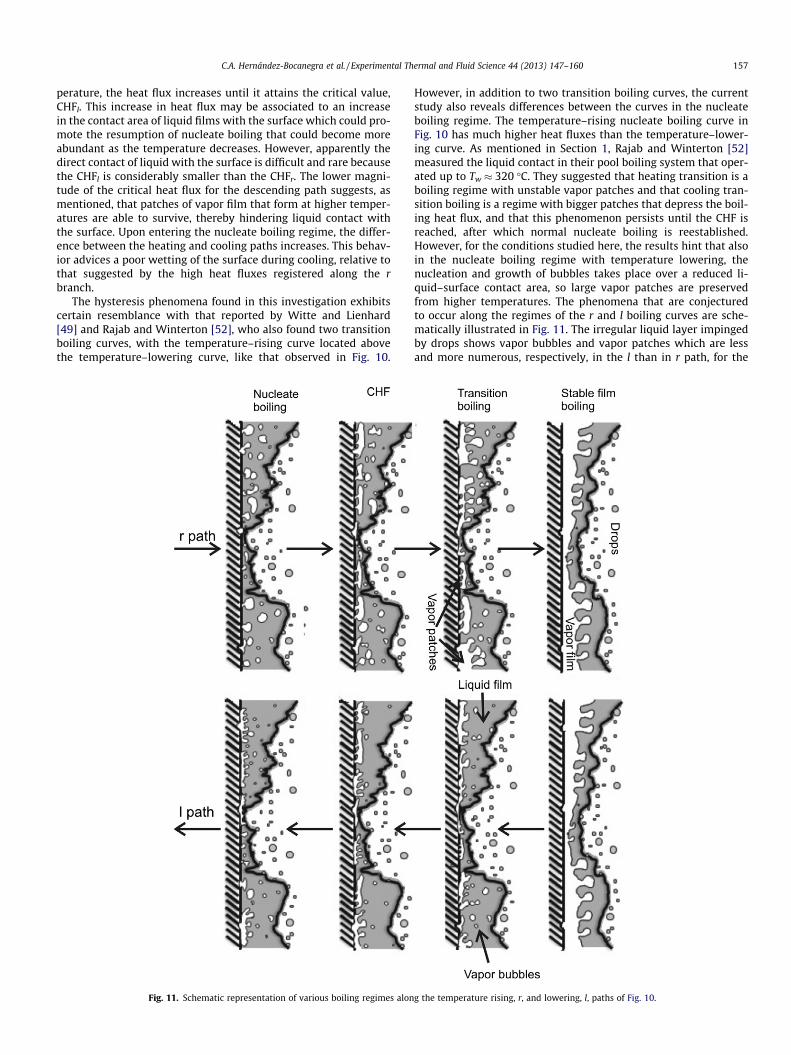
Fig. 9. Temperature contours in (a) surface and (b) symmetry plane of the Pt-sample, for W = 0.041 L/s, pa = 300 k Pa and Tm = 1200 �C.
Fig. 10. Boiling curves for a thermal loop with Tm between 200 �C and 1200 �C.
156 C.A. Hernández-Bocanegra et al. / Experimental Thermal and Fluid Science 44 (2013) 147–160
cooled while its control temperature Tm was maintained at1200 �C, for W = 0.041 L/s and pa = 300 k Pa. This figure depictsthe large temperature gradient in the thinnest ceramic region be-tween the Pt-disk and coil that leads to the transfer of heat fromthe sample to the coil cooling water. Everywhere else, the ceramicinsulated the specimen adequately. The calculated temperaturefield inside the Pt-specimen can be better appreciated from
Fig. 9a and b, which shows temperature contours for the front faceand symmetry plane of the disk, respectively. As Fig. 9a indicates,according to the electromagnetic and heat conduction model, theactive surface of the sample exhibits significant temperature vari-ations, so the following sections use the area-averaged surfacetemperature to relate with the spray heat flux extracted from thesurface.
3.2. Boiling curves
The Im traces plotted in Fig. 5a, for a typical spray cooling exper-iment, reveal that in the range from 200 �C to 800 �C, the currentsneeded to maintain a given sample temperature are significantlydifferent for the temperature raising and temperature loweringpaths of the loop cycle; the difference is particularly evident atlower temperatures. From the figure, it is observed that the RMScurrent needed to maintain a given sample temperature was largerduring the stepwise ascent than it was in the descent path. Theseresults suggest higher boiling heat fluxes during the raising path,which required the generator to supply a larger current to main-tain a given surface temperature. These history-dependent differ-ences in heat transfer are known as boiling hysteresis [43,44,53]as indicated in Section 1. An additional feature that can be ob-served on Fig. 5a is that above 900 �C, the coil currents were verysimilar along both trajectories. This behavior hints that the sameboiling phenomena prevail along both paths, and hence hysteresiswas negligible above this temperature.
Fig. 10 shows the boiling curves calculated from the Im mea-surements presented in Fig. 5a. The boiling heat flux values plottedin this figure correspond only to the boiling convection component�q, since the radiation part of Eq. (3) was subtracted. From Fig. 10,it is seen that in the nucleate and transition boiling regimes, theheat flux during the temperature raising path, r, is considerablyhigher than for the lowering path, l; but both curves are close inthe stable film boiling regime. It is noticed from the figure thatthe uncertainty bars for the r and l curves do not overlap alongthe nucleate and transition regimes, which implies that the differ-ences between the two curves are real, due to hysteresis phenom-ena. The high boiling curve for the temperature raising pathsuggests that in the nucleate boiling regime when the Pt surfacestarts at �200 �C (i.e. at the lower surface superheat used) theimpingement of fine high-velocity droplets should flood the sur-face with a thin layer of water. This water film must interact inten-sively with the surface, promoting the quick formation of vaporbubbles on certain surface sites, causing high heat extraction. Itcould be conjectured that the frequent impingement of fast dropsover the liquid film would promote the release of the vapor bub-bles formed, the renewal of liquid in contact with the surfaceand the mixing of the liquid film, to explain the enhanced heattransfer. At higher temperatures, more surface sites should becomeactive for the nucleation of vapor bubbles, leading to increasedheat removal until reaching the critical heat flux CHFr. Once thetemperature corresponding to the CHFr is exceeded, a transitionboiling regime appears with the formation of vapor patches. Thepatches hinder direct contact of the liquid with the surface, there-by reducing the heat flux. At the Leidenfrost temperature, TL,r, theminimum �q is reached with the formation of a stable vapor film.Further increase in the surface temperature causes a slight increasein the heat flux due to the increasing temperature gradient acrossthe vapor film.
Fig. 10 shows that along the temperature lowering trajectoryfrom 1200 �C to 200 �C, the l and r boiling curves matched very clo-sely at the highest temperatures but separate at �800 �C, with the lcurve remaining below the r curve along the rest of the path. Thissuggests that patches of the vapor film persist to lower tempera-tures along the temperature decreasing path. Below the TL,l tem-
C.A. Hernández-Bocanegra et al. / Experimental Thermal and Fluid Science 44 (2013) 147–160 157
perature, the heat flux increases until it attains the critical value,CHFl. This increase in heat flux may be associated to an increasein the contact area of liquid films with the surface which could pro-mote the resumption of nucleate boiling that could become moreabundant as the temperature decreases. However, apparently thedirect contact of liquid with the surface is difficult and rare becausethe CHFl is considerably smaller than the CHFr. The lower magni-tude of the critical heat flux for the descending path suggests, asmentioned, that patches of vapor film that form at higher temper-atures are able to survive, thereby hindering liquid contact withthe surface. Upon entering the nucleate boiling regime, the differ-ence between the heating and cooling paths increases. This behav-ior advices a poor wetting of the surface during cooling, relative tothat suggested by the high heat fluxes registered along the rbranch.
The hysteresis phenomena found in this investigation exhibitscertain resemblance with that reported by Witte and Lienhard[49] and Rajab and Winterton [52], who also found two transitionboiling curves, with the temperature–rising curve located abovethe temperature–lowering curve, like that observed in Fig. 10.
Fig. 11. Schematic representation of various boiling regimes alon
However, in addition to two transition boiling curves, the currentstudy also reveals differences between the curves in the nucleateboiling regime. The temperature–rising nucleate boiling curve inFig. 10 has much higher heat fluxes than the temperature–lower-ing curve. As mentioned in Section 1, Rajab and Winterton [52]measured the liquid contact in their pool boiling system that oper-ated up to Tw � 320 �C. They suggested that heating transition is aboiling regime with unstable vapor patches and that cooling tran-sition boiling is a regime with bigger patches that depress the boil-ing heat flux, and that this phenomenon persists until the CHF isreached, after which normal nucleate boiling is reestablished.However, for the conditions studied here, the results hint that alsoin the nucleate boiling regime with temperature lowering, thenucleation and growth of bubbles takes place over a reduced li-quid–surface contact area, so large vapor patches are preservedfrom higher temperatures. The phenomena that are conjecturedto occur along the regimes of the r and l boiling curves are sche-matically illustrated in Fig. 11. The irregular liquid layer impingedby drops shows vapor bubbles and vapor patches which are lessand more numerous, respectively, in the l than in r path, for the
g the temperature rising, r, and lowering, l, paths of Fig. 10.
Fig. 12. Boiling curves for thermal loops with Tm 600–1200–600 �C and for thermalpaths 1200–600 �C.
158 C.A. Hernández-Bocanegra et al. / Experimental Thermal and Fluid Science 44 (2013) 147–160
nucleate regime, the CHF point and the transition regime; the sche-matics, shown in the figure, for the film boiling regime are alikealong both paths.
The Pt samples used in this work had an initially even and cleansurface that got rough and slightly coated by salts as the experi-ments proceeded, additionally a Pt surface is hydrophilic [64] likemany oxidized surfaces of other metals are (e.g. Fe) [65]. These sur-face characteristics – roughness, hydrophilic nature and contami-nation – have been reported to favor hysteresis [47,48,52,53].Thus, it is possible that the hysteresis behavior was not reportedin the steady-state spray cooling investigations cited in Section 1simply because the techniques were unable to follow temperatureincrease and temperature decrease paths or because they includedonly a narrow temperature range. Also, the unsteady-state tech-niques under free cooling conditions, that have been employed,are inherently unable to reveal the boiling hysteresis phenomenon.The existence of hysteresis points out the difficulties that may befound in simulating actual cooling processes in the laboratory,since the thermal response of the system, in the nucleate and tran-sition boiling regimes, depends on the initial thermal state of thesurface and on its history. Fortunately, hysteresis was absent atthe highest temperatures.
Since the main interest behind this work is the spray cooling ofhighly superheat surfaces with Tw between 700 �C and 1200 �C,boiling curves in this temperature range were investigated further.The solid and dashed lines in Fig. 12 show boiling curves for thethermal loop 600–1200–600 �C corresponding to the same spray-ing conditions as those used in Fig. 10. From the solid and dashedlines in Fig. 12, it is seen that for Tw ranging between 550 and1200 �C the hysteresis phenomenon was essentially absent, asindicated by the negligible separation between the raising andlowering curves of the loop. It is appreciated that these boilingcurves comprised transition and stable film boiling regimes, assuggested by the different slopes of the curves over different tem-perature ranges. Comparing Figs. 10 and 12 over the Tw interval of550 �C to 1200 �C reveals that the r and l boiling curves appearingin Fig. 10 exhibit significant differences in the range of 550 �C to800 �C, which are not present in the curves plotted in Fig. 12. Addi-tionally, the heat fluxes for the 600–1200–600 �C loop are smallerthan the corresponding high-temperature heat fluxes from the200–1200–200 �C loop. This result hints that when the thermal cy-cle starts at a sufficiently high temperature, e.g., 600 �C, the nucle-ation and growth of the vapor bubbles occurs fast, forming vaporpatches that hinder the direct contact of the liquid with the solidsurface. In contrast, starting the thermal cycle at low Tw, e.g.,
�200 �C, apparently enables the liquid water to fully wet the sur-face causing a persistent liquid layer that leads to more intenseheat extraction later at the higher temperatures. These resultsclearly show the importance of fully understanding, the thermalhistory in the actual processes, in order to simulate them accu-rately in the laboratory. The dotted line in Fig. 12 shows that theboiling curve for the thermal path 1200–600 �C, falls quite closeto the loop curves. Thus, for sufficiently high temperatures the ini-tial temperature and thermal history have negligible effect on thespray cooling of the sample. Part II of this two-part article furtherinvestigates and quantifies the effect of the spray parameters onthe boiling heat extraction for high sample temperatures, Tm, be-tween 600 and 1200 �C [1].
4. Summary and conclusions
A novel steady-state method based on induction heating hasbeen developed for studying the heat transfer characteristics ofhighly superheated surfaces subjected to intense spray coolingconditions, such as those found in steel continuous casting andother processes. To our best knowledge, this is the first time thata steady-state method has been successfully applied under suchdemanding heat extraction conditions.
The technique measures the heat flux extracted when a local re-gion of the spray from a water–air–mist nozzle impinges upon theactive surface of a hot Pt-disk, which is encircled by an inductioncoil, both of which are embedded in a cast ceramic monolith thatshields the other surfaces from the spray. A digital controller ad-justs the output power of a high-frequency generator to balancethe induction heating of the metallic sample with the heat re-moved by the boiling of spray droplets impinging on its active sur-face, in order to maintain the control temperature of the sample atthe desired set-point. Measurement of the RMS current flowingthrough the coil to maintain the sample temperature, togetherwith the solution of a two-dimensional axi-symmetric computa-tional model of the electromagnetic and heat conduction equa-tions, enabled estimation of the heat extracted locally by thespray. The present steady-state technique allows determining theboiling curve in the temperature range of 200–1200 �C under in-tense spraying conditions of practical interest in the cooling of sur-faces with large superheat.
A rigorous experimental procedure involving stepwise heatingand cooling over the 200–1200 �C temperature range enabled thecomplete boiling curves to be determined for both trajectories.The results reveal that boiling hysteresis occurs in the nucleationand transition boiling regimes, and that this behavior is almost ab-sent in the stable film boiling regime. The large list of factors thatmay lead to boiling hysteresis clearly points to the need for under-standing the phenomena involved in the extraction of heat, in or-der to enable laboratory simulation of the cooling conditions thattake place in industrial processes. The characteristics of the presenttechnique, which enables maintaining a metallic sample at a cho-sen temperature for prolonged periods of time while being sub-jected to intense heat extraction, opens the possibility for carefulexamination of the phenomena occurring during spray cooling bydense sprays. In the interval involving temperatures only between600 and 1200 �C hysteresis is absent and for this range the influ-ence of spray parameters on heat transfer is examined in Part IIof this article [1].
Acknowledgements
We are grateful to the National Council of Science and Technol-ogy of Mexico (CONACYT) and the National Science Foundation (US)for financial support through Grants Nos. 57836 and
C.A. Hernández-Bocanegra et al. / Experimental Thermal and Fluid Science 44 (2013) 147–160 159
CMMI-0900138, respectively, and also to the Continuous CastingConsortium at the University of Illinois. CAH and XZ wish to thankCONACYT and the CCC, respectively, for their scholarship grants.We want to recognize the valuable contributions of Mr. Sami Vapa-lahti in the initial stages of the project. The excellent technical sup-port of Mr. Jorge Ramos of ASEPSA S.A. de C.V. is greatly appreciated.
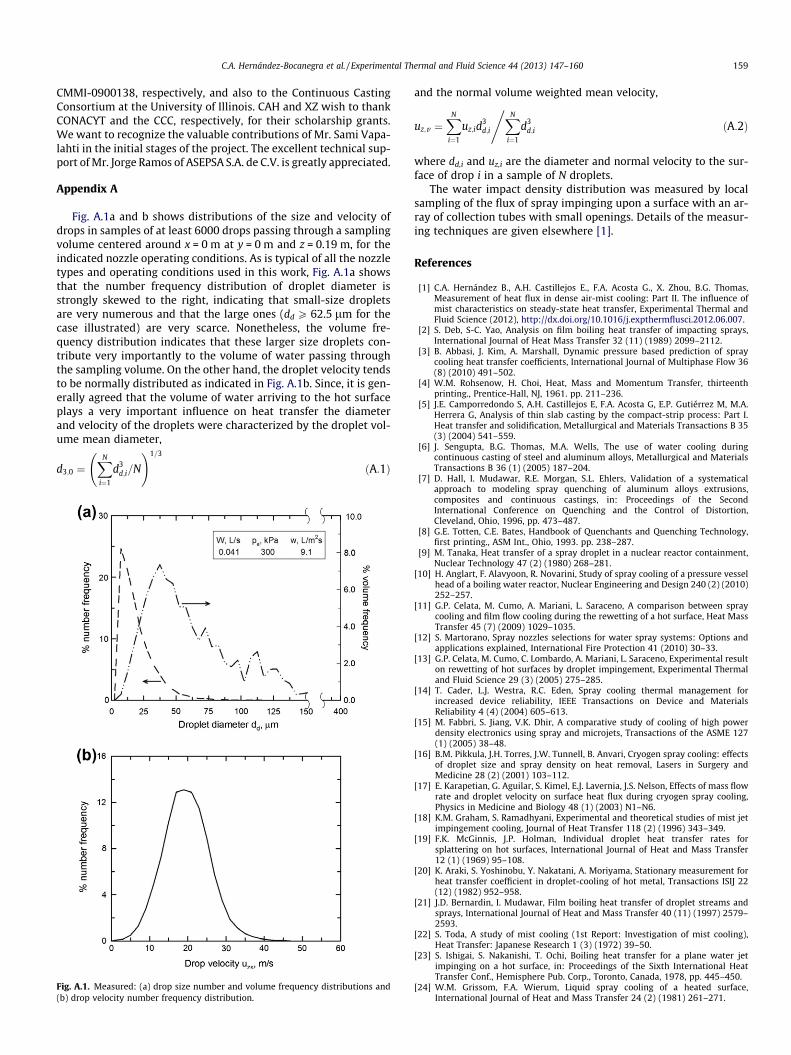
Appendix A
Fig. A.1a and b shows distributions of the size and velocity ofdrops in samples of at least 6000 drops passing through a samplingvolume centered around x = 0 m at y = 0 m and z = 0.19 m, for theindicated nozzle operating conditions. As is typical of all the nozzletypes and operating conditions used in this work, Fig. A.1a showsthat the number frequency distribution of droplet diameter isstrongly skewed to the right, indicating that small-size dropletsare very numerous and that the large ones (dd P 62.5 lm for thecase illustrated) are very scarce. Nonetheless, the volume fre-quency distribution indicates that these larger size droplets con-tribute very importantly to the volume of water passing throughthe sampling volume. On the other hand, the droplet velocity tendsto be normally distributed as indicated in Fig. A.1b. Since, it is gen-erally agreed that the volume of water arriving to the hot surfaceplays a very important influence on heat transfer the diameterand velocity of the droplets were characterized by the droplet vol-ume mean diameter,
d3;0 ¼XN
i¼1
d3d;i=N
!1=3
ðA:1Þ
Fig. A.1. Measured: (a) drop size number and volume frequency distributions and(b) drop velocity number frequency distribution.
and the normal volume weighted mean velocity,
uz;v ¼XN
i¼1
uz;id3d;i
,XN
i¼1
d3d;i ðA:2Þ
where dd,i and uz,i are the diameter and normal velocity to the sur-face of drop i in a sample of N droplets.
The water impact density distribution was measured by localsampling of the flux of spray impinging upon a surface with an ar-ray of collection tubes with small openings. Details of the measur-ing techniques are given elsewhere [1].
References
[1] C.A. Hernández B., A.H. Castillejos E., F.A. Acosta G., X. Zhou, B.G. Thomas,Measurement of heat flux in dense air-mist cooling: Part II. The influence ofmist characteristics on steady-state heat transfer, Experimental Thermal andFluid Science (2012), http://dx.doi.org/10.1016/j.expthermflusci.2012.06.007.
[2] S. Deb, S-C. Yao, Analysis on film boiling heat transfer of impacting sprays,International Journal of Heat Mass Transfer 32 (11) (1989) 2099–2112.
[3] B. Abbasi, J. Kim, A. Marshall, Dynamic pressure based prediction of spraycooling heat transfer coefficients, International Journal of Multiphase Flow 36(8) (2010) 491–502.
[4] W.M. Rohsenow, H. Choi, Heat, Mass and Momentum Transfer, thirteenthprinting., Prentice-Hall, NJ, 1961. pp. 211–236.
[5] J.E. Camporredondo S, A.H. Castillejos E, F.A. Acosta G, E.P. Gutiérrez M, M.A.Herrera G, Analysis of thin slab casting by the compact-strip process: Part I.Heat transfer and solidification, Metallurgical and Materials Transactions B 35(3) (2004) 541–559.
[6] J. Sengupta, B.G. Thomas, M.A. Wells, The use of water cooling duringcontinuous casting of steel and aluminum alloys, Metallurgical and MaterialsTransactions B 36 (1) (2005) 187–204.
[7] D. Hall, I. Mudawar, R.E. Morgan, S.L. Ehlers, Validation of a systematicalapproach to modeling spray quenching of aluminum alloys extrusions,composites and continuous castings, in: Proceedings of the SecondInternational Conference on Quenching and the Control of Distortion,Cleveland, Ohio, 1996, pp. 473–487.
[8] G.E. Totten, C.E. Bates, Handbook of Quenchants and Quenching Technology,first printing., ASM Int., Ohio, 1993. pp. 238–287.
[9] M. Tanaka, Heat transfer of a spray droplet in a nuclear reactor containment,Nuclear Technology 47 (2) (1980) 268–281.
[10] H. Anglart, F. Alavyoon, R. Novarini, Study of spray cooling of a pressure vesselhead of a boiling water reactor, Nuclear Engineering and Design 240 (2) (2010)252–257.
[11] G.P. Celata, M. Cumo, A. Mariani, L. Saraceno, A comparison between spraycooling and film flow cooling during the rewetting of a hot surface, Heat MassTransfer 45 (7) (2009) 1029–1035.
[12] S. Martorano, Spray nozzles selections for water spray systems: Options andapplications explained, International Fire Protection 41 (2010) 30–33.
[13] G.P. Celata, M. Cumo, C. Lombardo, A. Mariani, L. Saraceno, Experimental resulton rewetting of hot surfaces by droplet impingement, Experimental Thermaland Fluid Science 29 (3) (2005) 275–285.
[14] T. Cader, L.J. Westra, R.C. Eden, Spray cooling thermal management forincreased device reliability, IEEE Transactions on Device and MaterialsReliability 4 (4) (2004) 605–613.
[15] M. Fabbri, S. Jiang, V.K. Dhir, A comparative study of cooling of high powerdensity electronics using spray and microjets, Transactions of the ASME 127(1) (2005) 38–48.
[16] B.M. Pikkula, J.H. Torres, J.W. Tunnell, B. Anvari, Cryogen spray cooling: effectsof droplet size and spray density on heat removal, Lasers in Surgery andMedicine 28 (2) (2001) 103–112.
[17] E. Karapetian, G. Aguilar, S. Kimel, E.J. Lavernia, J.S. Nelson, Effects of mass flowrate and droplet velocity on surface heat flux during cryogen spray cooling,Physics in Medicine and Biology 48 (1) (2003) N1–N6.
[18] K.M. Graham, S. Ramadhyani, Experimental and theoretical studies of mist jetimpingement cooling, Journal of Heat Transfer 118 (2) (1996) 343–349.
[19] F.K. McGinnis, J.P. Holman, Individual droplet heat transfer rates forsplattering on hot surfaces, International Journal of Heat and Mass Transfer12 (1) (1969) 95–108.
[20] K. Araki, S. Yoshinobu, Y. Nakatani, A. Moriyama, Stationary measurement forheat transfer coefficient in droplet-cooling of hot metal, Transactions ISIJ 22(12) (1982) 952–958.
[21] J.D. Bernardin, I. Mudawar, Film boiling heat transfer of droplet streams andsprays, International Journal of Heat and Mass Transfer 40 (11) (1997) 2579–2593.
[22] S. Toda, A study of mist cooling (1st Report: Investigation of mist cooling),Heat Transfer: Japanese Research 1 (3) (1972) 39–50.
[23] S. Ishigai, S. Nakanishi, T. Ochi, Boiling heat transfer for a plane water jetimpinging on a hot surface, in: Proceedings of the Sixth International HeatTransfer Conf., Hemisphere Pub. Corp., Toronto, Canada, 1978, pp. 445–450.
[24] W.M. Grissom, F.A. Wierum, Liquid spray cooling of a heated surface,International Journal of Heat and Mass Transfer 24 (2) (1981) 261–271.
160 C.A. Hernández-Bocanegra et al. / Experimental Thermal and Fluid Science 44 (2013) 147–160
[25] R. Jeschar, U. Reiners, R. Scholz, Heat transfer during water and water–airspray cooling in the secondary cooling zone of continuous casting plants, in:R.W. Stovall (Ed.), Proceedings of the Fifth International Iron and SteelCongress, Iron and Steel Society, Washington DC, 1986, pp. 511–521.
[26] I. Mudawar, W.S. Valentine, Determination of the local quench curve for spray-cooled metallic surfaces, Journal of Heat Treating 7 (2) (1989) 107–121.
[27] V. Heidt, R. Jeschar, Influence of running water on the heat transfer incontinuous casting, Steel Research 64 (3) (1993) 157–164.
[28] I. Stewart, J.D. Massingham, J.J. Hagers, Heat transfer coefficient effects onspray cooling, Iron and Steel Engineer 73 (7) (1996) 17–23.
[29] J.C. Fry, H.D. Morgan, W.D. Morris, J.O. Medwell, Design of steady state testapparatus to evaluate heat transfer coefficient of spray, Ironmaking andSteelmaking 24 (1) (1997) 47–52.
[30] J. Schmidt, H. Boye, Influence of velocity and size of the droplets on the heattransfer in spray cooling, Chemical Engineering Technology 24 (3) (2001) 255–260.
[31] W. Jia, H.-H. Qiu, Experimental investigation of droplet dynamics and heattransfer in spray cooling, Experimental Thermal and Fluid Science 27 (7)(2003) 829–838.
[32] B. Horacek, K.T. Kiger, J. Kim, Single nozzle spray cooling heat transfermechanisms, International Journal of Heat and Mass Transfer 48 (8) (2005)1425–1438.
[33] M.S. Jenkins, S.R. Story, R.H. David, Defining air-mist nozzle operatingconditions for optimum spray cooling performance, in: Editor name (Ed.),Proceedings of the Nineteenth Australasian Chemical Engineering Conference,Institute of Engineers, Newcastle, New South Wales, Australia, September 12–20, 1991, pp. 161–169.
[34] V. Olden, M. Raudensky, K. Onsrud, W. Hummel, Water spray cooling ofstainless and C–Mn steel, Steel Research 69 (6) (1998) 240–246.
[35] B. Patrick, B. Barber, Caster operation, design and maintenance to ensure highproduct quality, in: Proceedings of the ISSTech Conference, Iron and SteelSociety, Indianapolis, IN, 2003, pp. 975–985.
[36] E.A. Mizikar, Spray cooling investigation for continuous casting of billets andblooms, Iron and Steel Engineer 47 (6) (1970) 53–60.
[37] M. Ciofalo, I. Di Piazza, V. Brucato, Investigation of the cooling of hot walls byliquid water sprays, International Journal of Heat and Mass Transfer 42 (7)(1999) 1157–1175.
[38] M. Ciofalo, A. Caronia, M. Di Liberto, S. Puleo, The Nukiyama curve in waterspray cooling: its derivation from temperature-time histories and itsdependence on the quantities that characterize drop impact, InternationalJournal of Heat and Mass Transfer 50 (25–26) (2007) 4948–4966.
[39] H.M. Al-Ahmadi, S.C. Yao, Spray cooling of high temperature metals using highmass flux industrial nozzles, Experimental Heat Transfer 21 (1) (2008) 38–54.
[40] W.J.J. Vorster, S.A. Schwindt, J. Schupp, A.M. Korsunsky, Analysis of the sprayfield development on a vertical surface during water spray-quenching using aflat spray nozzle, Applied Thermal Engineering 29 (7) (2009) 1406–1416.
[41] A.H. Castillejos E., F.A. Acosta G., M.A. Herrera, I. Hernández C., E.P. GutiérrezM, Practical productivity gains – Towards a better understanding of air-mistcooling in thin slab continuous casting, in: R.I.L. Guthrie, (Ed.), Proceeding ofthe Third International Congress of Steelmaking, Association of Iron and SteelTechnology, Charlotte, NC, 2005, pp. 881–890.
[42] S. Nukiyama, Translation – the maximum and minimum values of heat Qtransmitted fron metal to boiling water under atmosphere pressure,International Journal of Heat and Mass Transfer 9 (12) (1966) 1419–1433.
[43] F.P. Incropera, D.P. De Witt, T.L. Bergman, A.S. Lavine, Fundamentals of Heat andMass Transfer, sixth ed., John Wiley & Sons, Hoboken, NJ, 2007. pp. 622–627.
[44] J.G. Collier, J.R. Thome, Convective Boiling and Condensation, third ed., OxfordUniversity Press, NY, 1994. pp. 148–150, 163.
[45] T.B. Drew, C. Mueller, Boiling, Transactions of the American Institute ofChemical Engineers 33 (1937) 449–473.
[46] R. Hohl, H. Auracher, J. Blum, W. Marquardt, Pool boiling heat transferexperiments with controlled wall temperature transients, in: Proceedings 2ndEuropean Thermal Science and 14th UIT Nat. Heat Transfer Conference,Edizioni ETS, Rome, 1996, pp. 1647–1652.
[47] D.W. Zhou, C.F. Ma, J. Yu, Boiling hysteresis in impinging circular submergedjets with highly wetting liquids, International Journal of Heat and Fluid Flow25 (1) (2004) 81–90.
[48] T.M. Wojcik, Experimental investigations of boiling heat transfer hysteresis onsintered, metal – fibrous, porous structures, Experimental Thermal and FluidScience 33 (3) (2009) 397–404.
[49] L.C. Witte, J.H. Lienhard, On the existence of two ‘transition’ boiling curves,International Journal of Heat and Mass Transfer 25 (6) (1982) 771–778.
[50] P.J. Berenson, Transition boiling heat transfer from a horizontal surface, MITHeat Transfer Lab. Tech. Report no. 17, 1960.
[51] A. Sakurai, M. Shiotsu, Temperature-controlled pool-boiling heat transfer, in:Proceedings Fifth International Heat Transfer Conference, 4, B3.1, Tokyo, 1974,pp. 81–85.
[52] I. Rajab, R.H.S. Winterton, The two transition boiling curves and solid-liquidcontact on a horizontal surface, International Journal of Heat and Fluid Flow 11(2) (1990) 149–153.
[53] A. Faghri, Y. Zhang, J. Howell, Advanced Heat and Mass Transfer, first ed.,Global Digital Press, Columbia, MO, 2010. pp. 705–707.
[54] A.H. Castillejos E., F.A. Acosta G., R. Santos P., E.P. Gutiérrez M., R. González dela P., Studies for the improvement of the secondary cooling system of CSP thinslab casters, in: G.A. Irons (Ed.), Proceedings of the McMaster Iron andSteelmaking Symposium, Thinner Slab Casting, McMaster University,Hamilton, Ontario, 2005, pp. 47–58.
[55] J.J. Montes R, A.H. Castillejos E, F.A. Acosta G, E.P. Gutiérrez M, M.A. Herrera G,Effect of the operating conditions of air-mists nozzles on the thermal evolutionof continuously cast thin slabs, Canadian Metallurgical Quarterly 47 (2) (2008)187–204.
[56] http://www.platinummetalsreview.com/jmpgm.[57] http://www.ndt-ed.org/EducationResources/CommunityCollege/Materials/
Physical_Chemical/Electrical.htm.[58] High Temperature Materials Handbook, vol. 5, Cotronics Corp., 2005, pp. 23.[59] J. Szekely, N.J. Themelis, Rate Phenomena in Process Metallurgy, John Wiley &
Sons Inc., N.Y., 1971. pp. 236–239.[60] E.J. Davies, Conduction and Induction Heating, The Institution of Engineering
and Technology, London, 2007. pp. 17–18.[61] E. Kolbe, W. Reiss, Eine Methode zur numerischen Bestimmung der
Stromdichteverteilung in induktiv erwärmten Körpern unterschiedlichergeometrischer Form, Mittailung aus dem Institut für Elektrowärme 9 (3)(1963) 311–317.
[62] C.A. Hernández B., Estudio de la Extracción de Calor con Nieblas de Agua BajoCondiciones de Estado Estacionario, Ph.D. Thesis, CINVESTAV–Unidad Saltillo,Coahuila, Mexico, August 9, 2012.
[63] S.J. Kline, F.A. McClintock, Describing uncertainties in single-sampleexperiments, Mechanical Engineering 75 (1953) 3–8.
[64] K.W. Bewig, W.A. Zisman, The wetting of gold and platinum by water, TheJournal of Physical Chemistry 69 (12) (1965) 4238–4242.
[65] M.L. White, The wetting of gold surfaces by water, Journal of PhysicalChemistry 68 (10) (1964) 3083–3085.