Embed Size (px)
Citation preview

Experimental work includes making judgment calls, such as using preliminary results to change the design of an experiment, determining whether equipment is measuring what you think it is measuring, evaluating whether data support a particular conclusion, and communicating results in a convincing manner.
For most introductory labs, these judgment calls are made for you ‘behind the scenes.’ However being able to make them is an important part of the ‘art of experimenting.’ This case study is intended to help you in developing this understanding via questions and discussion. Please note that some of the experiment variations presented are not necessarily the best possible options
The Art of Experimenting - A Case StudyJohn Zwart, Dept. of Physics and Astronomy, Dordt College, Sioux Center, IA

Introduction to the case study:
• Stumbled on cheap power meter ($32) and IR thermometer ($22) in a surplus catalog (Sciplus.com)
• Could they by used in an experiment, relating the power used by a light bulb to its temperature?
• Show the P = εσAT4 relation?

Initial questions:
• How can light bulb power be varied in a controlled manner?
• What kind of light bulb should be used?
• How should the equipment be arranged?
The next slide shows one possible set up.

Set-up:
Power meter to dimmer switch to 200W clear incandescent light bulb.Played with IR thermometer locations – horizontal 25 cm offset seemed best.Not shown – aluminum foil shroud on thermometer to keep electronics from
overheating.
Theory and Analysis:
The power law equation P = εσAT4 describes both the radiation away of power as well as absorption from surroundings. In the equation:
P = powerT = temperature in KelvinA = surface area of the objectσ = Stefan-Boltzmann constant = 5.67 x 10⁻⁸ W/m2K4
ε = emissivity and 0 < ε < 1
In the experiment, Pin = Pelectric + Pabsorbed = Pout
Pelec = εσAT4 – εσA(Troom)4 is the expected relationship.
Question: Hard to separate A and ε. Do we need to worry about this?

Initial results:
Curve represents a fit to the data of the form expected from theory.
Questions: Is it convincing that theory fits the data? Or that it doesn’t? Can we display the data and fit differently to clarify this?
280 304 328 352 376 40050
0
50
100
150
200Power used versus temperature for a bulb filament
T (K)
Pow
er (
W)
yi
125 1010 zi 4 122( )
zi

Plotting measured power vs T4 should yield a straight line with a negative intercept. [Pelec = εσAT4 – εσA(Troom)4 ]
Good enough?What about the curvature? Is there a valid reason for dropping data?Are there experimental design and/or implementation problems?What might they be?

Some Possible Problems:-non-linear power consumption by dimmer switch-temperature dependent convection-system not in equilibrium when measuring temperatureHow can these problems be tested?
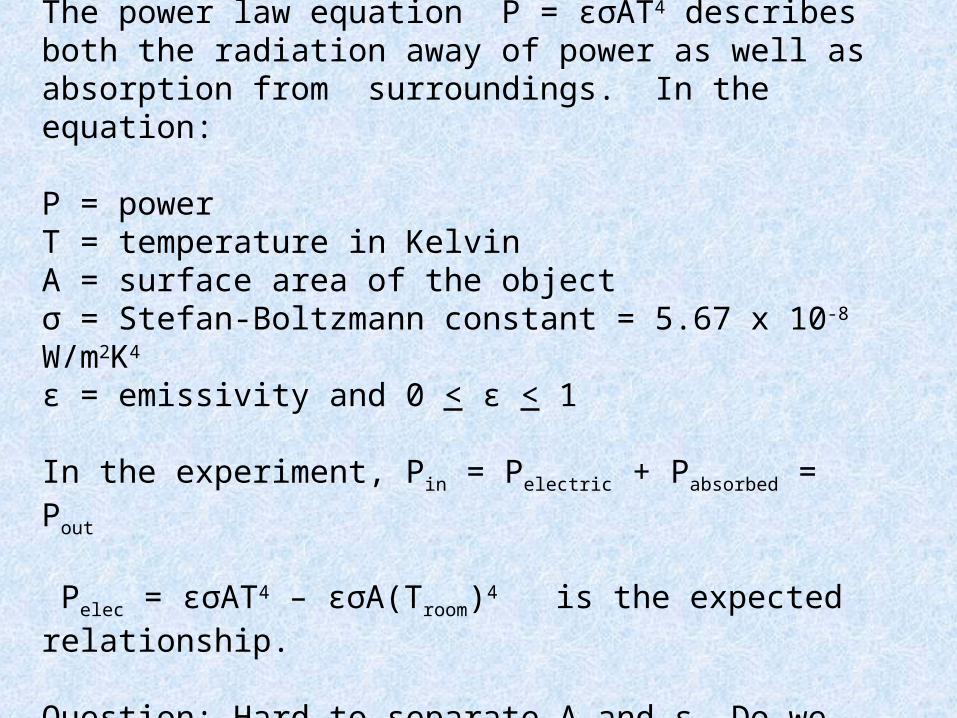
Check the power by measuring bulb current and voltage as well as power into dimmer + bulb combination.

Results:
Power into bulb is determined by product of current and voltage.Use above curve to correct the original measured power data.

Original plot

Corrected Plot – Original Data and Corrected Data
Now what is the problem? Am I measuring what I think I am?
Solid boxes are ‘corrected’ data points. Open boxes are the initial results.

Checked into operation of dimmer switches – they work by clipping part of the 60 Hz sine wave See: home.howstuffworks.com/dimmer-switch2.htm for a discussion.
The DMMs used to get I, V data expected 60 Hz sinusoids, so displayed values when clipping occurs are erroneous – need to use true rms meters.
True rms meters show dimmer used negligible power.Back to original plot.

Other problems?-temperature dependent convection?-system not in equilibrium when measuring temperature?
How can these problems be addressed?

Experiment modifications
Use 150W flood lamp to limit convection
Check time to get to equilibrium by measuring Temp vs time.
Note: foil shroud shown on IR thermometer here has been used throughout all variations of the experiment.
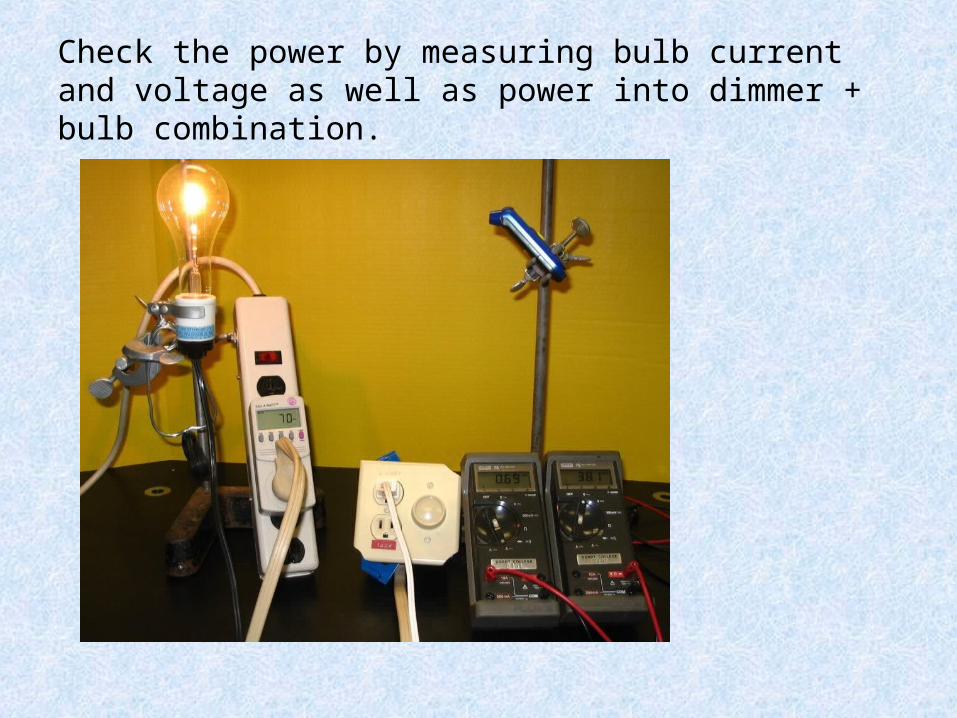
With dimmer set to provide maximum power to the bulb, measure temperature as a function of time. Results below.
How long should we wait between data points?

Are we done yet? What else can we check?
Waiting 30 minutes to measure temperature after changing the power yields:
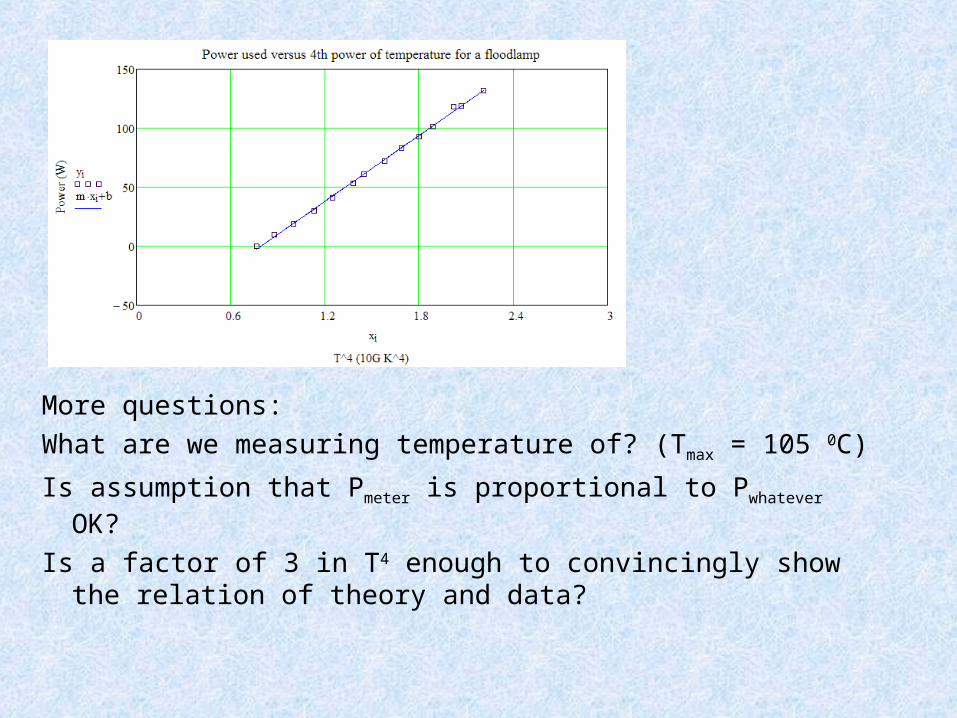
More questions:
What are we measuring temperature of? (Tmax = 105 0C)
Is assumption that Pmeter is proportional to Pwhatever OK?
Is a factor of 3 in T4 enough to convincingly show the relation of theory and data?
A couple of checks:
Mercury thermometer against glass of bulb yields temp close to that of the IR thermometer.
Since Pnet = εσAT4 – εσA(Troom)4
|intercept/slope| should equal (Troom)4
Values from least-squares fit yields Troom = 25 0C which is within uncertainty of the 22 0C measured directly.
But if we find εA by dividing the slope by σ we get 0.21 m2 and 0 < ε < 1, so what does this (larger than a light bulb) area mean? Is it an ‘effective area’ viewed by the IR thermometer? What does that mean?

When is the experiment over????
Thanks to colleagues:
Doug De Boer for dimmer switch and true rms discussions.
Carl Fictorie for photo editing and Powerpoint advice.