Embed Size (px)
Citation preview
Experimenting With High Dimensional VectorRepresentations of Instagram Users
Sumit MinochaStanford University
David MoralesStanford University
1 Introduction
In today’s digital age, hours of time are spent on social media platforms liking, posting, and com-menting. We want to ask the questions of how can we best represent a user profile of interests usingthis information. Imagining that user behavior in a social setting can be very reflective of real lifepersonality, finding such a representation for users could easily translate to commercial applicationslike user or product recommendations, content filtering, or targeted advertising. We hope that ourwork can help quantify and interpret a person from their online presence, empowering brands andindividuals alike to use these insights to their advantage, and embrace an era of curated content andhyper-personalization.
Our overall research objective is to generate, high dimensional embeddings for individuals that arereflective of their interests, connections, and online content. Using a comprehensive Instragramdataset, the input to our model’s initial node2vec, LDA, and CNN (ResNet) subcomponents will beimage and text data for each user. We then pipe embeddings outputs derived from these pieces into apooling autoencoder, and finally interpret and assess the quality of the resulting user vectors producedby applying an array of additional graphical analysis techniques that measure network structure.
2 Related Work
As our embeddings are trying to capture a diverse range of data types including text and images,our model implementation involves outputs from unsupervised node2vec [9], LDA [3], and CNN(ResNet) [10] subcomponents, all combined by an additional unsupervised pooling autoencoderarchitecture [14]. While we consider the novelty of our model to be the combination of these varioustechniques, there is plenty of work pushing the state of the art for each individual subcomponent.
Looking at the characterization of text through topic extraction with LDA, we note that Canini etal. [5] observe that most topic extraction algorithms are designed to be run over an entire documentcollection. We, like both teams previously mentioned, try to capitalize on the feature extraction,hypothesis generation, and statistical modeling prowess that comes with an LDA approach.
Regarding the CNN component, our use of a ResNet-50 goes against the general trend we are seeingof deeper neural networks increasing performance. The intuition for this choice is well articulatedby Wu et al. [15], where it is expressed that deep residual networks may not in fact be operatingas a single deep network, but rather as an ensemble of many shallow networks. Their “unravelled”view of deep residual networks additionally helps them provide a compelling interpretation of theirmodel’s state-of-the-art performance on datasets including PASCAL VOC, PASCAL Context, andCityscapes.
Development in the world of autoencoders has similarly been fruitful, with variations that span sparse,denoising, stacked denoising, as well as deep autoencoders. Some of these are touched on in Bengioet al.’s [2] survey of recent work and deep dive into various interpretations inspired by the areas ofprobabilistic models, auto-encoders, manifold learning, and deep networks. Additionally, related to
32nd Conference on Neural Information Processing Systems (NIPS 2018), Montréal, Canada.
a very interesting idea for potential future, this paper [12] proposes a new algorithm derived fromk-means, for clustering high-dimensional data that exists in sparse subspaces rather than the entirespace.
3 Data
We start with an Instagram dataset of 16, 524 posts from 972 top Instagram influencers (the 17 mostrecent posts per user) [1] [7] (as listed by the Iconosquare Index of Influencers [11]). Each recordrepresents a post and includes the original poster’s user handle, the post’s corresponding caption, tagsused in that caption, mentions, the post’s url (associated image), as well as other related features suchas the date of the post and number of likes the post has. For our purposes we only use the captions,tags, and post url attributes of each record.
3.1 Pre-processing
Along the lines of our original research objective, encoding more types of data into the embeddingswould allow us to achieve a more all encompassing and powerful user vector. Given that the caption,tag, and mention metadata were limited to text, we chose to augment our dataset by scraping theimage from every post url, which afforded us decision making flexibility later on in the poolingautoencoder step of our architecture (see section 4).
The downstream embeddings learning components of our model (section 4) require data to be ingestedon a per-user basis. Therefore, we first group all records in the original dataset by username or handle,such that records correspond to users and contain lists of all the hashtags, mentions, images, andcaptions that they used.
Furthermore, not all users’ posts were in English and sometimes contained unrecognizable characterslike emojis. We remove all emojis and consider translating non-English captions to English, butultimately remove these records, leaving us with 655 users. We additionally filtered out mentionsand hashtags given that those details were better compartmentalized in their own features, so theycould be used as the basis for creating the linkage graphs in our baseline (section 4.1) and evaluation(section 5) tasks. Lastly we resize all images to be of size 224 x 224 pixels.
4 Methods
4.1 Node2Vec Embeddings
Treating users as words are treated in word2vec [13], we seek to describe users by other users thatthey share some relationship with (i.e. a user can be represented by its neighborhood). Ideally wewould construct links between users based on whether they mutually follow each other, howeveras that data was not available we opted instead for a compatibility heuristic involving overlappinguse of hashtgas, which solved our sparsity problem that resulted from a graph derived from mentionmetadata. Specifically, we construct an undirected graph by linking two user nodes if they share atleast one tag in their posts. Then we project this undirected network into an embedding space bypiping this through the node2vec algorithm [9]. These node2vec embeddings have a dimensionalityof 64 and serve as our baseline embeddings, since they capture both user-to-user information andaspects about interest, where similarities in these aspects are assumed if 2 users use similar hashtags.
4.2 LDA Topic Embeddings
We make use of an LDA subcomponent to extract embeddings from the captions, which can be veryindicative of the user’s feelings, humor, and general personality. What we want is to make use ofexisting and distinguishable content across users and then project a user onto the distribution of thiscontent, allowing a constructed embedding to contain information of relativity between users. Todo this, we first perform topic analysis on a corpus of all users’ captions, and then project a user’scaptions onto these topics to retrieve the embedding over the user’s linguistic expression of interestsand personality relative to all other users.
We use LDA for corpus topic extraction, which learns a mixture of topics that best represent thedocuments, or sets of captions in our case [3]. This is done by learning the topics that maximize the
2
likelihood of the captions being generated from the distribution of terms that represent each topic.Unlike a mixture model, however, LDA allows for mixed membership, as each topic is comprisedof a several latent variables and a caption term that can belong to multiple mixtures. The capacityto describe a set of captions with multiple topics provides us with the very flexibility in interestrepresentation that is present in user posts. On top of this, these topics are constructed from theentire corpus of captions, and their distributions reflect the interest distributions of the users, allowingcertain intangible traits of the population as a whole to leak into the constructed user embeddings.
We train the LDA model to extract 50 topics from the corpus. Once trained the LDA layer generatesthe embeddings for users by inferring how well their captions fit each topic set. The scores measuringfit for each topic are used as the embeddings, giving a vector with a dimensionality of 50 that capturesa user’s linguistically-expressed interests.
4.3 CNN Visual Embeddings
As they say, “images are worth a 1000 words,” and in our case, we are hoping the CNN subcomponentof our architecture will extract this context. A user might post images about architecture, fashion,or scenery, this component serves to incorporate that information (dominating aesthetics and colors,textures and patterns, as well as other intangible or latent patterns) into the user embedding. To dothis we make use of the featurizing layers of a CNN.
We use a ResNet-50 CNN model [10], pre-trained on Imagenet [6]. Specifically, we remove the last,classification layer of the model and only use the layer of captured image features. To construct thefinal embedding for a user, we process each of the user’s post images through the model to extract thevisual features of the photos. The 2048-dimensional feature vectors produced from the images arethen averaged to construct a single vector that represents the user embedding.
4.4 Multi-modal Pooled Embeddings
From the above methods, we produce several embeddings for a user, each of which is based ondifferent aspects of a user’s personality and how it is expressed. To derive a more holistic userrepresentation that we will eventually evaluate, we concatenate these embeddings and send the resultthrough a final pooling autoencoder layer. This autoencoder layer mixes and pools all of a user’sdiverse attributes captured, reinforces those that are most meaningful, and reduces the dimensionalityof the representation from 2162 to 512 in the process.
The inputs to the autoencoder are the concatenated embeddings. We use a standard autoencoderarchitecture (trained to minimize the reconstruction error between the original input and the recon-structed output, where the bottleneck layer of the model serves as our embedding) with a contractiveconstraint modification to the loss function [14]. By penalizing large gradients with respect to theinputs in the first hidden layer, the contractive autoencoder encourages the encoded layer to be similarfor similar inputs. In doing so we ensure that similar users have similar vectors in the final embeddingspace. After training this model to overfit to the users, and to capture a sound reconstruction of theraw concatenated, user embeddings, we simply take the encoding activations for each user and arriveat our final, pooled embeddings of size 512.
5 Results and Analysis
5.1 Qualitative
One approach we use to qualitatively evaluate our user embeddings is sampling a random user(@sejkko), finding the nearest user in each embedding space (node2vec, LDA, CNN, poolingautoencoder) using cosine similarity, and inspecting the relevant aspects of both users’ posts to ensurethat the aspects being captured by the embedding space are similar. We compare @sejkko to hisclosest neighbors in each space below:
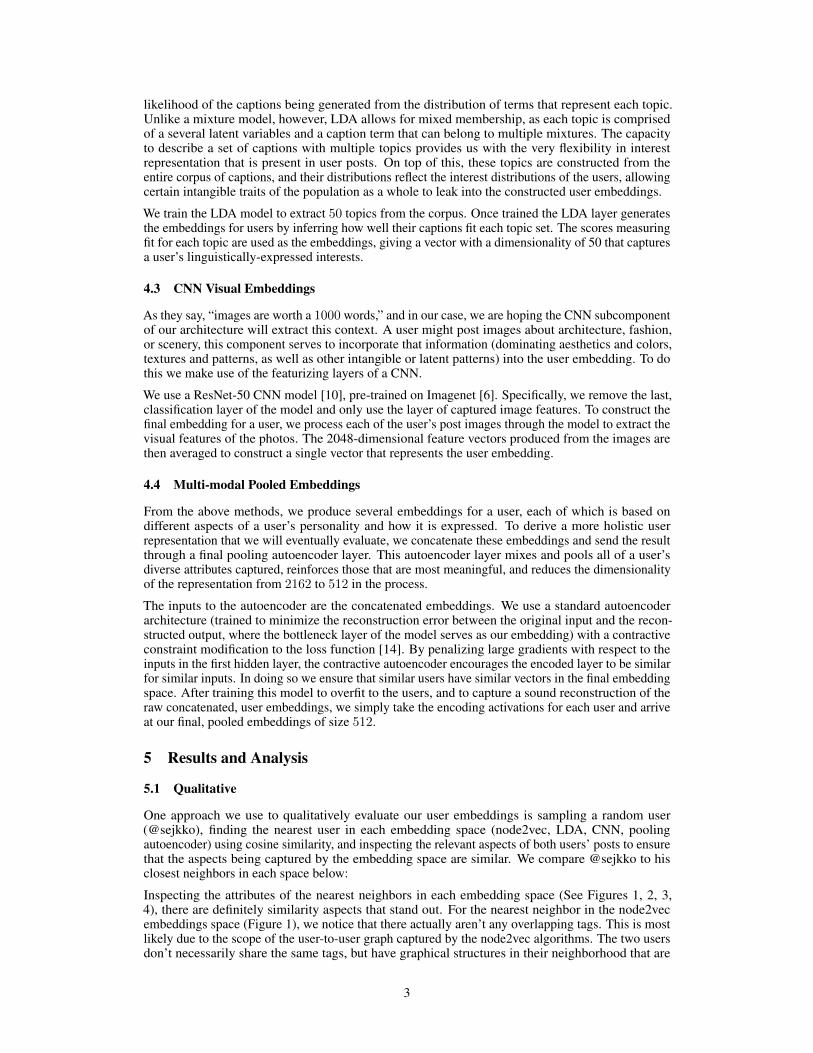
Inspecting the attributes of the nearest neighbors in each embedding space (See Figures 1, 2, 3,4), there are definitely similarity aspects that stand out. For the nearest neighbor in the node2vecembeddings space (Figure 1), we notice that there actually aren’t any overlapping tags. This is mostlikely due to the scope of the user-to-user graph captured by the node2vec algorithms. The two usersdon’t necessarily share the same tags, but have graphical structures in their neighborhood that are
3
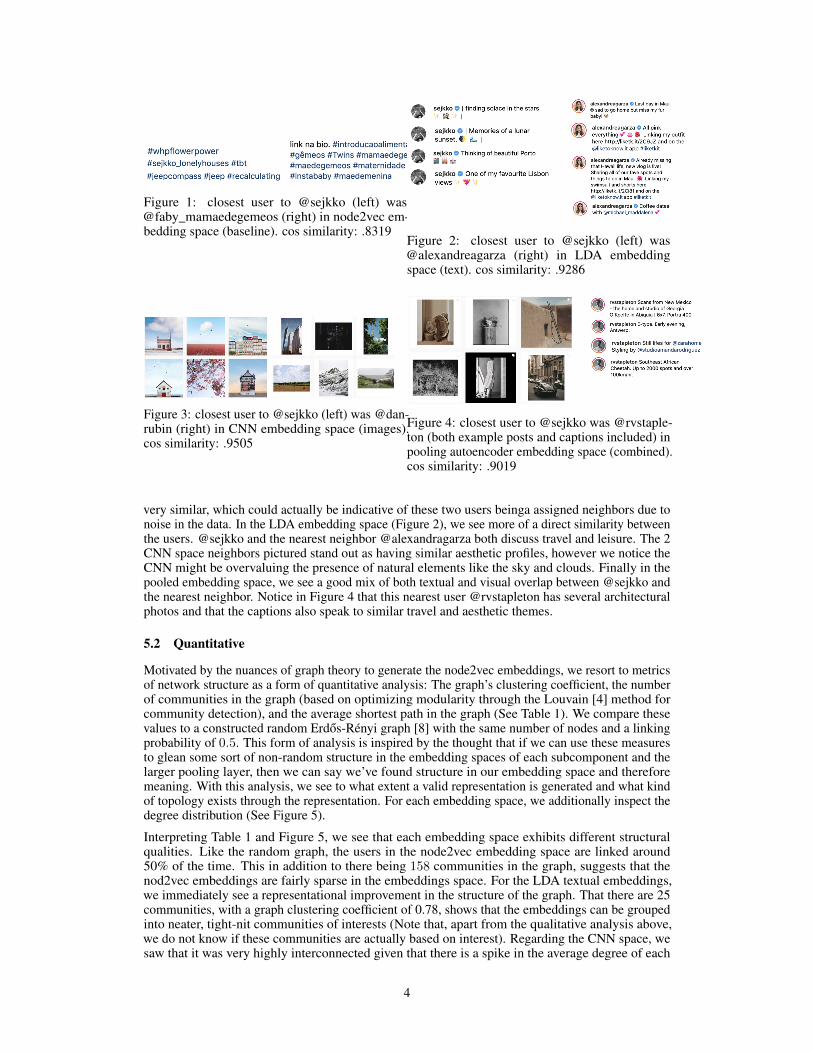
Figure 1: closest user to @sejkko (left) was@faby_mamaedegemeos (right) in node2vec em-bedding space (baseline). cos similarity: .8319
Figure 2: closest user to @sejkko (left) was@alexandreagarza (right) in LDA embeddingspace (text). cos similarity: .9286
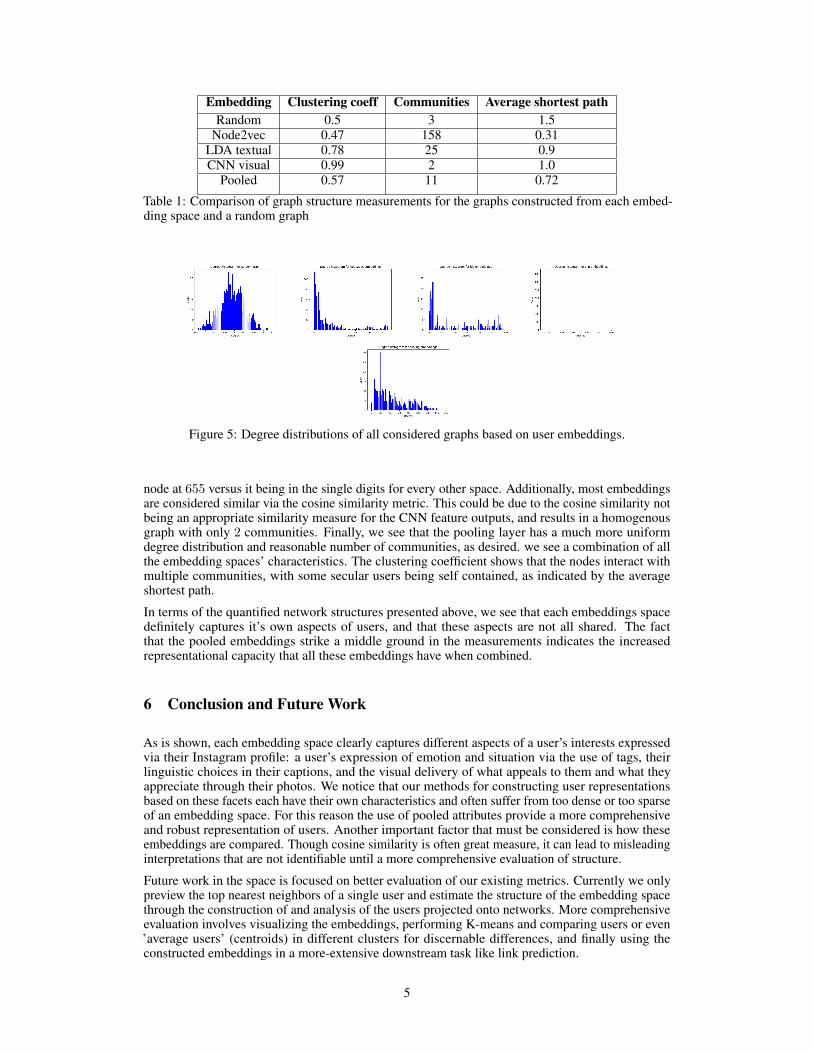
Figure 3: closest user to @sejkko (left) was @dan-rubin (right) in CNN embedding space (images).cos similarity: .9505
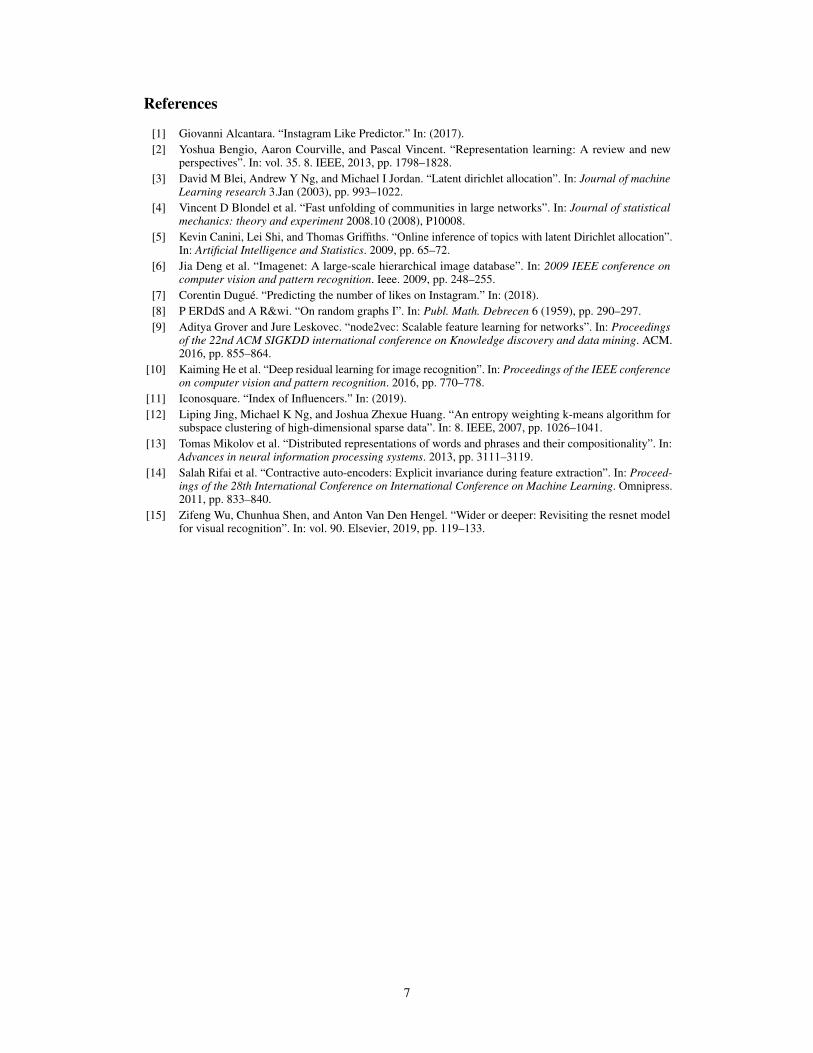
Figure 4: closest user to @sejkko was @rvstaple-ton (both example posts and captions included) inpooling autoencoder embedding space (combined).cos similarity: .9019
very similar, which could actually be indicative of these two users beinga assigned neighbors due tonoise in the data. In the LDA embedding space (Figure 2), we see more of a direct similarity betweenthe users. @sejkko and the nearest neighbor @alexandragarza both discuss travel and leisure. The 2CNN space neighbors pictured stand out as having similar aesthetic profiles, however we notice theCNN might be overvaluing the presence of natural elements like the sky and clouds. Finally in thepooled embedding space, we see a good mix of both textual and visual overlap between @sejkko andthe nearest neighbor. Notice in Figure 4 that this nearest user @rvstapleton has several architecturalphotos and that the captions also speak to similar travel and aesthetic themes.
5.2 Quantitative
Motivated by the nuances of graph theory to generate the node2vec embeddings, we resort to metricsof network structure as a form of quantitative analysis: The graph’s clustering coefficient, the numberof communities in the graph (based on optimizing modularity through the Louvain [4] method forcommunity detection), and the average shortest path in the graph (See Table 1). We compare thesevalues to a constructed random Erdos-Rényi graph [8] with the same number of nodes and a linkingprobability of 0.5. This form of analysis is inspired by the thought that if we can use these measuresto glean some sort of non-random structure in the embedding spaces of each subcomponent and thelarger pooling layer, then we can say we’ve found structure in our embedding space and thereforemeaning. With this analysis, we see to what extent a valid representation is generated and what kindof topology exists through the representation. For each embedding space, we additionally inspect thedegree distribution (See Figure 5).
Interpreting Table 1 and Figure 5, we see that each embedding space exhibits different structuralqualities. Like the random graph, the users in the node2vec embedding space are linked around50% of the time. This in addition to there being 158 communities in the graph, suggests that thenod2vec embeddings are fairly sparse in the embeddings space. For the LDA textual embeddings,we immediately see a representational improvement in the structure of the graph. That there are 25communities, with a graph clustering coefficient of 0.78, shows that the embeddings can be groupedinto neater, tight-nit communities of interests (Note that, apart from the qualitative analysis above,we do not know if these communities are actually based on interest). Regarding the CNN space, wesaw that it was very highly interconnected given that there is a spike in the average degree of each
4
Embedding Clustering coeff Communities Average shortest pathRandom 0.5 3 1.5
Node2vec 0.47 158 0.31LDA textual 0.78 25 0.9CNN visual 0.99 2 1.0
Pooled 0.57 11 0.72
Table 1: Comparison of graph structure measurements for the graphs constructed from each embed-ding space and a random graph
Figure 5: Degree distributions of all considered graphs based on user embeddings.
node at 655 versus it being in the single digits for every other space. Additionally, most embeddingsare considered similar via the cosine similarity metric. This could be due to the cosine similarity notbeing an appropriate similarity measure for the CNN feature outputs, and results in a homogenousgraph with only 2 communities. Finally, we see that the pooling layer has a much more uniformdegree distribution and reasonable number of communities, as desired. we see a combination of allthe embedding spaces’ characteristics. The clustering coefficient shows that the nodes interact withmultiple communities, with some secular users being self contained, as indicated by the averageshortest path.
In terms of the quantified network structures presented above, we see that each embeddings spacedefinitely captures it’s own aspects of users, and that these aspects are not all shared. The factthat the pooled embeddings strike a middle ground in the measurements indicates the increasedrepresentational capacity that all these embeddings have when combined.
6 Conclusion and Future Work
As is shown, each embedding space clearly captures different aspects of a user’s interests expressedvia their Instagram profile: a user’s expression of emotion and situation via the use of tags, theirlinguistic choices in their captions, and the visual delivery of what appeals to them and what theyappreciate through their photos. We notice that our methods for constructing user representationsbased on these facets each have their own characteristics and often suffer from too dense or too sparseof an embedding space. For this reason the use of pooled attributes provide a more comprehensiveand robust representation of users. Another important factor that must be considered is how theseembeddings are compared. Though cosine similarity is often great measure, it can lead to misleadinginterpretations that are not identifiable until a more comprehensive evaluation of structure.
Future work in the space is focused on better evaluation of our existing metrics. Currently we onlypreview the top nearest neighbors of a single user and estimate the structure of the embedding spacethrough the construction of and analysis of the users projected onto networks. More comprehensiveevaluation involves visualizing the embeddings, performing K-means and comparing users or even’average users’ (centroids) in different clusters for discernable differences, and finally using theconstructed embeddings in a more-extensive downstream task like link prediction.
5

7 Contributions
David: Implemented the various models used to construct the embeddings evaluated, as well asthe analaysis utilities used to construct the networks used to quatitatively evaluate the embeddings.Contributed equally to the writeups.
Sumit: Implemented the image scraper used to donwloaded the images from Instragram, as wellas the preprocessing scripts that processed all the attributes specifically for each of the differentembedders. Contributed equally to the writeups.
6
References
[1] Giovanni Alcantara. “Instagram Like Predictor.” In: (2017).[2] Yoshua Bengio, Aaron Courville, and Pascal Vincent. “Representation learning: A review and new
perspectives”. In: vol. 35. 8. IEEE, 2013, pp. 1798–1828.[3] David M Blei, Andrew Y Ng, and Michael I Jordan. “Latent dirichlet allocation”. In: Journal of machine
Learning research 3.Jan (2003), pp. 993–1022.[4] Vincent D Blondel et al. “Fast unfolding of communities in large networks”. In: Journal of statistical
mechanics: theory and experiment 2008.10 (2008), P10008.[5] Kevin Canini, Lei Shi, and Thomas Griffiths. “Online inference of topics with latent Dirichlet allocation”.
In: Artificial Intelligence and Statistics. 2009, pp. 65–72.[6] Jia Deng et al. “Imagenet: A large-scale hierarchical image database”. In: 2009 IEEE conference on
computer vision and pattern recognition. Ieee. 2009, pp. 248–255.[7] Corentin Dugué. “Predicting the number of likes on Instagram.” In: (2018).[8] P ERDdS and A R&wi. “On random graphs I”. In: Publ. Math. Debrecen 6 (1959), pp. 290–297.[9] Aditya Grover and Jure Leskovec. “node2vec: Scalable feature learning for networks”. In: Proceedings
of the 22nd ACM SIGKDD international conference on Knowledge discovery and data mining. ACM.2016, pp. 855–864.
[10] Kaiming He et al. “Deep residual learning for image recognition”. In: Proceedings of the IEEE conferenceon computer vision and pattern recognition. 2016, pp. 770–778.
[11] Iconosquare. “Index of Influencers.” In: (2019).[12] Liping Jing, Michael K Ng, and Joshua Zhexue Huang. “An entropy weighting k-means algorithm for
subspace clustering of high-dimensional sparse data”. In: 8. IEEE, 2007, pp. 1026–1041.[13] Tomas Mikolov et al. “Distributed representations of words and phrases and their compositionality”. In:
Advances in neural information processing systems. 2013, pp. 3111–3119.[14] Salah Rifai et al. “Contractive auto-encoders: Explicit invariance during feature extraction”. In: Proceed-
ings of the 28th International Conference on International Conference on Machine Learning. Omnipress.2011, pp. 833–840.
[15] Zifeng Wu, Chunhua Shen, and Anton Van Den Hengel. “Wider or deeper: Revisiting the resnet modelfor visual recognition”. In: vol. 90. Elsevier, 2019, pp. 119–133.
7