Embed Size (px)
Citation preview

HAL Id: halshs-00139070https://halshs.archives-ouvertes.fr/halshs-00139070
Submitted on 7 Mar 2008
HAL is a multi-disciplinary open accessarchive for the deposit and dissemination of sci-entific research documents, whether they are pub-lished or not. The documents may come fromteaching and research institutions in France orabroad, or from public or private research centers.
L’archive ouverte pluridisciplinaire HAL, estdestinée au dépôt et à la diffusion de documentsscientifiques de niveau recherche, publiés ou non,émanant des établissements d’enseignement et derecherche français ou étrangers, des laboratoirespublics ou privés.
Experiments on Authorship Attribution by IntertextualDistance in English
Dominique Labbé
To cite this version:Dominique Labbé. Experiments on Authorship Attribution by Intertextual Distance in English.Journal of Quantitative Linguistics, Taylor & Francis (Routledge), 2007, 14 (1), pp.33-80. <halshs-00139070>

Dominique Labbé ([email protected]) CERAT-IEP BP 48 F 38040 Grenoble Cedex 9
Experiments on Authorship Attribution by Intertextual Distance in English
Draft of the paper published in :
Journal of Quantitative Linguistics, 2007, Volume 14, Number 1, pp. 33-80.
Résumé
A quelles conditions peut-on affirmer que des textes sont "proches" ou
"éloignés" les uns des autres ? Est-ce que des textes d'un même auteur sont plus
similaires entre eux que ceux d'auteurs différents ? La réponse à ces questions
est donnée par le calcul de la distance intertextuelle combinée à diverses
méthodes de classification. Un test en aveugle et quelques expériences
complémentaires montrent que cette méthode offre un outil intéressant pour
résoudre les problèmes d'attribution d'auteur par des voies non-traditionnelles.
Abstract
How can it be said that texts are "near" or "distant" from one another? Are
different texts by a single author more similar than texts by different authors? To
answer these questions, a method is proposed by combination of the calculus of
intertextual distance with automatic clustering and tree-classification. A blind
test and some additional experiments show that this method offers an interesting
tool for non-traditional authorship attribution.

2
Experiments on Authorship Attribution by Intertextual Distance in English
How can it be said that texts are "near to" or "distant from" one another? Are different texts
by a single author more similar than texts by different authors? These are two of the basic
questions of authorship (On this question, see: Love, 2002 and for a discussion: Rudman,
1998). Rather than using a set of "frequent words" (Holmes, 1995, Burrows, 2002 & 2003) or
"collocations" (Hoover, 2001) or "function words" (Eliott & Valenza, 2001), more or less
arbitrarily selected, it would be better to make use of the entire vocabulary of the texts in
order to measure proximity. Following this simple idea, a method is proposed to establish
authorship by calculating "intertextual distance" (Labbé & Labbé, 2001, 2003).
An index of intertextual distance measures the influence of four factors familiar to literary
critics: subject (content, themes), genre, epoch (chronology) and author. A great number of
experiments with French texts led to the conclusion that, when looking at texts written during
the same period, in the same genre, the predominant factor is nearly always authorship (this
tendency seems to be verified also on some English texts: Merriam, 2003b). Thus, this
calculation offers an interesting tool for non-traditional authorship attribution.
Tom Merriam applied this method to Marlowe, Shakespeare and Middleton (Merriam,
2002b and 2003a) and some contemporaneous texts (Merriam, 2003b). The results proved
encouraging. Thus a question was asked: "Could this technique be extended in English to
other authors in the same way that it has been done in French?" Two different experiments
gave a first answer to this question.
I. A BLIND-TEST
At the end of January 2004, a blind-test was begun on a corpus of 52 texts — each of
10,000 tokens in length, drawn from English novels — without any indication of the authors’
identities or titles of the works (in the following this corpus is named "Oxquarry1"). Texts
were supplied by Gerard Ledger who was himself concerned by this question (Ledger, 1995).
He chose samples from more or less contemporaneous novels, the authorship of which he
thought was difficult to establish by means of their vocabularies. The samples were based on

3
texts downloaded from the Gutenberg Project. All texts were checked for errors and edited so
as to be easily machine readable. However they were not checked against the original works,
and only obvious errors were removed or corrected (nevertheless it may be assumed that they
are accurate, in that the Gutenberg Project texts are mostly of a high standard). Each excerpt
was coded with an alpha-numeric tag in the series 1A-1Z followed by 2A-2Z, giving 52
excerpts. In this article these codes are used throughout, but Appendix 1 discloses authors,
titles and chapters of the novels from which these excerpts were drawn. This information was
supplied by Dr. Ledger after the following text was sent to him (actual authors and titles are
added in order to facilitate the reading of some of the tables and charts).
The question asked was not: "Who wrote what?" but, more modestly: "Is it possible to
know which texts are written by the same author and which ones are from different hands?"
To answer this question, a three-step method was used. First, the indices, measuring the
distances separating the vocabulary of each pair of texts, were calculated. Secondly, a direct
examination of these indices brought out the values which indicate identity of authorship.
Thirdly, this separation was complemented by further classifications.
Preliminary remark .
All samples were processed with software written by C. & D. Labbé. The first stage had
been designed in parallel with the well-known Oxford Concordance Program (Hockey and
Martin, 1988): it lists the words used in the text and calculates their frequencies (the two
programs give exactly the same results). Then it calculates the inter-textual distances.
1.1. Calculation of inter-textual distance
Given two texts A and B.
— Na and Nb sizes of A and B in tokens;
— Fia and Fib the absolute frequencies of type i in texts A and B.
If their lengths (in tokens) are equal — as in this experiment — the distance index can be
directly performed by subtracting the two frequencies of each type and by summing the
results :
D( A, B) = Fia
i ∈(A,B)
∑ − Fib with Na = Nb

4
and the relative distance index is equal to:
(1) Drel( A, B) =
Fia
i ∈(A,B)∑ − Fib
2Na
D(A,B) gives the exact number of different words which separates the two texts. Relative
distance index is expressed by a figure between 0 and 1. It could also be defined as "the
number of different tokens in an excerpt of 10,000 tokens" and expressed with integers.
This sum is an Euclidian "distance" which gives a quantitative answer to our opening
question. Properties of Euclidian distances — identity, symmetry, triangle inequality — allow
many useful operations to be performed, especially unbiased classifications (for the properties
of textual distance index, see Labbé & Labbé, 2001; Labbé & Labbé, 2003 and below).
It should be noted that this index is given without estimate of uncertainty or error (of
course, the spellings of words must have been checked).
The Corpus "Oxquarry1" is 520,000 tokens long. It is sufficient for a first experiment, even
if it is not enough to give a full answer to all the questions about authorship attribution.
Formula (1) was applied to this corpus. The calculation of all indices leads to a matrix of 52
lines * 52 columns, too large to be printed here. It contains 1,326 different indices (given the
identity property, the diagonal matrix is null and given the symmetry property the upper half
of the matrix is equal to the lower one).
A direct examination of this matrix gives an initial answer to the authorship question.
1.2. Direct analysis of distance matrix
G. Ledger supplied merely three pieces of information about the corpus Oxquarry1: 1)
there were several authors; 2) there was a minimum of two excerpts by each author though
not necessarily drawn from the same book; 3) all these texts belonged approximately to the
same genre and the same period of time.
Thus if our preliminary assumption — giving authorship a predominant weight as opposed
to content — is right, a simple prediction can be made: compared to a random distribution, the
distance indices between pairs of excerpts by the same author should fall at the bottom of the
distribution, and the highest part of this distribution should contain only pairs of texts by
different authors.

5
The mean of all indices is .4067 and the standard deviation (σ) is equal to .0377. With an
uncertainty margin of 5%, we can use two "milestones" (i.e. points on a continuum) to mark
out significant values (± 1.96σ around the mean):
— lower limit (under which the authorship of the two excerpts is probably the same):
.4067 - (1.96*.0377) = .3328 (rounded to .333).
— upper limit (above which the authorship of the two texts is probably different):
.4067 + (1.96*.0377) = .4806 (rounded to .481).
a. Same authorship (indices under .333)
70 pairs of texts are under the lower margin (see appendix 2.1). For example, the first four
lines of this table indicate that the distance between the nearest couples of texts are:
1D - 2W: .259
1N - 2E: .265
1F - 2E: .267
1K - 2W: .277
Given the transitiveness of the inter-textual distance index, it can be said that since:
— texts 1D and 2W are supposed by the same author;
— texts 1K and 2W are also supposed by the same hand;
these two relations imply that the texts 1D and 1K may also be supposed by this same
author…
In the same way, it can be said that since pairs of texts 1N-2E and 1F-2E are probably by
the same author, similarly texts 1N and 1F may also be supposed by their same author, etc. (in
fact, Appendix 1 shows that these excerpts are all by Stevenson).
These relations lead to 12 sets of texts of whose identical authorship is highly probable:
this result is arrived at with greater than 95% certainty (Table 1).

6
Table 1. 12 text sets probably of same authorship
1 1D , 2W, 1K, 2R, 1N, 2E, 1F Stevenson
2 1S, 2M, 2I, 1C Morris
3 1E, 1Q, 1B, 2A Butler
4 2L, 2T, 2J, 2X, 1L, 2D, 1X, 2F Hardy
5 1H, 2Z, 2S Hardy
6 2O, 2P, 2V Forster
7 1Z, 2C, 1Y Tressel
8 1P, 2U, 1R Chesterton
9 2H, 1G, 1O Conrad
10 2N, 2Q, 2K Conrad
11 1M, 2Y, 1W, 2G Orczy
12 1J, 2B Morris
At the end of this first step, five texts remain un-classified: 1A, 1I, 1T, 1U, 1V1. It must be
remembered that the goal was not so much to give a full answer as to avoid a false one.
b. Different authorship (indices above .481)
26 distance indices are above this upper margin (appendix 2.4). These pairs of texts are
most probably not by the same author. For example: authorships of 1T and 1Z are different as
those of 1T and 2R. Given the fact that:
— 1Z belongs to Set 7, therefore 1T cannot belong to this set 7;
— 2R belongs to Set 1, therefore 1T cannot belong to set 1;
For example, all these mutual exclusions lead to the following conclusions (about the five
texts which remained un-classified after examination of the lower limit):
— 1T can only belong to sets 4, 5, 8, 9, 10, 11;
— 1V cannot belong to sets 1 and 12;
— the author of set 10 is different from the authors of sets 1, 2 and 12;
It is worth noting that these negative conclusions are important because, in some cases, it is
as valuable to be able to exclude a supposed authorship as to establish an unknown one. Of
course, all these deductions are possible, taking into account the information given concerning
the corpus (same genre, several authors and, at least, two texts for each author).
1 1A : Hardy (Jude); 1I: Orczy (Scarlet P); 1T: Conrad (Almayer); 1U: Orczy (Elusive P); 1V Conrad (Lord Jim).

7
When a large number of experiments are carried out, we are enabled to establish a
standardised distance scale. Our paper (Labbé & Labbé, 2001) presents such a scale for
French texts. For example, if, in all experiments to be made on English texts, we never find a
distance index under .34 between texts by two different authors, we will be able to assume the
same authorship for any two texts when their inter-textual distance is below this threshold (for
a 10,000 tokens standardised length).
In order to verify these conclusions and to propose some solutions for unsolved cases, two
classification techniques are used.
1.3. Automatic clustering
The Dendrogram below (Fig. 1) gives a pictorial summary of this established analysis.
The algorithm starts by merging the two nearest excerpts (placed at the extreme left of the
chart), and then recalculates the distance indices separating this new set from all other texts in
order to calculate the next grouping. The nearest text is then placed next to the first two, and
the procedure repeated until all texts have been placed in their correct position on the X-axis.
Intertextual distance values corresponding to grouping stages are placed on the Y-axis.
The origin of Y-axis is placed at .25 in order to create a kind of "zoom effect" which
facilitates reading the diagram, but it must not be forgotten that all the texts are relatively near
to another…
When two texts A, B are joined (A∪B), the properties of intertextual distance allow the
calculation, without bias, of a new distance between this group and any text (C) by the
arithmetic mean of the original distance indices:
(2) D(A ∪ B, C ) = D( A, C ) + D(B, C)
2
The calculation is made by merging the two texts A and B and then by calculating the
distance index separating this new "text" from C. For example, one can see on the extreme
left of the dendrogram, that the horizontal edge between 1D and 2W is placed just under .26
and that this group joins 1K at a level of .275 (mean between indices 1D-1K and 2W-1K)2.
Thus, horizontal lines which join vertical edges indicate the level of grouping. The higher this
level, the more heterogeneous is the group, the more uncertain is the authorship.
2 These three excerpts come from Catrionae by Stevenson (Appendix 1).

8
Fig. 1. Cluster analysis on Corpus Oxquarry1
.25
.30
.35
.40
.45
1 2 4 121110987653
From left to rigth : Set 1 : 1D Set 4 : 2L 2C 2Y
2W 2T 1Y 1W 1K 2J Set 8 : 1P 2G 2R 2X 2U 1U 1N 1X 1R 1I 2E 1L Set 9 : 1O Set 12 : 1J 1F 2D 2H 2B
Set 2 : 1S 2F 1G 2M Set 5 : 1H 1V 1C 2Z 1A 2I 2S Set 10 : 2N
Set 3 : 1E Set 6 : 2O 2Q 1Q 2P 2K 1B 2V 1T 2A Set 7 : 1Z Set 11 : 1M

9
Cluster analysis confirms the conclusions presented above and drawn from the direct
examination of the inter-textual distance matrix. It can be seen that all sets have their primary
nodes under .35 (calculated by automatic clustering using formula 2). This value is likely to
be a threshold for identity of authorship.
In addition, some other conclusions appear to be highly probable (and congruent with the
conclusions of direct inspection):
— text 1V may be joined to set 9 (the node is slightly over .35);
— set 4 may be joined to set 5: here again, the node is slightly over .35.
Two other solutions are also suggested and they are congruent with the conclusions of
direct inspection 3:
— text 1T seems to be near set 10 but this node is far above .35; thus it is impossible to
choose between two equivalent solutions: same author, different theme (and/or different book
and/or different date) or two different contemporaneous authors and the same theme;
— texts 1U and 1I seem to join set 11 (same uncertainty as with 1T);
In addition, 1A is clearly too far from all the sets and cannot be classified.
A more complete answer is given with the help of a more powerful tool: tree-analysis.
1.4. Tree-classification
The trees below (Figs. 2 and 3) are drawn following Luong's formulae: "valued" trees and
"grouping" method (Luong, 1988). These formulae, methods and algorithms are fully
explained in Rulhman (2003) and in Labbé & Labbé (2005).
Firstly, this analysis was applied to the original matrix (Fig. 2).
Each "vertice" or terminal "leaf" is tagged with its Corpus code. For example, 1W and 2G
(top of the tree), are adjacent, as also are 1B and 1E. They form two sets of "neighbours"
and these two groups are opposed. The edges ("stems" or "branches") link those four leafs to
two nodes which are created by the algorithm. Their relative positions are calculated in order
to create edges proportional to the original distances. A leaf of the tree is linked to another by
a path formed by, at least, one edge. The longer the path, the farther apart are the two texts.
This graph is "valued". That is to say that the path lengths are positive and in fact
proportional to the original values in the corresponding cells of the distance matrix. This
3 In fact, these four solutions are correct: 1V, 1U, sets 9 and 11 are by Orczy; Hardy is the author of Set 4 and 5; Conrad is the one of 1T and set 10 (Appendix 1).

10
calculation is very complex because this tree must represent, as exactly as possible, the
lengths of 1,326 different links.
Fig. 2 Tree-classification on "raw" distance indices
Among various innovations, a measure of quality is proposed. The quality of a tree, such
as that presented in Fig. 2, can be evaluated by comparing the 1,326 original indices with all
corresponding path lengths on the tree. If all these paths are exactly equal to their
corresponding distance indices, the quality index will be equal to 1. This index is calculated
for each path, for each node and for the whole tree. Above .95, the tree can be considered as
an excellent representation of similarities and dissimilarities existing between all the texts.
Here the quality index is equal to .975. In other words, 97.5% of the whole information
contained in the distance matrix is faithfully represented on this tree. For the 51 nodes, only
one index is equal to .934 ; all other indices are over .95. All path quality indices are over .90.

11
A high degree of confidence can be given to this chart. In all its parts, this tree gives credible
information.
Firstly one notices the cross shape (or star shape) around the tree root: a small grey
lozenge (or red one in electronic files) located exactly at the tree "centre". Terminal edges are
very long and nodes, black dots, are often very near the centre of the tree. This shape means
that all these texts are roughly "equidistant" except a few pairs - like 1D-2W, 1W-2G (the first
nodes are relatively far from the central trunk) - or some texts standing apart (1A, 1T)…
This shape of tree makes it difficult to observe slight differences between texts. Thus the
tree can be "reduced" in order to obtain a kind of "zoom effect" on the central trunk of the
diagram and to reduce proportionally the length of terminal leaves (in Fig. 3, original distance
indices have been "reduced" by 0.2). In other words, this reduction highlights the "contrast"
between texts which are actually very near to one another. Of course this "reduction" entails
some disadvantages, as it lowers the quality of the tree.
Fig. 3 Tree-classification on distance indices less 0.2
All the conclusions presented above are confirmed and a solution is proposed for the few
remaining uncertainties. In addition, tree-classification suggests the reduction of the 12 sets
(Table 1) to 9 by using the last junctions before the central trunk (Table 2 below). Texts 1I

12
and 1U are aggregated to set 1; sets 2 and 12 seem to be by the same author; sets 4 and 5 and
text 1A are also assumed to be by one hand, as are sets 9, 10 and texts 1T and 1V (clockwise
on Fig. 3).
As G. Ledger confirmed: this classification is correct (in Table 2, author's names have been
added in order to facilitate the reading).
Table 2. The nine text sets of probable same authorship. Clockwise on Fig. 2 and 3
(sets already established before tree-classification are placed between brackets)
Final sets Table 1 Excepts (between brackets : Table 1) Authors
1 11 1I, 1U + {1M, 2Y, 1W, 2G } Orczy
2 3 {1B, 1E, 1Q, 2A} Butler
3 2 + 12 {1C, 2I, 1S, 2M} + {1J, 2B} Morris
4 1 {1D , 2W, 1K, 2R, 1F ,1N, 2E} Stevenson
5 6 {2O, 2P, 2V} Foster
6 7 {1Z, 2C, 1Y} Tressel
7 4 + 5 1A + {2D, 1L, 1X, 2L, 2F, 2J, 2T, 2X} + {1H, 2S, 2Z} Hardy
8 9 + 10 {1G, 1O, 2H} + 1V + {1T, 2K, 2N, 2Q} Conrad
9 8 1P, 2U, 1R Chesterton
1.5. Some remarks about this test
What degree of certainty can be assigned to these conclusions?
The sets placed between brackets in table 2 are the only "certain" authorships. In addition,
the grouping of the two sets of excerpts by Hardy can be considered as highly probable,
because it is clearly indicated by automatic clustering, as well as by tree classification. Other
set groupings are "the best fit ones" — taking into account the fact that each author has at
least two texts — among all solutions possible, but one cannot assign them a numerical
probability. Lengths on the dendrogram, or the tree, give an approximate answer. For
example, it can be seen that sets of excerpts by Hardy join together just before reaching the
centre of the tree. In Fig. 2, the length of the last edge— joining these sets to the central
trunk — is very short: less than 10% of the mean length of the terminal edges of these groups.
Of course, the algorithm of classification is accurate but, when differences are so small… it is
difficult to choose between two solutions: (1) same author and different themes and/or books;

13
(2) two contemporaneous authors and a same theme? The same remark applies to pairs {1T -
2K} and {1I - 1U}.
If both cluster and tree classifications have not the same validity as a direct examination of
the matrix (with the help of a normalised scale that is yet to be created), their results converge
clearly toward the same conclusions. Cluster analysis and tree analysis are therefore reliable
tools for literary studies. Further experiments should lead to the calibration of a normalised
scale for authorship attribution, like the one used on French texts by Labbé & Labbé (2001 &
2003), which give a standardised degree of assurance.
Is success by chance alone possible?
If there were only pairs of texts, what is the probability of finding all the 26 correct
answers by chance? Given the fact that there are 1,326 possible different couples of texts, the
probability of success by chance is:
P = 26/1,326 * 25/1,325 * (…) * 2/1,301 * 1/1,300
This probability is almost infinitesimal. And this figure must be reduced to accommodate
possible trios, quartets, etc. Who can easily imagine the number of different combinations that
can be made with only 52 objects?4
The trial was potentially a difficult one, although the organiser wrote after the trial:
"I ought to point out a concern, which is that critics may object that the texts are relatively
easy to differentiate. Some of them should separate into groups quite readily because of
certain idiosyncracies, for example the Scottish dialect in the Stevenson work; or the working
class dialogue in the Tressel work."
In reply, it is to be noted that, if these idiosyncracies are likely to be prominent details for a
human reader, they weigh very little in the whole text surface and in the calculation of the
inter-textual distance index. Above all, distances between texts stem from "common" words
which are likely to be found in every writer.
Which words? It is an important question to which an answer can be made using Corpus
Oxquarry1.
4 Here ends the text sent, in February 2004, to G. Ledger in order to present him the results of the "blind-test".

14
1.6. Contribution of types (vocabulary words) to the inter-textual distances
Where do the distances between texts come from? Or more precisely, two questions may
be asked with the help of Corpus Oxquarry1.
First question: Do the differences between texts stem from rare words or from frequent
ones?
To answer this question, the software programme calculates, for each pair of texts (A, B),
the distance indices between each pair of the same word types which belong to the union of
the two texts (A U B). In the case of the type i (i ∈ A,B), the "absolute contribution to the
distance" (between texts A and B) for type i is equal to:
D(i a,ib) = Fia − F ib
The surface area of the texts compared in this computation is equal to Fia + Fib.
From these can be extracted the "distance index" or "relative distance" for the word type i:
Drel(ia,ib) = F ia − F ib
F ia + F ib
The "types" may be then ranked by ascending frequency. The contribution of each relative
frequency group is calculated by summing up the absolute contributions (column A in the
table 3 below). This allows one to measure the contribution of each group or frequency class
to the greater or lesser distancing between the two texts under consideration (A%), as well as
the text surface covered by this class (Columns B and B%), and the relative distance (Column
C).
Does the value of C differ significantly or not from the average for all the word types? For
all of Corpus Oxquarry1, the average or mean distance index is 0.406 (AvgDrel) and the
standard deviation (σ) is equal to 0.0377. The z-value, or standardised value of the random
variable (column D) is equal to:
Drel(i a,ib) − Avg(Drel)
σ

15
Table 3: Contribution by grouped frequency class to the distances (Corpus Oxquarry1)
Frequency Class
A Absolute Distance
A% % of Total Distance
B Theoretical
Surface Text
B% % of Total Theoretical
Text
C = A/B Distance
Index
D Z-value
1 to 4 10,104,730 47.0 12,105,150 22.8 0.835 16.3 5 to 9 2,553,474 11.9 4,480,490 8.4 0.570 6.3 10 to 14 1,233,152 5.7 2,639,652 5.0 0.467 2.4 15 to 19 815,530 3.8 1,986,830 3.7 0.410 0.2 20 to 29 1,098,062 5.1 2,940,266 5.5 0.373 -1.2 30 to 49 1,096,182 5.1 3,426,642 6.5 0.320 -3.2 50 to 99 1,340,886 6.2 5,066,190 9.6 0.265 -5.3 100 to 199 1,202,394 5.6 5,335,286 10.1 0.225 -6.8 200 to 499 1,242,266 5.8 7,132,326 13.4 0.174 -8.8 500 to 999 588,360 2.7 5,066,960 9.6 0.116 -11.0 >999 220,334 1.0 2,853,986 5.4 0.077 -12.5
Sum 21,495,370 100.0 53,033,778 100.0 0.406
Within the z-value interval (-1.96 et + 1.96), we cannot say that an observed value
significantly differs from the overall mean of .406 for all the words in Corpus Oxquarry1.
Above and below these two limits, however, there is less than 1 chance in 20 of erring in
stating that the observed value differs materially from the overall mean value.
For example, the least frequent "types", those of between 1 and 4 occurrences, contribute
10,105,000 words, that is to say, 47% of the total distance. At the same time, they cover only
22.8% of the total "surface". Therefore the relative distance or index is equal to 0.835
(10,104,730/12,105,150). The z-value of +16.3 indicates that there is virtually no chance of
this being the result of random variation; the "rare words" are those which create the greatest
distances between the texts. By contrast, the various frequent words (>499) contribute only
3.7% to this distance, while they occupy some 15% of the surface.
In referring to the article which appeared in Corpus (Labbé & Labbé, 2003, Table 4, p.
113), one will recognize that, even though the profile is the same as in the table above, the z-
values are less in the case of a similar corpus of French works. In effect, lemmatization in
French reduces the weighting of low frequency words and proportionally increases that of the
overall average and high frequency words.
These contrasts suggest some important comments: For example, most linguistic analyses
– notably PCA and factor analysis – are concerned only with the most frequent "types",
whereas it is manifestly the rare words which are the principal differentiators of authors.

16
Second question : among the frequent word types, which ones do and which ones do not
differentiate between the texts?
Here the concern is only with the most frequent "types". One already knows that on
average their contribution is weak. NB: The list of these words is based on the entire Corpus
Oxquarry1 (the first column of the two tables 4 and 5 below gives the frequency of these
"types" for the entire corpus). The reasoning is the same as above. The "types" are ranked
according to their ascending contribution (i.e., increasing distance index). Tables 4 and 5
show the top and bottom of the list.
Table 4: The most frequent "types" (or function words) which contribute least to the distance between texts.
Type Frequency Distance Text Surface Distance index Z-value
to 13 147 99 366 1 347 726 0.074 -12.60 the 29 654 231 374 3 036 642 0.076 -12.51 in 8 351 82 456 856 188 0.096 -11.75 of 15 975 167 632 1 635 468 0.103 -11.51 that 6 805 74 808 697 272 0.107 -11.33 and 16 441 181 310 1 684 326 0.108 -11.32 for 4 248 47 272 435 132 0.109 -11.28 at 3199 38 500 327 828 0.117 -10.94 with 4 296 56 604 439 824 0.129 -10.52 a 12 144 162 178 1 245 114 0.130 -10.46 out 1 287 17 254 132 090 0.131 -10.44 was 7 352 100 688 751 944 0.134 -10.32 on 3 126 43 358 320 586 0.135 -10.27 there 1 841 27 330 189 414 0.144 -9.92 as 4 448 67 982 456 246 0.149 -9.74 not 3 486 55 558 356 286 0.156 -9.48 from 1 863 29 884 190 332 0.157 -9.44 this 2 263 36 442 231 846 0.157 -9.43 if 1 630 26 866 167 382 0.161 -9.31 what 1 597 26 538 163 914 0.162 -9.25 but 3 387 56 818 346 902 0.164 -9.18

17
Table 5: The frequent "types" which contribute most to the distance between texts
Type Frequency Distance Text Surface Distance index Z-value your 977 40 654 100 266 0.4055 0.01 house 474 20 320 48 552 0.4185 0.50 things 350 15 092 35 904 0.4203 0.57 light 300 13 476 30 804 0.4375 1.22 yes 398 18 172 41 412 0.4388 1.27 moment 320 14 528 32 640 0.4451 1.51 felt 303 14 350 30 906 0.4643 2.24 my 2 529 122 838 260 406 0.4717 2.52 we 1 462 71 168 149 532 0.4759 2.69 rather 385 19 064 39 168 0.4867 3.10 us 511 25 564 52 224 0.4895 3.20 men 592 29 966 60 690 0.4938 3.36 woman 324 16 430 33 150 0.4956 3.43 our 519 27 104 53 040 0.5110 4.02 don't 497 26 444 51 204 0.5164 4.22 she 3 731 200 024 380 868 0.5252 4.56 her 3 977 214 302 406 062 0.5278 4.66 people 456 25 450 46 614 0.5460 5.35 shall 617 39 172 63 444 0.6174 8.06 work 318 20 596 32 436 0.6350 8.73 sir 312 22 484 32 436 0.6932 10.94 Mr 698 51 892 71 808 0.7227 12.06 Mrs 334 26 118 34 170 0.7644 13.65 father 368 28 912 37 740 0.7661 13.71
As in French, prepositions, articles, conjunctions, and auxiliary verbs produce the smallest
distances between texts. In other words, they are common to all authors, or, similarly, the
structure of the language imposes rigid restraints on those who use it; therefore authors can
hardly be differentiated by means of these words. Individual differences are therefore, on
average, very weak.
By contrast, personal pronouns, verbs, and the most ordinary nouns (substantive,
adjectives) are more variable in their usage among different texts and authors. That is the case
in French as well.
A main conclusion can be drawn from the analysis of distance contributions: for authorship
attribution, a great number of experiments like this may lead to a set of more or less frequent
words able to discriminate authors in general. Texts of different length will then become
comparable. One can understandably be sceptical about this outcome, but one can imagine
how to validate the idea, applying the procedure to a great number of texts which are of
established authorship. Then one could apply these lists to unknown or doubtful texts. It
would be a good supplement to a standardised scale for authorship attribution.

18
1.7. A provisional scale for authorship attribution
The reasoning above postulates that the indices of inter-textual distance calculated between
texts by a same author must be significantly lower than those between texts by different
authors. The results of the blind-test appear to validate this postulate but nevertheless a more
detailed examination is of interest. Given the choices made by G. Ledger, there are 153
different pairs of excerpts by the same authors and 1173 pairs which group excerpts by
different authors. Let the entire 1,326 indices be ranked by ascending values. Appendix 2
reproduces the beginning and the ending tails of this distribution. Fig. 4 presents their
repartition in equal classes (absolute densities).
Fig. 4 Distribution of inter-textual distance indices ranked by ascending values in equal
classes from Oxquarry1.
0
10
20
30
40
50
60
70
80
90
100
0,26 0.29 0.32 0.35 0.38 0.41 0.44 0.47 0.5
count
The shape of this graph suggests clearly a mix of different populations :
— in the middle of the graph, a large population, with a "mode" around 0.395-0.410 seems
to be more or less "Gaussian";

19
— on the right tail, a little group of text pairs separated by distance indices over 0.48.
Appendix 2.4 highlights the singularity of Conrad and suggests that, for some these texts, a
supplementary factor (genre?) adds its effects to differences in authorship and content.
— on the left tail, two small populations of which one cannot say if their distribution is
Gaussian or not because they are of insufficient size. The first population from the left has a
mode at 0.315-0.320; the second population mode seems to take place at 0.325-0.330.
Appendix 2.1 indicates clearly the difference between these two populations. The first one is
quite exclusively composed of text pairs drawn from the same books; the second one contains
a majority of excerpts from two different books by the same author.
Of course these populations are not strictly separated, but some thresholds appear clearly:
— all indices less than .349 are within excerpts by the same author. 56% of all distances
between texts by the same author are below this threshold (Appendix 2.1).
— between .35 and .36 one can find a great majority of pairs of texts by the same author
(Appendix 2.2, marked in bold) and very few of them can be found over .36 and under .395
(Appendix 2.3).
— all indices above .395 are between excerpts by different authors : 78% of all pairs of
texts by two different authors are above this threshold.
It is also noticeable that the highest indices (Appendix 2.3) observed for the same author,
concern for most part only different books, except Orczy's Scarlet Pimpernel (.364) and
Elusive P. (.376), Conrad 's Lord Jim (.367 and 373) and Almayer's Foly (.384). For these
four books, various explanations are possible, for example: they are more "heterogeneous"
than the others; G. Ledger chose excerpts very different from each other.
A final remark: in Corpus Oxquarry1, the texts are of equal lengths. Are the results equally
good when the method is applied to texts the lengths of which are different? In other words,
what is the influence of text length on inter-textual distance? And, if there is an actual
influence, how could one neutralise this drawback?

20
II. INFLUENCE OF TEXT LENGTHS ON DISTANCE INDEX
Firstly, a modification of formula (1) is presented to adapt it in the case of texts unequal in
length. To measure the potential bias due to the differences of length, several trials were
carried out. These experiments followed the same principle: the length was the only factor
allowed to vary while the other factors were neutralised (as strictly as possible).
2.1. Calculation of Inter-textual distance index on texts of different sizes
The extended reasoning is presented in Labbé & Labbé (2001 and 2003). It is proposed to
"reduce" the larger text (B) to the size of the shorter one (A) as explained below. Let Na and
Nb be the size of the two texts (in tokens), and a type i of which absolute frequencies are fia
and fib in A and B. The mathematical expectancy of this type in A, considering its frequency in
B (fib) is:
Eia(u) = Fib * u with u = Na
Nb
and the "absolute" distance is: Fia - Eia(u)
Thus, the new distance index between A and B is obtained in substituting Eia(u) for Fib in the
formula (1):
(3) Drel( A, B) =
Fia
i∈(A, B)∑ − Eia(u)
2Na
Two main experiments were carried out in order to test the accuracy of the formula (3) and
to measure its possible sensitivity to the differences of text lengths. First, the Corpus
Oxquarry1 was used, then a larger one, Oxquarry2, was collected with the help of G. Ledger.

21
2.2. Experiment on short texts (Oxquarry1)
Given three texts A, B, C, when two of them (A, B) are joined (A∪B), is the new distance
index between this group and any other text (C), equal to the arithmetic mean of the original
distances (see formula (2) above)? In what follows, the indices calculated in applying formula
(2) are designated "theoretical", and those using formula (3) on the actual "new text" created
by joining A to B are designated " observed". If the results of the two calculations are equal, it
mean that the calculation is insensitive to differences in text lengths.
In the blind-text presented above,
— the two nearest texts are excerpts from Stevenson's Catrionae (1D and 2W). These two
excerpts were joined and this "new text" was designated "Stevenson2" (since the length of
this "text" is 20,000 tokens, the double of the other excerpts which are unchanged);
— the most distant excerpts written by a single author are 1I (Orczy, Elusive) and 1U
(Orczy, Scarlet). They were also joined ("Orczy2").
The theoretical and observed indices are calculated between these two "new" texts (20,000
tokens long) and the 48 remaining excerpts (10,000 tokens long). Table 6 below gives the
results of the comparison between the two results.
This comparison reveals:
— a systematic bias: observed indices are always less than the theoretical ones. Almost all
the discrepancies vary between 2% and 4%, but they are above 5% in the case of two
occurrences for Stevenson and in four for Orczy (bold characters in Table 6). Given the fact
that for French texts of different lengths, the results fall within an uncertainty margin of 5%,
these six indices must be considered as "anomalous".
It is worth noting that, for Orczy, half of the discrepancies come from distances within her
own work (between Elusive P. and Scarlet P.). More generally, the highest values in the last
two columns are observed between texts by the same author or between the nearest texts by
different authors.

22
Table 6 Influence of text size on distance indices (Corpus Oxquarry1, scale difference 1:2) Theoretical index Observed index Difference % Stevenson2 Orczy2 Stevenson2 Orczy2 Stevenson2 Orczy2
1A (Hardy Jude) 0.4384 0.4228 0.4267 0.4057 -2.7 -4.0 1B (Butler Erewhon revisit.) 0.4164 0.4394 0.4081 0.4265 -2.0 -2.9 1C (Morris News) 0.4122 0.4355 0.4034 0.4219 -2.1 -3.1 1E (Butler Erewhon revisit.) 0.3962 0.4424 0.3836 0.4299 -3.2 -2.8 1F (Stevenson Ballantrae) 0.3315 0.4058 0.3158 0.3857 -4.7 -5.0 1G (Conrad Lord Jim) 0.3879 0.4343 0.3776 0.4171 -2.7 -4.0 1H (Hardy Madding) 0.4138 0.4145 0.4037 0.3969 -2.4 -4.3 1J (Morris Dream of JB) 0.4256 0.4560 0.4143 0.4418 -2.7 -3.1 1L (Hardy Jude) 0.2842 0.4378 0.2644 0.4231 -7.0 -3.4 1M (Orczy Scarlet P) 0.4052 0.4197 0.3957 0.4027 -2.4 -4.1 1N (Stevenson Ballantrae) 0.4353 0.4034 0.4268 0.3841 -2.0 -4.8 1O (Conrad Lord Jim) 0.3256 0.4237 0.3106 0.4056 -4.6 -4.3 1P (Chesterton Man who was) 0.4290 0.4304 0.4194 0.4153 -2.2 -3.5 1Q (Butler Erewhon revisit.) 0.4373 0.4207 0.4288 0.4036 -1.9 -4.1 1R (Chesterton Man who was) 0.3915 0.4327 0.3810 0.4173 -2.7 -3.6 1S (Morris News) 0.4059 0.4155 0.3963 0.3980 -2.4 -4.2 1T (Conrad Almayer) 0.3572 0.4279 0.3459 0.4138 -3.1 -3.3 1V (Conrad Lord Jim) 0.5118 0.4612 0.5029 0.4456 -1.7 -3.4 1W (Orczy Elusive P) 0.4764 0.4365 0.4679 0.4187 -1.8 -4.1 1X (Hardy Wessex Tales) 0.4346 0.3925 0.4242 0.3705 -2.4 -5.6 1Y (Tressel Ragged TP) 0.4157 0.4173 0.4037 0.3991 -2.9 -4.4 1Z (Tressel Ragged TP) 0.4413 0.4249 0.4319 0.4050 -2.1 -4.7 2A (Butler Erewhon revisit.) 0.4325 0.4295 0.4215 0.4148 -2.5 -3.4 2B (Morris Dream of JB) 0.4177 0.4299 0.4086 0.4127 -2.2 -4.0 2C (Tressel Ragged TP) 0.4330 0.4290 0.4246 0.4151 -1.9 -3.2 2D (Hardy Jude) 0.4184 0.4263 0.4100 0.4115 -2.0 -3.5 2E (Stevenson Ballantrae) 0.4148 0.4064 0.4038 0.3871 -2.7 -4.7 2F (Hardy Wessex Tales) 0.3244 0.4148 0.3112 0.3958 -4.1 -4.6 2G (Orczy Elusive P) 0.4284 0.4306 0.4169 0.4138 -2.7 -3.9 2H (Conrad Lord Jim) 0.4599 0.3977 0.4501 0.3747 -2.1 -5.8 2I (Morris News) 0.4033 0.4181 0.3932 0.4006 -2.5 -4.2 2J (Hardy Well beloved) 0.3902 0.4334 0.3793 0.4192 -2.8 -3.3 2K (Conrad Almayer) 0.4057 0.4138 0.3948 0.3967 -2.7 -4.1 2L (Hardy Well beloved) 0.4861 0.4379 0.4773 0.4227 -1.8 -3.5 2M (Morris News) 0.3983 0.4237 0.3877 0.4065 -2.6 -4.1 2N (Conrad Almayer) 0.3810 0.4260 0.3686 0.4125 -3.3 -3.2 20 (Forster Room with view) 0.4546 0.4224 0.4474 0.4055 -1.6 -4.0 2P (Forster Room with view) 0.3977 0.4316 0.3878 0.4139 -2.5 -4.1 2Q (Conrad Almayer) 0.4245 0.4235 0.4135 0.4055 -2.6 -4.2 2R (Stevenson Catrionae) 0.4339 0.4207 0.4265 0.4037 -1.7 -4.0 2S (Hardy Madding) 0.2966 0.4154 0.2788 0.3949 -6.0 -4.9 2T (Hardy Well beloved) 0.4076 0.4163 0.3962 0.3990 -2.8 -4.2 2U (Chesterton Man who was) 0.4240 0.4182 0.4136 0.3989 -2.4 -4.6 2V (Forster Room with view) 0.4293 0.4249 0.4196 0.4071 -2.2 -4.2 2W (Stevenson Catrionae) 0.4098 0.4395 0.3992 0.4211 -2.6 -4.2 2X (Hardy Well beloved) 0.4336 0.4264 0.4240 0.4096 -2.2 -3.9 2Y (Orczy Scarlet P) 0.4386 0.3668 0.4286 0.3400 -2.3 -7.3 2Z (Hardy Madding) 0.4226 0.4154 0.4111 0.3969 -2.7 -4.5
Mean -2.5 -4.2

23
The same experiment was repeated:
— step 3: the closest excerpt was added to Stevenson2 (i.e. 1K which is also an excerpt
from Catrionae) in order to constitute "Stevenson3" and to Orczy2 (1M, Scarlett P.) in order
to constitute "Orczy3";
— step 4: 2R is added to Stevenson3 (Stevenson4) and 1W to Orczy3 (Orczy4) ;
— steps 5 & 6. Stevenson5 and 6 are formed by merging with Stevenson4: 1F and then
1N; Orczy5 and 6 are constituted by merging with Orczy4: 2G and then 2Y.
It is not possible to proceed further in this way because there are only six excerpts by
Orczy. The distance indices between these groups and the remaining 10,000 token length
excerpts were calculated. This experiment highlights index behaviour when calculated with
texts the sizes of which diverge further and further. Tables 7 and 8 below show the results of
this new experiment.
Table 7 Stevenson. Comparison with all remaining 10,000 token excerpts Means of the whole indices
A
Means of Observed Indices
B Means of Theoretical
Indices
(A-B)/B%
Stevenson 20,000 .402 .412 -2.5
Stevenson 30,000 .397 .413 -3.9
Stevenson 40,000 .379 .412 -8.0
Stevenson 50,000 .374 .406 -7.9
Stevenson 60,000 .372 .405 -8.2
Table 8 Orczy. Comparison with all remaining 10,000 token excerpts
Means of the whole indices
A Means of Observed
Indices
B Means of Theoretical
Indices
(A-B)/B%
Orczy 20,000 .406 .424 - 4.2 Orczy 30,000 .390 .421 -7.3 Orczy 40,000 .387 .420 -7.9 Orczy 50,000 .392 .425 -7.9 Orczy 60,000 .391 .426 -8.2
The systematic bias noted above appears clearly. It is also clear that the relation between
text lengths and distance indices is non-linear. As the differences of size between texts
increase, the growth rate of the divergences between theoretical and observed values
decreases (last column). The same phenomenon was noted with the French corpora but to a
24
lesser degree (Labbé & Labbé, 2003). Again, these differences stem from a lesser proportion
of low frequency word types in French corpora (due to lemmatisation).
This bias entails an obvious consequence: when comparing texts the sizes of which greatly
differ, the indices calculated in applying Formula 3 to the longest ones will tend to be lower
than those calculated with the shortest ones.
However, two objections may be made to this experiment: the excerpts by Stevenson are
much nearer one another than those by Orczy, and it can be added that the larger the
"artificial" texts, the lesser the others : they remain 48 when length factor is equal to 2; 40
when it reaches 6 (it is the reason why values in column B vary).
In order to organise a more systematic experiment, G. Ledger was asked to set up a new
corpus.
2.3 First experiment on long texts (Corpus Oxquarry2)
An agreement with Dr Ledger was reached about the main characteristics of this new
corpus. It should contain the entire novels from which the Corpus Oxquarry1 was composed
in order to make the results comparable. And it was decided to add other novels written
during the same period (1870-1914) by other writers. The main purpose was to obtain, by a
choice independent of the operator, the largest possible range of sizes for texts written in the
same genre, period and by undisputed authors.
The result of this selection is Corpus Oxquarry2 (Appendix 3). This corpus is 5.1 million
tokens long (ten times Oxquarry1) with an average length slightly over 100,000 tokens. The
length ratio is nearly 1:16 between Heart of Darkness by Joseph Conrad (20,243 tokens) and
Middlemarch by George Eliot (316,156 tokens). This ratio of lengths clearly exceeds the
limits of validity of formula (3) observed by Labbé and Labbé (2003). Beyond a scale of 1:10,
the experiments conducted on French corpora demonstrate that distance indices are biased,
especially when calculations include the longest and the shortest texts.
This bias should not be over-emphasized. For example, tree-classification — applied to the
whole matrix of indices calculated on Corpus Oxquarry2 applying Formula 3 — is without
error (Fig. 5 below). Of course, the lengths of the paths must be carefully considered. For
example, for Conrad's cluster, some novels appear to be very near one another (Lord Jim,
Arrow of Gold or Victory), while others are more outlying (Almayer's Folly, Typhoon, Heart
of Darkness). One must not draw conclusions too quickly about Conrad's work because the
first set contains much longer texts than the second one. In fact, the first experiment above

25
allows one to "predict" that, the influence of the other factors being equal, the longer texts
will be relatively nearer all the others than the shorter ones.
Fig. 5. Tree classification of Corpus Oxquarry2 applying Formula 3
Even if tree-classification appears to be accurate, one must bear in mind that this
classification does not yield "proof" of authorship, but only provides the "best fit" of the
whole population. Its suggestions must be confirmed by the direct examination of the matrix
as in the blind-test presented above. Here, the mean distance index is equal to .315, greatly
below the one obtained for Oxquarry1 (.405). In other words, when the mean sizes of the texts
are multiplied by ten, their distance indices decrease by nearly 20% on average.
But this decrease is not linear and strictly proportional. There are also some irregularities
which render the method presented above no longer reliable for authorship attribution. The

26
5% lower limit (mean less 1.96 standard deviations) is equal to .237; the upper limit to .394.
All pairs of novels separated by a distance greater than .394 are indeed by two different
authors. By contrast, the lower boundary generates three errors of attribution (bold type in
Table 9).
Table 9. Inter-textual distance indices calculated on Corpus Oxquarry2 applying formula 3 - Pairs of distance indices which suggest same authorship (mean less 1.96 standard deviations)
Text 1 Text 2 Indice EliotDeronda EliotMiddlemarch 0.155 BraddonFenton BraddonLovels 0.180 BraddonGolden BraddonPhantom 0.185 ChestertonInnocence ChestertonWisdom 0.186 EliotMiddlemarch EliotMill 0.196 EliotDeronda EliotMill 0.196 ForsterHoward ForsterJourney 0.202 BraddonFenton BraddonRun 0.204 ConradJim ConradVictory 0.204 BraddonGolden BraddonLovels 0.205 HardyJude HardyWessex 0.206 ChestertonBall ChestertonManWW 0.206 HardyBeloved HardyWessex 0.207 HardyMadding HardyWessex 0.208 BraddonLovels BraddonPhantom 0.211 ForsterHoward ForsterRoom 0.214 StevensonCatriona StevensonKidnapped 0.214 HardyBeloved HardyJude 0.216 StevensonBallantrae StevensonKidnapped 0.219 HardyJude HardyMadding 0.219 ChestertonBall ChestertonInnocence 0.219 ForsterAngels ForsterJourney 0.219 ConradArrow ConradVictory 0.220 StevensonBallantrae StevensonCatriona 0.221 BraddonFenton BraddonGolden 0.222 BraddonLovels BraddonRun 0.222 ForsterJourney ForsterRoom 0.224 ChestertonInnocence ChestertonManWW 0.226 ForsterAngels ForsterHoward 0.228 ChestertonBall ChestertonWisdom 0.229 BraddonLondon BraddonPhantom 0.230 BraddonLovels EliotDeronda 0.230 ForsterAngels ForsterRoom 0.231 BraddonFenton EliotMiddlemarch 0.231 ButlerErewhonRev ButlerWay 0.232 ChestertonBall ChestertonManAlive 0.233 EliotMill HardyJude 0.234 BraddonFenton BraddonPhantom 0.234 BraddonLovels EliotMiddlemarch 0.235 BraddonGolden BraddonRun 0.236 BraddonPhantom BraddonRun 0.237 ChestertonManWW ChestertonWisdom 0.237
27
As predicted from the discussion above, these errors involve the longest texts. Indeed, it is
possible that the four novels and the two authors (Braddon and Eliot) were in fact
"neighbours" as to their content and vocabularies, but also it is clear that Formula (3) — when
applied to texts the size of which differs greatly (here more than 1:15) — "advantages" the
longer ones, ie: the longer ones appear to be nearer one another — and also from all the others
— than the shorter ones.
In order to measure the strength of association between distance index and length of the
texts examined, a calculation is proposed. The comparison of each text with the others
generates 47 indices. If the Formula 3 "advantages" the longer texts, the averages of their 47
indices must be lower than the same averages calculated for the shorter ones. The results of
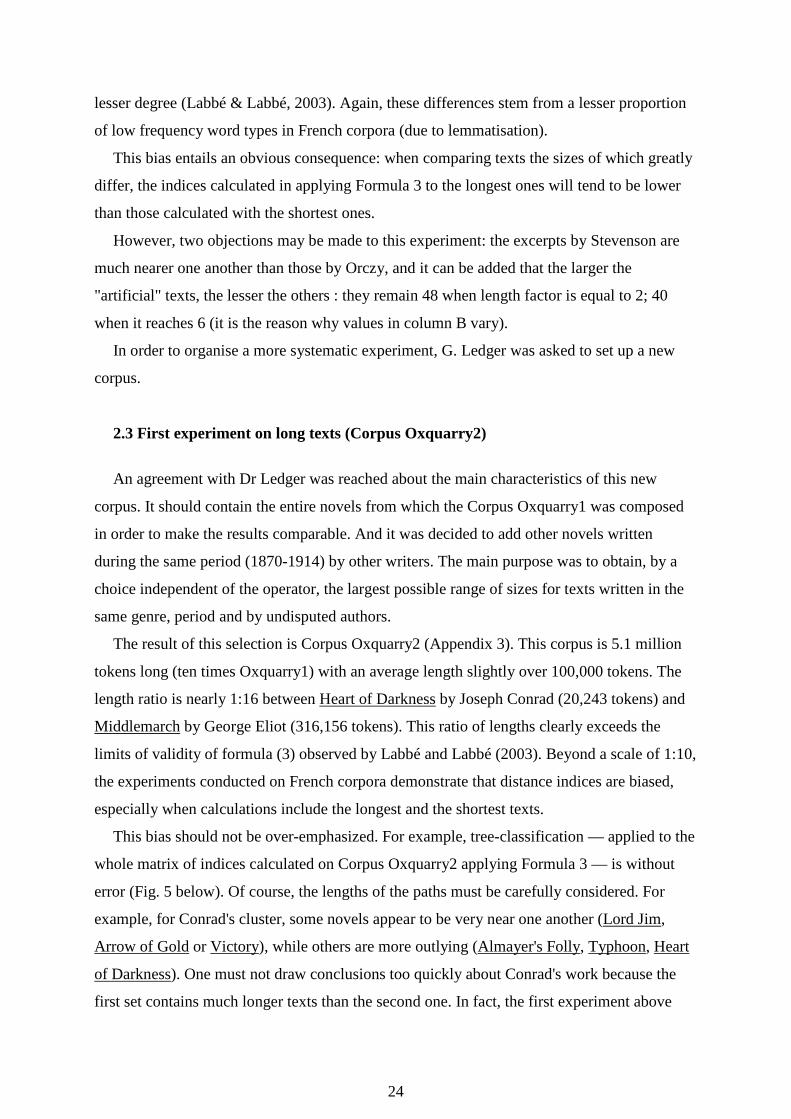
all these calculations are summarised in Fig. 6.
Fig. 6. Correlation between the length of each text and its average distance index compared with all the other texts (Corpus Oxquarry2).
Fig. 6 suggests an inverse relation between lengths of texts and distance indices. The
plotted points are oriented NW-SE and present a more or less hyperbolic shape: the shorter
the texts, the farther apart they appear to be in relation with the others. But it is noticeable that
7 texts stand out apart from the others. On the lower right, four of the shortest texts: Dream of
J.B by Morris and three novels by Conrad (Typhoon, Almayer's Folly, Heart of Darkness); on
the upper left, the three longer texts: Tressel's Ragged Philantropists, Eliot's Middlemarch and
0
50000
100000
150000
200000
250000
300000
350000
0.2 8 0.3 0 0.3 2 0.34 0.3 6 0.38 0.4 0
Lengt h (tokens)
Distance Index Mean
Morris (Dream)
Tressel ( Ragged )
Eliot (Middlemarch)
Eliot (Deronda)
Conrad (Typhoon)
Conrad (Almayer )
Conrad (Heart)
28
Daniel Deronda. When these 7 texts are removed, there is no longer a significant negative
correlation between length of each text and the averaged distance indices. Of course the "size
factor" is already present in these data, but it is "masked" by stronger factors: authorship and
content. It is note-worthy that, once these 7 texts are extracted, the ratio between the shortest
remaining text (Stevenson's Doctor Jekyll) and the longest remaining one (Braddon's The
Mill ) is equal to 1:8. Thus it is possible to draw a provisional conclusion: the procedure of
authorship attribution, presented above in the blind-test, should be used only when the lengths
of the texts compared are within a ratio less than 1:8.
2.4. Second large scale experiment
In order to measure accurately the effect of text length on the distance index, an
experiment was conducted on Corpus Oxquarry2. A large number (100) of slices of equal size
(n contiguous tokens) was drawn at random from each text of Corpus Oxquarry2 and formula
(1) was applied to all the different pairs formed with all the equivalent slices drawn from all
the other texts. Thus, the distance index between a pair of texts was the mean of 10,000
different calculations (for the reasons for this choice, see below, section 2.6). The experiment
started with an excerpt size of 5,000 tokens; then this length was increased by 1,000 tokens
and so on… until 20,000 tokens (summary is given in Table 10). It was not possible to go
further than 20,000 tokens because of the length of the shortest novel (Conrad's Heart of
Darkness: 20,243 tokens). During the experiment, the minimum index was between
Chesterton's The Innocence of Father Brown and The Wisdom of Father Brown (identity of
authorship and proximity of the two topics). The maximum index was between Butler's
Erewhon and Conrad's Almayer's Folly which is also not surprising because of the wide
disparity of topics which adds its effect to the expected effect of differing authorship.

29
Table 10 Main results of a large scale experiment on Corpus Oxquarry2
Excerpt sizes (tokens)
Mean Distance Index
Minimum Distance Index
Maximum Distance Index
Standard deviation
Variation coefficient
5 000 0.4578 0.3775 0.5474 0.0244 0.0532 6 000 0.4463 0.3657 0.5428 0.0256 0.0574 7 000 0.4365 0.3547 0.5361 0.0269 0.0617 8 000 0.4277 0.3459 0.5305 0.0271 0.0634 9 000 0.4207 0.3372 0.5265 0.0279 0.0664
10 000 0.4137 0.3300 0.5203 0.0279 0.0674 11 000 0.4090 0.3240 0.5200 0.0290 0.0710 12 000 0.4038 0.3166 0.5161 0.0293 0.0726 13 000 0.3996 0.3097 0.5135 0.0300 0.0750 14 000 0.3954 0.3046 0.5106 0.0303 0.0766 15 000 0.3916 0.2991 0.5075 0.0304 0.0777 16 000 0.3882 0.2941 0.5051 0.0309 0.0797 17 000 0.3850 0.2889 0.5031 0.0311 0.0809 18 000 0.3821 0.2845 0.5016 0.0316 0.0828 19 000 0.3794 0.2807 0.5002 0.0318 0.0838 20 000 0.3766 0.2768 0.4978 0.0320 0.0849
*
The index mean slowly decreases as the length of the excerpts increases. As shown on Fig.
7 below, this movement is not linear but more or less hyperbolic. The slight irregularities in
the curves are usual in any random process, even if the number of excerpts is large. One must
also note that the origin of Y-axis is not placed at zero but at .25 in order to highlight the
fluctuations of the indices: the distance indices decrease slowly and the rate of decrease is
becomes less as the size of excerpts increases. Conclusions of the first experiment, on
excerpts by Stevenson and Orczy, are verified. It is also clear that the influence of the "size
factor" is more acutely felt on short texts - especially those under 10,000 tokens - than on
longer ones.
Another characteristic is highlighted by the graph: the range between minimum and
maximum indices widens as excerpt size expands. This change does not derive from a small
number of marginal texts; it applies to all the series as indicated by the evolution of the
standard deviation. If the variation of excerpt size did not influence the dispersion of the
distance indices around the mean, the "coefficient of variation" (ratio of standard
deviation/mean) would be stable. On the contrary, this coefficient increases regularly (Fig. 8).
In other words, when the scale of observation is reduced, differences between texts are
slightly but significantly eroded.

30
Fig. 7 Evolution of the Index Mean and the Min/Max Range in relation to size of excerpts
Fig. 8 Evolution of the ratio, Standard Deviation/Mean, related to the size of excerpts
The main explanation is as follows: as the size of a text increases, the relative weight of the
low frequency words decreases with respect to its whole vocabulary. Since, as shown above,
the low frequency words contribute most to the distance index, the values of this index
logically decrease as the text lengths increase. For French texts, lemmatisation greatly reduces
the weight of these low frequency words. As a result, the influence of the length on the
distance index is distinctly lower than with English texts.
0.250
0.300
0.350
0.400
0.450
0.500
0.550
0.600
5000 7000 9000 11000 13000 15000 17000 19000
MeanMinMax
Excerpt sizes (tokens)
Distance Indices
0.040
0.045
0.050
0.055
0.060
0.065
0.070
0.075
0.080
0.085
0.090
5000 7000 9000 11000 13000 15000 17000 19000
V%
Excerpt sizes (tokens)
31
2.5 Neutralisation of the length factor: the "sliding window method"
How to neutralise the influence of the length factor in order to conduct authorship
attribution experiments free from bias?
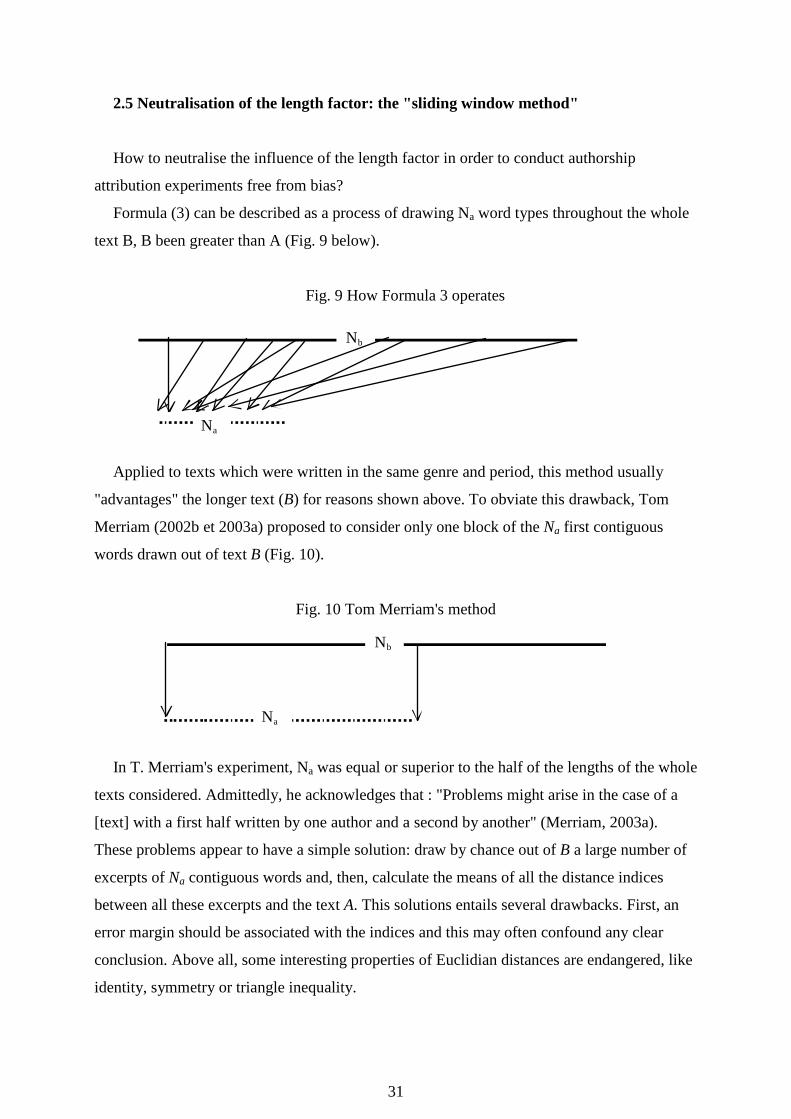
Formula (3) can be described as a process of drawing Na word types throughout the whole
text B, B been greater than A (Fig. 9 below).
Fig. 9 How Formula 3 operates
Nb
Na
Applied to texts which were written in the same genre and period, this method usually
"advantages" the longer text (B) for reasons shown above. To obviate this drawback, Tom
Merriam (2002b et 2003a) proposed to consider only one block of the Na first contiguous
words drawn out of text B (Fig. 10).
Fig. 10 Tom Merriam's method
Nb
Na
In T. Merriam's experiment, Na was equal or superior to the half of the lengths of the whole
texts considered. Admittedly, he acknowledges that : "Problems might arise in the case of a
[text] with a first half written by one author and a second by another" (Merriam, 2003a).
These problems appear to have a simple solution: draw by chance out of B a large number of
excerpts of Na contiguous words and, then, calculate the means of all the distance indices
between all these excerpts and the text A. This solutions entails several drawbacks. First, an
error margin should be associated with the indices and this may often confound any clear
conclusion. Above all, some interesting properties of Euclidian distances are endangered, like
identity, symmetry or triangle inequality.
32
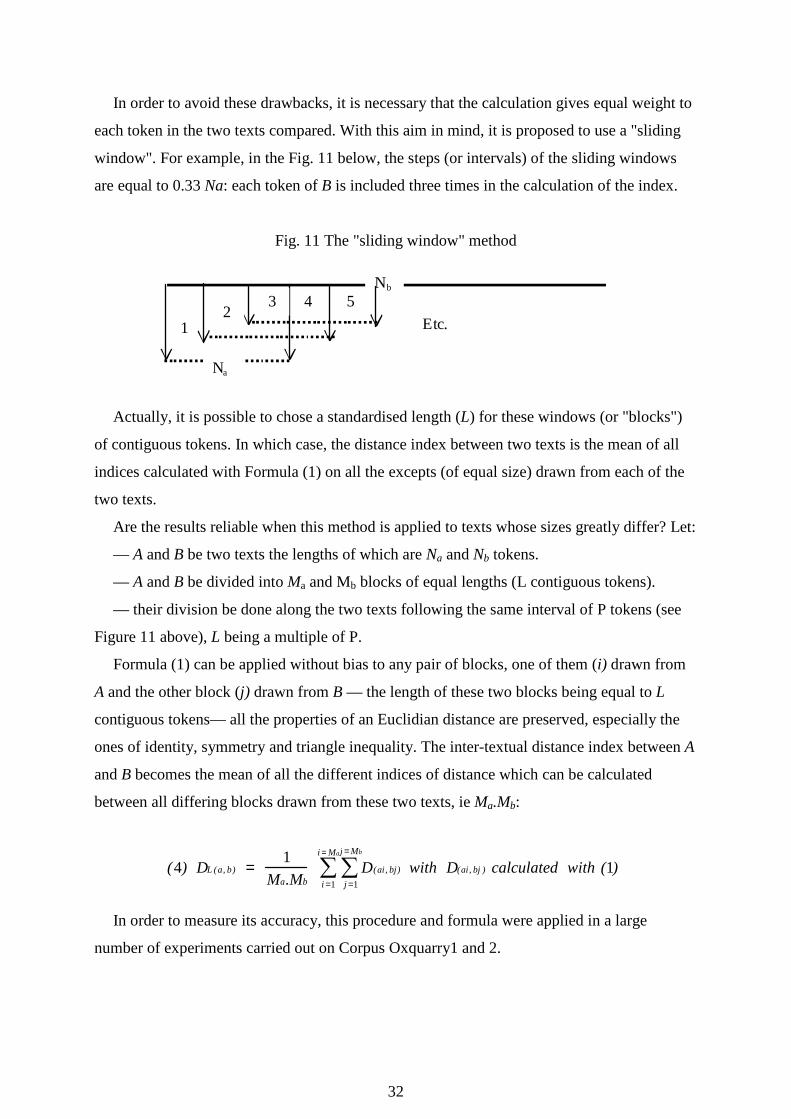
In order to avoid these drawbacks, it is necessary that the calculation gives equal weight to
each token in the two texts compared. With this aim in mind, it is proposed to use a "sliding
window". For example, in the Fig. 11 below, the steps (or intervals) of the sliding windows
are equal to 0.33 Na: each token of B is included three times in the calculation of the index.
Fig. 11 The "sliding window" method
Nb
1
32
Etc.
Na
4 5
Actually, it is possible to chose a standardised length (L) for these windows (or "blocks")
of contiguous tokens. In which case, the distance index between two texts is the mean of all
indices calculated with Formula (1) on all the excepts (of equal size) drawn from each of the
two texts.
Are the results reliable when this method is applied to texts whose sizes greatly differ? Let:
— A and B be two texts the lengths of which are Na and Nb tokens.
— A and B be divided into Ma and Mb blocks of equal lengths (L contiguous tokens).
— their division be done along the two texts following the same interval of P tokens (see
Figure 11 above), L being a multiple of P.
Formula (1) can be applied without bias to any pair of blocks, one of them (i) drawn from
A and the other block (j) drawn from B — the length of these two blocks being equal to L
contiguous tokens— all the properties of an Euclidian distance are preserved, especially the
ones of identity, symmetry and triangle inequality. The inter-textual distance index between A
and B becomes the mean of all the different indices of distance which can be calculated
between all differing blocks drawn from these two texts, ie Ma.Mb:
(4) DL (a, b) = 1
Ma.Mb D(ai, bj)
j =1
j = Mb
∑i =1
i = Ma
∑ with D(ai, bj ) calculated with (1)
In order to measure its accuracy, this procedure and formula were applied in a large
number of experiments carried out on Corpus Oxquarry1 and 2.

33
2.6 Accuracy of the "sliding window" method.
Corpus Oxquarry1 (made of texts the length of which is 10,000 tokens) was used in order
to compare the results of the "sliding window" to those of the blind-test. Table 11 below
presents a synthesis of the results of the experiments on blocks of 5,000 contiguous tokens,
while varying the step interval.
Table 11
Synthesis of the results of experiment on Oxquarry 1, blocks of 5,000 contiguous tokens.
Step interval in tokens 1,000 500 200
Number of calculations (Ma.Mb) 100 400 2,500
Deviations between observed and expected values:
Absolute mean 0.62% 0.59% 0.61%
Standard deviation 0.52% 0.49% 0.49%
Margin of error ± 1.66% ± 1.56% ± 1.59%
When a step interval of 200 tokens is chosen (as in the last column of Table 11), it means
that the first window starts at the first token and ends at the 5,000th token, the second starts at
201 and finishes at 5,200 and so on… until the last one which starts at 9,801 and finishes at
4,800 (the algorithm "buckles" in order to form the last blocks). Thus, each word of A and B
appears in 50 different blocks of 5,000 tokens, and the distance index between each pair of
texts (A, B) is the mean of 2,500 calculations (each of the 50 blocks of A is compared to each
of the 50 blocks of B).
The results in Table 11 show that, in superimposing the two 1,326 cell matrices, the
average deviation between expected and observed indices is appreciably less than 1% and
that more than 19 twentieths of these discrepancies are contained within a fluctuation margin
of ±1.6% about this mean. In fact, 38 values are above or below these two thresholds. As
predicted above, these anomalies derive from the nearest texts. For example, the greatest
deviation (-3.1%) was observed between 1H and 2Z (both excerpts from Far the madding
crowd by Hardy); the next in order of magnitude (+2.8% and + 2.6%) are from 4 excerpts
from Catrionae by Stevenson. Two explanations can be offered. Firstly the experiments,
presented in the first section of this paper, show that, in case of a great proximity in the
vocabulary of the two texts, the augmentation of L makes their intertextual distance decrease
faster than the average, and conversely, when the two texts are farther apart (see also Fig. 6

34
above). Stevenson's texts illustrate one case and Orczy's novels the other. Secondly, the
buckle method adds a slight but real unaccounted - for variability.
Table 11, first line, shows the number of calculations entailed by the size of the step
interval: this number grows exponentially as the step size is reduced. So a best compromise
should be decided on, taking into consideration the demands of accuracy and the necessity of
not waiting hours for results. Table 11 suggests that the step should be chosen in order to
obtain at least 100 different calculations, and that no further accuracy can be expected in
using over 400 different calculations.
Are these conclusions confirmed when applying the method to longer texts? Corpus
Oxquarry2 was used in order to provide some answers.
Granted the fact that, in this corpus, the shortest text is slightly over 20,000 tokens, it was
decided to adopt this size for L and a P (the size of the step) of 2,000 in order to ensure that
the number of calculations between two texts are always greater than 100. The average
distance index is .3712 and the standard deviation .0282. So it can be supposed that all the
novels which are separated by indices less than .315 (the mean less 1.96 standard deviations)
are by the same authors. Table 12 below shows that this authorship attribution is free of error
— contrary to Table 9 — but also that there is no text by Morris or by Wilde. One must bear
in mind that, at this stage, the aim was not to give an answer for all the texts, but to avoid
error.

35
Table 12. Corpus Oxquarry2. Pairs of texts separated by an index lower than .315
(blocks of 20,000 tokens, step of 2,000 tokens).
Text 1 Text 2 Indices ChestertonInnocence ChestertonWisdom 0.277 HardyBeloved HardyWessex 0.282 ForsterAngels ForsterJourney 0.283 StevensonCatriona StevensonKidnapped 0.286 ChestertonBall ChestertonManWW 0.287 ForsterAngels ForsterRoom 0.289 StevensonBallantrae StevensonJekyll 0.289 StevensonBallantrae StevensonKidnapped 0.290 ForsterHoward ForsterJourney 0.292 ConradHeart ConradJim 0.292 BraddonFenton BraddonLovels 0.292 ForsterAngels ForsterHoward 0.292 ForsterHoward ForsterRoom 0.292 EliotDeronda EliotMiddlemarch 0.295 StevensonBallantrae StevensonCatriona 0.295 HardyBeloved HardyJude 0.297 ChestertonBall ChestertonInnocence 0.299 ForsterJourney ForsterRoom 0.299 ChestertonInnocence ChestertonManWW 0.299 StevensonKidnapped StevensonTreasure 0.300 HardyJude HardyWessex 0.301 HardyMadding HardyWessex 0.302 ChestertonClub ChestertonManWW 0.303 StevensonJekyll StevensonKidnapped 0.303 ChestertonBall ChestertonWisdom 0.304 ChestertonBall ChestertonClub 0.305 ChestertonManWW ChestertonWisdom 0.306 ConradJim ConradVictory 0.306 ChestertonBall ChestertonManAlive 0.307 ButlerErewhonRev ButlerWay 0.308 BraddonFenton BraddonRun 0.310 ConradArrow ConradVictory 0.310 BraddonGolden BraddonPhantom 0.310 ChestertonClub ChestertonWisdom 0.312 ChestertonManAlive ChestertonWisdom 0.312 ConradJim ConradTyphoon 0.313 ChestertonClub ChestertonInnocence 0.313 ChestertonClub ChestertonManAlive 0.314 BraddonGolden BraddonLovels 0.315
As was remarked about the blind-test with Oxquarry1, all the reasoning is based on two
assumptions: (1) the corpus contains several authors and (2) there are, at least, two novels by
each of these authors (this second assumption is not entirely true: there is only one book by
Tressel).
Does tree-classification give a more complete and reliable answer? (Fig. 12)

36
Fig. 12 Tree-classification of Corpus Oxquarry2 using Formula (4) (window size: 20,000
tokens; step: 2,000 tokens).
The confidence index for the whole tree is .97; for all the nodes, this index is greater than
.90 and all the paths are over .80. It is thus possible to believe that the whole tree reproduces,
almost faithfully, the information provided by the original matrix of distance indices, but that
some of the terminal branches should be considered with care. The "problematic" texts
(located in N-NE part of the tree) are also those which are the farthest from the others:
Butler's Erewhon, Orczy's Old Man, Tressel's Ragged Philanthropists, or those which are
relatively far from their "brothers" (other texts by the same author), and relatively near several
others (like Wilde's two novels). None of these problematic texts appears in Table 12 and they
are all joined to the root of the tree or very near it. In other words, the algorithm fails to
classify them. Thus tree-classification must be improved by excluding these problematic texts
from the tree.

37
In addition, the "star-shape" must also be noted. As G. Ledger supposed, the vocabularies
of the majority of these novels are not very different from each other, even if they are by
different authors. One must also admit that the sliding window method erodes, slightly but
significantly, the differences between texts (when used on texts the lengths of which greatly
differ).
But it must be borne in mind that all these drawbacks were predictable given the fact that
the ratio of text lengths in Oxquarry2 was clearly beyond the valid limits of formula (3) and
that this experiment was arranged precisely for this reason.
Given these limitations, this method really neutralises the effect of length differences on
the distance index as can be observed in Fig. 13 (to be compared with the Fig. 6)
Fig. 13 Correlation between the length of each text and its average distance index with all the
others ("sliding window" method:L = 20,000; P = 2,000).
It must also be noted that some books stand apart (on the X-axis): one by Morris
(Dream…), the only book of Tressel, three by Conrad (Almayer, Nostromo, Typhoon), and
one by Butler (Erewhon). Are these books different from the others because of their topics, of
their style? Intertextual distance leads to an interesting question and offers a first possible
response with the help of the "contribution to the distance"…
0
50000
100000
150000
200000
250000
300000
350000
0.34 0.35 0.36 0.37 0.38 0.39 0.40 0.41 0.42
Morris (Dream)
Conrad (Almayer)
Tressel (Ragged)
Conrad (Nostromo)
Conrad (Typhoon)
Butler (Erewhon)Hardy (Wessex)
Distance Index Mean
Length (tokens)Eliot (Middlemarch)
Eliot (Deronda)

38
Conclusions
A necessary pre-condition must be kept in mind. The spelling of all words must be
carefully checked, and a simple rule must be applied to the whole corpus: "one word, one
spelling". This standardisation is necessary in order to be sure that the differences are not
partly "artificial"…
If texts compared are not too different in size, Formula (3) can be used. When that is not
the case, or when more accuracy is needed, the "sliding window" method provides a useful
tool. Further experiments carried out on other texts demonstrate that the "sliding window" is
not generally sensitive to differences of text size and that its results can be linked to a
standardised scale of authorship attribution, like the one presented in the first section of this
paper (for L = 10,000 tokens). In any case, it is preferable not to use these methods when
differences of sizes exceed a ratio of 1:8, and to be very cautious when applying them on texts
whose lengths are under 10,000 tokens.
Even if the notions of "genre", "topics" and "period" are to be more precisely discussed,
these experiments show clearly that, for texts written in the same "genre" by
contemporaneous writers, authorship is almost always the dominant factor.
In addition, the sliding window method offers a useful tool with which to analyse
"collaborative" texts. When a text is known (or ) suspected to have been written by several
hands (e.g. Merriam, 2005), which are the parts by one or other(s) of the potential authors?
Formula (3) and (4) are easy to compute and some interesting characteristics of the two
methods may be pointed out:
— Whole texts are considered and, in the calculations, each word type renders exactly its
frequency weighting in the text without any "pre-selection" or presupposition about
"characteristic" words of each author;
— There is also no prejudging of "sure" or "doubtful" authorship. Given the fact that the
method entails no limitation on the number of texts used, it is possible to take into
consideration all the available ones (on electronic files), subject to the restrictions of spelling
standardisation and of scale ratio cited above.
These two points are important, given the "state of the art" in authorship attribution studies
and the numerous critiques which are addressed to them (for example: Rudman, 1998).
Finally, the combination of intertextual distance with modern classification methods
considerably furthers the single question of authorship attribution. One is now able to answer
some very interesting questions. For example: in a given genre and period, which authors are

39
"neighbours" and which are distant? Which are the words which generated this proximity or
opposition? Here lies a possible answer to Craig's question: "If you can tell authors apart,
have you learned anything about them?" (Craig, 1999)…
Aknowledgments
The author is grateful to Cyril Labbé (Grenoble I University) who wrote the software with
him, to Gerard Ledger for providing the two Corpora Oxquarry and organising the blind-test,
and to Thomas Merriam : he had the idea of applying our methods on English texts, he gave
me a continuous support and most helpful comments and advice, he carefully edited the first
version of this article.
References
Barthélémy Jean-Pierre and Guénoche Alain (1991). Trees and Proximity Representations, New York, Wiley, 1991).
Burrows John (2002). "“Delta”: a Measure of Stylistic Difference and a Guide to Likely Authorship". Literary and Linguistic Computing. 17-3, 267-287.
Burrows John (2003). "Questions of Authorship: Attribution and Beyond". Computers and the Humanities. 37-1, 1-32.
Craig Hugh (1999), "Authorial Attribution and Computational Stylistics: If You Can Tell Authors apart, Have You Learned anything about them?". Literary and Linguistic Computing. 14-1. p 103-113.
Eliott Ward E. Y. and Valenza Robert J. (2001). "Smoking Guns and Silver Bullets: Could John Ford Have Written the Funeral Elegy ?". Literary and Linguistic Computing. 16-3, 205-232.
Hockey Suzan and Martin Jeremy (1988). OCP Users' Manual. Oxford. Oxford University Computing Service.
Holmes David I. (1995). "The Federalist revisited : new directions in autorship attribution". Literary and Linguistic Computing. 10-2. p 111-127.
Hoover David L. (2001). "Statistical Stylistics and Authorship Attribution : an Empirical Investigation". Literary and Linguistic Computing. 16-4. November 2001. p. 421-444.
Labbé Cyril and Labbé Dominique (2001). "Inter-Textual Distance and Authorship Attribution Corneille and Molière". Journal of Quantitative Linguistics. 8-3, 213-231.
Labbé Cyril and Labbé Dominique (2003). "La distance intertextuelle". Corpus. 2, 95-118.
Labbé Cyril and Labbé Dominique (2005). "A tool for Literary Studies. Inter-textual Distance and Tree-Classification". To be published in Literary and Linguistic Computing.
Ledger Gerard R. (1995). "An Exploration of Differences in the Pauline Epistles", Literary and Linguistic Computing. 10-2. 1995. p. 85-97.

40
Love Harold (2002). Attributing Authorship: an Introduction. Cambridge. Cambridge University Press.
Luong Xuan (1988). Méthodes d'analyse arborée. Algorithmes, applications. Thèse pour le doctorat ès sciences. Université de Paris V.
Merriam Thomas (2002). "Intertextual Distances between Shakespeare Plays, with Special Reference to Henry V (verse)". Journal of Quantitative Linguistics. 9-3, 260-273.
Merriam Thomas (2003a). "An Application of Authorship Attribution by Intertextual Distance in English". Corpus. 2, p 167-182.
Merriam Thomas (2003b). "Intertextual Distances, Three Authors". Literary and Linguistic Computing, 18-4, 379-388.
Merriam Thomas (2005). The Identity of Shakespeare in Henry VIII. The Renaissance Institute, Tokyo.
Rudman Joseph (1998), "The State of Authorship Attribution Studies: Some Problems and Solutions", Computers and the Humanities, p 351-365.
Rulmann Mathieu, Analyse arborée. Représentation arborée par la méthode des groupements. Grenoble, Polytech'Grenoble et Cerat-IEP, août 2003.

41
Appendix 1 "Corpus Oxquarry1" (all excerpt are 10,000 tokens long)
Except
Set 1 Author
Titles
Chap.
Except
Set 2 Author
Titles
Chap.
A Hardy Jude I A Butler Erewhon revisit. XIV
B Butler Erewhon revisit. II B Morris Dream of JB
C Morris News XIII C Tressel Ragged TP
D Stevenson Catrionae V D Hardy Jude
E Butler Erewhon revisit. XVIII E Stevenson Ballantrae IV
F Stevenson Ballantrae II F Hardy Wessex Tales
G Conrad Lord Jim XIV G Orczy Elusive P VII
H Hardy Madding III H Conrad Lord Jim XXI
I Orczy Scarlet P I I Morris News VIII
J Morris Dream of JB VII J Hardy Well beloved I
K Stevenson Catrionae X K Conrad Almayer VI
L Hardy Jude VII L Hardy Well beloved XII
M Orczy Scarlet P XIV M Morris News XIX
N Stevenson Ballantrae V N Conrad Almayer XI
O Conrad Lord Jim VII O Forster Room with view I
P Chesterton Man who was I P Forster Room with view IV
Q Butler Erewhon revisit. VII Q Conrad Almayer IX
R Chesterton Man who was VII R Stevenson Catrionae XVI
S Morris News I S Hardy Madding X
T Conrad Almayer II T Hardy Well beloved 2 VI
U Orczy Elusive P I U Chesterton Man who was III
V Conrad Lord Jim II V Forster Room with view VIII
W Orczy Elusive P XIV W Stevenson Catrionae I
X Hardy Wessex Tales X Hardy Well beloved VIII
Y Tressel Ragged TP Y Orczy Scarlet P VII
Z Tressel Ragged TP Z Hardy Madding XVIII

42
Appendix 2.1 Lowest intertextual distance indices ranked by ascending values (Corpus Oxquarry1)
Rank Pair of texts Index
1 1D (StevensonCatri) - 2W (StevensonCatri) 0.259 2 1N (StevensonBall) - 2E (StevensonBall) 0.265 3 1F (StevensonBall) - 2E (StevensonBall) 0.267 4 1K (StevensonCatri) - 2W (StevensonCatri) 0.277 5 1S (MorrisNews) - 2M (MorrisNews) 0.281 6 2N (ConradAlma) - 2Q (ConradAlma) 0.283 7 2L (HardyWell) - 2T (HardyWell) 0.283 8 1C (MorrisNews) - 2I (MorrisNews) 0.288 9 2J (HardyWell) - 2L (HardyWell) 0.289 10 1D (StevensonCatri) - 1K (StevensonCatri) 0.291 11 1E (ButlerErew) - 1Q (ButlerErew) 0.291 12 2R (StevensonCatri) - 2W (StevensonCatri) 0.291 13 2J (HardyWell) - 2T (HardyWell) 0.293 14 1F (StevensonBall) - 1N (StevensonBall) 0.294 15 2I (MorrisNews) - 2M (MorrisNews) 0.297 16 1D (StevensonCatri) - 2R (StevensonCatri) 0.302 17 2O (ForsterRoom) - 2P (ForsterRoom) 0.302 18 1S (MorrisNews) - 2I (MorrisNews) 0.303 19 1B (ButlerErew) - 1Q (ButlerErew) 0.304 20 1Z (TresselRagg) - 2C (TresselRagg) 0.304 21 2J (HardyWell) - 2X (HardyWell) 0.306 22 1F (StevensonBall) - 2R (StevensonCatri) 0.307 23 2E (StevensonBall) - 2R (StevensonCatri) 0.309 24 1L (HardyJude) - 2J (HardyWell) 0.310 25 1B (ButlerErew) - 2A (ButlerErew) 0.310 26 1J (MorrisDream) - 2B (MorrisDream) 0.311 27 1K (StevensonCatri) - 2R (StevensonCatri) 0.311 28 1P (ChestertonMan) - 2U (ChestertonMan) 0.312 29 2L (HardyWell) - 2X (HardyWell) 0.312 30 2T (HardyWell) - 2X (HardyWell) 0.313 31 1B (ButlerErew) - 1E (ButlerErew) 0.314 32 1L (HardyJude) - 2D (HardyJude) 0.314 33 1L (HardyJude) - 2L (HardyWell) 0.314 34 1M (Scar) - 2Y (OrczyScar) 0.314 35 1X (HardyWess) - 2L (HardyWell) 0.314 36 1M (Scar) - 1W (OrczyElus) 0.315 37 2O (ForsterRoom) - 2V (ForsterRoom) 0.315 38 1O (ConradLordJ) - 2H (ConradLordJ) 0.317 39 1P (ChestertonMan) - 1R (ChestertonMan) 0.317 40 1G (ConradLordJ) - 1O (ConradLordJ) 0.318 41 1H (HardyMadd) - 2Z (HardyMadd) 0.318 42 1Q (ButlerErew) - 2A (ButlerErew) 0.318 43 1R (ChestertonMan) - 2U (ChestertonMan) 0.319

43
Rank Pair of texts Index 44 1D (StevensonCatri) - 1N (StevensonBall) 0.319 45 1D (StevensonCatri) - 2E (StevensonBall) 0.320 46 1X (HardyWess) - 2J (HardyWell) 0.320 47 1N (StevensonBall) - 2R (StevensonCatri) 0.320 48 2F (HardyWess) - 2T (HardyWell) 0.321 49 2D (HardyJude) - 2J (HardyWell) 0.322 50 2K (ConradAlma) - 2Q (ConradAlma) 0.323 51 2D (HardyJude) - 2L (HardyWell) 0.323 52 1H (HardyMadd) - 2S (HardyMadd) 0.325 53 1A (HardyJude) - 2D (HardyJude) 0.325 54 1W (OrczyElus) - 2G (OrczyElus) 0.325 55 1X (HardyWess) - 2T (HardyWell) 0.326 56 1F (StevensonBall) - 1K (StevensonCatri) 0.326 57 2S (HardyMadd) - 2Z (HardyMadd) 0.326 58 1X (HardyWess) - 2X (HardyWell) 0.327 59 1K (StevensonCatri) - 1N (StevensonBall) 0.327 60 2K (ConradAlma) - 2N (ConradAlma) 0.327 61 1L (HardyJude) - 2T (HardyWell) 0.329 62 2E (StevensonBall) - 2W (StevensonCatri) 0.329 63 1E (ButlerErew) - 2A (ButlerErew) 0.330 64 1L (HardyJude) - 1X (HardyWess) 0.330 65 2D (HardyJude) - 2T (HardyWell) 0.330 66 1G (ConradLordJ) - 2H (ConradLordJ) 0.330 67 1F (StevensonBall) - 2W (StevensonCatri) 0.330 68 1X (HardyWess) - 2F (HardyWess) 0.331 69 2F (HardyWess) - 2J (HardyWell) 0.331 70 1N (StevensonBall) - 2W (StevensonCatri) 0.332 71 1D (StevensonCatri) - 1F (StevensonBall) 0.333 72 1L (HardyJude) - 2F (HardyWess) 0.333 73 1H (HardyMadd) - 2J (HardyWell) 0.335 74 2D (HardyJude) - 2X (HardyWell) 0.335 75 1Y (TresselRagg) - 1Z (TresselRagg) 0.337 76 1H (HardyMadd) - 2T (HardyWell) 0.337 77 2F (HardyWess) - 2L (HardyWell) 0.338 78 1K (StevensonCatri) - 2E (StevensonBall) 0.338 79 2P (ForsterRoom) - 2V (ForsterRoom) 0.338 80 1X (HardyWess) - 2D (HardyJude) 0.339 81 1H (HardyMadd) - 2D (HardyJude) 0.340 82 1H (HardyMadd) - 2L (HardyWell) 0.340 83 1H (HardyMadd) - 1L (HardyJude) 0.344 84 1L (HardyJude) - 2X (HardyWell) 0.344 85 1W (OrczyElus) - 2Y (OrczyScar) 0.344 86 1K (StevensonCatri) - 1S (MorrisNews) 0.349

44
Appendix 2.2 Pairs of texts of which the inter-textual distance indices are between .35 and .36
(bold types : same authorship)
Rank Pairs of texts Indices 87 1S (MorrisNews) - 2W (StevensonCatri) 0.350 88 1A (HardyJude) - 1L (HardyJude) 0.350 89 2G (OrczyElus) - 2Y (OrczyScar) 0.350 90 1A (HardyJude) - 2J (HardyWell) 0.350 91 1Y (TresselRagg) - 2C (TresselRagg) 0.351 92 1F (StevensonBall) - 1G (ConradLordJ) 0.351 93 1H (HardyMadd) - 2F (HardyWess) 0.351 94 1C (MorrisNews) - 2M (MorrisNews) 0.351 95 2J (HardyWell) - 2Z (HardyMadd) 0.351 96 1M (OrczyScar) - 2G (OrczyElus) 0.352 97 1A (HardyJude) - 1H (HardyMadd) 0.353 98 1C (MorrisNews) - 1S (MorrisNews) 0.353 99 1L (HardyJude) - 1Z (TresselRagg) 0.353 100 1L (HardyJude) - 2S (HardyMadd) 0.354 101 2F (HardyWess) - 2X (HardyWell) 0.354 102 1A (HardyJude) - 2T (HardyWell) 0.355 103 1Q (ButlerErew) - 2J (HardyWell) 0.355 104 2T (HardyWell) - 2Z (HardyMadd) 0.355 105 1H (HardyMadd) - 1X (HardyWess) 0.355 106 1G (ConradLordJ) - 1N (StevensonBall) 0.356 107 1H (HardyMadd) - 2X (HardyWell) 0.357 108 2J (HardyWell) - 2S (HardyMadd) 0.357 109 1G (ConradLordJ) - 2E (StevensonBall) 0.357 110 1O (ConradLordJ) - 1V (ConradLordJ) 0.357 111 1Q (ButlerErew) - 2L (HardyWell) 0.357 112 1S (MorrisNews) - 2R (StevensonCatri) 0.357 113 1T (ConradAlma) - 2K (ConradAlma) 0.357 114 1F (StevensonBall) - 1S (MorrisNews) 0.357 115 2D (HardyJude) - 2Z (HardyMadd) 0.358 116 1F (StevensonBall) - 2H (ConradLordJ) 0.358 117 1A (HardyJude) - 2L (HardyWell) 0.358 118 2D (HardyJude) - 2H (ConradLordJ) 0.359 119 1A (HardyJude) - 1X (HardyWess) 0.359 120 2H (ConradLordJ) - 2X (HardyWell) 0.359 121 1X (HardyWess) - 2Z (HardyMadd) 0.359 122 2D (HardyJude) - 2F (HardyWess) 0.359 123 2D (HardyJude) - 2S (HardyMadd) 0.360 124 2F (HardyWess) - 2S (HardyMadd) 0.360 125 1L (HardyJude) - 1Q (ButlerErew) 0.360 126 1A (HardyJude) - 2X (HardyWell) 0.360 127 2L (HardyWell) - 2Z (HardyMadd) 0.360

45
Appendix 2.3 Pairs of excerpts by a same author separated by intertextual distance indices over .36
Rank Pairs of texts Indices
134 2F (HardyWess) - 2Z (HardyMadd) 0.363
139 1I (OrczyScar) - 2Y (OrczyScar) 0.364
143 2L (HardyWell) - 2S (HardyMadd) 0.365
144 1L (HardyJude) - 2Z (HardyMadd) 0.365
145 2S (HardyMadd) - 2T (HardyWell) 0.365
151 1X (HardyWess) - 2S (HardyMadd) 0.366
153 1G (ConradLordJ) - 1V (ConradLordJ) 0.367
157 1A (HardyJude) - 2F (HardyWess) 0.367
171 1U (OrczyElus) - 2Y (OrczyScar) 0.370
172 2X (HardyWell) - 2Z (HardyMadd) 0.370
179 1J (MorrisDream) - 2I (MorrisNews) 0.371
186 1V (ConradLordJ) - 2H (ConradLordJ) 0.373
187 1F (StevensonBall) - 1R (ChestertonManW) 0.373
209 1U (OrczyElus) - 1W (OrczyElus) 0.376
213 1A (HardyJude) - 2Z (HardyMadd) 0.376
224 1A (HardyJude) - 2S (HardyMadd) 0.378
229 1S (MorrisNews) - 2B (MorrisDream) 0.378
233 1C (MorrisNews) - 1J (MorrisDream) 0.379
235 1V (ConradLordJ) - 2N (ConradAlma) 0.379
253 1J (MorrisDream) - 2M (MorrisNews) 0.380
256 1I (OrczyScar) - 1U (OrczyElus) 0.381
261 1J (MorrisDream) - 1S (MorrisNews) 0.381
265 1U (OrczyElus) - 2G (OrczyElus) 0.381
274 2H (ConradLordJ) - 2N (ConradAlma) 0.382
305 1T (ConradAlma) - 2Q (ConradAlma) 0.384
307 1O (ConradLordJ) - 2N (ConradAlma) 0.385
343 1O (ConradLordJ) - 2Q (ConradAlma) 0.387
365 1V (ConradLordJ) - 2K (ConradAlma) 0.389
408 2S (HardyMadd) - 2X (HardyWell) 0.391
420 1T (ConradAlma) - 2N (ConradAlma) 0.392
463 1M (OrczyScar) - 1U (OrczyElus) 0.395
The remaining 863 indices (over .395) are all between excerpts by different authors

46
Appendix 2.4
Pairs of excerpts separated by intertextual distance indices over .48
1301 1N (StevensonBall) - 1T (ConradAlma) 0.481
1302 2K (ConradAlma) - 2V (ForsterRoom) 0.483
1303 1D (StevensonCatri) - 1V (ConradLordJ) 0.483
1304 1T (ConradAlma) - 1Z (TresselRagg) 0.484
1305 1T (ConradAlma) - 2R (StevensonCatri) 0.486
1306 2K (ConradAlma) - 2W (StevensonCatri) 0.486
1307 1D (StevensonCatri) - 2K (ConradAlma) 0.486
1308 1J (MorrisDream) - 2K (ConradAlma) 0.488
1309 1J (MorrisDream) - 1V (ConradLordJ) 0.489
1310 1T (ConradAlma) - 2M (MorrisNews) 0.490
1311 1T (ConradAlma) - 2O (ForsterRoom) 0.490
1312 1C (MorrisNews) - 1T (ConradAlma) 0.491
1313 1T (ConradAlma) - 2A (ButlerErew) 0.491
1314 1T (ConradAlma) - 2B (MorrisDream) 0.492
1315 1T (ConradAlma) - 2C (TresselRagg) 0.494
1316 1T (ConradAlma) - 2I (MorrisNews) 0.496
1317 1S (MorrisNews) - 1T (ConradAlma) 0.496
1318 1B (ButlerErew) - 1T (ConradAlma) 0.497
1319 1Q (ButlerErew) - 1T (ConradAlma) 0.499
1320 1T (ConradAlma) - 2V (ForsterRoom) 0.500
1321 1J (MorrisDream) - 2G (OrczyElus) 0.503
1322 1E (ButlerErew) - 1T (ConradAlma) 0.508
1323 1K (StevensonCatri) - 1T (ConradAlma) 0.508
1324 1D (StevensonCatri) - 1T (ConradAlma) 0.511
1325 1T (ConradAlma) - 2W (StevensonCatri) 0.513
1326 1J (MorrisDream) - 1T (ConradAlma) 0.525

47
Appendix 3. Corpus Oxquarry 2
Author Title Length (tokens)
Vocabulary (types)
Braddon Mary Fenton’s Quest 172,952 10,154 Braddon Mary The Golden Calf 160,172 12,490 Braddon Mary London Pride 157,238 13,498 Braddon Mary The Lovels of Arden 182,428 11,832 Braddon Mary Phantom Fortune 178,994 12,886 Braddon Mary Run to Earth 185,627 10,635 Butler Samuel Erewhon 83,905 7,886 Butler Samuel Erewhon Revisited 84,853 6,706 Butler Samuel The Way of all Flesh 161,847 10,611 Chesterton G. K. The Bell and the Cross 79,445 8,126 Chesterton G. K. The Club of Queer Trades 44,017 5,663 Chesterton G. K. The Innocence of Father Brown 78,902 8,169 Chesterton G. K. Man Alive 57,553 7,492 Chesterton G. K. The Man who was Thursday 58,066 6,494 Chesterton G. K. Tremendous Trifles 55,969 6,821 Chesterton G. K. The Wisdom of Father Brown 71,588 8,124 Conrad Joseph Almayer's folly 62,575 6,483 Conrad Joseph The Arrow of Gold 107,193 8,663 Conrad Joseph Heart of Darkness 20,243 4,021 Conrad Joseph Lord Jim 128,685 10,970 Conrad Joseph Nostromo 170,103 12,805 Conrad Joseph Typhoon 31,024 5,009 Conrad Joseph Victory 117,319 9,408 Eliot George Daniel Deronda 309,013 15,829 Eliot George The Mill on the Floss 206,830 12,805 Eliot George Middlemarch 316,156 16,369 Forster E. M. Where Angels Fear to Tread 49,449 5,636 Forster E. M. Howard’s End 108,546 9,367 Forster E. M. The Longest Journey 93,986 8,478 Forster E. M. A Room with a View 66,456 6,920 Hardy Thomas Beloved 62,839 7,191 Hardy Thomas Jude 143,996 11,294 Hardy Thomas Far from the madding crowd 137,879 11,958 Hardy Thomas Wessex tales 80,694 8,231 Morris William Dream 31,398 3,661 Morris William News from nowhere 77,721 6,682 Orczy Baroness E. The Elusive Pimpernel 83,314 8,114 Orczy Baroness E. The Old Man in the Corner 69,591 6,365 Orczy Baroness E. League of the Scarlet Pimpernel 75,208 7,151 Stevenson Robert L. Ballantrae 87,156 7,694 Stevenson Robert L. Catronia 101,012 7,940 Stevenson Robert L. Doctor Jekyll 25,646 4,012 Stevenson Robert L. Kidnapped 81,706 6,829 Stevenson Robert L. Treasure Island 67,883 6,143 Tressel Robert The Ragged Trousered Philanthropists 251,159 12,423 Wilde Oscar The Picture of Dorian Gray 54,604 5,612 Wilde Oscar Lord Arthur Savilles Crimes 39,311 5,351