Embed Size (px)
Citation preview
This is an electronic reprint of the original article.This reprint may differ from the original in pagination and typographic detail.
Powered by TCPDF (www.tcpdf.org)
This material is protected by copyright and other intellectual property rights, and duplication or sale of all or part of any of the repository collections is not permitted, except that material may be duplicated by you for your research use or educational purposes in electronic or print form. You must obtain permission for any other use. Electronic or print copies may not be offered, whether for sale or otherwise to anyone who is not an authorised user.
Tikanmäki, Maria; Sainio, PanuExperiments on friction of dry and wet ice
Published in:Cold Regions Science and Technology
DOI:10.1016/j.coldregions.2020.102990
Published: 01/04/2020
Document VersionPublisher's PDF, also known as Version of record
Please cite the original version:Tikanmäki, M., & Sainio, P. (2020). Experiments on friction of dry and wet ice. Cold Regions Science andTechnology, 172, [102990]. https://doi.org/10.1016/j.coldregions.2020.102990
Contents lists available at ScienceDirect
Cold Regions Science and Technology
journal homepage: www.elsevier.com/locate/coldregions
Experiments on friction of dry and wet iceMaria Tikanmäkia,⁎, Panu Sainioba VTT Technical Research Centre of Finland Ltd, FinlandbAalto University, Finland
A R T I C L E I N F O
Keywords:IceFrictionSlidingWet ice
A B S T R A C T
Experiments on ice-on-ice friction both with and without water on the ice surface are presented. The experimentswere conducted at −9.4 °C on dry ice and at −2.8 °C on both wet and dry ice. The sliding speed was variedbetween 6 and 105mm/s. The effect of abrasion of ice surfaces was found to be an important phenomenonregarding the friction coefficient. Related to abrasion, the friction coefficient increased significantly in repetitiveexperiments especially at warm temperature. Adding water on the ice surface had only a minor effect on thefriction coefficient at sliding speed above 10mm/s. However, at lower speeds, the friction coefficient on wet icewas significantly higher than on dry ice.
1. Introduction
The friction of ice is an important phenomenon for example in car tiredesign and various winter sports. Friction between ice and ice is animportant factor for example when estimating ice forces against ships andoffshore structures (Tikanmäki et al., 2011). The friction of ice has beeninvestigated both theoretically (e.g. Bäurle et al., 2007; Lozowski et al.,2013; Makkonen and Tikanmäki, 2014) and experimentally. Experimentalresearch has been conducted on wide range of temperatures and speedsboth using natural ice (e.g. Pritchard et al., 2012; Sukhorukov and Løset,2013) and in laboratory. In laboratory studies, both rotational and lineardevices (e.g. Oksanen and Keinonen, 1982; Kennedy et al., 2000; Marmoet al., 2005) have been used.
In field studies, the experimental setup might better represent thenatural behavior of ice. However, in field studies, reaching comparablecircumstances in terms of environmental variables and the homo-geneity of ice is more difficult, and the reproducibility of results suffersfrom that fact. On laboratory-scale, it is more feasible to controlenvironmental variables and produce repeatability in ice surfaces.When designing any experimental setup for ice friction it has to beconsidered that the layout of the experimental arrangement supportscatching the phenomenon of interest. For example, with a rotationalfriction device one may warm up the ice sample to an unknowntemperature thus making the interpretation of the results difficult(Makkonen and Tikanmäki, 2014).
In the interaction process between floating ice and an offshorestructure, temperature at the bottom of the ice sheet is at the meltingtemperature of ice, and the sliding may happen both above and below
the waterline. In this study, the emphasis is on friction between two icesurfaces in warm temperatures, with and without additional waterpoured at the surface in contact. For simplicity, the terms wet and dryfriction, respectively, are used in this paper even though melted wateris assumed to be always present at the contact in the conditions of thisstudy. The effect of salinity on ice-ice friction experiments has beenshown to be minor (Kennedy et al., 2000) and thus, for simplicity, weconcentrate in freshwater ice friction in this study.
Some studies with additional water on ice or with melting iceconducted both in a laboratory and at the field have been made before.Sukhorukov and Løset (2013) did field experiments on natural sea ice inthe Barents Sea and in fjords of Spitsbergen. They did only limitedamount of experiments on wet ice but their results indicate that thedifference between dry and wet ice surfaces were minor. Jones et al.(1994) made laboratory experiments on melting ice on sliding speeds of0.1–400mm/s. In their experiments, the speed dependence between iceand other materials was not straightforward and varied betweendifferent materials but the lowest values of the friction coefficient wereachieved at the lowest speeds and the highest values were achieved atthe highest or intermediate speeds. This differs from the ice-ice frictioncoefficients measured around −10 °C summarized by Maeno andArakawa (2004). In their summary, the friction coefficients on the samesliding speed interval were decreasing with increasing speed. Takinginto account the discrepancy in these results more experiments areneeded to build precise understanding of ice-ice friction on wet ice andat temperatures close to the melting point of ice.
In following, experimental setup and results of the ice-ice frictionexperiments performed at −2.8 °C and− 9.4 °C are presented. At
https://doi.org/10.1016/j.coldregions.2020.102990Received 17 April 2019; Received in revised form 24 October 2019; Accepted 15 January 2020
⁎ Corresponding author at: VTT Technical Research Centre of Finland Ltd, P.O. Box 1000, FI-02044 VTT, Finland.E-mail address: [email protected] (M. Tikanmäki).
Cold Regions Science and Technology 172 (2020) 102990
Available online 16 January 20200165-232X/ © 2020 The Authors. Published by Elsevier B.V. This is an open access article under the CC BY license (http://creativecommons.org/licenses/BY/4.0/).
T
−2.8 °C, the experiments were performed both on dry and wet ice.
2. Experimental setup
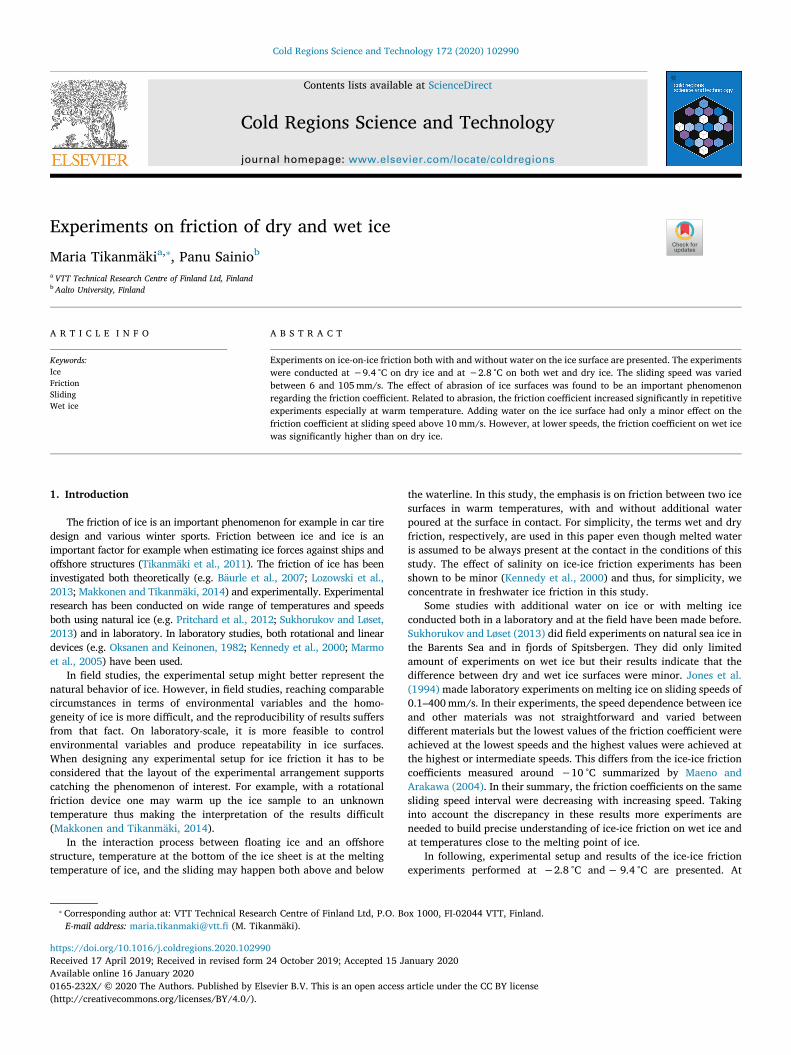
The experiments were performed on a mini-μ-road (MMR) in theAalto University. MMR is shown in Fig. 1. MMR consists of an icesurface where a sample is slid linearly. The linear motion of the deviceis important to notice here since in rotational devices frictional heatingof ice might be present and cause misinterpretations as discussed above(Makkonen and Tikanmäki, 2014). MMR is located in a cold room withthick brick and concrete structures making the temperature controlstable. Details of MMR can be found in Rantonen et al. (2012).
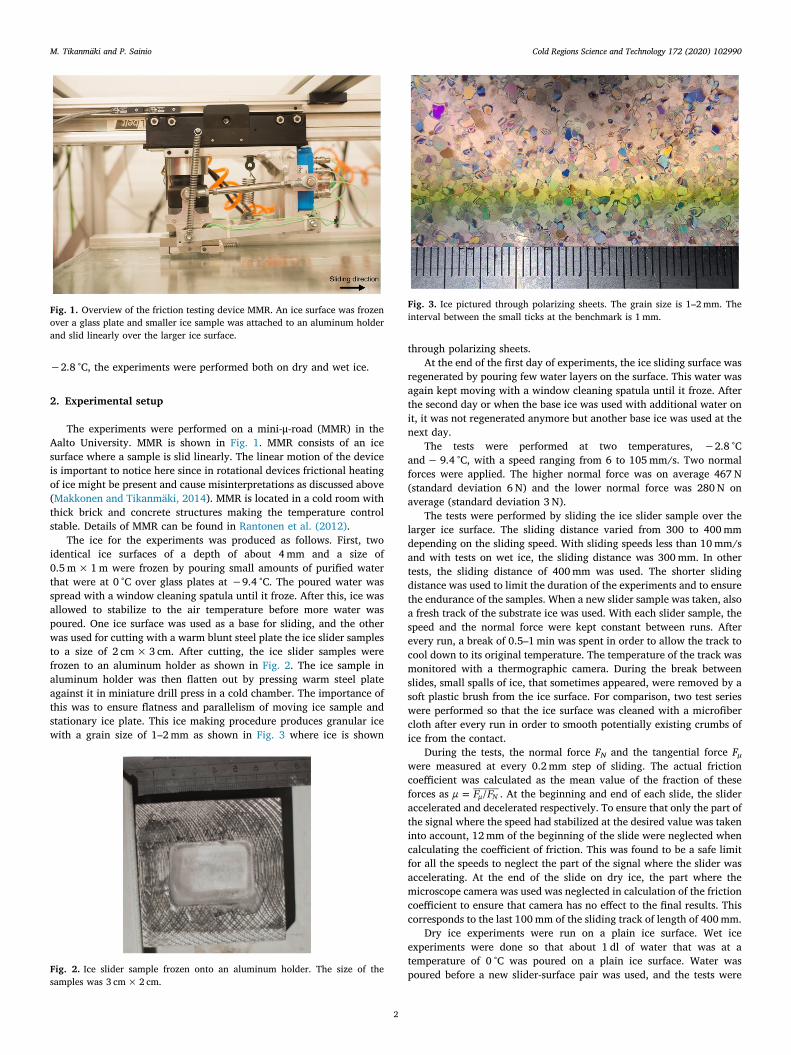
The ice for the experiments was produced as follows. First, twoidentical ice surfaces of a depth of about 4mm and a size of0.5 m×1m were frozen by pouring small amounts of purified waterthat were at 0 °C over glass plates at −9.4 °C. The poured water wasspread with a window cleaning spatula until it froze. After this, ice wasallowed to stabilize to the air temperature before more water waspoured. One ice surface was used as a base for sliding, and the otherwas used for cutting with a warm blunt steel plate the ice slider samplesto a size of 2 cm×3 cm. After cutting, the ice slider samples werefrozen to an aluminum holder as shown in Fig. 2. The ice sample inaluminum holder was then flatten out by pressing warm steel plateagainst it in miniature drill press in a cold chamber. The importance ofthis was to ensure flatness and parallelism of moving ice sample andstationary ice plate. This ice making procedure produces granular icewith a grain size of 1–2mm as shown in Fig. 3 where ice is shown
through polarizing sheets.At the end of the first day of experiments, the ice sliding surface was
regenerated by pouring few water layers on the surface. This water wasagain kept moving with a window cleaning spatula until it froze. Afterthe second day or when the base ice was used with additional water onit, it was not regenerated anymore but another base ice was used at thenext day.
The tests were performed at two temperatures, −2.8 °Cand− 9.4 °C, with a speed ranging from 6 to 105mm/s. Two normalforces were applied. The higher normal force was on average 467 N(standard deviation 6 N) and the lower normal force was 280 N onaverage (standard deviation 3 N).
The tests were performed by sliding the ice slider sample over thelarger ice surface. The sliding distance varied from 300 to 400mmdepending on the sliding speed. With sliding speeds less than 10mm/sand with tests on wet ice, the sliding distance was 300mm. In othertests, the sliding distance of 400mm was used. The shorter slidingdistance was used to limit the duration of the experiments and to ensurethe endurance of the samples. When a new slider sample was taken, alsoa fresh track of the substrate ice was used. With each slider sample, thespeed and the normal force were kept constant between runs. Afterevery run, a break of 0.5–1min was spent in order to allow the track tocool down to its original temperature. The temperature of the track wasmonitored with a thermographic camera. During the break betweenslides, small spalls of ice, that sometimes appeared, were removed by asoft plastic brush from the ice surface. For comparison, two test serieswere performed so that the ice surface was cleaned with a microfibercloth after every run in order to smooth potentially existing crumbs ofice from the contact.
During the tests, the normal force FN and the tangential force Fμwere measured at every 0.2mm step of sliding. The actual frictioncoefficient was calculated as the mean value of the fraction of theseforces as =µ F F/µ N . At the beginning and end of each slide, the slideraccelerated and decelerated respectively. To ensure that only the part ofthe signal where the speed had stabilized at the desired value was takeninto account, 12mm of the beginning of the slide were neglected whencalculating the coefficient of friction. This was found to be a safe limitfor all the speeds to neglect the part of the signal where the slider wasaccelerating. At the end of the slide on dry ice, the part where themicroscope camera was used was neglected in calculation of the frictioncoefficient to ensure that camera has no effect to the final results. Thiscorresponds to the last 100mm of the sliding track of length of 400mm.
Dry ice experiments were run on a plain ice surface. Wet iceexperiments were done so that about 1 dl of water that was at atemperature of 0 °C was poured on a plain ice surface. Water waspoured before a new slider-surface pair was used, and the tests were
Fig. 1. Overview of the friction testing device MMR. An ice surface was frozenover a glass plate and smaller ice sample was attached to an aluminum holderand slid linearly over the larger ice surface.
Fig. 2. Ice slider sample frozen onto an aluminum holder. The size of thesamples was 3 cm×2 cm.
Fig. 3. Ice pictured through polarizing sheets. The grain size is 1–2mm. Theinterval between the small ticks at the benchmark is 1mm.
M. Tikanmäki and P. Sainio Cold Regions Science and Technology 172 (2020) 102990
2
repeated without a break between subsequent runs. Water was keptmoving with a rubber spatula to prevent the entire water film fromfreezing, and new water was poured on the surface when needed.
The evolution of the sliding surface was monitored by taking videosand photos below and above the glass plate with a standard camera,and photos of the sliding track were taken with a microscope camera.The microscope camera was not used to take photos of wet ice.
3. Theory
The results from the first runs are compared to the predictions of themodel presented by Makkonen and Tikanmäki (2014). The model presentsfriction coefficient between two ice surfaces at the temperatures andvelocities used here as
= + +µa H
T kcv
T kc C vL12
12
( ) w2
(1)
where a is the width of the contact, ∆T the difference between the meltingtemperature of ice and the original temperature, k the thermal con-ductivity of ice, c the specific thermal capacity of ice, ρ the density of ice, Can iteratively determined factor describing the proportion of water notbeing squeezed out of the contact interface, η the viscosity of water, L thelatent heat of melting of ice, and ρw the density of water. The contact widtha is supposed to equal to 1mm.
4. Results
An example of the normal and tangential forces and sliding speedsignals as a function of the sliding distance on dry friction case areshown in Fig. 4. In this case, the temperature was −2.8 °C and theaverage sliding speed was 47mm/s.
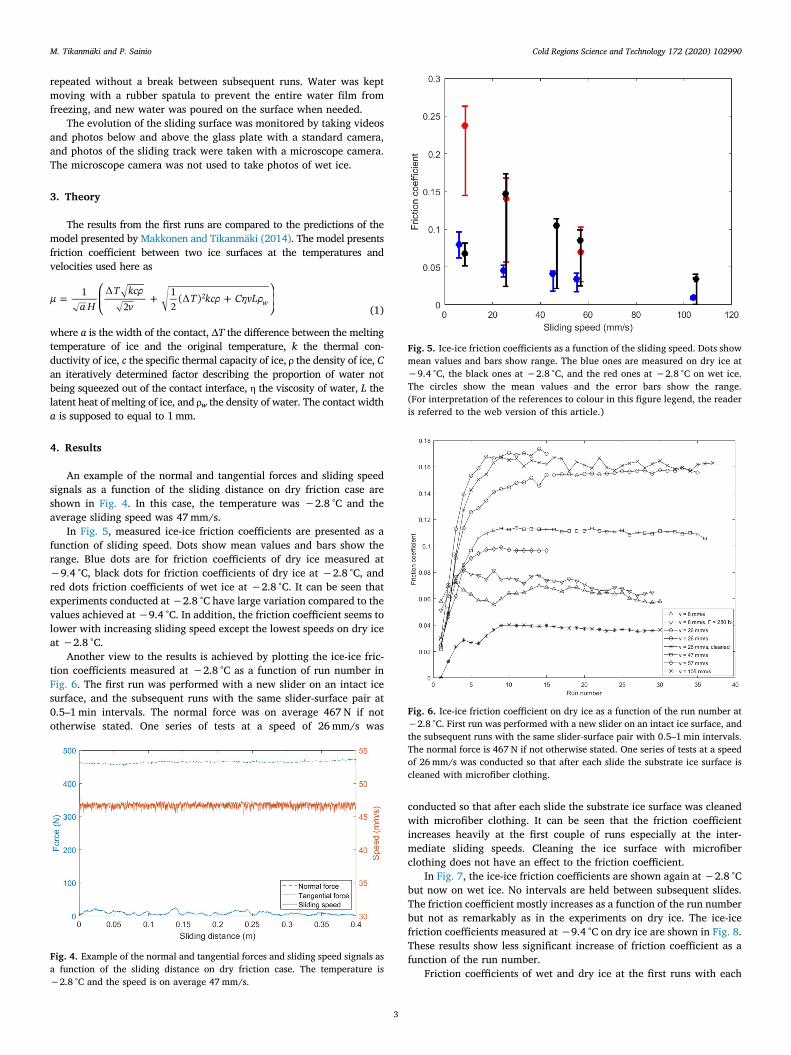
In Fig. 5, measured ice-ice friction coefficients are presented as afunction of sliding speed. Dots show mean values and bars show therange. Blue dots are for friction coefficients of dry ice measured at−9.4 °C, black dots for friction coefficients of dry ice at −2.8 °C, andred dots friction coefficients of wet ice at −2.8 °C. It can be seen thatexperiments conducted at −2.8 °C have large variation compared to thevalues achieved at −9.4 °C. In addition, the friction coefficient seems tolower with increasing sliding speed except the lowest speeds on dry iceat −2.8 °C.
Another view to the results is achieved by plotting the ice-ice fric-tion coefficients measured at −2.8 °C as a function of run number inFig. 6. The first run was performed with a new slider on an intact icesurface, and the subsequent runs with the same slider-surface pair at0.5–1min intervals. The normal force was on average 467 N if nototherwise stated. One series of tests at a speed of 26mm/s was
conducted so that after each slide the substrate ice surface was cleanedwith microfiber clothing. It can be seen that the friction coefficientincreases heavily at the first couple of runs especially at the inter-mediate sliding speeds. Cleaning the ice surface with microfiberclothing does not have an effect to the friction coefficient.
In Fig. 7, the ice-ice friction coefficients are shown again at −2.8 °Cbut now on wet ice. No intervals are held between subsequent slides.The friction coefficient mostly increases as a function of the run numberbut not as remarkably as in the experiments on dry ice. The ice-icefriction coefficients measured at −9.4 °C on dry ice are shown in Fig. 8.These results show less significant increase of friction coefficient as afunction of the run number.
Friction coefficients of wet and dry ice at the first runs with eachFig. 4. Example of the normal and tangential forces and sliding speed signals asa function of the sliding distance on dry friction case. The temperature is−2.8 °C and the speed is on average 47mm/s.
Fig. 5. Ice-ice friction coefficients as a function of the sliding speed. Dots showmean values and bars show range. The blue ones are measured on dry ice at−9.4 °C, the black ones at −2.8 °C, and the red ones at −2.8 °C on wet ice.The circles show the mean values and the error bars show the range.(For interpretation of the references to colour in this figure legend, the readeris referred to the web version of this article.)
Fig. 6. Ice-ice friction coefficient on dry ice as a function of the run number at−2.8 °C. First run was performed with a new slider on an intact ice surface, andthe subsequent runs with the same slider-surface pair with 0.5–1min intervals.The normal force is 467 N if not otherwise stated. One series of tests at a speedof 26mm/s was conducted so that after each slide the substrate ice surface iscleaned with microfiber clothing.
M. Tikanmäki and P. Sainio Cold Regions Science and Technology 172 (2020) 102990
3
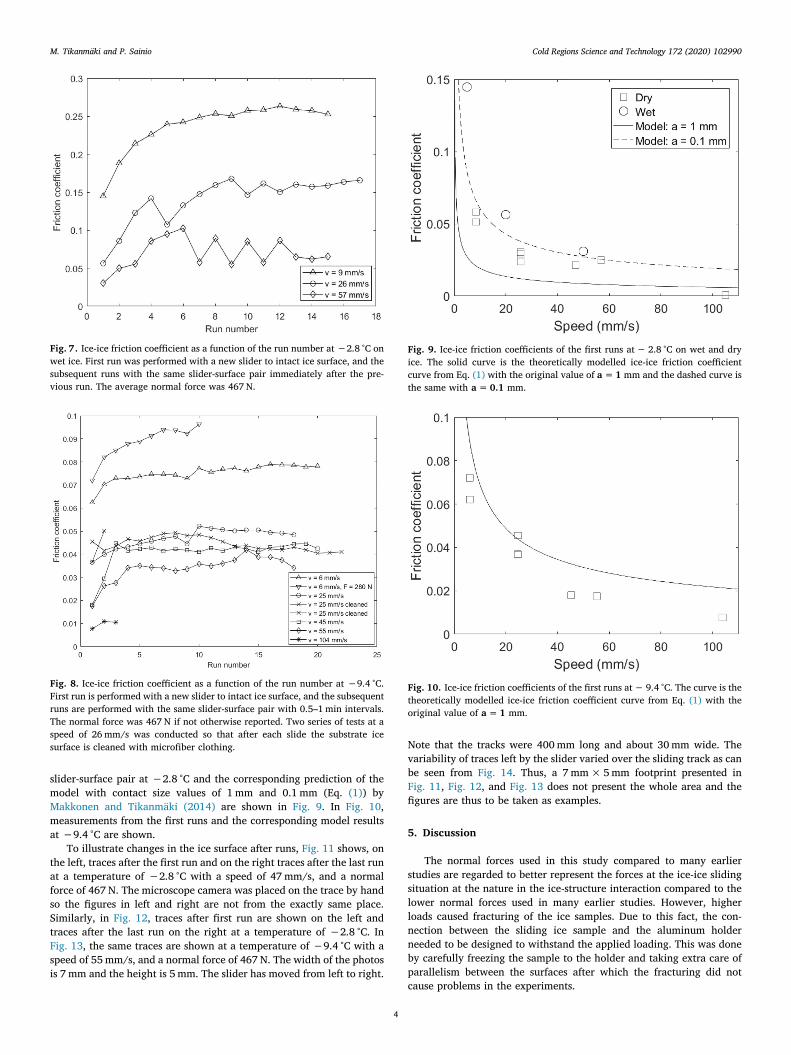
slider-surface pair at −2.8 °C and the corresponding prediction of themodel with contact size values of 1mm and 0.1mm (Eq. (1)) byMakkonen and Tikanmäki (2014) are shown in Fig. 9. In Fig. 10,measurements from the first runs and the corresponding model resultsat −9.4 °C are shown.
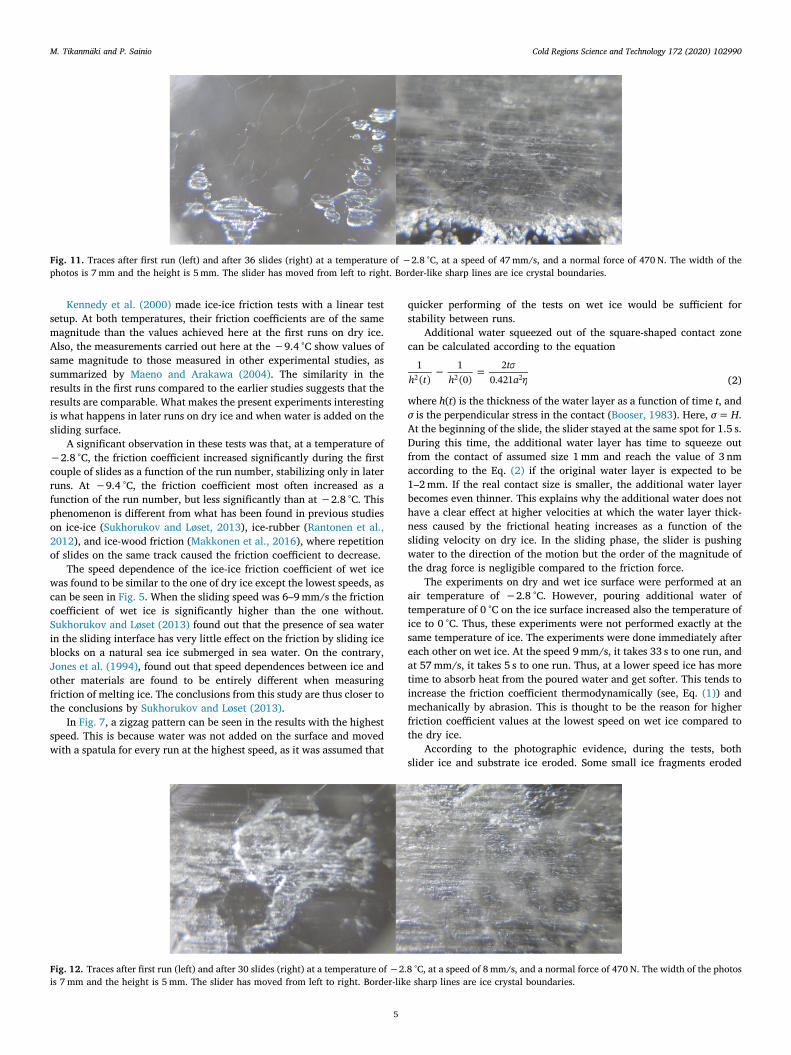
To illustrate changes in the ice surface after runs, Fig. 11 shows, onthe left, traces after the first run and on the right traces after the last runat a temperature of −2.8 °C with a speed of 47mm/s, and a normalforce of 467 N. The microscope camera was placed on the trace by handso the figures in left and right are not from the exactly same place.Similarly, in Fig. 12, traces after first run are shown on the left andtraces after the last run on the right at a temperature of −2.8 °C. InFig. 13, the same traces are shown at a temperature of −9.4 °C with aspeed of 55mm/s, and a normal force of 467 N. The width of the photosis 7mm and the height is 5mm. The slider has moved from left to right.
Note that the tracks were 400mm long and about 30mm wide. Thevariability of traces left by the slider varied over the sliding track as canbe seen from Fig. 14. Thus, a 7mm×5mm footprint presented inFig. 11, Fig. 12, and Fig. 13 does not present the whole area and thefigures are thus to be taken as examples.
5. Discussion
The normal forces used in this study compared to many earlierstudies are regarded to better represent the forces at the ice-ice slidingsituation at the nature in the ice-structure interaction compared to thelower normal forces used in many earlier studies. However, higherloads caused fracturing of the ice samples. Due to this fact, the con-nection between the sliding ice sample and the aluminum holderneeded to be designed to withstand the applied loading. This was doneby carefully freezing the sample to the holder and taking extra care ofparallelism between the surfaces after which the fracturing did notcause problems in the experiments.
Fig. 7. Ice-ice friction coefficient as a function of the run number at −2.8 °C onwet ice. First run was performed with a new slider to intact ice surface, and thesubsequent runs with the same slider-surface pair immediately after the pre-vious run. The average normal force was 467 N.
Fig. 8. Ice-ice friction coefficient as a function of the run number at −9.4 °C.First run is performed with a new slider to intact ice surface, and the subsequentruns are performed with the same slider-surface pair with 0.5–1min intervals.The normal force was 467 N if not otherwise reported. Two series of tests at aspeed of 26mm/s was conducted so that after each slide the substrate icesurface is cleaned with microfiber clothing.
Fig. 9. Ice-ice friction coefficients of the first runs at− 2.8 °C on wet and dryice. The solid curve is the theoretically modelled ice-ice friction coefficientcurve from Eq. (1) with the original value of a=1 mm and the dashed curve isthe same with a=0.1 mm.
Fig. 10. Ice-ice friction coefficients of the first runs at− 9.4 °C. The curve is thetheoretically modelled ice-ice friction coefficient curve from Eq. (1) with theoriginal value of a=1 mm.
M. Tikanmäki and P. Sainio Cold Regions Science and Technology 172 (2020) 102990
4
Kennedy et al. (2000) made ice-ice friction tests with a linear testsetup. At both temperatures, their friction coefficients are of the samemagnitude than the values achieved here at the first runs on dry ice.Also, the measurements carried out here at the −9.4 °C show values ofsame magnitude to those measured in other experimental studies, assummarized by Maeno and Arakawa (2004). The similarity in theresults in the first runs compared to the earlier studies suggests that theresults are comparable. What makes the present experiments interestingis what happens in later runs on dry ice and when water is added on thesliding surface.
A significant observation in these tests was that, at a temperature of−2.8 °C, the friction coefficient increased significantly during the firstcouple of slides as a function of the run number, stabilizing only in laterruns. At −9.4 °C, the friction coefficient most often increased as afunction of the run number, but less significantly than at −2.8 °C. Thisphenomenon is different from what has been found in previous studieson ice-ice (Sukhorukov and Løset, 2013), ice-rubber (Rantonen et al.,2012), and ice-wood friction (Makkonen et al., 2016), where repetitionof slides on the same track caused the friction coefficient to decrease.
The speed dependence of the ice-ice friction coefficient of wet icewas found to be similar to the one of dry ice except the lowest speeds, ascan be seen in Fig. 5. When the sliding speed was 6–9mm/s the frictioncoefficient of wet ice is significantly higher than the one without.Sukhorukov and Løset (2013) found out that the presence of sea waterin the sliding interface has very little effect on the friction by sliding iceblocks on a natural sea ice submerged in sea water. On the contrary,Jones et al. (1994), found out that speed dependences between ice andother materials are found to be entirely different when measuringfriction of melting ice. The conclusions from this study are thus closer tothe conclusions by Sukhorukov and Løset (2013).
In Fig. 7, a zigzag pattern can be seen in the results with the highestspeed. This is because water was not added on the surface and movedwith a spatula for every run at the highest speed, as it was assumed that
quicker performing of the tests on wet ice would be sufficient forstability between runs.
Additional water squeezed out of the square-shaped contact zonecan be calculated according to the equation
=h t h
ta
1( )
1(0)
20.4212 2 2 (2)
where h(t) is the thickness of the water layer as a function of time t, andσ is the perpendicular stress in the contact (Booser, 1983). Here, σ=H.At the beginning of the slide, the slider stayed at the same spot for 1.5 s.During this time, the additional water layer has time to squeeze outfrom the contact of assumed size 1mm and reach the value of 3 nmaccording to the Eq. (2) if the original water layer is expected to be1–2mm. If the real contact size is smaller, the additional water layerbecomes even thinner. This explains why the additional water does nothave a clear effect at higher velocities at which the water layer thick-ness caused by the frictional heating increases as a function of thesliding velocity on dry ice. In the sliding phase, the slider is pushingwater to the direction of the motion but the order of the magnitude ofthe drag force is negligible compared to the friction force.
The experiments on dry and wet ice surface were performed at anair temperature of −2.8 °C. However, pouring additional water oftemperature of 0 °C on the ice surface increased also the temperature ofice to 0 °C. Thus, these experiments were not performed exactly at thesame temperature of ice. The experiments were done immediately aftereach other on wet ice. At the speed 9mm/s, it takes 33 s to one run, andat 57mm/s, it takes 5 s to one run. Thus, at a lower speed ice has moretime to absorb heat from the poured water and get softer. This tends toincrease the friction coefficient thermodynamically (see, Eq. (1)) andmechanically by abrasion. This is thought to be the reason for higherfriction coefficient values at the lowest speed on wet ice compared tothe dry ice.
According to the photographic evidence, during the tests, bothslider ice and substrate ice eroded. Some small ice fragments eroded
Fig. 11. Traces after first run (left) and after 36 slides (right) at a temperature of −2.8 °C, at a speed of 47mm/s, and a normal force of 470 N. The width of thephotos is 7mm and the height is 5mm. The slider has moved from left to right. Border-like sharp lines are ice crystal boundaries.
Fig. 12. Traces after first run (left) and after 30 slides (right) at a temperature of −2.8 °C, at a speed of 8mm/s, and a normal force of 470 N. The width of the photosis 7 mm and the height is 5 mm. The slider has moved from left to right. Border-like sharp lines are ice crystal boundaries.
M. Tikanmäki and P. Sainio Cold Regions Science and Technology 172 (2020) 102990
5
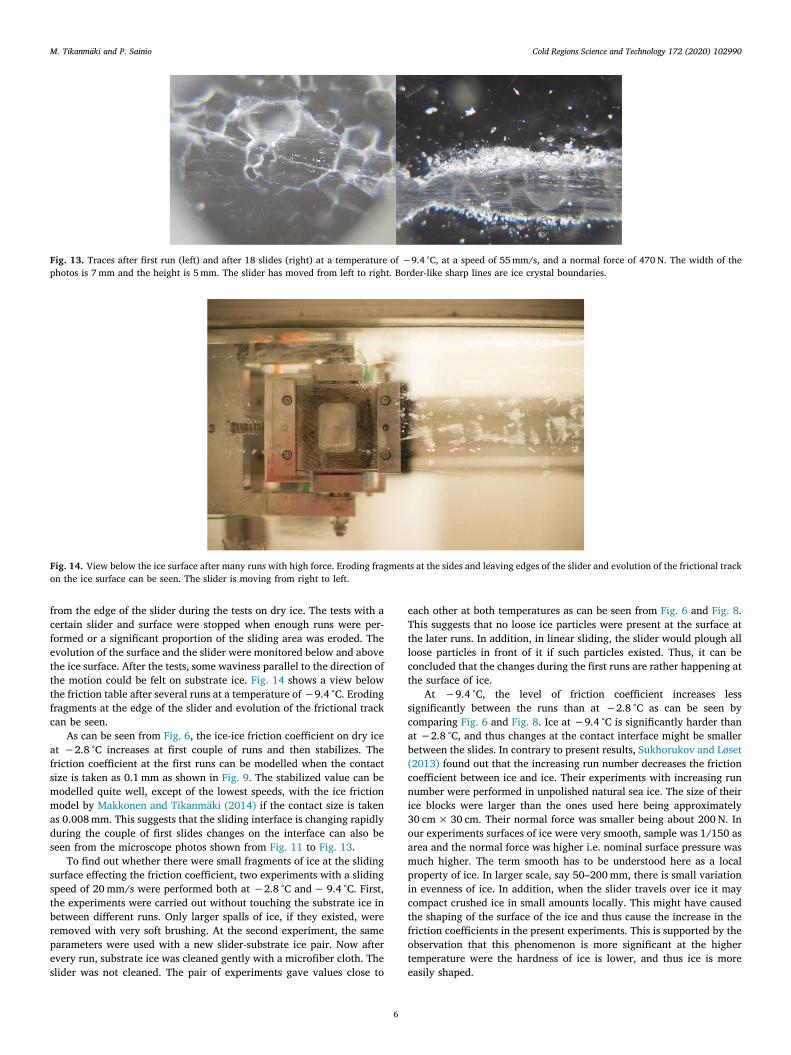
from the edge of the slider during the tests on dry ice. The tests with acertain slider and surface were stopped when enough runs were per-formed or a significant proportion of the sliding area was eroded. Theevolution of the surface and the slider were monitored below and abovethe ice surface. After the tests, some waviness parallel to the direction ofthe motion could be felt on substrate ice. Fig. 14 shows a view belowthe friction table after several runs at a temperature of −9.4 °C. Erodingfragments at the edge of the slider and evolution of the frictional trackcan be seen.
As can be seen from Fig. 6, the ice-ice friction coefficient on dry iceat −2.8 °C increases at first couple of runs and then stabilizes. Thefriction coefficient at the first runs can be modelled when the contactsize is taken as 0.1 mm as shown in Fig. 9. The stabilized value can bemodelled quite well, except of the lowest speeds, with the ice frictionmodel by Makkonen and Tikanmäki (2014) if the contact size is takenas 0.008mm. This suggests that the sliding interface is changing rapidlyduring the couple of first slides changes on the interface can also beseen from the microscope photos shown from Fig. 11 to Fig. 13.
To find out whether there were small fragments of ice at the slidingsurface effecting the friction coefficient, two experiments with a slidingspeed of 20mm/s were performed both at −2.8 °C and− 9.4 °C. First,the experiments were carried out without touching the substrate ice inbetween different runs. Only larger spalls of ice, if they existed, wereremoved with very soft brushing. At the second experiment, the sameparameters were used with a new slider-substrate ice pair. Now afterevery run, substrate ice was cleaned gently with a microfiber cloth. Theslider was not cleaned. The pair of experiments gave values close to
each other at both temperatures as can be seen from Fig. 6 and Fig. 8.This suggests that no loose ice particles were present at the surface atthe later runs. In addition, in linear sliding, the slider would plough allloose particles in front of it if such particles existed. Thus, it can beconcluded that the changes during the first runs are rather happening atthe surface of ice.
At −9.4 °C, the level of friction coefficient increases lesssignificantly between the runs than at −2.8 °C as can be seen bycomparing Fig. 6 and Fig. 8. Ice at −9.4 °C is significantly harder thanat −2.8 °C, and thus changes at the contact interface might be smallerbetween the slides. In contrary to present results, Sukhorukov and Løset(2013) found out that the increasing run number decreases the frictioncoefficient between ice and ice. Their experiments with increasing runnumber were performed in unpolished natural sea ice. The size of theirice blocks were larger than the ones used here being approximately30 cm×30 cm. Their normal force was smaller being about 200 N. Inour experiments surfaces of ice were very smooth, sample was 1/150 asarea and the normal force was higher i.e. nominal surface pressure wasmuch higher. The term smooth has to be understood here as a localproperty of ice. In larger scale, say 50–200mm, there is small variationin evenness of ice. In addition, when the slider travels over ice it maycompact crushed ice in small amounts locally. This might have causedthe shaping of the surface of the ice and thus cause the increase in thefriction coefficients in the present experiments. This is supported by theobservation that this phenomenon is more significant at the highertemperature were the hardness of ice is lower, and thus ice is moreeasily shaped.
Fig. 13. Traces after first run (left) and after 18 slides (right) at a temperature of −9.4 °C, at a speed of 55mm/s, and a normal force of 470 N. The width of thephotos is 7mm and the height is 5mm. The slider has moved from left to right. Border-like sharp lines are ice crystal boundaries.
Fig. 14. View below the ice surface after many runs with high force. Eroding fragments at the sides and leaving edges of the slider and evolution of the frictional trackon the ice surface can be seen. The slider is moving from right to left.
M. Tikanmäki and P. Sainio Cold Regions Science and Technology 172 (2020) 102990
6
At speeds of 6–9mm/s, experiments were performed with normalforces of 280 and 467 N. At both temperatures, the friction coefficientwith a normal force of 280 N was higher than with 467 N. At −2.8 °C,the difference was smaller than at −9.4 °C. The theoretical model(Makkonen and Tikanmäki, 2014) suggests that the normal force doesnot have a significant effect in ice-ice friction. Because of the largenormal forces used in this experiments also shapening of the ice ispresent and the normal force might have an effect. In order to makeclear statements about the effect of this large normal forces, moreexperiments on different load levels are needed.
A thermographic camera was used to detect whether the slidinginterface was warmed during the slides. The results show that thetemperature of the substrate ice cooled to its initial temperaturebetween repetitive slides. The temperature of the sliding ice samplecould only be measured after the last run when it was about twodegrees warmer than the initial cold chamber temperature.
A microscope camera was used to monitor the evolution of thesliding track between runs. From the microscope photos in Fig. 11,Fig. 12, and Fig. 13, it could also be seen that there were traces ofvarying sizes left behind. From these photos, it was evident that theapparent sliding area was not completely in contact which supports theuse of contact size smaller than the apparent contact size in the frictionmodel (Eq.(1)). The conclusion that the softer ice at −2.8 °C has erodedmore than the harder ice at −9.4 °C is supported by these figures.
Left sides of the Fig. 11, Fig. 12, and Fig. 13 as well as other photostaken with a microscope camera support the idea that not the wholearea of the slider is in contact with ice at the first run. This supports thechoice of the characteristic contact size a being less than the apparentslider width. The place of the contact is sometimes changing quicklywhen the slider is moving forward as can be seen from Fig. 11. Thephotos taken with a microscope camera also show that the charac-teristic contact size a in the friction model (Eq. (1)) is not a constantvalue but has to be taken as a mean value. It can be seen from thechanges from the left to right sides of the Fig. 11, Fig. 12, and Fig. 13that the nature of the contact has changed as a function of the runnumber that also supports the reasoning of changing contact as a reasonfor the increasing value of the friction coefficient.
6. Conclusions
In this paper, ice-ice friction coefficients at temperatures of −2.8 °Cand−9.4 °C were presented. At −2.8 °C, experiments were performedboth on wet and dry ice surface. Successful performing of the testsdemanded a well-designed testing apparatus MMR, and overcoming ofspecific problems arising from the low values of the ice-ice frictioncoefficient and ice fracture under a high normal force.
The effect of abrasion of ice surfaces was found to be an importantphenomenon regarding the friction coefficient between ice and ice. Asignificant notion in these experiments was that the friction coefficientincreased significantly in repetitive experiments in contradiction toearlier studies conducted with pairs of ice-ice, ice-rubber, and ice-woodwhere polishing of ice led to decrease of the friction coefficient.
The experiments performed on wet ice showed friction coefficientsclose to the ones measured on dry ice. However, at a low speed of
6–9mm/s, friction coefficient of wet ice was significantly higher thanon dry ice. The similarity of the values on dry and wet ice is probablycaused by the additional water being squeezed out from the true con-tacts before the actual test starts, and that the water layer thicknesscaused by the frictional heating increases with increasing speed. Thedifference of the values at the lower velocity can be because repeatingruns at lower speed and keeping the sliding distance same requiresmore time and thus the ice has more time to warm up from its originaltemperature of −2.8 °C to the temperature of the poured water being0 °C. This results in a warmer ice and a higher friction coefficient.
The results from this study give new knowledge from the evo-lution of the ice-ice friction in subsequent sliding runs and thefriction coefficient of wet ice. Experiments on wet ice at the originalice temperature of 0 °C would give more insight of the subject.However, 0 °C being the melting temperature of ice makes suchexperiments extremely challenging if not impossible.
Declaration of Competing Interest
The authors declare that they have no known competing financialinterests or personal relationships that could have appeared to influ-ence the work reported in this paper.
Acknowledgements
The authors wish to thank Lasse Makkonen for the comments on theplans of the experiments and for comments on the manuscript, KariKolari for the comments on the manuscript and Toni Hekkala for thephotographs 1, 2, and 14. This work was funded by the Academy ofFinland, Grants no. 268829 and 297278.
References
Bäurle, L., et al., 2007. Sliding friction of polyethylene on snow and ice: contact area andmodeling. Cold Reg. Sci. Technol. 47 (3), 276–289.
Booser, E.R., 1983. CRC Handbook of Lubrication : Theory and Practice of Tribology. CRCPress.
Jones, S.J., et al., 1994. Friction of melting ice. Ann. Glaciol. 19, 7–12.Kennedy, F., Schulson, E., Jones, D., 2000. The friction of ice on ice at low sliding ve-
locities. Philosophical Magazine A 80 (5), 1093–1110.Lozowski, E., Szilder, K., Maw, S., 2013. A model of ice friction for a speed skate blade.
Sports Engineering 16 (4), 239–253.Maeno, N., Arakawa, M., 2004. Adhesion shear theory of ice friction at low sliding ve-
locities, combined with ice sintering. J. Appl. Phys. 95 (1), 134.Makkonen, L., Tikanmäki, M., 2014. Modeling the friction of ice. Cold Reg. Sci. Technol.
102, 84–93.Makkonen, L., Tikanmäki, M., Sainio, P., 2016. Friction in sliding heavy objects on ice. J.
Glaciol. 62 (236), 1186.Marmo, B., Blackford, J., Jeffree, C., 2005. Ice friction, wear features and their depen-
dence on sliding velocity and temperature. J. Glaciol. 51 (174), 391–398.Oksanen, P., Keinonen, J., 1982. The mechanism of friction of ice. Wear 78 (3), 315–324.Pritchard, R.S., Knoke, G.S., Echert, D.C., Skip, 2012. Sliding friction of sea ice blocks.
Cold Regions Science and Technology 76–77, 8–16.Rantonen, M., Tuononen, A.J., Sainio, P., 2012. Measuring stud and rubber friction on ice
under laboratory conditions. Int. J. Veh. Syst. Model. Test. 7 (2), 194–207.Sukhorukov, S., Løset, S., 2013. Friction of sea ice on sea ice. Cold Reg. Sci. Technol. 94,
1–12.Tikanmäki, M., Makkonen, L., Kurkela, J., 2011. Friction modelling in ice crushing si-
mulation. In: Proceedings of the 21st International Conference on Port and OceanEngineering under Arctic Conditions (POAC 2011).
M. Tikanmäki and P. Sainio Cold Regions Science and Technology 172 (2020) 102990
7


![Validation of the generalized model of two-phase ...yadda.icm.edu.pl/yadda/element/bwmeta1.element...the convection heat transfer coefficient and friction factor. Dobson et al. [21,22]](https://img.pdfslide.net/doc/110x75/5f4d87c468593756d475ce67/validation-of-the-generalized-model-of-two-phase-yaddaicmeduplyaddaelement.jpg)