Embed Size (px)
Citation preview

Experiments on Prestressed Steel-Concrete Composite Girders with
Corrugated Webs
Lee Deuck Hang1), * Oh Jae Yuel1), Kang Hyun1), Kim Kang Su2), Kim Hyung-Jun3) and Kim Heung-Youl4)
1), 2)
Department of Architectural Engineering, University of Seoul, Seoul 130-743, Korea
3), 4) Fire Safety Research Center, Korea Institute of Construction Technology, Gyeonggi-Do 445-861, Korea
ABSTRACT
In this study, the structural performance of prestressed composite girders with corrugated webs was evaluated by conducting experiments on a total of five specimens with the key test variables of prestress level, tendon layout patterns, welding methods, and shear connectors. The test results showed that the prestress introduced in the top and bottom flanges of the steel beam increased significantly due to the accordion effect before the composite with concrete, and the flexural stiffness and strength of the prestressed composite beams were superior to the non-prestressed specimen. In addition, it was found that sufficient flexural performance can be secured by partial welding between corrugated-plate web and top or bottom flange, in which the constructability of the corrugated webbed beams could have been greatly improved. The accordion effect that occurs in a steel beam when prestress is introduced before the composite with concrete was reflected in the analysis model using the concept of effective cross-section, and the structural behavior of the prestressed composite beams was evaluated by a fiber element model. The analysis methods presented in this study appropriately evaluated the accordion effect and the flexural behavior of prestressed steel-concrete composite members with corrugated webs. 1. INTRODUCTION
The demand for horizontal members suitable for long-span implementation continue
1) Ph.D. Candidate
2) Professor 3) Ph.D. Candidate & researcher 4) Ph.D. & principal researcher Note: Copied from the manuscript submitted to “Steel and Composite Structures, An International Journal” for presentation at ASEM13 Congress
2086

to rise in civil structures such as bridges, and the demand for horizontal members that enable not only long-span but also floor height reduction has increased in a large-scale architectural buildings constructed in downtown areas. Thus, many efforts to develop long-span steel-concrete composite members have been actively made (Heo et al. 2002, Mullett 1998, Salmon and Johnson 1996), and in particular, prestressed composite beams has been recently studied (Ayyub et al. 1990, Ayyub et al. 1992a, Ayyub 1992b, Bae and Lee 2007, Chen and Gu 2005, Kim et al. 2002, Lorenc and Kubica 2006), which are more active way to ensure serviceability. While prestressing technique has been generally applied to concrete members, it is coupled to a composite beam in a prestressed composite beam. Since the prestressed composite beams are very effective for deflection control and strength enhancement, their researches and field applications have gradually increased (Ayyub et al. 1990, Ayyub et al. 1992a, Ayyub et al.1992b, Bae and Lee 2007, Chen and Gu 2005, Kim et al. 2002, Lorenc and Kubica 2006).
A typical I-shaped steel beam has a very large axial stiffness, which leads to a very low introduction efficiency of prestress when the prestressing method is applied. However, as shown in Fig. 1(a), the application of corrugated webs can improve the efficiency of prestress introduced to the top and bottom flanges through the accordion effect that occurs due to the low axial stiffness of the corrugated webs when the prestressing forces are introduced and that also enhances the deflection control efficiency. In addition, as shown in Fig. 1(b), the upward camber of steel beam in the prestressed encased-composite beam make it possible to reduce its floor height by
reh , compared to that of the general composite beam. The conventional composite beams for floor height reduction have disadvantages in stiffness and strength as their section heights reduce. However, a prestressed composite beam can complement it effectively by introducing high-strength tendons. Therefore, the prestressed composite beam with corrugated webs can be advantageous for long-spans, and can be an effective alternative for floor height reduction (Kim and Lee 2011, Kim et al. 2011).
Figure 2 shows the concept of the prestressed composite beam with corrugated webs. Since the deflection control is very important in a long-span member, this study attempted to enhance the flexural stiffness and strength by introducing prestress to the steel beam using high-strength tendons. In addition, since the efficiency of the prestress introduced into the flanges is low when prestress is introduced to a typical stiff steel beam, the corrugated webs replace the webs so that the efficiency of the prestress can be improved through the accordion effects. However, the accordion effect of corrugated webs is not yet clearly understood, and few studies have been conducted on the behavior of a prestressed composite beam with corrugated webs. Therefore, in this study, the accordion effect, which is induced at the prestressing stage before the composite with concrete, is quantitatively evaluated by applying the concept of the effective cross-section (Kim et al. 2011, Oh et al. 2012), and the flexural behavior of the composite beam is analyzed by the flexural behavior model proposed in this study. The proposed model is based on a cross-sectional analysis, and can be used for the evaluation of the nonlinear flexural behavior of the prestressed encased-composite beam in a relatively simple manner.
2087

Moment
Axial force
Moment
Axial forceA
A
A-A Section
Strain in wide flange beam Accordion effect
Strains Stresses
bottom flange
top flangeεpe, st, t
εpe, st, b
εpefpe
fpe, st, b
fpe, st, t
(a) Accordion effect
N.A.cN
,st tN
,st wN
,st bN
Concrete slab
Steel flange
Steel web
Steel flange
,st tN
,st wN
,st bN
psNTendon
reh
Typical steel-concrete composite beam Prestressed steel-concrete composite beam
Internalforce
Resultantforce
comF
tenF
jd
N.A.
'cN 'comF
'jd
'tenF
Internalforce
Resultantforce
Concrete slab
(b) Comparison of a typical composite beam and a prestressed composite beam Fig. 1 Characteristics of the corrugated webbed steel beam
PS composite beamCorrugated web
Composite
Prestressed
webweb
- Deflection control- Improvement of flexural strength- Reduction of story height with no
section area increase
- More stable before composition- Accordion effect
- Improvement of bond- Using steel more economically- Improvement of fire resistance- Improvement of constructability
Fig. 2 Conceptual description of prestressed composite beam with corrugated webs
2088

In this study, the flexural tests on a total of five prestressed corrugated-webbed steel-concrete composite beams were performed. To evaluate the effect of the prestress on its structural behavior, four specimens were prestressed but not in one control specimen. Two types of tendon profiles, one-draped and two-point draped layout, were considered in this study to investigate the difference in their flexural behavior according to the tendon profiles. The effect of welding methods between corrugated web plate and flanges was also investigated, for which one specimen adopted entire-length welding between corrugated web plate and flanges and all other specimens partially welded to improve constructability of the corrugated webbed steel beam. On the other hand, the neutral axis of the composite beam specimens in previous studies (Heo et al. 2002, Lawson et al. 1997, Mullett 1992) was mostly located at lower than the top flange of their steel beam because the widths of concrete slabs were relatively small, and the top flanges of the steel beams were embedded deep into their slab sections. However, the effective widths of the T-shaped composite beams can be much larger than those of the specimens in previous studies, which can be easily checked from calculating the effective width of the T-shaped concrete cross-section specified in national codes, for instance, the ACI318-08 (2005), AASHITO-LRFD (2004) and AISC (2001) design criteria, and the longitudinal reinforcing bars are generally provided in concrete slab. Thus, the neural axis can be often located at higher than the top flange of the steel beam. In this study, the slab width of the composite beam specimens was determined to 1,100 mm, which was the maximum slab width limited by the testing laboratory facility, and reinforcing bars were placed in the slab as needed so that their neural axis can be located at higher than the top flange of the steel beam. The effect of shear connectors on the horizontal shear strength of the composite beams was also investigated. In addition, the behavior of the specimens before the composite with concrete and their flexural behavior after the composite with concrete were evaluated by using an accordion effect analysis model and a fiber sectional analysis model, respectively. 2. TEST PROGRAM
In this study, one non-prestressed composite beam with a corrugated web, FNCP, and four prestressed composite beams with corrugated webs were fabricated, as shown in Table 1, to assess their flexural behavior. The prestressed composite beams with corrugated webs consisted of FPCE1P, FPCE2P, FPCE2PS and FPCE2GS, depending on shear connector, tendon profiles, and welding methods. Fig. 3 shows the tendon profiles, dimensions, and sectional details of each specimen before the composite with concrete. The specimen FPCE1P had one drape point, and the specimens FPCE2P, FPCE2PS and FPCE2GS had two drape points. For FNCP, no tendon was provided, and the other sectional details were identical to the prestressed specimens. Each of the specimens was 7,240 mm long, the corrugated web was 6 mm thick, and the top and bottom flanges were 12 mm thick. In addition, the steel beam has an asymmetric cross-section, where the widths of top and bottom flanges are 200 mm and 300 mm, respectively, so that any deck plate-type floor slab can be directly placed on its bottom flange. As shown in Fig. 3(c), the corrugated web was manufactured with a 60 mm wave height and a 28.7° wave height angle, and no extra stiffener was
2089

installed in the web. As shown in Figs. 4(a) and 4(b), after the top and bottom flanges and the corrugated web were manufactured separately, they were welded together. While the web and the flanges were welded along the whole length in a longitudinal direction for the G-series specimens, the inclined parts of the web were not welded in the P-series specimens for fast manufacturing process of the corrugated webbed steel beam. The weld size ( s ) of 12 mm and the weld throat thickness ( a ) of 8.4 mm were determined based on the AISC J2.2 requirements, and the welding quality was confirmed by ultrasonic tests. After the corrugated webbed steel beams were prestressed, forms were set on the sides of the steel beams, the slab reinforcing bars were placed, and concrete was cast in place, as shown in Figs 4(c) to 4(e). Table 1 Test specimens
Specimen Web Prestressing Draped point(s) Welding type Shear
connectors FPCE1P corrugated O 1 partial - FPCE2P corrugated O 2 partial -
FPCE2PS corrugated O 2 partial @300 FPCE2GS corrugated O 2 gross @300
FNCP corrugated X - partial -
[FPCE1P]
[FPCE2P]
[FPCE2PS, FPCE2GS]
13 55@ 300
12.6 7 wires tendon
12.6 7 wires tendon
12.6 7 wires tendon
(a) Tendon profiles and dimensions of specimens
and A-A section details of corrugated web
2090
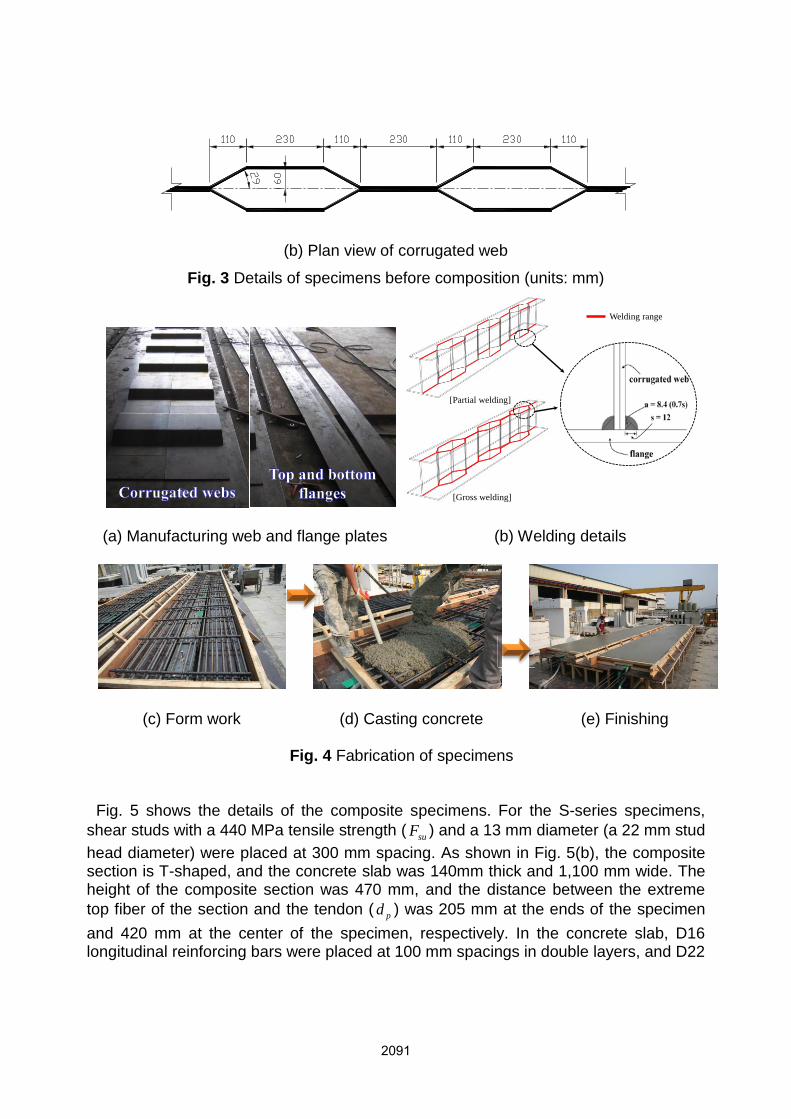
(b) Plan view of corrugated web
Fig. 3 Details of specimens before composition (units: mm)
Welding range
[Partial welding]
[Gross welding]
(a) Manufacturing web and flange plates (b) Welding details
(c) Form work (d) Casting concrete (e) Finishing
Fig. 4 Fabrication of specimens
Fig. 5 shows the details of the composite specimens. For the S-series specimens, shear studs with a 440 MPa tensile strength ( suF ) and a 13 mm diameter (a 22 mm stud head diameter) were placed at 300 mm spacing. As shown in Fig. 5(b), the composite section is T-shaped, and the concrete slab was 140mm thick and 1,100 mm wide. Theheight of the composite section was 470 mm, and the distance between the extreme top fiber of the section and the tendon ( pd ) was 205 mm at the ends of the specimen and 420 mm at the center of the specimen, respectively. In the concrete slab, D16 longitudinal reinforcing bars were placed at 100 mm spacings in double layers, and D22
2091
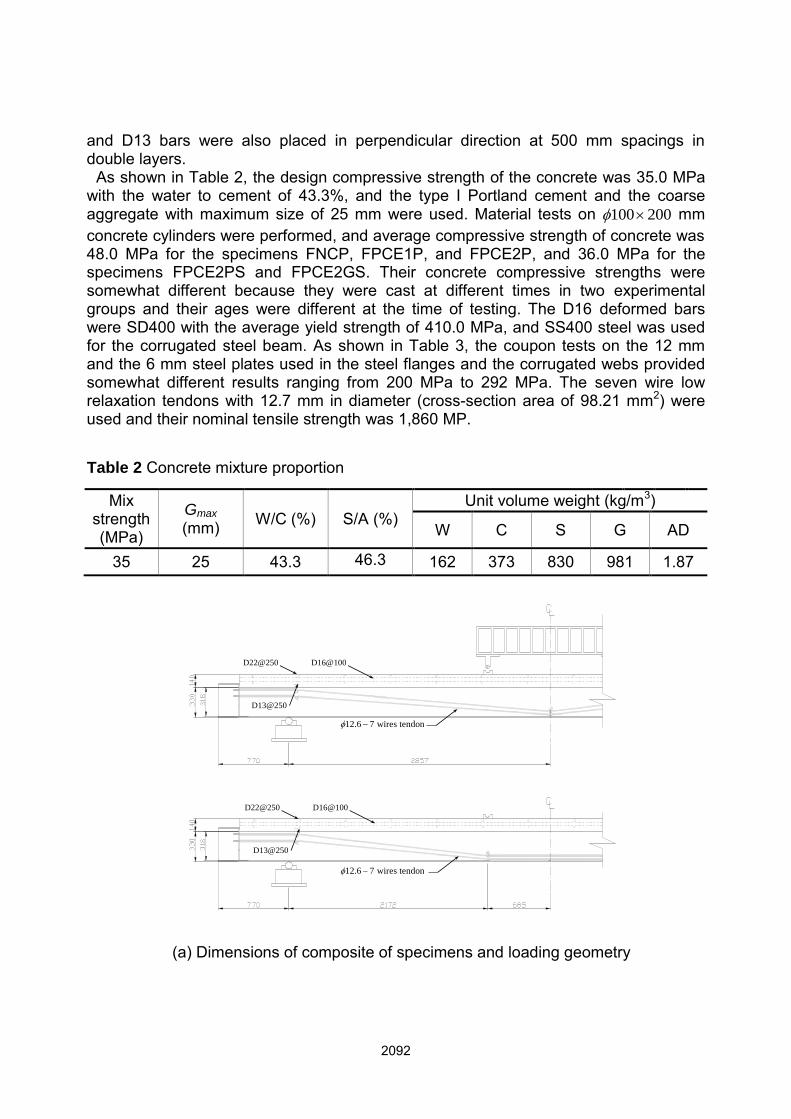
and D13 bars were also placed in perpendicular direction at 500 mm spacings in double layers.
As shown in Table 2, the design compressive strength of the concrete was 35.0 MPa with the water to cement of 43.3%, and the type I Portland cement and the coarse aggregate with maximum size of 25 mm were used. Material tests on 100 200 mm concrete cylinders were performed, and average compressive strength of concrete was 48.0 MPa for the specimens FNCP, FPCE1P, and FPCE2P, and 36.0 MPa for the specimens FPCE2PS and FPCE2GS. Their concrete compressive strengths were somewhat different because they were cast at different times in two experimental groups and their ages were different at the time of testing. The D16 deformed bars were SD400 with the average yield strength of 410.0 MPa, and SS400 steel was used for the corrugated steel beam. As shown in Table 3, the coupon tests on the 12 mm and the 6 mm steel plates used in the steel flanges and the corrugated webs provided somewhat different results ranging from 200 MPa to 292 MPa. The seven wire low relaxation tendons with 12.7 mm in diameter (cross-section area of 98.21 mm2) were used and their nominal tensile strength was 1,860 MP.
Table 2 Concrete mixture proportion
Mix strength (MPa)
Gmax
(mm) W/C (%) S/A (%) Unit volume weight (kg/m3)
W C S G AD
35 25 43.3 46.3 162 373 830 981 1.87
12.6 7 wires tendon
12.6 7 wires tendon
D22@250
D13@250
D16@100
D22@250
D13@250
D16@100
(a) Dimensions of composite of specimens and loading geometry
2092

(b) A-A section details of composite specimens
Fig. 5 Details of prestressed composite beams with corrugated web
Table 3 Material test results
Reinforcement Tendon
Specimen D13 D16 D19 612.
(MPa) sE (MPa) yf (MPa) sE (MPa) yf (MPa) sE (MPa) yf
puf (MPa)
FNC 2.0 x 10⁵ 410 2.0 x 10⁵ 410 2.0 x 10⁵ 410 1855 FPCE1 2.0 x 10⁵ 410 2.0 x 10⁵ 410 2.0 x 10⁵ 410 1855 FPCE2 2.0 x 10⁵ 410 2.0 x 10⁵ 410 2.0 x 10⁵ 410 1855
FPCE2PS 2.0 x 10⁵ 410 2.0 x 10⁵ 410 2.0 x 10⁵ 410 1855 FPCE2GS 2.0 x 10⁵ 410 2.0 x 10⁵ 410 2.0 x 10⁵ 410 1855
Steel Concrete
Specimen Thickness 6 mm Thickness 12 mm Design strength: 35 MPa
(MPa) yF (MPa) stE (MPa)yF (MPa) stE (MPa)cf '
FNC 278 1.9 x 10⁵ 292 2.0 x 10⁵ 48 FPCE1 278 1.9 x 10⁵ 292 2.0 x 10⁵ 48 FPCE2 278 1.9 x 10⁵ 292 2.0 x 10⁵ 48
FPCE2PS 290 1.9 x 10⁵ 220 1.9 x 10⁵ 35 FPCE2GS 290 1.9 x 10⁵ 220 1.9 x 10⁵ 35
2.2 Loading and Measurements As shown in Fig. 5(a), the composite beam specimens were simply supported with a
span length of 5,700mm, and a two-point concentrated load was applied on the specimens under the displacement control. Their deflections were measured by four LVDT extensometers installed under the specimens between the end-supports and the center of specimens, and the relative slip between the steel beam and concrete during the loading history was monitored by the LVDTs installed at both ends of the members.
2093

In addition, the changes in the tendon stresses were observed by the load cells installed at the member ends. As shown in Fig. 6(a), the strains in the longitudinal direction of the specimens were measured by the strain gauges attached on the top surface of the concrete slab, the flanges and the webs of the steel beams, and the tendons. As shown in Fig. 6(b), the strains of the corrugated beam encased by concrete were measured precisely during the prestressing stage as well as along the loading history by the three strain gauges in the webs and those at the top and bottom flanges. In addition, as shown in Fig. 6(c), concrete gauges were placed along the width at the top surface of the concrete slab at the midspan. All the gages and the measurement devices were connected to a data logger and all data were collected every second. The crack patterns and the crack widths in each loading step were also recorded in detail.
3. TEST RESULTS
3.1 Prestressing Stage of the Steel Beam with Corrugated Webs before the Composite with Concrete
The prestress was introduced to the corrugated steel beams. The design prestressing force of a tendon was 128 kN (0.7 pu psf A ), but the half of the prestressing force was introduced at a time in the order shown in Fig. 7(a) to prevent any possible out-of-plane buckling of the member, except the specimen FPCE2P in which the full design prestressing forces were introduced to each tendon at a time for the purpose of investigation of the prestress loss according to the prestress introduction methods. Fig. 7(b) shows the prestressing forces measured by the load cell versus the strains of the
Concrete strain gauge : see details in (f)Strain gauge : see details in (e)Tendon strain gauge
(a) Location of strain gauges
d/4
d/4
d/4
d/4
Concrete strain gaugeStrain gauge
Slab top fiber
Slab top
500400
300
250
500
Steel beam
(b) Detailed location of strain gauges (c) Location of concrete strain gauges (top view) Fig. 6 Test set-up and locations of measurement devices
2094

bottom flanges measured from the gauges attached at the midspan during the prestressing operation. The strain at the bottom flange of the steel beam increased almost linearly as the prestressing force increased. In the case of the specimens FPCE1P, FPCE2PS, and FPCE2GS, after the half of the target prestressing force (approximately 64 kN) was introduced, the prestressing force tended to decrease slightly, which was mainly due to the anchorage seating loss and the elastic shortening when introducing the prestress to the other tendons. In the second stage of prestressing up to the target prestressing force, the linear prestressing force-bottom flange strain behavior was also observed in all specimens. After the completion of the prestressing work, the effective prestressing force was 128.0 kN, which was the targeted prestressing force considering the instantaneous loss of approximately 6.9% caused by the anchorage seating and the elastic shortening. In the specimen FPCE2P, in which the full design prestressing forces were introduced to each tendon at a time, there was no difference in the effective prestressing force after completion of the prestressing operation, compared to other specimens.
Fig. 8 shows the strain distributions along the height of the cross-section of the specimens FPCE1P, FPCE2P, FPCE2PS, and FPCE2GS, which was measured at the midspan after the completion of the prestressing work. The accordion effect (Driver et al. 2006, Elgaaly et al. 1997, Huang et al. 2004, Khalid et al. 2004,) can be clearly observed in these all specimens, in which the strains in the top and bottom flanges were large while the strains in the corrugated webs were very small. Table 4 compares the strain values measured from the top and bottom flanges with those calculated for a typical I-shaped member, i.e., ignoring the accordion effect. It can be confirmed that the strains measured from the top and bottom flanges of all the corrugated webbed beams ( ,t m and ,b m ) were greater than those calculated for a I-shaped member ( ,t c and ,b m ). In addition, the efficiency of the prestress introduced into the bottom flange was enhanced by 13% ~ 41% with an average of approximately 28% improvement.
①, ③ ②
④, ⑥⑤
0
20
40
60
80
100
120
140
160
0 100 200 300 400 500 600
Load
(k
N)
Compressive strain (X106)
FPCE1P
FPCE2P
FPCE2PS
FPCE2GS
1 2
3 4
Location of strain
measurements
Load cell
(a) Jacking operation and order (b) Measured prestressing forces in tendon and
corresponding strains in bottom flange Fig. 7 Prestressing stages of corrugated steel beam
2095

0
93
187
280
373
600 500 400 300 200 100 0
FPCE1P
FPCE2P
FPCE2PS
FPCE2GS
Gross section
Effective section
Bea
m h
eigh
t(m
m)
Compressive strain (x106)
effective factor
0.91, 0.39f a 0.91 0.39f a
Effective concept
0
93
187
280
373
-600 -500 -400 -300 -200 -100 0
Beam
height (mm
)
Compressive strain (x106)
FPCE1P Test resultsFPCE2P Test resultsFPCE2SP Test resultsFPCE2GS Test resultsGross sectionEffective section
Effectives concept
0.91, 0.39f a
Fig. 8 Comparisons of test results to analysis results estimated by the effective area concept
Table 4 Strains in top and bottom flanges
Specimen (kN)ePCalculation Measurement Efficiency
, ( )t c , ( )b c , ( )t m , ( )b m , ,/t m t c , ,/b m b c
FPCE1 498.8 -37.9 -394.7 -95.7 -509.1 2.5 1.29FPCE2 504.8 -38.2 -399.6 -89.1 -450.5 2.3 1.13
FPCE2PS 494.0 -37.7 -390.8 -175.8 -550.0 4.7 1.41FPCE2G
S 496.4 -37.8 -392.8 -138.9 -514.0 3.7 1.31
The strains ( , ,pe st t and , ,pe st b ) and the stresses ( t and b ) in the top and bottom flanges of the corrugated webbed steel beams can be calculated, as follows:
,, ,
d steelt e epe st t t t
s s eff s eff s eff
MP P e y yE E A E I E I
(1a)
,, ,
d steelb e epe st b b b
s s eff s eff s eff
MP Pe y yE E A E I E I
(1b)
where eP is the effective prestressing forces, sE is the elastic modulus of steel plates, eis the eccentricity between the centroid of the member section to the centroid of the tendons, ,d steelM is the flexural moment caused by the dead load of the steel beam, tyis the distance from the centroid to the extreme top fiber of the member section, and byis the distance from the centroid to the extreme bottom fiber of the member section.
effA and effI is the effective cross-section area and the effective moment of inertia,
2096
respectively, which can be estimated, as follows (Kim et al. 2011): eff f gI I (2)
eff flange a webA A A (3)
where gI is the moment of inertia of gross section, flangeA is the sum of the sectional area of the top and bottom flanges, webA is the sectional area of the corrugated webs, and f and a are the coefficients of the effective moment of the inertia and the effective web area, respectively, which can be estimated, as follows (Kim et al. 2011):
0.15
0.70f
f
w w w
bd a
t h h
(4)
0.19 0.19 0.56
0.30f
a
w w w
bd a
t h h
(5)
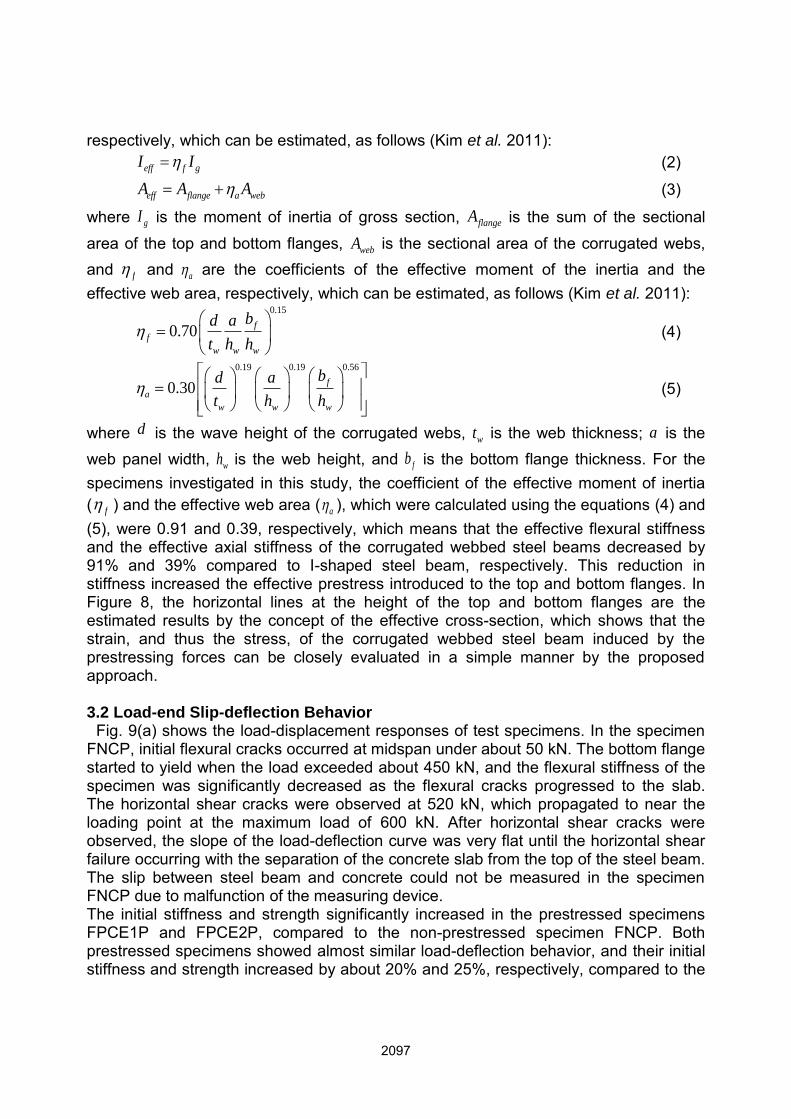
where d is the wave height of the corrugated webs, wt is the web thickness; a is the web panel width, wh is the web height, and fb is the bottom flange thickness. For the specimens investigated in this study, the coefficient of the effective moment of inertia ( f ) and the effective web area ( a ), which were calculated using the equations (4) and (5), were 0.91 and 0.39, respectively, which means that the effective flexural stiffness and the effective axial stiffness of the corrugated webbed steel beams decreased by 91% and 39% compared to I-shaped steel beam, respectively. This reduction in stiffness increased the effective prestress introduced to the top and bottom flanges. In Figure 8, the horizontal lines at the height of the top and bottom flanges are the estimated results by the concept of the effective cross-section, which shows that the strain, and thus the stress, of the corrugated webbed steel beam induced by the prestressing forces can be closely evaluated in a simple manner by the proposed approach. 3.2 Load-end Slip-deflection Behavior
Fig. 9(a) shows the load-displacement responses of test specimens. In the specimen FNCP, initial flexural cracks occurred at midspan under about 50 kN. The bottom flange started to yield when the load exceeded about 450 kN, and the flexural stiffness of the specimen was significantly decreased as the flexural cracks progressed to the slab. The horizontal shear cracks were observed at 520 kN, which propagated to near the loading point at the maximum load of 600 kN. After horizontal shear cracks were observed, the slope of the load-deflection curve was very flat until the horizontal shear failure occurring with the separation of the concrete slab from the top of the steel beam. The slip between steel beam and concrete could not be measured in the specimen FNCP due to malfunction of the measuring device. The initial stiffness and strength significantly increased in the prestressed specimens FPCE1P and FPCE2P, compared to the non-prestressed specimen FNCP. Both prestressed specimens showed almost similar load-deflection behavior, and their initial stiffness and strength increased by about 20% and 25%, respectively, compared to the
2097

non-prestressed specimen. Both prestressed specimens showed linear behavior up to about 650 kN that was much greater than the yield strength of the specimen FNCP, from which the strengthening effect of the prestressing tendons was clearly observed. The initial cambers induced by the vertical component of prestressing forces were measured as about 4.0 mm and 3.0 mm in the specimens FPCE1P and FPCE2P, respectively. Their initial flexural cracks occurred at near 70 kN, which is 40% higher than the specimen FNCP. At a load of about 420 kN, the horizontal shear cracks occurred between the concrete slab and the steel beam at the end region of the specimen FPCE1P. The bottom flange of the steel beam yielded at 680 kN, and the stresses in the tendons approached their yield strengths at 719 kN. The horizontal shear crack propagated into the maximum moment region at the maximum load of 737 kN, and the significant slip was observed between the concrete slab and the top flange of the steel beam with a sharp decrease of load. There was no further increase in the load from this point, but the load was maintained until the displacement reached about 110 mm, at which loading was terminated. In the specimen FPCE2P, a horizontal shear crack was observed at 450 kN, and the bottom flange yielded at 691 kN. The stresses in the tendons approached their yield strength ( pyf ) at 725 kN, and the horizontal shear crack progressed into the maximum moment region at 745 kN, which finally led to the horizontal shear failure that was similar to the specimen FPCE1P. Fig. 9(b) shows the end slip between the concrete slab and the steel beam measured at the end of specimens. It can be seen that the end slip was initiated at a load level of 394 kN in the specimens FPCE1P and FPCE2P. As shown in Fig. 10(a), in the specimens FNCP, FPCE1P and FPCE2P that had no shear connector, the significant increase of the slip between the concrete slab and the steel beam occurred and led to the horizontal shear failure.
A horizontal shear crack also occurred in the specimens FPCE2PS and FPCE2GS that had shear studs, but it occurred at 690 kN, which was about 60 % higher than that in the specimens FPCE1P and FPCE2P that had no shear stud. In addition, as shown in Fig. 9(a), the specimen FPCE2PS showed a continuous increase of load without any marked drop even after the horizontal shear crack occurred. The loading were terminated when there was no further increase in the load after the deflection reached over 100 mm at the maximum load of 804 kN. The specimen FPCE2GS also showed a very similar behavior with that of the specimen FPCE2PS. There was a slight decrease in the load when the horizontal shear crack was occurred at 750 kN, but it was immediately recovered, and the test ended at the maximum load of 830 kN and the displacement of about 110 mm. The overall behavior of the specimen FPCE2PS, in which the corrugated web and the top and bottom flanges were partially welded, was in fact almost similar to that of the specimen FPCE2GS, where the entire length was welded. Thus, it was suggested that the sufficient performance of the prestressed composite beam can be achieved by the partial welding, which can significantly improve the constructability of the corrugated webbed steel beam, compared to the gross welded member. In the specimens FPCE2GS and FPCE2PS, the slip was initiated at the load level of near 600 kN, as shown in Fig. 9(b), which was much greater than the specimens FPCE1P and FPCE2P. Thus, it can be confirmed that shear
2098

0
100
200
300
400
500
600
700
800
900
0 20 40 60 80 100 120
Loa
d(k
N)
Deflection (mm)
FNC
FPCE1
FPCE2
FPCE2PS
FPCE2GS
①
②
③
④
⑤
①
②
③
④
⑤
Horizontal shear crack observedFlexural cracking
Tension flange yieldingMaximum load
P
P
P
0
100
200
300
400
500
600
700
800
900
0 0.1 0.2 0.3 0.4 0.5
Loa
d (k
N)
End slip (mm)
FPCE1P
FPCE2P
FPCE2PS
FPCE2GS
394.1 kN (without shear connector)
600.7 kN (with shear connector)
(a) Load-deflection curves (b) Load-slip curves Fig. 9 Load-slip-deflection relations of specimens
(a) Specimens without shear connector (b) Specimens with shear connectors Fig. 10 Types of horizontal shear cracks
connector can significantly increase the composite action between the steel beam and the concrete slab, which can ensure a good serviceability of the composite beam. As shown in Fig. 10(b), the horizontal shear failure plane had expanded to the top of the shear studs in the specimens FPCE2GS and FPCE2PS having shear studs.
As aforementioned, the changes in tendon stresses during the test were observed by the load cells installed at the ends of all prestressed specimens. The load cell data indicated that there was no change in the tendon stresses at the member ends from the beginning of the loading to the maximum load, which means the tendon and the concrete remained completely bonded until the end of the test. Fig. 11 shows the vertical deflection of specimens measured by the LVDTs. There was an about 25 % decrease of the vertical deformations in the prestressed specimens compared to the non-prestressed specimen under the same load level. For example, at a load of 490 kN, the specimen FNCP showed 24.3 mm of deflection at the midspan, whereas the specimen FPCE2P showed 18.1 mm. In other words, the proposed composite beam is more advantageous in applying to a long-span structure, and it can effectively control the deflection by utilizing the high-strength prestressing tendons without increasing the height of the cross-section. The effect of tendon profile on the overall deflection behavior of the prestressed composite beam can be observed from comparing the
2099

results in Figs. 11(b) and 11(c) as the specimen FPCE2P had two draped points in its tendon layout similar to the shape of bending moment diagram while the specimen FPCE1P had one draped point. There was no difference in their deflection behavior, which indicated that the tendon profile have little influence on the member deflection in these prestressed composite members. The comparison between the results shown in Figs. 11(d) and 11(e) can show any difference in their deflection, if any, according to the welding method applied between the corrugated webs and flanges. The deflection of the partially welded specimen FPCE2PS was almost the same with that of the fully welded specimen FPCE2GS, which indicates that a good flexural performance of the prestressed composite beam can be achieved by the partial welding method that can significantly reduce the time and cost for the fabrication of the corrugated webbed steel beam.
-110
-100
-90
-80
-70
-60
-50
-40
-30
-20
-10
0
0 1000 2000 3000 4000 5000 6000
Def
lect
ion
(mm
)
Location from beam left end (mm)
98kN
196kN
294kN
392kN
490kN
(a) FNCP
-110
-100
-90
-80
-70
-60
-50
-40
-30
-20
-10
0
0 1000 2000 3000 4000 5000 6000
Def
lect
ion
(mm
)
Location from beam left end (mm)
98kN
196kN
294kN
392kN
490kN
588kN
686kN
MAX-110
-100
-90
-80
-70
-60
-50
-40
-30
-20
-10
0
0 1000 2000 3000 4000 5000 6000
Def
lect
ion
(mm
)
Location from beam left end (mm)
98kN
196kN
294kN
392kN
490kN
588kN
686kN
Max
(b) FPCE1P (c) FPCE2P
-110
-100
-90
-80
-70
-60
-50
-40
-30
-20
-10
0
0 1000 2000 3000 4000 5000 6000
Def
lect
ion
(mm
)
Location from beam left end (mm)
98kN
196kN
294kN
392kN
490kN
588kN
686kN
Max -110
-100
-90
-80
-70
-60
-50
-40
-30
-20
-10
0
0 1000 2000 3000 4000 5000 6000
Def
lect
ion
(mm
)
Location from beam left end (mm)
98kN
196kN
294kN
392kN
490kN
588kN
686kN
Max
(d) FPCE2GS (e) FPCE2PS Fig. 11 Deflection of specimens at various loading stages
2100

3.3 Crack Patterns and Failure Modes Fig. 12 shows the observed crack patterns of specimens. In the specimen
FNCP, the flexural cracks in the maximum moment region propagated deeply up to the concrete slab at a load of 550 kN as well as its ultimate failure load. There were relatively small numbers of cracks, on which strains were concentrated, and consequently, the maximum crack widths went as large as 2.5 mm and 3.0 mm at 550 kN and its ultimate load, respectively. The horizontal shear cracks also occurred near the member ends and propagated toward the midspan. In the specimen FPCE1P, the flexural cracks rarely progressed into the concrete slab even at the ultimate failure load, unlike in the specimen FNCP. The flexural cracks were well distributed along the member length and the crack widths were relatively small compared to the specimen FNCP. The crack patterns and distributions in the specimen FPCE2P were also very similar to those of the specimen FPCE1P, except that the horizontal shear cracks developed from both ends in the specimen FPCE2P. More flexural cracks formed with smaller crack widths in the specimens FPCE2PS and FPCE2GS, compared to the specimens aforementioned, and the numbers and widths of the horizontal shear cracks were also relatively small in these specimens. The maximum crack width of the specimens FPCE2PS and FPCE2GS at the failure load was about 3 mm, even though they failed at much higher loads than the other specimens. At the load level near 550kN, the maximum crack width in the specimens FPCE1P and FPCE2P was only 0.6 mm, whereas the maximum crack width in the specimen FNCP was 2.5 mm, and the crack widths in the specimens FPCE2PS and the FPCE2GS with shear studs were 0.40 mm and 0.45 mm, respectively. This shows that the prestressed composite beam proposed in this study can provide a good crack control ability, which is due to the effects of the tendons and the prestress.
Fig. 13 shows the concrete strains obtained from the gauges attached on the top face of the concrete slab, as shown in Fig 6(c), to assess the effective width of the concrete slab. The compressive strains of the slab in each specimen was distributed nearly same along the slab width, which means that a 1,100mm flange width in the composite section is within the effective width of the T-shaped beam. The specimen FNCP failed at the compressive strain of 0.0025, which is nearly the maximum compressive strain of the concrete ( cu ), and thus, it seems that the horizontal shear failure occurred at very close to the ultimate strength. However, in the specimens FPCE1P and FPCE2P, the compressive strain at ultimate was only about 0.0015, which means that the horizontal shear failure occurred long before it reached the flexural strength of the composite section. In the specimens FPCE2PS and FPCE2GS, however, the compressive strain at ultimate reached 0.003, the maximum compressive strain of the concrete ( cu ), which implies that they reached their flexural strength even though they showed a horizontal shear failure. Thus, it was confirmed that appropriate amount of shear stud are also very effective in preventing or delaying horizontal shear failure for the prestressed composite member.
2101

Load: 550 kN, Maximum crack width: 2.5 mm
Ultimate load: 600 kN, Maximum crack width: 3 mm
(a) FNCP
Load: 550 kN, Maximum crack width: 0.6 mm
Ultimate Load: 737 kN, Maximum crack width: 1 mm
(b) FPCE1P
Load: 550 kN, Maximum crack width: 0.6 mm
Ultimate Load: 745 kN, Maximum crack width: 1 mm
(c) FPCE2P
Load: 550 kN, Maximum crack width: 0.45 mm
Ultimate Load: 804 kN, Maximum crack width: 3 mm
(d) FPCE2PS
Load: 550 kN, Maximum crack width: 0.4 mm
Ultimate Load: 830 kN, Maximum crack width: 3 mm
(e) FPCE2GS
Fig. 12 Crack patterns and maximum crack widths
2102

-0.0060
-0.0050
-0.0040
-0.0030
-0.0020
-0.0010
0.00000 250 500 750 1000
Stra
in
Location (mm)
98kN
196kN
294kN
392kN
490kN
540 kN
573 kN
600 kN
621 kN
Failure loadConcrete strain gauge
(a) FNCP
-0.0060
-0.0050
-0.0040
-0.0030
-0.0020
-0.0010
0.00000 250 500 750 1000
Stra
in
Location (mm)
98kN
196kN
294kN
392kN
490kN
588kN
686kN
745kN
Seperated load
Failure loadConcrete strain gauge-0.0060
-0.0050
-0.0040
-0.0030
-0.0020
-0.0010
0.00000 250 500 750 1000
Stra
in
Location (mm)
98kN
196kN
294kN
392kN
490kN
588kN
686kN
745kN
Seperated load
Failure loadConcrete strain gauge
(a) FPCE1P (c) FPCE2P
-0.0060
-0.0050
-0.0040
-0.0030
-0.0020
-0.0010
0.00000 250 500 750 1000
Stra
in
Location (mm)
98kN
196kN
294kN
392kN
490kN
588kN
686kN
736kN
Failure loadConcrete strain gauge-0.0060
-0.0050
-0.0040
-0.0030
-0.0020
-0.0010
0.00000 250 500 750 1000
Stra
in
Location (mm)
98kN
196kN
294kN
392kN
490kN
588kN
686kN
736kN
Failure loadConcrete strain gauge
(d) FPCE2PS (e) FPCE2GS Fig. 13 Concrete strain at the extreme top fiber of slab concrete
4. ANALYTICAL STUDY
4.1 Flexural Behavior The flexural behavior of a prestressed composite beam with a corrugated web can be
easily estimated by the layered analysis model (Kim et al. 2011), as shown in Fig. 14. In other words, the flexural moment and corresponding curvature can be determined by assuming the strain in the extreme top fiber of the section ( t ), and calculating the strain, stress, and corresponding force in each layer while changing the neutral axis depth until the equilibrium condition of the sectional forces on a cross-section is satisfied. In this study, the overall moment-curvature relationships of the specimens were determined by repeating this calculation process for all imposed strains of the extreme top fiber of the section ( t ) until t reaches cu . The constitutive equation for concrete proposed by Collins and Mitchell (1991) was adopted for the nonlinear flexural
2103
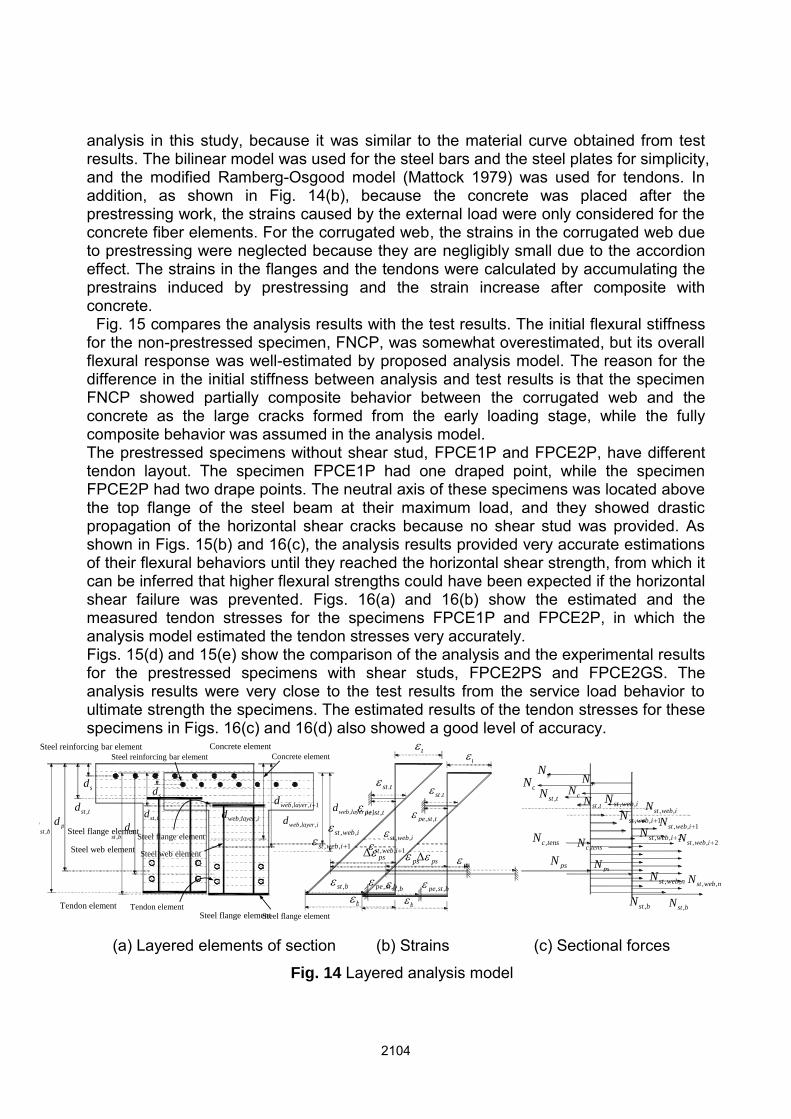
analysis in this study, because it was similar to the material curve obtained from test results. The bilinear model was used for the steel bars and the steel plates for simplicity, and the modified Ramberg-Osgood model (Mattock 1979) was used for tendons. In addition, as shown in Fig. 14(b), because the concrete was placed after the prestressing work, the strains caused by the external load were only considered for the concrete fiber elements. For the corrugated web, the strains in the corrugated web due to prestressing were neglected because they are negligibly small due to the accordion effect. The strains in the flanges and the tendons were calculated by accumulating the prestrains induced by prestressing and the strain increase after composite with concrete.
Fig. 15 compares the analysis results with the test results. The initial flexural stiffness for the non-prestressed specimen, FNCP, was somewhat overestimated, but its overall flexural response was well-estimated by proposed analysis model. The reason for the difference in the initial stiffness between analysis and test results is that the specimen FNCP showed partially composite behavior between the corrugated web and the concrete as the large cracks formed from the early loading stage, while the fully composite behavior was assumed in the analysis model. The prestressed specimens without shear stud, FPCE1P and FPCE2P, have different tendon layout. The specimen FPCE1P had one draped point, while the specimen FPCE2P had two drape points. The neutral axis of these specimens was located above the top flange of the steel beam at their maximum load, and they showed drastic propagation of the horizontal shear cracks because no shear stud was provided. As shown in Figs. 15(b) and 16(c), the analysis results provided very accurate estimations of their flexural behaviors until they reached the horizontal shear strength, from which it can be inferred that higher flexural strengths could have been expected if the horizontal shear failure was prevented. Figs. 16(a) and 16(b) show the estimated and the measured tendon stresses for the specimens FPCE1P and FPCE2P, in which the analysis model estimated the tendon stresses very accurately. Figs. 15(d) and 15(e) show the comparison of the analysis and the experimental results for the prestressed specimens with shear studs, FPCE2PS and FPCE2GS. The analysis results were very close to the test results from the service load behavior to ultimate strength the specimens. The estimated results of the tendon stresses for these specimens in Figs. 16(c) and 16(d) also showed a good level of accuracy.
Steel web element
sd
,st td
pd,st bd
Steel reinforcing bar element Concrete element
, ,web layer id, , 1web layer id
Steel flange element
Tendon elementSteel flange element
,st b , ,pe st b
b
psps
, ,st web i
, , 1st web i
, ,pe st t
.st t
t
sN
cN,st tN
, ,st web iN
, , 1st web iN
, ,st web nN
,st bN
psN
,c tensN , , 2st web iN Steel web element
sd
,st td
pd,st bd
Steel reinforcing bar element Concrete element
, ,web layer id, , 1web layer id
Steel flange element
Tendon elementSteel flange element
,st b , ,pe st b
b
psps
, ,st web i
, , 1st web i
, ,pe st t
.st t
t
sN
cN,st tN
, ,st web iN
, , 1st web iN
, ,st web nN
,st bN
psN
,c tensN , , 2st web iN
(a) Layered elements of section (b) Strains (c) Sectional forces
Fig. 14 Layered analysis model
2104

0
100
200
300
400
500
600
700
800
900
1000
-5 0 5 10 15 20 25 30 35 40 45 50M
omen
t (kN
·m)
Curvature (rad/km)
FNC_Test Results
Flexural behavior model
Mattock Eq. 8
Li and Makawa Eq. 9
AASHTO-LRFD Eq. 10
Eq. 11
Horizontal shear strength
7
8
9
10
(a) FNCP
0
100
200
300
400
500
600
700
800
900
1,000
-5 0 5 10 15 20 25 30 35 40 45 50
Mom
ent (
kN·m
)
Curvature (rad/km)
FPCE1_Test Results
Flexural behavior model
Mattock Eq. 8
Li and Maekawa Eq. 9
AASHTO-LRFD Eq. 10
Eq. 11
Horizontal shear strength
7
8
9
100
100
200
300
400
500
600
700
800
900
1000
-5 0 5 10 15 20 25 30 35 40 45 50
Mom
ent (
kN·m
)
Curvature (rad/km)
FPCE2_Test Results
Flexural behavior model
Mattock Eq. 8
Li and Makawa Eq. 9
AASHTO-LRFD Eq. 10
Eq. 11
Horizontal shear strength
7
8
9
10
(b) FPCE1P (c) FPCE2P
0
100
200
300
400
500
600
700
800
900
1000
-5 0 5 10 15 20 25 30 35 40 45 50
Mom
ent (
kN·m
)
Curvature (rad/km)
FPCE2PS_Test Results
Flexural behavior model
0
100
200
300
400
500
600
700
800
900
1000
-5 0 5 10 15 20 25 30 35 40 45 50
Mom
ent (
kN·m
)
Curvature (rad/km)
FPCE2GS_Test Results
Flexural behavior model
(d) FPCE2PS (e) FPCE2GS Fig. 15 Comparisons of analysis and test results
0
200
400
600
800
1000
1200
1400
1600
1800
0 100 200 300 400 500 600 700 800 900
Tend
on st
ress
(MPa
)
Applied load (kN)
Measured stresses
Calculated stresses
Maximum stress
0
200
400
600
800
1000
1200
1400
1600
1800
0 100 200 300 400 500 600 700 800 900
Tend
on st
ress
(MPa
)
Applied load (kN)
Measured stresses
Calculated stresses
Maximum stress
(a) FPCE1P (b) FPCE2P
2105

0
200
400
600
800
1000
1200
1400
1600
1800
0 100 200 300 400 500 600 700 800 900
Tend
on st
ress
(MPa
)
Applied load (kN)
Measured stresses
Calculated stresses
Maximum stress
0
200
400
600
800
1000
1200
1400
1600
1800
0 100 200 300 400 500 600 700 800 900
Tend
on st
ress
(MPa
)
Applied load (kN)
Measured stresses
Calculated stresses
Maximum stress
(c) FPCE2PS (d) FPCE2GS Fig. 16 Tendon stresses
4.2 Horizontal Shear Strength As shown in Fig. 17(a), when the top flange of the steel beam is placed deep inside
the concrete slab, the neutral axis can be located lower than the top flange of the steel beam. In this case, therefore, shear connector may not be necessary, because the bond stresses developed in the shear bond perimeter (Mullett 1998), as marked in Fig. 17 (a), can resist the horizontal shear force. When the effective width of a T-shaped composite section is considerably large and reinforcing bars are provided in the concrete slab, however, the neutral axis can be located above the top flange of the steel beam as shown in Fig. 17(b). In such a case, the existing approach adopting the bond resistance mechanism developed in the shear bond perimeter can estimate horizontal shear strength of composite beam un-conservatively, because the horizontal shear failure surface can be developed in a different way, as shown in Figs. 17(b) and 17(c), for instance. Therefore, in this study, three specimens without shear connectors, i.e, FNCP, FPCE1P and FPCE2P, were designed to have their neutral axes located at above the top flange of the corrugated steel beam. Because it was difficult to fabricate the concrete slab as wide as the effective width specified in the design codes (AASHITO 2004, ACI Committee 318 2005, AISC 2001) due to the limited conditions of laboratory facilities, the locations of the neutral axis were adjusted by increasing the amount of the longitudinal compression bars in this study, as shown in Fig. 5(b). As a result, all three specimens without shear stud showed horizontal shear failures, at which there were slippages and separations between the concrete slab and the top flange of the steel beam. The horizontal shear strength of these specimens can be calculated by summing the shear bond strength developed on the surface of the top flange of the corrugated steel beam ( bV ) and the direct shear resistance provided in the inclined concrete failure surfaces ( dirV ), as shown in Figs. 17(b) and 17(c). Thus, thetotal horizontal shear strength ( hnV ) can be expressed, as follows:
hn b dir sb ft a dir w aV V V f b L v t L (6)
where sbf is the average bond strength, and 0.6 MPa is used in this study as suggested by Mullett. ftb is the top flange width of the steel beam, wt is the width of the concrete
failure surface, aL is the length of the concrete failure surface in the longitudinal
2106

direction of the composite beam, and the shear span length was used for aL . With regard to the direct shear stress at the failure surface ( dirv ), various equations have been proposed (Li and Maekawa 1987, Li et al. 1989, Mattock 2001), as shown in Table 5. Based on the test results performed in this study, the direct shear strength of the concrete ( dirv ) on the failure surface of the specimens was estimated as 6.77 MPa. The horizontal shear strengths ( hnV ) of the specimens were calculated by substituting the direct shear strength equations shown in Table 5, including the direct shear strength ( dirv ) of the concrete obtained from the test results performed in this study, into Eq. (6). These estimated shear strengths are expressed by different types of horizontal lines in Fig. 14. From the observations on the shear strength prediction equations of several researchers (Li and Maekawa 1987, Li et al. 1989, Mattock 2001), the design criteria, and the experiment results of this study, it is considered that the horizontal shear strength ( hnV ) of the composite member can be predicted properly by Eq. (6) adopting the direct shear strength ( dirv ) of 6.0 MPa. On the other hand, the specimens with shear connectors, FPCE2GS and FPCE2PS, showed satisfactory horizontal shear resistances until they reached the flexural capacity. Thus, it is confirmed that the sufficient horizontal shear strength can be obtained by placing shear studs in accordance with the design provisions specified in codes (AISC 2001).
Table 5 Horizontal direct shear strength models
Researchers Equations (unit: MPa)
Mattock (2001) 0.1 dir cv f ' (7)Li and Maekawa(1987)and Li et al.(1989) 1/3 2 2 23.83 /dir cv f ' w
(8)
AASHTO-LRFD specification (2004) 2.8dirv (9)
test results in this study 6.77dirv § (10)
Bonded perimeterNeutral axis line
Neutral axis plan
Bonded perimeter
- section view - - 3D view - (a) Definition of bond perimeter (Heo et al. 2002)
2107

Bond surface Horizontal shear crack(failure plane)
Neutral axis lineat shear failure
Neutral axis planat shear failure
Bond surface
Horizontal shear crack(failure plane)
- section view - - 3D view - (b) Potential failure plane and bond surface
(c) Horizontal shear failure plane of composite members Fig. 17 Description of horizontal shear plane
5. CONCLUSION In this study, experiments on the prestressed steel-concrete composite beams with
corrugated webs, which was developed for the application to the long-span structures with the reduction of floor height, were carried out with the key test parameters of prestress, tendon layout, shear connector, and welding method. Based on the experiment and analysis results, the following conclusions were drawn:
1. It is experimentally confirmed that the effective prestress introduced in the top and bottom flanges, the main flexural resistance components, of the corrugated webbed steel beams can be very efficiently increased by the accordion effect, which is the important characteristic of corrugated steel plate. 2. The accordion effect of steel beams with corrugated webs can be estimated by the simple method based on the concept of the effective moment of inertia and the effective web area, which is expected to be easily applied to the design of steel beams with corrugated webs in practice. 3. The flexural behavior model based on a layered analysis accurately estimated the flexural responses of the prestressed composite beams with corrugated webs by
2108

properly considering the nonlinearity of materials and the stresses in concrete, tendons, and steel beams. 4. The test results of the specimen fabricated by the partial welding method, in which the corrugated webs and the top and bottom flanges were partially welded, showed that the sufficient flexural performance can be achieved by the partial welding method that significantly reduces the time and cost for the fabrication of the corrugated webbed steel beam. 5. The horizontal shear failure modes should be carefully taken into account for the design of encased composite beams, especially when the neutral axis depth is small, and the horizontal shear strength can be achieved effectively by the properly designed shear studs. ACKNOWLEDGEMENT This research was supported by a grant (12 High-tech Urban C04) from High-tech
Urban Development Program funded by Ministry of Land, Transport and Maritime Affairs of Korean government.
REFERENCES ACI Committee 318 (2005), Building Code Requirements for Structural Concrete (ACI
318-08) and Commentary (318R-08), ACI, Farmington Hills, MI. AISC (2001), Manual of steel construction-load and resistance factor design, third
edition, AISC, Chicago, IL. American Association of State Highway and Transportation Officials (2004), AASHTO
LRFD Bridge Design Specifications, third edition, AASHTO, Washington, DC. Ayyub, B.M., Sohn, Y.G. and Saadatmanesh, H. (1992a), “Prestressed Composite
Girders. I: Experimental Stusy for Negative Moment,” J. of Struct. Engr., ASCE, 118(10), 2743-2762.
Ayyub, B.M., Sohn, Y.G. and Saadatmanesh, H. (1992b), “Prestressed Composite Girders. II: Analytical Stusy for Negative Moment,” J. of Struct. Engr., ASCE, 118(10), 2763-2783
Ayyub, B.M., Sohn, Y.G. and Saadatmanesh, H. (1990), “Prestressed Composite Girders under Positive Moment,” J. of Struct. Engr., ASCE, 116(11), 2931-2951.
Bae, D.B. and Lee, K.M. (2007), “Behavior of Preflex Beam in Manufacturing Process,” KSCE J. of Civ. Engr., 19(3), 247~258.
Chen, S. and Gu, P. (2005), “Load Carrying Capacity of Composite Beams Prestressed with External Tendons under Positive Moment,” J. Constr. Steel Res., 61(4), 515–530.
Collins, M.P. and Mitchell, D. (1991), Prestressed Concrete Structures, Prentice Hill. Driver, R. G., Abba, H. H., and Sause, R. (2006), “Shear Behavior of Corrugated Web
Bridge Girders,” Journal of Structural Division, ASCE, 132(2), 195~203. Drury, J.C. (2004), Ultrasonic Flaw Detection for Technicians, third edition, Silverwing
Ltd. Elgaaly, M., Seshadri, A. and Hamilton, R.W. (1997), “Bending Strength of Steel
Beams with Corrugated Webs,” J. of Struct. Engr., ASCE, 123(6), 772-782.
2109

Heo, B.Y.W., Kwak, M.K., Bae, K.W. and Jeong, S.M. (2002), “Flexural Capacity of Profiled Steel Composite Beams: Deep Deck Plate,” J. of Korean Soc. of Steel Constr., 14(5), 593~602.
Huang, L., Hikosaka, H. and Komine, K. (2004), “Simulation of Accordion Effect in Corrugated Steel Web with Concrete Flanges,” Compt. & Struct., 82(23-26), 2061~2069.
Khalid, Y.A., Chan, C.L., Sahari, B.B. and Hamouda, A.M.S. (2004), “Bending Behavior of Corrugated Web Beam,” J. of Mat. Proc. Techn., 150(3), 242-254.
Kim, J.H., Park, K.H., Hwang, Y.K., Choi, Y.M. and Cho, H.N. (2002), “Experimental Study for the Development of Steel-Confined Concrete Girder,” J. of Korean Soc. of Steel Constr., 14(5), 593~602.
Kim, K.S., Lee, D.H., Choi, S.M., Choi, Y.H. and Jung, S.H. (2011), “Flexural Behavior of Prestressed Composite Beams with Corrugated Webs: Part I. Development and Analysis,” Comp. Part B: Engr., 42(6), 1603-1616.
Kim, K.S. and Lee, D.H. (2011), “Flexural Behavior of Prestressed Composite Beams with Corrugated Webs: Part II. Experiments and Verification,” Comp. Part B: Engr., 42(6), 1617-1629.
Lawson, R.M., Mullett, D.L. and Rackham, J.W. (1997), “Design of Asymmetric Slim-floor Beam Using Deep Composite Decking,” The Steel Constr. Inst., Publication No. 175.
Li, B. and Maekawa, K. (1987), “Contact density model for cracks in concrete,” IABSE reports, Publication No. 54, 52~62.
Li, B., Maekawa, K. and Okamura, H. (1989), “Contact Density Model for Stress Transfer across Cracks in Concrete,” J. of the Fac. of Engr., University of Tokyo, 40(1), 9-52.
Lorenc, W. and Kubica, E. (2006), “Behavior of Composite Beams Prestressed with External Tendons: Experimental Study,” J. Constr. Steel Res., 62(12), 1353~1366.
Mattock, A.H. (2001), “Shear Friction and High-Strength Concrete,” ACI Struct. J., 98(1), 50~59.
Mattock, A.H. (1979), “Flexural Strength of Prestressed Concrete Sections by Programable Calculator,” PCI J., 24(1), 32~54.
Mullett, D.L. (1992), “Slim Floor Design and Construction,” The Steel Constr. Inst., Publication No. 110.
Mullett, D.L. (1998), Composite floor system, Blackwell science Ltd, 72~73. Oh, J.Y., Lee, D.H. and Kim, K.S. (2012), “Accordion Effect in Prestressed Steel
Beams with Corrugated Webs,” Thin-Walled Struct., 57(1), 49~61. Salmon, C.G. and Johnson, J.E. (1996), Steel Structures: Design and Behavior, 4th
ed., Harper Collins.
2110