Embed Size (px)
Citation preview

This is a repository copy of Experiments on the pressure distribution and frictional torque in articulating pin joints.
White Rose Research Online URL for this paper:http://eprints.whiterose.ac.uk/94627/
Version: Accepted Version
Article:
Zhu, J., Pugh, S., Dwyer-Joyce, R.S. et al. (3 more authors) (2010) Experiments on the pressure distribution and frictional torque in articulating pin joints. Proceedings of the Institution of Mechanical Engineers, Part J: Journal of Engineering Tribology, 224 (10). pp. 1153-1162. ISSN 1350-6501
https://doi.org/10.1243/13506501JET767
[email protected]://eprints.whiterose.ac.uk/
Reuse
Unless indicated otherwise, fulltext items are protected by copyright with all rights reserved. The copyright exception in section 29 of the Copyright, Designs and Patents Act 1988 allows the making of a single copy solely for the purpose of non-commercial research or private study within the limits of fair dealing. The publisher or other rights-holder may allow further reproduction and re-use of this version - refer to the White Rose Research Online record for this item. Where records identify the publisher as the copyright holder, users can verify any specific terms of use on the publisher’s website.
Takedown
If you consider content in White Rose Research Online to be in breach of UK law, please notify us by emailing [email protected] including the URL of the record and the reason for the withdrawal request.

Experiments on the Pressure Distribution and Frictional Torque in
Articulating Pin Joints
J. Zhu1, S. Pugh
1, R.S. Dwyer-Joyce
1, A. Beke
2, G. Cumner
2, T. Ellaway
2
1 Department of Mechanical Engineering, The University of Sheffield, Mappin Street, Sheffield, S1 3JD
2 Messier-Dowty Limited, Cheltenham Road East, Gloucester, GL2 9QH
Abstract
In its simplest form, aircraft landing gear consists of large structural members connected by
pin joints that allow articulation, and hydraulic actuators for deployment. The design of these
pin joints is critical to successful operation. In this paper we explore two related aspects of
pin joint design; firstly the contact pressure distribution within the joint, and secondly the
frictional torque required to rotate the joint. The former is important in stress analysis, and
the latter in defining the required actuation force. The joint consists of a pin that is located
within four bushes that are fixed into the structural member. Grease is fed into the bearing
cavity.
A purpose built test rig was designed and built to hydraulically load and articulate a specimen
pin within its bushes. A novel ultrasonic method was used to measure the contact pressure
between the pin and bushes when the joint is subjected to a constant radial load. The method
is based on recording the proportion of an ultrasonic pulse that reflects from the pin-bush
contact. When there is no contact the pulse is fully reflected and when contact takes place the
pulse is partially reflected. The proportion of the pulse reflected depends on the conformity of
the surfaces are and hence the contact pressure. The pressure profiles measured in this way
were found to be approximately cosinusoidal, extending over an arc of ±60º regardless of the
radial load.
The rotational torque and angular displacement were also measured during joint articulation
cycles for a range of applied lateral pin loads. The results showed articulation torques ranging
from 20 to 150 kNm were required to rotate the pin as the lateral load was increased from 5
to 40 kN. An estimate of the friction coefficient between pin and bush can be obtained
directly from this lateral load and torque data. However, an improved measurement, that
includes the effect of the radial component of the lateral loading force, was obtained by
combining the pressure distribution data with the torque data. Friction coefficients in the
range 0.08 to 0.11 were deduced in this way and were found to increase slightly with load.
This indicates that the joint operates in boundary lubricated regime and that grease
entrainment is an important factor.
Keywords
pin joints, bushings, articulating joints, ultrasonic reflection, contact pressure, frictional
torque
Introduction
Landing Gear Pin Joints
Wherever structural parts are required to articulate joints are required. A typical configuration
of such a joint is a pin that is free to rotate inside bushes that are bonded or press fitted to
each of the structural members. Such joints are found in many types of engineering
machinery from heavy mining equipment to the latest evolution of the space shuttle. They
play a key role in the operation and durability of articulating mechanisms.

This study focuses on the design of pin joints in aircraft landing gear. The landing gear is
required to fold inside the aircraft fuselage. The articulation in landing gear systems is
achieved by the use of a whole system of varied pin joints and members. A photograph of one
such landing gear is included as Figure 1. The locking stay pin has been selected as a test
specimen for this study, this is also shown in Figure 1.
Figure 1. Photograph of landing gear and typical pin joint
This pin joint locates two articulating parts that form the locking mechanism for the gear. The
pin is hollow for weight reduction and manufactured from hard chrome plated 300M steel.
The hard chrome provides a wear and corrosion resistant surface that also has micropores that
can trap lubricant. The bush configuration consists of four aluminium bronze sleeves; two
pressed into each side of the adjacent members. The steel and bronze are mutually insoluble
so provide a good tribological pair [1]. The pin and bush contact is lubricated by an aerospace
grade grease. Each of the four aluminium bronze bushes have a circumferential groove
machined internally to allow distribution of grease. The grease is injected through grease
nipples and fed through bored channels in the members to the bushes. The pin joint is total
loss and the grease reserve is that which remains in the grooves and lubricant channels. This
means the joint requires re-lubrication at regular maintenance intervals.
Landing gear articulation is relatively slow so the joint does not see a fast rotation. The
relative rotation between greased pin and bushes is typically 12 deg/s, giving a surface
velocity of 5.86 mm/sec. This particular joint articulates by ±50º during normal operation.
Tribological Performance of Pin Joints
The pin joint bears a close similarity with a conventional journal bearing. These bearings
normally operate with a lubricant film separating the shaft, or journal, and the bush. The
science behind the lubrication of such configurations is well understood and pressure
distributions and frictional torque straightforward to calculate [2]. However, to achieve this
full separating lubricant film the rotational speed has to be sufficient to entrain lubricant.
In articulating pin joints this is rarely the case and the joints operate with considerable metal
to metal contact. This means that the frictional torque and wear life is difficult to predict and
this aspect of design is usually based on experiment. Glaeser & Dufrane [3] carried out a
series of such experiments specifically intended for aircraft landing gear applications. He
determined the friction and wear rate of a range of different bush materials for different
loading and environmental conditions.
Commonly the performance of bearings operating in this boundary lubrication regime are
defined using pressure - velocity PV charts. Glaeser and Dufrane [3] created such charts for
aerospace grade cast bronze bushes, although similar charts are available for many bush

materials [4]. The pressure in such charts is usually simply expressed as the load divided by
the projected bush area. This presupposes the contact area extends over half of the bush (i.e.
the wrap angle is 180º) and the pressure is uniformly distributed. This is clearly not the case
and there are several models to predict what the wrap angle between a pin and bush and the
resulting pressure distribution should be [5,6]. This is clearly important because it is this
pressure distribution and wrap angle controls wear progress [7].
The design and durability of landing gear pin joints therefore depends on the load capacity
and torque requirement to articulate the joint. These correspondingly depend on the pressure
distribution in the joint and the friction between the surfaces. This paper seeks to provide
experimental measurements of both of these parameters. Circumferential pressure
distributions within the pin joint assembly were measured by reflected ultrasound at the
pin/bush interface. The torque to articulate the pin was measured in a specially designed and
constructed hydraulic pin joint actuation tester. The pressure distributions and torque results
were then combined to predict the friction coefficient between the mating surfaces.
APPARATUS
Pin Joint Function Test Rig
The pin joint function test rig was designed to simulate both the loading and articulation of a
pin and bush assembly selected from an aircraft landing gear joint. To perform this, an
adapted Schenck tension-torsion apparatus POZ 0921 was used with a bespoke test head
designed to load the joint.
This apparatus used a double fork arrangement geometrically similar to the pin joint
arrangement found on the landing gear upper to lower side-stay pin highlighted in Figure 1.
Figure 2 shows a schematic of the test head assembly. The assembly consists of two forks.
Each side of the inner fork is press fitted with a pair of the test bushes. The outer fork uses a
pair of roller bearings to support the pin. In this way the test head only tests two bush pairs
rather than four.
The forks are then jacked apart by means of a hydraulic cylinder (an Enerpac low height
cylinder). This provides the lateral loading of the pin into the four bushes.
Figure 2. Schematic of the test head assembly from the pin joint function test rig.
In order to drive and turn the pin, four slots were wire cut at one end, with each enabled by a
direct line axial coupling via a splined interface to the torsion drive shaft. A sketch is shown
in Figure 3.

Figure 3. Sketch of the pin drive assembly.
Another design feature of this rig was the use of an O-ring seal between the pin and drive
shaft which enabled the pin to hold water. This effectively turned the pin into its own water
bath for which to undertake the ultrasound analysis of the pin and bush contacts.
The whole of this test head assembly is mounted onto a torsional hydraulic assembly that is
part of the Schenck tension torsion apparatus. This torsional actuator drives the spline shaft
shown in Figure 3. The photographs included as figure 4 shows the test head assembly and its
location on the torsional actuator.
(a) (b)
Figure 4. Photographs of (a) the pin joint test head, (b) the test head installed on the Schenck
torsional actuator.
Pin and Bushings Specimens
A pin and four bushes were obtained from an actual upper to lower side-stay pin joint and
were used as the test specimens. The single chromed 300M pin, OD 56 mm (tolerance f6),
ID42 mm, length 200.5 mm mated with four bushes with the radial clearance of 25 µm. The
four aluminium bronze bushes had an inner diameter ID of 56 mm (tolerance h7) and a length
of 18.5 mm. Grease lubrication was operated with two axial lubrication grooves in each bush.
Figure 5 shows the specimen picture of pin/bush contact.

Figure 5. Photograph of the pin and four bushes.
Instrumentation
The torsional actuator was fitted with a strain gauge based internal torque sensor. It should be
noted that the torque transducer also measured the torque between the two support ball
bearings, however this torque is assumed to be low compared with that the from the pin
joints. A typical friction coefficient expected for the ball bearings used here is µ=0.0011.
Later in this work we measure friction coefficients in the region of 0.1; thus the rolling
bearing contribution is believed to be of the order of 1%. In addition, the torque in the ball
bearings was measured when unloaded (i.e. the pin not in place) and found to be within the
noise range of the transducer, and so could be controlled. The radial loading hydraulic
cylinder had a simple load cell read out.
The tension hydraulic actuator could be driven under both torque and angular displacement
control. For all work in this paper only the displacement control method was used. A
sinusoidal drive signal was inputted via a function generator. Both the reacted torque and the
achieved displacement were then recorded throughout the cycle. Figure 6 shows a sample of
the measured displacement over 60 seconds of testing, which is clearly very close to the
desired sinusoidal input.
-60
-40
-20
0
20
40
60
0 10 20 30 40 50 60
Time, seconds
Angle
, degre
es
Figure 6. Typical angular displacement variation during the test.
The overall monitoring, recording and control of the rig was via a PC using a software
program written in Labtech Notebook. During testing the time of the duration of each test, the
angular position and speed of pin relative to the start position and the frictional torque
required to turn were recorded.
Ultrasonic Reflection Sensor and Instrumentation
The method for the measurement of contact pressure requires the measurement of reflection
of an ultrasonic pulses from points around the interface (the principle is described later in the
paper). A bespoke 25 MHz transducer was commissioned (from NDT Systems Ltd) for this
application. The transducer incorporates a focusing lens, a long stem and a mirror. In this way
a focused beam can be made to strike the interface at a normal contact angle. The bore of the
pin was filled with distilled water to act as the couplant bath. The transducer was then
immersed in this water bath. The transducer was located on a positioning table that permitted
rotary motion (about the pin axis) and vertical translation. The transducer was located
manually by adjustment of this traversing system.
Figure 7 shows a schematic layout of the instrumentation. The ultrasonic pulser receiver
(UPR) generated a voltage signal that caused the piezoelectric transducer to be excited. The
reflected pulse was received by the same transducer (i.e. pulse-echo mode), amplified, and
stored on a digital oscilloscope. The stored reflected signals were passed to a personal
computer (PC) for processing.

Figure 7. Schematic representation of ultrasonic pulsing and receiving system
The driver software was written in software program LabView which positioned the
transducer, controlled the sending and receiving of pulses, downloaded reflected pulse
waveforms, and performed the required signal processing. The reflection coefficient was
recorded at each transducer position. This was then related to the interface stiffness and
contact pressure. Full details of the principles and experimental approach are given in
references [8,9].
Loading Conditions
Test sequences were carried out by increasing the lateral load on the pin using the Enerpac
hydraulic cylinder up to 60kN. The pin was then articulated by the torsional actuator in
displacement control, whilst continually measuring the reactive torque. The maximum
angular displacement of pin was ±50° at a frequency of 0.12Hz. This gave a mean
articulation speed of 12 deg/s and surface velocity of 5.86mm/sec. These conditions were
realistic of that experienced by the pin joint in normal operation.
MEASUREMENT OF CONTACT PRESSURE
Ultrasonic Reflection and Reflection Coefficient
The ultrasonic transducer was used to emit discrete pulses of ultrasound. The pulses reflected
back from the interface were captured on the digital oscilloscope. The amplitude of the
reflected pulse was divided by the amplitude of the incident pulse to give the reflection
coefficient, R. The transducer was then moved to a new circumferential location and the
process repeated. In this way a profile of the reflection coefficient was recorded across the
interface. This was performed for each of the pin load cases. It should be noted that the pin
was stationary at all times and free for grease.
Figure 8 shows the reflection coefficient distributions with increasing lateral load from 5 to
60kN. The zero on the x-axis corresponds to a position diametrically opposite to the joint
loading direction. Reflection coefficients were measured in 10° increments, from -60° to 60°.
Digital scope
Download waveform to PC
Water bath
Interface
Ultrasonic
transducer
Control Signal

Figure 8. Ultrasound reflection coefficient distributions under increasing load
The plot shows the reflection coefficient is close to 1 for φ < -60o and φ > 60
o. In this region
the surface area are out of contact and the ultrasonic wave was fully reflected at the pin steel
to air contact. In the region of -60o < φ < 60
o the reflection fell below 1. Here there is contact
between the pin and bush surfaces and part of the wave amplified is transmitted.
In the hypothetical case where there is complete contact (i.e. no air gaps between the steel
and aluminium bronze) the reflection depends on the acoustic impedance mismatch of the
two materials:
21
21
zz
zzR
+
−= (1)
Where z is the acoustic impedance (a material property that is equal to the product of the
wave speed in the material and its density), and subscripts 1 and 2 refer to the material either
side of the interface.
The acoustic impedance of steel and bronze are z1(Steel) = 45.45 and z2(Bronze) = 31.28 MRayls
respectively. Equation (1) then gives for complete contact a reflection coefficient of R =
0.185. The lowest value achieved in the experiments is 0.71, clearly someway off a
completely conforming contact.
Reflection and Interface Stiffness
The reason for this greatly increased reflection is that the interface is not complete but is a
rough surface contact consisting of regions of contact and air gaps. When a wave strikes this
incomplete interface, it will pass through regions of asperity contact and be reflected back at
air gaps. The physical principle that governs the reflection of ultrasound at such a rough
surface interface is known as the ‘quasi-static spring model’ [9,10 and 11] and the reflection
is a function of the stiffness of the interface, K. The proportion of the wave reflected is then
given by:

( ) ( )( ) ( )2
21
22
21
2
21
22
21
zzKzz
zzKzzR
++
−+=
ω
ω (2)
Where, ω is the angular frequency of the wave (ω=2πf). A highly conformal interface with
few gaps is very stiff and allows transmission of ultrasound, whilst a interface with lots of air
gaps has very low stiffness and causes a lot of reflection.
Mathematically, the interface stiffness K (expressed per unit area) is the change in nominal
contact pressure, p required to cause unit approach of the mean lines of the surfaces [3]:
u
pK
d
d−= (3)
Where u is the separation of the mean lines of the roughness of the two surfaces. Equation (2)
was used to determine the interference stiffness from the reflection coefficient. The results
are shown in Figure 9.
Figure 9. Contact stiffness distributions under increasing load
As the surfaces are pressed together, more asperity contact occurs as the surfaces are in closer
conformity. It then requires a greater pressure increase to push them closer together. It has
been shown empirically [12] that the stiffness of an interface is proportional to the contact
pressure. Classical rough surface contact models [13] also predict this. Dwyer-Joyce et al
[12] conducted experiments that found at mean pressure below bulk yield the relationship
between the contact pressure and interfacial stiffness may be approximated as linear with a
constant m:
p = mK (4)
Calculation of Pressure Distribution
Equation (4) expressed the proportionality behaviour between contact stiffness and contact
pressure. If the total load on the contact, P is known and the complete stiffness map, K over

the contact area is measured, then it is possible to deduce the constant of proportionality.
Mathematically this is expressed by:
∑∑ ==AnomAnom
KdAmpdAP (5)
So the load on the pin joint is equal to the sum of the contact pressure which is in turn equal
to the constant m times the sum of the interface stiffness. At this stage stiffness data is only
available at one axial location on the bush (Figure 9). Tacitly, an assumption is made that this
stiffness distribution remains constant axially. This neglects the edge effects that would occur
at the bush corners, and also that the pin could bend and so distribute the load unevenly
across the four bushes. Making this assumption, allows equation (5) to be rewritten:
∑∑ ==ππ
φφ22 22
KdmLD
dpLD
P ss (6)
The discretised stiffness data (Kdφ) of figure 9 can then be used to determine the constant of
proportionality for each load case. The results are shown in Table 1.
P (kN) 5 20 40 60
m (×10-9) 3
10 18 26
Table 1. Calculation of constant m
The different load cases show different contacts of proportionality between P and K.
Nominally, these loads are being applied onto the same surface pair and so it is expected that
linearity would be retained across the whole loading range. Clearly this is not the case; as the
load increases the contact is becoming proportionally more stiff. The reasons for this are not
clear at present. Possibly this is connected with the curved geometry of the pin bush contact
and as the load is increased there is a redistribution of pressure across the interface.
Clearly, the pressure must integrate to equal the applied load; however this uncertainty
between the relationship between pressure and stiffness could cause an error in the form of
the pressure distribution.
Figure 10 shows the interference stiffness data of Figure 9 transposed into contact pressure
using equation (6) and the data from Table 1.

Figure 10. Radial pressure distribution
The results show that an increase in load is accommodated by an increase in the contact
pressure, and not by an increase in the nominal contact area. However, at a microscopic level
this pressure increase will cause an increase in the real contact area. The pressure distribution
is close to cosinusoidal. The ‘bump’ at -50o is anomalous but occurs on each load cycle. It is
a possibility that this is a slight machining inaccuracy in the bush or pin.
MEASUREMENT OF FRICTIONAL TORQUE
Torque Cycles
Figure 11 shows a typical torque cycle with the joint under a lateral load of 5kN. The torque
variation is plotted (a) against time, and (b) against the articulation angle. In all cases the
cycles follow a similar pattern. There is a peak at the start of each articulation (in both
directions at φ=±50º) is caused by the static friction being higher than dynamic. The friction
then reduces as the entrainment speed increases and grease in drawn into the contact
hydrodynamically generating a thin lubricant film. A minimum is reached at centre stroke
(φ=0º) and then the friction rises slightly at the entrainment speed drops again.
(a) (b)
Figure11. Torque plotted against (a) time (5kN) and (b) articulation angle (5kN)

Torque cycles for different loads are shown in Figure 12. As the lateral load is increased the
resistive torque increases. The curves are virtually symmetrical as expected, although there
does seem to be some slight oscillation on the forward stroke, especially at the higher loads.
This is probably a feature of the dynamic motion of this specific rig as opposed to a
tribological phenomenon.
Figure12. Torque cycle from the chrome for a range of radial loads
Relationship Between Torque and Friction Coefficient
Conventionally the method to relate the torque on a shaft to the friction coefficient between
shaft and bush is to multiply the normal load by the friction coefficient, µ with the half
diameter of the shaft, Ds. This gives a value for the nominal torque, T’, according to
sPDT µ2
1' = (7)
However, this assumes the load is numerically equal to the integration of the contact pressure
that acts normal to the interface. This is not the case. Since the load is applied in the radial
direction then it is only numerically equal to the integration of the vertical component of the
pressure distribution. Figure 13(a) shows the dimensions of the pin and the applied load, P. α
is the pressure half wrap angle and φ is co-ordinate angle.

Figure 13. (a) Schematic of a pin inside a bush (b) the contact pressure distribution (c) the
vertical component of pressure
If the pressure distribution is assumed to be constant in the axial direction, i.e. there are no
edge effects caused by the bush then,
∫−
=
α
α
φφµ dLDpT s
2)(2
1 (8)
The friction coefficient is assumed to remain constant around the pin circumference for a
particular load case. It will be shown later that the experiments reveal that from one load case
to the next the friction coefficient varies (because grease entrainment occurs in a different
manner).
However, the pressure component that supports the applied load P is expressed as p(φ)cos(φ)
is shown in Figure 13(c). Hence the formula for calculation of P is,
∫−
=
α
α
φφφ dLDpP s)cos()( (9)
Substituting equation (9) into equation (7) gives,
∫−
=
α
α
φφφµ dLDpT s
2cos)(
2
1' (10)
Clearly equation (8) should be used to calculate the friction coefficient from torque values
and not equations (7) or (10). However, this requires the pressure distribution to be known.
Ratio of True Torque to Nominal Torque
In the same manner as [14], defining a ratio of true torque T to nominal torque T´ as T*=
T/T´. Expressions of T and T´ are given by equation (8) and (10). So T* is as follows:
T* =
∫
∫
−
−
α
α
α
α
φφφµ
φφµ
dLDp
dLDp
s
s
2
2
cos)(2
1
)(2
1
=
∫
∫
−
−
α
α
α
α
φφφ
φφ
dp
dp
cos)(
)(
(11)
It can be seen from Figure 13 that there are antagonistic force components of the pressure
distribution that do not support the normal force, so T must always be greater than T´. The
magnitude of T’ and T* depend on the distribution of pressure [14]. By the above ultrasonic
L
P
Db
Ds
T
(a)
p(φ)
α
φ
(b)
p(φ)cos(φ)
φ
α
(c)
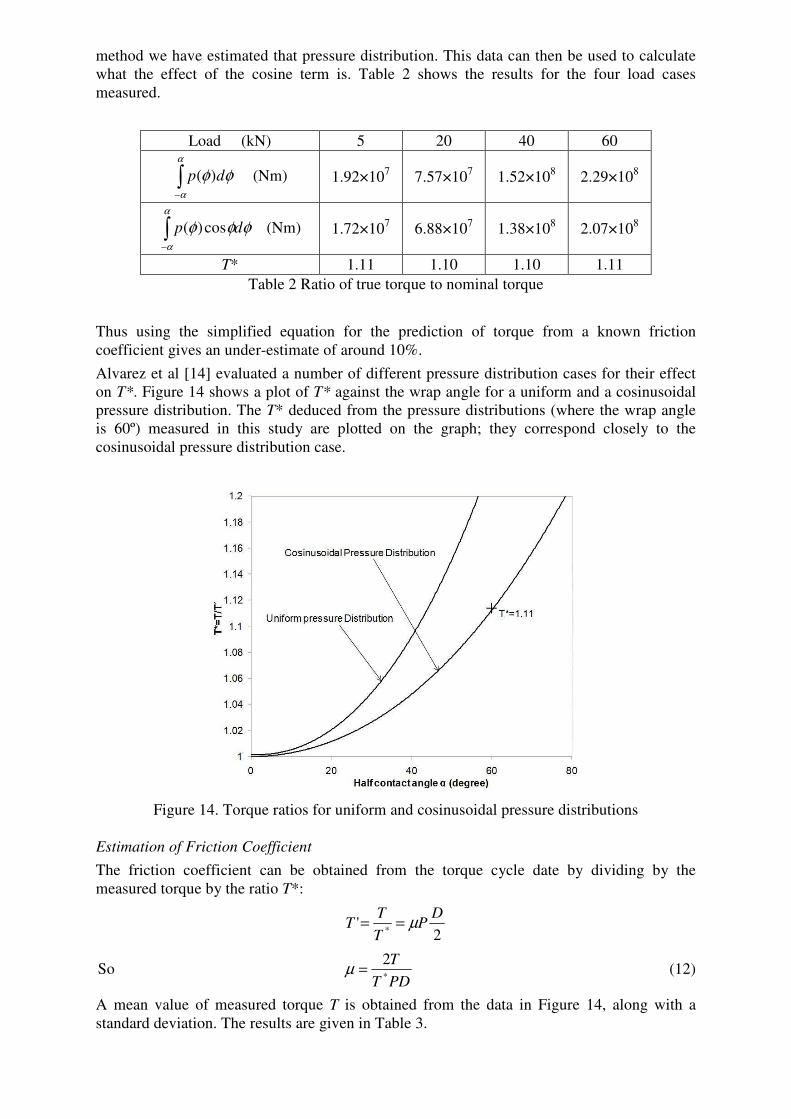
method we have estimated that pressure distribution. This data can then be used to calculate
what the effect of the cosine term is. Table 2 shows the results for the four load cases
measured.
Load (kN) 5 20 40 60
∫−
α
α
φφ dp )( (Nm) 1.92×10⁷ 7.57×10
7 1.52×10
8 2.29×10
8
∫−
α
α
φφφ dp cos)( (Nm) 1.72×10⁷ 6.88×10
7 1.38×10
8 2.07×10
8
T* 1.11 1.10 1.10 1.11
Table 2 Ratio of true torque to nominal torque
Thus using the simplified equation for the prediction of torque from a known friction
coefficient gives an under-estimate of around 10%.
Alvarez et al [14] evaluated a number of different pressure distribution cases for their effect
on T*. Figure 14 shows a plot of T* against the wrap angle for a uniform and a cosinusoidal
pressure distribution. The T* deduced from the pressure distributions (where the wrap angle
is 60º) measured in this study are plotted on the graph; they correspond closely to the
cosinusoidal pressure distribution case.
Figure 14. Torque ratios for uniform and cosinusoidal pressure distributions
Estimation of Friction Coefficient
The friction coefficient can be obtained from the torque cycle date by dividing by the
measured torque by the ratio T*:
2'
*
DP
T
TT µ==
So PDT
T*
2=µ (12)
A mean value of measured torque T is obtained from the data in Figure 14, along with a
standard deviation. The results are given in Table 3.

Load (kN) 5 20 40 60
T (Nm) 13 64 133 201
σT 1.29 5.82 12.09 19.92
µ 0.083 0.104 0.108 0.108
σ µ 0.009 0.010 0.011 0.012
Table 3. Measured torque, friction coefficient and their respective standard deviations
Figure15. Variation of friction coefficient with applied load
The friction coefficients range between 0.08-0.11. This is perhaps slightly higher than might
be expected for normal boundary-lubricated values under low-speed and oscillatory motion
[15]. This indicates that the pin-bush contact is operating with marginal lubrication with large
amounts of asperity contact.
The friction coefficient however is not independent of load. This is because as the load
increases, the pin is pushed into closer conformity with the bush, and so the real area of
contact goes up and so more adhesion occurs. It is also likely that as the load is increased
more of the grease is squeezed out of the contact and is less likely to be entrained during
articulation.
Conclusions
The pressure distribution in a pin joint, and the torque to rotate the joint are both important
parameters in the design of articulating structures like aircraft landing gear. The torque and
pressure are both linked through the friction coefficient. In this work a specimen landing gear
joint has been assembled into test head to load and rotate it in a controlled manner. The
pressure distribution has been measured using an ultrasonic reflection method for a range of
joint loads. The results showed that contact pressure was distributed cosinusoidally across a
circumferential arc of approximate ±60º.
The pin was then subjected to a simple oscillation cycle to determine the torque
characteristics with increasing radial load. The torque values were slightly higher at the start
and end of the cycle. The minimum torque occurred in the middle of the cycle where the
sliding velocity and hydrodynamic entrainment is maximum.

The torque used to rotate a pin is commonly calculated from µPD/2. This under-predicts the
actual torque requirement because it neglects the components of pressure that do not support
normal load. The true torque can only be determined if the pressure distribution is known.
From the measurements from this study the ratio of true to nominal torque was 1.1±0.01.
The friction coefficient was obtained from this torque data incorporating the ratio T*
determined from the measured pressure distribution. Friction coefficients were found to vary
from 0.08 to 0.11 on the pin joint as the load was increased. This indicated that the joint
operates in a boundary lubrication regime.
Nomenclature
R = reflection coefficient
ω = angular frequency of ultrasound wave
z1 = acoustic impedances of pin
z2 = acoustic impedances of bush
K = contact stiffness
p = contact pressure
P = normal force
T = true (requirement) torque
T´ = nominal torque
T* = ratio between requirement torque and nominal torque
u = separation of the mean lines of roughness of two contact surfaces
m = stiffness constant
Anom = nominal contact area
� = friction coefficient
α = half the contact wrap angle
φ = angular coordinate
L = total bush length
Db = bush diameter
Ds = pin diameter
Acknowledgement
The authors are grateful for the help and support of Safran Group and Messier-Dowty Ltd for
their permission to publish this research.
References
[1] Rabinowicz, E., (1995), Friction and Wear of Materials, Wiley.
[2] Hamrock, B.J., Schmid, S.R. and Jacobson, B.O., (2004), Fundamentals of Fluid Film
Lubrication, Dekker Mechanical Engineering.
[3] Glaeser, W.A. and Dufrane, K.F., (1975), Operating Limitations of Heavily loaded grease
lubricated cast bronze bearings, Lubrication Engineering, Vol. 31, pp 614-618.
[4] Neale, M.J., (1993), Bearings: A Tribology Handbook (Tribology Handbook),
Butterworth-Heinemann.

[5] Persson, A., (1964), On the stress distribution of cylindrical elastic bodies in contact,
Ph.D. Thesis, Chalmers, Tekniska, Goteborg, Sweden.
[6] Chen, H.H. and Marshek, K.M., (1988), Effect of clearance And Material Property on
Contact Pressure in Two-Dimensional Conforming Cylinders. Mech. Mach. Theory
Vol.23, No. 1,pp.55-62.
[7] Dickrell, D.J. and Gawyer, W.G., (2004), Evolution of Wear in Two Dimensional
Bushing, Tribology Transactions, Vol. 47, pp. 257-262.
[8] Marshall, M.B., Lewis, R., Drinkwater, B.W. and Dwyer-Joyce, R.S., (2004), An
ultrasonic approach for contact stress mapping in machine joints and concentrated
contacts, J. Strain Analysis, Vol. 39, No. 4, , pp. 339-350.
[9] Dwyer-Joyce, R.S. and Drinkwater, B.W., (2004), In-Situ Measurement of Contact Area
and Pressure Distribution in Machine Elements, Tribology Letters, Vol. 14, No. 1, pp 41-
52.
[10] Kendall, K. and Tabor, D. (1971), An ultrasonic study of the area of contact between
stationary and sliding surfaces, Proc. R. Soc., Ser. A, 323, pp 321–340.
[11] Nagy, P.B., (1992), Ultrasonic classification of imperfect interfaces, Journal of Non-
destructive Evaluation, Vol. 11, Nos. 3/4, pp 127-139.
[12] Heath, T. V, (1974), Some properties of bolted joints, PhD Thesis, University of
Warwick, UK.
[13] Greenwood, J. A. and Williamson, J. B. P., (1966), Contact of Nominally Flat
Surfaces, Proceedings of the Royal Society of London, Vol. 295A, pp 300-319.
[14] Alvarez, L.A., Hamilton, M.A., Steffens, J.G., Ziegert, J.C., Burris, D.L. and Gregory
Sawyer, W., (2009) Edges, clearances, and wear: Little things that make big differences
in bushing friction. Wear, Volume 268, Issues 1-2, 4 January 2010, Pages 41-49
[15] Glaeser, W.A. and Dufrane, K.F., (1976), Performance of Heavily Loaded Oscillatory
Journal bearings, ASLE Trans. Vol 20, 4, 309-314.