Embed Size (px)
Citation preview
WHO/BS/2016.2281
ENGLISH ONLY
EXPERT COMMITTEE ON BIOLOGICAL STANDARDIZATION
Geneva, 17 to 21 October 2016
COLLABORATIVE STUDY ON THE 2ND
INTERNATIONAL STANDARD FOR
BLOOD COAGULATION FACTOR XI, PLASMA (15/180): ASSIGNMENT OF
FUNCTIONAL AND ANTIGEN VALUES
Helen Wilmot1, Peter Rigsby
2, Jason Hockley
2 and Elaine Gray
1
1Haemostasis Section and
2Biostatistics Group,
National Institute for Biological Standards and Control,
Potters Bar, Hertfordshire, EN6 3QG, UK.
NOTE:
This document has been prepared for the purpose of inviting comments and suggestions on the
proposals contained therein, which will then be considered by the Expert Committee on
Biological Standardization (ECBS). Comments MUST be received by 16 September 2016 and
should be addressed to the World Health Organization, 1211 Geneva 27, Switzerland, attention:
Technologies, Standards and Norms (TSN). Comments may also be submitted electronically to
the Responsible Officer: Dr C M Nübling at email: [email protected]
© World Health Organization 2016
All rights reserved. Publications of the World Health Organization are available on the WHO web site (www.who.int) or can be
purchased from WHO Press, World Health Organization, 20 Avenue Appia, 1211 Geneva 27, Switzerland (tel.: +41 22 791
3264; fax: +41 22 791 4857; e-mail: [email protected]).
Requests for permission to reproduce or translate WHO publications – whether for sale or for noncommercial distribution –
should be addressed to WHO Press through the WHO web site:
(http://www.who.int/about/licensing/copyright_form/en/index.html).
The designations employed and the presentation of the material in this publication do not imply the expression of any opinion
whatsoever on the part of the World Health Organization concerning the legal status of any country, territory, city or area or of its
authorities, or concerning the delimitation of its frontiers or boundaries. Dotted lines on maps represent approximate border lines
for which there may not yet be full agreement.
The mention of specific companies or of certain manufacturers’ products does not imply that they are endorsed or recommended
by the World Health Organization in preference to others of a similar nature that are not mentioned. Errors and omissions
excepted, the names of proprietary products are distinguished by initial capital letters.
All reasonable precautions have been taken by the World Health Organization to verify the information contained in this
publication. However, the published material is being distributed without warranty of any kind, either expressed or implied. The
responsibility for the interpretation and use of the material lies with the reader. In no event shall the World Health Organization
be liable for damages arising from its use. The named authors alone are responsible for the views expressed in this publication.
WHO/BS/2016.2281
Page 2
Summary
The aims of this study were to assign Factor XI functional activity to the 2nd
International
Standard (IS) for Blood Coagulation Factor XI, Plasma, and to additionally assign a new analyte,
FXI antigen, to the same International Standard. Assignment of the functional activity value in
International Units (IU) was performed by one-stage clotting assay by 29 laboratories, relative to
the 1st IS. The majority of intra-laboratory GCVs were less than 5% and the inter-laboratory
variability was extremely low at 1.8%, with an overall geometric mean of 0.71 IU/ampoule. The
antigen value assignment was performed by 11 laboratories and was calculated relative to normal
plasma pools. As is customary with new coagulation factor analytes, the amount of analyte
present in 1 ml of normal plasma was taken to be 1 unit, therefore the assignment of antigen is in
IU/ampoule relative to normal plasma pools. The inter-laboratory variation of the antigen assays
was acceptable at 10%, with an overall geometric mean of 0.78 IU/ampoule.
Proposals for establishment:
To establish candidate 15/180 as the 2nd International Standard for FXI, Plasma, with
assigned values of:
o FXI functional activity (FXI:C) of 0.71 IU/ampoule
o FXI antigen value (FXI:Ag) of 0.78 IU/ampoule
Introduction
Factor XI deficiency is generally mild and bleeding is most often associated with surgery or
trauma, though bleeding phenotype can vary and is not always correlated to FXI clotting activity.
Deficiency is most common in Ashkenazi Jews (around 1 in 190 are homozygous for mutation in
the F11 gene and around 1 in 8 are heterozygous), but has now been identified in a wide variety
of populations. There are a number of inherited mutations that cause FXI deficiency, most of
which lead to a decrease in antigen and functional activity, though some patients (around 4%)
experience a decrease in functional activity only.1
The 1st International Standard (IS) for Blood Coagulation Factor XI, Plasma (04/102), was
established by the Expert Committee on Biological Standardisation (ECBS) of the World Health
Organisation (WHO) in October 20052. The standard is used to aid diagnosis of factor XI (FXI)
deficiency and to assign potency to licensed FXI concentrates as well as control of virus
inactivated plasma products, both of which are used for treatment of patients. As with most
coagulation factors and inhibitors where the International Unit (IU) is defined as the amount of
activity in 1 ml of pooled normal plasma, this first IS was assigned with FXI functional activity
(FXI:C) relative to local normal plasma pools only. The stock levels of the 1st IS are now near
depletion and a replacement standard is required. For continuity of the IU, the replacement IS
for FXI functional activity (FXI:C) was value assigned relative to the 1st IS in this collaborative
study. The relationship of the IS to normal plasma was also examined. In addition, this study
also aimed to establish an antigen value for FXI (FXI:Ag) for the same candidate relative to
WHO/BS/2016.2281
Page 3
laboratories’ local normal pooled plasma. This will enable differentiation between patients who
have low functional activity but normal antigen FXI levels and patients who have both low
functional and antigen FXI levels.
The replacement of the 1st IS for FXI, Plasma (FXI:C) and the FXI:Ag value assignment projects
were endorsed by the WHO ECBS in October 2014.
Candidate WHO 2nd
International Standard for Factor XI, Plasma (15/180)
Bulk material was purchased from the United Kingdom Blood Service in the form of plasma
which had been prepared by centrifugation of whole blood collected into CPD adenine
anticoagulant. A second centrifugation step was performed to remove all cellular material and
the plasma rapidly frozen at -70°C. Individual donations were tested at source and found to be
negative for HBsAg, anti-HIV-1 and HIV-2 antibodies, and anti-HCV. The material was
prepared for filling by thawing immediately prior to use in a 37°C waterbath and then pooled.
Glycine and HEPES were added at a final concentration of 1% w/v and 40 mM, respectively. To
avoid activation of FXI by cold activation or contact with glass, plastic vessels were used and the
plasma was maintained at room temperature after thawing and throughout the duration of the fill.
The product was filled into siliconized glass ampoules and freeze dried over a 5 day cycle. The
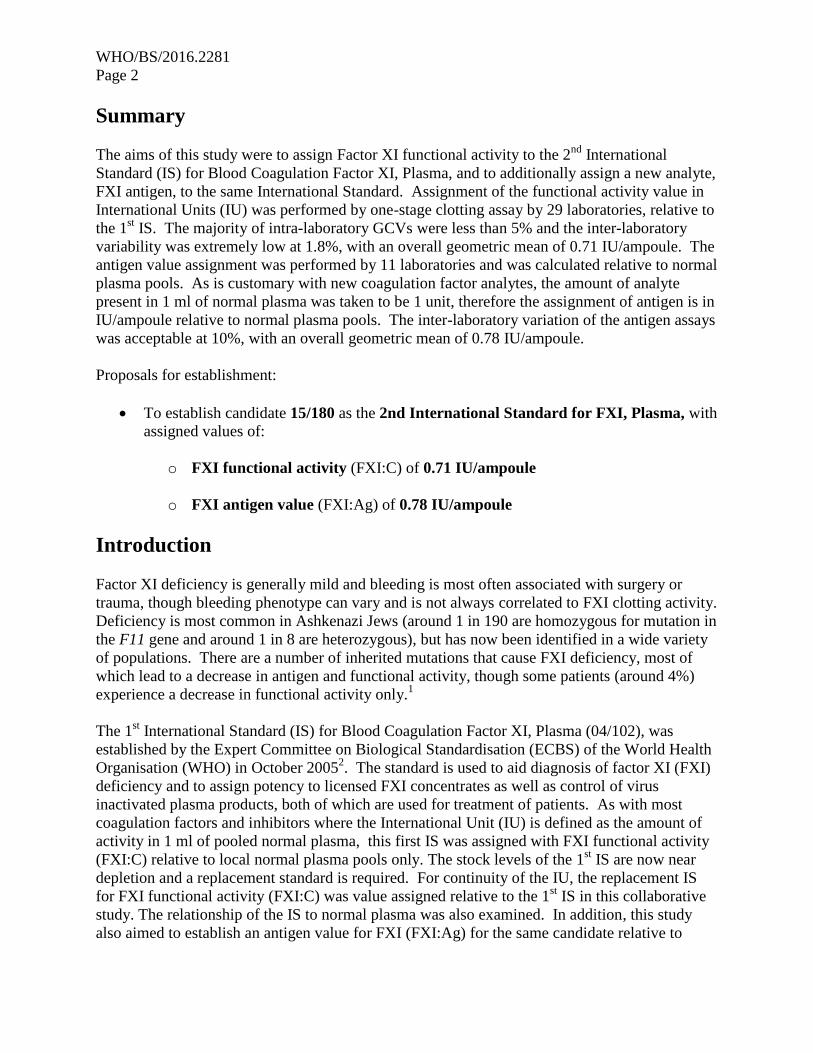
finished product summary is as follows:
Code number 15/180
Presentation Sealed, siliconized glass ampoules
Number of ampoules available 6000
Date filled 01 October 2015
Mean fill mass (n=410) 1.0094 g
Precision of fill (CV of fill mass) (n=410) 0.300%
Residual moisture (n=12) 0.605%
Mean dry weight (n=3) 0.0928 g
Mean oxygen head space (n=12) 0.23 %
Storage conditions -20°C
Address of processing facility NIBSC, Potters Bar, EN6 3QG, UK
Address of custodian NIBSC, Potters Bar, EN6 3QG, UK
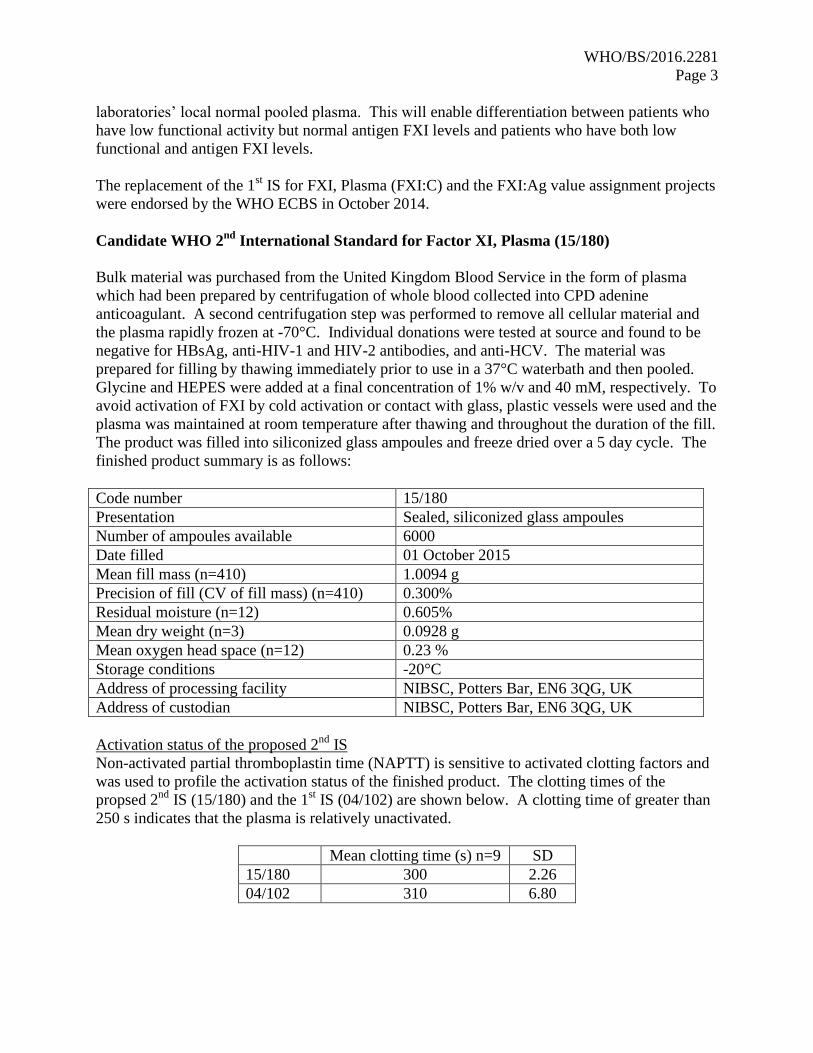
Activation status of the proposed 2nd
IS
Non-activated partial thromboplastin time (NAPTT) is sensitive to activated clotting factors and
was used to profile the activation status of the finished product. The clotting times of the
propsed 2nd
IS (15/180) and the 1st IS (04/102) are shown below. A clotting time of greater than
250 s indicates that the plasma is relatively unactivated.
Mean clotting time (s) n=9 SD
15/180 300 2.26
04/102 310 6.80

WHO/BS/2016.2281
Page 4
The clotting time of the proposed 2nd
IS was similar to that of the 1st IS and therefore is deemed
to be suitable. A chromogenic assay for FXIa was also performed, however the assay kit is not
designed for use with plasma and no dose response was observed. Taking single point
estimations did give an estimation of FXIa activity of around 2.3 mIU/ml for the proposed 2nd
IS.
Spiking this amount of FXIa into the 1st IS and assaying by FXI clotting assay did not alter the
potency estimate of the 1st IS, so it is highly unlikely that any low level FXIa which may be
present in the proposed 2nd
IS would affect the overall potency estimates.
Stability studies
On-bench and accelerated degradation studies have been carried out. The results of the FXI:C
on-bench stability are shown below, with potencies representing 2 assays at each time-point and
determined relative to a fresh ampoule of 15/180 at each time. Potency is expressed as
percentage relative to the fresh ampoule. The potency after 4 hours storage at room temperature
in a capped plastic tube overlaps well with that at 0 h, indicating the material is stable for at least
4 hours when stored at room temperature.
FXI functional activity (FXI:C)
Time % potency – combined
(95% confidence intervals)
0 h 97.70
(93.58-102.00)
1 h 96.83
(94.15-99.58)
2 h 96.13
(91.38-101.13)
3 h 96.99
(92.51-101.69)
4 h 98.02
(93.33-102.95)
On-bench stability studies of FXI antigen were carried out, with potencies shown below
representing one assay performed with duplicate dilutions. Potency is expressed in percent,
relative to time 0 (assigned to be 100%). The 95% confidence limits at 4 h overlap 100%,
indicating the product is stable for at least 4 hours when stored at room temperature.
FXI antigen (FXI:Ag)
Time % potency – combined
(95% confidence intervals)
1 h 116.09
(105.99-127.24)
2 h 106.48
(97.22-116.65)
3 h 103.16
(94.19-113.00)
4 h 106.57
(97.31-116.76)
WHO/BS/2016.2281
Page 5
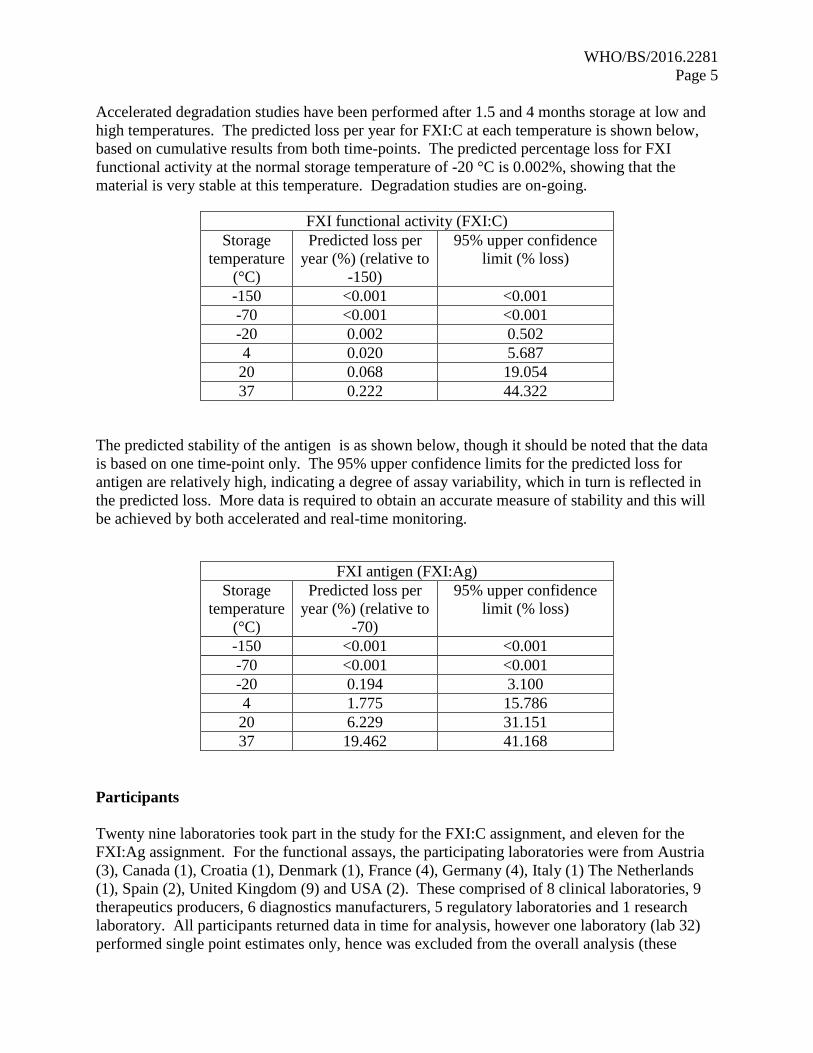
Accelerated degradation studies have been performed after 1.5 and 4 months storage at low and
high temperatures. The predicted loss per year for FXI:C at each temperature is shown below,
based on cumulative results from both time-points. The predicted percentage loss for FXI
functional activity at the normal storage temperature of -20 °C is 0.002%, showing that the
material is very stable at this temperature. Degradation studies are on-going.
FXI functional activity (FXI:C)
Storage
temperature
(°C)
Predicted loss per
year (%) (relative to
-150)
95% upper confidence
limit (% loss)
-150 <0.001 <0.001
-70 <0.001 <0.001
-20 0.002 0.502
4 0.020 5.687
20 0.068 19.054
37 0.222 44.322
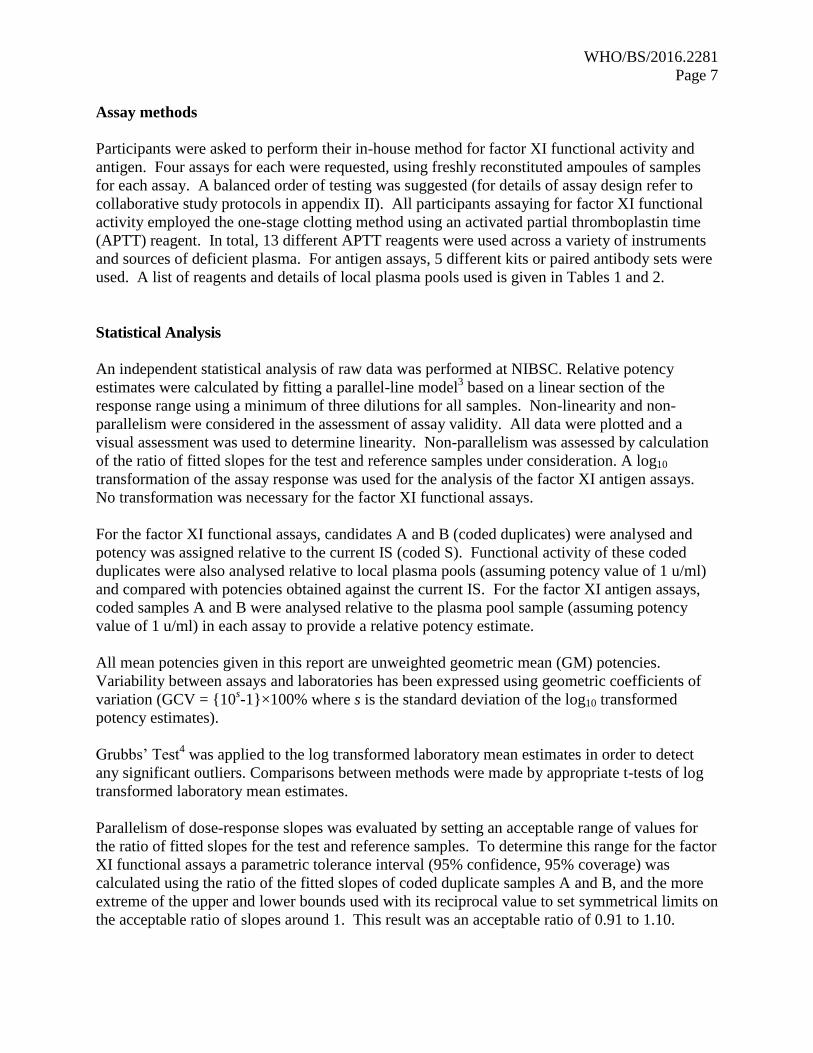
The predicted stability of the antigen is as shown below, though it should be noted that the data
is based on one time-point only. The 95% upper confidence limits for the predicted loss for
antigen are relatively high, indicating a degree of assay variability, which in turn is reflected in
the predicted loss. More data is required to obtain an accurate measure of stability and this will
be achieved by both accelerated and real-time monitoring.
FXI antigen (FXI:Ag)
Storage
temperature
(°C)
Predicted loss per
year (%) (relative to
-70)
95% upper confidence
limit (% loss)
-150 <0.001 <0.001
-70 <0.001 <0.001
-20 0.194 3.100
4 1.775 15.786
20 6.229 31.151
37 19.462 41.168
Participants
Twenty nine laboratories took part in the study for the FXI:C assignment, and eleven for the
FXI:Ag assignment. For the functional assays, the participating laboratories were from Austria
(3), Canada (1), Croatia (1), Denmark (1), France (4), Germany (4), Italy (1) The Netherlands
(1), Spain (2), United Kingdom (9) and USA (2). These comprised of 8 clinical laboratories, 9
therapeutics producers, 6 diagnostics manufacturers, 5 regulatory laboratories and 1 research
laboratory. All participants returned data in time for analysis, however one laboratory (lab 32)
performed single point estimates only, hence was excluded from the overall analysis (these

WHO/BS/2016.2281
Page 6
results are shown in Appendix III, Table 3; reported potencies were approximately 6% lower
than the overall geometric mean for the candidate). For the FXI antigen study, the participating
laboratories were from Austria (1), Canada (1), Denmark (1), France (2), Germany (1), Spain (1)
United Kingdom (2) and USA (2), comprising 2 clinical laboratories, 1 diagnostics
manufacturer, 6 plasma therapeutics producers and 2 regulatory laboratories. One other
laboratory withdrew due to problems with supply of the kits from the manufacturers, as the
assays could not have been completed in time for analysis. Each participating laboratory is
referred to in the report by an arbitrarily assigned number and is listed in Appendix I, the order
of which does not represent the assigned laboratory number.
Collaborative study design
The samples sent out for study were as follows:
S (04/102): 1st IS for Factor XI, Plasma, FXI:C potency 0.86 IU/ampoule (used for functional
activity assays only)
A: (15/180): Candidate for 2nd
IS for Factor XI, Plasma
B: (15/180): Coded duplicate
P: Local plasma pool
Although the 2nd
IS factor XI potency will be established relative to the 1st IS, the relationship
between the plasma pool unit was also examined. Since the FXI antigen assignment is a new
value, the unitage of the standard will be assigned relative to normal plasma pools. For these
reasons, participants were asked to collect fresh local plasma pools for use both fresh and
subsequently frozen during the study. Laboratories were asked to follow a supplied protocol for
collection of plasma pools (see collaborative study protocol in appendix II). NIBSC in-house
studies on both FXI functional activity and FXI antigen assays have shown that there is no
significant difference in results when using fresh plasma pools compared to the same pool of
plasma used after freezing, therefore if participants were unable to collect fresh plasma pools,
then frozen plasma could be used as an alternative. A total of 5 laboratories used fresh plasma
pools for the FXI functional assays (18 assays in total), and 2 laboratories used fresh plasma
pools in the FXI antigen assays (4 assays in total). Across the pools used in the study (fresh and
frozen) for either functional activity or antigen value, plasma from more than 20,000 donors was
used.
The issue of commutability was considered, and sourcing of appropriate samples was
investigated. The samples would need to be plasma from Factor XI deficient patients with FXI
levels of around 1-5% of normal. Due to the fact that FXI deficieny is relatively rare and that a
large volume of plasma would be required for the study, it was not possible to source samples for
this purpose. Commerical sources of deficient plasma were either completely deficient
(immune-depeleted) and therefore not appropriate, or were pooled plasmas, which would not
address commutability.
WHO/BS/2016.2281
Page 7
Assay methods
Participants were asked to perform their in-house method for factor XI functional activity and
antigen. Four assays for each were requested, using freshly reconstituted ampoules of samples
for each assay. A balanced order of testing was suggested (for details of assay design refer to
collaborative study protocols in appendix II). All participants assaying for factor XI functional
activity employed the one-stage clotting method using an activated partial thromboplastin time
(APTT) reagent. In total, 13 different APTT reagents were used across a variety of instruments
and sources of deficient plasma. For antigen assays, 5 different kits or paired antibody sets were
used. A list of reagents and details of local plasma pools used is given in Tables 1 and 2.
Statistical Analysis
An independent statistical analysis of raw data was performed at NIBSC. Relative potency
estimates were calculated by fitting a parallel-line model3 based on a linear section of the
response range using a minimum of three dilutions for all samples. Non-linearity and non-
parallelism were considered in the assessment of assay validity. All data were plotted and a
visual assessment was used to determine linearity. Non-parallelism was assessed by calculation
of the ratio of fitted slopes for the test and reference samples under consideration. A log10
transformation of the assay response was used for the analysis of the factor XI antigen assays.
No transformation was necessary for the factor XI functional assays.
For the factor XI functional assays, candidates A and B (coded duplicates) were analysed and
potency was assigned relative to the current IS (coded S). Functional activity of these coded
duplicates were also analysed relative to local plasma pools (assuming potency value of 1 u/ml)
and compared with potencies obtained against the current IS. For the factor XI antigen assays,
coded samples A and B were analysed relative to the plasma pool sample (assuming potency
value of 1 u/ml) in each assay to provide a relative potency estimate.
All mean potencies given in this report are unweighted geometric mean (GM) potencies.
Variability between assays and laboratories has been expressed using geometric coefficients of
variation (GCV = {10s-1}×100% where s is the standard deviation of the log10 transformed
potency estimates).
Grubbs’ Test4 was applied to the log transformed laboratory mean estimates in order to detect
any significant outliers. Comparisons between methods were made by appropriate t-tests of log
transformed laboratory mean estimates.
Parallelism of dose-response slopes was evaluated by setting an acceptable range of values for
the ratio of fitted slopes for the test and reference samples. To determine this range for the factor
XI functional assays a parametric tolerance interval (95% confidence, 95% coverage) was
calculated using the ratio of the fitted slopes of coded duplicate samples A and B, and the more
extreme of the upper and lower bounds used with its reciprocal value to set symmetrical limits on
the acceptable ratio of slopes around 1. This result was an acceptable ratio of 0.91 to 1.10.

WHO/BS/2016.2281
Page 8
The same calculation method was used for the factor XI antigen assays, with a result of 0.79 to
1.27, and it was decided to use limits of 0.80 to 1.25 to demonstrate acceptable parallelism in
these assays. This narrower range was selected because it is generally considered to be the
widest range acceptable for these types of assays.
Assay validity
FXI functional assays
All laboratories performed 4 assays using one-stage clotting assay, with a total of thirteen
different APTT reagents used across 140 assays. Where a laboratory had performed more than
one set of assays using a different APTT reagent or coagulometer, these are designated as a, b
etc. In the case of labs 26 and 31, a and b refer to the two different sources of plasma pools used
within the same assays therefore these labs have one set of results relative to S, but two results
relative to P (one set relative to each plasma pool). Assay 3 from Lab 17 was excluded from the
analysis due to poor replicates and, for the analysis relative to S, all of the assays from Lab 17
were excluded because the results were found to be outliers. In addition, for the whole study, a
total of 8 assays for A against S, 6 for B against S, 19 for A against P and 13 for B against P
were excluded from the analysis for non-parallelism.
FXI antigen assays
With the exception of Lab 26, which performed 6 assays, all laboratories performed 4 antigen
assays for FXI antigen. In the case of lab 26, a and b refer to the two different sources of plasma
pools used within the same assays, therefore lab 26 has two set of results for FXI antigen against
P. Of the 52 assays performed, 4 assays of B against P were excluded for non-parallelism. No
assays for A against P were excluded for non-parallelism. One assay from Lab 24 was
withdrawn by the laboratory.
RESULTS AND DISCUSSION
FXI functional assays
Analysis relative to S, the 1st IS for FXI, Plasma
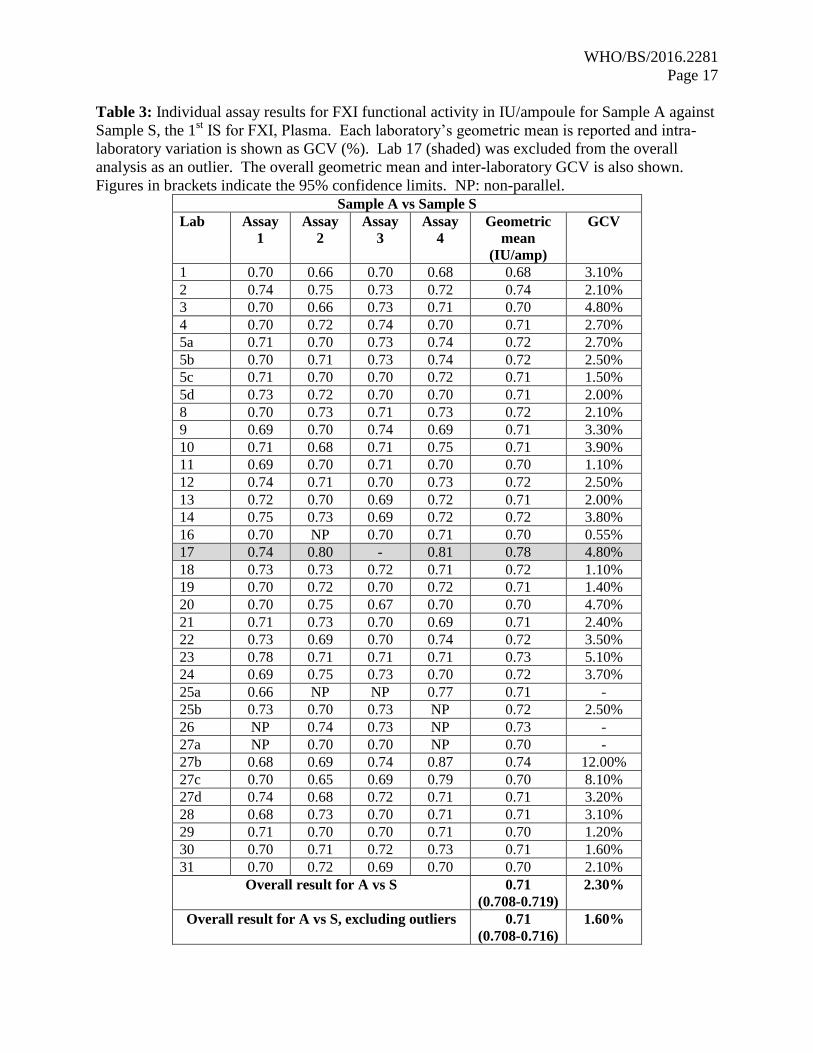
Results for samples A and B were analysed relative to sample S, the 1st IS for FXI, and the
individual assay results together with the laboratory geometric mean and GCV are shown in
Tables 3 and 4. For comparison, the laboratories’ own calculated results relative to S are shown,
alongside the centrally calculated results, in Appendix III, Table 1. On the whole, the
laboratories’ own calculated data were similar to NIBSC’s calculated results, indicating that the
laboratories were able to analyse the data appropriately. The laboratories were also able to
perform precise assays, with the majority of intra-laboratory GCVs being less than 5% for A or
B. The overall potency of A compared to S was 0.71 IU/ampoule, with a GCV of 1.60%. For B,
it was also 0.71 IU/ampoule, with a GCV of 2.40%. The good agreement of potencies for
sample A and B, the coded duplicates, showed that there was no assay design bias and that the
WHO/BS/2016.2281
Page 9
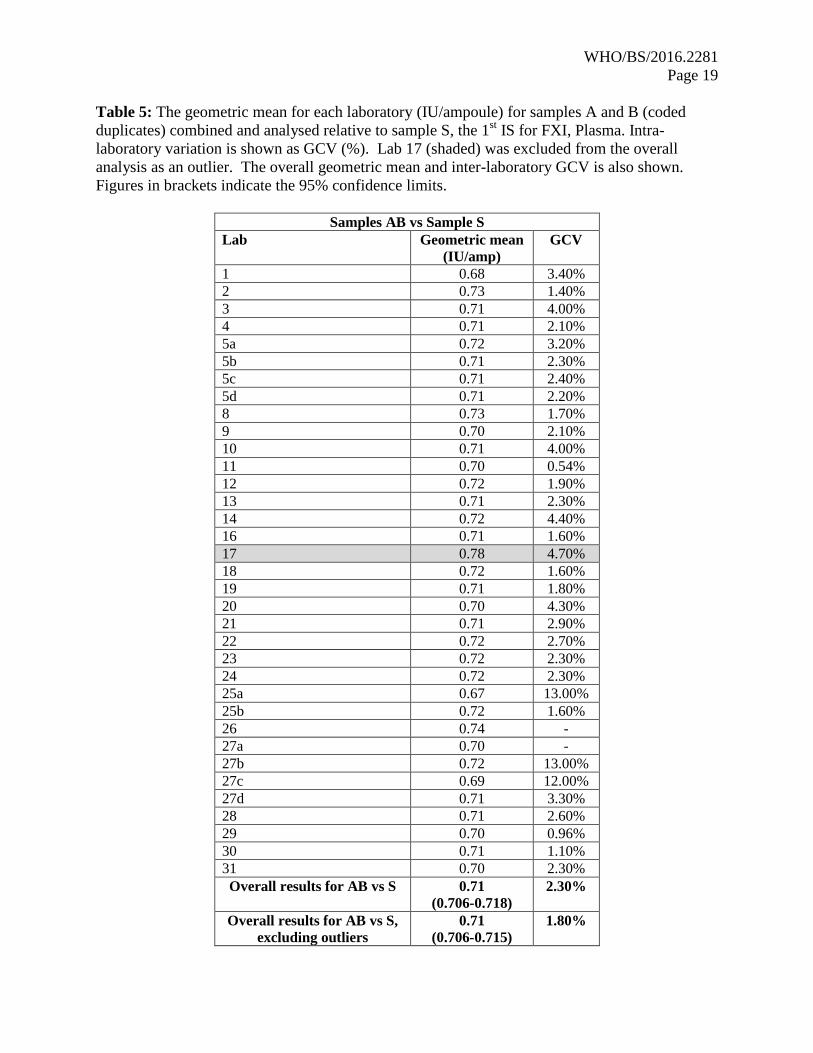
laboratories were able to measure FXI:C accurately. As samples A and B were coded duplicates,
the results for both A and B vs S were combined to give an overall estimate (AB vs S). Each
laboratory’s geometric mean and GCV are shown in Table 5. The overall result of AB vs S was
0.71 IU/ampoule, the same as for A or B individually against S, and the inter-laboratory GCV
was 1.80%. Results from Lab 17 were detected as statistical outliers and were excluded from the
overall calculation of potency and inter-laboratory GCV. The excellent agreement between the
laboratories as shown by the close distribution of laboratory geometric means is demonstrated in
Figure 1.
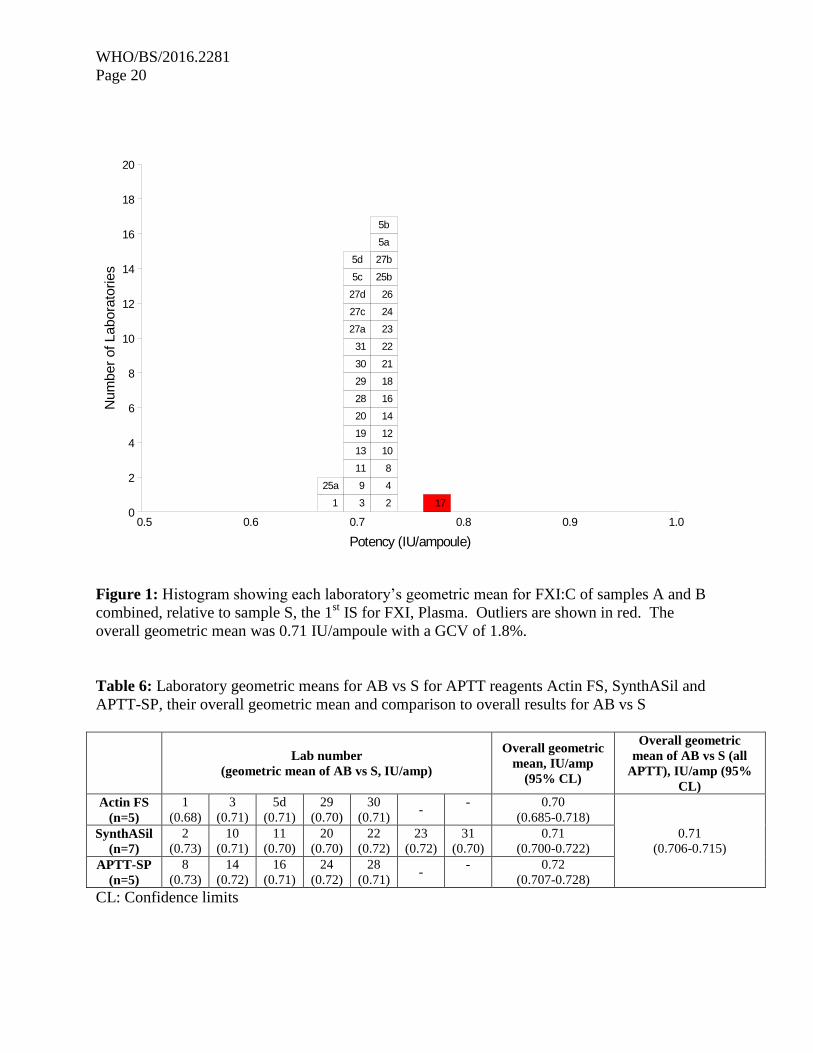
Several of the laboratories used Actin FS, SynthASil or APTT-SP as the APTT reagent in their
assays. To determine if these reagents produced any method bias, the AB vs S geometric means
of these laboratories were combined and compared to the overall geometric mean. Table 6
shows that the results for Actin FS (0.70 IU/ampoule; 5 laboratories), SynthASil (0.71
IU/ampoule; 7 laboratories) and APTT-SP (0.72 IU/ampoule; 5 laboratories) compared well with
the overall geometric mean of 0.71 IU/ampoule for AB, indicating no method bias. The overall
geometric mean of the other APTT reagents (excluding Actin FS, SynthASil and APTT-SP) was
0.71 IU/ampoule, with 95% confidence limits of 0.701-0.716 IU/ampoule.
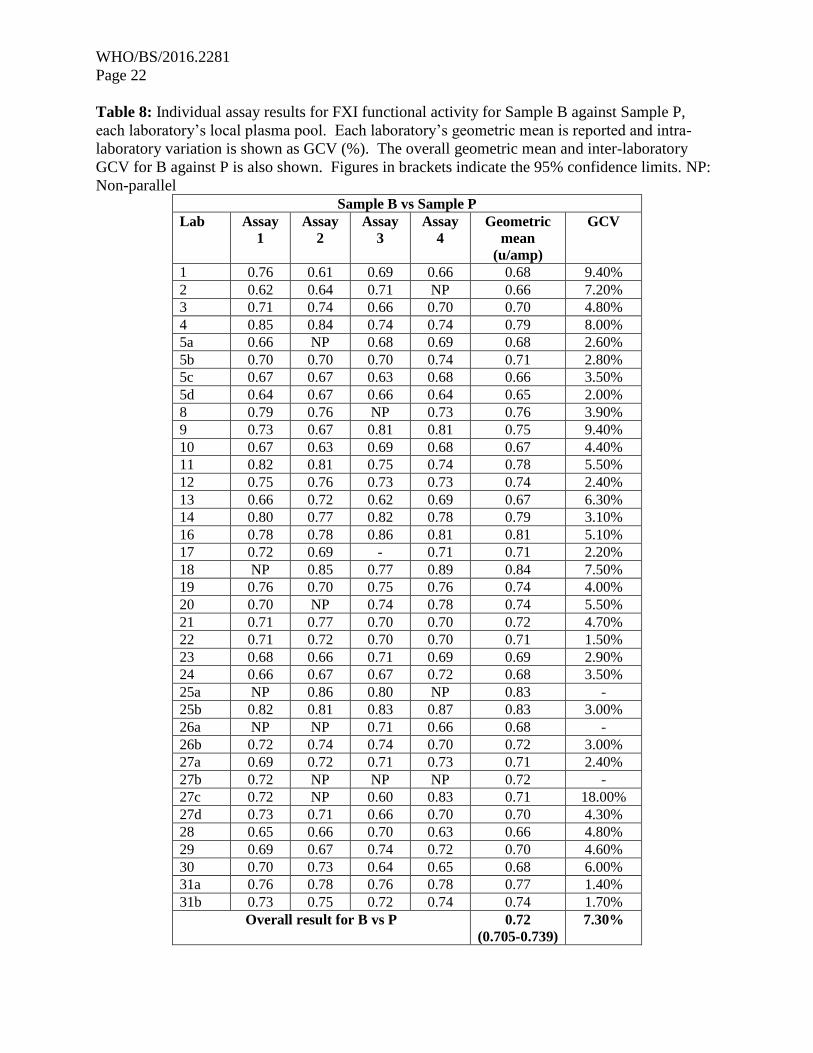
Analysis relative to plasma pools (P)
Participants were asked to collect two plasma pools (P1 and P2) for use both as fresh and frozen
pools in the assays. Where participants were unable to collect fresh plasma pools, it was
requested that two different batches of local frozen plasma pools were used. In order to assess
the relationship with the plasma unit (where the amount of FXI in 1 ml of plasma is taken to be 1
u/ml), the data were analysed relative to P. The assay results for A and B vs P for each
laboratory are shown in Tables 7 and 8, together with the laboratory geometric means and intra-
laboratory variation (GCV). The intra-laboratory variations were higher than that of the data
compared to S, most likely due to the differences between the batches of plasma pools used
within each laboratory. However, the majority of the results still had a GCV of less than 10%,
showing that the laboratories were performing the assays with good precision. The overall
geometric mean for sample A or B relative to P was 0.72 u/ampoule, agreeing well with the
potency of 0.71 u/ampoule relative to S. As before, the results for A and B relative to P were
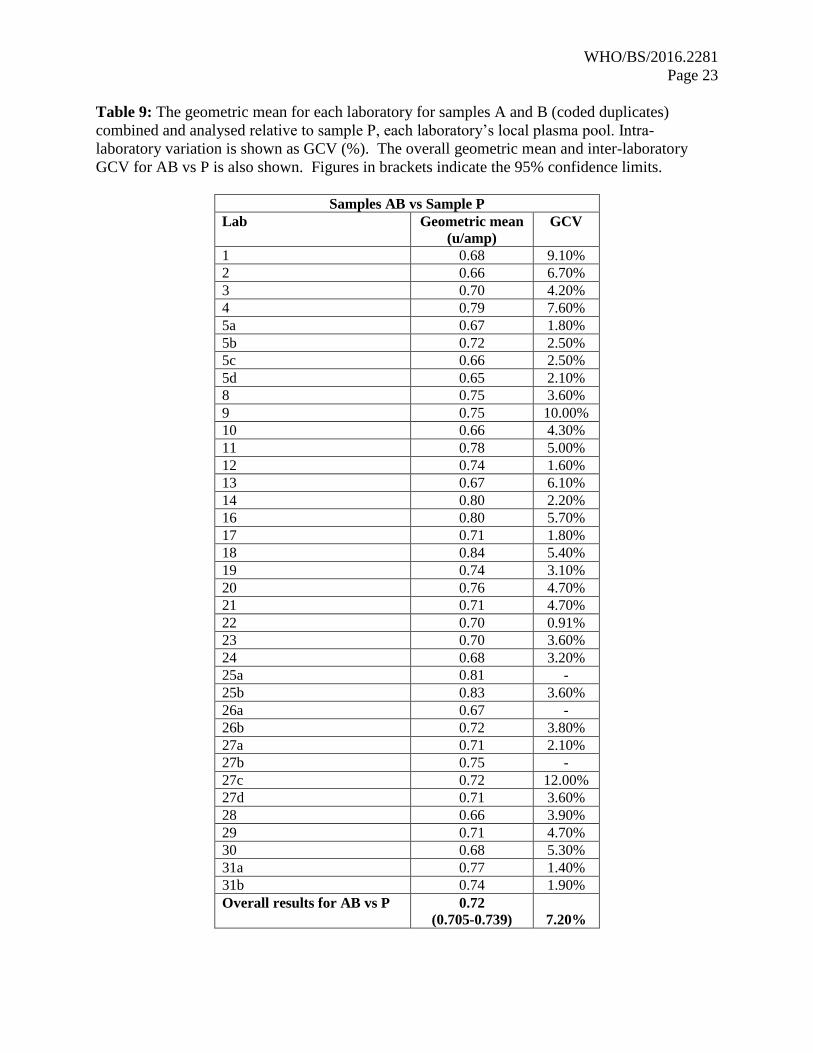
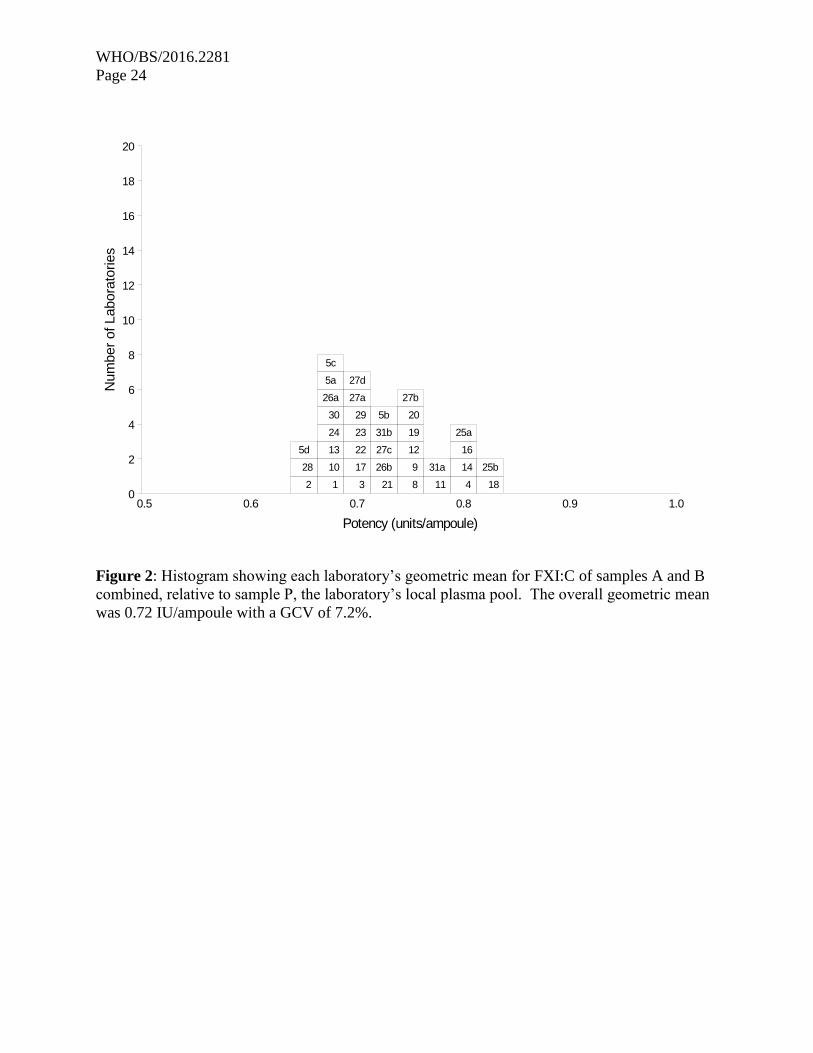
combined, and the overall results shown in Table 9 and Figure 2. The inter-laboratory variation
was higher than for AB vs S, at 7.20% overall, but still below 10%. The overall geometric mean
for AB vs P was 0.72 u/ampoule, compared to 0.71 IU/ampoule relative to S. The results for AB
vs S and AB vs P were compared using a paired two-tailed t-test and the result showed no
significant difference between the two values (p=0.215), indicating that a good relationship
between the IU and the plasma unit had been maintained. A comparison of assays performed
using fresh plasma pools to assays where frozen plasma pools were used showed there was no
difference in the results between fresh and frozen pools (p=0.704).

WHO/BS/2016.2281
Page 10
FXI antigen assays
Participants were asked to collect two plasma pools (P1 and P2) for use both as fresh and frozen
pools in the assays. Where participants were unable to collect fresh plasma pools, it was
requested that two different batches of local frozen plasma pools were used. As there is no
current International Standard for FXI antigen, the units of FXI antigen in 1 ml of plasma pool
was taken to be 1, and the potencies of A and B calculated relative to the laboratories’ local
plasma pool. The individual assay results for samples A and B, together with the laboratory
geometric mean and GCV are shown in Tables 10 and 11. The laboratories own calculated
results are shown in Appendix III, Table 2, alongside the centrally calculated results. As with
the FXI:C results, in general, the locally calculated data were similar to those obtained by
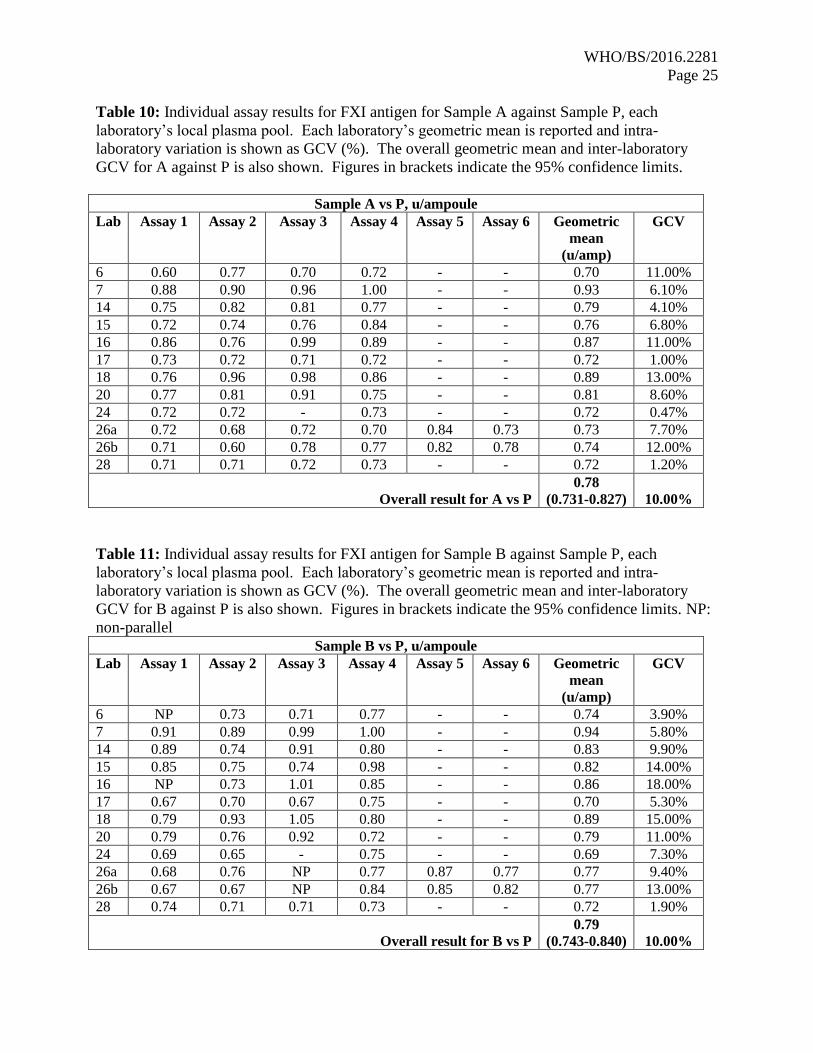
NIBSC. The overall geometric mean for A against P was 0.78 u/ampoule, compared to 0.79
u/ampoule for B against P. The inter-laboratory variation was 10% for A and B, showing
acceptable agreement between laboratories. Overall, the intra-laboratory variations ranged
between 0.5 and 18%, with most laboratories having a GCV of less than 10%. The variation of
these assays would be expected to be higher than that of the FXI functional assays, by virtue of
the fact that the calculations are relative to the local plasma pools, which themselves have
inherent variability. Due to the low number of assays performed using fresh plasma pools (5) it
was not possible to compare fresh and frozen plasma pools.
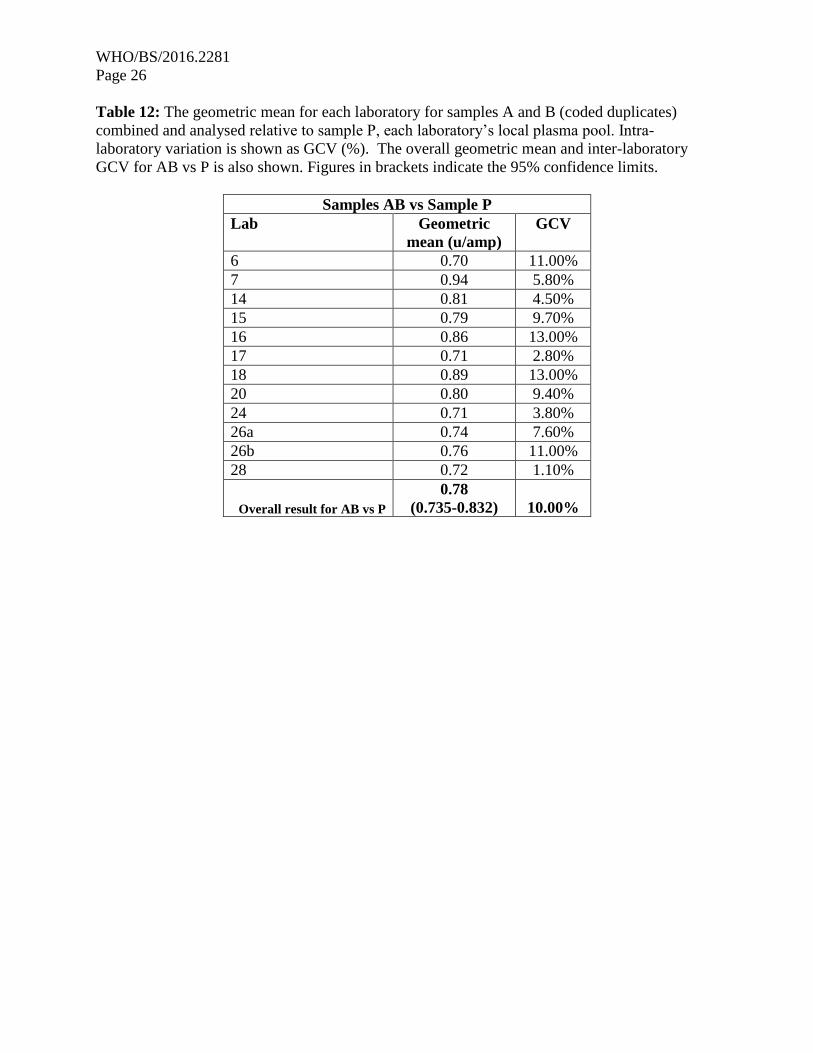
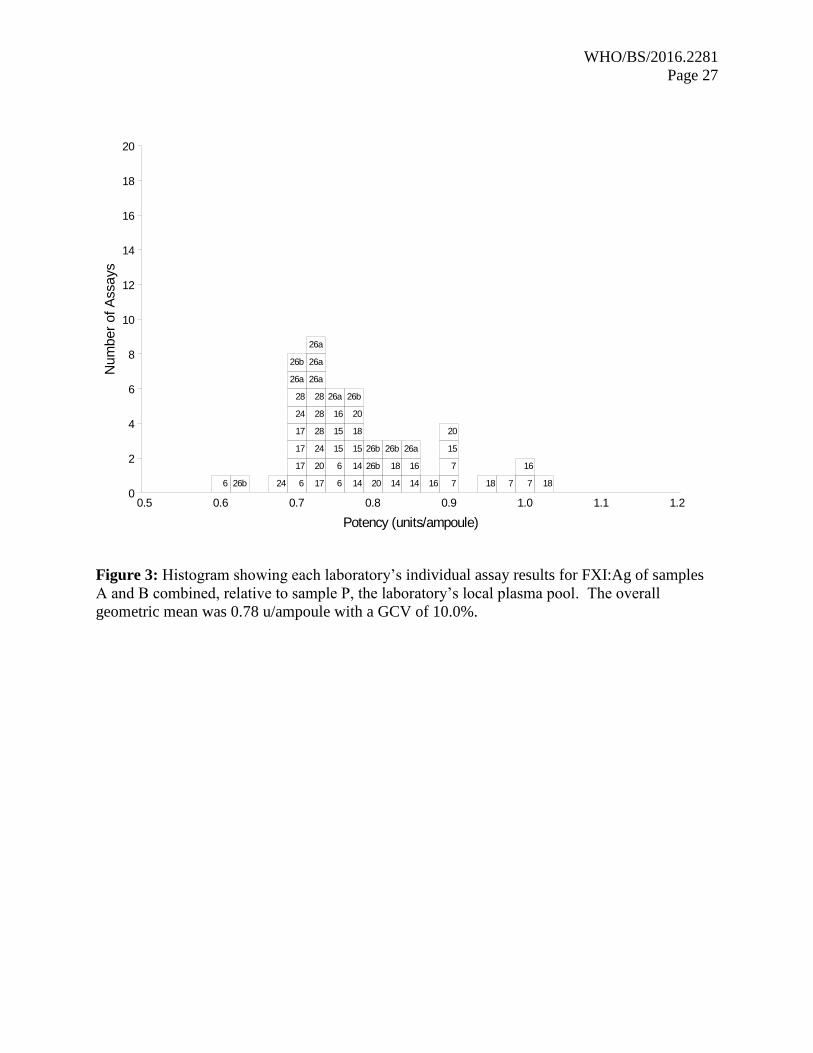
Since A and B were coded duplicates, the results were combined to give an overall result for AB
against P. The results are shown in Table 12. The overall geometric mean was 0.78 u/ampoule,
in good agreement with the results for A or B separately against P. Again, the variability of the
assays was acceptable, at 10% overall. No statistical outliers were detected. The individual
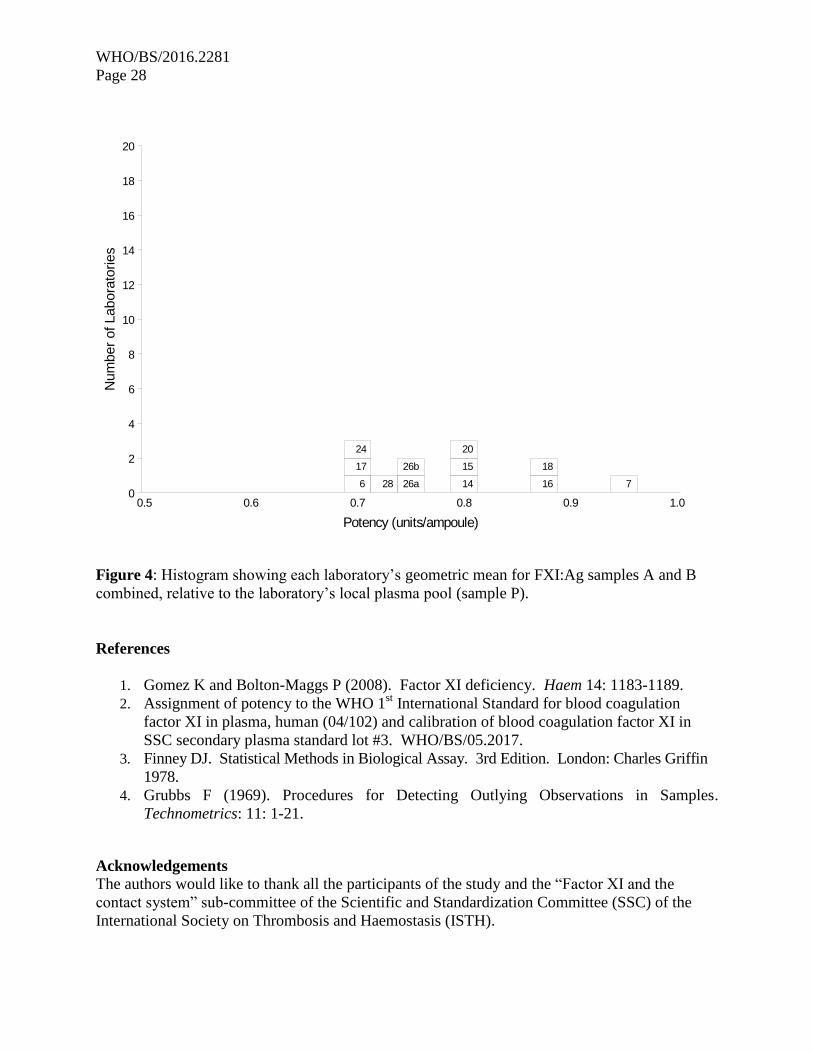
assay results from each lab are shown graphically in Figure 3, and the laboratory geometric
means are shown plotted in Figure 4. These graphs show a fairly even distribution of results
around the overall geometric mean.
Of the 12 laboratories that took part, 5 used an antigen kit from Affinity Biologicals. The
geometric means for AB against P of these laboratories were combined and resulted in a
geometric mean of 0.72 u/ampoule (with 95% confidence limits of 0.695-0.749 u/ampoule).
This is slightly lower than the overall result for AB against P (0.78 u/ampoule). The result for
the other laboratories not using the Affinity Biologicals kit was 0.82 u/ampoule, with 95%
confidence limits of 0.754-0.899 u/ampoule, which overlap the overall geometric mean of AB vs
P, but not that of the laboratories using the Affinity Biologicals kit. A comparison of the two
groupings was made using the unpaired two-tailed t-test and the difference was found to be
significant (p<0.05). The difference suggests that the Affinity Biologicals kit may yield lower
results than other kits, however this could also be a reflection of the different plasma pools used
within each laboratory. Due to the small number of laboratories taking part in the study and the
fact that the two groupings had 95% confidence limits that were extremely close to being
overlapping, the consensus geometric mean was taken as the antigen value for the candidate
preparation. Any effect of minor method bias on the results is likely to be small.
WHO/BS/2016.2281
Page 11
RECOMMENDATIONS
The recommendations to the Expert Committee for Biological Standardization (ECBS) of the
World Health Organization (WHO) are:
To establish candidate 15/180 as the 2nd International Standard for FXI, Plasma, with
assigned values of:
o FXI functional activity (FXI:C) of 0.71 IU/ampoule
o FXI antigen value (FXI:Ag) of 0.78 IU/ampoule
A draft Instruction For Use (IFU) is shown in Appendix IV.
The collaborative study has been reviewed by the Participants and the Experts nominated by the
Scientific and Standardisation Committee (SSC) of the International Society on Thrombosis and
Haemostasis and their comments and the NIBSC corresponding responses are shown below. All
participants agreed with the recommendation and the SSC has also endorsed the proposal at the
Business Meeting of the 62nd
Annual SSC meeting, June 2016 to go forward for establishment by
the ECBS.
Participants’ Review
All participants were sent a copy of the report along with a questionnaire asking for their
agreement or otherwise with the recommendations to establish candidate 15/180 as the 2nd
IS for
Factor XI, Plasma, with a FXI:C value of 0.71 IU/ampoule and a FXI:Ag value of 0.78
IU/ampoule. The participants were requested to respond within two weeks if they had any
comments or objections to the recommendations, otherwise a null response would be taken as
agreement with no comments. Twenty-two of the participants chose to respond, all giving their
agreement to the recommendations. Any comments were related to the names or affiliations of
the participants and one requested a minor change to Figure 2, all of which have been completed.
SSC Experts’ Review
The proposals and recommendations presented in this report were approved at the SSC Board
Meeting in Montpellier in May 2016. Nine responses from the expert review were received and
all endorsed the project. Some minor typographical errors were highlighted; all of which have
been corrected. Other comments and NIBSC responses are shown below.
Reviewer A:
“The number of data is impressive and the study design is the best as possible.
I have only some minor remarks
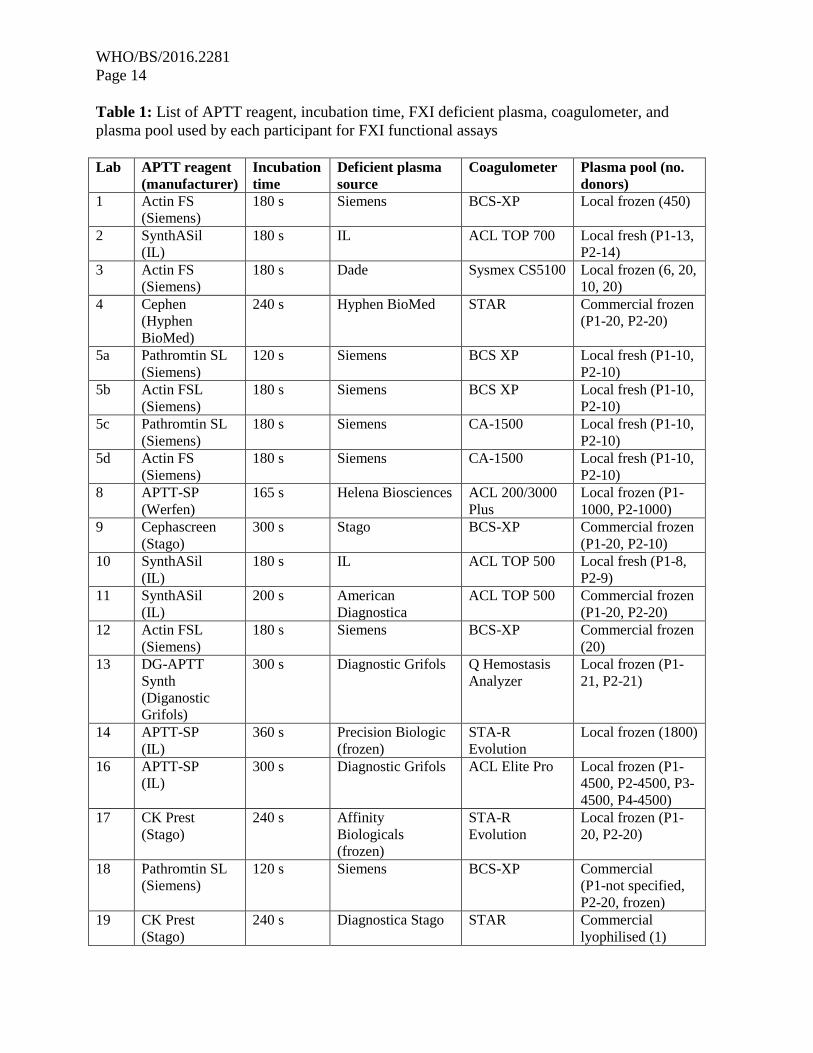
Table 1:
In column 4 the company/source of the deficient plasma is mentioned.
Is this also the company of the APTT reagent? This information is missing in the table.
WHO/BS/2016.2281
Page 12
For the deficient plasma much more important information is the properties of the deficient
plasma used; is it immune depleted plasma or congenital deficient plasma. It is interesting if
there is a difference in result. If not this could also be mentioned as a remark.
Appendix III Table 1:
The calculated result by the own laboratory or by the NIBSC calculation is not always the same.
Therefore in the development of an international standard not only the comparison of the rough
measured data is important, but also to teach the laboratories the method to extract the final
result.”
NIBSC response:
The source of APTT reagent has been added to Table 1.
For the deficient plasma, 6 laboratories used plasma from deficient donors (congenital) and there
was no difference in potency from these labs (average 0.70 IU/ampoule with 95% confidence
limits of 0.68-0.73 IU/ampoule) compared to the overall assigned potency.
On occasion there are some discrepancies between the laboratory reported results and the NIBSC
calculated results. In these instances the participating laboratory is contacted and possible
reasons for the discrepancies are discussed. Usually the discrepancies are identified as being
caused by a reporting error in the raw data. The laboratories taking part in such studies are
usually expert laboratories that are adept at using appropriate data analysis methods.
Reviewer B:
There are two issues the authors need to address.
1) Please justify why the blood for this study was centrifuged at 4 degrees Celsius? This fact can
result in C1 inhibitor inactivation (Weiss R et al. Blood 68:239,1986) with increased in vitro
FXII contact activation on the tube surface resulting in prior activation and lowering of zymogen
FXI in the ampules. Perhaps that is the reason the level of FXI is only 0.71 U/ml in the 2nd
ampuole. It also leads to cold activation of FVII and FIX by FXIIa (Seligsohn U et al. Thromb
Res. 13:1049, 1978).
2) Should the results be expressed as “u/ml” or “U/ml”. What is the international standard.
NIBSC response:
1. From the pre-study questionnaires it was identified that only a few laboratories were able
to collect fresh plasma pools for the study (5 labs). The decision was taken to
recommend centrifugation at 4°C in order to maintain consistency with frozen plasma
pools which are routinely prepared by centrifugation in this manner. The potency of
FXI:C is assigned relative to the 1st IS and not the plasma pools, so the centrifugation of
local plasma pools at 4°C would not impact the overall assigned potency of FXI:C. The
bulk material itself was maintained at room temperature throughout the duration of the
fill in order to avoid cold activation and in-house studies using NAPTT and FXIa assays
indicated minimal activation of the product had occurred.
2. The results for FXI:C are expressed u/ampoule when referring to results calculated
relative to plasma pools because it is an accepted assumption that 1 ml of plasma contains
1 unit, rather than being an official unitage. The FXI:Ag results are expressed u/ampoule
throughout the report as there is no International Standard for FXI:Ag. The
WHO/BS/2016.2281
Page 13
recommendations refer to the assignment of units in IU/ampoule because this is the
terminology that would be used on establishment of the standard.
Reviewer C:
“A well designed study from an extensive number of laboratories yielding a conclusive
agreement on the potency of the FXI standard in terms of both activity and antigen. My only
slight concern is the large intra-laboratory variation of a couple of the reported laboratories
particularly number 27. However, the data from the remaining laboratories is sufficiently tight to
support the proposal.”
NIBSC response:
A small number of laboratories do have intra-laboratory variations that are higher than others;
however, it is the geometric mean from each laboratory that is used to calculate the overall
potency. The inter-laboratory agreement for FXI:C is excellent with a GCV of 1.8% and for
FXI:Ag is good at 10%. In this case, intra-laboratory variation has minimal impact on the
overall potency estimate and, in some cases, could be a reflection of the differences in the two
plasma pools used by each laboratory and/or an indication of the performance of the laboratory.
Reviewer D:
This is a carefully performed study and the recommendations of the Expert Committee for
Biological Standardization of the World Health Organization are sound.
Reviewer E:
Study & analyses appear to have been performed in a careful manner and the conclusions are
well supported by the study results.
WHO/BS/2016.2281
Page 14
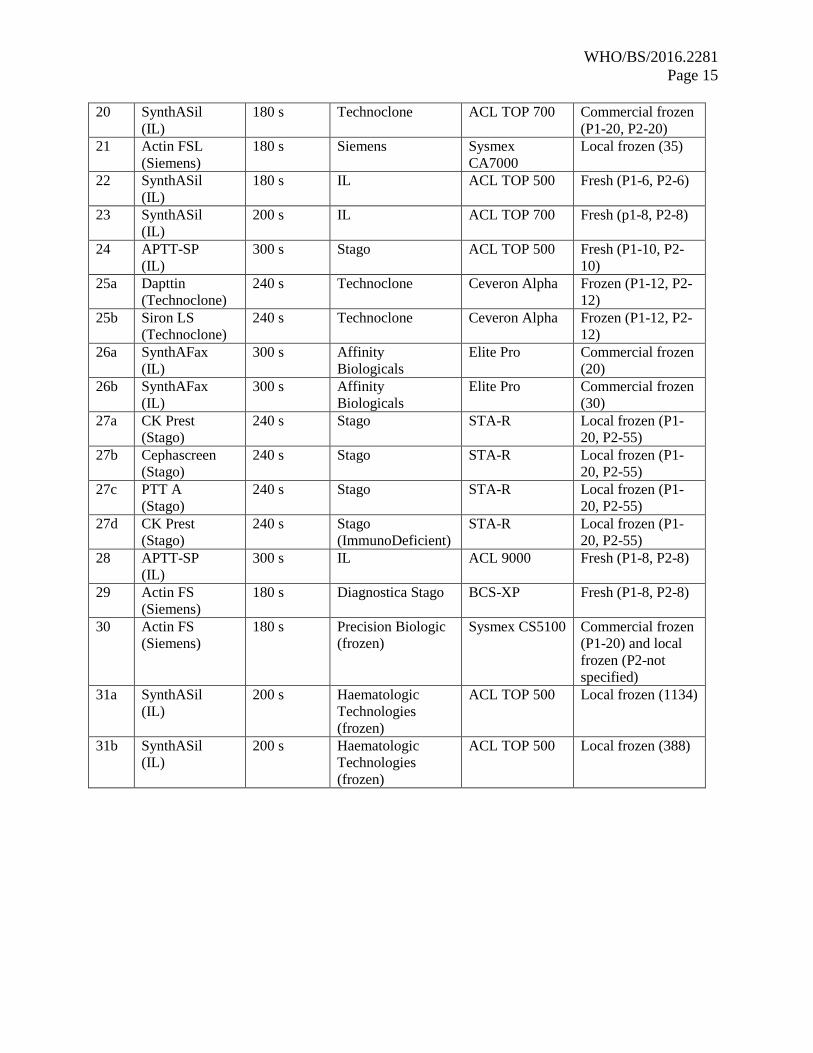
Table 1: List of APTT reagent, incubation time, FXI deficient plasma, coagulometer, and
plasma pool used by each participant for FXI functional assays
Lab APTT reagent
(manufacturer)
Incubation
time
Deficient plasma
source
Coagulometer Plasma pool (no.
donors)
1 Actin FS
(Siemens)
180 s Siemens BCS-XP Local frozen (450)
2 SynthASil
(IL)
180 s IL ACL TOP 700 Local fresh (P1-13,
P2-14)
3 Actin FS
(Siemens)
180 s Dade Sysmex CS5100 Local frozen (6, 20,
10, 20)
4 Cephen
(Hyphen
BioMed)
240 s Hyphen BioMed STAR Commercial frozen
(P1-20, P2-20)
5a Pathromtin SL
(Siemens)
120 s Siemens BCS XP Local fresh (P1-10,
P2-10)
5b Actin FSL
(Siemens)
180 s Siemens BCS XP Local fresh (P1-10,
P2-10)
5c Pathromtin SL
(Siemens)
180 s Siemens CA-1500 Local fresh (P1-10,
P2-10)
5d Actin FS
(Siemens)
180 s Siemens CA-1500 Local fresh (P1-10,
P2-10)
8 APTT-SP
(Werfen)
165 s Helena Biosciences ACL 200/3000
Plus
Local frozen (P1-
1000, P2-1000)
9 Cephascreen
(Stago)
300 s Stago BCS-XP Commercial frozen
(P1-20, P2-10)
10 SynthASil
(IL)
180 s IL ACL TOP 500 Local fresh (P1-8,
P2-9)
11 SynthASil
(IL)
200 s American
Diagnostica
ACL TOP 500 Commercial frozen
(P1-20, P2-20)
12 Actin FSL
(Siemens)
180 s Siemens BCS-XP Commercial frozen
(20)
13 DG-APTT
Synth
(Diganostic
Grifols)
300 s Diagnostic Grifols Q Hemostasis
Analyzer
Local frozen (P1-
21, P2-21)
14 APTT-SP
(IL)
360 s Precision Biologic
(frozen)
STA-R
Evolution
Local frozen (1800)
16 APTT-SP
(IL)
300 s Diagnostic Grifols ACL Elite Pro Local frozen (P1-
4500, P2-4500, P3-
4500, P4-4500)
17 CK Prest
(Stago)
240 s Affinity
Biologicals
(frozen)
STA-R
Evolution
Local frozen (P1-
20, P2-20)
18 Pathromtin SL
(Siemens)
120 s Siemens BCS-XP Commercial
(P1-not specified,
P2-20, frozen)
19 CK Prest
(Stago)
240 s Diagnostica Stago STAR Commercial
lyophilised (1)
WHO/BS/2016.2281
Page 15
20 SynthASil
(IL)
180 s Technoclone ACL TOP 700 Commercial frozen
(P1-20, P2-20)
21 Actin FSL
(Siemens)
180 s Siemens Sysmex
CA7000
Local frozen (35)
22 SynthASil
(IL)
180 s IL ACL TOP 500 Fresh (P1-6, P2-6)
23 SynthASil
(IL)
200 s IL ACL TOP 700 Fresh (p1-8, P2-8)
24 APTT-SP
(IL)
300 s Stago ACL TOP 500 Fresh (P1-10, P2-
10)
25a Dapttin
(Technoclone)
240 s Technoclone Ceveron Alpha Frozen (P1-12, P2-
12)
25b Siron LS
(Technoclone)
240 s Technoclone Ceveron Alpha Frozen (P1-12, P2-
12)
26a SynthAFax
(IL)
300 s Affinity
Biologicals
Elite Pro Commercial frozen
(20)
26b SynthAFax
(IL)
300 s Affinity
Biologicals
Elite Pro Commercial frozen
(30)
27a CK Prest
(Stago)
240 s Stago STA-R Local frozen (P1-
20, P2-55)
27b Cephascreen
(Stago)
240 s Stago STA-R Local frozen (P1-
20, P2-55)
27c PTT A
(Stago)
240 s Stago STA-R Local frozen (P1-
20, P2-55)
27d CK Prest
(Stago)
240 s Stago
(ImmunoDeficient)
STA-R Local frozen (P1-
20, P2-55)
28 APTT-SP
(IL)
300 s IL ACL 9000 Fresh (P1-8, P2-8)
29 Actin FS
(Siemens)
180 s Diagnostica Stago BCS-XP Fresh (P1-8, P2-8)
30 Actin FS
(Siemens)
180 s Precision Biologic
(frozen)
Sysmex CS5100 Commercial frozen
(P1-20) and local
frozen (P2-not
specified)
31a SynthASil
(IL)
200 s Haematologic
Technologies
(frozen)
ACL TOP 500 Local frozen (1134)
31b SynthASil
(IL)
200 s Haematologic
Technologies
(frozen)
ACL TOP 500 Local frozen (388)

WHO/BS/2016.2281
Page 16
Table 2: List of FXI antigen kit/paired antibodies and local plasma pool used by each laboratory
Lab Antibody/kit source Plasma pool (no. donors)
Lab 6 Cedarlane paired
antibodies
Commerical frozen (P1-20, P2-20)
Lab 7 Cedarlane Lyophilised (donors not specified)
Lab 14 Coachrom paired
antibodies
Fresh (P1-1800, P2-1800)
Lab 15 Molecular Innovation kit Commercial frozen (p1-10, P2-10, P3-
10, P4-10)
Lab 16 Dunn Labortechnick kit Local frozen (P1-4500, P2-4500, P3-
4500, P4-4500)
Lab 17 VisuLize ELISA Kit,
Affinity Biologicals
Local frozen (P1-20, P2-20)
Lab 18 CoaChrom paired
antibodies
Commercial frozen (P1-not specified,
P2-20)
Lab 24 VisuLize ELISA Kit,
Affinity Biologicals
Fresh (P1-10, P2-10)
Lab 26a VisuLize ELISA Kit,
Affinity Biologicals
Commercial frozen (single batch-20)
Lab 26b VisuLize ELISA Kit,
Affinity Biologicals
Commercial frozen (single batch-30)
Lab 28 VisuLize ELISA Kit,
Affinity Biologicals
Local frozen (P1-8, P2-8)
WHO/BS/2016.2281
Page 17
Table 3: Individual assay results for FXI functional activity in IU/ampoule for Sample A against
Sample S, the 1st IS for FXI, Plasma. Each laboratory’s geometric mean is reported and intra-
laboratory variation is shown as GCV (%). Lab 17 (shaded) was excluded from the overall
analysis as an outlier. The overall geometric mean and inter-laboratory GCV is also shown.
Figures in brackets indicate the 95% confidence limits. NP: non-parallel.
Sample A vs Sample S
Lab Assay
1
Assay
2
Assay
3
Assay
4
Geometric
mean
(IU/amp)
GCV
1 0.70 0.66 0.70 0.68 0.68 3.10%
2 0.74 0.75 0.73 0.72 0.74 2.10%
3 0.70 0.66 0.73 0.71 0.70 4.80%
4 0.70 0.72 0.74 0.70 0.71 2.70%
5a 0.71 0.70 0.73 0.74 0.72 2.70%
5b 0.70 0.71 0.73 0.74 0.72 2.50%
5c 0.71 0.70 0.70 0.72 0.71 1.50%
5d 0.73 0.72 0.70 0.70 0.71 2.00%
8 0.70 0.73 0.71 0.73 0.72 2.10%
9 0.69 0.70 0.74 0.69 0.71 3.30%
10 0.71 0.68 0.71 0.75 0.71 3.90%
11 0.69 0.70 0.71 0.70 0.70 1.10%
12 0.74 0.71 0.70 0.73 0.72 2.50%
13 0.72 0.70 0.69 0.72 0.71 2.00%
14 0.75 0.73 0.69 0.72 0.72 3.80%
16 0.70 NP 0.70 0.71 0.70 0.55%
17 0.74 0.80 - 0.81 0.78 4.80%
18 0.73 0.73 0.72 0.71 0.72 1.10%
19 0.70 0.72 0.70 0.72 0.71 1.40%
20 0.70 0.75 0.67 0.70 0.70 4.70%
21 0.71 0.73 0.70 0.69 0.71 2.40%
22 0.73 0.69 0.70 0.74 0.72 3.50%
23 0.78 0.71 0.71 0.71 0.73 5.10%
24 0.69 0.75 0.73 0.70 0.72 3.70%
25a 0.66 NP NP 0.77 0.71 -
25b 0.73 0.70 0.73 NP 0.72 2.50%
26 NP 0.74 0.73 NP 0.73 -
27a NP 0.70 0.70 NP 0.70 -
27b 0.68 0.69 0.74 0.87 0.74 12.00%
27c 0.70 0.65 0.69 0.79 0.70 8.10%
27d 0.74 0.68 0.72 0.71 0.71 3.20%
28 0.68 0.73 0.70 0.71 0.71 3.10%
29 0.71 0.70 0.70 0.71 0.70 1.20%
30 0.70 0.71 0.72 0.73 0.71 1.60%
31 0.70 0.72 0.69 0.70 0.70 2.10%
Overall result for A vs S
0.71
(0.708-0.719)
2.30%
Overall result for A vs S, excluding outliers 0.71
(0.708-0.716)
1.60%

WHO/BS/2016.2281
Page 18
Table 4: Individual assay results for FXI functional activity in IU/ampoule for Sample B against
Sample S, the 1st IS for FXI, Plasma. Each laboratory’s geometric mean is reported and intra-
laboratory variation is shown as GCV (%). Lab 17 (shaded) was excluded from the overall
analysis as an outlier. The overall geometric mean and inter-laboratory GCV is also shown.
Figures in brackets indicate the 95% confidence limits. NP: non-parallel.
Sample B vs Sample S
Lab Assay
1
Assay
2
Assay
3
Assay
4
Geometric
mean
(IU/amp)
GCV
1 0.71 0.65 0.68 0.68 0.68 3.90%
2 0.70 0.72 0.73 0.71 0.72 1.50%
3 0.70 0.670 0.76 0.71 0.71 3.80%
4 0.70 0.72 0.73 0.71 0.71 1.60%
5a 0.69 0.71 0.74 0.75 0.72 3.80%
5b 0.69 0.71 0.70 0.73 0.71 2.50%
5c 0.72 0.70 0.67 0.72 0.70 3.30%
5d 0.72 0.72 0.69 0.70 0.71 2.40%
8 0.73 0.73 0.73 0.76 0.74 1.70%
9 0.72 0.68 0.71 0.71 0.70 2.50%
10 0.75 0.68 0.71 0.74 0.72 4.70%
11 0.70 0.70 0.70 0.70 0.70 0.15%
12 0.73 0.73 0.70 0.70 0.72 2.20%
13 0.74 0.71 0.69 0.72 0.72 2.90%
14 0.77 0.71 0.70 0.68 0.72 5.50%
16 0.73 0.73 0.72 0.71 0.72 1.70%
17 0.74 0.79 - 0.80 0.77 4.60%
18 0.72 0.71 0.68 0.72 0.71 2.90%
19 0.73 0.70 0.68 0.72 0.71 3.00%
20 0.67 0.74 0.68 0.68 0.69 4.60%
21 0.74 0.74 0.69 0.71 0.72 3.70%
22 0.75 0.73 0.70 0.72 0.73 3.00%
23 0.70 0.71 0.72 0.69 0.70 1.50%
24 0.72 0.74 0.71 0.73 0.72 1.60%
25a 0.73 0.65 0.58 0.80 0.69 15.00%
25b NP 0.72 0.75 0.72 0.73 2.10%
26 NP 0.71 0.76 NP 0.74 -
27a NP 0.70 0.71 NP 0.70 -
27b 0.65 0.69 0.63 NP 0.66 4.20%
27c 0.67 0.62 0.61 0.85 0.68 16.00%
27d 0.73 0.67 0.70 0.71 0.70 3.60%
28 0.69 0.72 0.72 0.70 0.71 2.50%
29 0.70 0.69 0.68 0.70 0.69 0.86%
30 0.71 0.71 0.70 0.72 0.71 0.99%
31 0.71 0.72 0.68 0.71 0.71 2.80%
Overall result for B vs S
0.71
(0.703-0.717)
2.80%
Overall result for B vs S, excluding outliers
0.71
(0.702-0.714)
2.40%
WHO/BS/2016.2281
Page 19
Table 5: The geometric mean for each laboratory (IU/ampoule) for samples A and B (coded
duplicates) combined and analysed relative to sample S, the 1st IS for FXI, Plasma. Intra-
laboratory variation is shown as GCV (%). Lab 17 (shaded) was excluded from the overall
analysis as an outlier. The overall geometric mean and inter-laboratory GCV is also shown.
Figures in brackets indicate the 95% confidence limits.
Samples AB vs Sample S
Lab Geometric mean
(IU/amp)
GCV
1 0.68 3.40%
2 0.73 1.40%
3 0.71 4.00%
4 0.71 2.10%
5a 0.72 3.20%
5b 0.71 2.30%
5c 0.71 2.40%
5d 0.71 2.20%
8 0.73 1.70%
9 0.70 2.10%
10 0.71 4.00%
11 0.70 0.54%
12 0.72 1.90%
13 0.71 2.30%
14 0.72 4.40%
16 0.71 1.60%
17 0.78 4.70%
18 0.72 1.60%
19 0.71 1.80%
20 0.70 4.30%
21 0.71 2.90%
22 0.72 2.70%
23 0.72 2.30%
24 0.72 2.30%
25a 0.67 13.00%
25b 0.72 1.60%
26 0.74 -
27a 0.70 -
27b 0.72 13.00%
27c 0.69 12.00%
27d 0.71 3.30%
28 0.71 2.60%
29 0.70 0.96%
30 0.71 1.10%
31 0.70 2.30%
Overall results for AB vs S
0.71
(0.706-0.718)
2.30%
Overall results for AB vs S,
excluding outliers
0.71
(0.706-0.715)
1.80%
WHO/BS/2016.2281
Page 20
Figure 1: Histogram showing each laboratory’s geometric mean for FXI:C of samples A and B
combined, relative to sample S, the 1st IS for FXI, Plasma. Outliers are shown in red. The
overall geometric mean was 0.71 IU/ampoule with a GCV of 1.8%.
Table 6: Laboratory geometric means for AB vs S for APTT reagents Actin FS, SynthASil and
APTT-SP, their overall geometric mean and comparison to overall results for AB vs S
Lab number
(geometric mean of AB vs S, IU/amp)
Overall geometric
mean, IU/amp
(95% CL)
Overall geometric
mean of AB vs S (all
APTT), IU/amp (95%
CL)
Actin FS
(n=5)
1
(0.68)
3
(0.71)
5d
(0.71)
29
(0.70)
30
(0.71) -
- 0.70
(0.685-0.718)
0.71
(0.706-0.715) SynthASil
(n=7)
2
(0.73)
10
(0.71)
11
(0.70)
20
(0.70)
22
(0.72)
23
(0.72)
31
(0.70)
0.71
(0.700-0.722)
APTT-SP
(n=5)
8
(0.73)
14
(0.72)
16
(0.71)
24
(0.72)
28
(0.71) -
- 0.72
(0.707-0.728)
CL: Confidence limits
Num
ber
of Labora
tories
0
2
4
6
8
10
12
14
16
18
20
Potency (IU/ampoule)
0.5 0.6 0.7 0.8 0.9 1.0
1
25a
3
9
11
13
19
20
28
29
30
31
27a
27c
27d
5c
5d
2
4
8
10
12
14
16
18
21
22
23
24
26
25b
27b
5a
5b
17

WHO/BS/2016.2281
Page 21
Table 7: Individual assay results for FXI functional activity for Sample A against Sample P,
each laboratory’s local plasma pool. Each laboratory’s geometric mean is reported and intra-
laboratory variation is shown as GCV (%). The overall geometric mean and inter-laboratory
GCV for A against P is also shown. Figures in brackets indicate the 95% confidence limits. NP:
Non-parallel
Sample A vs Sample P
Lab Assay
1
Assay
2
Assay
3
Assay
4
Geometric
mean
(u/amp)
GCV
1 0.75 0.62 0.71 0.65 0.68 8.90%
2 0.64 NP 0.72 NP 0.68 -
3 0.71 0.70 0.65 0.70 0.69 4.10%
4 0.85 0.83 0.75 NP 0.81 6.90%
5a 0.67 NP 0.67 0.68 0.67 1.20%
5b 0.71 0.71 0.73 0.74 0.72 2.50%
5c 0.66 0.67 0.66 0.68 0.67 1.70%
5d 0.64 0.67 0.67 0.64 0.65 2.20%
8 0.75 0.75 NP 0.71 0.74 3.70%
9 0.70 NP 0.84 0.80 0.78 10.00%
10 0.64 0.63 0.69 0.68 0.66 4.60%
11 0.81 0.81 0.76 0.74 0.78 4.50%
12 0.76 0.74 0.73 0.75 0.74 1.80%
13 0.64 0.70 0.62 0.69 0.66 6.10%
14 0.78 0.79 0.81 0.82 0.80 2.50%
16 0.74 0.79 NP 0.82 0.78 5.20%
17 0.72 0.70 - 0.72 0.71 1.40%
18 0.81 0.87 0.81 NP 0.83 4.00%
19 0.73 0.72 0.76 NP 0.74 3.20%
20 0.74 0.77 0.73 0.81 0.76 5.10%
21 0.69 0.76 0.71 0.68 0.71 4.90%
22 0.69 0.68 0.70 0.72 0.70 2.50%
23 0.77 0.67 0.70 0.70 0.71 5.80%
24 0.64 0.68 0.69 0.69 0.68 3.70%
25a NP 0.80 0.78 NP 0.79 -
25b NP 0.78 0.81 NP 0.80 -
26a NP NP 0.68 NP 0.68 -
26b 0.70 0.78 0.70 0.71 0.72 5.60%
27a NP 0.72 0.71 0.71 0.71 1.20%
27b 0.76 NP 0.76 NP 0.76 -
27c 0.75 NP 0.67 0.76 0.73 6.90%
27d 0.73 0.72 0.69 0.70 0.71 3.00%
28 0.64 0.67 0.68 0.64 0.66 3.20%
29 0.70 0.67 0.75 0.73 0.71 4.90%
30 0.69 0.72 0.65 0.66 0.68 4.70%
31a 0.75 0.78 0.77 0.76 0.77 1.90%
31b 0.72 0.76 0.74 0.72 0.73 2.50%
Overall result for A vs P 0.72
(0.706-0.738)
6.90%
WHO/BS/2016.2281
Page 22
Table 8: Individual assay results for FXI functional activity for Sample B against Sample P,
each laboratory’s local plasma pool. Each laboratory’s geometric mean is reported and intra-
laboratory variation is shown as GCV (%). The overall geometric mean and inter-laboratory
GCV for B against P is also shown. Figures in brackets indicate the 95% confidence limits. NP:
Non-parallel
Sample B vs Sample P
Lab Assay
1
Assay
2
Assay
3
Assay
4
Geometric
mean
(u/amp)
GCV
1 0.76 0.61 0.69 0.66 0.68 9.40%
2 0.62 0.64 0.71 NP 0.66 7.20%
3 0.71 0.74 0.66 0.70 0.70 4.80%
4 0.85 0.84 0.74 0.74 0.79 8.00%
5a 0.66 NP 0.68 0.69 0.68 2.60%
5b 0.70 0.70 0.70 0.74 0.71 2.80%
5c 0.67 0.67 0.63 0.68 0.66 3.50%
5d 0.64 0.67 0.66 0.64 0.65 2.00%
8 0.79 0.76 NP 0.73 0.76 3.90%
9 0.73 0.67 0.81 0.81 0.75 9.40%
10 0.67 0.63 0.69 0.68 0.67 4.40%
11 0.82 0.81 0.75 0.74 0.78 5.50%
12 0.75 0.76 0.73 0.73 0.74 2.40%
13 0.66 0.72 0.62 0.69 0.67 6.30%
14 0.80 0.77 0.82 0.78 0.79 3.10%
16 0.78 0.78 0.86 0.81 0.81 5.10%
17 0.72 0.69 - 0.71 0.71 2.20%
18 NP 0.85 0.77 0.89 0.84 7.50%
19 0.76 0.70 0.75 0.76 0.74 4.00%
20 0.70 NP 0.74 0.78 0.74 5.50%
21 0.71 0.77 0.70 0.70 0.72 4.70%
22 0.71 0.72 0.70 0.70 0.71 1.50%
23 0.68 0.66 0.71 0.69 0.69 2.90%
24 0.66 0.67 0.67 0.72 0.68 3.50%
25a NP 0.86 0.80 NP 0.83 -
25b 0.82 0.81 0.83 0.87 0.83 3.00%
26a NP NP 0.71 0.66 0.68 -
26b 0.72 0.74 0.74 0.70 0.72 3.00%
27a 0.69 0.72 0.71 0.73 0.71 2.40%
27b 0.72 NP NP NP 0.72 -
27c 0.72 NP 0.60 0.83 0.71 18.00%
27d 0.73 0.71 0.66 0.70 0.70 4.30%
28 0.65 0.66 0.70 0.63 0.66 4.80%
29 0.69 0.67 0.74 0.72 0.70 4.60%
30 0.70 0.73 0.64 0.65 0.68 6.00%
31a 0.76 0.78 0.76 0.78 0.77 1.40%
31b 0.73 0.75 0.72 0.74 0.74 1.70%
Overall result for B vs P 0.72
(0.705-0.739)
7.30%
WHO/BS/2016.2281
Page 23
Table 9: The geometric mean for each laboratory for samples A and B (coded duplicates)
combined and analysed relative to sample P, each laboratory’s local plasma pool. Intra-
laboratory variation is shown as GCV (%). The overall geometric mean and inter-laboratory
GCV for AB vs P is also shown. Figures in brackets indicate the 95% confidence limits.
Samples AB vs Sample P
Lab Geometric mean
(u/amp)
GCV
1 0.68 9.10%
2 0.66 6.70%
3 0.70 4.20%
4 0.79 7.60%
5a 0.67 1.80%
5b 0.72 2.50%
5c 0.66 2.50%
5d 0.65 2.10%
8 0.75 3.60%
9 0.75 10.00%
10 0.66 4.30%
11 0.78 5.00%
12 0.74 1.60%
13 0.67 6.10%
14 0.80 2.20%
16 0.80 5.70%
17 0.71 1.80%
18 0.84 5.40%
19 0.74 3.10%
20 0.76 4.70%
21 0.71 4.70%
22 0.70 0.91%
23 0.70 3.60%
24 0.68 3.20%
25a 0.81 -
25b 0.83 3.60%
26a 0.67 -
26b 0.72 3.80%
27a 0.71 2.10%
27b 0.75 -
27c 0.72 12.00%
27d 0.71 3.60%
28 0.66 3.90%
29 0.71 4.70%
30 0.68 5.30%
31a 0.77 1.40%
31b 0.74 1.90%
Overall results for AB vs P 0.72
(0.705-0.739) 7.20%
WHO/BS/2016.2281
Page 24
Figure 2: Histogram showing each laboratory’s geometric mean for FXI:C of samples A and B
combined, relative to sample P, the laboratory’s local plasma pool. The overall geometric mean
was 0.72 IU/ampoule with a GCV of 7.2%.
Num
ber
of Labora
tories
0
2
4
6
8
10
12
14
16
18
20
Potency (units/ampoule)
0.5 0.6 0.7 0.8 0.9 1.0
2
28
5d
1
10
13
24
30
26a
5a
5c
3
17
22
23
29
27a
27d
21
26b
27c
31b
5b
8
9
12
19
20
27b
11
31a
4
14
16
25a
18
25b
WHO/BS/2016.2281
Page 25
Table 10: Individual assay results for FXI antigen for Sample A against Sample P, each
laboratory’s local plasma pool. Each laboratory’s geometric mean is reported and intra-
laboratory variation is shown as GCV (%). The overall geometric mean and inter-laboratory
GCV for A against P is also shown. Figures in brackets indicate the 95% confidence limits.
Sample A vs P, u/ampoule
Lab Assay 1 Assay 2 Assay 3 Assay 4 Assay 5 Assay 6 Geometric
mean
(u/amp)
GCV
6 0.60 0.77 0.70 0.72 - - 0.70 11.00%
7 0.88 0.90 0.96 1.00 - - 0.93 6.10%
14 0.75 0.82 0.81 0.77 - - 0.79 4.10%
15 0.72 0.74 0.76 0.84 - - 0.76 6.80%
16 0.86 0.76 0.99 0.89 - - 0.87 11.00%
17 0.73 0.72 0.71 0.72 - - 0.72 1.00%
18 0.76 0.96 0.98 0.86 - - 0.89 13.00%
20 0.77 0.81 0.91 0.75 - - 0.81 8.60%
24 0.72 0.72 - 0.73 - - 0.72 0.47%
26a 0.72 0.68 0.72 0.70 0.84 0.73 0.73 7.70%
26b 0.71 0.60 0.78 0.77 0.82 0.78 0.74 12.00%
28 0.71 0.71 0.72 0.73 - - 0.72 1.20%
Overall result for A vs P
0.78
(0.731-0.827) 10.00%
Table 11: Individual assay results for FXI antigen for Sample B against Sample P, each
laboratory’s local plasma pool. Each laboratory’s geometric mean is reported and intra-
laboratory variation is shown as GCV (%). The overall geometric mean and inter-laboratory
GCV for B against P is also shown. Figures in brackets indicate the 95% confidence limits. NP:
non-parallel
Sample B vs P, u/ampoule
Lab Assay 1 Assay 2 Assay 3 Assay 4 Assay 5 Assay 6 Geometric
mean
(u/amp)
GCV
6 NP 0.73 0.71 0.77 - - 0.74 3.90%
7 0.91 0.89 0.99 1.00 - - 0.94 5.80%
14 0.89 0.74 0.91 0.80 - - 0.83 9.90%
15 0.85 0.75 0.74 0.98 - - 0.82 14.00%
16 NP 0.73 1.01 0.85 - - 0.86 18.00%
17 0.67 0.70 0.67 0.75 - - 0.70 5.30%
18 0.79 0.93 1.05 0.80 - - 0.89 15.00%
20 0.79 0.76 0.92 0.72 - - 0.79 11.00%
24 0.69 0.65 - 0.75 - - 0.69 7.30%
26a 0.68 0.76 NP 0.77 0.87 0.77 0.77 9.40%
26b 0.67 0.67 NP 0.84 0.85 0.82 0.77 13.00%
28 0.74 0.71 0.71 0.73 - - 0.72 1.90%
Overall result for B vs P
0.79
(0.743-0.840) 10.00%
WHO/BS/2016.2281
Page 26
Table 12: The geometric mean for each laboratory for samples A and B (coded duplicates)
combined and analysed relative to sample P, each laboratory’s local plasma pool. Intra-
laboratory variation is shown as GCV (%). The overall geometric mean and inter-laboratory
GCV for AB vs P is also shown. Figures in brackets indicate the 95% confidence limits.
Samples AB vs Sample P
Lab Geometric
mean (u/amp)
GCV
6 0.70 11.00%
7 0.94 5.80%
14 0.81 4.50%
15 0.79 9.70%
16 0.86 13.00%
17 0.71 2.80%
18 0.89 13.00%
20 0.80 9.40%
24 0.71 3.80%
26a 0.74 7.60%
26b 0.76 11.00%
28 0.72 1.10%
Overall result for AB vs P
0.78
(0.735-0.832) 10.00%
WHO/BS/2016.2281
Page 27
Figure 3: Histogram showing each laboratory’s individual assay results for FXI:Ag of samples
A and B combined, relative to sample P, the laboratory’s local plasma pool. The overall
geometric mean was 0.78 u/ampoule with a GCV of 10.0%.
Num
ber
of A
ssays
0
2
4
6
8
10
12
14
16
18
20
Potency (units/ampoule)
0.5 0.6 0.7 0.8 0.9 1.0 1.1 1.2
6 26b 24 6
17
17
17
24
28
26a
26b
17
20
24
28
28
28
26a
26a
26a
6
6
15
15
16
26a
14
14
15
18
20
26b
20
26b
26b
14
18
26b
14
16
26a
16 7
7
15
20
18 7 7
16
18
WHO/BS/2016.2281
Page 28
Figure 4: Histogram showing each laboratory’s geometric mean for FXI:Ag samples A and B
combined, relative to the laboratory’s local plasma pool (sample P).
References
1. Gomez K and Bolton-Maggs P (2008). Factor XI deficiency. Haem 14: 1183-1189.
2. Assignment of potency to the WHO 1st International Standard for blood coagulation
factor XI in plasma, human (04/102) and calibration of blood coagulation factor XI in
SSC secondary plasma standard lot #3. WHO/BS/05.2017.
3. Finney DJ. Statistical Methods in Biological Assay. 3rd Edition. London: Charles Griffin
1978.
4. Grubbs F (1969). Procedures for Detecting Outlying Observations in Samples.
Technometrics: 11: 1-21.
Acknowledgements
The authors would like to thank all the participants of the study and the “Factor XI and the
contact system” sub-committee of the Scientific and Standardization Committee (SSC) of the
International Society on Thrombosis and Haemostasis (ISTH).
Num
ber
of Labora
tories
0
2
4
6
8
10
12
14
16
18
20
Potency (units/ampoule)
0.5 0.6 0.7 0.8 0.9 1.0
6
17
24
28 26a
26b
14
15
20
16
18
7
WHO/BS/2016.2281
Page 29
Appendix I – List of participants
Renata Zadro, University Hospital Center Zagreb, Zagreb, Croatia
Joergen Jespersen and Johannes Sidelmann, University of Southern Denmark, Esbjerg, Denmark
Caroline Lawrence and Grainne Hickman, Glasgow Royal Infirmary, Glasgow, United Kingdom
Sophie Desseauve and Jean Amiral, Hyphen Biomed, Neuville Sur Oise, France
Chris Hardway, Bio Products Laboratory, Elstree, United Kingdom
Chris Gardiner and Ian Mackie, University College London, London, United Kingdom
Regina Gebauer and Michael Timme, Siemens Healthcare Diagnostics Products GmbH,
Marburg, Germany
Anne Riddell, Royal Free London NHS Hospital Trust, London, United Kingdom
Frédéric Dhainaut, LFB Biotechnologies, Les Ulis, France
Aurelie Hazotte, LFB, Cedex, France
Amanda Blande, Bio Products Laboratory, Elstree, United Kingdom
Francois Hemery, LFB Biomedicaments, Lille, France
Roger Luddington, Addenbrooke’s Hospital, Cambridge, United Kingdom
Stephanie Eichmeir and Christoph Kefeder, AGES MEA, Vienna, Austria
Steffen Kistner, Jens Daufenbach and Karin Fuchs, Biotest AG, Dreieich, Germany
Mariona Bono and Begona Alonso, Diagnostic Grifols SA, Barcelona, Spain
Enrica Paladini, San Bortolo Hospital, Florence, Italy
Andrea Buchacher, Martina Schwartz and Pieter De Jong, Octapharma PPGmbH, Vienna,
Austria
Katherine Tull, Peter Vandeberg, Maria Cruz, Catherine Russ, Grifols Inc, North Carolina, USA
Berta Pons and Maite López, Instituto Grifols SA, Barcelona, Spain
Denise Foulon, Affinity Biologicals, Ontario, Canada
WHO/BS/2016.2281
Page 30
Colin Downey, Royal Liverpool Hospital, Liverpool, United Kingdom
Annette Feussner, CSL Behring GmbH, Marburg, Germany
Valérie LIEVRE, ANSM, Saint Denis, France
Carel Eckmann and Jeanette Rentenaar, Sanquin Blood Supply, Amsterdam, The Netherlands
Kathleen Trumbull, Instrumentation Laboratory, Massachusetts, USA
Annette Bowyer, Royal Hallamshire Hospital, Sheffield, United Kingdom
Nikolaus Binder, Technoclone GmbH, Vienna, Austria
Helen Wilmot and Stella Williams, NIBSC, Potters Bar, United Kingdom
Mikhail Ovanesov, Yideng Liang, Tseday Tegegn and Ravi Rasmi Jasti, FDA/CBER, Maryland,
USA
Claire Martin, Anne Lochu, Jerome Beltran, Marc Grimaux and Francois Nicham, Stago,
Gennevilliers, France
Andreas Hunfeld and Sylvia Rosenkranz, Paul Ehrlich Institute, Langen, Germany
WHO/BS/2016.2281
Page 31
Appendix II – Collaborative study protocols for FXI functional activity and FXI antigen
Appendix IIi – FXI functional activity protocol
CALIBRATION OF PROPOSED 2nd INTERNATIONAL STANDARD FOR
FACTOR XI, PLASMA (15/180).
CS546 STUDY PROTOCOL – FXI functional activity
1 SAMPLES FOR ASSAY
CODE PREPARATION
S 1st International Standard for Factor XI, Plasma (04/102), containing 0.86
IU FXI per ampoule
A Candidate A, containing approximately 0.7 units FXI per ampoule
B Candidate B, containing approximately 0.7 units FXI per ampoule
P1 – P2 Fresh normal plasma pools prepared locally according to the instructions
in Appendix one.
2 STORAGE AND RECONSTITUTION OF AMPOULES S, A AND B
Store all unopened ampoules at -20oC or below. For reconstitution, ampoules should first be
allowed to warm to room temperature and subsequently reconstituted by the addition of 1.0 ml of
distilled water. Allow the contents to solubilise for 10-15 minutes at room temperature with
gentle mixing, transfer contents to a plastic tube and store at ambient temperature (18-25oC).
Assays should be completed within 2 hours of reconstitution.
3 OUTLINE OF STUDY
If possible, please collect two sets of normal pooled plasma on days 1 and 3 of the study (see
appendix one) for use fresh and then subsequently frozen. A total of four assays should be
carried out over 4 separate days, using fresh ampoules of S, A and B in each assay. Please
perform Assay 1 on freshly prepared normal plasma pool (P1), Assay 2 on frozen plasma pool
P1, Assay 3 on a second freshly prepared normal plasma pool (P2) and Assay 4 on frozen plasma
pool P2. If freshly prepared normal pooled plasma cannot be collected, please use different
batches of freshly thawed normal pooled plasma as a substitute.
WHO/BS/2016.2281
Page 32
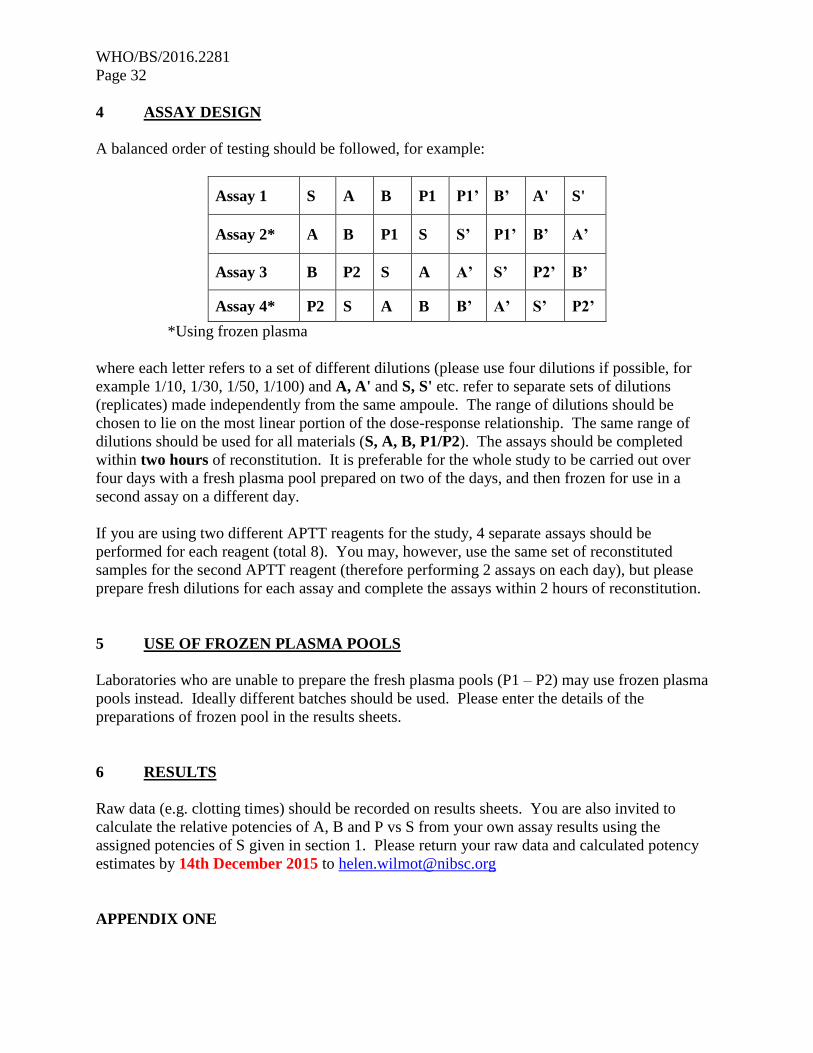
4 ASSAY DESIGN
A balanced order of testing should be followed, for example:
Assay 1 S A B P1 P1’ B’ A' S'
Assay 2* A B P1 S S’ P1’ B’ A’
Assay 3 B P2 S A A’ S’ P2’ B’
Assay 4* P2 S A B B’ A’ S’ P2’
*Using frozen plasma
where each letter refers to a set of different dilutions (please use four dilutions if possible, for
example 1/10, 1/30, 1/50, 1/100) and A, A' and S, S' etc. refer to separate sets of dilutions
(replicates) made independently from the same ampoule. The range of dilutions should be
chosen to lie on the most linear portion of the dose-response relationship. The same range of
dilutions should be used for all materials (S, A, B, P1/P2). The assays should be completed
within two hours of reconstitution. It is preferable for the whole study to be carried out over
four days with a fresh plasma pool prepared on two of the days, and then frozen for use in a
second assay on a different day.
If you are using two different APTT reagents for the study, 4 separate assays should be
performed for each reagent (total 8). You may, however, use the same set of reconstituted
samples for the second APTT reagent (therefore performing 2 assays on each day), but please
prepare fresh dilutions for each assay and complete the assays within 2 hours of reconstitution.
5 USE OF FROZEN PLASMA POOLS
Laboratories who are unable to prepare the fresh plasma pools (P1 – P2) may use frozen plasma
pools instead. Ideally different batches should be used. Please enter the details of the
preparations of frozen pool in the results sheets.
6 RESULTS
Raw data (e.g. clotting times) should be recorded on results sheets. You are also invited to
calculate the relative potencies of A, B and P vs S from your own assay results using the
assigned potencies of S given in section 1. Please return your raw data and calculated potency
estimates by 14th December 2015 to [email protected]
APPENDIX ONE
WHO/BS/2016.2281
Page 33
PREPARATION OF FRESH NORMAL PLASMA POOLS
Collect fresh normal plasma as described below, on two separate days, giving pools P1 and P2.
The method of collection of the fresh normal plasma is an important part of the study and should
be standardised as far as possible, according to the following protocol.
Donors
Normal healthy volunteers, excluding pregnant women or women taking oral contraceptives.
Take blood from as many different individuals as possible, on two separate days. If possible, use
a minimum of eight different donors for each pool; if this is not possible, some of the same
individuals can be used again, but the aim is to have a total of at least 12 different donors for
each laboratory.
Anticoagulant
0.109 M tri-sodium citrate, i.e. 3.2% w/v of the dihydrate (or a mixture of tri-sodium citrate and
citric acid with a total citrate concentration of 0.109 M). Ratio of 9 volumes blood to 1 volume
of anticoagulant.
Centrifugation
Blood should be centrifuged at 4oC as soon as possible after collection either at 50,000 g for 5
minutes or at 2000 g for 20 minutes.
Pooling and Storage
Pool equal volumes of plasma from the different donors and mix gently. Snap-freeze aliquots of
each pool (P1, P2) for assays 2 and 4. Thaw frozen aliquots at 37oC before use.
Keep the plasma pool in a plastic stoppered tube at ambient temperature (18-25oC) during the
assay session.
Appendix IIii – FXI antigen protocol
CALIBRATION OF PROPOSED 2nd INTERNATIONAL STANDARD FOR
FACTOR XI, PLASMA (15/180).
STUDY PROTOCOL – FXI / FXII antigen
1 SAMPLES FOR ASSAY
CODE PREPARATION
A Candidate A, containing approximately 1.0 u FXI/FXII per ampoule
B Candidate B, containing approximately 1.0 u FXI/FXII per ampoule
WHO/BS/2016.2281
Page 34
P1 – P2 Fresh normal plasma pools prepared locally according to the instructions
in Appendix one.
2 STORAGE AND RECONSTITUTION OF AMPOULES A AND B
Store all unopened ampoules at -20oC or below. For reconstitution, ampoules should first be
allowed to warm to room temperature and subsequently reconstituted by the addition of 1.0 ml of
distilled water. Allow the contents to solubilise for 10-15 minutes at room temperature with
gentle mixing, transfer contents to a plastic tube and store at ambient temperature (18-25oC).
3 OUTLINE OF STUDY
If possible, please collect two sets of normal pooled plasma on days 1 and 3 of the study (see
appendix one) for use fresh and then subsequently frozen. A total of four assays should be
carried out over 4 separate days, using fresh ampoules of A and B in each assay. Please perform
Assay 1 on freshly prepared normal plasma pool (P1), Assay 2 on frozen plasma pool P1, Assay
3 on a second freshly prepared normal plasma pool (P2) and Assay 4 on frozen plasma pool P2.
If freshly prepared normal pooled plasma cannot be collected, please use different batches of
freshly thawed normal pooled plasma as a substitute.
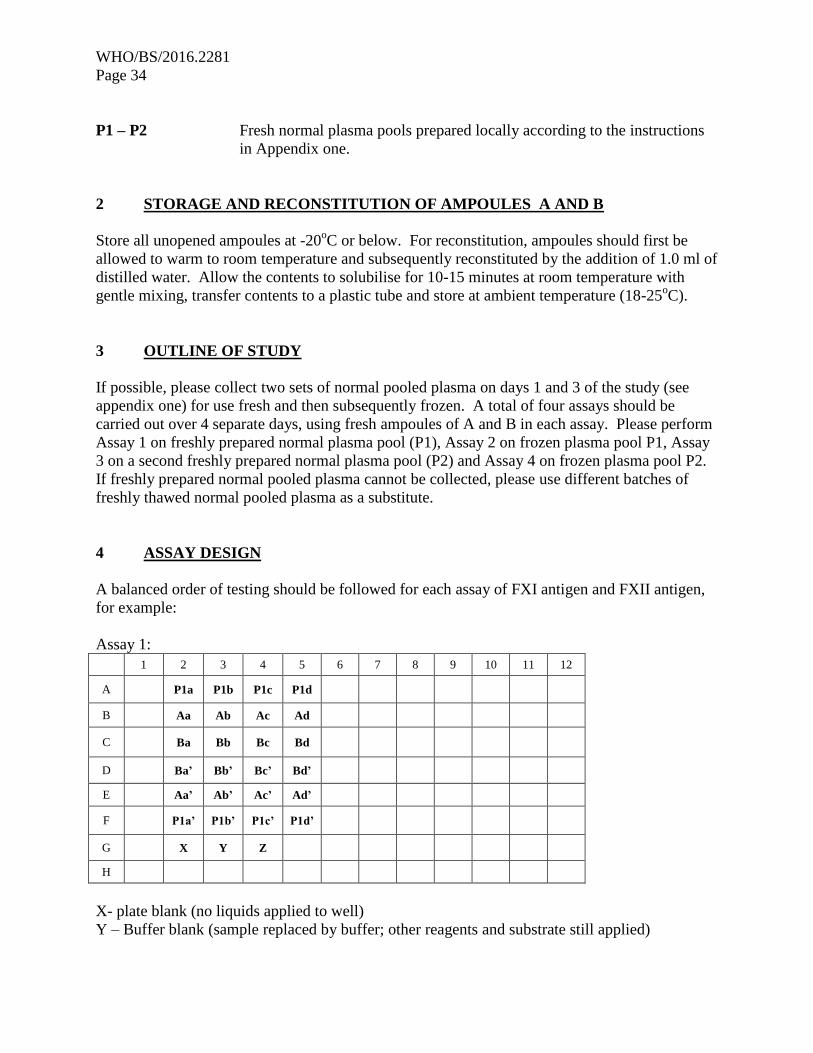
4 ASSAY DESIGN
A balanced order of testing should be followed for each assay of FXI antigen and FXII antigen,
for example:
Assay 1:
1 2 3 4 5 6 7 8 9 10 11 12
A P1a P1b P1c P1d
B Aa Ab Ac Ad
C Ba Bb Bc Bd
D Ba’ Bb’ Bc’ Bd’
E Aa’ Ab’ Ac’ Ad’
F P1a’ P1b’ P1c’ P1d’
G X Y Z
H
X- plate blank (no liquids applied to well)
Y – Buffer blank (sample replaced by buffer; other reagents and substrate still applied)
WHO/BS/2016.2281
Page 35
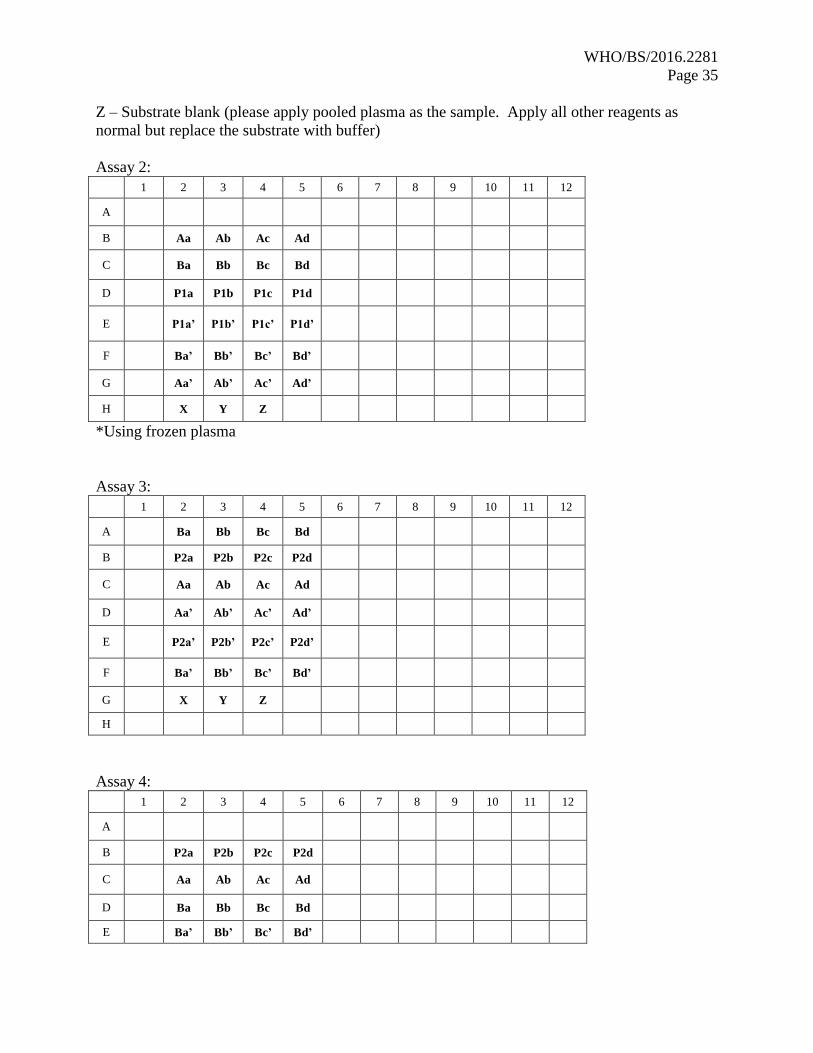
Z – Substrate blank (please apply pooled plasma as the sample. Apply all other reagents as
normal but replace the substrate with buffer)
Assay 2:
1 2 3 4 5 6 7 8 9 10 11 12
A
B Aa Ab Ac Ad
C Ba Bb Bc Bd
D P1a P1b P1c P1d
E P1a’ P1b’ P1c’ P1d’
F Ba’ Bb’ Bc’ Bd’
G Aa’ Ab’ Ac’ Ad’
H X Y Z
*Using frozen plasma
Assay 3:
1 2 3 4 5 6 7 8 9 10 11 12
A Ba Bb Bc Bd
B P2a P2b P2c P2d
C Aa Ab Ac Ad
D Aa’ Ab’ Ac’ Ad’
E P2a’ P2b’ P2c’ P2d’
F Ba’ Bb’ Bc’ Bd’
G X Y Z
H
Assay 4:
1 2 3 4 5 6 7 8 9 10 11 12
A
B P2a P2b P2c P2d
C Aa Ab Ac Ad
D Ba Bb Bc Bd
E Ba’ Bb’ Bc’ Bd’
WHO/BS/2016.2281
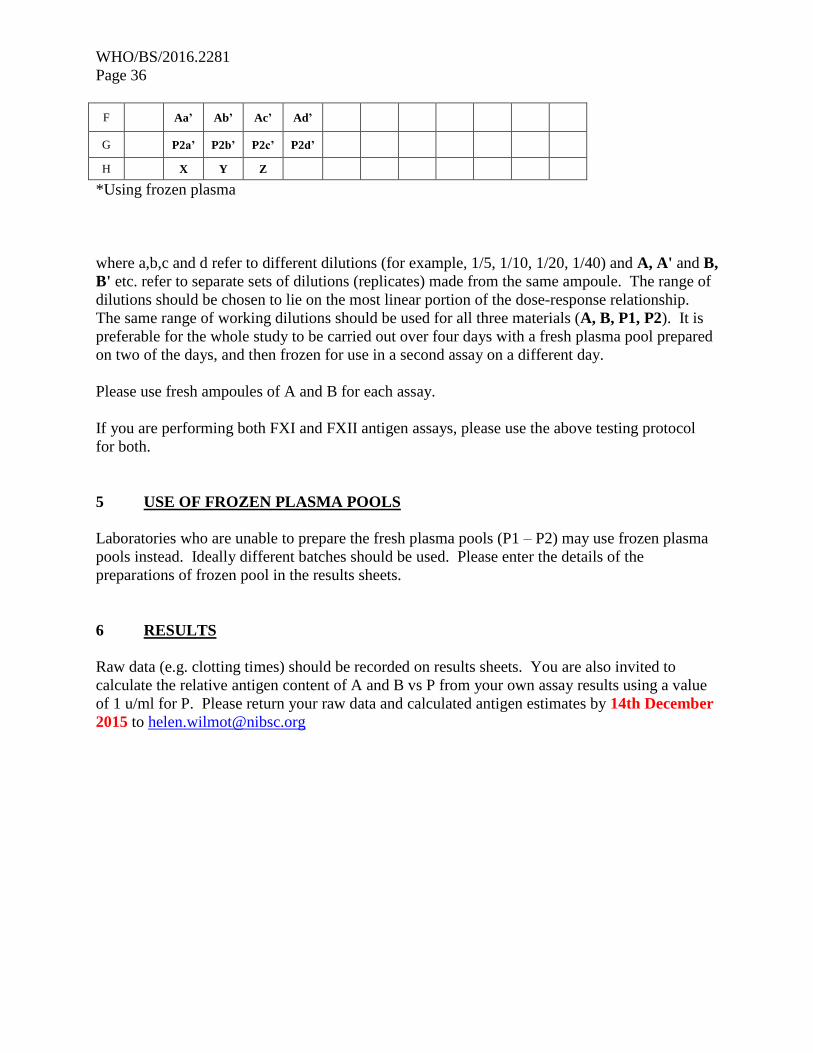
Page 36
F Aa’ Ab’ Ac’ Ad’
G P2a’ P2b’ P2c’ P2d’
H X Y Z
*Using frozen plasma
where a,b,c and d refer to different dilutions (for example, 1/5, 1/10, 1/20, 1/40) and A, A' and B,
B' etc. refer to separate sets of dilutions (replicates) made from the same ampoule. The range of
dilutions should be chosen to lie on the most linear portion of the dose-response relationship.
The same range of working dilutions should be used for all three materials (A, B, P1, P2). It is
preferable for the whole study to be carried out over four days with a fresh plasma pool prepared
on two of the days, and then frozen for use in a second assay on a different day.
Please use fresh ampoules of A and B for each assay.
If you are performing both FXI and FXII antigen assays, please use the above testing protocol
for both.
5 USE OF FROZEN PLASMA POOLS
Laboratories who are unable to prepare the fresh plasma pools (P1 – P2) may use frozen plasma
pools instead. Ideally different batches should be used. Please enter the details of the
preparations of frozen pool in the results sheets.
6 RESULTS
Raw data (e.g. clotting times) should be recorded on results sheets. You are also invited to
calculate the relative antigen content of A and B vs P from your own assay results using a value
of 1 u/ml for P. Please return your raw data and calculated antigen estimates by 14th December
2015 to [email protected]
WHO/BS/2016.2281
Page 37
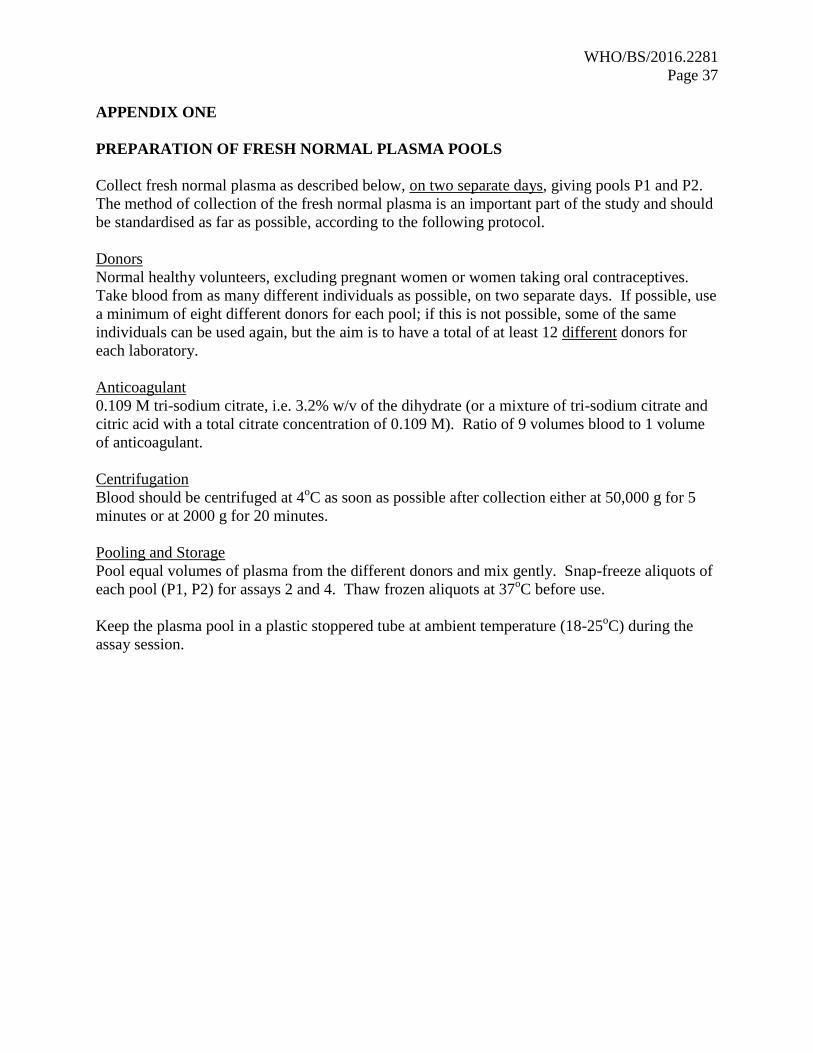
APPENDIX ONE
PREPARATION OF FRESH NORMAL PLASMA POOLS
Collect fresh normal plasma as described below, on two separate days, giving pools P1 and P2.
The method of collection of the fresh normal plasma is an important part of the study and should
be standardised as far as possible, according to the following protocol.
Donors
Normal healthy volunteers, excluding pregnant women or women taking oral contraceptives.
Take blood from as many different individuals as possible, on two separate days. If possible, use
a minimum of eight different donors for each pool; if this is not possible, some of the same
individuals can be used again, but the aim is to have a total of at least 12 different donors for
each laboratory.
Anticoagulant
0.109 M tri-sodium citrate, i.e. 3.2% w/v of the dihydrate (or a mixture of tri-sodium citrate and
citric acid with a total citrate concentration of 0.109 M). Ratio of 9 volumes blood to 1 volume
of anticoagulant.
Centrifugation
Blood should be centrifuged at 4oC as soon as possible after collection either at 50,000 g for 5
minutes or at 2000 g for 20 minutes.
Pooling and Storage
Pool equal volumes of plasma from the different donors and mix gently. Snap-freeze aliquots of
each pool (P1, P2) for assays 2 and 4. Thaw frozen aliquots at 37oC before use.
Keep the plasma pool in a plastic stoppered tube at ambient temperature (18-25oC) during the
assay session.
WHO/BS/2016.2281
Page 38
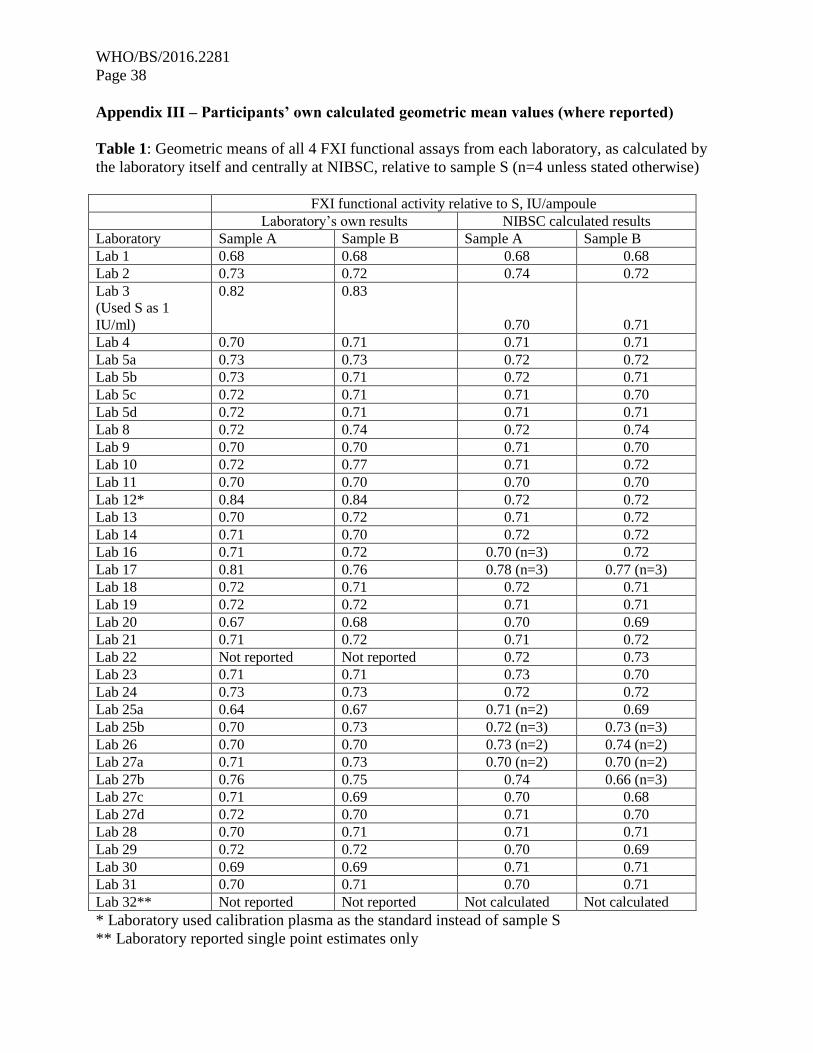
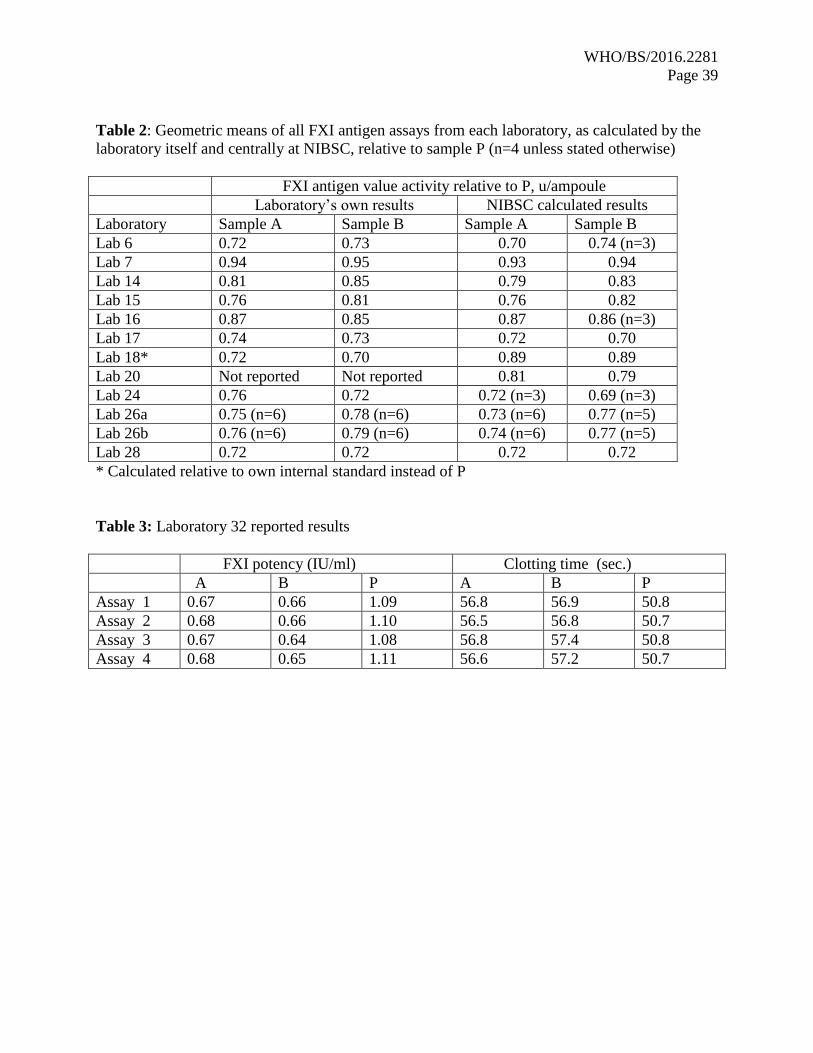
Appendix III – Participants’ own calculated geometric mean values (where reported)
Table 1: Geometric means of all 4 FXI functional assays from each laboratory, as calculated by
the laboratory itself and centrally at NIBSC, relative to sample S (n=4 unless stated otherwise)
FXI functional activity relative to S, IU/ampoule
Laboratory’s own results NIBSC calculated results
Laboratory Sample A Sample B Sample A Sample B
Lab 1 0.68 0.68 0.68 0.68
Lab 2 0.73 0.72 0.74 0.72
Lab 3
(Used S as 1
IU/ml)
0.82 0.83
0.70 0.71
Lab 4 0.70 0.71 0.71 0.71
Lab 5a 0.73 0.73 0.72 0.72
Lab 5b 0.73 0.71 0.72 0.71
Lab 5c 0.72 0.71 0.71 0.70
Lab 5d 0.72 0.71 0.71 0.71
Lab 8 0.72 0.74 0.72 0.74
Lab 9 0.70 0.70 0.71 0.70
Lab 10 0.72 0.77 0.71 0.72
Lab 11 0.70 0.70 0.70 0.70
Lab 12* 0.84 0.84 0.72 0.72
Lab 13 0.70 0.72 0.71 0.72
Lab 14 0.71 0.70 0.72 0.72
Lab 16 0.71 0.72 0.70 (n=3) 0.72
Lab 17 0.81 0.76 0.78 (n=3) 0.77 (n=3)
Lab 18 0.72 0.71 0.72 0.71
Lab 19 0.72 0.72 0.71 0.71
Lab 20 0.67 0.68 0.70 0.69
Lab 21 0.71 0.72 0.71 0.72
Lab 22 Not reported Not reported 0.72 0.73
Lab 23 0.71 0.71 0.73 0.70
Lab 24 0.73 0.73 0.72 0.72
Lab 25a 0.64 0.67 0.71 (n=2) 0.69
Lab 25b 0.70 0.73 0.72 (n=3) 0.73 (n=3)
Lab 26 0.70 0.70 0.73 (n=2) 0.74 (n=2)
Lab 27a 0.71 0.73 0.70 (n=2) 0.70 (n=2)
Lab 27b 0.76 0.75 0.74 0.66 (n=3)
Lab 27c 0.71 0.69 0.70 0.68
Lab 27d 0.72 0.70 0.71 0.70
Lab 28 0.70 0.71 0.71 0.71
Lab 29 0.72 0.72 0.70 0.69
Lab 30 0.69 0.69 0.71 0.71
Lab 31 0.70 0.71 0.70 0.71
Lab 32** Not reported Not reported Not calculated Not calculated
* Laboratory used calibration plasma as the standard instead of sample S
** Laboratory reported single point estimates only
WHO/BS/2016.2281
Page 39
Table 2: Geometric means of all FXI antigen assays from each laboratory, as calculated by the
laboratory itself and centrally at NIBSC, relative to sample P (n=4 unless stated otherwise)
FXI antigen value activity relative to P, u/ampoule
Laboratory’s own results NIBSC calculated results
Laboratory Sample A Sample B Sample A Sample B
Lab 6 0.72 0.73 0.70 0.74 (n=3)
Lab 7 0.94 0.95 0.93 0.94
Lab 14 0.81 0.85 0.79 0.83
Lab 15 0.76 0.81 0.76 0.82
Lab 16 0.87 0.85 0.87 0.86 (n=3)
Lab 17 0.74 0.73 0.72 0.70
Lab 18* 0.72 0.70 0.89 0.89
Lab 20 Not reported Not reported 0.81 0.79
Lab 24 0.76 0.72 0.72 (n=3) 0.69 (n=3)
Lab 26a 0.75 (n=6) 0.78 (n=6) 0.73 (n=6) 0.77 (n=5)
Lab 26b 0.76 (n=6) 0.79 (n=6) 0.74 (n=6) 0.77 (n=5)
Lab 28 0.72 0.72 0.72 0.72
* Calculated relative to own internal standard instead of P
Table 3: Laboratory 32 reported results
FXI potency (IU/ml) Clotting time (sec.)
A B P A B P
Assay 1 0.67 0.66 1.09 56.8 56.9 50.8
Assay 2 0.68 0.66 1.10 56.5 56.8 50.7
Assay 3 0.67 0.64 1.08 56.8 57.4 50.8
Assay 4 0.68 0.65 1.11 56.6 57.2 50.7
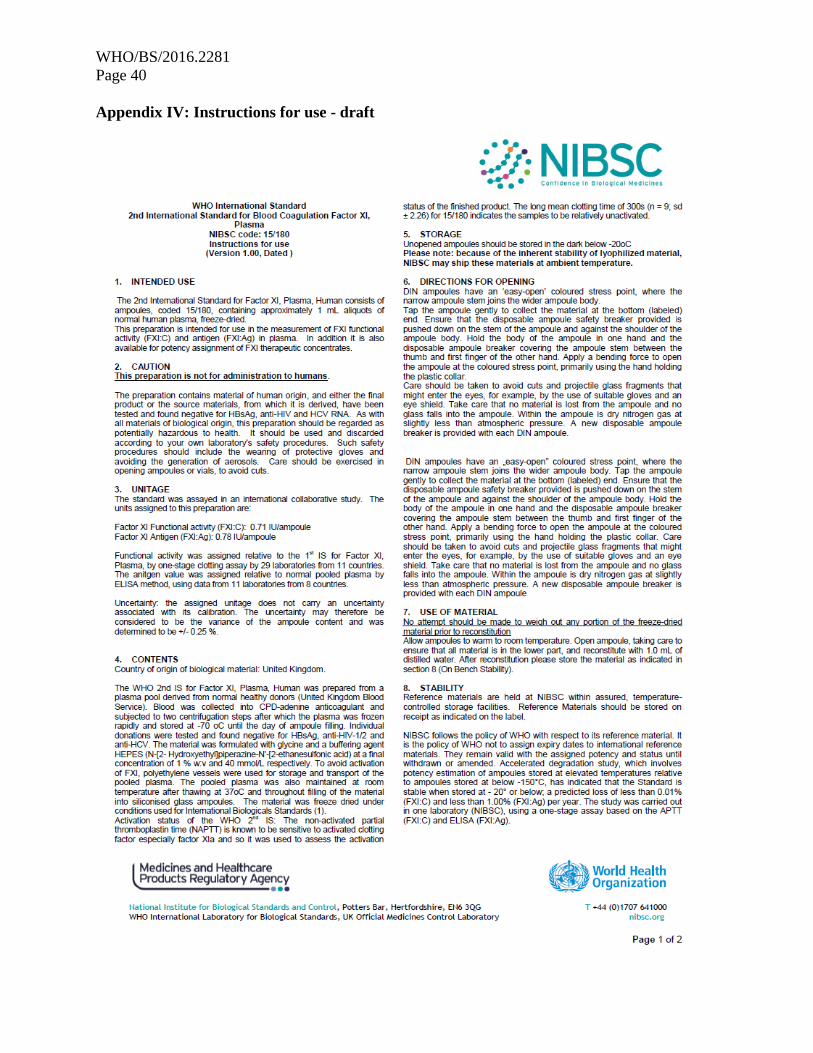
WHO/BS/2016.2281
Page 40
Appendix IV: Instructions for use - draft
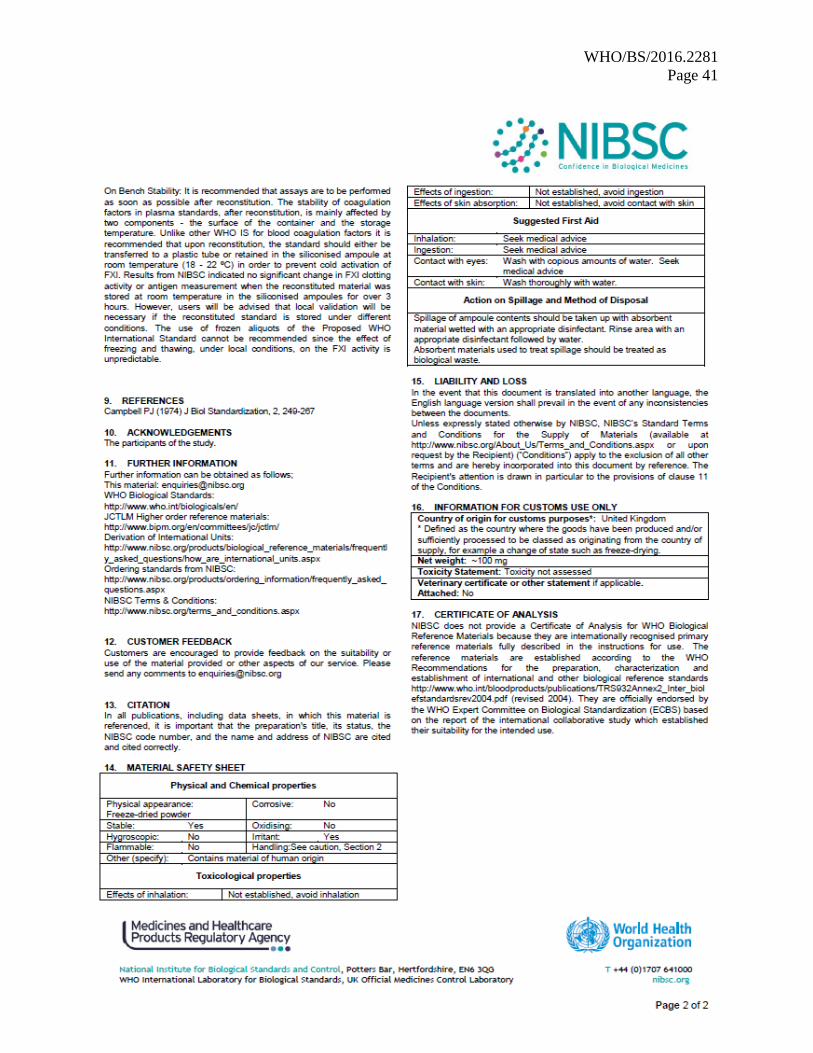
WHO/BS/2016.2281
Page 41