Embed Size (px)
Citation preview
Expert Elicitation of a Maximum
Duration using Risk Scenarios
Presented by:
Marc Greenberg
Cost Analysis Division (CAD)
National Aeronautics and Space Administration
2014 ICEAA Professional Development & Training Workshop
June 10-13, 2014 • Denver, Colorado
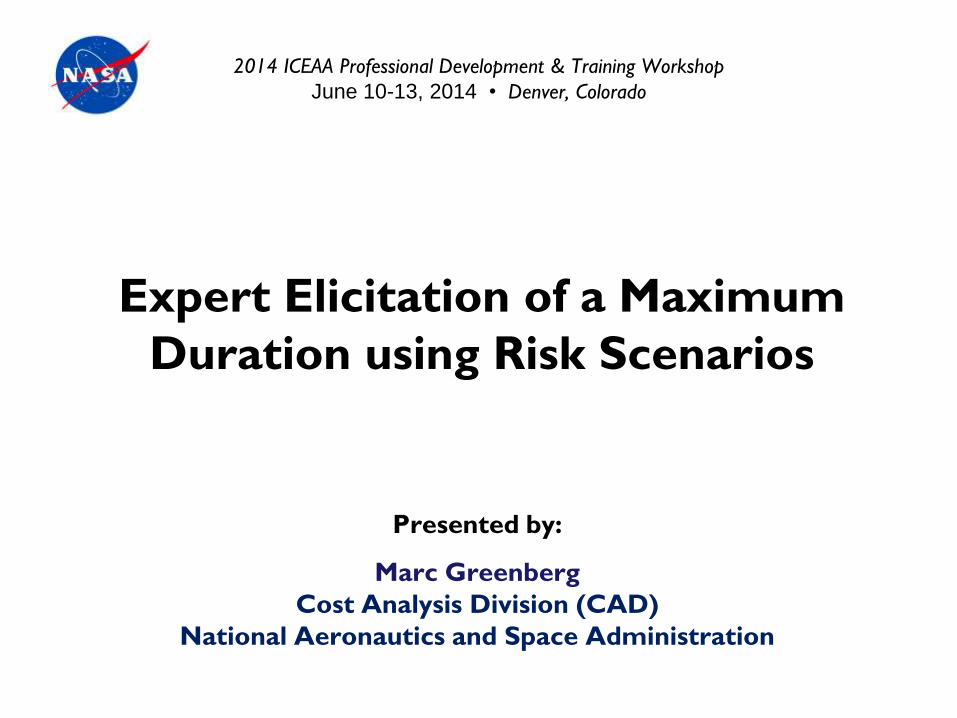
A Day in the Life of a Cost Analyst …
Slide 2
How Does A Cost Analyst REALLY Quantify the Unquantifiable?
A. Use common estimating methods: analogy, parametric & build-up
B. Use subject matter expert opinion
C. Incorporate cost risk & uncertainty analysis techniques
D. Yell out a number with conviction (like Dogbert the Quantifier)
E. Have the estimate “magically” equal what’s in your budget
F. Combination of A, B and/or C
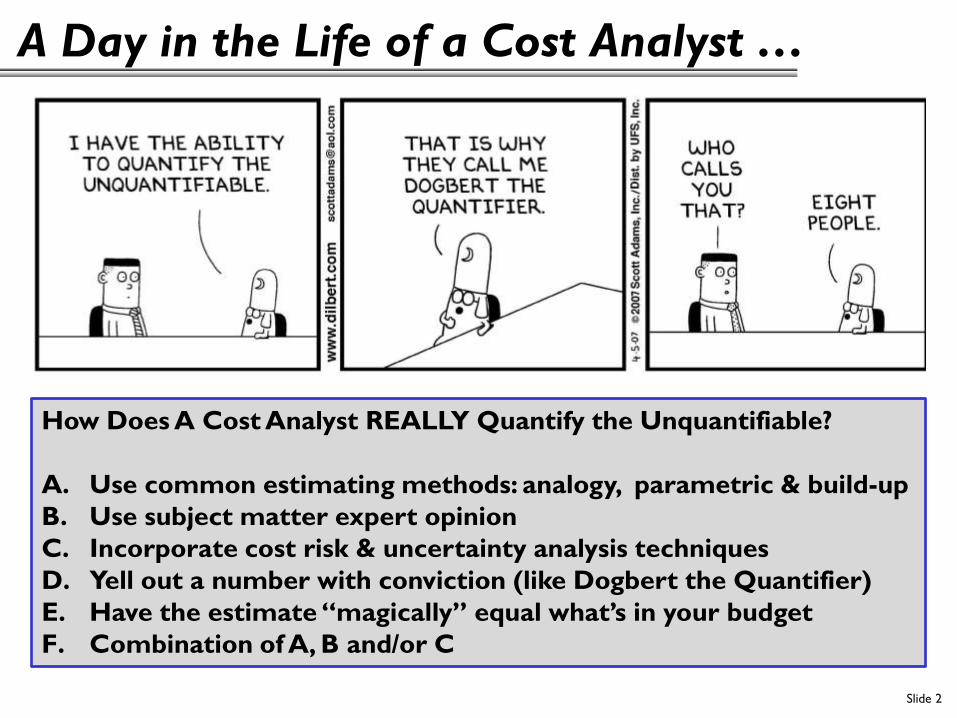
Estimating Minimum & Maximum Values
Slide 3
Perhaps the most common method of uncertainty
analysis used today is where the FIRST step is to
elicit Minimum & Maximum values directly from an
expert based upon her Most-Likely value.
The 2 scenario-based methods presented herein take
an alternative approach where the FIRST step is to
elicit “risk scenarios” that enable an expert to
describe risks & risk intensities that occur in typical,
optimistic and pessimistic scenarios.
By having such scenarios already described, we now
have (i) a justification for what risk factors contribute
to the uncertainty and (ii) a means to estimate to
what extent each risk factor “drives” the uncertainty
in order to estimate Minimum & Maximum values.
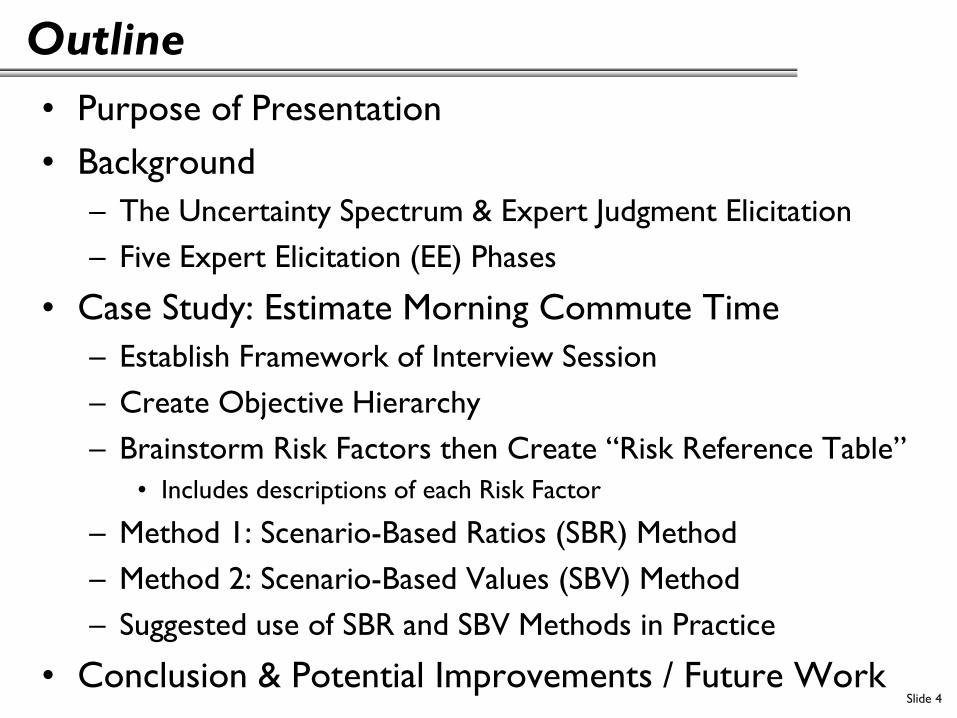
Outline
• Purpose of Presentation
• Background
– The Uncertainty Spectrum & Expert Judgment Elicitation
– Five Expert Elicitation (EE) Phases
• Case Study: Estimate Morning Commute Time
– Establish Framework of Interview Session
– Create Objective Hierarchy
– Brainstorm Risk Factors then Create “Risk Reference Table”
• Includes descriptions of each Risk Factor
– Method 1: Scenario-Based Ratios (SBR) Method
– Method 2: Scenario-Based Values (SBV) Method
– Suggested use of SBR and SBV Methods in Practice
• Conclusion & Potential Improvements / Future Work Slide 4
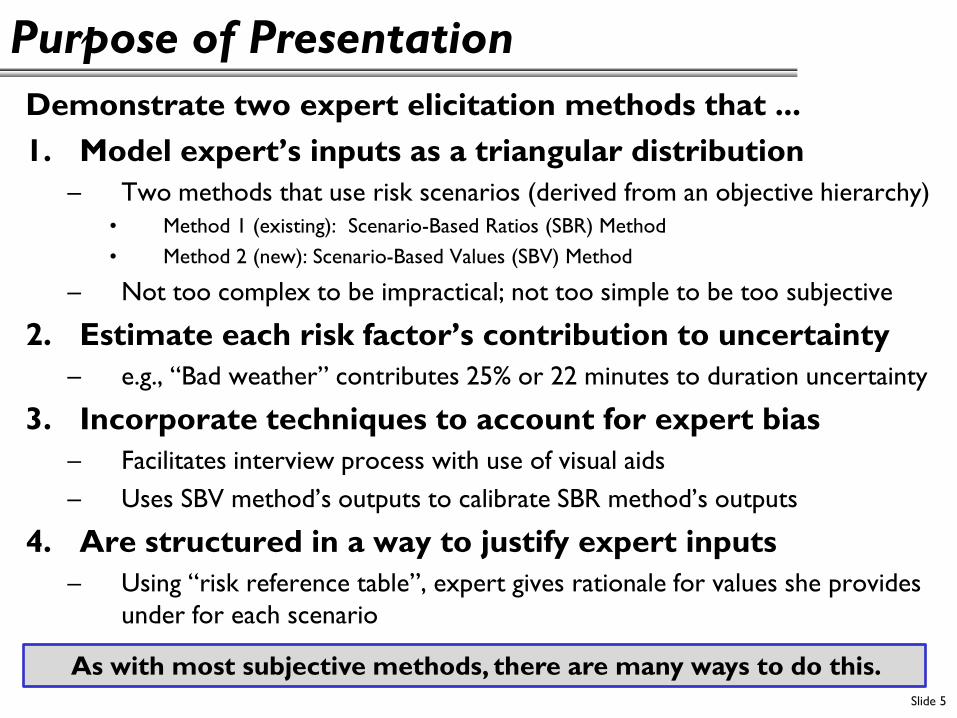
Purpose of Presentation
Demonstrate two expert elicitation methods that ...
1. Model expert’s inputs as a triangular distribution
– Two methods that use risk scenarios (derived from an objective hierarchy)
• Method 1 (existing): Scenario-Based Ratios (SBR) Method
• Method 2 (new): Scenario-Based Values (SBV) Method
– Not too complex to be impractical; not too simple to be too subjective
2. Estimate each risk factor’s contribution to uncertainty
– e.g., “Bad weather” contributes 25% or 22 minutes to duration uncertainty
3. Incorporate techniques to account for expert bias
– Facilitates interview process with use of visual aids
– Uses SBV method’s outputs to calibrate SBR method’s outputs
4. Are structured in a way to justify expert inputs
– Using “risk reference table”, expert gives rationale for values she provides
under for each scenario
Slide 5
As with most subjective methods, there are many ways to do this.
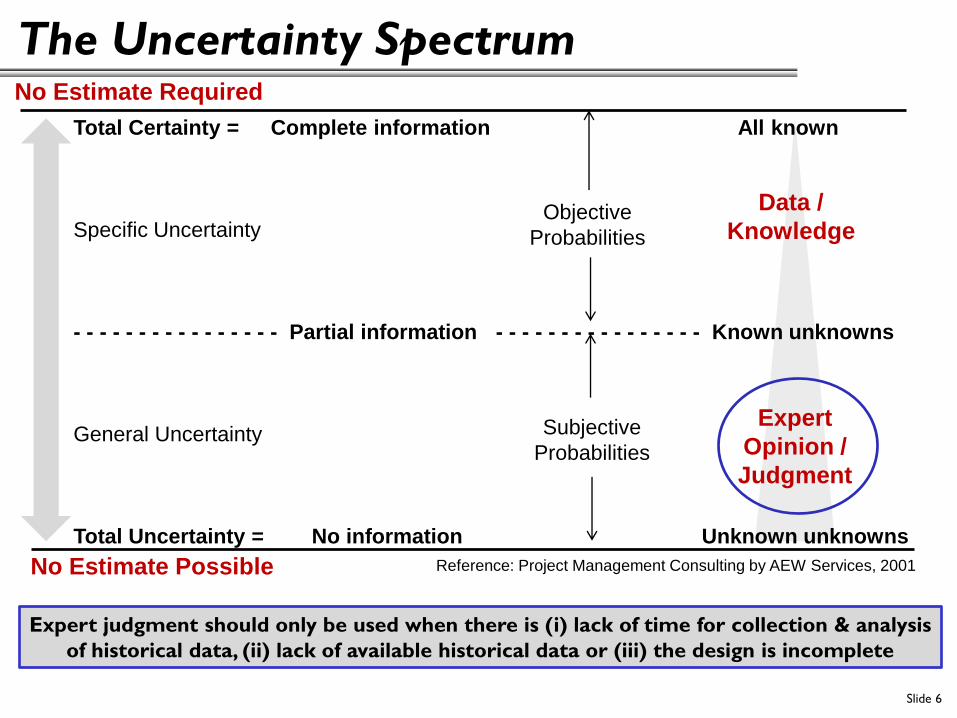
The Uncertainty Spectrum
Total Certainty = Complete information All known Specific Uncertainty - - - - - - - - - - - - - - - - Partial information - - - - - - - - - - - - - - - - Known unknowns General Uncertainty Total Uncertainty = No information Unknown unknowns
No Estimate Required
No Estimate Possible
Expert Opinion / Judgment
Objective Probabilities
Subjective Probabilities
Data / Knowledge
Slide 6
Expert judgment should only be used when there is (i) lack of time for collection & analysis
of historical data, (ii) lack of available historical data or (iii) the design is incomplete
Reference: Project Management Consulting by AEW Services, 2001
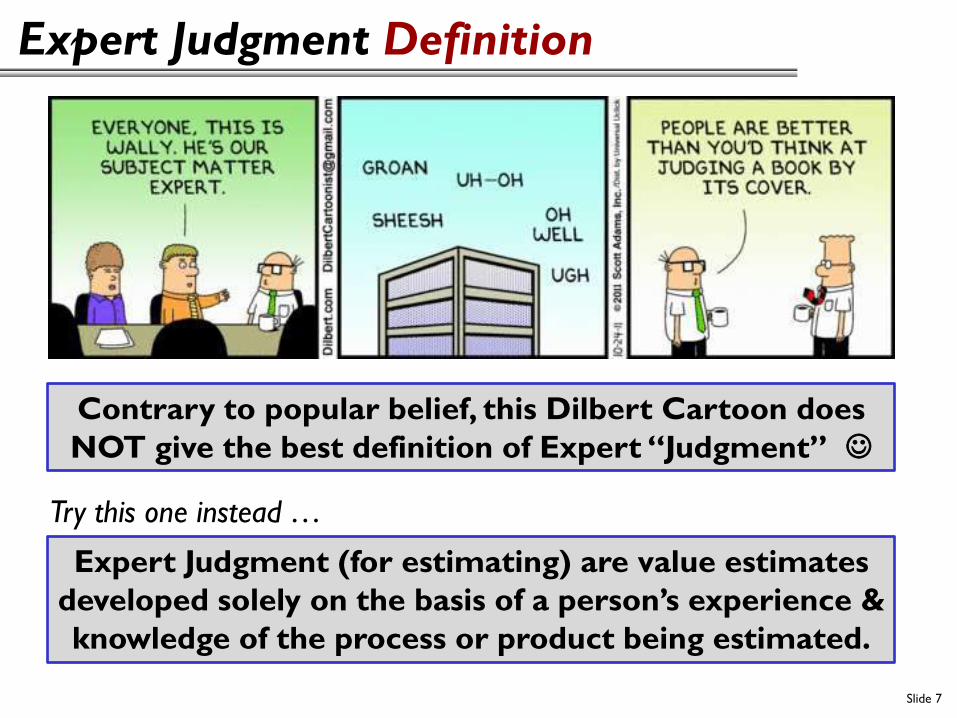
Expert Judgment Definition
Slide 7
Expert Judgment (for estimating) are value estimates
developed solely on the basis of a person’s experience &
knowledge of the process or product being estimated.
Contrary to popular belief, this Dilbert Cartoon does
NOT give the best definition of Expert “Judgment”
Try this one instead …
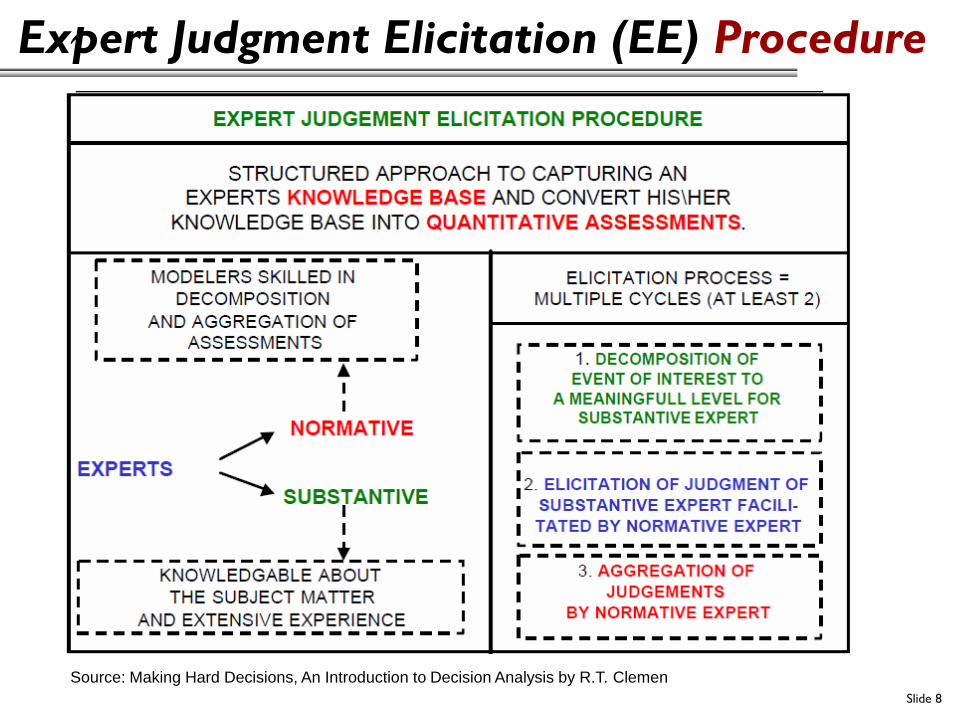
Expert Judgment Elicitation (EE) Procedure
Source: Making Hard Decisions, An Introduction to Decision Analysis by R.T. Clemen Slide 8
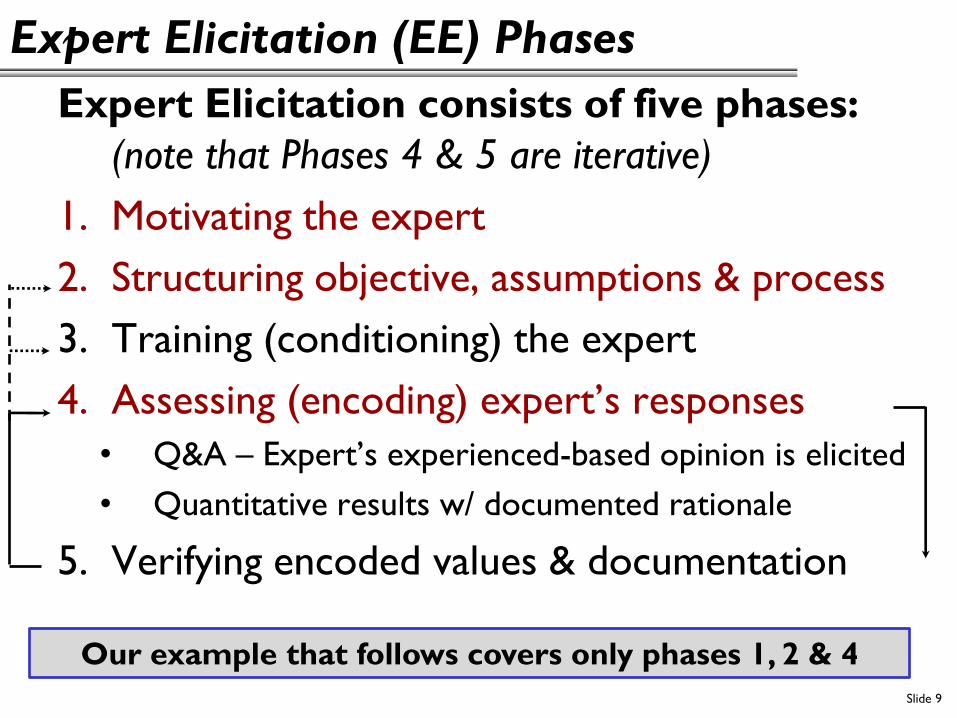
Expert Elicitation (EE) Phases
Expert Elicitation consists of five phases:
(note that Phases 4 & 5 are iterative)
1. Motivating the expert
2. Structuring objective, assumptions & process
3. Training (conditioning) the expert
4. Assessing (encoding) expert’s responses
• Q&A – Expert’s experienced-based opinion is elicited
• Quantitative results w/ documented rationale
5. Verifying encoded values & documentation
Our example that follows covers only phases 1, 2 & 4
Slide 9
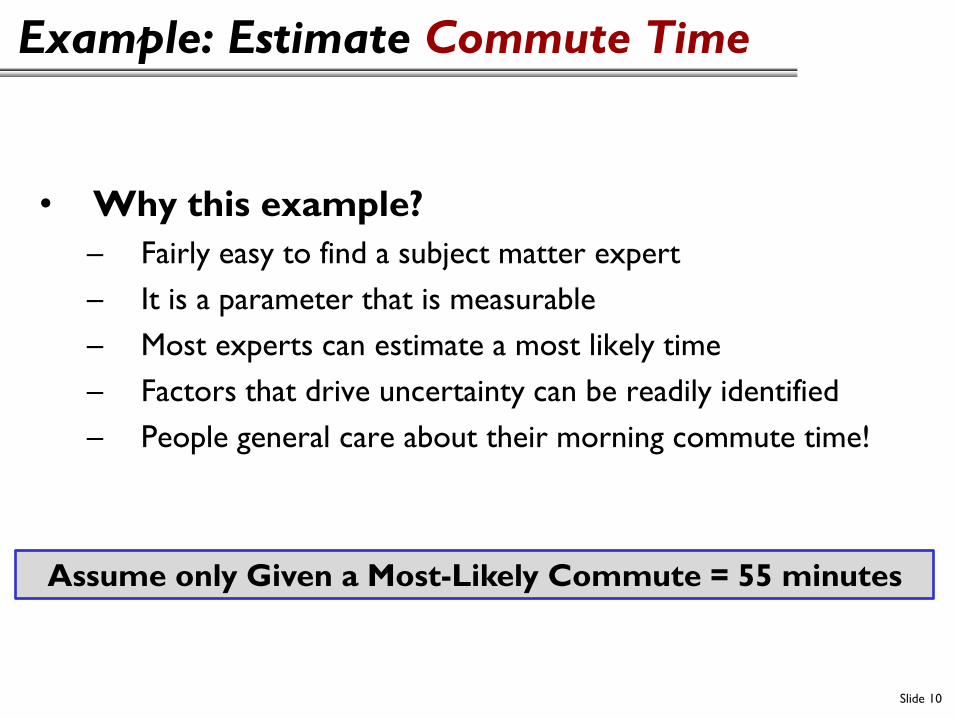
Example: Estimate Commute Time
Slide 10
• Why this example?
– Fairly easy to find a subject matter expert
– It is a parameter that is measurable
– Most experts can estimate a most likely time
– Factors that drive uncertainty can be readily identified
– People general care about their morning commute time!
Assume only Given a Most-Likely Commute = 55 minutes
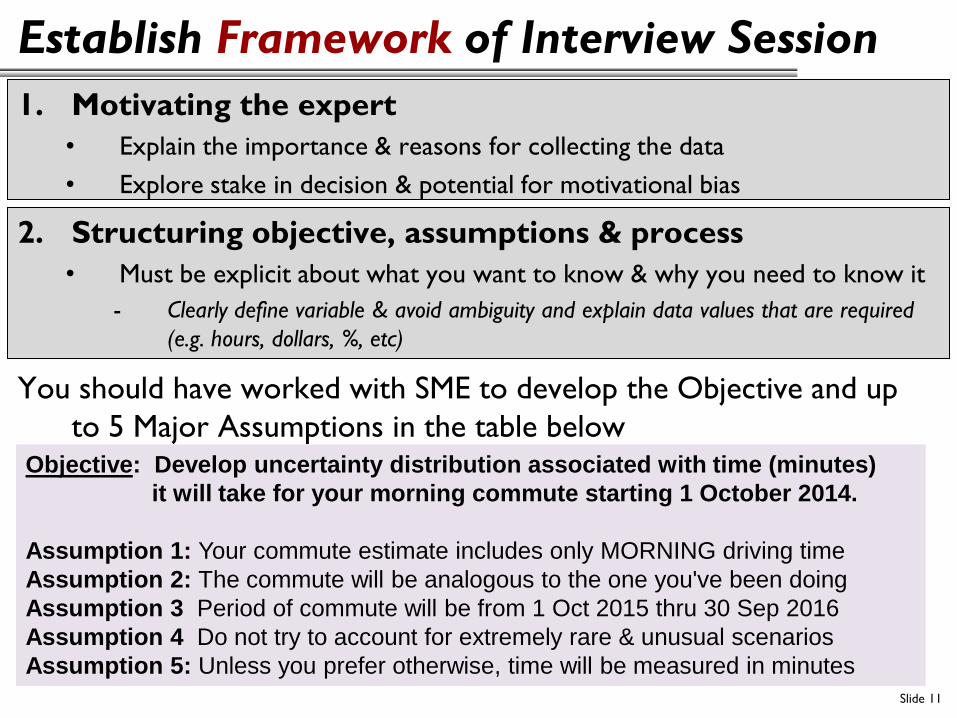
Establish Framework of Interview Session
Slide 11
2. Structuring objective, assumptions & process
• Must be explicit about what you want to know & why you need to know it
- Clearly define variable & avoid ambiguity and explain data values that are required
(e.g. hours, dollars, %, etc)
You should have worked with SME to develop the Objective and up
to 5 Major Assumptions in the table below Objective: Develop uncertainty distribution associated with time (minutes) it will take for your morning commute starting 1 October 2014. Assumption 1: Your commute estimate includes only MORNING driving time Assumption 2: The commute will be analogous to the one you've been doing Assumption 3 Period of commute will be from 1 Oct 2015 thru 30 Sep 2016 Assumption 4 Do not try to account for extremely rare & unusual scenarios Assumption 5: Unless you prefer otherwise, time will be measured in minutes
1. Motivating the expert
• Explain the importance & reasons for collecting the data
• Explore stake in decision & potential for motivational bias
Create Objective Hierarchy
Slide 12
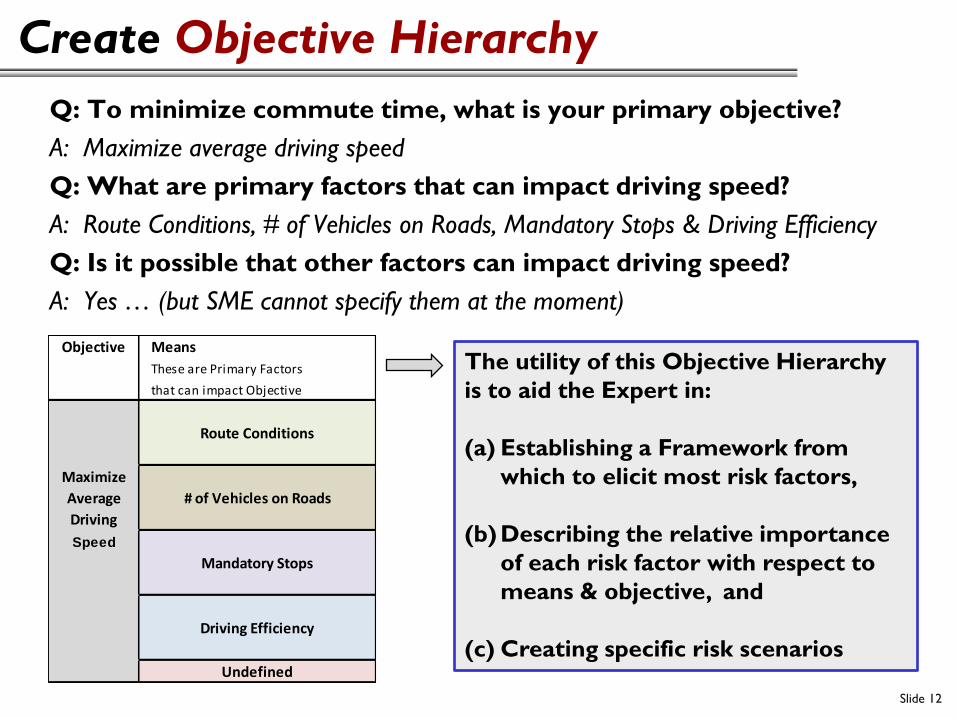
Q: To minimize commute time, what is your primary objective?
A: Maximize average driving speed
Q: What are primary factors that can impact driving speed?
A: Route Conditions, # of Vehicles on Roads, Mandatory Stops & Driving Efficiency
Q: Is it possible that other factors can impact driving speed?
A: Yes … (but SME cannot specify them at the moment)
The utility of this Objective Hierarchy
is to aid the Expert in:
(a) Establishing a Framework from
which to elicit most risk factors,
(b) Describing the relative importance
of each risk factor with respect to
means & objective, and
(c) Creating specific risk scenarios
Objective Means
These are Primary Factors
that can impact Objective
Route Conditions
Maximize
Average # of Vehicles on Roads
Driving
Speed
Mandatory Stops
Driving Efficiency
Undefined
Brainstorm Risk Factors
Slide 13
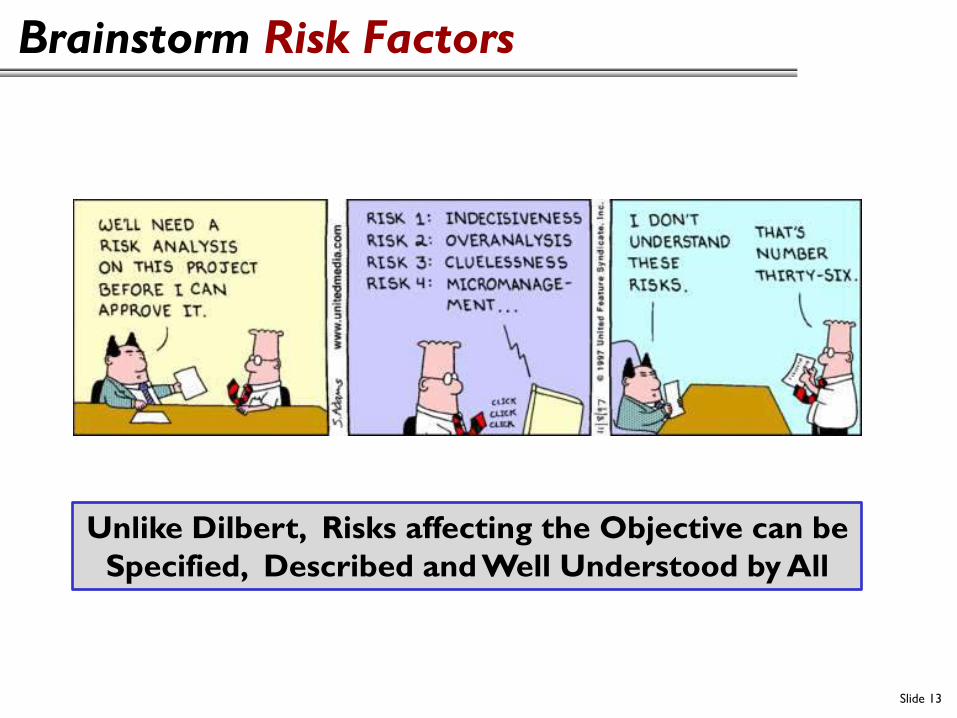
Unlike Dilbert, Risks affecting the Objective can be
Specified, Described and Well Understood by All
Brainstorm Risk Factors
Slide 14
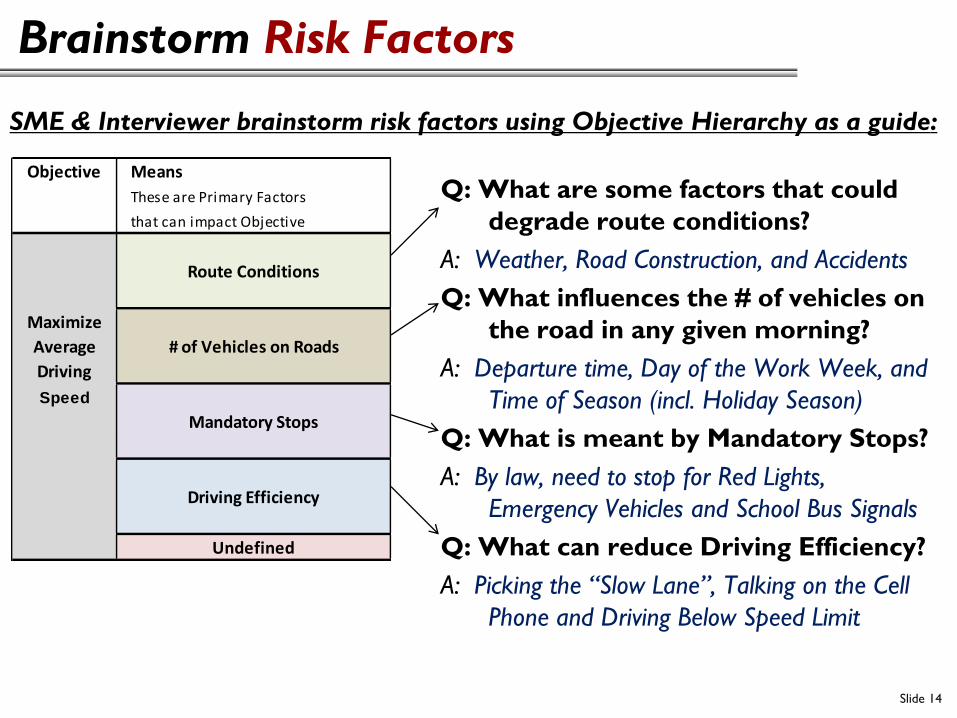
SME & Interviewer brainstorm risk factors using Objective Hierarchy as a guide:
Q: What are some factors that could
degrade route conditions?
A: Weather, Road Construction, and Accidents
Q: What influences the # of vehicles on
the road in any given morning?
A: Departure time, Day of the Work Week, and
Time of Season (incl. Holiday Season)
Q: What is meant by Mandatory Stops?
A: By law, need to stop for Red Lights,
Emergency Vehicles and School Bus Signals
Q: What can reduce Driving Efficiency?
A: Picking the “Slow Lane”, Talking on the Cell
Phone and Driving Below Speed Limit
Objective Means
These are Primary Factors
that can impact Objective
Route Conditions
Maximize
Average # of Vehicles on Roads
Driving
Speed
Mandatory Stops
Driving Efficiency
Undefined
Create “Risk Reference Table”
Slide 15
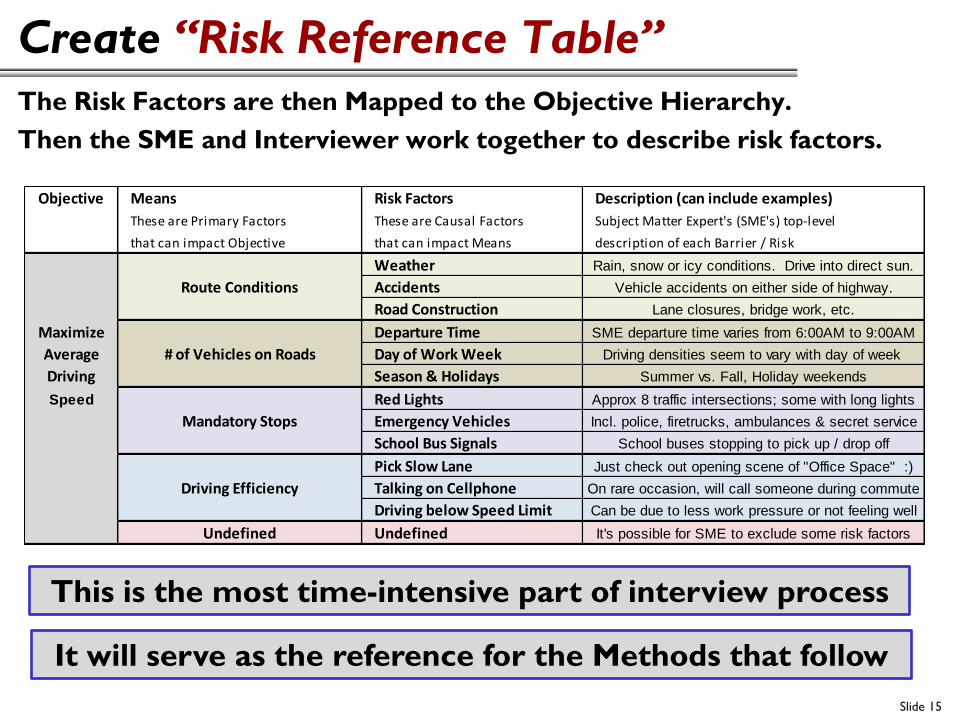
The Risk Factors are then Mapped to the Objective Hierarchy.
Then the SME and Interviewer work together to describe risk factors.
This is the most time-intensive part of interview process
It will serve as the reference for the Methods that follow
Objective Means Risk Factors Description (can include examples)
These are Primary Factors These are Causal Factors Subject Matter Expert's (SME's) top-level
that can impact Objective that can impact Means description of each Barrier / Risk
Weather Rain, snow or icy conditions. Drive into direct sun.
Route Conditions Accidents Vehicle accidents on either side of highway.
Road Construction Lane closures, bridge work, etc.
Maximize Departure Time SME departure time varies from 6:00AM to 9:00AM
Average # of Vehicles on Roads Day of Work Week Driving densities seem to vary with day of week
Driving Season & Holidays Summer vs. Fall, Holiday weekends
Speed Red Lights Approx 8 traffic intersections; some with long lights
Mandatory Stops Emergency Vehicles Incl. police, firetrucks, ambulances & secret service
School Bus Signals School buses stopping to pick up / drop off
Pick Slow Lane Just check out opening scene of "Office Space" :)
Driving Efficiency Talking on Cellphone On rare occasion, will call someone during commute
Driving below Speed Limit Can be due to less work pressure or not feeling well
Undefined Undefined It's possible for SME to exclude some risk factors
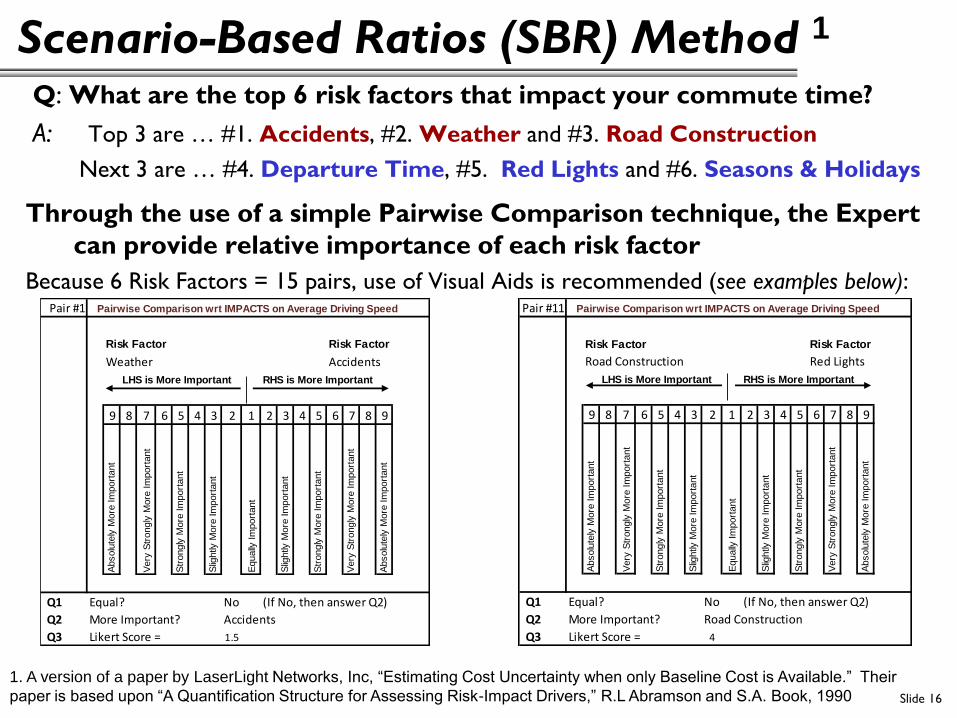
Scenario-Based Ratios (SBR) Method 1
Slide 16
1. A version of a paper by LaserLight Networks, Inc, “Estimating Cost Uncertainty when only Baseline Cost is Available.” Their
paper is based upon “A Quantification Structure for Assessing Risk-Impact Drivers,” R.L Abramson and S.A. Book, 1990
Q: What are the top 6 risk factors that impact your commute time?
A: Top 3 are … #1. Accidents, #2. Weather and #3. Road Construction
Next 3 are … #4. Departure Time, #5. Red Lights and #6. Seasons & Holidays
Through the use of a simple Pairwise Comparison technique, the Expert
can provide relative importance of each risk factor
Because 6 Risk Factors = 15 pairs, use of Visual Aids is recommended (see examples below): Pair #1 Pairwise Comparison wrt IMPACTS on Average Driving Speed
Risk Factor Risk Factor
Weather Accidents
LHS is More Important RHS is More Important
9 8 7 6 5 4 3 2 1 2 3 4 5 6 7 8 9
Abs
olut
ely
Mor
e Im
port
ant
Ver
y S
tron
gly
Mor
e Im
port
ant
Str
ongl
y M
ore
Impo
rtan
t
Slig
htly
Mor
e Im
port
ant
Equ
ally
Impo
rtan
t
Slig
htly
Mor
e Im
port
ant
Str
ongl
y M
ore
Impo
rtan
t
Ver
y S
tron
gly
Mor
e Im
port
ant
Abs
olut
ely
Mor
e Im
port
ant
Q1 Equal? No (If No, then answer Q2)
Q2 More Important? Accidents
Q3 Likert Score = 1.5
Pair #11 Pairwise Comparison wrt IMPACTS on Average Driving Speed
Risk Factor Risk Factor
Road Construction Red Lights
LHS is More Important RHS is More Important
9 8 7 6 5 4 3 2 1 2 3 4 5 6 7 8 9
Abs
olut
ely
Mor
e Im
port
ant
Ver
y S
tron
gly
Mor
e Im
port
ant
Str
ongl
y M
ore
Impo
rtan
t
Slig
htly
Mor
e Im
port
ant
Equ
ally
Impo
rtan
t
Slig
htly
Mor
e Im
port
ant
Str
ongl
y M
ore
Impo
rtan
t
Ver
y S
tron
gly
Mor
e Im
port
ant
Abs
olut
ely
Mor
e Im
port
ant
Q1 Equal? No (If No, then answer Q2)
Q2 More Important? Road Construction
Q3 Likert Score = 4
SBR Method: Pairwise Comparison Results
Slide 17
Raw P/W Weighting Weather AccidentsRoad
ConstructionDeparture
Time Red LightsSeason & Holidays
Weather 1 2/3 1 1/2 2 4 8
Accidents 1 1/2 1 2 2 1/2 6 9
Road Construction 2/3 1/2 1 2 4 7
Departure Time 1/2 2/5 1/2 1 2 5
Red Lights 1/4 1/6 1/4 1/2 1 2
Season & Holidays 1/8 1/9 1/7 1/5 1/2 1
Sum 4.0 2.8 5.4 8.2 17.5 32.0
Rank 2 1 3 4 5 6
Normalized Matrix Weather AccidentsRoad
ConstructionDeparture
Time Red LightsSeason & Holidays
Weather 0.247 0.234 0.278 0.244 0.229 0.250
Accidents 0.371 0.352 0.371 0.305 0.343 0.281
Road Construction 0.165 0.176 0.185 0.244 0.229 0.219
Departure Time 0.124 0.141 0.093 0.122 0.114 0.156
Red Lights 0.062 0.059 0.046 0.061 0.057 0.063
Season & Holidays 0.031 0.039 0.026 0.024 0.029 0.031
Sum 1.000 1.000 1.000 1.000 1.000 1.000
Pairwise comparison of risk factors results in the following raw values:
Weights
0.2471
0.3371
0.2029
0.1249
0.0579
0.0301
1.000
Accidents have
the biggest
impact (34%) on
commute time
uncertainty
If Expert is not comfortable with calculated Weights, need to revisit (a) selection
of her top 6 risk factors and/or (b) expert-provided Pairwise Comparisons
The raw values are normalized to a 100% scale, then summed to Weights per Risk Factor:
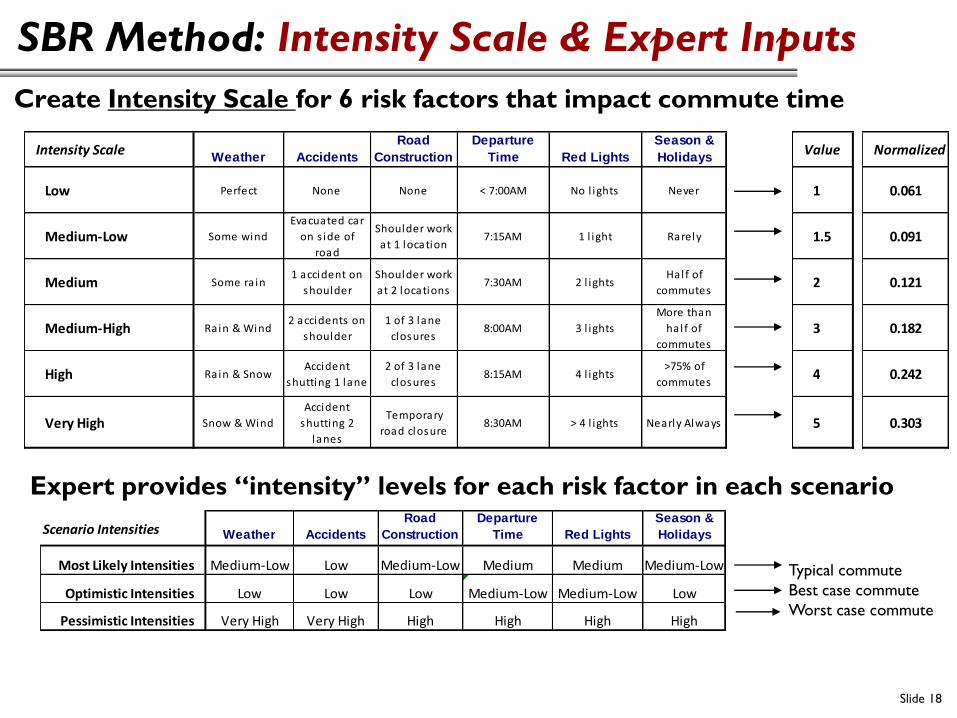
SBR Method: Intensity Scale & Expert Inputs
Slide 18
Create Intensity Scale for 6 risk factors that impact commute time
Intensity Scale Weather AccidentsRoad
ConstructionDeparture
Time Red LightsSeason & Holidays
Low Perfect None None < 7:00AM No l ights Never
Medium-Low Some wind
Evacuated car
on s ide of
road
Shoulder work
at 1 location7:15AM 1 l ight Rarely
Medium Some ra in1 accident on
shoulder
Shoulder work
at 2 locations7:30AM 2 l ights
Hal f of
commutes
Medium-High Rain & Wind2 accidents on
shoulder
1 of 3 lane
closures8:00AM 3 l ights
More than
hal f of
commutes
High Rain & SnowAccident
shutting 1 lane
2 of 3 lane
closures8:15AM 4 l ights
>75% of
commutes
Very High Snow & Wind
Accident
shutting 2
lanes
Temporary
road closure8:30AM > 4 l ights Nearly Always
Value
1
1.5
2
3
4
5
Expert provides “intensity” levels for each risk factor in each scenario
Normalized
0.061
0.091
0.121
0.182
0.242
0.303
Typical commute
Best case commute
Worst case commute
Scenario Intensities Weather AccidentsRoad
ConstructionDeparture
Time Red LightsSeason & Holidays
Most Likely Intensities Medium-Low Low Medium-Low Medium Medium Medium-Low
Optimistic Intensities Low Low Low Medium-Low Medium-Low Low
Pessimistic Intensities Very High Very High High High High High
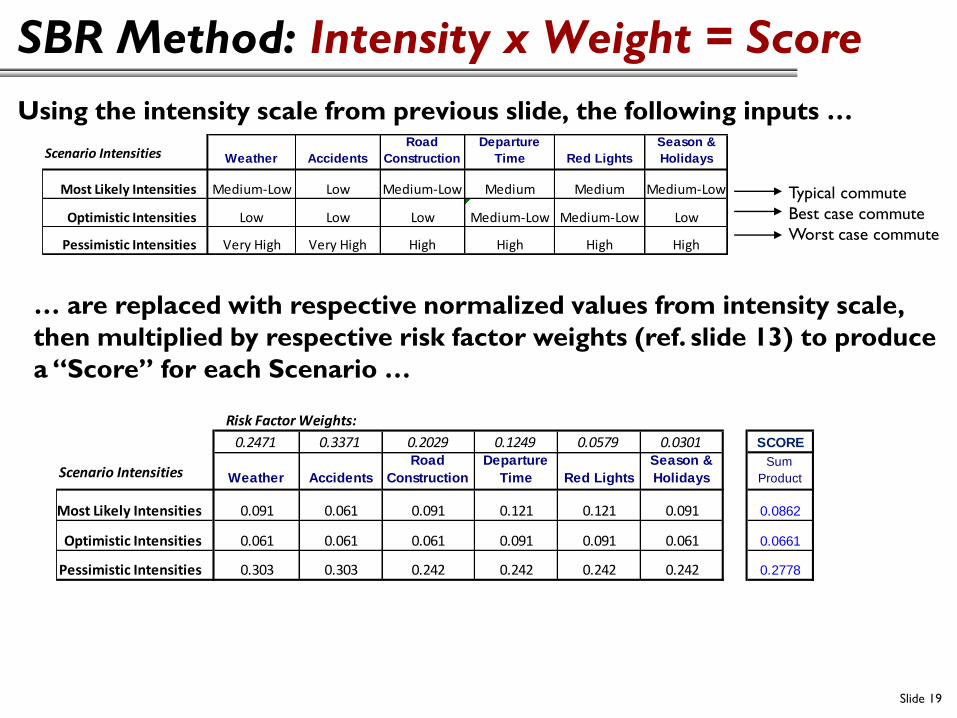
SBR Method: Intensity x Weight = Score
Slide 19
Using the intensity scale from previous slide, the following inputs …
Typical commute
Best case commute
Worst case commute
… are replaced with respective normalized values from intensity scale,
then multiplied by respective risk factor weights (ref. slide 13) to produce
a “Score” for each Scenario …
Scenario Intensities Weather AccidentsRoad
ConstructionDeparture
Time Red LightsSeason & Holidays
Most Likely Intensities Medium-Low Low Medium-Low Medium Medium Medium-Low
Optimistic Intensities Low Low Low Medium-Low Medium-Low Low
Pessimistic Intensities Very High Very High High High High High
Risk Factor Weights:
0.2471 0.3371 0.2029 0.1249 0.0579 0.0301 SCORE
Scenario Intensities Weather AccidentsRoad
ConstructionDeparture
Time Red LightsSeason & Holidays
Sum Product
Most Likely Intensities 0.091 0.061 0.091 0.121 0.121 0.091 0.0862
Optimistic Intensities 0.061 0.061 0.061 0.091 0.091 0.061 0.0661
Pessimistic Intensities 0.303 0.303 0.242 0.242 0.242 0.242 0.2778
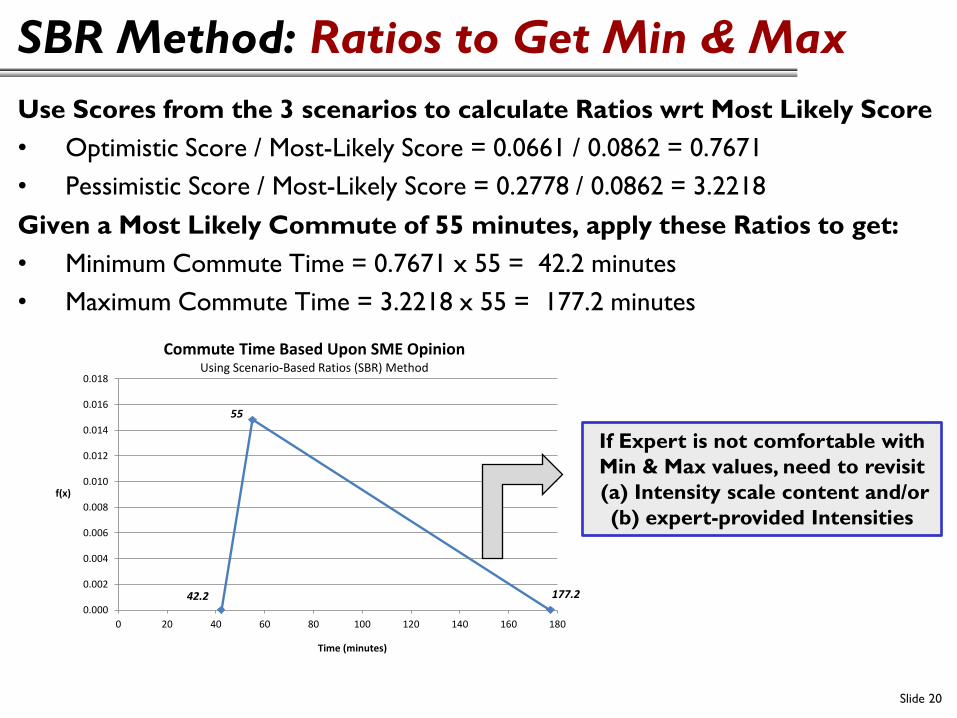
SBR Method: Ratios to Get Min & Max
Slide 20
Use Scores from the 3 scenarios to calculate Ratios wrt Most Likely Score
• Optimistic Score / Most-Likely Score = 0.0661 / 0.0862 = 0.7671
• Pessimistic Score / Most-Likely Score = 0.2778 / 0.0862 = 3.2218
42.2
55
177.2
0.000
0.002
0.004
0.006
0.008
0.010
0.012
0.014
0.016
0.018
0 20 40 60 80 100 120 140 160 180
f(x)
Time (minutes)
Commute Time Based Upon SME OpinionUsing Scenario-Based Ratios (SBR) Method
If Expert is not comfortable with
Min & Max values, need to revisit
(a) Intensity scale content and/or
(b) expert-provided Intensities
Given a Most Likely Commute of 55 minutes, apply these Ratios to get:
• Minimum Commute Time = 0.7671 x 55 = 42.2 minutes
• Maximum Commute Time = 3.2218 x 55 = 177.2 minutes
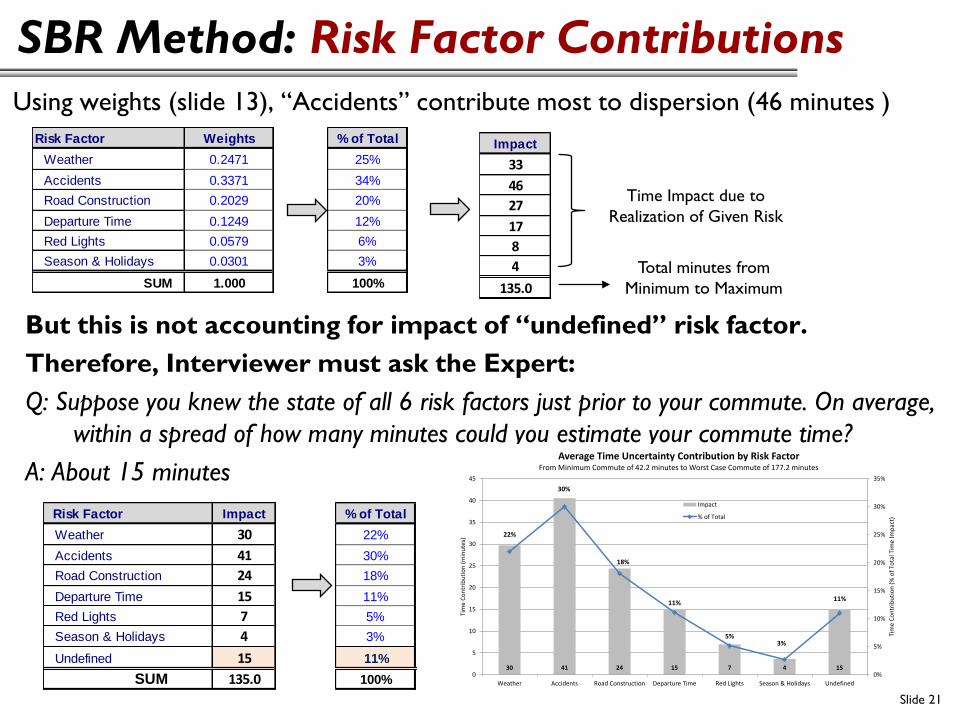
SBR Method: Risk Factor Contributions
Slide 21
Using weights (slide 13), “Accidents” contribute most to dispersion (46 minutes )
Risk Factor Weights
Weather 0.2471
Accidents 0.3371
Road Construction 0.2029
Departure Time 0.1249
Red Lights 0.0579
Season & Holidays 0.0301
SUM 1.000
But this is not accounting for impact of “undefined” risk factor.
Therefore, Interviewer must ask the Expert:
Q: Suppose you knew the state of all 6 risk factors just prior to your commute. On average,
within a spread of how many minutes could you estimate your commute time?
A: About 15 minutes
% of Total
25%
34%
20%
12%
6%
3%
100%
Impact
33
46
27
17
8
4
135.0
Total minutes from
Minimum to Maximum
Time Impact due to
Realization of Given Risk
Risk Factor Impact
Weather 30
Accidents 41
Road Construction 24
Departure Time 15
Red Lights 7
Season & Holidays 4
Undefined 15
SUM 135.0
% of Total
22%
30%
18%
11%
5%
3%
11%
100%30 41 24 15 7 4 15
22%
30%
18%
11%
5%3%
11%
0%
5%
10%
15%
20%
25%
30%
35%
0
5
10
15
20
25
30
35
40
45
Weather Accidents Road Construction Departure Time Red Lights Season & Holidays Undefined
Tim
e C
on
trib
uti
on
(%
of
Tota
l Tim
e Im
pac
t)
Tim
e C
on
trib
uti
on
(m
inu
tes)
Average Time Uncertainty Contribution by Risk FactorFrom Minimum Commute of 42.2 minutes to Worst Case Commute of 177.2 minutes
Impact
% of Total
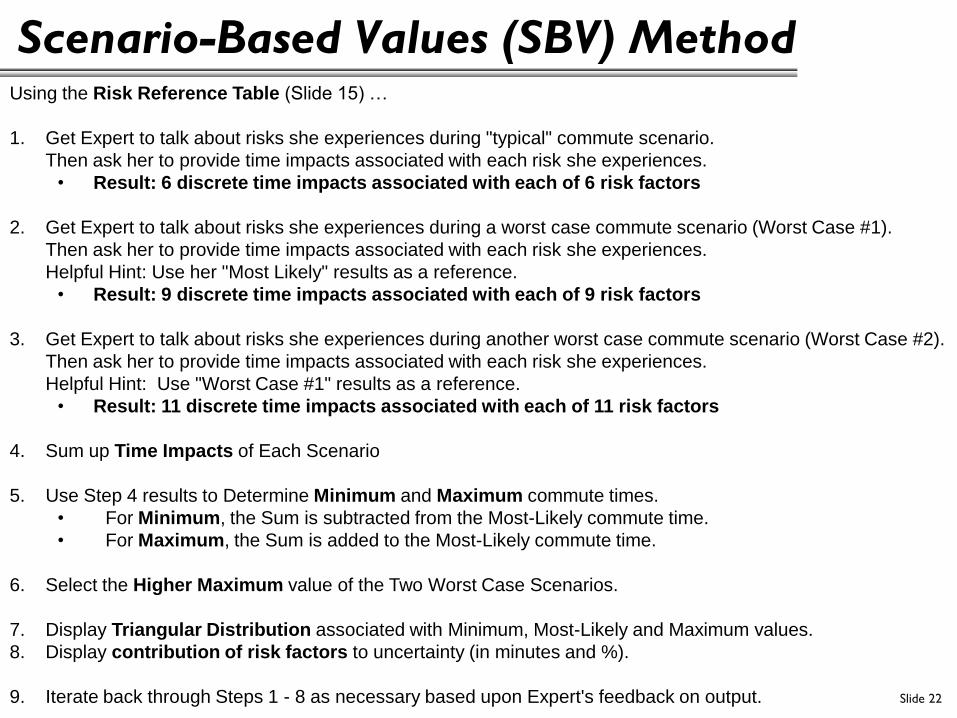
Scenario-Based Values (SBV) Method
Slide 22
Using the Risk Reference Table (Slide 15) … 1. Get Expert to talk about risks she experiences during "typical" commute scenario.
Then ask her to provide time impacts associated with each risk she experiences. • Result: 6 discrete time impacts associated with each of 6 risk factors
2. Get Expert to talk about risks she experiences during a worst case commute scenario (Worst Case #1).
Then ask her to provide time impacts associated with each risk she experiences. Helpful Hint: Use her "Most Likely" results as a reference.
• Result: 9 discrete time impacts associated with each of 9 risk factors
3. Get Expert to talk about risks she experiences during another worst case commute scenario (Worst Case #2). Then ask her to provide time impacts associated with each risk she experiences. Helpful Hint: Use "Worst Case #1" results as a reference.
• Result: 11 discrete time impacts associated with each of 11 risk factors 4. Sum up Time Impacts of Each Scenario
5. Use Step 4 results to Determine Minimum and Maximum commute times.
• For Minimum, the Sum is subtracted from the Most-Likely commute time. • For Maximum, the Sum is added to the Most-Likely commute time.
6. Select the Higher Maximum value of the Two Worst Case Scenarios. 7. Display Triangular Distribution associated with Minimum, Most-Likely and Maximum values. 8. Display contribution of risk factors to uncertainty (in minutes and %).
9. Iterate back through Steps 1 - 8 as necessary based upon Expert's feedback on output.
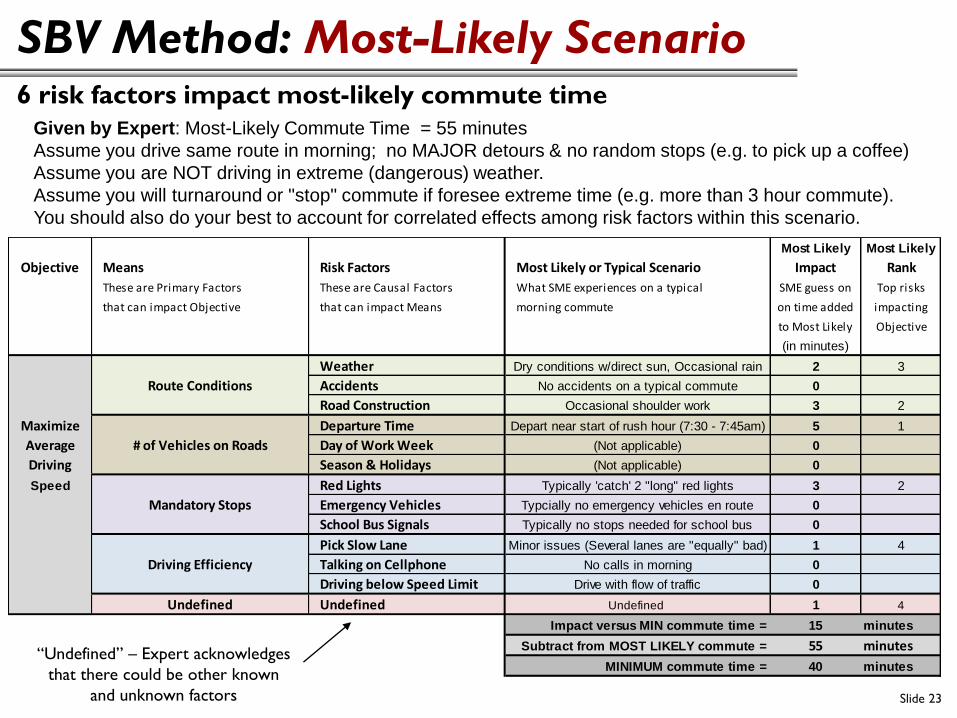
SBV Method: Most-Likely Scenario
Slide 23
6 risk factors impact most-likely commute time
Most Likely Most Likely
Objective Means Risk Factors Most Likely or Typical Scenario Impact Rank
These are Primary Factors These are Causal Factors What SME experiences on a typical SME guess on Top risks
that can impact Objective that can impact Means morning commute on time added impacting
to Most Likely Objective
(in minutes)
Weather Dry conditions w/direct sun, Occasional rain 2 3
Route Conditions Accidents No accidents on a typical commute 0
Road Construction Occasional shoulder work 3 2
Maximize Departure Time Depart near start of rush hour (7:30 - 7:45am) 5 1
Average # of Vehicles on Roads Day of Work Week (Not applicable) 0
Driving Season & Holidays (Not applicable) 0
Speed Red Lights Typically 'catch' 2 "long" red lights 3 2
Mandatory Stops Emergency Vehicles Typcially no emergency vehicles en route 0
School Bus Signals Typically no stops needed for school bus 0
Pick Slow Lane Minor issues (Several lanes are "equally" bad) 1 4
Driving Efficiency Talking on Cellphone No calls in morning 0
Driving below Speed Limit Drive with flow of traffic 0
Undefined Undefined Undefined 1 4
Impact versus MIN commute time = 15 minutes
Subtract from MOST LIKELY commute = 55 minutes
MINIMUM commute time = 40 minutes
Given by Expert: Most-Likely Commute Time = 55 minutes Assume you drive same route in morning; no MAJOR detours & no random stops (e.g. to pick up a coffee) Assume you are NOT driving in extreme (dangerous) weather. Assume you will turnaround or "stop" commute if foresee extreme time (e.g. more than 3 hour commute). You should also do your best to account for correlated effects among risk factors within this scenario.
“Undefined” – Expert acknowledges
that there could be other known
and unknown factors
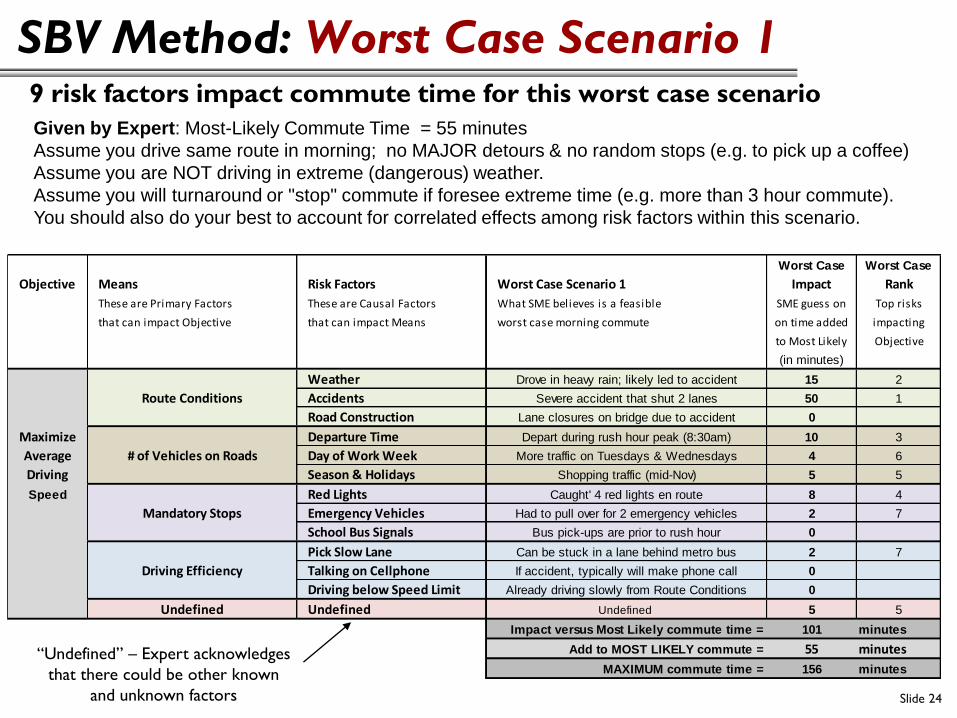
SBV Method: Worst Case Scenario 1
Slide 24
9 risk factors impact commute time for this worst case scenario
Worst Case Worst Case
Objective Means Risk Factors Worst Case Scenario 1 Impact Rank
These are Primary Factors These are Causal Factors What SME believes is a feasible SME guess on Top risks
that can impact Objective that can impact Means worst case morning commute on time added impacting
to Most Likely Objective
(in minutes)
Weather Drove in heavy rain; likely led to accident 15 2
Route Conditions Accidents Severe accident that shut 2 lanes 50 1
Road Construction Lane closures on bridge due to accident 0
Maximize Departure Time Depart during rush hour peak (8:30am) 10 3
Average # of Vehicles on Roads Day of Work Week More traffic on Tuesdays & Wednesdays 4 6
Driving Season & Holidays Shopping traffic (mid-Nov) 5 5
Speed Red Lights Caught' 4 red lights en route 8 4
Mandatory Stops Emergency Vehicles Had to pull over for 2 emergency vehicles 2 7
School Bus Signals Bus pick-ups are prior to rush hour 0
Pick Slow Lane Can be stuck in a lane behind metro bus 2 7
Driving Efficiency Talking on Cellphone If accident, typically will make phone call 0
Driving below Speed Limit Already driving slowly from Route Conditions 0
Undefined Undefined Undefined 5 5
Impact versus Most Likely commute time = 101 minutes
Add to MOST LIKELY commute = 55 minutes
MAXIMUM commute time = 156 minutes
Given by Expert: Most-Likely Commute Time = 55 minutes Assume you drive same route in morning; no MAJOR detours & no random stops (e.g. to pick up a coffee) Assume you are NOT driving in extreme (dangerous) weather. Assume you will turnaround or "stop" commute if foresee extreme time (e.g. more than 3 hour commute). You should also do your best to account for correlated effects among risk factors within this scenario.
“Undefined” – Expert acknowledges
that there could be other known
and unknown factors
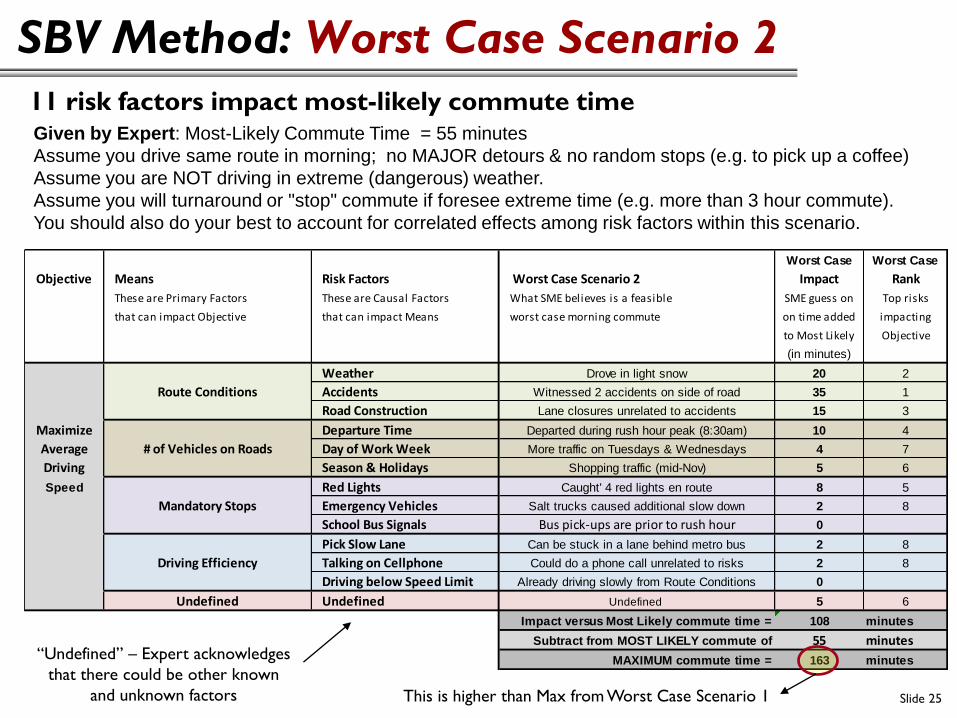
SBV Method: Worst Case Scenario 2
Slide 25
11 risk factors impact most-likely commute time
Worst Case Worst Case
Objective Means Risk Factors Worst Case Scenario 2 Impact Rank
These are Primary Factors These are Causal Factors What SME believes is a feasible SME guess on Top risks
that can impact Objective that can impact Means worst case morning commute on time added impacting
to Most Likely Objective
(in minutes)
Weather Drove in light snow 20 2
Route Conditions Accidents Witnessed 2 accidents on side of road 35 1
Road Construction Lane closures unrelated to accidents 15 3
Maximize Departure Time Departed during rush hour peak (8:30am) 10 4
Average # of Vehicles on Roads Day of Work Week More traffic on Tuesdays & Wednesdays 4 7
Driving Season & Holidays Shopping traffic (mid-Nov) 5 6
Speed Red Lights Caught' 4 red lights en route 8 5
Mandatory Stops Emergency Vehicles Salt trucks caused additional slow down 2 8
School Bus Signals Bus pick-ups are prior to rush hour 0
Pick Slow Lane Can be stuck in a lane behind metro bus 2 8
Driving Efficiency Talking on Cellphone Could do a phone call unrelated to risks 2 8
Driving below Speed Limit Already driving slowly from Route Conditions 0
Undefined Undefined Undefined 5 6
Impact versus Most Likely commute time = 108 minutes
Subtract from MOST LIKELY commute of 55 minutes
MAXIMUM commute time = 163 minutes
Given by Expert: Most-Likely Commute Time = 55 minutes Assume you drive same route in morning; no MAJOR detours & no random stops (e.g. to pick up a coffee) Assume you are NOT driving in extreme (dangerous) weather. Assume you will turnaround or "stop" commute if foresee extreme time (e.g. more than 3 hour commute). You should also do your best to account for correlated effects among risk factors within this scenario.
“Undefined” – Expert acknowledges
that there could be other known
and unknown factors This is higher than Max from Worst Case Scenario 1
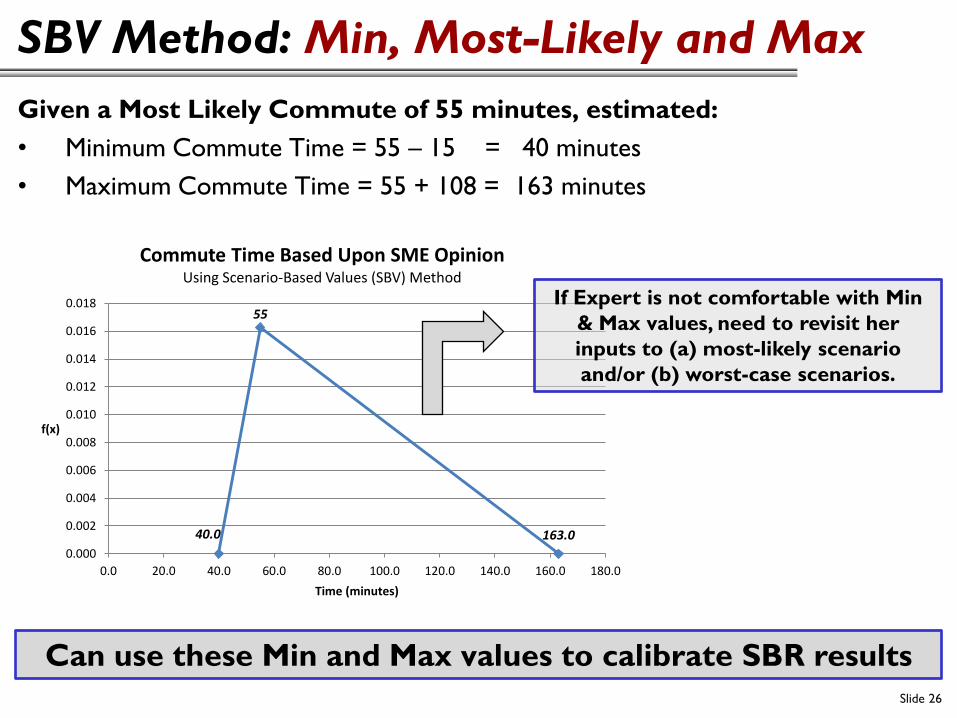
SBV Method: Min, Most-Likely and Max
Slide 26
Given a Most Likely Commute of 55 minutes, estimated:
• Minimum Commute Time = 55 – 15 = 40 minutes
• Maximum Commute Time = 55 + 108 = 163 minutes
Can use these Min and Max values to calibrate SBR results
40.0
55
163.0
0.000
0.002
0.004
0.006
0.008
0.010
0.012
0.014
0.016
0.018
0.0 20.0 40.0 60.0 80.0 100.0 120.0 140.0 160.0 180.0
f(x)
Time (minutes)
Commute Time Based Upon SME OpinionUsing Scenario-Based Values (SBV) Method
If Expert is not comfortable with Min
& Max values, need to revisit her
inputs to (a) most-likely scenario
and/or (b) worst-case scenarios.
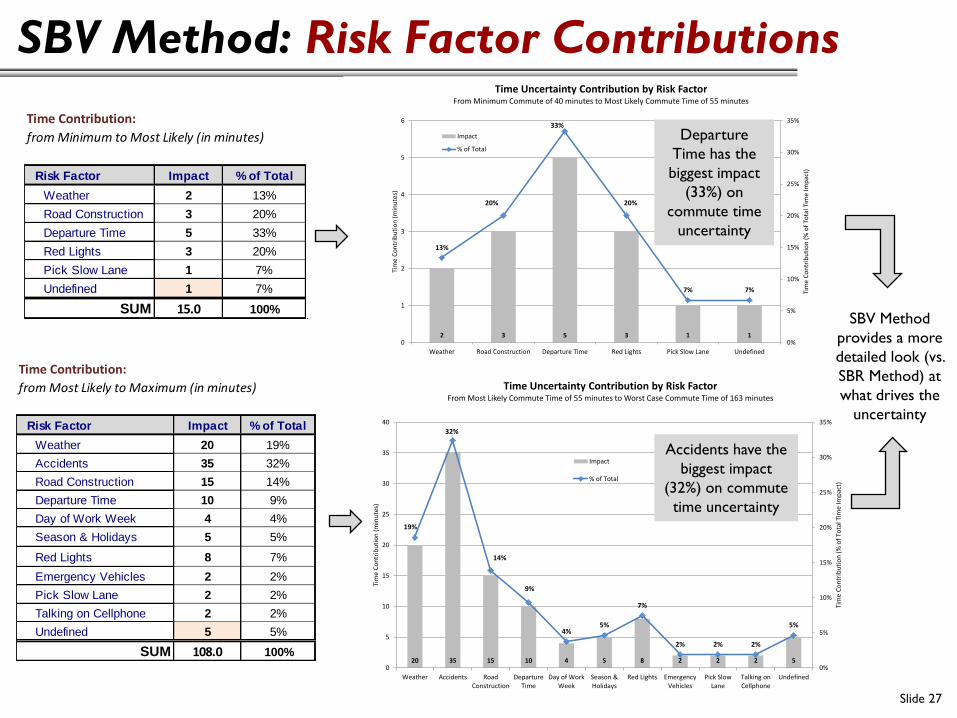
SBV Method: Risk Factor Contributions
Slide 27
Time Contribution:
from Minimum to Most Likely (in minutes)
Risk Factor Impact % of Total
Weather 2 13%
Road Construction 3 20%
Departure Time 5 33%
Red Lights 3 20%
Pick Slow Lane 1 7%
Undefined 1 7%
SUM 15.0 100%
Time Contribution:
from Most Likely to Maximum (in minutes)
Risk Factor Impact % of Total
Weather 20 19%
Accidents 35 32%
Road Construction 15 14%
Departure Time 10 9%
Day of Work Week 4 4%
Season & Holidays 5 5%
Red Lights 8 7%
Emergency Vehicles 2 2%
Pick Slow Lane 2 2%
Talking on Cellphone 2 2%
Undefined 5 5%
SUM 108.0 100%20 35 15 10 4 5 8 2 2 2 5
19%
32%
14%
9%
4%5%
7%
2% 2% 2%
5%
0%
5%
10%
15%
20%
25%
30%
35%
0
5
10
15
20
25
30
35
40
Weather Accidents RoadConstruction
DepartureTime
Day of WorkWeek
Season &Holidays
Red Lights EmergencyVehicles
Pick SlowLane
Talking onCellphone
Undefined
Tim
e C
on
trib
uti
on
(%
of
Tota
l Tim
e Im
pac
t)
Tim
e C
on
trib
uti
on
(m
inu
tes)
Time Uncertainty Contribution by Risk FactorFrom Most Likely Commute Time of 55 minutes to Worst Case Commute Time of 163 minutes
Impact
% of Total
Accidents have the
biggest impact
(32%) on commute
time uncertainty
2 3 5 3 1 1
13%
20%
33%
20%
7% 7%
0%
5%
10%
15%
20%
25%
30%
35%
0
1
2
3
4
5
6
Weather Road Construction Departure Time Red Lights Pick Slow Lane Undefined
Tim
e C
on
trib
uti
on
(%
of
Tota
l Tim
e Im
pac
t)
Tim
e C
on
trib
uti
on
(m
inu
tes)
Time Uncertainty Contribution by Risk FactorFrom Minimum Commute of 40 minutes to Most Likely Commute Time of 55 minutes
Impact
% of Total
Departure
Time has the
biggest impact
(33%) on
commute time
uncertainty
SBV Method
provides a more
detailed look (vs.
SBR Method) at
what drives the
uncertainty
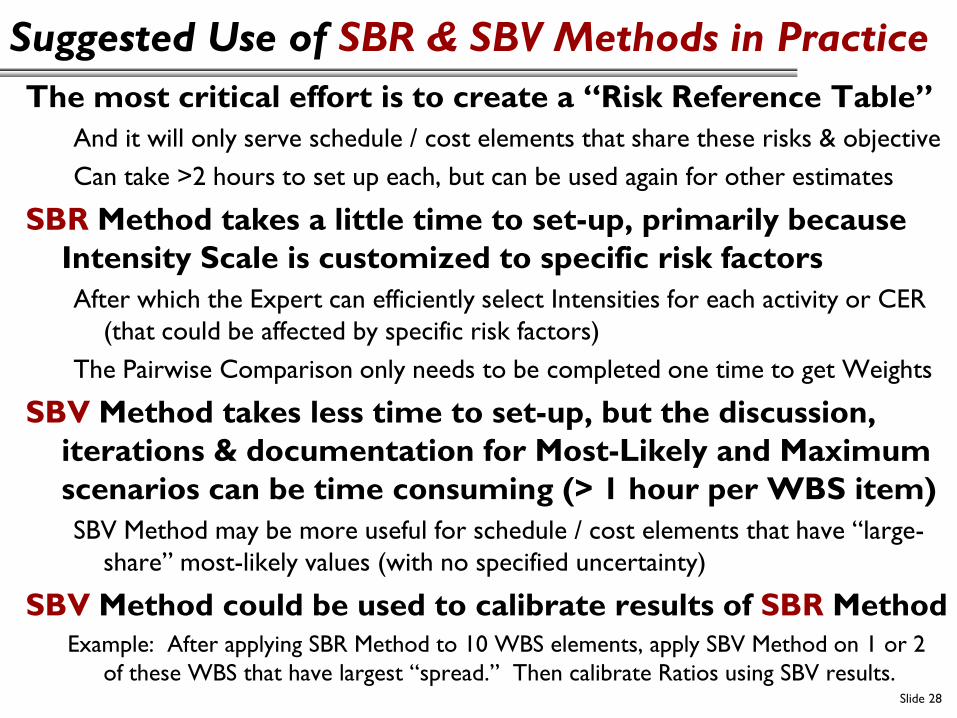
Suggested Use of SBR & SBV Methods in Practice
Slide 28
The most critical effort is to create a “Risk Reference Table”
And it will only serve schedule / cost elements that share these risks & objective
Can take >2 hours to set up each, but can be used again for other estimates
SBR Method takes a little time to set-up, primarily because
Intensity Scale is customized to specific risk factors
After which the Expert can efficiently select Intensities for each activity or CER
(that could be affected by specific risk factors)
The Pairwise Comparison only needs to be completed one time to get Weights
SBV Method takes less time to set-up, but the discussion,
iterations & documentation for Most-Likely and Maximum
scenarios can be time consuming (> 1 hour per WBS item)
SBV Method may be more useful for schedule / cost elements that have “large-
share” most-likely values (with no specified uncertainty)
SBV Method could be used to calibrate results of SBR Method Example: After applying SBR Method to 10 WBS elements, apply SBV Method on 1 or 2
of these WBS that have largest “spread.” Then calibrate Ratios using SBV results.
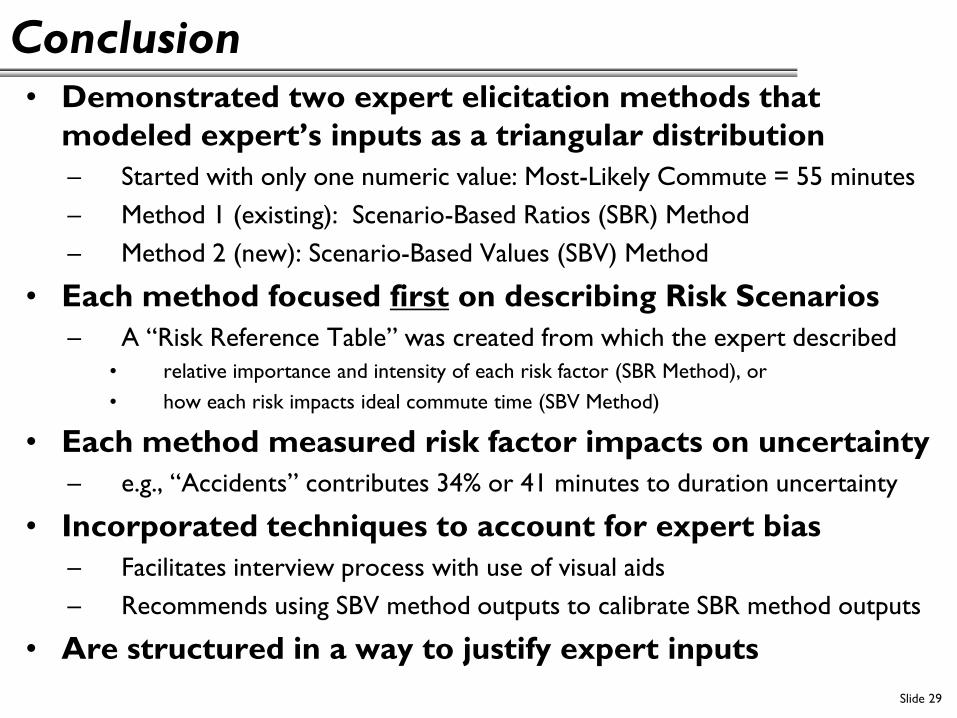
Conclusion
Slide 29
• Demonstrated two expert elicitation methods that
modeled expert’s inputs as a triangular distribution
– Started with only one numeric value: Most-Likely Commute = 55 minutes
– Method 1 (existing): Scenario-Based Ratios (SBR) Method
– Method 2 (new): Scenario-Based Values (SBV) Method
• Each method focused first on describing Risk Scenarios
– A “Risk Reference Table” was created from which the expert described
• relative importance and intensity of each risk factor (SBR Method), or
• how each risk impacts ideal commute time (SBV Method)
• Each method measured risk factor impacts on uncertainty
– e.g., “Accidents” contributes 34% or 41 minutes to duration uncertainty
• Incorporated techniques to account for expert bias
– Facilitates interview process with use of visual aids
– Recommends using SBV method outputs to calibrate SBR method outputs
• Are structured in a way to justify expert inputs
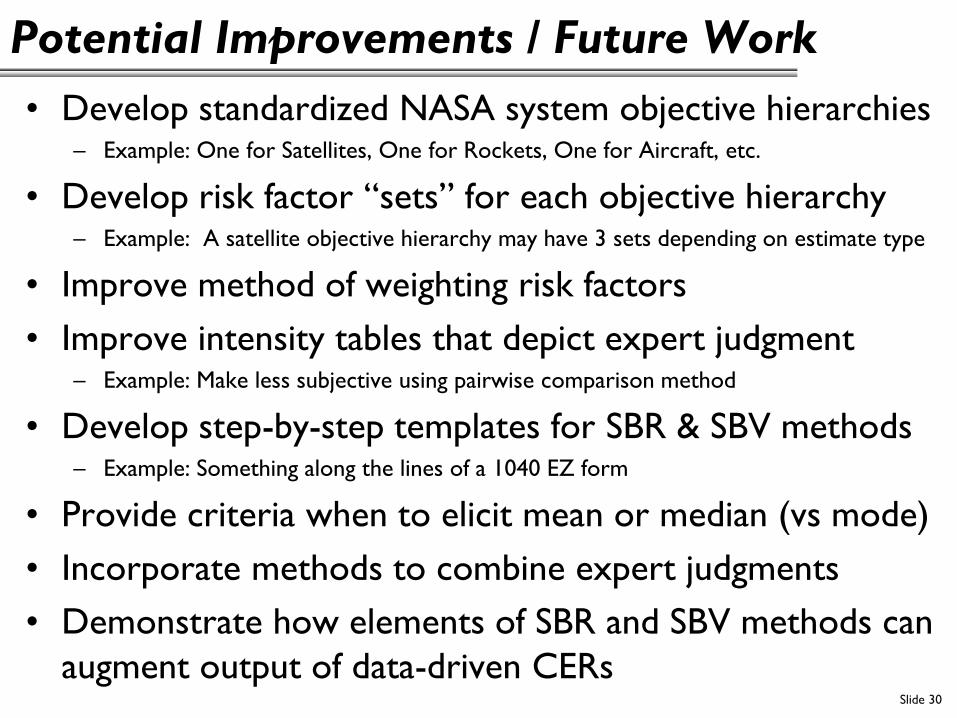
Potential Improvements / Future Work
• Develop standardized NASA system objective hierarchies – Example: One for Satellites, One for Rockets, One for Aircraft, etc.
• Develop risk factor “sets” for each objective hierarchy – Example: A satellite objective hierarchy may have 3 sets depending on estimate type
• Improve method of weighting risk factors
• Improve intensity tables that depict expert judgment – Example: Make less subjective using pairwise comparison method
• Develop step-by-step templates for SBR & SBV methods – Example: Something along the lines of a 1040 EZ form
• Provide criteria when to elicit mean or median (vs mode)
• Incorporate methods to combine expert judgments
• Demonstrate how elements of SBR and SBV methods can
augment output of data-driven CERs Slide 30