Embed Size (px)
Citation preview

Performance Economique du Togo 3/11/05 Page 0 de 40
EXPLAINING AFRICAN ECONOMIC GROWTH PERFORMANCE TOGO CASE STUDY by Tchabouré Aimé Gogué and Kodjo Evlo Université de Lomé Lome, Togo
August 2004

Economic Performance 3/11/05 Page 1 of 40
1. Introduction Macroeconomic performance has been quite poor in Togo over the past four decades. GDP per capita has nearly stagnated between 1960 and 1999. The economic performance has not been the same since 1960. Togo started at independence with a weak but stable economy. Performance was relatively good between 1960 and 1973 due principally to prudent and market-friendly economic policies and to a stable international environment. The situation has deteriorated considerably since the middle of the 1970s, when real GDP per capita started declining and the country started struggling with generalized macroeconomic problems. Since 1973 the growth performance has worsened constantly, with growth rate of GDP per capita declining from 6.2% in the 1960s to 0.46% in the 1970s, to -0.3% in the 1980s and to -0.96% in the 1990s. The instability of the growth rate was particularly acute in the case of some components of aggregate demand such as government consumption and investment. The ratio of public investment to GDP averaged 36.1% between 1975 and 1980, 18.5% in 1980-90 and 15.6% in the 1990s. In trying to compare economic performance of countries with the same characteristics, Collier (2003) classified Togo among coastal countries. In this group of country, Mauritius is the highest performing country even though Togo has more growth opportunities than Mauritius: Togo is not an insular country, the country is nearer the developed markets and Togo has natural resources (phosphate rocks), which is not the case of Mauritius. Therefore, Togo should have had better economic performance than Mauritius. Even, following Ndulu and O’Connors (2000), the country has done poorly compared to the average of African countries although it had clearly outperformed the latter in the 1960s. The objective of this paper is to explain why Togo does not perform well. Macro economic performances of a country can be explained by many factors such as history, geography, natural resources endowment, accumulation of physical and human capital, international economic environment, political economy and economic policies. In section 2, the period of analysis (1960-1999) shall be subdivided in four distinct sub-periods each of which shows the same features concerning the economic performance of the country. Then, the economic performance of the country shall be presented, using the growth accounting model of Collins and Bosworth (1999), the cross country regression suggested by Ndulu and O’Connor (2000) and Hoetffler’s (1999)SYS-GMM model. In the growth accounting model, the respective contribution of physical, human capital and Total Factor Productivity (TFP) to growth shall be analyzed. The role of economic policy and the base variables (demography, trade shocks and initial endowment) will be considered in presenting the cross country regression evidence. The study will show in section 3 how market institutions impact growth performance, whereas in section 4 the role of microeconomic agents, mostly government sector, in explaining economic will be stressed on. In section 5, political economy (interest groups) will be used to explain the poor economic performance of the country especially since 1973. Some concluding remark will be drawn in section 6. The study shows that the downturn that began in the 1970s was due to a few intertwined factors relating to the instability of the international
Economic Performance 3/11/05 Page 2 of 40
and mostly to the adoption of inappropriate macroeconomic policies by the government and political crisis the country is going through since 1990. Therefore, it is found that if better economic policies were implemented and if the country had avoided the political crisis the economy will not have been outperformed by the average African country of the O’Connor and Ndulu study’s sample. This paper will fill a gap in economic literature of the country as no study of this depth has ever been undertaken in the past. No study in the past has followed an approach as comprehensive as the one used in the current study. In particular, the current study will use an innovative framework that sheds light on the anti-growth syndromes that haunt most African economies. 2. Growth Experience in a Cross-Country Perspective 2.1 Historical background The period immediately preceding independence was characterized by stable international environment and prudent macroeconomic policies. The colonial power had put in place an administrative structure that built the bond the country to the metropolis while taking a rather low profile in economic activity. The share of the public sector in GDP was low. The economy was dominated by agriculture that accounted for more than half of GDP. The industrial sector was weak and dominated by the mining of phosphate rock. The service sector was fairly strong and growing but dominated by the informal traders. Economic policy was market-friendly and geared toward the interests of the colonial power. The latter had introduced commercial policies in the 1950s with a view to giving French companies control over the economy. Exports were little diversified and included mainly agricultural products and phosphate rock. Trade and budget imbalances were negligible. Inflation was kept under control as the colonial currency was pegged to the metropolitan French franc and monetary policy was managed by the French. Saving and investment were not strong. However, the potential for growth was good, given the untapped natural resources of the country and the enabling policy environment. It is with this background that the country got its independence on April, 27th 1960. 2.2 Distinct Periods of the Growth History Togo has been outperformed by the average sub-Saharan African counties between 1960 and 1999. However, the economic performance of the country has not been uniform over the forty-year period of the study. The high performance of the economy in the 1960s and early 1970s, when the country outperformed the average sub Saharan African country was in contrast with the bad performance since the second half of the 1970s. Based on key macroeconomic indicators, four periods can be distinguished in the country’s economic growth history: (a) 1960-1973; (b) 1974-1979; (c) 1980-1990 and (d) 1991-1997. Interestingly, average annual growth rate of GDP per capita has constantly fallen from one period to the following.
Economic Performance 3/11/05 Page 3 of 40
On Economic point of view, the post-independence period, 1960-1973, was the most stable of all and great performance period. It was characterized by a fairly rapid growth rate warranted by prudent and market-friendly policies macroeconomic policies with efforts to modernize the (economic) administration and to adjust the economy from colonial to post-independence structures and a stable international environment. GDP per capita grew by 4.5% per year on average. However, the growth rate varied substantially across the period. Part of such variability was due to (a) the young history of the country as a sovereign nation, and (b) the successive coups of 1963 and 1967 that followed almost immediately the difficult years of strife for independency. Regarding monetary policy, the most important development was the Olympio government’s refusal to join the West African Monetary Union (UMOA) created in 1962. Olympio opted for a relative monetary independence although he negotiated an individual arrangement with France. Through such arrangement, France agreed to provide the Togolese currency (to be created) with some support similar to the one given to the CFA franc. After the 1963 coup, Togo joined the UMOA in November 1963 and has benefited from the monetary stability this currency area gives its member countries. 1974-1979 was the period of various international shocks (oil shocks and commodity booms), bad macroeconomic policies and unsustainable growth. Even though the 1.9% per capita GDP growth rate during this sub-period was lower than the one in the precedent sub period, this growth rate was unsustainable as it was mainly drawn by demand with non improvement of production capacity of the country. In fact the high increase of export revenues due to term of trade improvement ended up with rapid public sector expansion and generalized government intervention. The oil shocks of 1973 and 1975 surprised the country and caused GDP growth rate to fall sharply. Second, the phosphate boom of 1974 and 1975, on the one hand, and the rise in coffee price in 1977 on the other hand, caused an opposite effect on the economy. Overall there is a considerable increase of public sector revenues1. The temporary increase in income due to external terms of trade improvement was thought as permanent. More important, the country failed to transform this temporary increase of income unto permanent income. In contrast, the policymaker entered into a series of policy mistakes. The increase in revenue was used to increase public investment and implement ill conceived projects and expand parastatal sector by creating publicly owned manufactures behind heavy import protection. Public investment rose to 47% of GDP in the late 1970s. Employment in the formal industrial (mainly public) sector increased from 8,288 in 1973 to 19,254 in 1979. Baniganti and Lawson (1994) found that the effective rate of protection for State owned enterprises was over 200%. In 1976, state-owned enterprises accounted for 68.4%, 47.7% and 100% of the value added of the mining, manufacturing and energy industries respectively. In 1979, 77% of firms in the modern sector were state-owned or state-controlled. There has been an unprecedented expansion of the public sector with massive recruitment in the civil service increase in payroll difficult to reduce in periods of public resource shortages. Government expenditure rose sharply, leading to large budget deficits (from 13.4% of GDP in 1973 to 39.6% of GDP in 1979). Because of the increase in revenue, the government was able to borrow in international financial markets. Therefore, the country also experienced a fast growing public external debt. The stock of external debt grew from 15.1% in 1970 to 53.9% 1 Phosphate rocks, coffee and cocoa were the main export crop of the country in that period.
Economic Performance 3/11/05 Page 4 of 40
of GDP in 1977 and 116.4% of GDP in 1978 whereas debt service increased from 58.8% in 1970 to 185.5% in 1977 and 372.5% in 1978. Resources from short term commercial loans were used to finance ill conceived industrial projects. The period 1980-90 was marked by economic reforms but under the control of one party system and an ethno-regional minority. The economic reforms started with an IMF-sponsored Financial Stabilization Program (FSP) in 1979 followed by IMF and World Bank-sponsored Structural Adjustment Programs (SAP) since 1982. Togo is one of the first Sub-Saharan countries to implement SAP. This result in budget deficit and external public debt reduction to respectively 3.8% and 74% of GDP by 1989. Budget deficit was reduced mostly through decrease in public investment and suspension in recruitment in civil service. However, average annual growth rate of GDP per capita was -0.3%. This bad performance in this sub-period is the consequence of the unsustainable growth and economic mismanagement in the second half of the 1970s. The contraction of the public sector as a result of the reforms and the debt burden were the principal causes of the GDP decline. By the end of the period, the lag effects of the mismanagement of the 1970s phased out and the reforms had led to a recovery in the mid-1980s resulting in a positive growth rate of GDP per capita in the second half of the 1980s. The main feature of the 1990s was the people’s fight for democracy. GDP per capita grew by an annual average of –0.9%, which was the worse of the four periods. As in most of the West African countries, the aspiration of the population to democracy increases. The first half of 1990s was marked by socio- political crisis. Such a fight led to confrontations between the population and the government. It ended with a substitution of political elite. This change was however short lived: 1991-1993 and was marked by, unstable economic environment, public authority dysfunction, and strikes and ended with a nine months general strike. The former regime resorts to violent means to suppress the public protests and to come back on power. Even though the power was gained back, the control of the country by this regime was not strong and the contest of the population still remained. This results, in the second half of the 1990s, in strong regional and anticipated redistribution, looting and wide-spread corruption. As he political elite in power is not sure to maintain power for long. In consequence, it uses is position to amass wealth as rapidly as possible. The economy is not managed with the objective of development. Consequently, the situation became a protracted political crisis with damaging effects on the economy. The refusal of the government to accept democratic rules caused the international community to impose economic sanctions on the country. The sanctions have compounded the difficulties and caused further decline in economic activity. Government consumption remained high although it had declined over the past two decades as a result of the structural adjustment programs. Private investment was weak and falling primarily because of the instability of the political environment, the weak level of domestic saving and the inability of the economy to attract foreign direct investment. Materials from Collins and Bosworth (1999) and O'Connell and Ndulu (2000) and Hoeffler’s (1999) will be used to explain the poor economic performance of Togo from 1960 to 1999.
Economic Performance 3/11/05 Page 5 of 40
2.3 Analysis of Togo’s Economic Growth Performance There is a fast growing body of literature that tries to explain the economic performance of developing countries (see, for example, Fischer, 1993; Krugman, 1994; World Bank, 1994; Young 1992, 1994). One branch of such literature, which uses growth accounting framework and the extended Solow model, emphasizes the role of physical human capital and capital accumulation. Other models stress the role of structural features and economic policy. 2.3.1 Growth Accounting According to Collins and Bosworth (1999) human and physical capital accumulation is the main determinant of economic growth. Their growth accounting model has been applied to a number of countries. But the result of their study was not applied in the case of Togo. Following O’Connell and Ndulu, the Collins and Bosworth coefficients are used to calculate the contribution of capital per worker and education per worker to growth2. Key variables have been defined as follows: (a) the variable capital stock has been constructed, following Cohen (1993), as the sum of initial capital stock and accumulation of net investment flows per period, and (b) secondary education has been used to represent the variable "education." The estimated equation is the following: bgno = bcro + 0.35 bcko + 0.65 bcho, where bgno is growth rate of real GDP per capita, bcko is growth rate of physical capital per worker, bcho is the growth rate of human capital per worker and bcro is TFP residual. Based on the coefficients above, the residuals have been computed for the various sub-periods as shown Table 1. Growth performance in Togo between 1960 and 1997 has been influenced by weak productivity, especially total factor productivity (TFP) since the 1970s. During the forty-year period, output per worker grew by an annual average of 1.71%. The contributions of physical capital per worker and education per worker were positive (0.85% and 1.09% respectively). However, TFP was negative—except in 1970-74 and 1985-89. The relatively good contribution of physical and human capital to growth in the 1960s and early 1970s was the result of appropriate macroeconomic policies and productive public investment in 1973-74. The contribution of both factors has constantly declined since the mid-1970s as a result of inadequate investment and education policies since the mid-1970s. Both types of capital were influenced in the same way by government policies, thus followed similar growth patterns. In the case of physical capital, considerable amounts of resources were spent on non-productive investment projects. The ambitious public investment program of the 1970s was not based on any carefully planned development strategy but was the result of increased revenue. Such a program has not helped the economy grow but, instead, has left the country with a large public external debt. Similarly, investment in human capital has not given satisfactory results. As explained above, the government pursued in the 1970s a policy that aimed at increasing enrollment in the education system with a view to increasing the stock of skilled work force. 2 Education has been used as a proxy of human capital.

Economic Performance 3/11/05 Page 6 of 40
The number of high school and university graduates increased sharply, but usually not in the fields most wanted by the labor market. A growing structural gap has resulted between the products of the education system and the needs of the labor market, causing a rapidly increasing unemployment of skilled labor. 2.3.2 Cross-Country Regression Evidence O'Connell and Ndulu (2000) and Hoeffler’s (1999) SYS-GMM model provide convenient frameworks to trace the effects of geography, policy, politics and international environment on economic growth. The results of the application of these models to the case of Togo are mixed. (a) Overview of the Estimation Results Based on the analysis of the contribution of initial income, investment, education and population on growth, O'Connell and Ndulu (2000) classify Togo among countries that fit reasonably well on average into the cross-country regression line. However, for the average of the period, the Hoeffler (1999) SYS-GMM results based on an augmented Solow model predict a growth rate of 5.31% whereas the actual growth rate was only 1.27%. The residual was small in the 1960s but became large in the rest of the sample period. The terms of trade shocks of 1973-74 accounted for a great part of the residual in 1970-74. On the other hand, the political crisis was responsible for the large prediction errors in the 1990s. The decrease in aggregate demand due to the implementation of the SAP in the early 1980s justifies the size of the residual in that sub-period. During the four decades, Togo was outperformed by the sample mean by 0.66%. This situation was the result of the combination of the effect of initial income (4.46) and investment (0.22), both of which were offset by the replacement investment term (-1.03) and initial education attainment (-0.26). The negative effect of population is linked to rapid demographic growth rate and high dependency rate. Overall, however, the residual is high, suggesting that the variables in the model fail to explain the dependant variable satisfactorily. Regression results reported in Table 6 suggest that the Togolese economy performed better than the sample mean in the 1960s and in the second half of the 1970s. The growth rate was 3.81 and 2.75 points above that of the sample mean in the two half-decades of the 1960s. The poor performance in the first half of the 1970s could be explained by the fact that the (negative) effect of the oil crisis outweighed the (positive) effect of terms of trade improvement in the phosphate sector. The better-than-average performance in 1975-79 was mainly the result of short-run Keynesian multiplier effect following the large increase in government spending in response to terms of trade improvements in 1973-74 and 1976-78. As we pointed out earlier, this is an unsustainable growth, which will explain the poor performance in the next half decade. In fact, performance in 1980-84 is attributable in part to the effects of the Financial Stabilization Program (FSP) concluded with the IMF in 1979 and the SAPs (which started in 1982). These programs brought a sharp decrease in public spending; as a consequence, public deficit shrank to 3.8% of GDP. The reduction of the
Economic Performance 3/11/05 Page 7 of 40
deviation from the sample mean’s growth rate in 1985-89 is attributable to improved economic policies arising from the implementation of the SAPs. As Table 6 shows, conditional convergence, as is predicted by the Solow model, took place only in the 1960s and late 1970s3. These were the only sub-periods when Togo, which has lower initial income than the sample mean, grew faster than the latter. Violation of the convergence principle in the rest of the sample period is warranted by the fact predicted growth rates overestimate actual ones except in the 1960s. This finding is consistent with the negative and relatively large residuals, and underscores the fact that during most of the period of the study, the Togolese economy was outperformed by the sample average. Several factors had contributed to the situation. Although it played a positive role in the 1970 and early 1980s—when in fact there was an over-investment in the public sector—lower-than-desirable investment rate had a negative effect on growth in most parts of the period. Likewise, replacement investment term and initial education attainment, two factors for which the country is at disadvantage compared to the sample mean, contributed to the relative under-performance of the economy. (b) The Role of Economic Policy The conditional model allows for breakdown of the contribution of policy variables and economic environment. The residuals in the regression equation of the conditional model for Togo from O'Connell and Ndulu (2000) are reported in Table 7. As can be seen in the table, the contribution of base variables (demography, trade shocks and initial endowments) to growth was highest in the 1960s and 1970s. It is noticeable, however, that this contribution had weakened between 1960 and 1984. The contribution of political instability is weak but positive for most of the period because the country lived in a (seemingly) stable political environment during the first three decades of the study. Such an environment could be included among the factors that had contributed to growth in the 1960s and 1970s. It had also helped to reduce the growth rate deviation from the sample mean as is suggested by the estimation results reported in Table 7. 3. Market Institutions Following Afeikhena and Olawadw (1999) and Oyejide (2000) market institutions organization impact economic growth of the country. Every things being equal, (factors and goods) market-friendly economy, with soft control and less government intervention have positive effect on growth. In the case of Togo, the structure and functioning of market institutions have changed considerably during the past forty years. There has been a sharp contrast between the early 1960s, characterized by an undisturbed private sector operating in a market-friendly environment, and the mid-1970s when there were extensive government interventions. The 1980s and 1990s have been marked by a disengagement of the government from some sectors of the economy and a gradual re-empowerment of market institutions. 3 As already stated the growth in the late 1970s was an unsustainable growth.

Economic Performance 3/11/05 Page 8 of 40
3.1 Sub period 1960-1973: market-friendly economy The first government led by Sylvanus Olympio from 1960 to 1963 has been the most conservative in the history of the country. Olympio favored small government and free market in part because of (a) his background as former executive of an international trading company, and (b) the influence of the business community, which made up his support base. No particular price control mechanism was put in place. The market of goods and services continued to evolve without much government intervention and in a way that encouraged the development of internal and external trade. Following Collier (2003), this period can be characterized as a syndrome free and very soft control of the economy. No particular price control mechanism was put in place. The market of goods and services continued to progress without much government intervention and in a way that encouraged the development of internal and external trade. The government had inherited agricultural products export control policies put in place by the colonial power in the 1950s with a view to protecting French interest, i.e. aiming at giving French companies control over the exports sector. However, such policies had not affected regional trade significantly in part because the customs administration was not large enough or adequately equipped to enforce the relevant regulatory measures. Overall, the export control policies of the 1960s were weaker, more flexible and less constraining than the ones introduced in the second half of the 1970s. Factor markets also continued to evolve within the framework established by the colonial power. The labor market was characterized by a relative scarcity of skilled labor. There were trade unions however their influence was limited to a tiny modern labor market (less than 5% of the labor force). Likewise, the influence of government labor policies was hardly felt outside the modern labor market. The government pursued a strategy aiming at improving the quality of the labor force in the long run. It started by increasing and improving the network of public schools while continuing to encourage the creation and operation of mission schools. There were no higher education institutions in the country. Qualified students were sent to Dakar, Europe and North America for higher education. In this regard, the government tried to diversify as much as possible the education system by sending students to different countries and different education systems. The capital market was weak due to scant savings and the underdeveloped state of financial institutions. However, the government did not try to influence the development of this market through public investment. On the contrary, it tried to encourage private investment, which was weak because of scant domestic saving. International trading companies, whose affiliates controlled most of the international trade sector, played a major role in private investment spending. The openness of the economy favored some flows of foreign direct investment (FDI) through the activities of these trading companies.

Economic Performance 3/11/05 Page 9 of 40
The government led by Nicolas Grunitzky, in the wake of the 1963 coup, made significant changes compared to the Olympio government. It started to introduce measures that gave the government more control over the market of goods and services. In particular, it created in 1964 a marketing board, the Office des Produits Agricoles du Togo (OPAT), to regulate the producer price of most agricultural export products. The commodities covered by OPAT, which included coffee and cocoa, accounted for more than two thirds of the country’s export earnings at the time. However, these changes had not hampered growth significantly. In fact, OPAT had not affected significantly the output of agricultural export goods in the 1960s and early 1970s. Its role was little felt because of low domestic inflation and stable international environment. Producers did not show major signs of discontent about the prices set by OPAT partly because they felt better off than they would be if they were to produce other agricultural goods. In addition, the prices set by OPAT were at times higher than the ones prevailing in the neighboring Ghana—due in part to the instability of the Ghanaian currency, the cedi—which made producers pleased with what they were earning. So, OPAT was viewed as a price stabilizer. It did relatively well because of little political interference. 3.2 Sub period 1974-1979: government intervention economy Market institutions took a more severe blow in the 1970s. With the increase of public resources from the control of the main exports commodities, the government increased its control over the economy since 1974. There was also the consolidation of the single party system, the creation of public entreprises protected by high tariffs and non tariffs barriers, interest and price control. Price control measures were introduced in the markets of consumer goods and export commodities. In addition, the public sector expanded at the expense of the private sector, which hurt competition, efficiency and growth. Price control was administered, either directly, through price setting mechanisms, or indirectly through public production or supply. To regulate directly prices, three institutions where either created or became more active. Following the 1975-76 food crisis, the government forbade export of agricultural food starting in February 1976. To ease the adverse effect on (urban) population of the 1977 severe drought, the government tried to control the marketing of cereals. TOGOGRAIN was founded with the objective to avoid great fluctuation in food prices by buying, storing and selling grains and vegetables. This institution will act as a buffer stock, buying when the supply is lower than what can be beneficial for producers and selling when the prices are higher than affordable by consumers. With the support of the armed forces, Togograin took control of the grain market. Nevertheless, due to lack of resources, inefficient management and strong links between producers and traditional private traders, TOGOGRAIN had not been able to successfully take advantage of its monopoly power. More specifically, it did not succeed in imposing its price policies on the sector. Overall, Togograin operations introduced serious distortions in the agricultural food production sector.
Economic Performance 3/11/05 Page 10 of 40
The Société Nationale de Commerce (SONACOM) was founded in 1973, with the objective of importing essential consumer goods. SONACOM soon became a monopoly, as it was the sole company that was granted the right to import these commodities. Its monopoly was later extended to other commodities including cigarettes and alcohol. The price control system set up for agricultural export commodities by OPAT since the mid-1960s continued and was reinforced. OPAT consolidated its bases and increased its monopoly power. It became a dominant force in the export sector and an invaluable source of non-fiscal revenue for the government. It became less and less efficient in the performance of its role of price stabilizer in the export sector because its price fixing system had failed to provide farmers incentives to increase output. Added to these problems was the worsening management the agency experienced by the end of the 1970s. The government set up a host of public enterprises, most of which quickly became state monopolies that forced several private firms out of the market. A great number of these public enterprises had never become profitable, but had ended up closing down after persistent accumulations of losses. Finally, the government implemented a broad-based program of nationalization of private enterprises. The most publicized case was the government’s takeover of the Compagnie Togolaise des Mines du Benin (CTMB), which became the Office Togolais des Phosphates (OTP), the Parastatal enterprise that produces and markets phosphate rock, the country’s number one export commodity. In the short rum, the nationalization did not cause any significant change in output. However, it led to increased corruption as it benefited Party leaders. The increase of the government controls over the economy results in distribution. The first type of distribution was the vertical distribution. With the growing influence of the one party system a disproportional part of the resources benefits the political elite: they have privilege access:
- to import goods of SONACOM and became the resellers of these goods; and - to employment in the entrepises owned or control by the government.
There was also distribution from rural to urban population. First, the operation of Togograin results in distribution from food crops producers to food crops consumers. Even though Togograin does control less than 20% of the cereals market, its power from the government allows it to impose prices in the market. Second, in setting producer prices of agricultural export crops well below the international prices, the government was able to extract large resources to finance it spending which benefit mostly to the urban population and latter on to the Kara region and to the Kabye ethnic group4. The regional redistribution was favored by the nationalization of the phosphate rock sector which generates large rent to the government. The population of one of the district where the phosphate rocks is located is one of the poorest of the country. Public sector and parastatal 4 The president is from the Kara region and from the Kabye ethnic group.

Economic Performance 3/11/05 Page 11 of 40
Public enterprise ad mostly CTMB, the biggest enterprise in the country was used to create job for the Kabye, the ethnic group of the president. The detrimental effect on growth is high, mostly in the agricultural sector as low producer prices were not incentives to production. The subsidy to inefficient parstatal protected by high non tariff and tariff barriers maintain distortions in the economy. The labor market experienced distortions as well. For political reasons, the government made the civil service the place to recruit college and university graduates who contributed little to aggregate output. The recruitment system was highly distortionary because the surplus civil servants were paid salaries higher than their marginal productivity. As a consequence, many youngsters were attracted by the cities, in particular the capital. Another aspect of such distortions was the fact that the recruitment program blurred unemployment figures. This situation comforted the government in its demagogical rhetoric and spared it the social trouble that could come from the unemployed. Oversized civil service had resulted in wage bill problems that had contributed to the overall government finance crisis of the late 1970s. Since 1983, the reforms imposed test for recruitment in civil. However, the results of these tests were biased in favor of the Kabye. This abnormally increases the share in civil service and may have had a negative impact on the efficiency of the public sector which in turn negatively impact on growth. Evidently, the increase of controls and these resources redistributions did not have positive impact on growth. 3.3 Sub period 1980-1990: economic reform Market institutions started to regain strength with the implementation of structural adjustment programs (SAPs) in the 1980s, when the IMF and World Bank-led reform programs portrayed broad-based liberalization as a key condition for sustained economic growth. These programs included measures to reduce the budget deficit mainly through (a) control of government expenditure and (b) gradual disengagement of the government from some sectors of activity. Such measures represented a clear reversal of the policies adopted in the 1970s. The disengagement of the government and the rest of the reform programs caused a recession in the early 1980s because of both supply side and demand side effects. On the demand side, the reduced government expenditure produced in the short run the Keynesian type decline in output. On the supply side, the disengagement left a vacuum the private sector was not quite ready to fill. Fortunately, these problems faded away as time passed by, and resumption of growth occurred eventually in the second half of the decade. In the market of consumer goods and services, the liberalization was symbolized by the dismantling of some State monopolies such as Togograin and SONACOM. The dissolution of Togograin and the subsequent price liberalization program were appreciated in the rural areas. In particular, the price liberalization resulted in increase in agricultural output and set a new dynamics for internal trade in agricultural products. Likewise, the abolition of SONACOM's

Economic Performance 3/11/05 Page 12 of 40
monopoly power brought back competitive environment in the import sector and revived rival companies such as SGGG, SCOA and CICA. In the agricultural export commodities markets, OPAT’s monopoly power started to decline thanks to several factors. First, the share in total export revenue of the main products exported through OPAT declined significantly. Second, a new agency, the Société Togolaise de Coton (SOTOCO) started imposing itself in the marketing of cotton, that had become the country's number one agricultural export product. SOTOCO's policies toward producers were friendlier than OPAT's. In particular, the new agency gave technical assistance and provided producers with inputs (improved seeds, fertilizers, pesticides) that had contributed to the spectacular increase in production in the 1980s. Phosphate remained the country's number one export commodity although its share in total export revenue had declined compared to the 1970s. OTP continued to be in charge of the production and the marketing of this product. The government steadfast resisted suggestions by donors to liberalize the sector. Lack of good governance and environmental concerns made OTP operations less and less popular. The government feared a liberalization of the sector would have political and financial consequences on the regime, as OTP was a great resource provider for the regime and its dignitaries. In the labor market, measures to rationalize recruitment in the civil service were introduced with the SAPs. Efforts to reduce public expenditure led the government to put a freeze on recruitment in the civil service. The size of the civil service started to shrink, as retired employees were not replaced by newly recruited ones. In addition, new laws were introduced that set retirement age at 55. However, civil servants who had served for thirty years (or more) were retired, even if they had not reached age limit. Access to civil service was filtered by a national recruitment exam, at which the rate of success was 7.2% in 1985. The change was very tough and caused a great deal of social discomfort, since the related measures hit so many people. The size of the civil service shrank by 13% between 1985 and 1988. The population could not react or protest because any disagreement with the government was absolutely inconceivable at the time and was swiftly and severely repressed. Unemployment rate increased (although no official figures were available), since the civil service was the destination of most college and university graduates entering the labor market. The effect of the reduction of the size of the civil service on growth is complex to evaluate. As Collier (2003) pointed out, an unsustainable growth (like the one in the late 1970s) is followed by a decline in GDP. In fact, the economy did experience negative growth in the early years of the period. It could be argued that reduction of government expenditure, in particular of civil service wage bill, had had adverse demand-side effects on output. The direct supply side effect was minimal. First, the reduction of numbers in the civil service had not caused a meaningful decline in output because overstaffing during preceding periods had resulted in underemployment. Second, the reduction of the size of the public enterprise sector was not detrimental to growth given the inefficiency that characterized that sector. Public sector’s contraction, notably decline in government budget deficit, did have positive effects on current account whose deficit fell from 25.4% of GDP in 1978 to 2.3% in 1989
Economic Performance 3/11/05 Page 13 of 40
while budget deficit shrank from 31.1% to 3.2% of GDP. An important element of the fiscal consolidation measures was the reduction of public expenditure. In particular government investment spending was cut from 47% of GDP in the late 1970s to 20% of GDP in 1989. This decrease in public investment will have adverse effect on growth due to lack of maintenance of infrastructures built in the previous period. In the money market, the BCEAO introduced a reform in 1989 that represented a timid but crucial step toward liberalization. The reform included measures to consolidate the interest rate structure. The most important element of the new interest rate policy was the introduction of a single discount rate applicable to all private sector activities. The former policy, which compelled banks to devote a minimum volume of credit to the so-called priority sectors, had not worked. It was distortionary and banks did not apply it. The new interest rate policy is simpler and allows banks to determine their own interest rates based on their desired mark-up over the official discount rate. Still, the system is rigid since (a) interest rates are not fully determined by market forces and (b) no individual member country has its own monetary policy. Money supply was particularly tight during this period, because the central bank was trying to resolve a bad loans crisis that first erupted in Côte d'Ivoire and Senegal and then spilt over to other member countries of UMOA. Tight monetary policy was viewed as a virtue and has been therefore recommended to several non CFA Zone countries of the region as one of the fundamental elements of the structural adjustment package. For that reason, the BCEAO was praised for its conservative policy. Nonetheless, this policy, which was too rigid at times and became rather deflationary during most of the sub-period, did not favor growth in Togo during that period (Evlo, 1997). This sub period was also characterized by ethnical redistribution of resources. The freeze in recruitment in civil service suspension was not uniformly applied on all ethnics groups. Even if the applicants have to pass a test before being recruit, one finds that the Kabyes, ethnic group of the president were favored in the process. The weak GDP growth in this sub period was mainly explained by the lag effect of the mismanagement of the economy during the previous sub period. 3.4 Sub period 1990-1999: political crisis The pace of economic liberalization process accelerated in the 1990s. The reforms affected both the market of goods and services and the parastatal sector. In addition, a few important events, such as the devaluation of the CFA franc, occurred in the area of monetary policy, boosting the efficiency of market institutions. First, many public enterprises the government was previously reluctant to privatize were restructured or privatized. These enterprises included the Compagnie Energie Electrique du Togo (CEET) and SOTOTOLES. The capital of the Office des Postes et Télécommunications du Togo (OPTT) and many other companies has been opened to private shareholders. In many cases, the privatization did not bring about the change expected by the population, because the government continued to hold the majority of the shares in some of these new companies. The

Economic Performance 3/11/05 Page 14 of 40
privatized companies essentially kept their monopoly power and continued to produce at sub-optimal levels. This was the case of the former CEET and OPTT. The former CEET has become Togo Electricité. Likewise, the restructuring of the former OPTT has resulted in the separation of postal services from telecommunications. The government continues to have control over the telecommunications sector, as it holds the majority of the shares of Togo Telecom. In the beginning, Togo Telecom was a strong monopoly in the area of telecommunications, although the advent of Internet has brought a few changes into the sector. Provision of Internet services has been liberalized, making Togo one of the countries where such services have reached the highest level of development in the region. The sector opened-up further by the end of the 1990s when a new company, Telecel, was given authorization to operate and supply mobile telecommunications services, thus to compete with Togocell, the unit of Togo Telecom that was the sole supplier of these services. The competition produced favorable effects on the prices of telecommunications. Second, the market of agricultural export commodities continued to undergo institutional changes. OPAT lost its monopoly power on agricultural products exports in 1996. Several private companies are now operating in the sector. The gradual liquidation of OPAT was done in a broad context of trade liberalization. The distribution of resources in favor of the Kabye can be seen in the regional distribution of public health provision and of civil servants. With 14% of the country’s population, the Kara Region has 22% and 23% of the health centers and personnel respectively. In 1995, public health expenditure per habitant was 1844 FCFA in the Kara region compare to 784 FCFA in the poorest region of the country. There are 92 habitants per civil servant in Kara Region compare to 109 for the country.5 4. Microeconomic Agents The government is the microeconomic agent that has had the greatest influence on the country’s economic performance. It has been responsible for events that have marked the major transitions in the country’s economic history. Economic philosophy has changed considerably during the forty-year period. Such changes have had determinant effects on performance. In most parts of the 1960s, the government played a positive role by keeping a low profile and refraining from intervening excessively in the economy. In particular, the Olympio government gave the market a leading role in economy. The size of the public sector was small. In 1965, the civil service employed about 15,000, less than 2% of total labor force. Fiscal policy was conservative and budget deficit insignificant, with government expenditure averaging one tenth of GDP. Overall, low level of government interference had had a positive effect efficiency and economic performance. But the situation changed in the mid-1960s when the government started to play a larger role in the economy. 4.1 Increased Government Intervention in the 1970s
5 There is a concentration of the civil servants in Lomé, the capital of the country. Therefore, the region where Lomé is located is not taken into account in the regional distribution of civil servants. Kara Region is the region mostly populated by the kabye.

Economic Performance 3/11/05 Page 15 of 40
In the second half of the 1970s, the government became the predominant economic agent and it policies had contributed to the poor macroeconomic performance the country had experienced the rest of the period. 4.1.1 Fiscal Policy Following the international phosphate rock price increase in 1973, the government was haunted by a complex of grandeur as it called itself a "government of big projects." It embarked on a big expenditure program that the country had never seen before and acted as if such program could be financed indefinitely with windfall resources from terms of trade improvement. The goal pursued through these expansionary policies was to bring about structural transformation in the economy so as to foster sustained growth. Particular emphasis was put on industry because this sector was the weakest of the economy and also because the government believed that development required rapid development of the industrial sector. Public investment increased dramatically, from 13.4% of GDP in 1973 to 39.6% of GDP in 1979. As a consequence, the formal employment in the industrial (mainly public) sector increased from 8,288 in 1973 to 19,254 in 1979. Institutionally, the strategy was supported by a favorable investment code. The investment code drafted in 1968 and revised in 1973 and in 1978 was intended to promote the creation of “big” industrial enterprises. Between 1976 and 1980, 15 State-owned or funded enterprises accounted for more than half of the investment made in this sector. Because of their high operating cost, these enterprises could not operate without tariff and non tariff barriers. Most elements of this highly improvised development strategy were far-fetched and the economy as a whole was not ready for them. Such elements included the building of a petroleum refinery plant in the middle of the oil crisis of the 1970s. The plant was supposed to be supplied with crude oil by some countries through some bilateral trade agreements. But the agreements were never signed and the plant ended up closing down. Other examples of bad projects included the building of a steel mill that also closed down a couple of years after it started operating. A few strategic mistakes can be cited. First, most of the projects were highly capital-intensive but the government underestimated subsequent financing needs. The government failed to adopt projects that could make judicious use of human capital, the factor of production it strived to develop with an arguable degree of success. It continued to make the civil service the principal recipient of the qualified labor force. Second, the government failed to associate the private sector to this development strategy. In fact, certain elements of the strategy discouraged the private sector as they caused the crowding-out of some firms. In 1976, State-owned enterprises accounted for 68.4%, 47.7% and 100% of the value added of the mining, manufacturing and energy industries respectively. In 1979, 77% of firms in the modern sector were State-owned or State-controlled. These firms accounted for about half of the modern sector payroll outside the civil service.

Economic Performance 3/11/05 Page 16 of 40
The development strategy was not accompanied by measures to create a generally enabling environment for industrial development. In particular, the government failed to build adequate development infrastructure such as road and communication networks. The strategy focused essentially on import-substitution activities, which were highly subsidized. Private firms, which produced or imported these commodities, were crowded out. Inefficient public or parastatal enterprises drove more efficient private firms out of the market. 4.1.2 Monetary Policy Monetary policy did not change much during the period. Overall, the monetary system worked fairly well. However, it was too static and too passive in some regards. In particular, the monetary authority failed to adjust policy to respond to the shocks that occurred during the period. First, continued and unrestricted use of the resources of the Operations Account did not make the government feel the need to work out a solution to the current account deficit problem. The central bank did not sanction member countries for behaviors that could have detrimental effects on the Monetary Union (as a whole) or the common currency. Member countries felt free to take on practices that suited their individual interests with no regard to potential effects on the Community. Practices that contributed to aggravations of current account or external debt positions of member countries were not sanctioned. On the contrary, the common reserve pool served as a factor that boosted creditworthiness, solvency and liquidity of individual member countries. It, therefore, favored individual member countries' access to international financial resources, thus contributed to the debt crisis experienced by Togo and other member countries (Evlo, 1997). Second, monetary policy lacked dynamism. The central bank did not introduce measures to enable its credit allocation policy to respond to economic difficulties. No action was devised to help reduce member governments' budget deficits. No measure was envisioned to foster fiscal discipline. Governments were free to run deficits as large as they desired, provided they could have such deficits financed outside the monetary system. Togo’s record-high deficits in the second half of the 1970s were condoned by the central bank. In fact, the latter made available to member governments credit facilities that were determined on the basis of factors that had nothing to do with the size of budget deficits. More importantly, most member governments including Togo never exhausted the resources allocated to them through these facilities. So, they had the possibility of running even larger deficits. 4.1.3 Trade Policy The second half of the 1970s was also characterized by an increase in government control over the external trade sector and an agressive import substitution policies. By the end of the previous sub-period, the government nationalized the CTMB, the company that produced and marketed phosphate rocks. Through this move, the government controlled over 90% of export revenues. The agricultural export products marketing agency, OPAT that was created in 1964, was not really stabilized the producer prices of the relevant products until the mid-1970s. However, it
Economic Performance 3/11/05 Page 17 of 40
served as a mechanism through which financial resources were transferred from producers to the government. The differential between producer and international prices of cocoa and coffee increased during this sub-period, in particular between 1976 and 1978. The ratio of cocoa producer price to international price fell from an average of 41% in the 1970 - 1974 period to 24% in the 1974 – 1978 period. Likewise, the ratio of coffee producer price to international price declined from an average of 31%, in 1970 - 1974, to 24% in 1974 - 1978. The increase in exported quantities of coffee and cocoa during the sub-period was due essentially to smugglings from Ghana6. Baniganti and Lawson (1994) estimate the rate of protection of some of the largest enterprises in Togo. Effective rate of protection (ERP) was generally high even though the cost of domestic resources coefficient suggested that there were inefficiencies in the operation of most the enterprises. Baniganti and Lawson (1994) found that ERP for state owned enterprises, which was on average high as over 200% is very high for some sectors. For example, the ERP for the Brasserie du Bénin was in the range of 118.5 to 349%. The average rate of effective protection for textile and leather products was 354% compared to 216.7% for woods and wood products. The textile industry was also highly protected. The Balassa effective rate of protection index reached 614% for the Textile industry and a record high of 673% for Togométal. One of the least protected industries was the Ciments du Togo whose effective rate of protection did not exceed 175% in 1979. 4.2 Adjustment Policies and Economic Reforms Due to unsustainable public finance deficit and the debt overhang, the government’s behavior changed considerably in the 1980s. The government remained the most important economic agent because of its willingness to carry out economic reforms and also because the public sector remained large. It implemented most aspects of the structural adjustment programs (SAPs), although certain measures of such programs were unpopular. Reduction of the size of the civil service could be politically costly in a democratic regime. Likewise, liquidation or privatization of some non-performing public enterprises was not well accepted by the public, which was concerned not only about job losses, but also about the way these enterprises were sold. Nonetheless, the government felt no pressure from the population to behave one way or another. Because of its authoritarian style, it implemented such programs without consulting the population. Togo was one of the few countries that accepted without any major amendment the structural adjustment aid package proposed by the IMF and the World Bank. In reality, it did not have much choice given the severity of the government finance crisis the country was experiencing7. Current account deficit was brought down in most part of the sub-period. Positive growth resumed in the second half of the sub-period, but was quite weak: 15.5% between 1985 and 1990. The recovery was caused principally by a 24% growth in the agricultural sector and a 6 Such smuggling activities were not necessarily due to practice of lower producer prices in Ghana. They were primarily motivated by the opportunity to earn CFA francs that these producers could use to buy (in Togo or other neighboring countries) imported consumer goods that were severely rationed in Ghana. So, inappropriate exchange rate policies (in Ghana) might have made Ghanaian cocoa producers contribute to the prosperity and wealth of OPAT. 7 The fact that there were many such programs, suggest that there were not often implemented.

Economic Performance 3/11/05 Page 18 of 40
47% growth in the mining sector. The recovery was hampered, on the one hand, by the weakness of the services sector due in part to the continued contraction of the public sector and, on the other hand, by deteriorating terms of trade. Budget deficit was lower in the sub-period than in the second half of the 1970s. Official Development Assistance (ODA) increased steadily from US $63 millions in 1981 to US $260 millions in 1990, which was its highest level ever. In this sub-period the country was also granted debt relief through the Paris and London Clubs. From 1984 to 1990, five countries cancelled partially or in totality Togo’s bilateral debt following the Toronto Plan, various aid initiatives for Least Developed Countries, or the resolution of the Francophone Summit held in Dakar. Total debt relief was US$ 315.4 millions. However, this debt relief effort proved inadequate to help the government to pay its due debt service on time. Debt service payment had been rescheduled eight times by the Club of Paris. The flow of financial resources from the IMF and the World Bank increased although the country did not implement satisfactorily the adjustment programs it agreed upon with these institutions. World Bank loans increased from US$ 47 million in 1980 to 400 million in 1990 and IMF loans from US$ 33 million to 87 million in 1990. 4.3 The Socio-Political Crisis In the 1990s, the government continued implementing IMF and World Bank-sponsored economic reforms despite the socio-political crisis. The pace of the reforms accelerated, leading to an even higher degree of liberalization and privatization. However, the crisis caused a slowdown of economic activity in virtually all sectors. Households' savings and private investment went down, causing long-term reduction of physical capital stock. The problem was aggravated by the economic sanctions imposed on the government by the donor community. These sanctions caused reduction of the flow of foreign direct investment (FDI) and official development aid (ODA). ODA shrunk from 260 millions CFA francs in 1990 to 71 millions in 1999. 5. Political Economy For a growing literature (see Bates and Devarajan (1999) for a review), political economy is an important determinant of growth. Togo has been one of the countries where political leadership has not changed much over the past forty years. Three presidents have governed the country since 1960, one since 1967. For this reason, Togo has often been labeled to as politically stable among African countries. This stability ended in 1990, as the country has been going through a socio-political crisis since. Interest groups and their role have changed during the 40 years of the study period. 5.1 The Political Environment and Interest Groups The sub-period following independence was unstable because of covered interference acts by the former colonial power and inter-party rivalries carried over from the pre-independence period. These destabilizing factors contributed to the two military coups that rocked the
Economic Performance 3/11/05 Page 19 of 40
country in the 1960s. The 1963 coup, in which the first elected president was assassinated, was the first military coup in Sub-Saharan Africa. The second coup occurred in 1967; it looked like a "palace revolution" in that it did not really affect the country's political stability. In spite of these two military’s coups, 1960-1974 was the period in which the economy has had the best performance. 5.1.1 The Post-Independence Political Instability of the 1960s The struggle for independence was a concern of the majority of Togolese no matter their ethnic group and their region of origin. The political environment in the pre-independence period and the early 1960s was characterized by a multi-party system. Some parties favored the continuation of colonial rule while others fought for independence. Usually, parties in weak political settings operate under the influence of foreign powers and do not always agree on the way to govern. Conflicts often erupt and cause the collapse of coalitions leading to political crises like the ones that cripple most newly independent African countries. In Togo, the coalition that assumed power after independence comprised two allied parties, the Comité de l'Unité Togolaise (CUT) of Mr. Sylvanus Olympio and the JUVENTO of Mr. Anani Santos. The only thing that united these two parties was their common staunch desire to free the country from colonial rule as quickly as possible. Interestingly, however, the two parties were very different ideologically, as they came from opposite ends of the political spectrum. Conservative-minded thriving businessmen and women made up the core ideological constituency of the CUT while the JUVENTO, led by middle class intellectuals and trade unions, was influenced by Marxist-Leninist ideology. In particular, the JUVENTO did not favor the conservative and market-oriented philosophy embraced by Olympio. The JUVENTO preferred progressist, pro-labor, policies that would put agriculture and rural development at the center of the economic development strategy. The ideological divide between the two parties persisted and widened quite rapidly, causing the breakup of the coalition. The atmosphere was not helped by Olympio's pro-Anglo-Saxon rhetoric, a situation that did not please France, the former colonial power, which lent its support to opposition parties and to some leaders of the JUVENTO. The political environment deteriorated rapidly, starting with public clashes between the CUT and the JUVENTO. The coalition collapsed, leading to open hostilities between the two parties. The hostilities intensified as opposition parties joined in, and resulted in arrests of political leaders. As early as in 1961, the government crushed the opposition by jailing some political leaders. In the process, the government made some fatal political mistakes by trying to reduce the influence of France on the country. Namely, the President strengthened ties with West Germany8, at the expense of relations with France. A strong example was the fact that the government snubbed the French to seek from the Germans financing for the construction of the Port of Lome, the most important public infrastructure investment in the country. The discontent of the French increased by the end of 1962, when the government requested all Togolese soldiers fighting under the flag of the former French colonial army against the 8 Germany was the country that colonized Togo between 1884 and the end of the First World War.
Economic Performance 3/11/05 Page 20 of 40
Algerian independence army to withdraw from the war and from the colonial army. This decision prompted the French to increase their covert support not only to opposition parties, but also to the military. The military believed that Olympio's plans calling for their withdrawal from the French colonial army and aiming at reducing the size of the national armed forces would marginalize them in the conduct of the country's affairs. Interestingly, the government was not able to sense the discontent of the Algerian war veterans that the French reluctantly relieved and that it did not intend to recruit into the national army. The Olympio administration in power from 1960 to 1963 was quite popular; so the time horizon considered by most coalition leaders was long enough. It felt so confident about itself that it overlooked basic security matters. In particular, it did not imagine any other force than the will of the people that elected the President could topple a government that was so popular. This somehow excessive confidence was warranted by the fact that there was no previous case of violent change of executive in independent Sub-Saharan African countries. The President, therefore, ignored all about the military coup that was being plotted and that eventually took place in January 1963. The coup resulted in the death of President Olympio and the end of his regime. The first significant change that occurred following the coup was improvement and strengthening of ties with France, which actually backed the coup. Following the coup, France's involvement in Togo’s politics increased, making France the most important political, economic and military partner of the government. In fact, Nicolas Grunitzky who was put in power by the military junta, was the leader of the opposition party, the Parti Togolais du Progrès (PTP), which did not want independence in 1960, but instead, advocated the continuation of the colonial rule for a few more years in order, according to their argument, to better prepare the country for self-rule. Grunitzky quickly made overture toward France and the post-colonial institutions it supported in the sub-region. These institutions included UMOA that Grunitzky did not waste any time to join, abandoning Olympio’s long standing quest for monetary independence. The Grunitzky government was not popular for at least two reasons. First, the PTP had not been a popular party. It was viewed as a party that represented the extension of French colonial interests. Second, Grunitzky was not elected. His acceptance to take over on the request of the military was not tolerated by the population, the majority of which saw him as an accomplice to the coup that killed the popular and first elected President. Others viewed him as a weak leader who did not have an agenda of his own, or a puppet of the military. Lack of popular support did not help Grunitzky carry out any well-defined program of government. The inability of the new government to improve the socio-economic situation gave the military an excuse to intervene again, to remove the President through a bloodless coup in 1967. Grunitzky's removal was not surprising or greatly regretted by most Togolese. The population was worried, however, that these successive military coups may result in the establishment of a dangerous trend in the country's political life, where military power and violence would have precedence over the rule of law and prohibit democracy.
Economic Performance 3/11/05 Page 21 of 40
The 1967 coup brought to power the military junta that also staged the 1963 coup. Gnassingbe Eaydema, who led at least the second coup, imposed himself as President. The military government quickly consolidated its power, which prevented the occurrence of any other military coup. Over the past thirty-seven years, Togo has experienced one of the strongest, best-consolidated and most ruthless military dictatorships in Africa. Political life was banned following the 1963 coup; it was only in 1969 that the military government founded the Rassemblement du Peuple Togolais (RPT), a single party, to give political bases to its rule. The true objective of the government was to make the population and the outside world believe that it was bringing back political life. In reality, the establishment of this single party was a move to outlaw any other political party and strengthen the long-existing ban on political activity. Ethnic harmony was a positive feature of the country's social life. The first two presidents came from the southern region of the country, while the soldiers of kabye ethnic group who led the military coups were from the North. However, there was no serious ethnic conflict. Trade unions were brought to silence in most parts of the period, especially following the abolition of political and union activity in 1963. The military feared trade unions and other civil associations the same way as they did political organizations. 5.1.2 The Advent of the One-Party System in the 1970s The Eyadema government consolidated itself in the 1970s during which the single party regime established in 1969 campaigned for legitimacy. The President took advantage of the population's compassion following a mysterious plane accident he survived to quickly consolidate his power base and make the public idolize him through the Party. The regime became more and more autocratic and repressive. Through manipulation, persecution and persuasion, the regime organized youths, women and labor associations under the Party’s umbrella. Because of the cold war climate that prevailed in the world, the regime was quite popular on the international scene. The main features of the end of this period were the presidential plane crash in January 1974 and the five-fold increase in the price of phosphate 1974 and 1975. The plane crash shortened the time horizon of the executive. Following Mansur and Olson (1993), in such a situation, there had been a tendency toward bad economic management, a phenomenon that had been facilitated by the windfall increase in revenue enjoyed by government. Political environment was unstable elsewhere in the sub-region, notably in Burkina Faso, Ghana and Nigeria. Marxism-Leninism made progress and took ground in neighboring Benin. Such a situation was of concern to the West given, the cold war context. Human rights abuse was apparently of no concern to the international community in such an environment. In the sub-region, Cote d’Ivoire and Togo were the main defenders of Western countries’ interests. The governments of these two countries therefore enjoyed the support of the West. Capital and foreign aid flowed in and ACP-EEC conventions were signed in Lome. Togo also enjoyed important inflows of foreign investment because of the over-liquidity of banks.

Economic Performance 3/11/05 Page 22 of 40
The legacy of the second half of the 1970s was the consolidation of a repressive regime, the institution of a predatory method of government, large budget deficits and a record-high external public debt. All this happened with the blessing of France and the West in an international environment dominated by the cold war. 51.3 The 1980s and the Consolidation of the Single Party Regime The government imposed a constitution in 1981 to give the regime institutional and legal bases, and institute the preeminence of the single party rule. This new situation put an end to the exceptional regime under which the country had been ruled since 1963. The political environment became very repressive as the government adopted the North Korean style of administration. In the first half of the 1980s, the political system was fairly stable; there were only two cabinet reshuffles. The regime stood firm and looked undisturbed despite the isolated bomb and rebellion attacks that unsettled the seemingly calm atmosphere in Lomé in 1985 and 1986. The political leadership remained almost the same as in the 1970s. The 1985 and 1986 political turmoil probably changed the attitude of the government. In particular, the events made the executive branch less secured and shortened its time horizon. The President increasingly mistrusted the citizens from other ethnic groups than his own. In addition to the interest groups of the previous period, i.e. RPT leaders and the military, there was a third group, the ethnic group of the President. Ethnicity became therefore an increasingly disturbing phenomenon, as more and more people from the President’s ethnic group held the most important senior management positions in the civil service and public enterprises. 5.1.4 The Socio-Political Crisis of the 1990s The 1990s were a period during which the troubled political situation deeply affected economic performance. The highly unstable environment turned violent, as the unpopular dictatorial regime turned to the armed forces for swift repressions. The events caused a severe slowdown of economic activity and a sharp decline in per capita income. The year 1993 marked the climax of the economic downturn with 18% decline in GDP caused principally by a nine-month social strike. The fight for democracy produced some results, as it brought about perceptible changes in the country's political life. Such changes were in part the result of a strong pressure from the international community on the President, on the one hand, and an unprecedented social pressure from inside the country, on the other hand. In particular, the civil strife that started on October 5, 1990, had profoundly changed the socio-political environment. In the beginning, the regime resorted, as usual, to political manipulations to outdo the opposition. But such a strategy did not work. In the end, the regime was overwhelmed by the events. It reluctantly yielded to the demands of the population and accepted in April 1991 to bring an end to the one-party political system. Following a National Conference held in the summer of 1991, a transitional government led by a prime minister was put into place. A parliamentary system of government was instituted to replace the one-man terror show ran by the President.

Economic Performance 3/11/05 Page 23 of 40
But the new system of government had never functioned properly because of permanent frictions between the President, who had the support of the armed forces and the Prime Minister, who as supposed to be the choice of the people. These frictions resulted in a putsch in December 1991 though which the President gradually recovered the power he had before the start of the civil strife. The new political environment was characterized by increased insecurity, generalized violence, assassination of political leaders, and abuse of human rights. Faked elections were held periodically, through which the President imposed himself and his party. In the second half of the 1990s, the President’s party was the only that sat on Parliament. The opposition continued to enjoy interest groups' support, which facilitated the process toward democracy. The government adopted a more clientelist behavior as the make-up of interest groups had changed. Members of the President's party, who were predominantly from the President’s ethnic group, held most senior positions in the civil service and parastatal enterprises. Regional distribution of social services is biased toward the President’s region of origin, the Kara region. 5.2 Economic Policy 5.2.1 In the 1960s and Early 1970s About 80% of the population lived in rural areas. Modern employment was less than 15% of labor force during the period. Bureaucracy and institutions were rather weak. Foreign trading companies (mostly French) dominated the private sector. The economic philosophy was conservative and market-oriented, reflecting fairly well the legacy of the first President. Increased involvement of the government through introduction of price control measures in 1964 did not cause any major prejudice to growth because such measures were below the 'harmful' level they reached in the mid-1970s. The business community and the private sector supported the first president’s political party. Before independence, private companies were in charge of the export sector. The government carefully attended to the interests of these companies by resisting some pressure to interfere with their activities. The situation in Togo contrasted with the one in neighboring countries, such as Ghana and Cote d’Ivoire, where State-controlled marketing boards were established. Producer price stabilization measures were not introduced before 1964 despite the 45% decline in the price of coffee and cocoa between 1958 and 1962. It is still not clear what the net effect of such policy was on output and exports. Supporters of price stabilization policy could argue that the uncompensated price decline discouraged production, a phenomenon that would not be desirable for a country that had just attained independence. Lack of political power or proper organization did not give farmers means to put pressure on the government. Proponents of free market who would argue that, by behaving that way, farmers might have avoided establishing dangerous precedents that could prove prejudicial to long-term growth. In fact, most JUVENTO leaders believed that the government could do more for farmers. Some went even further by advocating actions that would aim at attenuating the negative effects of the commodity price fall on the welfare of farmers. The debate over agricultural policy put the JUVENTO at odds with the CUT and contributed to the tension between the

Economic Performance 3/11/05 Page 24 of 40
two parties. Fortunately for the CUT, farmers did not get involved in the conflict, which minimized the extent of potential adverse effects on the President's popularity. After the 1963 coup, and following what had become trendy in other former French colonies like Côte d’Ivoire the new government founded in June 1964 the Office des Produits Agricoles du Togo (OPAT), which was granted the monopoly of marketing major agricultural export products. The OPAT soon became a stabilization fund with growing revenue, part of which the government used to finance development projects. The Eyadema government that assumed power after the 1967 coup was interested in regional economics because the Kabye ethnic group from the Kara region, the second poorest region of the country, dominated the armed forces. Part of the revenue from taxes on coffee, cocoa and cotton was channeled into the development programs in the Kara region. It was the beginning of a strategy that tended to favor the north at the expense of the south and that helped Eyadema consolidate his political base in the North. During the period, the Eyadema government did not introduce any major economic reform program. The President was rather interested in consolidating his political base. Beside the port of Lome, whose building was planned by Olympio and started by Grunitzky, the government did not undertake any major investment project. Fiscal policy was mostly prudent; budget deficit and public debt were negligible. Togo has been member of UMOA since 1963. The monetary regime in place since the colonial times was unchanged until 1973 when it underwent minor reforms. Monetary policy was de facto designed and managed by the French Treasury. By convention, the French Treasury was responsible for the convertibility of the CFA franc, UMOA's currency. Because of this arrangement, and as a consequence of conservative fiscal policy, the country had adequate quantity of international reserves. Government claims on the banking system were positive and significant. Bank loans benefited mostly foreign-owned trading companies. These companies accounted for more than 90% of total bank deposits and loans. UMOA has remained a low-inflation currency area since that period: inflation rate averaged 1.2 % a year during the period. International economic environment was stable until the first oil shock in 1973. 5.2.2 In the Second Half of the 1970s Clientelistic management resulted in greater pressure on public resources with an impressive increase in civil wage bill and in fiscal deficits. There was also an increase in social infrastructure (schools and health centers, water and sanitation). The government implemented ethnic and urban-biased policies. The increase in the size of the civil service was a sign of this policy change. The number of civil servants grew three-fold between 1965 and 1977. Civil servants numbers increased further, from 30 000 in 1977 to 49 000 in 1980. Most of the newly recruited workers came from the Kara region. Economic policy was urban-biased largely because the potential opposition to the regime was represented by educated people who resided in the main cities. Such a bias was illustrated by the creation of Togograin and SONACOM with a view to controlling the price of consumer goods in the cities. The operation of such companies only caused distortions and hurt overall economic performance.

Economic Performance 3/11/05 Page 25 of 40
The government nationalized the production and marketing of phosphate rocks with a view to increasing its control over the economy. The President and the Party made this nationalization a big political issue. The President claimed victory following the conclusion of this highly improvised nationalization process that he made public in the wake of his 1974 plane accident. To get the public involved (emotionally and otherwise), the Party leadership claimed that the accident was plotted by the West as a preemptive reaction to the President's intention to nationalize the phosphate sector. The country remained member of UMOA and did not have independent monetary policy. There was a reform in 1975 that gave a more active role to the central bank, the BCEAO. The central bank was given more authority in the determination of interest rate and the allocation of credit. A Union-wide money market was created in 1977. The objective of this market was to improve capital and credit mobility within the Union. France continued to play a determinant role in the design of monetary policy. France used the reform to increase its influence over the sub-region. Many aid programs were tied to membership of the Franc Zone or to public support of the French culture. The promotion of agencies such as the Agence pour la Coopération Culturelle et Technique (ACCT) and the institution of Francophone Summits were meant to develop special ties with France. France gave military and security assistance to loyal regimes of the sub-region and got in return privileged access to the national resources and markets of these countries. 5.2.3 In the 1980s The government continued to grant special privileges to its supporters through public enterprises such as SONACOM and OPAT. But the situation started to change with economic reforms sponsored by the Bretton Woods Institutions and bilateral donors. The international political environment was dominated by the cold war, which helped the regime receive the support of the West. Indeed the President portrayed himself to the outside world as an anti-communist champion. This situation weakened the position of the Bretton Woods institutions as power brokers and reduced the effectiveness of their role in influencing the pace of the economic reforms. The degree of implementation of economic reforms depended to a great extent on the will and mood of the President. Trade liberalization and privatization programs were implemented with delays even though the government declared its commitment to such programs. Nonetheless, there was evidence of the government's disengagement from several sectors, which cut effective rate of protection from 128.5% in 1980 to 72.6% in 1999. Pressure continued on public expenditure, which decreased by an average of 14.2% between 1980 and 1987. The financial situation of public and parastatal enterprises worsened. However, budget deficit declined from 8.4% of GDP in 1979 to 2.9% of GDP in 1990, thanks to fall in expenditure and increase in external aid. Economic reforms started to have adverse effects on the welfare of population. Most social sector indicators worsened substantially. Between 1980 and 1985, enrollment rate declined by 125% for primary school and 31% for secondary school. The number of employees of the civil service dropped from 39 000 in 1981 to 34 000 in 1988. The population's discontent was
Economic Performance 3/11/05 Page 26 of 40
overwhelming. The government reacted by introducing measures to improve the social situation. Such measures represented a setback on the implementation of the SAPs and had contributed to the increase in government expenditure of the late 1980s. 5.2.4 The 1990s Important policy and institutional changes took place in the 1990s. In the area of monetary and exchange rate policy, the authorities of the CFA Zone finally consented to effect the historic and long-awaited devaluation of the CFA franc in January 1994. Second, the monetary union, UMOA was transformed into a new regional economic community, the Union Economique et Monétaire Ouest Africaine (UEMOA). The new arrangement has broader goals and objectives than the old. Notably, it aims at achieving full (monetary and) economic integration among its member countries. In addition to monetary integration, which these countries had enjoyed since independence, UEMOA achieved customs union in 2000 with the removal of tariff and non-tariff barriers on intra-community trade and the application by all member countries of a common external tariff (CET). Overall, the creation of UEMOA has brought about a profound change in the institutional framework in which macroeconomic policy should be conducted. Participation in UEMOA is subject to respect of specific conditions that include the convergence criteria discussed above. These conditions impose new constraints on the government as regards economic policy. The governments of all member countries have committed themselves to increased fiscal discipline and to avoiding the types of macroeconomic imbalances that they experienced in the 1970s. For example, debt to GDP ratio is required to be kept below 70%, budget has to be balanced, and inflation rate shall not exceed 3%. In addition, no government is allowed to indulge in cheating practices that would consist in accumulating payment arrears. All these measures are supposed to lend support to the common currency and contribute to the cohesion of the Union. However, it is now too early to evaluate their effect on growth in Togo. The government has kept its official commitment to economic reforms. However, the macroeconomic situation worsened due to the instability of the socio-political environment. Fiscal deficit increased to 6.2% in the 1990s. Accumulation of arrears on civil servants' salaries and retired civil servants pension payments, on the one hand, and reduction of public investment, on the other hand, have caused contraction of aggregate demand and output. Partisan politics helped accelerate the public enterprises privatization program, which this very regime resisted in the 1980s when its time horizon was longer. RPT dignitaries were major shareholders in the newly privatized public enterprises. Politicization of the civil service and delays in the payment of salaries affected the performance of the administration Trade unions kept persistent pressure on the government through strikes that disturbed the functioning of the administration. The first concern of the population was political liberties. Apart from this request, the main demand of interest groups essentially related to access to public resources. Each interest group had its demands. Student organizations sought improved social benefits (housing, transportation, food, health care, etc.), and trade unions increased salaries.
Economic Performance 3/11/05 Page 27 of 40
Non-respect of human rights had adverse effects on the economy. The financial situation of the government worsened due to decline in aid. Aid from Bretton Woods institutions also decreased, following the unwillingness of the government to respect agreed upon programs and to service in a timely way its outstanding debt vis-à-vis these institutions. The dissatisfaction of these top two donors resulted in the sharp decline in external aid. The resources devoted to partisan politics decreased because of poor economic performance and suspension of international cooperation. However, strong demands from interest groups contributed to increase in government expenditure. Budget deficit rose from 2.84% of GDP in 1980-1990 to 6.5% of GDP in 1991-1998. The bulk of current government expenditure was allocated to payments of salary and transfers. Civil service wage bill reached 51% of fiscal revenue in 1999, which exceeded UEMOA ceiling of 35%. Public investment fell from 25% of GDP in the period 1980-1990 to 12.5% of GDP in 1991-1998. There had been an increase in public investment during the period of political crisis, a period during which the time horizon of political leaders was supposed to be shortened. Rational behavior would go against investment and other types of long-term commitment under such circumstances. However, in an environment characterized by bad governance, spending relating to investment gives opportunities for corruption. So, the corruption effect had offset the time horizon effect. In conclusion, this sub-period was dominated by political factors that have hampered economic performance. Changes in the domestic context and the international environment put unprecedented pressure on the government to affect move toward democracy. Throughout the 1990s, the population contested the regime openly even though the latter succeeded in hanging on power. Shortage of resources, in particular, reduced aid flows, made it difficult for the government to sustain its development policies. Social sectors were among the most affected by the situation. Shortening of political time horizon caused the political leadership to be less attentive to good economic management and governance issues. 6. Conclusion The Togolese economy has gone through ups and downs since independence in 1960. Performance was satisfactory in the 1960s and early 1970s but had worsened since the end of the 1970s. The difficulties started with the commodity shocks of the 1970s that caused strong swings in the terms of trade. First, the 1973-74 oil shock contributed to the recession of the mid-1970s. Second, the 1974-75 phosphate boom has had mixed effects on the economy. In particular, the unexpected increase in revenue it caused had induced the government into several policy mistakes including a spectacular increase in expenditure and extensive government interventions. The increased size of the public sector hampered the functioning of market institution and resulted in reduced efficiency. Productivity dropped and overall economic performance went onto a downward trend that the implementation of structural adjustment programs has not been able to reverse and that the socio-political crisis of the 1990s has helped consolidate. Indeed, the economic performance of Togo over the past forty years cannot be explained by a single factor. Accumulation of physical and human capital has not been determinant in the performance of the economy performance in part because of the inappropriateness of the

Economic Performance 3/11/05 Page 28 of 40
underlying investment policy. Political factors and economic policies have played determinant roles in the performance of the economy. Stability of economic and political environment is a prerequisite for good economic performance. Stability of political environment, in turn, requires a form of government that enjoys a broad-base support from the population and in which consensus, not conflict, should be sought in dealing with the issues facing the nation. The study also shows that the redistribution does impede growth. High growth rare was attained when no (weak) distribution took place in the sixties. Growth rate was weak with the start of distribution in the late 1970s. The economy experienced stagnation with the improvement of regional and ethnic based redistribution in the 1980s. When anticipated distribution took place with the doubt of the actual political elite to maintain power, the economy collapsed in the 1990s. Following this, it can be concluded that the prospects for the future are dependent on the way the government manages the current political crisis and respect, as a member country, the convergence criteria of UEMOA. Suitable solution to the crisis will stabilize political environment and reduce anticipated redistribution. This in turn will pave the way for resumption of cooperation with the international community. It will increase the opportunity for getting debt relief through HIPC initiatives. But up to now, the political crisis still remains. The improvement of economic policies will depend on the ability of UEMOA to play the role of agent of constraint. In fact, the member countries have to respect, since 2002, the criteria of convergence, which define limit on some economic aggregates. These criteria impose that budget has to be in equilibrium, inflation rate no more than 3%, debt to PIB ratio no more than 70% with no more arrears in debt servicing, wage bill will not exceed 35% of total public spending and domestic fund has to be no less than 20% of public investment. However, budget deficit exceeded 10% of GDP in 2002 (if proper account were taken of the increase in accumulation of arrears), which was a significant increase from 9.3% in 2001. As a result, the debt burden gets heavier and heavier; it has exceeded 100% of GDP for the past four years. Even though there are some improvements in 2003, the public finance situation is still fragile. This seemingly improvement has been achieved through exceptional financing (domestic arrears, bank financing and advances from public enterprises) and an increase of 14.2% of current expenditures compare to 16% decrease in public investment. Public investment which decreased by 17.4%, 16.9% and 5.7% in 1999, 2000 and 2001 remain very low: 17% of total public spending in the 1998-2002 period. Public investment from domestic sources is very low: 3% of fiscal revenue and civil servant salaries represent 40% of current public expenditures. For UEMOA to be an agent of constraint it must be able to implement sanction against member countries which did not respect the commitments. The experiences show that in the case of regional integration between developing countries, the institutions like UEMOA do not have the power to impose and implement sanctions against countries which violate the commitments. I the short run, the prospects of improvement of macroeconomic policies will not therefore come from the membership of the country in UEMOA. Schiff and Winter (2003), find that the credibility of policies of developing countries increases when their policies are lock in agreement in which developed countries are part of. Therefore, one can

Economic Performance 3/11/05 Page 29 of 40
expect the country to improve its economic policies with the Economic Partnership Agreement (EPA) which West African Countries are negotiating with European Union.

Economic Performance 3/11/05 Page 30 of 40
REFERENCES Afeikhena, J. and O. Olawade (1999), “Characteristics and Behaviour of African Commodity/Prodict Markets Institutions and their Consequences for Economic Growth.” Framework Paper for AERC Collaborative Research Project on “Explaining African Economic Growth Performance.” Baniganti K.R. and F. Lawson (1994), « Les indicateurs de protection, d’incitation et d’avantage comparatif: Méthodologie pour l’étude de l’industrie manufacturière du Togo”, mimeo, Université du Bénin Bates, R.H. and S. Devarajan (1999) “Political Economy of African Growth.” Framework Paper for AERC Collaborative Research Project on “Explaining African Economic Growth Performance”. Claessens, S., E. Detragiache, R. Kanbur and P. Wickham (1997), “HIPCs’ Debt Review of the Issues,” Journal of African Economies 6(2): 231-254. Cohen, D. (1993), “Two Notes on Economic Growth and the Solow Model,” Discussion Paper, No. 780, Center for Economic Policy Research, Oxford (June). Collier, P. and J.W. Gunning (1999), “Explaining African Economic Growth,” Journal of Economic Literature, 37: 64-111. Devarajan, S. et J. de Melo (1997), “Real Exchange Rate Misalignment in the CFA Zone” Journal of African Economies 6(1): 35-53. Devarajan, S. and J. de Melo (1987), “Evaluating Participation in African Monetary Unions: A Statistical Analisis of CFA Zone,” World Development 15 (4): 483-96. Dewatripont, M. and G. Roland (1992), “Economic Reform and Dynamic Political Constraints,” Review of Economic Studies, 59: 703-730. Evlo, K. (1997), “La Zone CFA et Performance Economique”, Annales de l’Université du Bénin, Série Droit et Sciences Economiques, 17: 81-122. Evlo, K. (1996), “Capital Humain et Croissance Economique au Togo : Une Extension du Modèle de Solow”, Annales de l’Université du Bénin, Série Droit et Sciences Economiques, Tome 16: 68-86. Fischer, S. (1993), “The Role of Macroeconomic Factors in Growth,” Journal of Monetary Economics 32: 485-512. Friedman, M. (1969), “The Role of Monetary Policy, " in Optimum Quantity of Money, and Other Essays, Hawthorn, New York: Aldine Publishing Company.
Economic Performance 3/11/05 Page 31 of 40
Friedman, M. et A. Schwarz (1971), A Monetary History of the United States 1867-1960, Princeton, New Jersey: Princeton University Press. Gogué, T. A. (2002), Cadre macroéconomique du Togo, PNUD, Lomé. Gogué, T. A. (1997), Public Spending in Sub Saharan Africa, AERC Senior Policy Seminar. Gogué, T. A. (1997), Impact des Programmes d’Ajustement Structurel (PAS) sur le Secteur de la Santé : cas du Togo, Nouvelles Pratiques Sociales. Gogué, T. A. (1996), Impact des PAS sur les Effectifs Scolaires au Togo, Revue Canadienne d’Etudes de Développement, Vol. xvii, 2. Keefer, Philip (2004) What does political economy tells us about development and vice versa? World Bank Policy Research Working Paper 3250 Krueger, A. (1974), “The Political Economy of the Rent-Seeking Society,” American Economic Review, 64(3): 291-303 Krugman, P. (1988), “Financing versus Forgiving a Debt Overhang,” Journal of Development Economics 29: 253-268. Nelson, J.M. (1984), “The Political Economy of Stabilization: Commitment, Capacity, and Public Response,” World Development, 12(10): 983-1006. O’Connell, S.A. and B.J. Ndulu (2000), “Africa’s Growth Experience: A Focus on Sources of Growth.” Framework Paper for AERC Collaborative Research Project on “Explaining African Economic Growth Performance.” Oyejide, A.T. (2000), “Markets and Economic Growth in Africa,” Framework Paper for AERC Collaborative Research Project on “Explaining African Economic Growth Performance.” Ojo, O. and T. Oshikoya (1995), “Determinants of Long-Term Growth: Some African Results,” Journal of African Economies 4(2): 163-191. Pindyck, R. (1991), “Irreversibility, Uncertainty and Investment,” Journal of Economic Literature, 29: 110-148. Rodrik, D. (1991), “Policy Uncertainty and Private Investment in Developing Countries,” Journal of Development Economics 36: 229-242. Schiff, Maurice and L. Alan Winters, 2003 Regional Integration and Development, World Bank.
Economic Performance 3/11/05 Page 32 of 40
World Bank (1994), Adjustment in Africa: Reforms, Results and the Road Ahead, New York: Oxford University Press. Young, A. (1992), “A Tale of Two Cities: Factor Accumulation and Technical Change in Hong Kong and Singapore,” NBER Macroeconomics Annual: 13-54. Young, A. (1993), “Substitution and Complementarity in Endogenous Innovation,” Quarterly Journal of Economics 108(3): 775-807.

Economic Performance 3/11/05 Page 33 of 40
ANNEX Graph 1 Official Assistance and net Private capital flows
US$ million
-50000000
0
50000000
100000000
150000000
200000000
250000000
300000000
1974 1975 1976 1977 1978 1979
APDFDI
APD: Official Development Assistance; FDI: Net Private Capital inflows Graph 2 Official Development Assistance and Loans from the World Bank and IDA
Millions of US$
0
50000000
100000000
150000000
200000000
250000000
300000000
350000000
400000000
450000000
1974
1976
1978
1980
1982
1984
1986
1988
1990
APDDMCERD
APD: Official Development Assistance; DMCRED: IBRD loans and IDA credit

Economic Performance 3/11/05 Page 34 of 40
Table 1 Estimated Residuals Based on Collins and Bosworth Coefficients Contribution Growth in Real of Education Contribution of Period GDP per Capita per Worker Capital per Worker Residual 1960-64 7.26 2.09 1.51 3.66 1965-69 5.35 1.88 1.72 1.75 1970-74 0.93 1.93 1.57 -2.57 1975-79 0.00 1.35 0.90 -2.25 1980-84 -1.28 0.31 0.19 -1.75 1985-89 0.67 0.08 0.04 0.55 1990-97 -0.96 0.02 0.01 -0.99 1960-97 1.71 1.09 0.85 -0.23
Table 2 Actual and Predicted Values of Sectoral Variables
Agriculture’s Share in GDP Industry’s Share in GDP Service Sector Share in GDP Period Actual Share
Fitted Share
Residual Actual Share
Fitted Share
Residual Actual Share
Fitted Share
Residual
1960-64 1965-69 1970-74 1975-79 1980-84 1985-89 1990-97
31.21 26.75 23.95 25.41 31.55 37.79
50.49 43.50 37.93 36.97 33.01 34.46 33.36
-12.29 -11.18 -13.03 -7.60 -2.91 4.43
18.10 18.33 22.30 20.94 20.26 20.87
0.62 5.57 10.01 9.95 12.63 10.50 10.67
12.53 8.32 12.35 8.31 9.76 10.21
50.69 54.92 53.76 53.65 48.20 41.34
48.89 50.94 52.06 53.08 54.36 55.04 55.97
-0.24 2.86 0.68 -0.71 -6.84 -14.63
Total 29.44 38.53 -7.10 20.13 8.56 10.25 50.43 52.91 -3.15 Source: Ndulu and O’Connor (2000) Background Information on Economic Growth Table 3 Actual and Predicted Values of Sectoral Variables
Manufacturing Share in GDP Agriculture’s Share in Labor force
Ratio of ALP in Non-agric to ALP in Agriculture
Period
Actual Share
Fitted Share
Residual Actual Share
Fitted Share
Residual Actual Share
Fitted Share
Residual
1960-64 1965-69 1970-74 1975-79 1980-84 1985-89 1990-97
8.20 8.14 7.49 9.44
-5.16 -3.57 -1.44 -1.46 -0.30 -1.03 -0.79
9.66 8.44 8.52 10.23
79.11 79.29 73.38 70.54 68.13 66.54
74.75 72.05 67.72 65.39 62.23 60.21 57.55
4.37 4.25 5.66 5.15 5.90 6.33
7.10 7.55 7.64 6.37 4.32
5.65 6.52 6.86 6.38 6.51 5.46 4.93
0.58 0.70 1.26 -9.14 -1.14
Total 8.32 -1.96 9.21 72.33 65.70 5.27 6.60 6.04 0,25 Source: Ndulu and O’Connor (2000) Background Information on Economic Growth
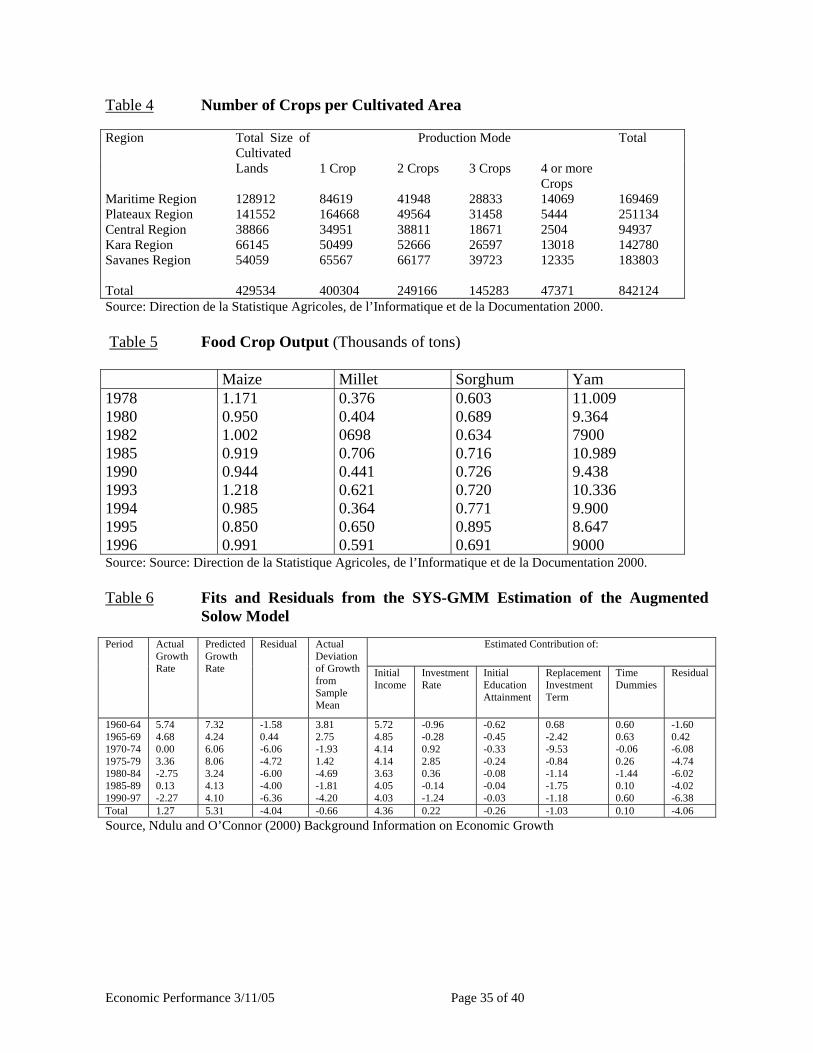
Economic Performance 3/11/05 Page 35 of 40
Table 4 Number of Crops per Cultivated Area
Production Mode
Region Total Size of Cultivated Lands
1 Crop 2 Crops 3 Crops 4 or more
Crops
Total
Maritime Region Plateaux Region Central Region Kara Region Savanes Region Total
128912 141552 38866 66145 54059 429534
84619 164668 34951 50499 65567 400304
41948 49564 38811 52666 66177 249166
28833 31458 18671 26597 39723 145283
14069 5444 2504 13018 12335 47371
169469 251134 94937 142780 183803 842124
Source: Direction de la Statistique Agricoles, de l’Informatique et de la Documentation 2000. Table 5 Food Crop Output (Thousands of tons) Maize Millet Sorghum Yam 1978 1980 1982 1985 1990 1993 1994 1995 1996
1.171 0.950 1.002 0.919 0.944 1.218 0.985 0.850 0.991
0.376 0.404 0698 0.706 0.441 0.621 0.364 0.650 0.591
0.603 0.689 0.634 0.716 0.726 0.720 0.771 0.895 0.691
11.009 9.364 7900 10.989 9.438 10.336 9.900 8.647 9000
Source: Source: Direction de la Statistique Agricoles, de l’Informatique et de la Documentation 2000. Table 6 Fits and Residuals from the SYS-GMM Estimation of the Augmented
Solow Model
Estimated Contribution of: Period Actual Growth Rate
Predicted Growth Rate
Residual Actual Deviation of Growth from Sample Mean
Initial Income
Investment Rate
Initial Education Attainment
Replacement Investment Term
Time Dummies
Residual
1960-64 1965-69 1970-74 1975-79 1980-84 1985-89 1990-97
5.74 4.68 0.00 3.36 -2.75 0.13 -2.27
7.32 4.24 6.06 8.06 3.24 4.13 4.10
-1.58 0.44 -6.06 -4.72 -6.00 -4.00 -6.36
3.81 2.75 -1.93 1.42 -4.69 -1.81 -4.20
5.72 4.85 4.14 4.14 3.63 4.05 4.03
-0.96 -0.28 0.92 2.85 0.36 -0.14 -1.24
-0.62 -0.45 -0.33 -0.24 -0.08 -0.04 -0.03
0.68 -2.42 -9.53 -0.84 -1.14 -1.75 -1.18
0.60 0.63 -0.06 0.26 -1.44 0.10 0.60
-1.60 0.42 -6.08 -4.74 -6.02 -4.02 -6.38
Total 1.27 5.31 -4.04 -0.66 4.36 0.22 -0.26 -1.03 0.10 -4.06 Source, Ndulu and O’Connor (2000) Background Information on Economic Growth
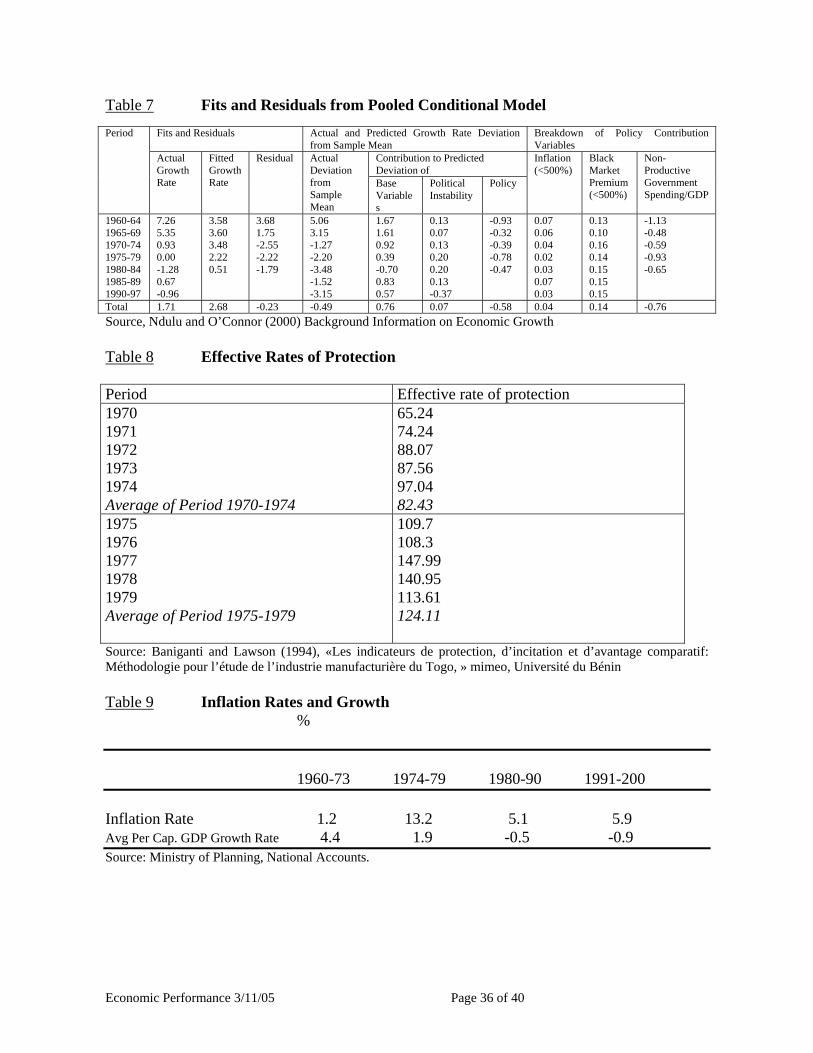
Economic Performance 3/11/05 Page 36 of 40
Table 7 Fits and Residuals from Pooled Conditional Model
Fits and Residuals Actual and Predicted Growth Rate Deviation from Sample Mean
Breakdown of Policy Contribution Variables
Contribution to Predicted Deviation of
Period
Actual Growth Rate
Fitted Growth Rate
Residual Actual Deviation from Sample Mean
Base Variables
Political Instability
Policy
Inflation (<500%)
Black Market Premium (<500%)
Non-Productive Government Spending/GDP
1960-64 1965-69 1970-74 1975-79 1980-84 1985-89 1990-97
7.26 5.35 0.93 0.00 -1.28 0.67 -0.96
3.58 3.60 3.48 2.22 0.51
3.68 1.75 -2.55 -2.22 -1.79
5.06 3.15 -1.27 -2.20 -3.48 -1.52 -3.15
1.67 1.61 0.92 0.39 -0.70 0.83 0.57
0.13 0.07 0.13 0.20 0.20 0.13 -0.37
-0.93 -0.32 -0.39 -0.78 -0.47
0.07 0.06 0.04 0.02 0.03 0.07 0.03
0.13 0.10 0.16 0.14 0.15 0.15 0.15
-1.13 -0.48 -0.59 -0.93 -0.65
Total 1.71 2.68 -0.23 -0.49 0.76 0.07 -0.58 0.04 0.14 -0.76 Source, Ndulu and O’Connor (2000) Background Information on Economic Growth Table 8 Effective Rates of Protection Period Effective rate of protection 1970 1971 1972 1973 1974 Average of Period 1970-1974
65.24 74.24 88.07 87.56 97.04 82.43
1975 1976 1977 1978 1979 Average of Period 1975-1979
109.7 108.3 147.99 140.95 113.61 124.11
Source: Baniganti and Lawson (1994), «Les indicateurs de protection, d’incitation et d’avantage comparatif: Méthodologie pour l’étude de l’industrie manufacturière du Togo, » mimeo, Université du Bénin Table 9 Inflation Rates and Growth % 1960-73 1974-79 1980-90 1991-200 Inflation Rate 1.2 13.2 5.1 5.9 Avg Per Cap. GDP Growth Rate 4.4 1.9 -0.5 -0.9 Source: Ministry of Planning, National Accounts.
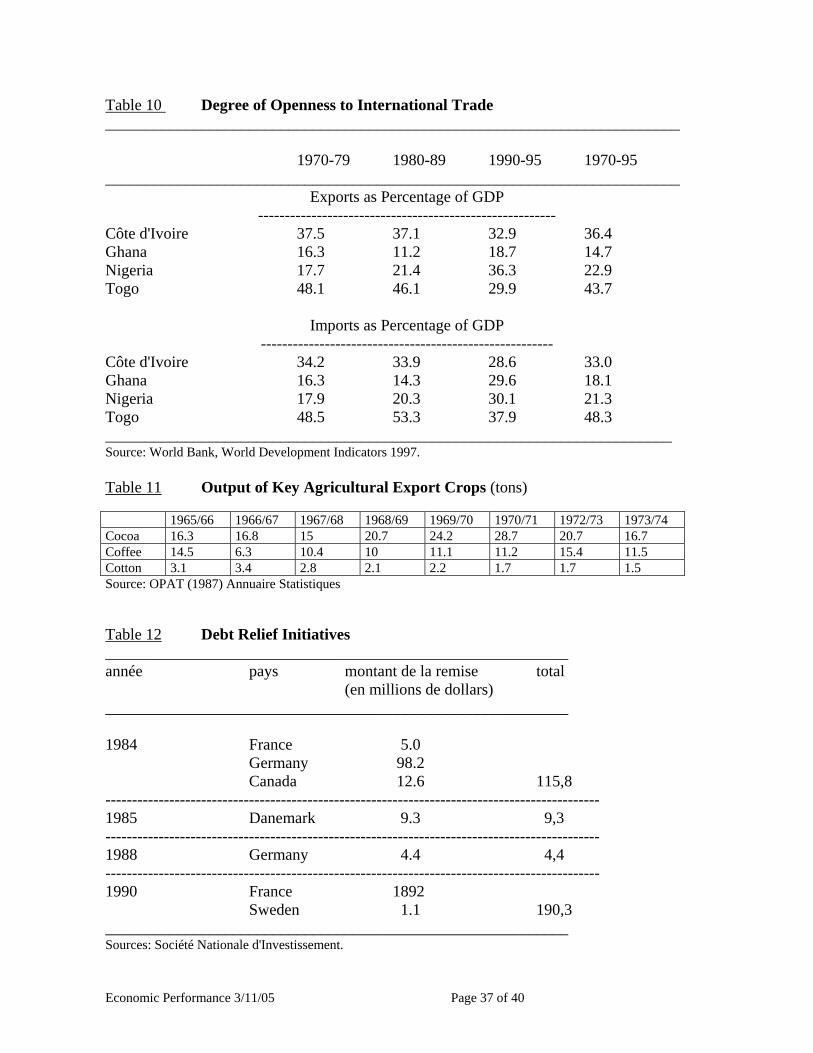
Economic Performance 3/11/05 Page 37 of 40
Table 10 Degree of Openness to International Trade ________________________________________________________________________
1970-79 1980-89 1990-95 1970-95 ________________________________________________________________________
Exports as Percentage of GDP --------------------------------------------------------
Côte d'Ivoire 37.5 37.1 32.9 36.4 Ghana 16.3 11.2 18.7 14.7 Nigeria 17.7 21.4 36.3 22.9 Togo 48.1 46.1 29.9 43.7
Imports as Percentage of GDP -------------------------------------------------------
Côte d'Ivoire 34.2 33.9 28.6 33.0 Ghana 16.3 14.3 29.6 18.1 Nigeria 17.9 20.3 30.1 21.3 Togo 48.5 53.3 37.9 48.3 _______________________________________________________________________ Source: World Bank, World Development Indicators 1997. Table 11 Output of Key Agricultural Export Crops (tons) 1965/66 1966/67 1967/68 1968/69 1969/70 1970/71 1972/73 1973/74 Cocoa 16.3 16.8 15 20.7 24.2 28.7 20.7 16.7 Coffee 14.5 6.3 10.4 10 11.1 11.2 15.4 11.5 Cotton 3.1 3.4 2.8 2.1 2.2 1.7 1.7 1.5 Source: OPAT (1987) Annuaire Statistiques Table 12 Debt Relief Initiatives __________________________________________________________ année pays montant de la remise total (en millions de dollars) __________________________________________________________ 1984 France 5.0 Germany 98.2 Canada 12.6 115,8 --------------------------------------------------------------------------------------------- 1985 Danemark 9.3 9,3 --------------------------------------------------------------------------------------------- 1988 Germany 4.4 4,4 --------------------------------------------------------------------------------------------- 1990 France 1892 Sweden 1.1 190,3 __________________________________________________________ Sources: Société Nationale d'Investissement.
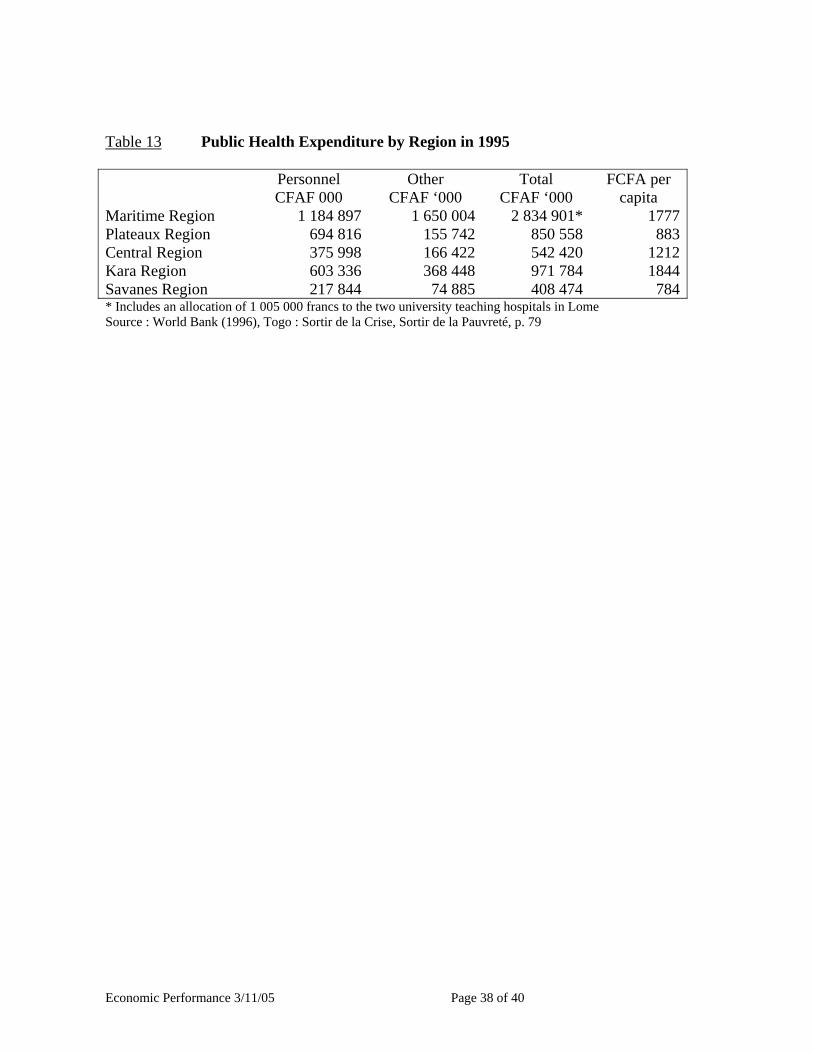
Economic Performance 3/11/05 Page 38 of 40
Table 13 Public Health Expenditure by Region in 1995
Personnel CFAF 000
Other CFAF ‘000
Total CFAF ‘000
FCFA per capita
Maritime Region Plateaux Region Central Region Kara Region Savanes Region
1 184 897694 816375 998603 336217 844
1 650 004155 742166 422368 44874 885
2 834 901* 850 558 542 420 971 784 408 474
1777883
12121844784
* Includes an allocation of 1 005 000 francs to the two university teaching hospitals in Lome Source : World Bank (1996), Togo : Sortir de la Crise, Sortir de la Pauvreté, p. 79

Performance Economique du Togo 3/11/05 Page 0 de 40