Embed Size (px)
Citation preview

Louisiana State UniversityLSU Digital Commons
LSU Doctoral Dissertations Graduate School
2010
Explaining and predicting suggested relationshipsbetween human social capital, citizen political trust,and citizen political engagementJames A. Gilmore, Jr.Louisiana State University and Agricultural and Mechanical College, [email protected]
Follow this and additional works at: https://digitalcommons.lsu.edu/gradschool_dissertations
Part of the Human Resources Management Commons
This Dissertation is brought to you for free and open access by the Graduate School at LSU Digital Commons. It has been accepted for inclusion inLSU Doctoral Dissertations by an authorized graduate school editor of LSU Digital Commons. For more information, please [email protected].
Recommended CitationGilmore, Jr., James A., "Explaining and predicting suggested relationships between human social capital, citizen political trust, andcitizen political engagement" (2010). LSU Doctoral Dissertations. 108.https://digitalcommons.lsu.edu/gradschool_dissertations/108
EXPLAINING AND PREDICTING SUGGESTED RELATIONSHIPS BETWEEN HUMAN
SOCIAL CAPITAL, CITIZEN POLITICAL TRUST, AND CITIZEN POLITICAL
ENGAGEMENT
A Dissertation
Submitted to the Graduate Faculty of
Louisiana State University and
Agricultural and Mechanical College
in partial fulfillment of the
requirements for the degree of
Doctor of Philosophy
in
The School of Human Resource Education and
Workforce Development
by
James A. Gilmore, Jr.
B.A., Southern University 1999
MPA, Louisiana State University, 2001
December 2010
ii
ACKNOWLEDGEMENTS
I must thank the Lord and Savior Jesus Christ for providing me with the opportunity to
achieve this milestone in my life.
To my phenomenal dissertation committee, Dr. Ed Holton (Chair), Dr. Geraldine
Johnson, Dr. Satish Verma, and Dr. Robert Hogan, thanks for sharing your knowledge and
expertise unselfishly.
I must give my sincerest gratitude to my father and mother, James and Gloria Gilmore,
for giving me life and for giving me the determination to succeed. To my grandparents, thanks
for serving as my guardian angels watching from heaven. To my sisters, the extended family
members, I appreciate the support, energy, and the enthusiasm that you have given me
throughout my life.
Finally, I must give special acknowledgement to Toni Harris, Marcus Davis, and Jason
Meyers. Each of you taught me discipline, the value of work and life balance, and reminded me
of my value to myself and others. Your unwavering friendship, guidance, and advice can never
be repaid.
iii
TABLE OF CONTENTS
ACKNOWLEDGMENTS ................................................................................................ ii
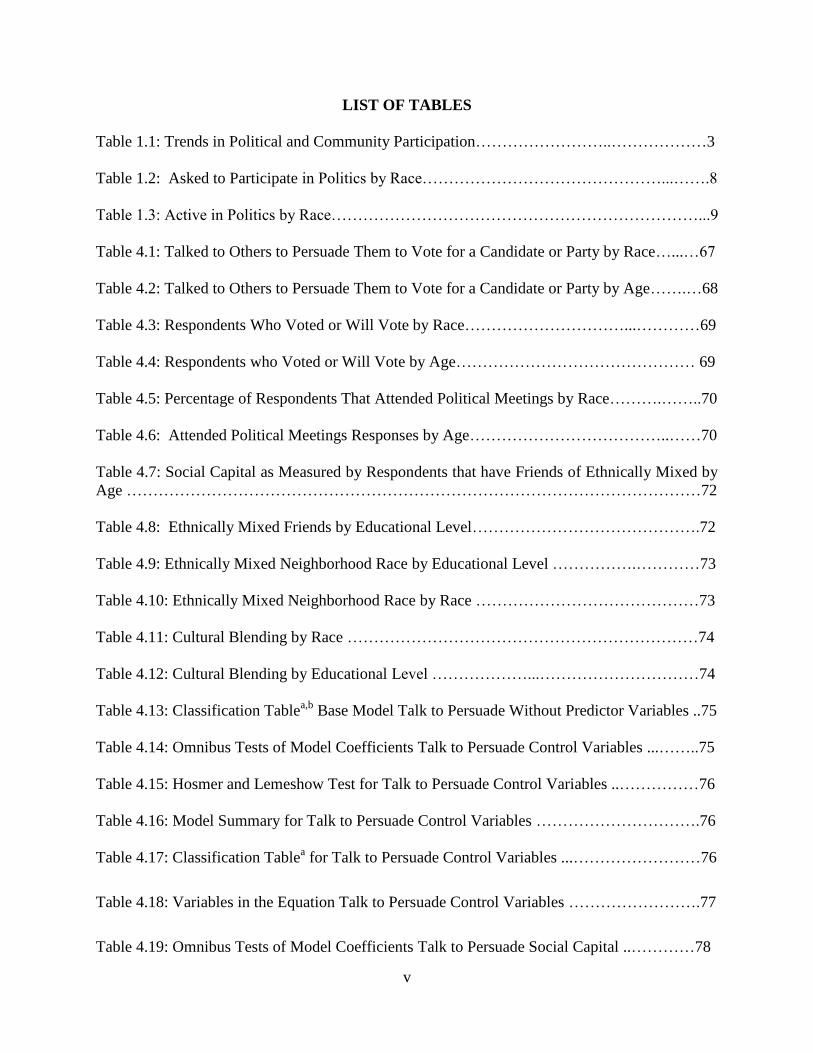
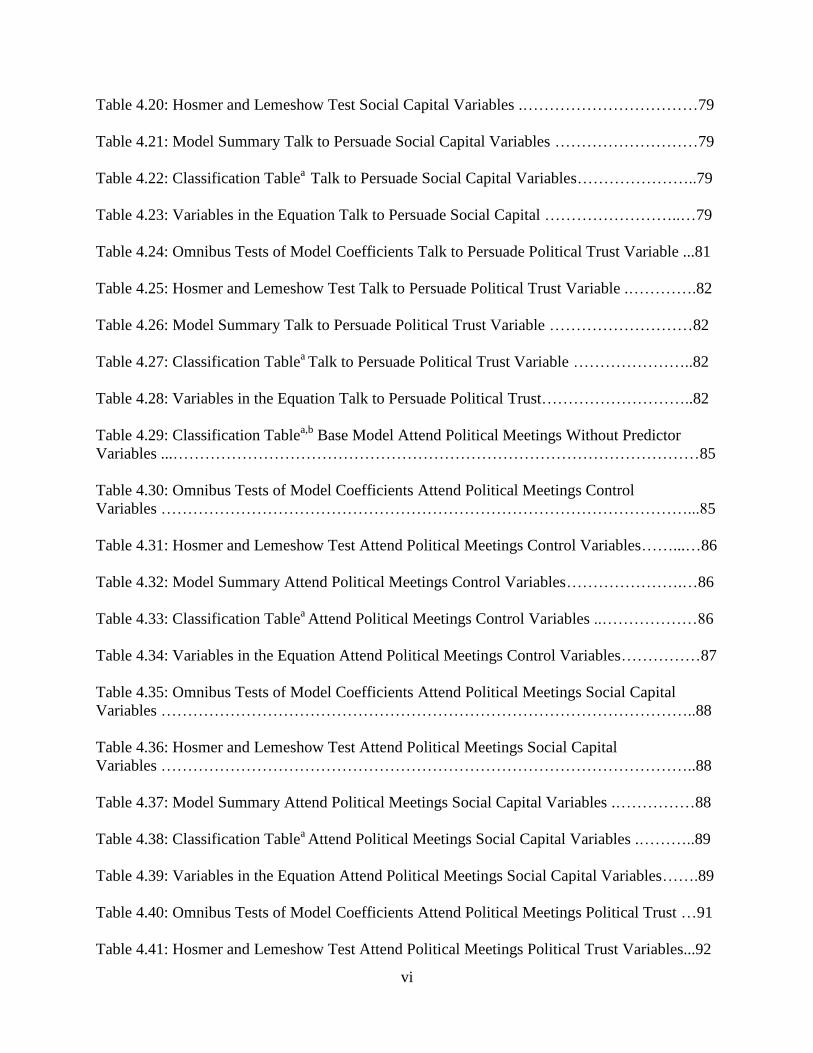
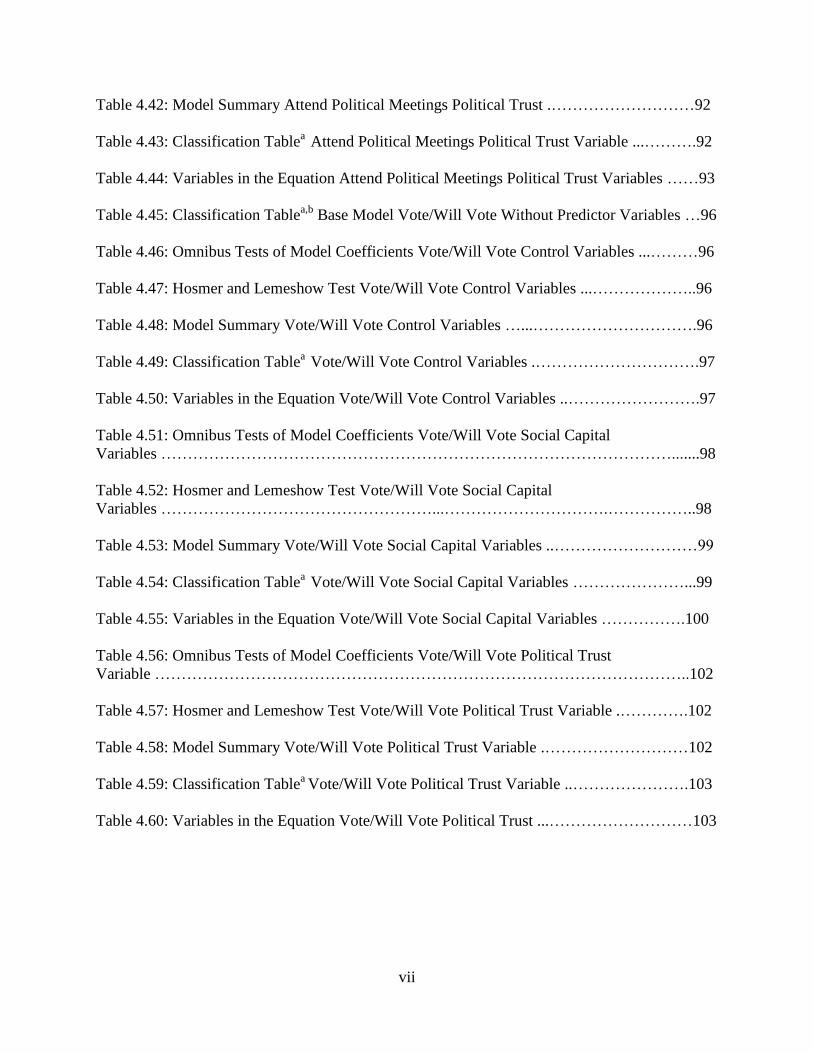
LIST OF TABLES………………………………………………………………………..v
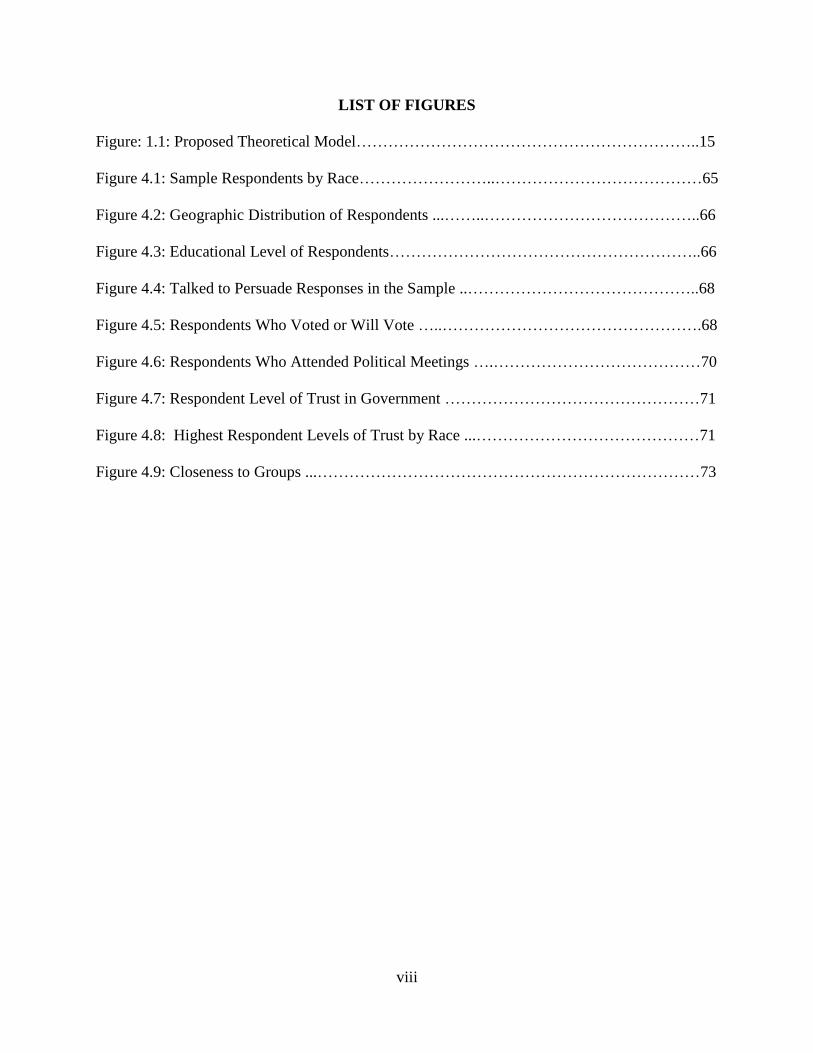
LIST OF FIGURES .............................................................. ………………………… viii
ABSTRACT ..................................................................................................................... ix
CHAPTER ONE: INTRODUCTION .…………………………………………………1
Political Engagement ………………………………………………………………2
Political Trust..……………………………………………………………………...3
Social Capital…………………………………………………………………….…5
Minority Political Participation……………………………………………………..8
Proposed Model ...................................................................................................... 10
Purpose.................................................................................................................... 16
Statement of the Research Problem ........................................................................ 17
Objectives ............................................................................................................... 17
Hypotheses .............................................................................................................. 18
Limitation of the Study ........................................................................................... 19
CHAPTER TWO: LITERATURE REVIEW ................................................................ 21
Political Engagement .............................................................................................. 21
Trust……………………………………………………………………………….32
Political Trust ……………………………………………………………………..34
Social Capital .......................................................................................................... 40
Literature Review Interpretations .......................................................................... 46
CHAPTER THREE: METHODOLOGY ...................................................................... 48
Data Used for This Study........................................................................................ 48
Instrument Reliability ............................................................................................. 48
Instrument Validity ................................................................................................. 48
Data Collection ……………………………………………………………………49
Statistical Methodology .......................................................................................... 50
Variables Used in the Study.................................................................................... 52
Data Analysis .......................................................................................................... 62
CHAPTER FOUR: RESULTS ....................................................................................... 65
Characteristics of Sample ....................................................................................... 65
Summary of Objectives .......................................................................................... 66
Hypotheses Testing ................................................................................................. 74
CHAPTER FIVE: CHARACTERISTICS OF DATASET, INTERPRETATIONS,
CONCLUSIONS, IMPLICATIONS AND RECOMMENDATIONS ................. 106
iv
Characteristics of the Dataset ............................................................................... 106
Interpretations of Key Findings ............................................................................ 108
Summary of Interpretations .................................................................................. 112
Further Research ................................................................................................... 113
Implications for Human Resource Development.................................................. 119
Conclusion ............................................................................................................ 122
REFERENCES ........................................................................................................... ..124
VITA ………………………………………………………………………………….130
v
LIST OF TABLES
Table 1.1: Trends in Political and Community Participation……………………..………………3
Table 1.2: Asked to Participate in Politics by Race………………………………………...…….8
Table 1.3: Active in Politics by Race……………………………………………………………...9
Table 4.1: Talked to Others to Persuade Them to Vote for a Candidate or Party by Race…...…67
Table 4.2: Talked to Others to Persuade Them to Vote for a Candidate or Party by Age…….…68
Table 4.3: Respondents Who Voted or Will Vote by Race…………………………...…………69
Table 4.4: Respondents who Voted or Will Vote by Age……………………………………… 69
Table 4.5: Percentage of Respondents That Attended Political Meetings by Race……….……..70
Table 4.6: Attended Political Meetings Responses by Age………………………………..……70
Table 4.7: Social Capital as Measured by Respondents that have Friends of Ethnically Mixed by
Age ………………………………………………………………………………………………72
Table 4.8: Ethnically Mixed Friends by Educational Level…………………………………….72
Table 4.9: Ethnically Mixed Neighborhood Race by Educational Level …………….…………73
Table 4.10: Ethnically Mixed Neighborhood Race by Race ……………………………………73
Table 4.11: Cultural Blending by Race …………………………………………………………74
Table 4.12: Cultural Blending by Educational Level ………………...…………………………74
Table 4.13: Classification Tablea,b
Base Model Talk to Persuade Without Predictor Variables ..75
Table 4.14: Omnibus Tests of Model Coefficients Talk to Persuade Control Variables ...……..75
Table 4.15: Hosmer and Lemeshow Test for Talk to Persuade Control Variables ..……………76
Table 4.16: Model Summary for Talk to Persuade Control Variables ………………………….76
Table 4.17: Classification Tablea for Talk to Persuade Control Variables ...……………………76
Table 4.18: Variables in the Equation Talk to Persuade Control Variables …………………….77
Table 4.19: Omnibus Tests of Model Coefficients Talk to Persuade Social Capital ..…………78
vi
Table 4.20: Hosmer and Lemeshow Test Social Capital Variables .……………………………79
Table 4.21: Model Summary Talk to Persuade Social Capital Variables ………………………79
Table 4.22: Classification Tablea
Talk to Persuade Social Capital Variables…………………..79
Table 4.23: Variables in the Equation Talk to Persuade Social Capital ……………………..…79
Table 4.24: Omnibus Tests of Model Coefficients Talk to Persuade Political Trust Variable ...81
Table 4.25: Hosmer and Lemeshow Test Talk to Persuade Political Trust Variable .………….82
Table 4.26: Model Summary Talk to Persuade Political Trust Variable ………………………82
Table 4.27: Classification Tablea Talk to Persuade Political Trust Variable …………………..82
Table 4.28: Variables in the Equation Talk to Persuade Political Trust………………………..82
Table 4.29: Classification Tablea,b
Base Model Attend Political Meetings Without Predictor
Variables ...………………………………………………………………………………………85
Table 4.30: Omnibus Tests of Model Coefficients Attend Political Meetings Control
Variables ………………………………………………………………………………………...85
Table 4.31: Hosmer and Lemeshow Test Attend Political Meetings Control Variables……...…86
Table 4.32: Model Summary Attend Political Meetings Control Variables………………….…86
Table 4.33: Classification Tablea Attend Political Meetings Control Variables ..………………86
Table 4.34: Variables in the Equation Attend Political Meetings Control Variables……………87
Table 4.35: Omnibus Tests of Model Coefficients Attend Political Meetings Social Capital
Variables ………………………………………………………………………………………..88
Table 4.36: Hosmer and Lemeshow Test Attend Political Meetings Social Capital
Variables ………………………………………………………………………………………..88
Table 4.37: Model Summary Attend Political Meetings Social Capital Variables .……………88
Table 4.38: Classification Tablea Attend Political Meetings Social Capital Variables .………..89
Table 4.39: Variables in the Equation Attend Political Meetings Social Capital Variables…….89
Table 4.40: Omnibus Tests of Model Coefficients Attend Political Meetings Political Trust …91
Table 4.41: Hosmer and Lemeshow Test Attend Political Meetings Political Trust Variables...92
vii
Table 4.42: Model Summary Attend Political Meetings Political Trust .………………………92
Table 4.43: Classification Tablea
Attend Political Meetings Political Trust Variable ...……….92
Table 4.44: Variables in the Equation Attend Political Meetings Political Trust Variables ……93
Table 4.45: Classification Tablea,b
Base Model Vote/Will Vote Without Predictor Variables …96
Table 4.46: Omnibus Tests of Model Coefficients Vote/Will Vote Control Variables ...………96
Table 4.47: Hosmer and Lemeshow Test Vote/Will Vote Control Variables ...………………..96
Table 4.48: Model Summary Vote/Will Vote Control Variables …...………………………….96
Table 4.49: Classification Tablea
Vote/Will Vote Control Variables .………………………….97
Table 4.50: Variables in the Equation Vote/Will Vote Control Variables ..…………………….97
Table 4.51: Omnibus Tests of Model Coefficients Vote/Will Vote Social Capital
Variables …………………………………………………………………………………….......98
Table 4.52: Hosmer and Lemeshow Test Vote/Will Vote Social Capital
Variables ……………………………………………...………………………….……………..98
Table 4.53: Model Summary Vote/Will Vote Social Capital Variables ..………………………99
Table 4.54: Classification Tablea
Vote/Will Vote Social Capital Variables …………………...99
Table 4.55: Variables in the Equation Vote/Will Vote Social Capital Variables …………….100
Table 4.56: Omnibus Tests of Model Coefficients Vote/Will Vote Political Trust
Variable ………………………………………………………………………………………..102
Table 4.57: Hosmer and Lemeshow Test Vote/Will Vote Political Trust Variable .………….102
Table 4.58: Model Summary Vote/Will Vote Political Trust Variable .………………………102
Table 4.59: Classification Tablea Vote/Will Vote Political Trust Variable ..………………….103
Table 4.60: Variables in the Equation Vote/Will Vote Political Trust ...………………………103
viii
LIST OF FIGURES
Figure: 1.1: Proposed Theoretical Model………………………………………………………..15
Figure 4.1: Sample Respondents by Race……………………..…………………………………65
Figure 4.2: Geographic Distribution of Respondents ...……..…………………………………..66
Figure 4.3: Educational Level of Respondents…………………………………………………..66
Figure 4.4: Talked to Persuade Responses in the Sample ..……………………………………..68
Figure 4.5: Respondents Who Voted or Will Vote …..………………………………………….68
Figure 4.6: Respondents Who Attended Political Meetings ….…………………………………70
Figure 4.7: Respondent Level of Trust in Government …………………………………………71
Figure 4.8: Highest Respondent Levels of Trust by Race ...……………………………………71
Figure 4.9: Closeness to Groups ...………………………………………………………………73
ix
ABSTRACT
The United States of America was built on the foundation of a representative democracy.
Citizens engage in various political activities to elect representation to create policies and
programs that may benefit individuals, groups of individuals, and special interests. A citizen‘s
type of political engagement and level of political engagement may be influenced by the
individual and group resources a citizen possesses, as well as the citizen‘s level of trust in
government to respond to their individual or group needs.
This study contributes to the literature on political engagement by suggesting factors that
predict political engagement in the United States. The goal of this study was to explore
predictors of political engagement in the United States. Data from the National Politics Survey
2004 was used to analyze and interpret findings related to the nine hypotheses in this study.
Survey items were selected from the survey to measure political trust, social capital, and political
engagement. Citizen level of trust in the national government was used to measure political
trust. Individual and group resource variables such as income, educational level, ethnic mix of
friends, ethnic mix of neighborhood, closeness of ideas and interests to people, and maintaining
or blending cultures were used to measure social capital. Three dependent variables were used to
measure political engagement; voting, talking to others to persuade them to vote for or against a
party or candidate, and attending a political rally in support of a particular candidate. Each
dependent variable was measured separately against the independent variables in a hierarchical
regression analysis.
The results indicated that certain Socioeconomic Status variables, social capital variables,
and the political trust variable failed to meaningfully predict citizen political engagement related
to voting and attending political meetings or rallies, and had minimal meaningful predictability

x
to talking to others to persuade citizens to vote for a specific party or candidate. The results also
indicated noteworthy biases in the dataset that contributed to the model‘s inability to
meaningfully predict political engagement based on the variables suggested in this study.
1
CHAPTER ONE: INTRODUCTION
Across the United States of America, thousands of local, state, and nationally elected
officials and government agencies function to serve the needs of every American citizen,
regardless of race, creed, color, or socioeconomic status. Elected officials often impose personal
beliefs while creating laws and policies that govern government agencies. As government
agencies design and administer programs to serve citizens, often times input from citizens is
minimal or nonexistent. In the United States, citizens are born with the freedom to advocate for
or against government policies and programs and vote based on their own personal beliefs and
attitudes towards government agencies and elected officials without legal repercussions from
government agencies or elected officials. These inalienable rights are given to Americans
through the Declaration of Independence and the Constitution of the United States.
Candidates vying for political offices campaign to persuade eligible and registered voters
to support their political platform or belief system. Months prior to an election, political
consultants, public policy experts, research think-tanks, lobbyists, and political action groups
debate issues through media advertisements and published reports to increase citizen awareness
about a candidate‘s policy preferences on issues. The behaviors in which citizens exercise their
own beliefs systems and opinions towards these candidates and issues are defined as political
engagement. Political engagement may include activities such as lobbying, voting, contributing
to a campaign, volunteering on a campaign, signing a petition, or any other form of individual or
organized engagement in politics. Putnam (2000) reveals stagnated growth and even declines in
various forms of civic and political engagement during a twenty to thirty year period in history.
―American democracy is at risk. The risk comes not from some external threat but from
disturbing internal trends: an erosion of the activities and capacities of citizenship.
2
Americans have turned away from politics and the public sphere in large numbers, leaving
our civic life impoverished. Citizens participate in public affairs less frequently, with less
knowledge and enthusiasm, in fewer venues, and less equally than is healthy for a vibrant
Democratic polity‖ (Macedo, Alex-Assensoh, Berry, Brintnall, Campbell, Fraga, Fung,
Galston, Karpowitz, Levi, Levinson, Lipsitz, Niemi, Putnam, Rahn, Reeves, Reich, Rodgers,
Swanstrom, Walsh, 2005, p.1).
Political Engagement
Various factors motivate citizens to become politically active. Political engagement
literature mostly describes the demographic and economic make-up of politically engaged
citizens but lacks in explaining the individual and group social factors that influence citizen
political engagement. Shah, Mcleod, and Yoon (2001) argue that the social structure of a society
influences citizen participation in politics. Socioeconomic status, as defined by education,
income, homeownership, etc. is often described in the literature to have an effect on citizen
political engagement (Smith, Schlozman, Verba, & Brady, 2009; Timpone, 1998). Education
has especially been found to have a positive effect on political engagement among minorities
(Farmer, 2006). The higher an individual‘s educational level, the more likely they will engage in
politics. Shah, Mcleod, & Yoon (2001) reveal that education, income, age, and gender are all
factors that influence citizen political engagement. Other factors that influence citizen political
engagement, excluding race and socio economic status, may include personal and political self-
efficacy, social trust, political trust, and social capital (Sekou, 2008; Mishler & Rose, 2005);
Kwak, Shah, Holbert, 2004).
The Roper Social and Political Trends Survey (1973-1994) (See Table 1.1) revealed that
all forms of civic engagement listed in the survey were on the decline, as examined by Putnam

3
(2000). ―Dramatic declines in traditional forms of civic participation over the past 30 years as
reported by Robert Putnam (Putnam, 1995a, in press) potentially pose a threat to the fabric of
American society‖ (Scheufele & Shah, 2000, p. 108).
Table 1.1: Trends in political and community participation
Relative change 1973-74 to 1993-94
Served as an officer of some club or organization -42%
Worked for a political party -42%
Served on a committee for some local
organization -39%
Attended a public meeting on town or school
affairs -35%
Attended a political rally or speech -34%
Participated in at least one of these twelve
activities -25%
Made a speech -24%
Wrote a congressman or senator -23%
Signed a petition -22%
Was a member of some "better government"
group -19%
Held or ran for political office -16%
Wrote a letter to the paper -14%
Wrote an article for a magazine or newspaper -10%
From BOWLING ALONE by Robert D. Putnam. Copyright © 2000 by Robert D. Putnam. Used
by permission of Simon & Schuster, Inc. All rights reserved
―A large body of research maintains that there is a long-term decline in virtually all forms
of political activity (Hibbing & Theiss-Morse, 2002; Macedo, S., et al, 2005; Putnam, 2000;
Rosenstone & Hansen, 1993; Wattenberg, 2006)‖ Dalton (2008 p. 89).
Political Trust
―There is no shortage of pundits and political analysts who proclaim that too few of us
are voting, we are disconnected from our fellow citizens, we lack social capital and we are losing
faith in our government (e.g. Craig, 1996; Dionne, 1991; Hibbing and Theiss-Morse, 2002;
Wattenberg, 2002)‖ (Dalton, 2008, p. 77). A Pew Research Center Study (2010) revealed that a
4
mere 22% of Americans surveyed indicated that they trust government ‗almost always‘ or ‗most
of the time.‘ Literature demonstrates the value of political trust to sustaining a democratic
government. Hetherington (1998) cited Stokes (1962) and Miller (1976b) by defining political
trust as an evaluation of how government is operating according to the expectations of citizens.
―Trust evaluations may be traced to citizen perceptions that politicians lack integrity (Lipset and
Schneider, 1987; Black and Black, 1994), make decisions inefficiently, or are too easily
influenced by special interests (Blendon et al., 1997)‖ (Gershtenson & Plane, 2007 p. 5).
Mishler & Rose (2005) argue that the system of government as a whole shapes citizen trust
perceptions of government, especially as it relates to the (un)ethical behaviors of the appointed
and elected officials in government who are making decisions and engaging in unethical
behaviors when making decisions. Hetherington & Golobetti (2002) cited (Citrin, 1974; Miller,
1974) in suggesting a need for further explorations into the consequences of political trust.
―A democratic society is unlikely to emerge without political trust (Dahl, 1971). Trust
makes everyday life easier, less complex, and more orderly-increasing democratic stability and
lowering citizen angst (Barber, 1983). In addition, trust increases voluntary compliance with
laws, without which democratic government would be untenable (Tyler, 1990; Tyler & Degoey
1995; Levi 1997; Scholz & Lubell 1998)‖ (Gershtensen & Plane, 2007, p. 1).
A review of literature reveals that research as it relates to the more social influences of
political engagement is understudied and literature related to the influence political trust has on
political engagement most often focuses on periods of social and civil unrest such as the civil
rights movement, women‘s rights movement, and the level of trust and satisfaction citizens
possess after the attacks on September 11, 2001. During the 1950s and 1960s citizen
participation in campaign activities was at an all time high, yet participation began to decline
5
after 1968 ―hitting an all time low‖ in 1996 (Putnam, 2000 p. 38). Levi & Stoker (2000) discuss
two theories related to trustworthiness in elected officials and government that are factors which
motivate citizens to become politically engaged or disengaged: 1) individuals who trust
government engage in politics more often than those who do not trust government, and 2)
individuals who support and trust government are active in politics to ensure that the current
system of government in place continues. Levi & Stoker (2000) also argue that distrust in an
elected official or the government system as a whole may motivate individuals to become
engaged or disengaged in politics. For example, citizens that become distrustful of government
may become politically engaged to change the current system of government and elect new
leadership to manage government. Distrustful citizens may feel as if government is inherently
corrupt, inefficient, or works only on behalf of a certain population of people, such as the
wealthy or poor, and therefore these citizens find no reason to actively engage in supporting
government, electing government officials, or holding government accountable. Citizens who do
not trust government may choose not to engage because of their personal belief that government
will never change and that they, as individuals, are incapable of influencing government. After a
review of literature, there are many researchers that support these theories related to citizen trust
and distrust (Abravanel & Busch, 1975; Schneider, 2007; Stolle, Hooghe, and Micheletti, 2005).
Social Capital
Another factor that influences citizen engagement in politics is social capital. There are
several aspects to social capital which make it challenging to define and measure. Putnam (2000)
describes social capital as the development of trust, networks, understanding of other traditions,
and norms of society that result in connections that foster relationships and mutual benefits.
Bourdieu (1986) defined social capital in five dimensions: networks, reciprocity, trust, social
6
norms, personal and collective efficacy.
The literature on social capital (Putnam, 2003; Sekou, 2008) describes antecedents or
categories of social capital as ‗individual or group level resources‘. Individual level resources
might include self efficacy, income, and education. Group level resources might include
membership and participation in social, political, and other types of organizations, events, and
the connections, trust, traditions, norms, and relationships that develop as a result of participating
in these groups. Putnam (2000) cited the results of the Roper Survey and the American Use of
Time Survey to present data related to networking trends in social settings among Americans.
The results (Putnam, 2000) reveal that the percentage of time Americans spent in social settings
dropped from 65 percent to 39 percent between 1965 and 1995.
―Group-level resources are particularly important because they provide the foundation
societies need to build social capital (Putnam, 2000)‖ (Sekou, 2008 p. 6). Participating in the
development and execution of a public march, campaign rally, or voter registration drive would
be considered a group- level resource that helps build social capital. ―Those involved in
associational activities are even more likely to become civic participants when they hold trusting
attitudes toward others‖ (Kwak, Shah, Holbert, 2004 p. 643).
The social capital resource-based approach supports theories related to factors that
influence citizen political engagement. The resource-based approach to social capital (Sekou,
2008), theorizes that income and education, coupled with a social network, are a catalyst to
political engagement. These factors provide citizens with the resources necessary to gain
knowledge, build trust, and enhance personal political self-efficacy. Education, as an individual
resource, provides citizens with the knowledge necessary to understand how policies are created
through various branches of government, and educates citizens on the rights and privileges they
7
are given to influence public policy and hold government officials accountable. Income, as an
individual resource, provides citizens with the resources necessary to financially support
organizations and individuals (i.e. political candidates) that align with the political ideologies of
a citizen or groups of citizens. ―Individual-level resources are thought to increase the likelihood
that one will possess the skills, time, knowledge, and attitudes needed to effectively engage in
politics (Verba & Nie 1972; Milbrath & Goel, 1977; Rosenstone & Hansen, 2003; Verba,
Schlozman, & Brady, 1995). Meanwhile, group-level resources are thought to increase the
likelihood that people will be active in politics by, for example, enhancing one‘s civic skills –
such as, the ability to organize and run a meeting (Verba and Nie 1972; Shingles 1981; Miller
1982; Tate 1994)‖ (Sekou, 2008, pg 5).
The social capital literature focuses heavily on the positive benefits that social capital
brings to individuals and groups of individuals who are connected to social or cultural
organizations and affiliations, yet these studies lack an in-depth focus on political organizations
and affiliations. Further exploration should be performed to examine the positive and negative
effects of social capital as it relates to citizen engagement in politics and citizens‘ ability to
influence politics.
Putnam‘s research (2000) demonstrates that citizens are spending less time with family
and friends, and even less time seeking networks outside of family and friends. ―We generally
do not spend enough time in civic groups or informal social settings with people who are
different from ourselves and, if there is any causal flow at all, it is from trust to civic engagement
rather than the other way around‖ (Uslaner & Conley, 2003 pg 352). In other words, Uslaner &
Conley (2003) believe that citizens do not gain trust by participating in political or civic
activities, but rather that trust must come first and then citizens will choose to engage in social
8
activities. Putnam (2000) proclaims that political disengagement may be a result of decreasing
social capital.
Minority Political Participation
―Democracy could not survive unless citizens continued to participate actively, joining
with others of similar mind and interest to address matters of common concern, (Tocqueville,
1969)‖ (Smidt, 1999 p. 177). A disengaged population whose needs are often not heard are
often not addressed. The Annie Casey Foundation published a fact sheet entitled Race Matters:
Unequal Opportunities for Civic Participation (Annie Casey Foundation, 2006) that cited
findings from a study conducted by Verba, Schlozman, & Brady (1995). The fact sheet indicated
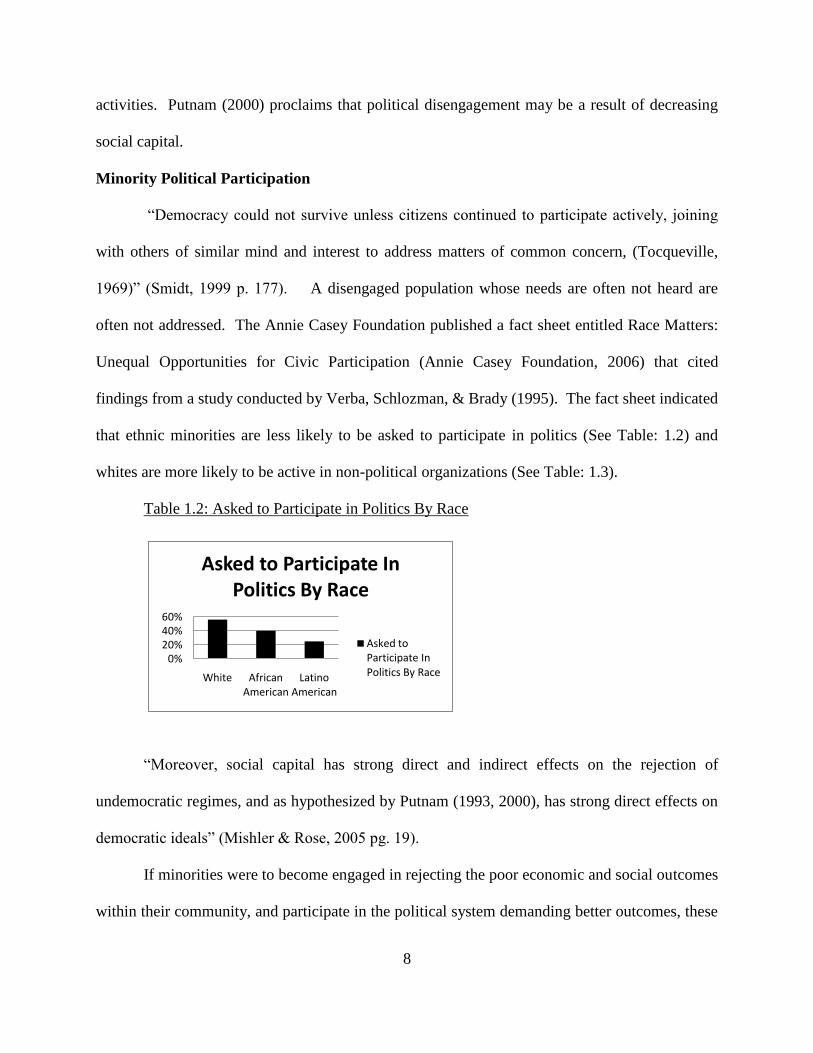
that ethnic minorities are less likely to be asked to participate in politics (See Table: 1.2) and
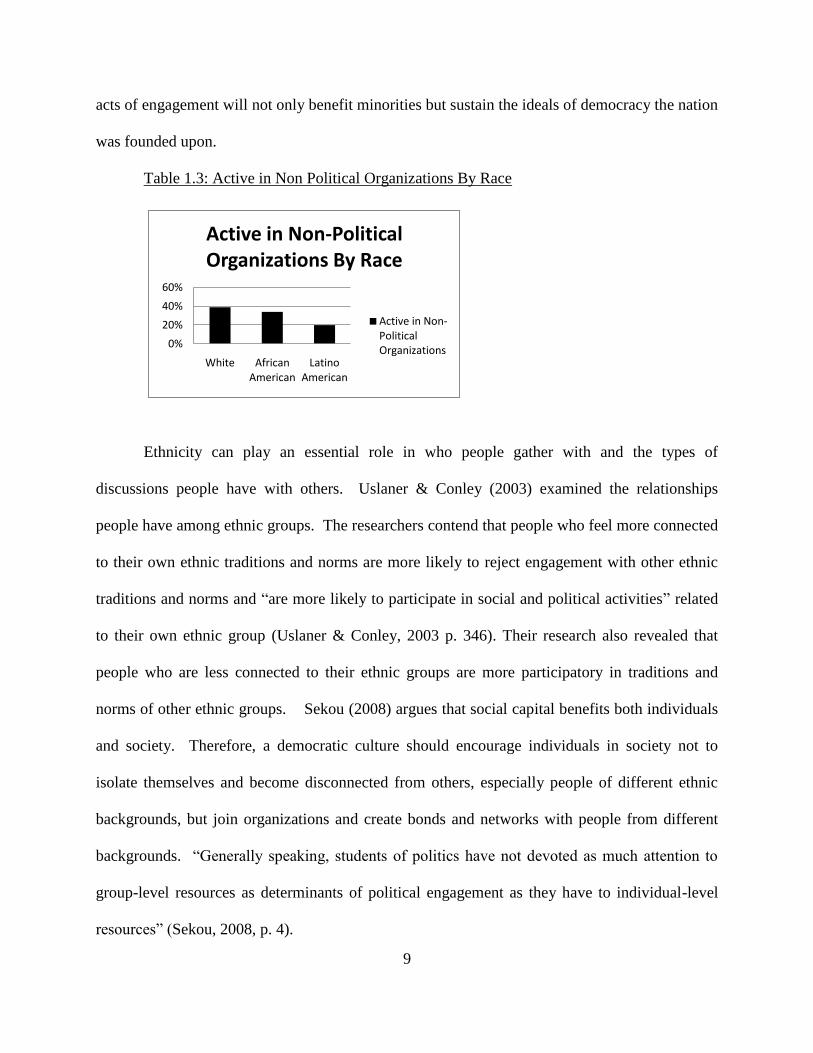
whites are more likely to be active in non-political organizations (See Table: 1.3).
Table 1.2: Asked to Participate in Politics By Race
0%20%40%60%
White African American
Latino American
Asked to Participate In Politics By Race
Asked to Participate In Politics By Race
―Moreover, social capital has strong direct and indirect effects on the rejection of
undemocratic regimes, and as hypothesized by Putnam (1993, 2000), has strong direct effects on
democratic ideals‖ (Mishler & Rose, 2005 pg. 19).
If minorities were to become engaged in rejecting the poor economic and social outcomes
within their community, and participate in the political system demanding better outcomes, these
9
acts of engagement will not only benefit minorities but sustain the ideals of democracy the nation
was founded upon.
Table 1.3: Active in Non Political Organizations By Race
0%
20%
40%
60%
White African American
Latino American
Active in Non-Political Organizations By Race
Active in Non-Political Organizations
Ethnicity can play an essential role in who people gather with and the types of
discussions people have with others. Uslaner & Conley (2003) examined the relationships
people have among ethnic groups. The researchers contend that people who feel more connected
to their own ethnic traditions and norms are more likely to reject engagement with other ethnic
traditions and norms and ―are more likely to participate in social and political activities‖ related
to their own ethnic group (Uslaner & Conley, 2003 p. 346). Their research also revealed that
people who are less connected to their ethnic groups are more participatory in traditions and
norms of other ethnic groups. Sekou (2008) argues that social capital benefits both individuals
and society. Therefore, a democratic culture should encourage individuals in society not to
isolate themselves and become disconnected from others, especially people of different ethnic
backgrounds, but join organizations and create bonds and networks with people from different
backgrounds. ―Generally speaking, students of politics have not devoted as much attention to
group-level resources as determinants of political engagement as they have to individual-level
resources‖ (Sekou, 2008, p. 4).
10
Hero (2003) argues that a weakness in social capital research is its lack of contributing
knowledge about the benefits, as well as detriments of social capital, especially among
minorities. Instead, much of the social capital research describes various characteristics of
social capital people possess and lack detail about the relationships and the benefits that accrue
from the relationships, especially as it relates to race and social capital. The author contends that
social-capital researchers underestimate the ―importance of race and ethnicity‖ in their studies
Hero, 2003 p. 120). Research related to social capital focuses ―almost entirely on aggregate
outcomes and absolute‖ gains (Hero, 2003, p. 113). Hero‘s (2003) assessment of Putnam‘s
(1990) social capital index revealed that social capital can have a negative effect on minorities
where whites are the majority and possess high levels of social capital. Sekou (2008) also agrees
with Putnam‘s (1990) findings that states with high social capital tend to have poor social,
health, and economic outcomes for minorities.
Proposed Model
Related literature on political involvement (Hero, 2003; Kwak, Shah; Leighley & Nagler,
2007; & Holbert, 2004) presents a need for further study of antecedents to political engagement.
This study examines social capital characteristics related to ethnicity, neighborhood
characteristics, and norms as identified through cultural beliefs (Adler & Kwon, 2002; Coleman,
1987; Coleman, 1988; McDonald, Lin, & Ao, 2009; Xu, Perkins, & Chow, 2010). This study
also examines political trust (Coleman, 1988; Dahl, 1971) and ties in social networks
(Granovetter, 1973; Lin, 1999) as antecedents or predictors of political engagement. The model
in this study has not been used in studies about factors that predict citizen political engagement
(See Figure 1.1). Variables such as socioeconomic status, citizen political orientations, and
citizen political efficacy are over-studied in literature related to political engagement. This study

11
adds value to political engagement literature by suggesting other factors such as social capital
and political trust that may predict citizen political engagement.
Social Capital
Social capital has many elements that can be beneficial or detrimental to society.
Granovetter (1973) explains that social networks and interpersonal ties can lead to social action
such as political engagement, assuming the ties are positive and symmetric. Putnam‘s (2003)
research on social capital demonstrates strong direct effects of social capital on involvement in
politics.
Social resources theory (Lin, 1999) describes social capital antecedents as personal
resources and social resources. Putnam (2003) describes social capital resources in a very
similar fashion as individual and group resources. Individual resources such as education,
income, gender, marital status, and race are resources that provide individuals with the capacity
and increased capability to build relationships and access networks which they might not have
accessed otherwise (Coleman, 1988; Lin, 1999; Putnam, 2003). Literature (Xu, Perkins, Chow,
2010; Coleman 1987; Putnam, 2003) describes group resources as ties created through
neighboring, religious affiliations, and organizational affiliations. Coleman (1988) describes
characteristics of social capital as simplex and multiplex (Coleman, 1988). A multiplex
individual is a person connected to a neighbor, coworker, or is a parent whereas a simplex
individual is linked through one of these relations (Coleman, 1988). This study focuses on
ethnic and cultural social capital characteristics and their positive benefits they bring to society –
including a politically engaged citizenry.
Social Capital – Individual Resources: Race, Gender, Age, Education, Employment
McDonald, Lin, and Ao (2009) use characteristics such as the proportion of white male
12
friends, English as (or not as) a first language, education, age, and employment in measuring
social capital. Their findings (McDonald, Lin, & Ao 2009) revealed significant advantages of
being a white male when seeking job leads because white males possessed levels of social capital
that exposed them to information resources that led to job opportunities. The results (McDonald,
Lin, & Ao, 2009) showed deficits in the level of social capital among women and Hispanics and
thus their ability to access information to assist in finding job opportunities (McDonald, Lin, &
Ao, 2009). The results (McDonald, Lin, & Ao, 2009) also revealed that Hispanics have fewer
resources in their network than white males and people for whom English is not the primary
language of use received 60 percent fewer job leads than primary English speakers (McDonald,
Lin, & Ao, 2009). Higher educated individuals receive more job leads, but age was not a
significant predictor of job leads (McDonald, Lin, & Ao, 2009). The research (McDonald, Lin,
& Ao, 2009) demonstrates that social networks ―are gender and race homophilous and that these
gender and racialized networks vary in the extent to which they contain different social
resources‖ (McDonald, Lin, & Ao, 2009).
Social Capital – Group Resources: Norms
Citizen norms are considered to be a social capital group resource and influence effective
social capital (Coleman, 1988). Effective norms might include citizens agreeing to file taxes or
obey laws that prevent crime. An example used in the NPS (2004) survey that would be
considered a norm includes the item that asks respondents whether they believe society should
blend or maintain distinct cultures. This type of social capital norm is one that ―forgoes self-
interests and act in the interests of the collectivity,‖ (Coleman, 1988 p.104). Coleman (1988)
believes that these types of norms result in rewards to society only if there is a cohesive effort of
social support. As it relates to this study and the proposed theoretical model, a reward would be
13
increased political engagement and a sustainable and viable democracy.
The relationships and networks that result from individual and group resources not only
help build social capital, but create an environment for citizens to build social trust among each
other - which may lead to discussions and the sharing of information that leads to civic and
political engagement. If humans create or expand their network with others of similar or
different backgrounds, and do not live and function in isolation, social capital and social trust
develops. Coleman (1988) indicated that through family, community, and religious affiliation
connections, transactions of trust are facilitated that create ties that are necessary for social
capital to develop and for certain individual or group actions to occur. These ties facilitate social
movements that are rewarding for individuals, groups, and the public as a whole (Coleman,
1988). Granovetter‘s (1973) examination of strong and weak ties conclude that weak ties are
more beneficial to building social capital and individual or group mobilization because people
with strong ties tend to stay in cliques, whereas those with weak ties tend to connect with other
weak ties. Social trust brings about the sharing of information and ideas, including ideas related
to politics and attitudes towards government and the people elected or appointed to operate
government. Coleman (1988) argues that information is acquired by social relations that could be
used for various purposes.
Through the development of social capital there may also be a likelihood that social
capital and political attitudes towards government will predict citizen political engagement – as
citizens who share information may share ideals about politics and community and become
engaged. Coleman (1988) argues that system-level outcomes occur when individual and group
social capital resources are combined and produce results.
Political Trust
14
Political trust literature (Dahl, 1971) describes or explains political trust as a consequence
of an individual‘s perception or attitude towards government integrity, effectiveness, and
responsiveness to individual or group needs. Granovetter (1973) believes that leaders are not
responsive to those that in whom they have no trust or with whom they have no direct
relationships (Granovetter, 1973). ―I would propose that whether a person trusts a given leader
depends heavily on whether there exits intermediary personal contacts who can, from their
knowledge, assure him that the leader is trustworthy, and who can, if necessary, intercede with
the leader or his lieutenants on his behalf,‖ (Granovetter, 1973 p. 1374). Citizen social networks
can help build trust or distrust in political leaders which may lead to political engagement or
disengagement. Davis, Holland, Leinhardt (1971) describes the relationship between trust and
social capital as an influence on choices and individual or group actions – if P chooses O and O
chooses X, then P is likely to Choose X. This model (Davis, et. al., 1971) supports the
theoretical model proposed in this study that if an individual chooses to become politically
engaged, their peers may also choose to become politically engaged because of citizens social or
their political trust discussed in their relationship. McClurg (2003) explains that social networks
allow for citizens to find out who candidates are and where the candidates stand on issues, thus
encouraging the likelihood of citizens to participate in politics.
Model Summary
This model aims to suggest that social capital and political trust may increase the
likelihood of an individual‘s engagement in politics based on the individual and group resources
a person possesses and their level of political trust in government.
The proposed theoretical model will be used to test hypotheses that suggest relationships
between social capital and political engagement, and political trust and political engagement –
15
controlling for race and certain types of individual resources that build social capital such as
income and education. Community (group) and individual variables, types of ethnic
relationships and networks, and citizen norms or attitudes towards the American culture will be
examined as social capital variables in this study and are supported by the literature (Lin, 1999;
Putnam, 2003; Xu, Perkins, & Chow, 2010).
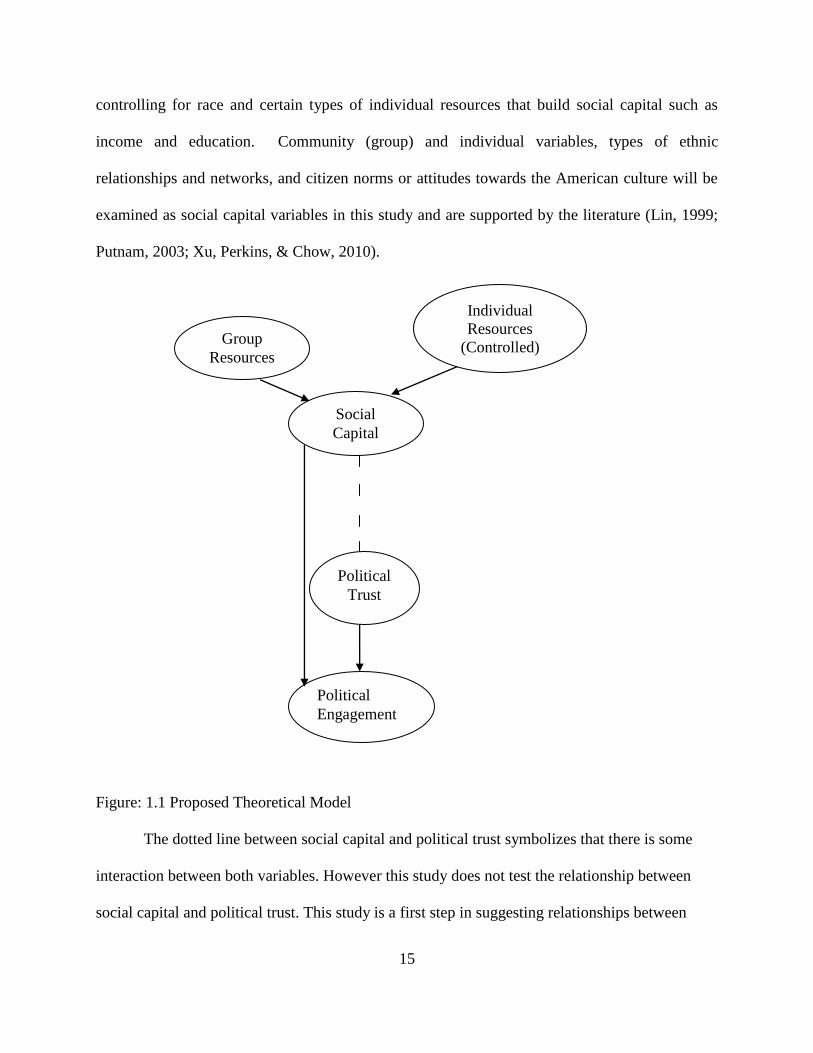
Figure: 1.1 Proposed Theoretical Model
The dotted line between social capital and political trust symbolizes that there is some
interaction between both variables. However this study does not test the relationship between
social capital and political trust. This study is a first step in suggesting relationships between
Social
Capital
Group
Resources
Political
Engagement
Political
Trust
Individual
Resources
(Controlled)
16
certain independent variables and the dependent variable political engagement.
As discussed above, social capital is not a single construct but a variety of different
constructs (Coleman, 1988). Chapter three of this study outlines a complete list of questions on
the NPS survey that relate to individual and group (community) social capital based on literature
found in (Adler & Kwon, 2002; Coleman, 1987; Lin, 1999; Putnam, 2003; McDonald et. al,
2009; Xu et. al, 2010;). This study will focus on ethnic and cultural social capital characteristics
and how these networks and resources explain or predict political engagement.
It should be noted that the proposed model in this study is an understudied theory which
may contribute significantly to theories of relationships between social capital, political trust, and
political engagement, especially as it relates to ethnicity. ―Social capital is productive, making
possible the achievement of certain ends that in its absence would not be possible,‖ (Coleman,
1988 p. 98).
Purpose
―Public participation in politics is broadly considered to be a defining element of
democratic citizenship (Dahl, 1998; Verba et al., 1995)‖ (Dalton, 2008, p 78). Research on civic
and political engagement needs to further explain, experiment, and predict relationships to civic
culture, beliefs, behaviors, and perceptions toward government and elected officials. Kwak,
Shah, & Holbert (2004) and Hetherington & Globetti (2002) challenge researchers to further
understand the relationships between trust and civic engagement. ―Continuing empirical
investigation of this interactive relationship of trust with other important variables in public
participation should allow us to have a more nuanced understanding of the role it plays in civic
engagement‖ (Kwak, Shah, Holbert, 2004, p. 649).
The primary purpose of this study is to better understand predictors of political
17
engagement using political trust and social capital as predictor variables, based on data collected
in the 2004 National Politics Study. This study adds value to the field of political science, public
administration, and human resource development by providing a better understanding of how
citizen levels of trust in government and citizen social resources predict citizen engagement in
politics. Ultimately, findings and recommendations of this research report will: 1) assist elected
officials and government agencies in identifying strategies to increase citizen political
engagement in programs and policy making; 2) serve to help increase the level of trust and
political engagement, specifically among ethnic minority communities; 3) help hold elected
officials and government agencies responsible for listening and understanding the critical policy
issues that come about through increased political participation; 4) therefore, creating an
opportunity to create public policy that addresses concerns of all citizens, through political
engagement.
Statement of the Research Problem
The primary problem this research addresses is explaining whether variables of social
capital and political trust can predict political engagement. Though there are many studies that
explore citizen trust in government, there have been no studies found that explore the
relationship between these constructs.
Objectives
Specific objectives formulated to guide the research include:
1) What levels of citizen political engagement are reported, both overall and based on:
a. Age
b. Race
c. Gender

18
d. Educational Level
2) What levels of citizen political trust are reported, both overall and based on:
a. Age
b. Race
c. Gender
d. Educational Level
3) What levels of social capital are reported among citizens both overall and based on:
a. Age
b. Race
c. Gender
d. Educational Level
Hypotheses
Hypothesis 1: Control variables (Education, Income and Race) will
contribute significantly to the prediction of political engagement.
H1a: Control variables will contribute significantly to the prediction of citizens
who talk to people and try to persuade them to vote for or against one of the
parties or candidates.
H1b: Control variables will contribute significantly to the prediction of citizens
who attend political meetings, rallies, speeches, dinners, or things like that in
support of a particular candidate.
H1c: Control variables will contribute significantly to the prediction of citizens
who vote.
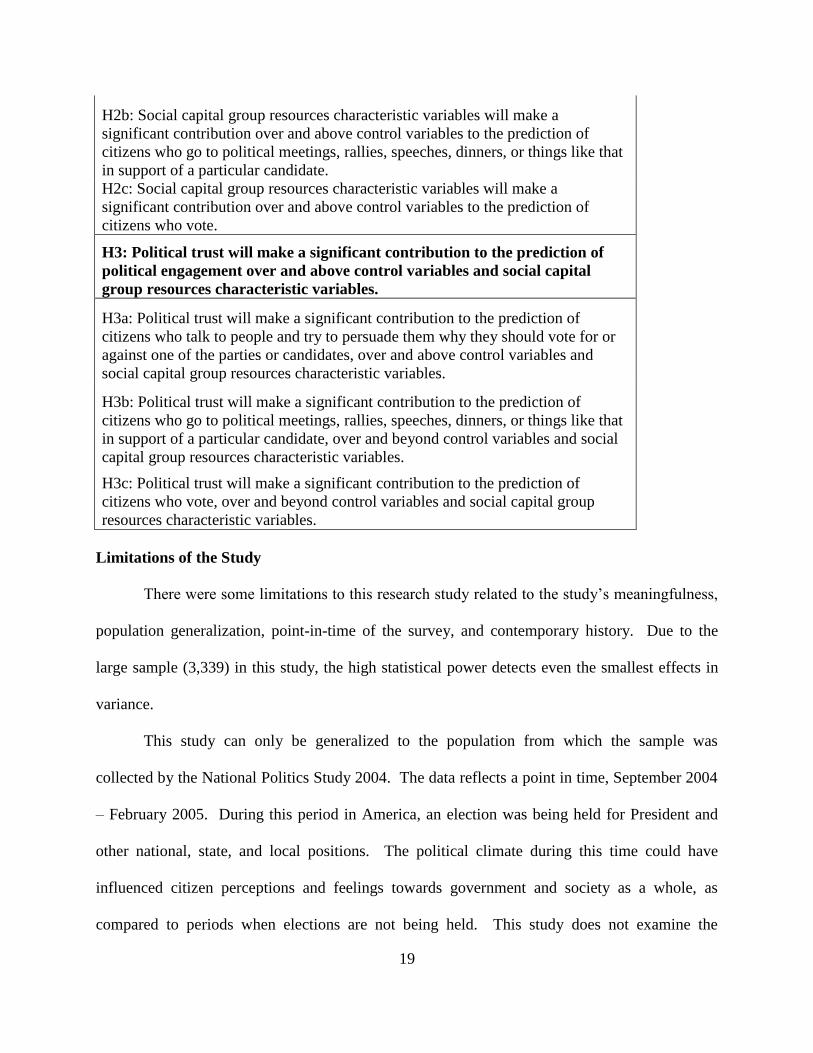
H2: Social capital group resources characteristic variables will make a
significant contribution to the prediction of political engagement over and
above control variables.
H2a: Social capital group resources characteristic variables will make a
significant contribution over and above control variables to the prediction of
citizens who talk to people and try to persuade them why they should vote for or
against one of the parties or candidates.
19
H2b: Social capital group resources characteristic variables will make a
significant contribution over and above control variables to the prediction of
citizens who go to political meetings, rallies, speeches, dinners, or things like that
in support of a particular candidate.
H2c: Social capital group resources characteristic variables will make a
significant contribution over and above control variables to the prediction of
citizens who vote.
H3: Political trust will make a significant contribution to the prediction of
political engagement over and above control variables and social capital
group resources characteristic variables.
H3a: Political trust will make a significant contribution to the prediction of
citizens who talk to people and try to persuade them why they should vote for or
against one of the parties or candidates, over and above control variables and
social capital group resources characteristic variables.
H3b: Political trust will make a significant contribution to the prediction of
citizens who go to political meetings, rallies, speeches, dinners, or things like that
in support of a particular candidate, over and beyond control variables and social
capital group resources characteristic variables.
H3c: Political trust will make a significant contribution to the prediction of
citizens who vote, over and beyond control variables and social capital group
resources characteristic variables.
Limitations of the Study
There were some limitations to this research study related to the study‘s meaningfulness,
population generalization, point-in-time of the survey, and contemporary history. Due to the
large sample (3,339) in this study, the high statistical power detects even the smallest effects in
variance.
This study can only be generalized to the population from which the sample was
collected by the National Politics Study 2004. The data reflects a point in time, September 2004
– February 2005. During this period in America, an election was being held for President and
other national, state, and local positions. The political climate during this time could have
influenced citizen perceptions and feelings towards government and society as a whole, as
compared to periods when elections are not being held. This study does not examine the
20
influences of more contemporary issues occurring at the time of the interpretation of the results,
such as the election of the first African American President of the United States, citizen policy
preferences related to healthcare reform, economic downturn, immigration reform efforts, the
Wall Street bailout, federal response to natural disasters, and other national and international
affairs that may influence public trust and citizen political engagement.
This dissertation does not fully examine the impact of significant events such as the War
in Iraq, 9/11, and hurricane Katrina, each of which could have several influences on citizen trust
in government and political engagement, because they each involved leadership from the federal
government in response to citizen concerns and needs.
Literature also supports the theory that distrust influences political engagement or
disengagement. This study did not focus on variables related to citizen distrust in government
and its suggested predictability to political (dis)engagement. Similarly, this study did not focus
on social distrust, and its impact on citizen social capital.
As it relates to content, this research attempted to suggest relationships between political
trust, social capital, and civic engagement. This study describes, explains, and suggests
predictability in relationships between multiple independent variables and one dependent
variable, but does not test non-linear relationships. This study does not measure relationships
between social capital and political trust. The purpose of this study is not to examine the
differences between social capital and political trust and the ability of those differences to predict
political engagement. The hierarchical logistic statistical analysis used, suggests measures of
strength and direction but does not measure cause and effect.
21
CHAPTER TWO: LITERATURE REVIEW
The theoretical background of this literature review focuses on antecedents and
consequences of social capital, trust (political and interpersonal), and political engagement. In a
review of JSTOR (Journal Archive Service), Education Resources Information Center (ERIC)
database, Academic Search Complete and other peer reviewed journal databases, literature was
found among research related to the fields of political science, sociology, public administration,
and organizational theory.
Most related literature explains political engagement for Americans as an entire
community aggregated based on variables such as age, education, and income. A review of
literature reveals only a minimal amount of literature that explains how factors such as social
capital and political trust are related to political engagement. ―A number of scholars (e.g.,
McLeod et al., 1999; Nie, Junn, & Stehlik-Barry, 1996; Verba, Schlozman, & Brady, 1995) have
suggested that the traditional Social Economic Status (SES) model, which hypothesizes a direct
link between SES and participation, might be too simplistic‖ (Scheufele & Shah, 2000 p. 109).
Scheufele & Shah (2000) argue that socioeconomic status is only one of many factors that may
influence political engagement. Other factors that may influence political engagement include
social networks, the media, and other individual resources. This literature review includes
theories and research related to engagement, trust, and social capital across various age groups,
ethnicities, nationalities, and provides additional literature related to social capital and political
trust that serve as a foundation to the rationale, purpose, and proposed theoretical model for this
study.
Political Engagement
Political engagement is considered to be an essential characteristic of a democracy
22
and has many definitions and descriptions. Most research on political engagement describes or
defines political engagement as electoral and non-electoral behaviors such as memberships and
participation in political organizations, voting, and advocacy for or against political issues or
political candidates. Stolle & Howard (2008) cited (Billiet & Cambre, 1996) in stating that when
citizens join and participate in organizations, the exposure and experiences of connecting with
people of similar or different backgrounds and organizing around certain issues builds citizen
political efficacy in their belief that they can engage in politics and influence politics.
Measuring Political Engagement
The General Social Survey (http://www.norc.uchicago.edu/GSS+Website/), Social
Capital Benchmark Survey (http://www.cfsv.org/communitysurvey/), and American National
Election Studies (http://www.electionstudies.org/) are well-known and tested instruments that
measure political engagement and also collect information about citizen social behaviors and
knowledge about politics. The instruments include items that measure whether respondents
contribute money to campaigns, attend rallies or protests, vote, write letters to Congress, and
their levels of social trust and levels of political trust.
Political Engagement and Race
Bilal Sekou (2008) examined the effects bridging and bonding organizations have on
black and white racial groups. Bridging and bonding organizations are two types of affiliations
often referenced by Robert Putnam (2000) in explaining citizen relationships as they relate to
group level resources. Group level resources contribute to building social capital among
individuals. Bridging organizations are organizations that are created for the purpose of inviting
individuals from diverse racial, economic, and social backgrounds. Bonding organizations are
organizations that are more limited to individuals that are of a certain race, class, or profession.
23
Bonding social capital organizations are ―good for undergirding specific reciprocity and
mobilizing solidarity‖ (Putnam, 2000 p. 22). Bridging social capital organizations are good for
―linkage to external assets and for information diffusion‖ (Putnam, 2000, p.22).
Sekou (2008) used a binary regression analysis to examine the level of engagement in
voluntary associations of 3,003 survey respondents, focusing on closing the racial gap in political
participation. The researcher used an independent sample t-test to analyze citizen participation in
bonding and bridging organizations, by race. The study provided important findings that
contribute to the literature related to race, social capital and organizational affiliation. Most
significantly, the study found there were minimal differences in the rates blacks and whites
participated in bonding and bridging organizations. However, those minimal differences are
worth noting.
As it relates to electoral political behavior, a study by Sekou, (2008) revealed that more
whites voted in 1996 than blacks, but the percentage of whites and blacks that responded that
they attended a political meeting was about equal. This created a question as to whether
attending a political rally or meeting is a predictor of voting. Whites reported that they were
more likely to sign a petition than blacks (Sekou, 2008). As it relates to non-electoral behavior
(political behavior that did not involve voting) more blacks in the study claimed to have
participated in a public march than whites (Sekou, 2008). The results showed some racial
differences in participation in organizations:
―Whites were substantially less likely to report involvement in an ethnic,
nationality, or civil rights organization than were blacks.
Whites were much more likely to report involvement in a professional, trade,
foreign, or business group than blacks.

24
Blacks and whites had similar rates of participation in voluntary groups.
Whites that participated in bonding social capital organizations were more likely
to vote than whites active in bridging social capital organizations.
Whites that participated in bridging social capital organizations were more likely
to sign a petition than whites that participate in bonding organizations.
Black and white bridging social capital organizations were more likely than
bonding social capital organizations to attend a political meeting or rally or
participate in a public march‖ (Sekou, 2008 p. 17).
The results (Sekou, 2008) concluded that the gap between black and white political
participation is not closing, even when explained by the two types of political or non-political
social capital organizations.
Political Engagement and Income
Frederick Solt (2008) studied the effect national economic inequality had upon citizen
political engagement. In his article Solt (2008) claims that ―..economic inequality powerfully
depresses political interest, discussion of politics, and participation in elections among all but the
most affluent and this negative effect increases with declining relative income‖ (Solt, 2008, p.
48).
Solt (2008) conducted this study to test how relative power theory, conflict theory, and
resource theory related to politics and income inequality. Relative power theory is based on the
principle that economic inequality within a country will have a negative effect on the level of
political participation among citizens in that country. Conflict theory is based on the principle
that economic inequality will increase people's engagement in politics. Resource theory
contends that depending on an individual‘s income, citizens will be politically engaged or
25
politically disengaged.
The theories suggest that as national income inequality increases, the relative power of
higher income citizens to become politically engaged and set political agendas increases. On the
opposite side of the spectrum, the theories suggest that national income inequality depresses the
ability of lower-income citizens to advance a political agenda, which may also suggest that low-
income citizens in the bottom percentile of income-inequality index are less likely to engage in
politics.
The author (Solt, 2008) used cross-national surveys of 22 democratic nations to test the
hypothesized theories related to income inequality and political engagement. The variables
included in the cross-national surveys were political interest, political discussion, and electoral
participation as measured by the World Values Survey (http://www.worldvaluessurvey.org/), the
Eurobarometer (http://ec.europa.eu/public_opinion/index_en.htm), and the European Election
Survey (http://www.ees-homepage.net/) (Solt, 2008). Political discussion was characterized and
measured based on the frequency with which people discussed politics with other people.
Electoral participation was characterized and measured by voting in the most recent national
election. The independent variables were economic inequality and income, as measured by the
Luxembourg Income Study (http://www.lisproject.org/), which calculates the income inequality
among countries. The author used education and age as control variables because education is
the most proven predictor of political engagement (Solt, 2008).
The results (Solt, 2008) proved relative power theory true in that lower income citizens
that live in nations with income inequality are more likely to not engage in politics as often as the
rich that live in nations with income inequality. However, the results (Solt, 2008) also suggest
that income inequality does nothing to stimulate citizen engagement, regardless of income. This
26
implies that income inequality is a depressor, not a motivator, of political engagement.
Political Engagement and Consumerism
Citizen political engagement can be defined in many ways, including traditional and
nontraditional politically related behaviors such as voting, attending a political meeting or rally,
and signing e-petitions. Stolle, Hooghe, and Micheletti (2005) explored a not-so traditional
approach to political engagement centered on citizen buyer choices – also called political
consumerism. Stolle, Hooghe, & Micheletti (2005) cited (Micheletti, Follesdal, Stolle, 2003) in
explaining that political consumerism occurs when consumers choose to purchase goods based
on ―political or ethical considerations‖. Examples of political consumerism might include
purchasing products produced by companies that use environmentally friendly or organic
materials, purchasing energy efficient cars, or purchasing conflict free diamonds. Political
consumerism is a type of political engagement that is rarely studied in the literature as a predictor
of political engagement because of its broad scope of activities which poses difficulty in
measuring it consistently (Stolle, Hooghe, & Micheletti, 2005).
Stolle, Hooghe, & Micheletti (2005) cited (Bennett, 1998; Eliasoph, 1998; Lichterman,
1996) in explaining why youth were choosing not to participate in formal political engagement
activities such as mass demonstrations and protests, but were choosing to participate in more
non-traditional types of engagement such as using social networking websites to blog or express
political views or volunteering in support of a social cause, and advocacy-texting. This study
(Stolle, Hooghe, & Micheletti, 2005) examined a pilot survey that used a political consumerism
index administered to 1,015 Canadian, Belgian, and Swedish students. The index measured how
frequently students used their buying power to exercise their political power. The authors used a
multivariate analysis to examine student political consumerism.
27
The findings (Stolle, Hooghe, Micheletti, 2005) revealed that 1) respondents purchased
products based on their ethical and political beliefs; 2) respondents exercised political
consumerism in purchasing things like clothing, groceries, and shoes; 3) respondents who
purchased goods based on ethical and political beliefs exhibited higher levels of trust for their
peers, than for institutions; 4) women acted as political consumers more often than men; and, 5)
income influenced a person‘s ability to purchase products based on their ethical, political, or
environmental beliefs. The researchers (Stolle, Hooghe, Micheletti, 2005) emphasized that
political consumerism is a type of political engagement that is predicated on citizen income-- the
less a consumer‘s income, the more likely the consumer will not be able to engage in political
consumerism. Lower income citizens, who possess minimum personal spending power, have
fewer products to choose from when purchasing goods which limits their ability to engage in
political consumerism.
Political consumerism is a form of political engagement that garners the attention of
social science and economic researchers. Though formal organizing in groups is a frequent
activity among group level activists, Stolle, Hooghe, and Micheletti‘s (2005) research
demonstrated that consumers make choices when they purchase products based on political
views and that understanding how they determine what products to buy and how often citizens
engage in political consumerism could be a significant factor that adds value to understanding
political engagement. ―Both anecdotal and case study evidence have long suggested that
consumer behavior such as the buying or boycotting of products and services for political and
apolitical reasons can take on political significance‖ (Stolle, Hooghe, Micheletti, 2005 p. 245).
Political Engagement and Immigrants
Uslaner and Conley (2003) analyzed data collected by the Los Angeles Times in May of

28
1997. The survey was conducted via telephone. The sampling frame of the survey included
ethnic Chinese that were 18 years of age or older. A total of 773 responses were received. The
survey focused on civic and political engagement of the ethnic Chinese community in American
organizations and politics. The results offer insight into factors that may influence immigrant
engagement in American culture.
The results revealed that Chinese immigrants that view Chinatown as a significant
component of their culture are 43 percent less likely to be engaged in American politics,
probably because these individuals felt most connected to their Chinese roots. Engaging in
American culture was 8.6 percent less likely for ethnic Chinese who felt closest to their Chinese
heritage, compared to those who may be engaged in American cultures. American ethnic
Chinese were 16 percent more likely to participate in both American and Chinese organizations.
Kwak, Shah, & Holbert (2004) cited (Liu et al., 1998; Olsen, 1972) that people who feel most
close to their own ethnic traditions and norms are least likely to engage with people of different
ethnic traditions and norms.
The study (Uslaner & Conley, 2003) also focused on particularized trusters among ethnic
Chinese. Particularized trusters are people who trust others of the same ethnicity or nationality.
The study revealed that Chinese particularized trusters believed that ethnic Chinese were not
contributing to the sustainability of the ethnic Chinese culture, such as Chinese religion and
traditions. The authors (Uslaner & Conley, 2003) also noted in their results that though older
ethnic Chinese were more particular about preserving their culture, younger Chinese growing up
in America were more likely to engage in American culture. For example, an 18-year-old ethnic
Chinese was 9 percent more likely to participate in American politics and be active in their own
culture too when compared with a 50-year-old ethnic Chinese (Uslaner and Conley, 2003).
29
Fifty-nine (59%) percent of ethnic Chinese between the ages of 18 and 24 reported being
politically engaged in American political life, compared to around 35 percent of respondents
between the ages of 40 and 69 years of age (Uslaner & Conley, 2003).
Predictors of Chinese engagement in American democracy include the existence of
Chinatown, education, length of time as a citizen, and religion (Uslaner & Conley, 2003). The
results also found that 37.2 percent of ethnic Chinese did not engage in the ethnic Chinese or
American culture. Further research to explore how immigrants integrate into the American
culture, including political culture, is essential to ensuring that every American citizen
appreciates, understands, and participates in the American democratic system of government.
Trust and Civic Engagement Outside the United States
―Being closer to the Canadian border means more social capital‖ (Putnam, 1995b, p. 10).
Exploring political engagement outside of the United States, Smidt (1999) performed a
comparative analysis of 3,000 Americans and 3,000 Canadians surveyed in 1996. The sample
was statistically analyzed based on gender, age, and country, with some emphasis on non-whites.
There were a number of American and Canadian citizen behaviors and attitudes analyzed such as
attitudes of social trust and behavior in membership organizations. This study contributed to the
literature in a variety of ways, but is most significant because it compares citizen group-level
engagement of two democratic neighboring countries. Significant results in the study (Smidt,
1999) revealed that 1) Canadians are more trusting of one another than Americans; 2) Americans
are more engaged in social organizations than Canadians; 3) Americans hold lower levels of
social capital than Canadians; 4) Whites in America are more trusting and socially engaged than
non-whites in America; and, 5) Americans attend church at higher rates than Canadians (Smidt,
1999 p. 180).
30
Putnam‘s (1995b) examination of social capital based on geography determined that
southern states within the United States possessed lower levels of social capital, as compared to
northern states with higher levels of social capital. ―The single predictor of the level of social
capital in American states is distance to the Canadian border‖ (Putnam, 1995b pg 10). Putnam
(1995b) study compared social capital among states in the U.S., and revealed that lower levels of
social capital, lower levels of academic achievement, and worst health outcomes exist in the
southern United States.
Political Engagement and Youth
Soule (2001) investigated youth political knowledge, youth political participation, and
youth political attitudes. It is important for researchers to examine the political attitudes and
political knowledge of youth because these attitudes may carry into adulthood. The study
examined youth born between 1965 and 1978 (also called generation X), and those born after
1978 (also called generation Y). Soule (2001) argued that youth become more responsible as
they age, and in their mid-thirties begin to accept adult responsibilities, such as voting. Soule
(2001) suggested that many young adults born as generation Xers and Yers may not be as
engaged as previous generations of youth because Xers and Yers have been exposed to minimal
civil strife. Generation X and Y did not experience social and political moments in American
history such as the Vietnam War, Watergate, World Wars, and the Civil Rights Movement.
Most social and political turbulence experienced by Generation X and Y has involved
international crises related to natural disasters, the Desert Storm War, and more recent debates
related to healthcare reform, immigration reform, and terrorism.
Soule (2001) cited a survey (Panetta Institute Survey, New York Times, 1-12-2000)
which conveyed that youth were volunteering in community activities more so than engaging in
31
political activities, and the types of community and social activities are less related to political
issues and more related to addressing social needs of the community surrounding the youth.
Whereas voting was a significant form of political expression to generations before Xers and
Yers, voting is not a significant form of engagement as much for Generation X and Y. Soule
(2001) cited research (Keeter et al., 2002; Lopez & Kirby, 2003) that indicated youth were
registering to vote, voting, and engaging in political activities at rates lower than the adult age
population in America. Research suggests (Putnam, 2003) that in the period during and
immediately after the Civil Rights movement, the country, and especially youth, were most
civically engaged. Reflecting back to 1940 and 1965, citizen engagement was higher than ever
before in America (Putnam, 2003). However, Oritsejafor & Guseh (2004) cited (Janger, 1998) in
stating that youth American engagement in politics is ‗abysmal‘.
Soule (2001) reports that young Americans do not vote because ―1) most believe that
their vote doesn't make a difference, 2) they don't have enough information about the candidates,
3) are too pressed for time, 4) are turned off by negative campaigns 5) they exercise political
engagement through protest by not voting 6) they see no difference in the candidates, 7) they
changed their address and some fail to register‖ (Soule, 2001 p. 9). Soule (2001) reports that
young American citizens do vote because ―1) their opinion matters and can make a difference 2)
can't complain unless you vote 3) every vote counts 4) civic responsibility or duty 4) support or
opposition to a specific candidate or cause 5) for partisan reasons (National Association of
Secretaries of State, 46) ― (Soule, 2001, p. 9).
Political Engagement and Young Adults
In Abravavanel and Busch‘s (1975) report on college students‘ levels of political trust
and political competence, the researchers examined 661 university students and the findings
32
were revealing. The study was conducted in 1972 with the objective of comparing college
students to the general public on their levels of interpersonal trust, political competence, political
activity, and political trust. To measure student political action, the authors asked if students felt
they had the ability to create or implement a plan or strategy to influence Congress. The survey
also used open-ended responses to provide students the opportunity to explain the type of
political activities they would engage in such as protests, writing a congressman, voting, etc.
The author clearly distinguished between the two types of engagement, political and civic, which
in many studies were used interchangeably and was a weakness of those studies.
The results revealed that:
―Students who were sensitive to the Vietnam War were more distrustful of
government than the general public.
Students were less likely than the general public to expect success with Congress.
Seventy-one percent did not believe they could influence Congress, compared to
58 percent of the general public in 1966 and 47 percent in 1968.
Students were found to be more politically self-confident.
Students who had distrust for government were somewhat more likely than the
general public to report they could or would attempt to influence the legislature‖
(Abravanel & Busch, 1975 p. 69).
―Findings that demonstrate that young adults trust people less and participate less in their
community replicates many previous studies‖ (Shah et al., 2001, p. 492).
Trust
Based on a review of literature, trust is a difficult concept to define and measure. Trust
has been studied among researchers in the fields of sociology, political science, organizational
33
development, and psychology. ―If A and B are actors and X is the action that is in A‘s interest,
then if A believes B will do X, A trusts B. Trust then is someone‘s (A) belief about the likely
action (X) of someone else (B)‖ (Cleary & Stokes, 2006, pg. 11). Mayer, Davis, and Schoorman
(1995) summarized three antecedents to trust as integrity, ability, and benevolence.
The social structure and culture of a democracy, also termed ―civic culture‖ plays a
significant role in citizen social and political trust. A civic culture can be defined as norms,
traditions, and beliefs that encourage free expression of views, participation in electoral and non-
electoral types of political engagement, obeying of rules established by government, and
awareness and knowledge about current and historical social and political issues. Mishler &
Rose (2005) summarized three areas of trust related to culture theories as ―1) social and
governmental trust brings about support for the systems and branches of government; 2) social
and political trust results in greater support for values such as voting, obeying the law, and other
characteristics that make democracy a success; and (Norris, 1999) 3) trust stimulates political
engagement as cited by (Brehm & Rahn, 1997; Norris, 1999; Putnam, 1993, 2000).‖ Cultural
theories establish a hierarchy of trust that begins with trust among family, then trust among peers
or people outside the family, and at the top of the hierarchy is trust in institutions such as
government or business (Mishler & Rose, 2005). Institutional theories believe that support for
democratic regimes is the result of a person‘s perception of the economic and political
performance of the institution (Mishler & Rose, 2005).
Citizen views of government and the elected, appointed, or civilian employees working
for government agencies are often developed based on the behaviors of these individuals in
keeping their word, performing their jobs, and kindness towards constituents. Mishler & Rose
(2005) cited (Allmond & Verba, 1963 & Putnam, 1995) in stating that democracies with high
34
levels of social and political trust operate more effectively.
Brehm and Rahn (1997) analyzed data from the General Social Survey
((http://www.norc.uchicago.edu/GSS+Website/), collected between 1972 and 1994 and
hypothesized that social capital is developed through citizen cognitive abilities and other group
and individual resources. The results (Brehm & Rahn, 1997) revealed that civic engagement and
interpersonal trust had a positive relationship with one another. Therefore, citizens who engaged
in their community had stronger levels of interpersonal trust for their peers. Citizens who are not
engaged within their community were least likely to have interpersonal trust for their peer
groups.
Political Trust
―A democratic society is unlikely to emerge without political trust (Dahl, 1971). Trust
makes everyday life easier, less complex, and more orderly-increasing democratic stability and
lowering citizen angst (Barber, 1983)‖ (Gershtenson & Plane, 2007, p.1).
Measuring Political Trust
Based on a review of related literature, political trust has rarely been studied since the
women‘s‘ rights and civil rights movements. One of the first well documented use of a trust
index related to political trust was created in 1974 by Citrin (1974) and Miller (1974). Over the
years the index has evolved into the American National Election Survey
(http://www.electionstudies.org/) comprised of these four questions: 1) Do you trust the
government to do what‘s right? 2) Is government run by a few big interests? 3) How much tax
money do you believe government wastes? 4) Are those running government crooked?
More recently, the American National Election Studies (http://www.electionstudies.org/) has
piloted the trust index to retrieve more valid and reliable results on voting patterns, public
35
opinion of government, and political participation. These pilot tests have served researchers and
policymakers well by providing results that paint a clearer picture of the attitudes and beliefs
citizens possess towards government in specific areas of evaluation such as fiscal responsibility,
influence of interests groups, and integrity. A weakness of the National Election Survey is that it
defines government in a broad sense, on the national or federal level, and does not ask citizens
about their levels of trust towards local and state government (Gershtenson & Plane, 2007).
Questions used from the American National Election Survey (http://www.electionstudies.org/)
for the purposes of measuring trust included:
1) How much of the time do you think you can trust the government in Washington to do
what is right: just about always, most of the time, or only some of the time?
2) Do you think that people in government waste a lot of the money we pay in taxes, waste
some of it, or don't waste very much of it?
3) Would you say the government is pretty much run by a few big interests groups or
individuals looking out for themselves, or that it is a run for the benefit of all the people?
4) Do you think that quite a few of the people running the government are crooked, not very
many, or do you think hardly any of them are crooked (http://www.electionstudies.org/) ?
Challenges to Measuring Political Trust
In the 2006 American National Election Studies (ANES): The Pilot Report (Gershtenson
& Plane 2007), the authors evaluated citizens‘ frequency of trust. The researchers (Gershtenson
& Plane, 2007) argued that political trust has no consensus in definition and weaknesses in its
current most widely used form of measurement. The researchers (Gershtenson & Plane, 2007)
evaluated the National Election Studies (http://www.electionstudies.org/) survey to examine its
reliability. They argued that a major problem with the standard NES trust questions is that the
36
items are weak in measuring frequency at which individuals trust government. Gershtenson &
Plane (2007) argue that the responses do not offer respondents the opportunity to answer on both
sides of the scale. For example though there is a ‗just about always‘ option there is not a ‗just
about never option‘ and though there is a ‗most of the time‘ option there is no option for ‗little of
the time‘. The authors (Gershtenson & Plane, 2007) also argue that the responses can encourage
citizens to respond more often to the ―more desirable outcome for survey designers.‖
(Gershtenson & Plane, 2007 p. 3).
Political Distrust
―The existence of distrustful citizens who are convinced that government serves the interests
of few rather than the interests of all is a barrier to the realization of the democratic ideal‖
(Aberbach & Walker, 1970, p. 1199). An essential component of a representative democracy is
trust among its citizens that democracy is working on behalf of the people and not on behalf of
the self interest of government, government officials, and special interests groups. ―This is even
more important in the American society where racial and ethnic minorities are actively searching
for new and more dignified role as political equals‖ (Aberbach & Walker, 1970, p. 1199). Social
and political distrust has led to mass demonstrations and riots by people who felt betrayed or
treated unfairly by government or organizations outside of government. Farmer (2006) cited
(Cook, Hardin, & Levi, 2005) about the creation and use of organizations to serve as the voice of
politically disengaged people and populations. These organizations, which could be bridging
and bonding organizations, not only serve as a voice for citizens who may lack the political
efficacy, skills, and ability to be politically engaged, but the organizations also serve to train and
develop citizens in advocacy, promote voter registration, and assist citizens in connecting to
networks that can champion their cause. One example would be the National Association for the
37
Advancement of African Americans. Putnam (2003) notes that even these organizations are on
the decline as it relates to membership and that fewer of these organizations are being created
now than during more heightened periods of civic turbulence in the United States.
Examining literature on the consequences of political distrust, Hetherington and Globetti
(2002) explain how policy preferences may lead to political distrust. The study tests policy
consequences of political trust by focusing on policy preferences that are racially motivated. The
researchers hypothesized that because African Americas are beneficiaries of certain policy
preferences, they should trust government to a greater extent than whites who often are asked to
make sacrifices for policy preferences.
The researchers (Hetherington & Globetti, 2002) used National Election Study
(http://www.electionstudies.org/) data collected between 1990 and 1994 to construct models to
explain racial policy preferences. Hetherington & Globetti (2002) cited (Sniderman & Piazza,
1993) to emphasize that though citizens object to policy preferences, this does not mean that
citizens object to the individual for which the policy preferences have been created to benefit.
―Even if people support progressive public policy goals, they do not support the policies
themselves because they do not believe that the government is capable of bringing about the
desired outcomes‖ (Hetherington, 2005 p. 3). In other words, people who actively advocate for
or against certain policy preferences, such as tax breaks for the wealthy and welfare for the poor,
may not necessarily distrust or dislike the wealthy or poor person benefiting from the policy
preferences. Citizens may possess a lack of support for the policy preference or a lack of trust
that government can effectively deliver on the policy preference (Hetherington & Globetti,
2002). The researchers (Hetherington & Globetti, 2002) used simultaneous equation modeling to
test their hypothesis related to the effects of policy preferences on citizen trust. The preferences
38
were categorized as race-consciousness, social welfare, and equal treatment policy agendas
(Hetherington & Globetti, 2002). The researchers (Hetherington & Globetti, 2002) analyzed
white and black respondents and the racial policy agendas separately. Specific items included a)
support for affirmative action and the use of racial quotas in college admission (race-conscious
agenda), b) support for government aid to blacks and spending to assist blacks (social welfare
agenda), and c) support for government ensuring school integration and equal treatment in hiring
(equal treatment agenda) (Hetherington & Globetti, 2002).
The independent variables in the study (Globetti and Hetherington, 2002) were political
trust, partisanship, and racial resentment. The researchers used the National Election Study four-
item trust scale to measure trust in government. To measure partisanship, the researchers used a
seven-point scale that ranged between respondents identifying themselves as a strong democrat
to a strong republican. Liberal to conservative views were also measured on a self-reported scale
of measurement. A Likert-type scale was used to measure racial resentment as it relates to
preferential policies for blacks.
The results (Hetherington & Globetti, 2002) of the analysis revealed that among white
respondents trust causes racial policy preferences rather than the racial policy preferences
causing trust. The results also revealed that political trust has a statistically significant effect on
all policy preferences except for equal treatment in hiring. For African Americans, trust had no
effect on preferences for affirmative action, aid to blacks, or school integration (Hetherington &
Globetti, 2002). The authors argued that because blacks benefit from certain policy preferences,
blacks may view government as doing an effective job in creating and implementing these
programs and policy preferences. Other findings include:
Preference for aid to blacks and school integration revealed a statistically
39
significant effect on political trust;
Preference for affirmative action was not significant; and
Affirmative action and aid to blacks on political trust are negatively significant,
implying that supporters of these policies and programs are less trustful of the
government to implement these policies (Hetherington & Globetti, 2002).
In summary the study reveals that policy preferences have an effect on political trust, in some
instances, among both blacks and whites.
Political Trust Outside of the United States
Veenstra (2002) studied eight health districts in Saskatchewan by randomly selecting
citizens and measuring their trust in government and trust among each other. A random sample
was obtained and the study received a response rate of 40.3 percent, totaling 534 returned
questionnaires.
To identify citizen levels of personal trust, surveyors asked participants to agree or
disagree with the statement ―most people can be trusted‖ (Veenstra, 2002). To identify a
citizen‘s level of political trust the surveyors asked respondents to respond to items that
measured trust across four levels of government in Saskatchewan: municipal government, Health
Board, provincial, and national government. It is rare to find a study related to political trust in
government that does not focus entirely on citizen level of trust towards the national government.
Participants were asked to rate all levels of government in problem solving, making
decisions, and whether government had the public's best interest at heart (Veenstra, 2002). The
survey also measured trust in professionals, or trust in experts. Measuring trust in professionals
or experts is also a rare find in studies related to political trust and interpersonal trust. To
measure trust in experts, participants in the survey were asked whether experts and professionals
40
could aid in solving community problems. There is often a debate as to whether government
should privatize, is too bureaucratic, and too inefficient to perform certain services for the public.
Examining and comparing citizen level of trust in government and professionals adds value to
the debate.
The findings of the study revealed that citizens had greater trust in each other than in
professionals, and greater trust in professionals over government (Veenstra, 2002). Eighty-nine
percent of respondents had some level of trust for their neighbors, as compared to fifty-three
percent (53%) of respondents expressing trust for the government (Veenstra, 2002). ―Regardless
of the popularity of its leaders or how overt they are in soliciting opinions and encouraging
participation in the process of policy making, there are always those who see inequalities and
injustices in society and harbor suspicions of government motives and intentions‖ (Aberbach &
Walker, 1970 p. 1199).
Based on geographic distribution and demographics, the results revealed that social trust was
stronger in rural communities than in larger, more urban communities (Veenstra, 2002). Older
respondents were more trusting of others and government (Veenstra, 2002). Those respondents
that were widowed, married, and common-law married revealed greater social trust than those
respondents that reported being divorced, separated, and single (Veenstra, 2002). Homeowners
were more trusting than non-homeowners and respondents with children were more trusting than
those without children (Veenstra, 2002). Interestingly, income and education were not related to
trust (Veenstra, 2002).
Social Capital
Pasek, Kenski, Romer, & Jamieson (2006) cited Coleman‘s (1990) argument that social
capital is essential to social trust which is a necessity for a democracy. In order to have social
41
capital, research by Timpone (1998) reveals that being married, attending parties, or possessing
some form of social network is important because these experiences provide opportunities for
interpersonal trust to build. However, literature (McClurg, 2003) also reveals that citizens who
are part of a social network that does not encourage voting or other political activities are not
necessarily a good predictor of social networks‘ ability to influence voter turnout or other
political involvement. ―Decreasing social capital may be an important source of political
disengagement (Putnam 2000)‖ (Pasek, Kenski, Romer, Jamieson, 2006, p. 116).
Social Networks
Social networking is an antecedent of social capital. McClurg (2003) presented data that
showed the value of social interaction in building social networks and how it leads to citizen
political participation. The author analyzed data collected from citizens in South Bend, Indiana.
This is one of few studies found that collects in-depth information about social networks and the
role they play in political engagement. The study quantifies the relationship of social
interaction‘s effect on political engagement by the number and type of discussions held with
discussants in social networks. McClurg (2003) rationalizes that group political participation in
networks, not simply a citizen‘s education, income, and race influences civic and political
engagement. His study argued that there are other factors related to a citizen‘s level of
interaction and political engagement in those groups, regardless of race, gender, income, or
education, which provides the possibility for political participation.
The research (McClurg, 2003) explains that social networks allow for citizens to find out
who candidates are and where the candidates stand on issues, thus encouraging the likelihood of
citizens to participate in politics. Questions asked in the study (McClurg, 2003) to assess
political participation included whether citizens worked for a candidate in an election, attended a
42
meeting or rally for a candidate, put up a political sign or bumper sticker, or donated money. An
index (McClurg, 2003) of electoral involvement was created by adding together each of these
variables, where ―1‖ signified significant participation and ―0‖ signified non-participation. To
measure social interaction (McClurg, 2003), each respondent was asked to name up to three
people they had held political discussions with. The survey (McClurg, 2003) questions asked
about the nature of their discussions and how often they spoke specifically about politics. The
respondents were provided four response options, including: ―never‖ ―once in a while‖
―sometimes‖ or ―fairly often.‖ The hypotheses (McClurg, 2003) tested whether:
A. ―Social interaction only effects participation when there is an exchange of political
information (McClurg, 2003 p. 10).
B. Conversations which carry politically-relevant information make participation more
likely regardless of participation in formal social organizations‖ (McClurg, 2003 p. 11).
The results of the study showed that social interaction only effects participation when there is
an exchange of political information. Education, party mobilization, and membership in an
organized group were statistically significant predictors of political participation. The results
also showed that interaction is only statistically significant when it explicitly contained political
substance.
The results of this study suggested that the political content and political substance of
social interaction is important to explaining or predicting the effects of social networks on social
capital and political engagement. The study concluded that citizens who are relatively better off
in terms of individual civic resources are still not very likely to participate unless they engage in
politically relevant discussion within their social networks. These findings add value because the
results encourage more in-depth research into how politically relevant social networks empower
43
citizens to become politically engaged.
Social Capital and Personality Strength
Scheufele and Shah (2000) collected data via a mail survey to examine personality
strength and social capital. Five-thousand persons received the survey. The final analysis
included variables relating to gender, education level, and household income. Four antecedents
examined in the study included interest in politics, personality strength, amount of news watched
on TV or read in the newspaper, and amount of news watched on television. The analysis also
included variables such as social trust, life satisfaction, and civic engagement. Interrelationships
among these variables were measured using structural equation modeling. This was a useful and
applicable technique for the study on interrelationships because the technique allows for
relationships‘ effects to be measured.
The results (Scheufele & Shah, 2000) demonstrated that the older participants of the
study were interested in politics at a greater level than younger survey participants and were
more likely to watch the news and read the newspaper to gather information. Older respondents
were more satisfied with their life, had higher levels of trust for their peers and were more
civically engaged (Scheufele & Shah, 2000). Male respondents were more interested in politics
than female respondents and were more likely to have personality strength than females
(Scheufele & Shah, 2000). Females read the newspaper and watched television for news
programming more than males, but were not as likely as males to engage in political activities
(Scheufele & Shah, 2000).
Respondents of the study (Scheufele & Shah, 2000) who identified themselves as
possessing personality strength exposed themselves more to political content on television and
print news and they were also more trusting and possessed high levels of civic engagement.
44
Education was linked to political interest and civic engagement, and high income was linked to
high levels of interpersonal trust (Scheufele & Shah, 2000). Reading and listening to print and
television news held only a small significant indirect effect on civic engagement (Scheufele &
Shah, 2000). When a correlation analysis was performed, social trust and civic engagement were
related, providing readers of the study (Scheufele & Shah, 2000) the opportunity to understand
how citizens receive information related to public policy and how the news correlates to citizen
political engagement.
Social Capital and Racial Equality
Hero (2003) is one of the most prolific authors discovered in a review of literature related
to race and social capital. Hero (2003) provides the most in-depth analysis into the positive and
negatives effects of social capital on ethnic minorities. Hero‘s (2003) analysis of Putnam‘s
(1990) social capital index complements Putnam‘s findings. Putnam‘s study of human social
capital and well-being, based on geographic location within the United States, aligns with Hero‘s
arguments on the benefits and detriments of social capital as it relates to the race, well-being, and
State of residency within the United States. “Most analyses of social capital do not adequately
confront conditions associated with race and as a result they come to conclusions more benign
than a fuller assessment warrants‖ (Hero, 2003 p. 113). Hero (2003) examined the 1990 social
capital index created by (Putnam, 1990) to explain the important role social capital plays in race
and equality within the United States. Putnam (2000) established a variety of hypotheses on race
and social capital examining variables related to voting, poverty ratios, income, minority school
graduation rates, incarceration rates, and infant mortality rates.
Significant findings (Hero, 2003) reveal that 1) social capital does not have a positive
relationship to black and white poverty ratios 2) social capital is not related to more equal black
45
and white voter registration ratios 3) social capital has a positive relationship to black and white
per capita income ratios 4) states with high levels of social capital do not necessarily have high
rates of voter registration for blacks 5) states with high levels of social capital have a positive
relationship to lower black poverty rates 6) the income gap between blacks and whites is greater
in states with high social capital 7) states with high social capital have high incarceration rates
for blacks (Hero, 2003).
The results of Hero‘s (2003) analysis reveal that in states where there was more diversity,
there were higher levels of social capital – except among the majority White race population.
This resulted in negative effects on the minority population who possessed less social capital and
probably were least likely to be politically engaged. This study could lead one to believe that
states that contain social capital at high levels are socially and economically better for blacks –
but only in certain circumstances. The research revealed that social capital can arguably hurt
African Americans in states where Caucasians have high levels of social capital.
The social and economic conditions of African Americans may be a result of the African
American community‘s lack of responsibility for their own behaviors and issues that impact their
community. On the other hand, the social conditions that permeate the African American
community, particularly the high rates of poverty, incarceration, and single heads of households,
may not be about irresponsibility but about social injustices coupled with failed government
programs and policies that hinder the community‘s ability to improve their social conditions.
Regardless of either argument, increased engagement among African Americans, both civically
and politically, might be one solution to addressing issues that negatively impact the community
as a whole. Due to the lack of detailed literature and the need for further exploration of social
capital based on race, additional research is necessary.
46
Literature Review Interpretations
There are many historical, cultural, and personal factors that explain or predict civic and
political engagement including social capital and political trust–the purpose of this study. This
review of literature provides readers with an understanding and appreciation of the complexity
and commonalities of political trust, social capital, and political engagement, and how they are
connected to human development and social advancement. The review of literature explains
how social capital functions as source of family support, a source of access and control, and a
source of benefiting from networks that are familiar or unfamiliar. Social capital has many
consequences. This research explores one suggested consequence, political engagement.
A recurring theme in the review of literature was the concern that the American
democracy would have economic and social inequality if citizen trends of engagement, social
capital, and trust continue downward, especially in a country as ethnically diverse as America.
The literature also explains that when citizens of economic means and greater social capital
move to the suburbs and geographically separate themselves from those of lower economic
status, this can lead to segregated communities with citizens who live in poverty and have
limited individual and group resources to pull themselves out of poverty.
The literature review demonstrates how economic trends, political unrest, and threats to
human resource development lead to some form of personal or institutional trust (distrust),
creates or weakens social networks (including family ties), and engages or disengages citizens in
the political process. Researchers must be clearer in their definitions of social capital and
political trust and move beyond race, gender, and socioeconomic status (Brady, Verba, &
Schlozman, 1995) in their exploration and explanation about the influences on citizen political
behavior. On the opposite side of the spectrum, researchers should also consider broadening
47
their definition of political engagement and design measures that assess and compare
relationships using nontraditional forms of engagement such as e-petitions, buycotting, blogging,
and texting.
Government officials who are interested in public life would benefit from engaging
citizens in policy making and should be concerned when citizens are not engaged.
Disengagement may suggest that citizens lack trust in government, are becoming too isolated, do
not care about their fellow citizens, or reveal that democracy is not working efficiently and
effectively for all. Government agencies and elected officials must not ignore and be frightened
by politically engaged citizens. In fact, government organizations and officials should embrace
the beliefs, and differences in beliefs, of citizens. Citizens benefit from engaging with, for or
against, government officials and the policies officials create. Citizens also benefit from
engaging with one another in formal and informal settings. Hopefully, these processes of
engagement build trust.
48
CHAPTER THREE: METHODOLOGY
The primary objective of this research was to determine whether factors related to
political trust and social capital would predict political engagement. This chapter describes the
secondary data that was analyzed for this study, as well as the research design, data collection
methods, population, sample, survey methodology, and statistical analysis methodology.
Data Used for This Study
The data used for this study comes from the National Politics Survey (NPS) (Jackson,
Hutchings, Brown, & Wong, 2004) led by investigators of the Program for Research on Black
Americans and Center for Political Studies (CPS) and included James Jackson (University of
Michigan), Vincent Hutchings (University of Michigan), Ronald Brown (Wayne State
University), and Cara Wong (University of Illinois, Urbana-Champaign). The NPS study serves
as a collection of data related to ethnic minority and non-minority political and social attitudes
and behaviors, membership in organizations, and citizen connectivity with others. The NPS
provides researchers with the opportunity to use the data to conduct further studies that
contribute to the fields of political science, sociology, and human resource development.
The Louisiana State University Institutional Review Board (IRB) was not required for
this study because secondary data was analyzed. However, the initial researchers received IRB
approval (B04-00005938-R1).
Instrument Reliability
Survey items used in this study are all single item measures, therefore tests of reliability
such as Cronbach‘s Alpha were not applicable.
Instrument Validity
The NPS was sponsored by the National Science Foundation, the University of Michigan,
49
and the Carnegie Corporation. The study built upon the work and methodologies used in the
following studies (Jackson et. al., 2004):
National Survey of American Life (NSAL)
National Latino and Asian American Survey (NLAAS)
National Black Election Panel Study, 1984 and 1988 (ICPSR 9954)
National Black Politics Study, 1993 (ICPSR 2018)
Latino National Political Survey, 1989-1990 (ICPSR 6841)
National Asian American Political Survey, 2000-2001
Data Collection
The data for this survey was collected via computer-assisted telephone interview (CATI)
by an outside firm, DataStat. From September 2004 to February 2005, a total of 3,339 telephone
interviews were completed with persons throughout the United States. The sample consisted of
919 non-Hispanic Whites, 756 African Americans, 757 Hispanic Americans, 404 Caribbean
Black, and 503 Asian Americans. Fifty-seven percent (57%) of the survey respondents were
women and forty-three percent (43%) were men. The age of participants ranged from 18 to 100
years old.
Study Sample
The sample of 3,339 was taken from a stratified random national sample of 9,548
households who responded to the Center for Politics Study at the University of Michigan
National Survey of American Life (NSAL) (Jackson et. al., 2004). The remaining households
not used in this study were unable to be reached due to nonworking numbers or refusal to answer
NPS survey items. An interview was attempted at each household and the researchers were
careful to avoid interviewing the actual National Survey of American Life participant due to
50
concerns about respondent burden. Many NSAL households had moved during the time between
the NSAL and NPS study. This resulted in the unanticipated contacting and interviewing of
many new (non-NSAL) households that were not in the original NSAL sample.
The researchers used a stratified random sampling technique that intentionally
oversamples for minority populations. Stratified sampling divides the population into mutually
exclusive categories based on some related characteristic. Then, a sample is drawn randomly
from relatively homogeneous sub-groups. The sample can then be generalized to sub-groups if
the sample is large enough. Generally, stratification reduces sampling error. The sample from
the National Politics Study included Whites, Blacks, Hispanics, Asians, and Caribbeans. The
overall response rate was 30.63%. Whites‘ responded at a rate of 34.14%, African Americans
29.61%, Hispanics 28.54%, Asians 32.45%, and Caribbeans 30.45%.
Statistical Methodology
Logistic regression predicts the probability of an event occurring (Hair, Black, Babin,
Anderson, Tatham, 2006). Logistic regression uses a single dichotomous dependent variable and
a single or multiple independent variables, and does not assume normality. This study included
three dichotomous dependent variables that were each measured separately against predictor
(independent) variables. Logistic regression predicts a dependent variable probability value,
constrained to the range between 0 and 1 (Hair et al., 2006). The probability can be restated as
odds. The exponential betas were used in this study to calculate probability or odds of suggested
prediction of independent variables on the dependent variable. The formula used to calculate
probability is, p= exp(b)/(1+exp(b)).
A minimum of five, and some studies suggest twenty, observations are recommended per
independent variable (Hair, et al., 2006 p. 288) The ratio for this study is 30:1; therefore, meeting
51
the logistic regression guidelines.
In addition, logistic regression allows the researcher to enter independent variables in a
hierarchical fashion and assess how much the additional variables increase or improve upon the
likelihood of prediction, and can also assess whether the predictors go above and beyond
previous predictors or control variables entered into the hierarchy (Petrocelli, 2003). These tests
are often conducted using a type of regression called hierarchical logistic regression. The
hierarchical logistic regression technique was used to analyze the linear relationships for the
variables in this study.
Hierarchical regression allows researchers to specify a fixed order of entry for
independent variables into a model in order to control for the effects of covariates or test the
effects of certain predictors, independent of the influence of others. Hierarchical regression
allows any observed effects to be seen beyond the effects of controlled variables (Cohen, Cohen,
West, & Aiken, 2003).
Some variables take precedence in the hierarchy order of entry into the model. Entry of
variables into a hierarchical logistic regression can be based on ‗causal priority‘ or ‗research‘
(Cohen, et al, 2003). The order independent variables are entered in the model influences the
results and interpretations. For the purpose of this study, predictor variables were determined
based on a review of literature and theory. The variables were entered into SPSS based on
presumed causal priority.
Not only was the model tested for predictor significance, but the strengths of the
significance were also determined by using the Wald statistic. The Wald statistic is a test for
significance between an independent variable and a dependent variable. The negative or
positive results of the original coefficients, indicates the direction (positive or negative) of the
52
relationship (Hair et al., 2006).
Variables Used in the Study
Individual discussions were held with each member of the dissertation research
committee related to the use of secondary data from the National Politics Study. Dissertation
committee members also reviewed and approved the selected survey questions that were used to
measure the variables identified in this study. The final approval was obtained from the entire
dissertation committee.
Control Variables: Income, Educational Level, and Race
Individuals that possess the personal resources to access groups and certain networks
have access to resources that potentially positions them in a better place to engage in politics.
―Some studies show that individual-level resources such as one‘s socioeconomic status (e.g.,
race, income, education, and occupation) or one‘s psychological orientation towards politics
(e.g., interest in politics, knowledge of politics, political efficacy, and sense of civic duty) affects
the likelihood one will become involved in the political system (Campbell, Converse, Miller and
Stokes, 1960; Verba and Nie, 1972; Conway, 2000)‖ (Sekou, 2008, p. 4).
Research has focused heavily on predicting political engagement using socioeconomic status as
predictor variables. This approach is known as the standard socioeconomic model (Brady,
Verba, & Schlozman, 1995; Verba & Nie, 1972).
Using the hierarchical method, control variables were entered first in the analysis, then
the independent or predictor variables were entered. For the purpose of this study, control
variables included race (White, Black, Hispanic, Asian, and Caribbean), educational level (less
than high school, high school, some college, college, and graduate degree) and individual
income. These control variables were used as the baseline predictive model for the hierarchical
53
logistic regression. Education and race were considered nominal scales by the NPS study
authors and it was decided to use them as nominal scales in this study by identifying each as a
categorical-nominal variable in SPSS. Income was considered a metric scale by the NPS study
authors and it was decided to use it as a metric scale in this study by identifying it as such in
SPSS.
Independent Variable Block 1: Social Capital Characteristic Variables
As citizens create or identify networks based on traditions and norms, they build upon those
networks through trust and reciprocity to create social capital. Social relationships act as a
means through which individuals, households, small groups, and communities secure (or are
denied) access to resources. Schneider (2007) cited Portes (1998) and Boudieu (1986) in their
definition of social capital as the means to accessing networks, traditions, and norms through
individual and group resources. These networks provide opportunity for interaction on issues
that impact the individual or the individual‘s community (i.e., economically, socially, politically,
and culturally). A review of literature reveals a litany of characteristics of social capital, yet no
single defined measure emerged because all persons possess some type of resources through
family, friends, or membership in organizations that create social capital.
A review of the NPS 2004 survey was conducted by the researcher and based on the
literature and in consultation with committee members several survey items were discovered that
were related to social capital. The NPS includes 21 possible survey items that were related to
social capital as defined by an individual‘s networks, traditions, norms, and the individual‘s
access to groups that provide access to resources, networks, traditions, and norms. The
following NPS 2004 survey items are considered types of individual or group resources related
to social capital:
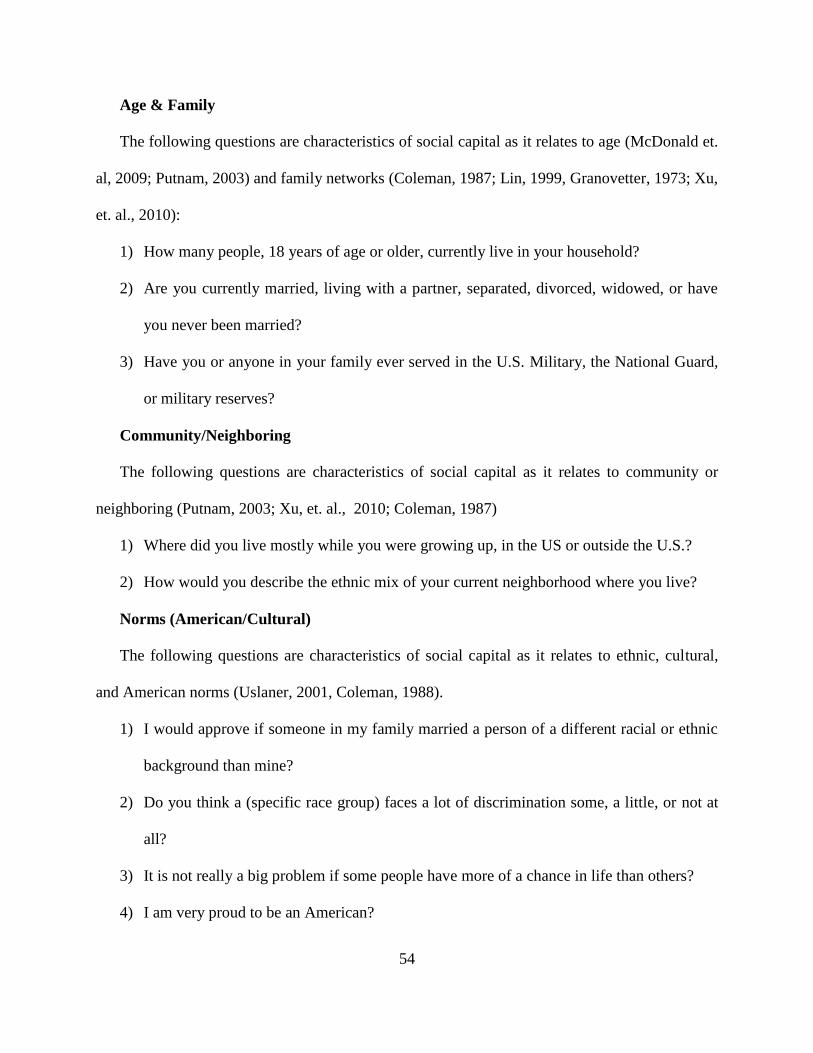
54
Age & Family
The following questions are characteristics of social capital as it relates to age (McDonald et.
al, 2009; Putnam, 2003) and family networks (Coleman, 1987; Lin, 1999, Granovetter, 1973; Xu,
et. al., 2010):
1) How many people, 18 years of age or older, currently live in your household?
2) Are you currently married, living with a partner, separated, divorced, widowed, or have
you never been married?
3) Have you or anyone in your family ever served in the U.S. Military, the National Guard,
or military reserves?
Community/Neighboring
The following questions are characteristics of social capital as it relates to community or
neighboring (Putnam, 2003; Xu, et. al., 2010; Coleman, 1987)
1) Where did you live mostly while you were growing up, in the US or outside the U.S.?
2) How would you describe the ethnic mix of your current neighborhood where you live?
Norms (American/Cultural)
The following questions are characteristics of social capital as it relates to ethnic, cultural,
and American norms (Uslaner, 2001, Coleman, 1988).
1) I would approve if someone in my family married a person of a different racial or ethnic
background than mine?
2) Do you think a (specific race group) faces a lot of discrimination some, a little, or not at
all?
3) It is not really a big problem if some people have more of a chance in life than others?
4) I am very proud to be an American?
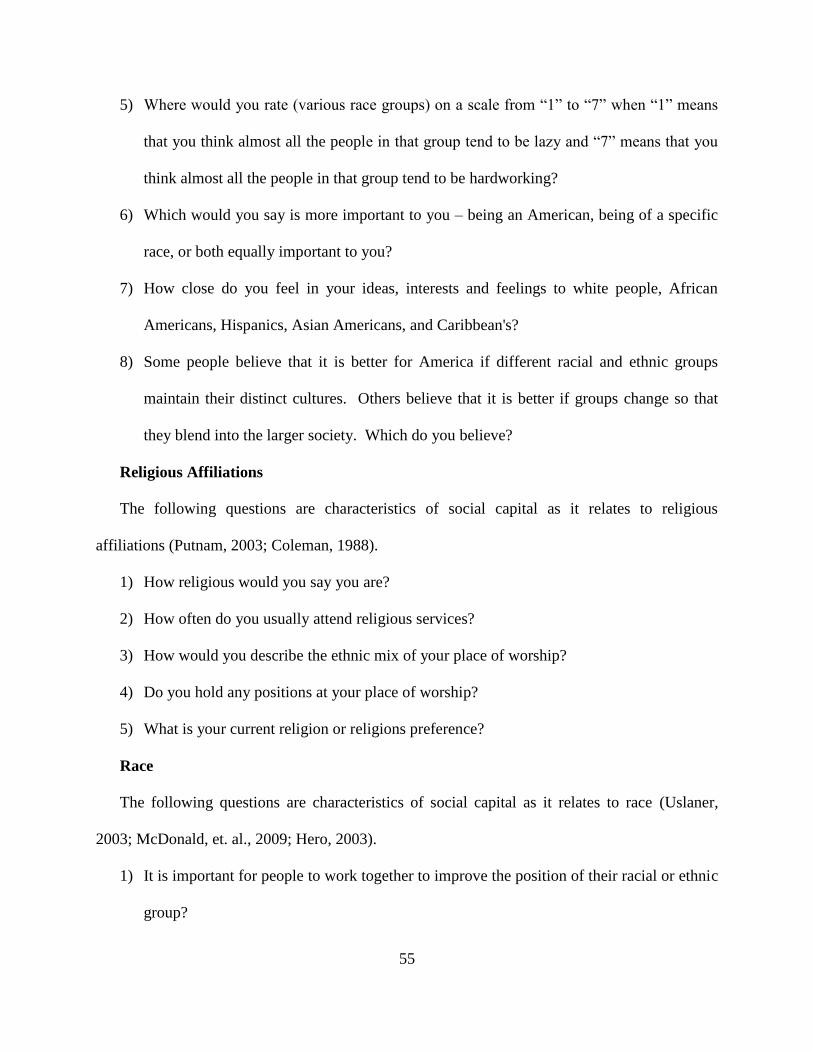
55
5) Where would you rate (various race groups) on a scale from ―1‖ to ―7‖ when ―1‖ means
that you think almost all the people in that group tend to be lazy and ―7‖ means that you
think almost all the people in that group tend to be hardworking?
6) Which would you say is more important to you – being an American, being of a specific
race, or both equally important to you?
7) How close do you feel in your ideas, interests and feelings to white people, African
Americans, Hispanics, Asian Americans, and Caribbean's?
8) Some people believe that it is better for America if different racial and ethnic groups
maintain their distinct cultures. Others believe that it is better if groups change so that
they blend into the larger society. Which do you believe?
Religious Affiliations
The following questions are characteristics of social capital as it relates to religious
affiliations (Putnam, 2003; Coleman, 1988).
1) How religious would you say you are?
2) How often do you usually attend religious services?
3) How would you describe the ethnic mix of your place of worship?
4) Do you hold any positions at your place of worship?
5) What is your current religion or religions preference?
Race
The following questions are characteristics of social capital as it relates to race (Uslaner,
2003; McDonald, et. al., 2009; Hero, 2003).
1) It is important for people to work together to improve the position of their racial or ethnic
group?

56
2) How would you describe the ethnic mix of your group of friends?
English Speaking
The following questions are characteristics of social capital as it relates to English as a first
language, and speaking multiple languages (McDonald, Lin Ao, 2009; McDonald, et. al., 2009).
1) Do you speak a language other than English?
Social Capital Items Used in this Study
Ultimately, the following four survey items were determined by the researcher to be the best
measures of social capital for the purposes of this study. The researcher selected the NPS study
because of its large sample of ethnic minorities and the researcher‘s proposed theoretical model
that examines the predictability of political engagement based on ethnicity and cultural norms.
1) How would you describe the ethnic mix of your current neighborhood where you live?
The NPS Survey 2004 initially coded the data in the following manner:
1 - Mostly White
2 – Mostly Black
3 – Mostly Hispanic
4 – Mostly Asian
5 – Other Black and White
6 – Other Black and Hispanic
7 – Other White and Hispanic
8 – Other Black, White, and Hispanic
9 – Other Black and Asian
10 – White and Asian
11 – Other Black, White and Asian
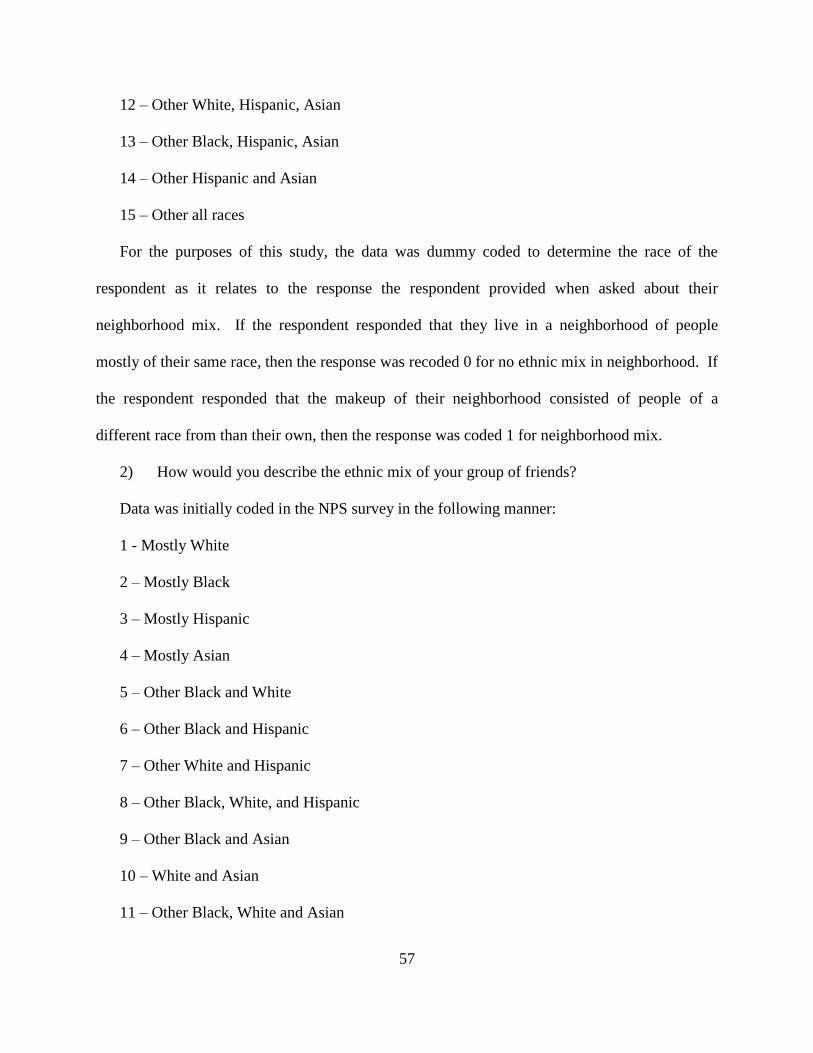
57
12 – Other White, Hispanic, Asian
13 – Other Black, Hispanic, Asian
14 – Other Hispanic and Asian
15 – Other all races
For the purposes of this study, the data was dummy coded to determine the race of the
respondent as it relates to the response the respondent provided when asked about their
neighborhood mix. If the respondent responded that they live in a neighborhood of people
mostly of their same race, then the response was recoded 0 for no ethnic mix in neighborhood. If
the respondent responded that the makeup of their neighborhood consisted of people of a
different race from than their own, then the response was coded 1 for neighborhood mix.
2) How would you describe the ethnic mix of your group of friends?
Data was initially coded in the NPS survey in the following manner:
1 - Mostly White
2 – Mostly Black
3 – Mostly Hispanic
4 – Mostly Asian
5 – Other Black and White
6 – Other Black and Hispanic
7 – Other White and Hispanic
8 – Other Black, White, and Hispanic
9 – Other Black and Asian
10 – White and Asian
11 – Other Black, White and Asian
58
12 – Other White, Hispanic, Asian
13 – Other Black, Hispanic, Asian
14 – Other Hispanic and Asian
15 – Other all races
For the purposes of this study, the data was dummy coded to determine the race of the
respondent as it relates to the response the respondent provided to ethnic mix of friends. If the
respondent responds that they have friends mostly of their same race, then the response was
recoded 0 for no ethnic mix of friends. If the respondent responded that the makeup of their
friends were people of a different race from their own, then the response was coded for 1 for
ethnic mix of friends.
3) How close do you feel in your ideas, interests and feelings to white people, African
Americans, Hispanics, Asian Americans, and Caribbean's?
This item was measured using a 4-point anchored scale coded in the NPS study in the
following manner:
1 - Very Close
2 – Fairly Close
3 – Not Too Close
4 – Not Close At All
This response scale was considered a nominal scale by the NPS study authors and it was decided
to use it as a nominal scale in this study by identifying it as a categorical-nominal variable in
SPSS.
4) Some people believe that it is better for America if different racial and ethnic groups
maintain their distinct cultures. Others believe that it is better if groups change so that they blend
59
into the larger society. Which do you believe?
Data was initially coded in the NPS study the following manner:
1 – Maintain Distinct Cultures
2 – Blend into Larger Society
3 – Both
This response scale was considered a nominal scale by the NPS study authors and it was decided
to use it as a nominal scale in this study by identifying it as a categorical-nominal variable in
SPSS.
Independent Variable Block 2: Political Trust
The second independent variable added to the model was political trust. The item used in this
study is the only true measure of political trust on the NPS 2004 Survey and has been used in the
American National Election Study since 1958. Though its vagueness has been heavily debated
(Gershtenson & Plane, 2007), it has been determined to be the best measurement of political trust
in America.
Political trust for this study was measured by the respondent‘s level of trust towards the
federal government in Washington, D.C. This includes nationally elected officials and federal
government agencies. This single item was:
1) How much of the time do you think you can trust the government in Washington?
This item was measured using a 4-point anchored scale. Data was coded:
1 - Just about always
2 - Most of the time
3 - Only some of the time
4 - Never
60
This response scale was considered an ordinal scale by the study authors and it was decided to
use it as an ordinal scale in this study by identifying it as a categorical-ordinal variable in SPSS.
Dependent Variables: Political Engagement
There were three dependent variables that measure political engagement for this study
and each were analyzed separately with the independent variables. Thus, three separate
hierarchical logistic regression models were created, each having the three blocks of independent
variables described above.
Based on a review of literature by the researcher, there are eight NPS 2004 survey items
that measure political engagement. After several discussions with the dissertation committee, it
was determined that the following three survey items would be most useful in this study to
measure political engagement.
1) Did you talk to any people and try to show them why they should vote for or against one
of the parties or candidates?
Data was coded as follows in the NPS study:
1 -Yes
5 - No
2) Did you go to any political meetings, rallies, speeches, dinners, or things like that in
support of a particular candidate?
Data was coded in the following manner in the NPS study:
1 -Yes
5 - No
3) Did you vote in the elections this November?
Data was coded in the following manner in the NPS study:
61
1 -Yes
5 - No
All three of these scales were considered nominal scales by the NPS study authors and it was
decided to use them as nominal scales in this study by identifying them as a categorical-nominal
variable in SPSS.
The researcher‘s rationale for inclusion of these survey items to measure political
engagement was based on a review of literature and discussions with the dissertation committee
that the preferred traditional forms of political engagement activities within the American
democratic culture such as voting and attending rallies would be more appropriate instead of the
nontraditional methods such as blogging, e-petitions, text advocacy, and boycotting. Other NPS
2004 survey items that were determined to measure political engagement but were not used in
this study include:
1. Have you ever worked for a political party or campaigned for a political candidate?
2. Did you give or help raise money for any of the candidates?
3. Did you help campaign for a racial minority candidate?
4. In the past twelve months have you:
a. Called, written, or visited a public official about a concern or problem?
b. Attended a meeting about an issue facing your community or schools?
c. Worked with any people to deal with some issue facing your community?
d. Participated in any groups or organizations that are working to improve the
conditions of racial or ethnic minorities?
5. How much of your place of worship is involved in politics?

62
Data Analysis
All data were coded and entered into Statistical Package for the Social Sciences. The Binary
Logistic Regression procedure was used with the three sets of independent variables entered as
blocks in the procedure. SPSS automatically produces the required statistics as it enters the
variables in the prescribed order.
Model Estimation
The model estimation is the process by which the ‘most likely estimates for the
coefficients‘ are determined (Hair et al., 2006). The maximum likelihood procedure tests the
goodness of fit of the model. A model that is a good fit will result in a small likelihood value. A
perfect fitting model will have a likelihood of zero. As additional independent variables are
added, the maximum likelihood procedure attempts to achieve a better fit. The maximum
likelihood procedure attempts to get closer and closer to zero, until a ‗convergence‘ happens,
which is the point where the likelihood of an event occurring no longer changes (Cohen et al.,
2003).
The procedure recommended by Hair, et. al., 2006 was used to assess model fit.
Estimate a null model. The most common null models are without any independent variables.
1. Estimate the proposed model. This model contains the independent variables to be
included in the logistic regression model. Model fit will improve if the model results in a
lower -2LL.
2. Assess -2LL difference with Chi-square. Assess the statistical significance of the
difference between the -2LL values of the null model and model containing independent
variable(s) models. The chi-square test is used to interpret the improvement of the model
once independent variables are entered into the model (Hair et al., 2006). If the chi-

63
square test results in statistically significant differences, then the model that includes the
independent variables will be reported as statistically significant and a good fit (Hair et
al., 2006).
3. Assess overall fit. The Hosmer & Lemeshow test measures overall fit of model to the
data. If these test results in a significance value of greater than .05, this non-significant
value indicates that the ―model is acceptable‖ because there are no significant differences
that remain between the actual data and the model so the fit is acceptable (Hair et. al.,
2006 p. 372).
4. Examine classification accuracy. The percentage of cases classified correctly in
hypothesized models is determined based on the percentage of difference from the
baseline model. Logistic regression calculates the probability that a percentage of
correctly classified cases belong to the proposed model. Percentage of classified cases
correctly predicted should increase to discern improvement in the model (Hair et al.,
2006).
5. Assess the pseudo R-squared statistic. Logistic regression has several pseudo R-squared
measures that are similar to R2 in multivariate regression. They indicate the total
improvement in the classification of the dependent variable accounted for by a set of
independent variable predictors. For the purposes of this study the Nagelkerke Index will
be used as the appropriate pseudo R2 because its values range from 0.0 to 1.0 (Hair et al.,
2006).
6. Examine significance of predictors. The Wald statistic is the test for significance
between an independent variable and the dependent variable. If the statistic is significant
the coefficient is interpreted in terms of how it impacts the estimated probability and

64
prediction of group membership (Hair et al., 2006). The Wald statistic is provided in
SPSS, and is calculated as (B/S.E.)².
7. Assess magnitude of predictor relationships. The Beta is used to interpret the probability
of an event occurring (Hair, et al., 2006). The base probability of an event occurring is
equal to 50 percent (with 50 percent chance of the event not occurring). Each base model
log likelihood value of -2LL will provide the percentage of likelihood the cases are
classified correctly, or the likelihood of the model being correct. In logistic regression,
the dichotomous dependent variable predicts the percentage of ‗yes‘ versus ‗no‘
responses. The probability ranges from 0.0 to 1.0. The odds exceed 1.0 when the
probability exceeds .5; the odds are less than 1 (but never negative), when the probability
is less than .5 (Cohen et. al., 2003). The exponentiated Beta (exp(B)) is examined to
determine the magnitude of the change in probability due to each independent variable.
Hypothesis Testing
Hypotheses 1 – 3 in this study correspond to each of the blocks of independent variables.
Thus, each of the three dependent variables produced four blocks in the analysis:
Block 0 – null model with no independent variables
Block 1 – Control model with race, income and education variables entered
Block 2 – Social capital independent variables entered
Block 3 – Political trust independent variables entered
The significance of each model and its independent variables was evaluated using the above
procedures.

65
CHAPTER FOUR: RESULTS
This study was designed to explore whether political trust and social capital predict
political engagement. This chapter presents results related to the study objectives including a
description of the sample and hypotheses presented in chapter one.
Characteristics of the Sample
The total sample for this study was 3,339. Fifty-seven percent (57%) of survey
respondents were women and forty-three percent (43%) were men. The participants ranged from
18 to 100 years old. Figure 4.1 shows the racial distribution of the sample.
It is important to note that the sample overweights minority groups as whites make up
77% of the total U.S. population (US Census, American Community Survey, 2009), yet only
27% of the sample was White. Asians (23%) and Blacks (23%) are also notably overweighted in
this sample, as they make up only 5% and 13% of the total population. Sixty-eight percent
(68%) of the respondents were born in the United States and thirty-two (32%) percent at the time
of the survey were currently applying to become a United States citizen or planning to apply for
United States citizenship.
27%23%
12%
23%
15%
White Black Hispanics Asian Caribbean
Sample Population by Race
Respondents by Race
Figure 4.1: Sample Population by Race
Figure 4.2 shows the geographic distribution of the respondents. The South is clearly the
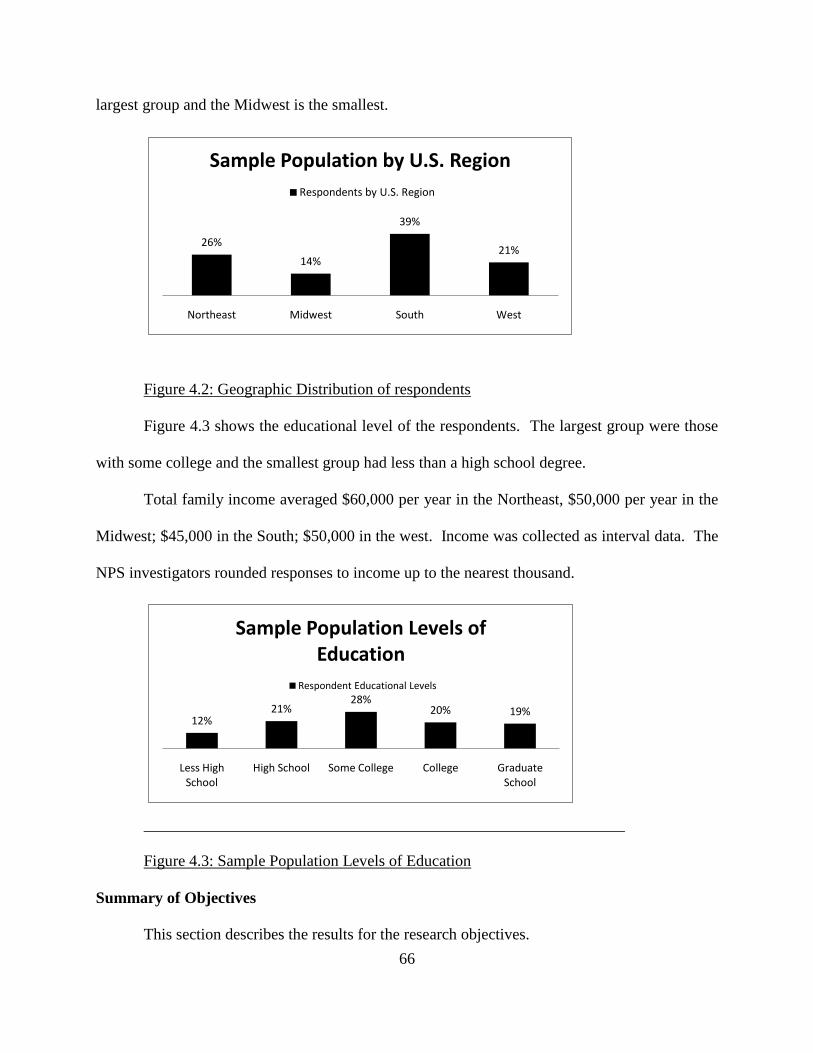
66
largest group and the Midwest is the smallest.
26%
14%
39%
21%
Northeast Midwest South West
Sample Population by U.S. Region
Respondents by U.S. Region
Figure 4.2: Geographic Distribution of respondents
Figure 4.3 shows the educational level of the respondents. The largest group were those
with some college and the smallest group had less than a high school degree.
Total family income averaged $60,000 per year in the Northeast, $50,000 per year in the
Midwest; $45,000 in the South; $50,000 in the west. Income was collected as interval data. The
NPS investigators rounded responses to income up to the nearest thousand.
12%21%
28%20% 19%
Less High School
High School Some College College Graduate School
Sample Population Levels of Education
Respondent Educational Levels
Figure 4.3: Sample Population Levels of Education
Summary of Objectives
This section describes the results for the research objectives.
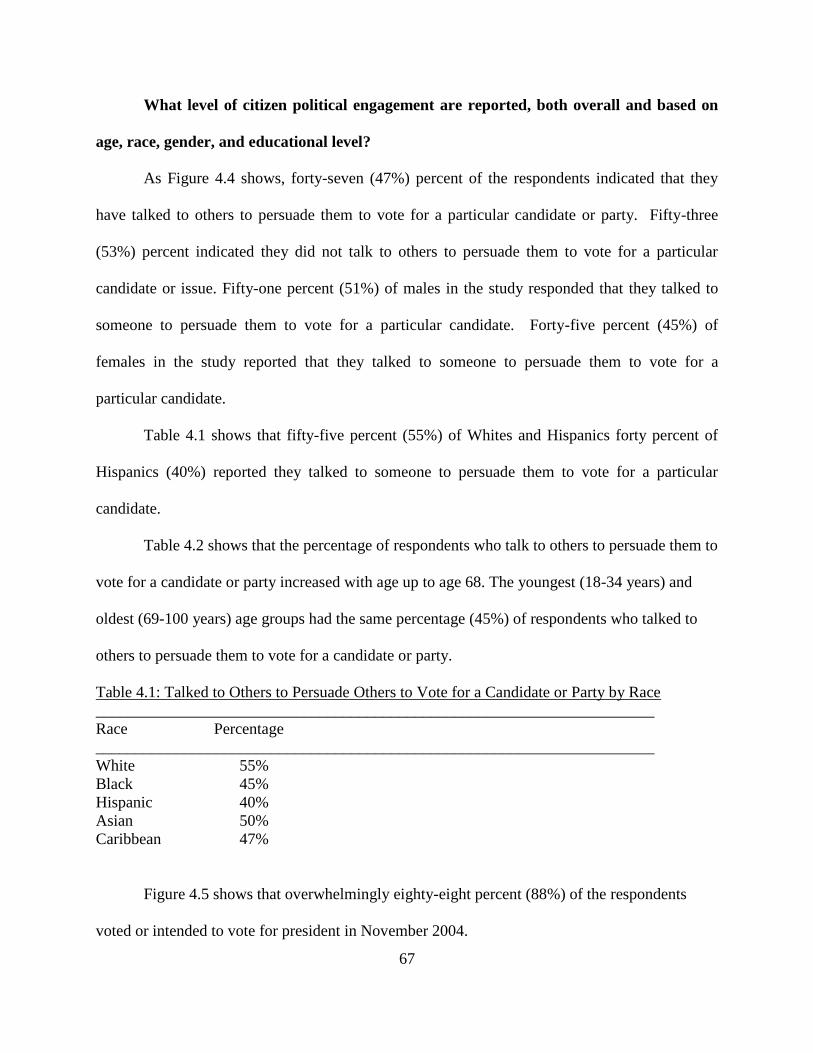
67
What level of citizen political engagement are reported, both overall and based on
age, race, gender, and educational level?
As Figure 4.4 shows, forty-seven (47%) percent of the respondents indicated that they
have talked to others to persuade them to vote for a particular candidate or party. Fifty-three
(53%) percent indicated they did not talk to others to persuade them to vote for a particular
candidate or issue. Fifty-one percent (51%) of males in the study responded that they talked to
someone to persuade them to vote for a particular candidate. Forty-five percent (45%) of
females in the study reported that they talked to someone to persuade them to vote for a
particular candidate.
Table 4.1 shows that fifty-five percent (55%) of Whites and Hispanics forty percent of
Hispanics (40%) reported they talked to someone to persuade them to vote for a particular
candidate.
Table 4.2 shows that the percentage of respondents who talk to others to persuade them to
vote for a candidate or party increased with age up to age 68. The youngest (18-34 years) and
oldest (69-100 years) age groups had the same percentage (45%) of respondents who talked to
others to persuade them to vote for a candidate or party.
Table 4.1: Talked to Others to Persuade Others to Vote for a Candidate or Party by Race
______________________________________________________________________
Race Percentage
______________________________________________________________________
White 55%
Black 45%
Hispanic 40%
Asian 50%
Caribbean 47%
Figure 4.5 shows that overwhelmingly eighty-eight percent (88%) of the respondents
voted or intended to vote for president in November 2004.
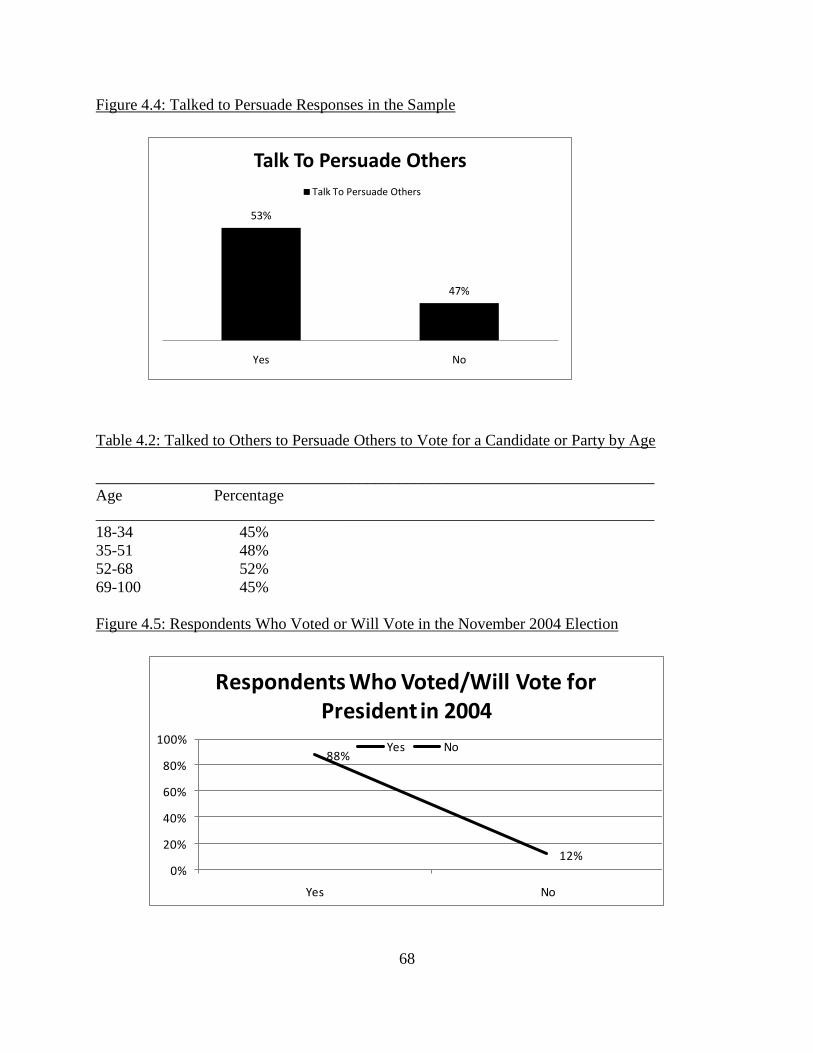
68
Figure 4.4: Talked to Persuade Responses in the Sample
53%
47%
Yes No
Talk To Persuade Others
Talk To Persuade Others
Table 4.2: Talked to Others to Persuade Others to Vote for a Candidate or Party by Age
______________________________________________________________________
Age Percentage
______________________________________________________________________
18-34 45%
35-51 48%
52-68 52%
69-100 45%
Figure 4.5: Respondents Who Voted or Will Vote in the November 2004 Election
88%
12%0%
20%
40%
60%
80%
100%
Yes No
Respondents Who Voted/Will Vote for President in 2004
Yes No
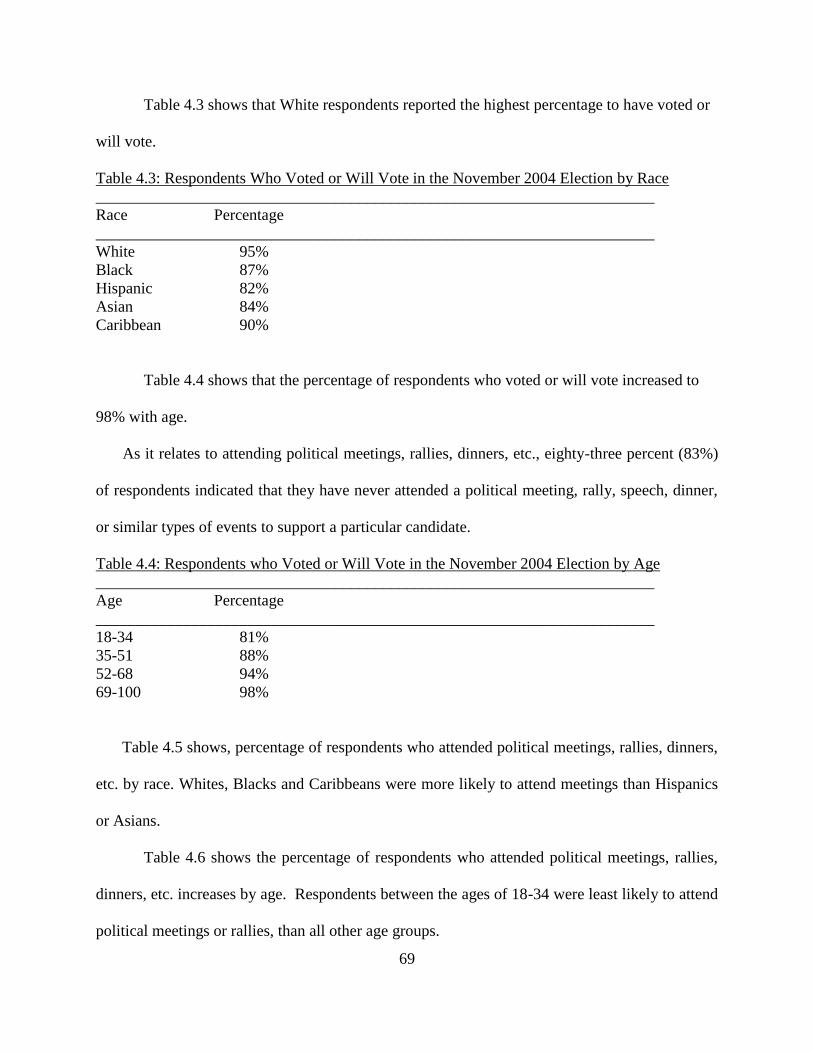
69
Table 4.3 shows that White respondents reported the highest percentage to have voted or
will vote.
Table 4.3: Respondents Who Voted or Will Vote in the November 2004 Election by Race
______________________________________________________________________
Race Percentage
______________________________________________________________________
White 95%
Black 87%
Hispanic 82%
Asian 84%
Caribbean 90%
Table 4.4 shows that the percentage of respondents who voted or will vote increased to
98% with age.
As it relates to attending political meetings, rallies, dinners, etc., eighty-three percent (83%)
of respondents indicated that they have never attended a political meeting, rally, speech, dinner,
or similar types of events to support a particular candidate.
Table 4.4: Respondents who Voted or Will Vote in the November 2004 Election by Age
______________________________________________________________________
Age Percentage
______________________________________________________________________
18-34 81%
35-51 88%
52-68 94%
69-100 98%
Table 4.5 shows, percentage of respondents who attended political meetings, rallies, dinners,
etc. by race. Whites, Blacks and Caribbeans were more likely to attend meetings than Hispanics
or Asians.
Table 4.6 shows the percentage of respondents who attended political meetings, rallies,
dinners, etc. increases by age. Respondents between the ages of 18-34 were least likely to attend
political meetings or rallies, than all other age groups.
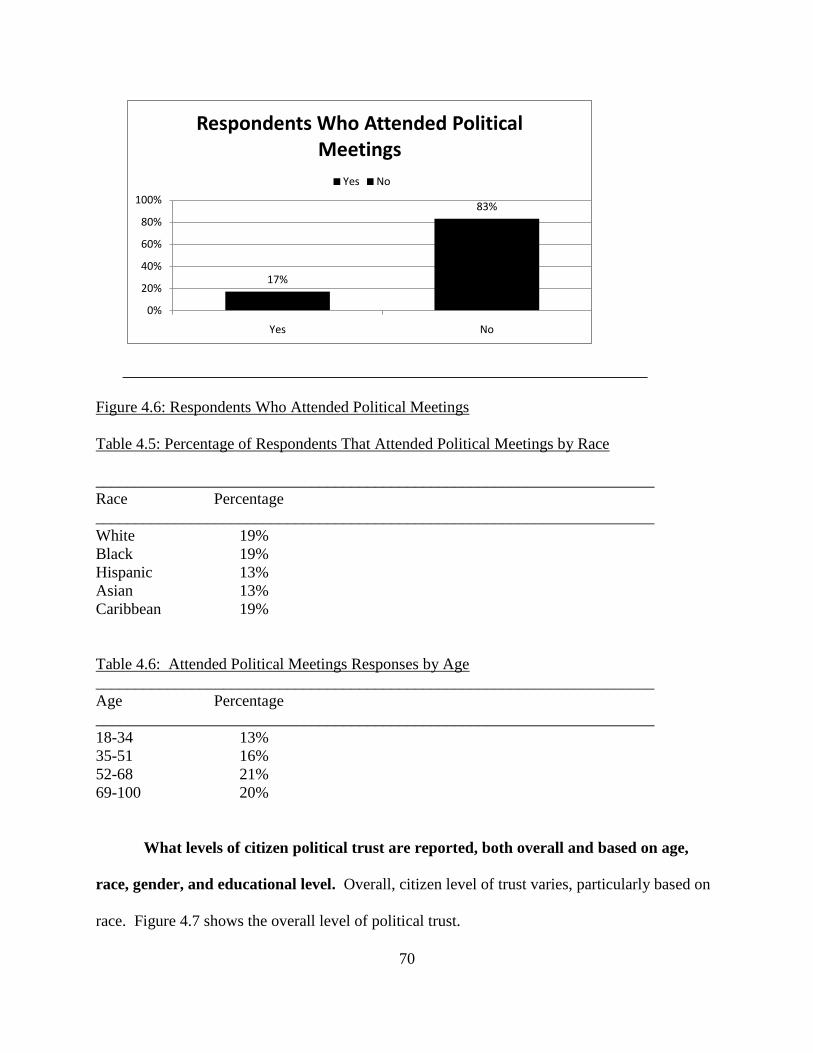
70
17%
83%
0%
20%
40%
60%
80%
100%
Yes No
Respondents Who Attended Political Meetings
Yes No
Figure 4.6: Respondents Who Attended Political Meetings
Table 4.5: Percentage of Respondents That Attended Political Meetings by Race
______________________________________________________________________
Race Percentage
______________________________________________________________________
White 19%
Black 19%
Hispanic 13%
Asian 13%
Caribbean 19%
Table 4.6: Attended Political Meetings Responses by Age
______________________________________________________________________
Age Percentage
______________________________________________________________________
18-34 13%
35-51 16%
52-68 21%
69-100 20%
What levels of citizen political trust are reported, both overall and based on age,
race, gender, and educational level. Overall, citizen level of trust varies, particularly based on
race. Figure 4.7 shows the overall level of political trust.
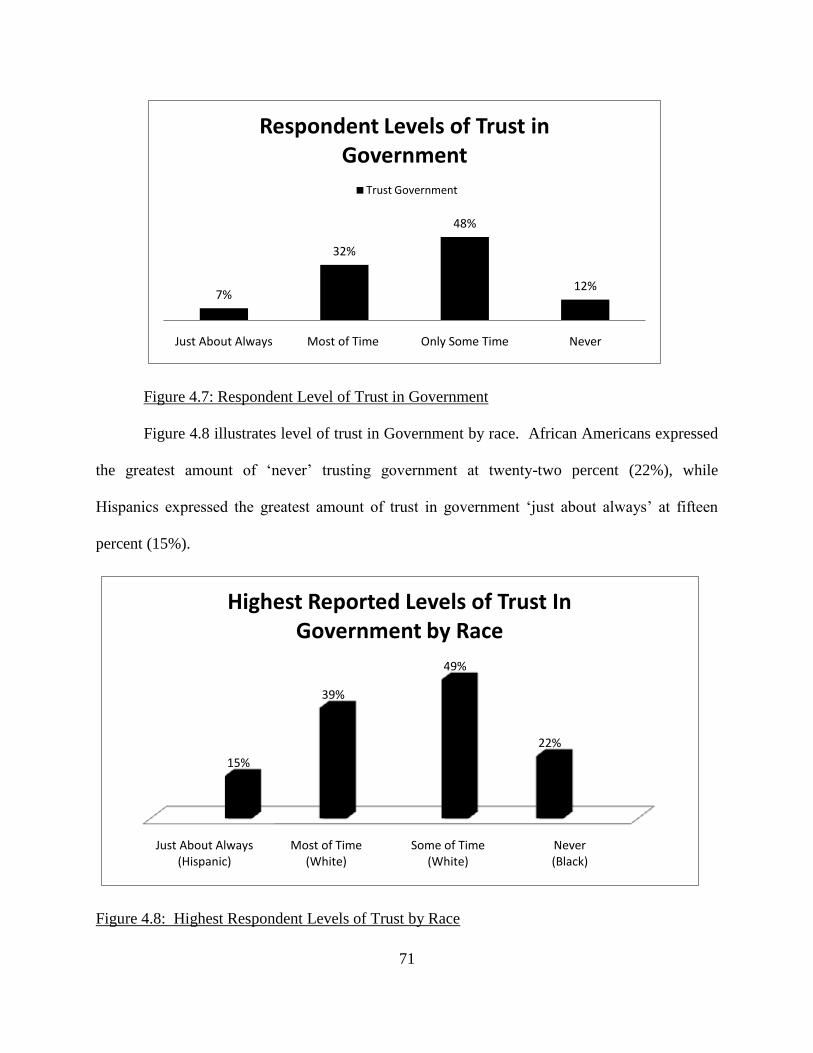
71
7%
32%
48%
12%
Just About Always Most of Time Only Some Time Never
Respondent Levels of Trust in Government
Trust Government
Figure 4.7: Respondent Level of Trust in Government
Figure 4.8 illustrates level of trust in Government by race. African Americans expressed
the greatest amount of ‗never‘ trusting government at twenty-two percent (22%), while
Hispanics expressed the greatest amount of trust in government ‗just about always‘ at fifteen
percent (15%).
Just About Always (Hispanic)
Most of Time (White)
Some of Time (White)
Never (Black)
22%
39%
49%
15%
Highest Reported Levels of Trust In Government by Race
Figure 4.8: Highest Respondent Levels of Trust by Race

72
What level of social capital are reported among citizens, both overall and based on
age, race, gender, and educational level.
Table 4.7 shows, Asians (93%) and Caribbeans (100%) are the only races that reported
having over a majority of friends that are opposite of their own race.
Table 4.7: Social Capital as Measured by Respondents that have Friends of Ethnically Mixed by
Age
______________________________________________________________________
Race Percentage
______________________________________________________________________
White 49%
Black 46%
Hispanic 47%
Asian 93%
Caribbean 100%
Table 4.8 shows, that respondents who indicated they attended Graduate School reported
the highest percentage of ethnically mixed friends. Respondents who responded that their highest
level of education completed was High School, reported the smallest percentage of ethnically
mixed friends among all educational levels categorized in the study.
Table 4.8: Ethnically Mixed Friends by Educational Level
______________________________________________________________________
Race Percentage
______________________________________________________________________
Less HS 54%
High School 52%
Some College 59%
College 66%
Graduate School 72%
Table 4.9 shows that as respondents that indicated they attended some college and
Graduate School reported the highest percentages of living in an ethnically diverse
neighborhood. Figure 4.9, adapted from the National Politics Study Respondents Report (Krenz,
2006 p. 9), revealed that all races felt closest to their own race, except Caribbean blacks.
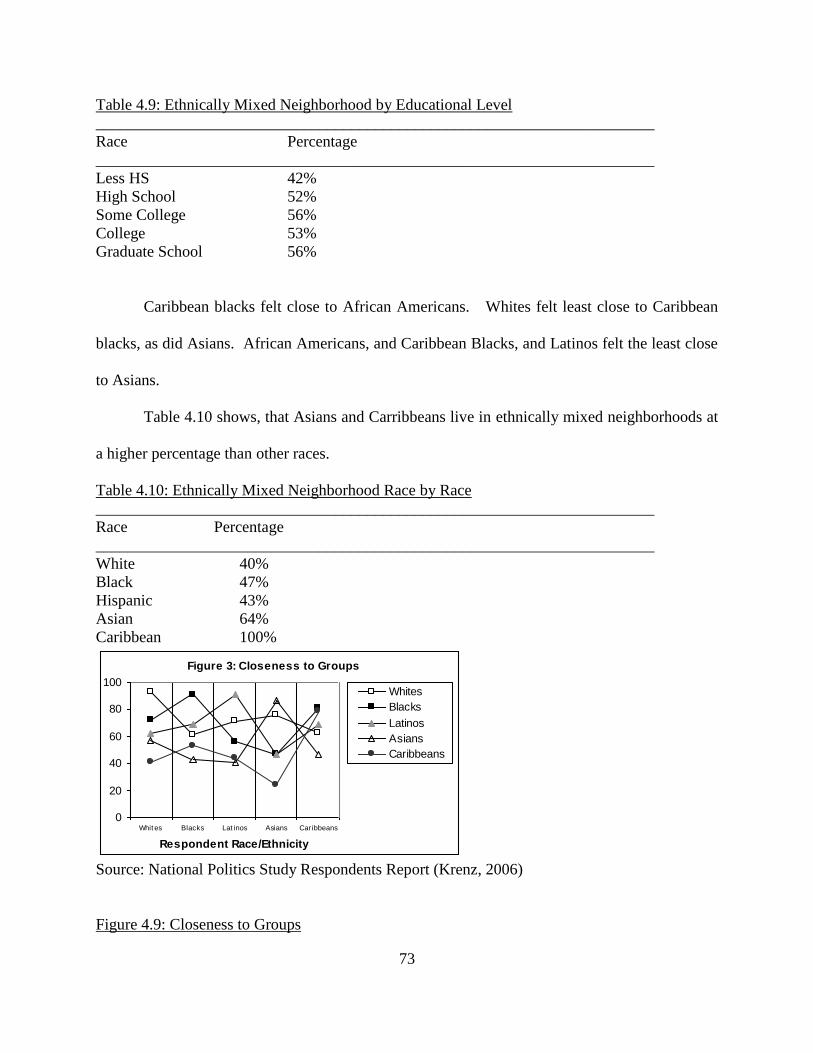
73
Table 4.9: Ethnically Mixed Neighborhood by Educational Level
______________________________________________________________________
Race Percentage
______________________________________________________________________
Less HS 42%
High School 52%
Some College 56%
College 53%
Graduate School 56%
Caribbean blacks felt close to African Americans. Whites felt least close to Caribbean
blacks, as did Asians. African Americans, and Caribbean Blacks, and Latinos felt the least close
to Asians.
Table 4.10 shows, that Asians and Carribbeans live in ethnically mixed neighborhoods at
a higher percentage than other races.
Table 4.10: Ethnically Mixed Neighborhood Race by Race
______________________________________________________________________
Race Percentage
______________________________________________________________________
White 40%
Black 47%
Hispanic 43%
Asian 64%
Caribbean 100%
Figure 3: Closeness to Groups
0
20
40
60
80
100
Whit es Blacks Lat inos Asians Caribbeans
Respondent Race/Ethnicity
Whites
Blacks
Latinos
Asians
Caribbeans
Source: National Politics Study Respondents Report (Krenz, 2006)
Figure 4.9: Closeness to Groups
74
Table 4.11 shows the percentage of respondents who believe that it is better for America if
different racial and ethnic groups maintain their distinct cultures . Asians are the least likely to
believe that cultures should blend and the greatest percentage of respondents who believe that
cultures should maintain distinctness.
Table 4.12 shows that regardless of level of education the majority of individuals
surveyed believed that cultures should blend.
Table 4.11: Cultural Blending by Race
______________________________________________________________________
Race Distinct Blend Both
______________________________________________________________________
White 33% 54% 13%
Black 38% 56% 6%
Hispanic 33% 59% 8%
Asian 46% 41% 13%
Caribbean 38% 56% 6%
Table 4.12: Cultural Blending by Educational Level
______________________________________________________________________
Education Maintain Blend Both
______________________________________________________________________
Less HS 30% 66% 4%
High School 32% 66% 2%
Some College 45% 53% 1%
College 40% 47% 13%
Graduate School 40% 45% 15%
Hypotheses Testing
The researcher proposed nine hypotheses to suggest the prediction of three dependent
variables by multiple independent variables. A review of literature revealed that these
hypotheses have never been tested, especially with such a large sample of ethnic minorities.
While the hypotheses were grouped by theoretical construct (e.g. social capital, political trust,
etc), the clearest way to present the hierarchical regression results is by each dependent variable.
Thus, this section is organized in that manner.

75
Political engagement dependent variable 1 – citizens who talk to people to persuade
them to vote for a particular candidate or party.
This section discusses the results for the first dependent variable, citizens who talk to
people to persuade them.
H1a: Control variables will contribute significantly to the prediction of citizens who
talk to people and try to show them why they should vote for or against one of the parties
or candidates.
Table 4.13 shows the base model, also known as the null model, without predictor
variables correctly predicted 51.4% of the cases. The control model resulted in a -2LL of
3850.993 which was a significant decrease from the base model as evidenced by Omnibus Tests
of Model Coefficients chi-square statistic (133.651, p<0.05; see Table 4.14).
Table 4.13: Classification Tablea,b
Base Model Talk to Persuade Without Predictor Variables
Observed Predicted
Talk to persuade Percentage
Correct
Yes No
Step 0 Talk to persuade Yes 0 1397 .0
No 0 1479 100.0
Overall Percentage 51.4
a. Constant is included in the model.
b. The cut value is .500
Table 4.14: Omnibus Tests of Model Coefficients Talk to Persuade Control Variables
Chi-square df Sig.
Step 1 Step 133.651 9 .000
Block 133.651 9 .000
Model 133.651 9 .000

76
The Hosmer and Lemeshow Test of goodness of fit (see Table 4.15) was acceptable
(3.787, p>0.05). The p-value is not significant, indicating that there are no significant
differences between actual data and expected model values (Hair et al, 2006).
Table 4.16 shows that the Nagelkerke pseudo R-square (variance) is small (6%) while
Table 4.17 shows that 58.4 percent of the cases were correctly predicted.
Table 4.15: Hosmer and Lemeshow Test for Talk to Persuade Control Variables
Step Chi-square Df Sig.
1 3.787 8 .876
Table 4.16: Model Summary for Talk to Persuade Control Variables
Step
-2 Log likelihood
Cox & Snell R
Square
Nagelkerke R
Square
1 3850.993a .045 .061
Table 4.17: Classification Tablea for Talk to Persuade Control Variables
Observed Predicted
Talk to persuade Percentage
Correct
Yes No
Step 1 Talk to persuade Yes 924 473 66.1
No 724 755 51.0
Overall Percentage 58.4
a. The cut value is .500
Table 4.18 shows that race (p=.011) and education (p<.001) were significant in predicting
the dependent variable. Possessing a college degree was the only insignificant educational level
variable (p=.593). Income was also not significant (p=.493).
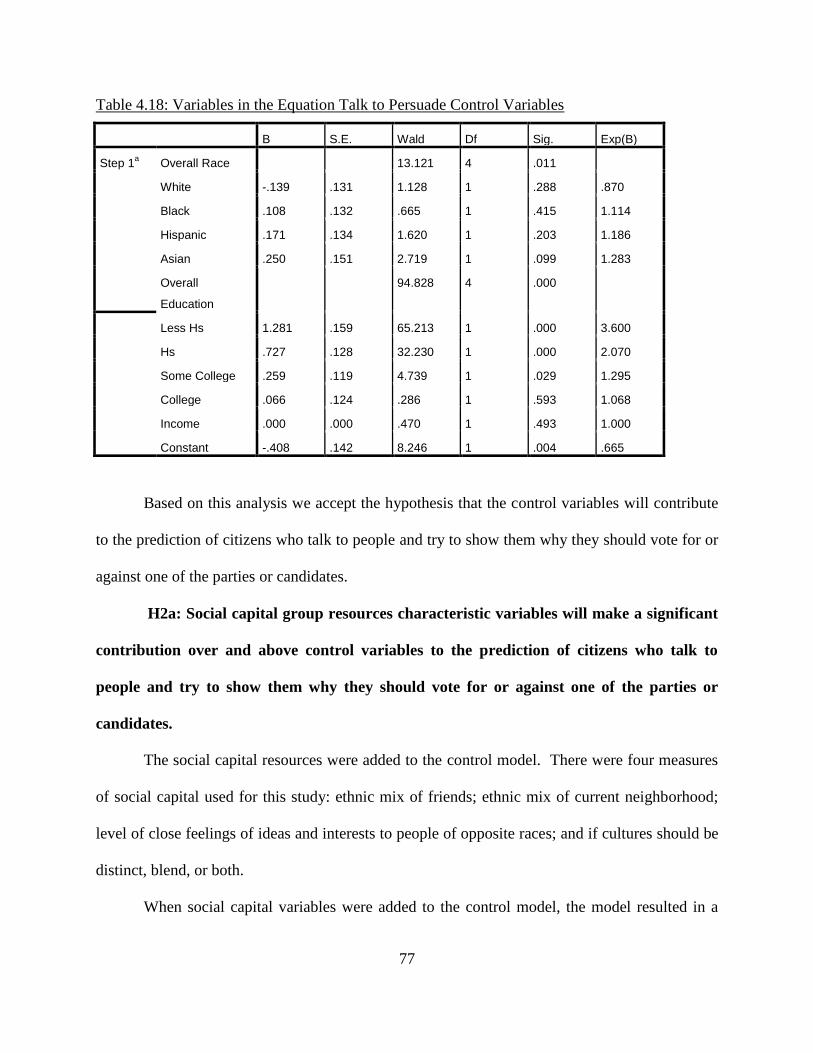
77
Table 4.18: Variables in the Equation Talk to Persuade Control Variables
B S.E. Wald Df Sig. Exp(B)
Step 1a
Overall Race 13.121 4 .011
White -.139 .131 1.128 1 .288 .870
Black .108 .132 .665 1 .415 1.114
Hispanic .171 .134 1.620 1 .203 1.186
Asian .250 .151 2.719 1 .099 1.283
Overall
Education
94.828 4 .000
Less Hs 1.281 .159 65.213 1 .000 3.600
Hs .727 .128 32.230 1 .000 2.070
Some College .259 .119 4.739 1 .029 1.295
College .066 .124 .286 1 .593 1.068
Income .000 .000 .470 1 .493 1.000
Constant -.408 .142 8.246 1 .004 .665
Based on this analysis we accept the hypothesis that the control variables will contribute
to the prediction of citizens who talk to people and try to show them why they should vote for or
against one of the parties or candidates.
H2a: Social capital group resources characteristic variables will make a significant
contribution over and above control variables to the prediction of citizens who talk to
people and try to show them why they should vote for or against one of the parties or
candidates.
The social capital resources were added to the control model. There were four measures
of social capital used for this study: ethnic mix of friends; ethnic mix of current neighborhood;
level of close feelings of ideas and interests to people of opposite races; and if cultures should be
distinct, blend, or both.
When social capital variables were added to the control model, the model resulted in a
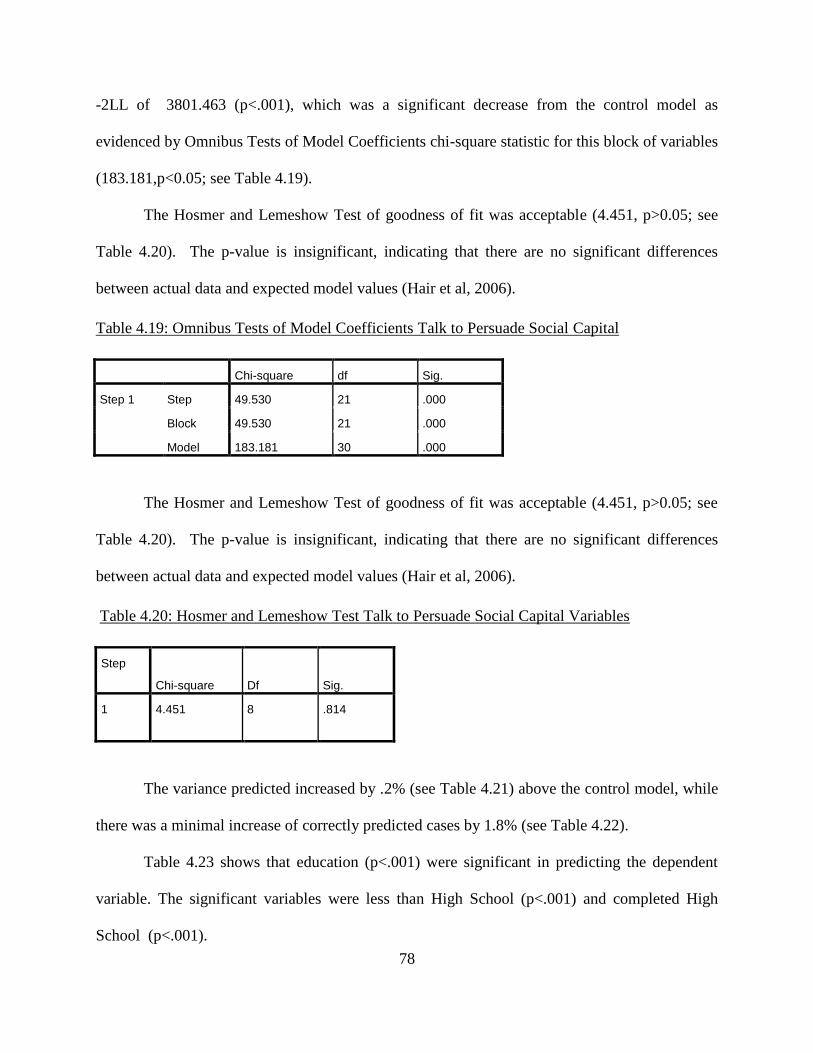
78
-2LL of 3801.463 (p<.001), which was a significant decrease from the control model as
evidenced by Omnibus Tests of Model Coefficients chi-square statistic for this block of variables
(183.181,p<0.05; see Table 4.19).
The Hosmer and Lemeshow Test of goodness of fit was acceptable (4.451, p>0.05; see
Table 4.20). The p-value is insignificant, indicating that there are no significant differences
between actual data and expected model values (Hair et al, 2006).
Table 4.19: Omnibus Tests of Model Coefficients Talk to Persuade Social Capital
Chi-square df Sig.
Step 1 Step 49.530 21 .000
Block 49.530 21 .000
Model 183.181 30 .000
The Hosmer and Lemeshow Test of goodness of fit was acceptable (4.451, p>0.05; see
Table 4.20). The p-value is insignificant, indicating that there are no significant differences
between actual data and expected model values (Hair et al, 2006).
Table 4.20: Hosmer and Lemeshow Test Talk to Persuade Social Capital Variables
Step
Chi-square Df Sig.
1 4.451 8 .814
The variance predicted increased by .2% (see Table 4.21) above the control model, while
there was a minimal increase of correctly predicted cases by 1.8% (see Table 4.22).
Table 4.23 shows that education (p<.001) were significant in predicting the dependent
variable. The significant variables were less than High School (p<.001) and completed High
School (p<.001).
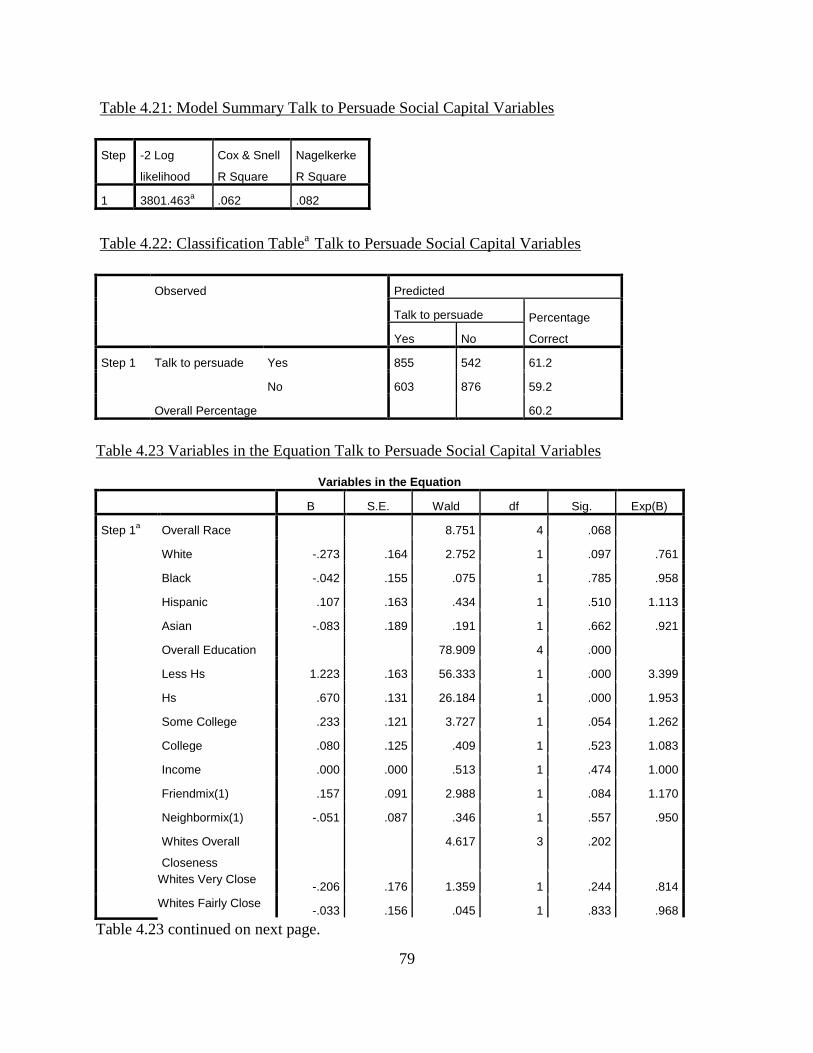
79
Table 4.21: Model Summary Talk to Persuade Social Capital Variables
Step -2 Log
likelihood
Cox & Snell
R Square
Nagelkerke
R Square
1 3801.463a .062 .082
Table 4.22: Classification Tablea
Talk to Persuade Social Capital Variables
Observed Predicted
Talk to persuade Percentage
Correct Yes No
Step 1 Talk to persuade Yes 855 542 61.2
No 603 876 59.2
Overall Percentage 60.2
Table 4.23 Variables in the Equation Talk to Persuade Social Capital Variables
Variables in the Equation
B S.E. Wald df Sig. Exp(B)
Step 1a Overall Race 8.751 4 .068
White -.273 .164 2.752 1 .097 .761
Black -.042 .155 .075 1 .785 .958
Hispanic .107 .163 .434 1 .510 1.113
Asian -.083 .189 .191 1 .662 .921
Overall Education 78.909 4 .000
Less Hs 1.223 .163 56.333 1 .000 3.399
Hs .670 .131 26.184 1 .000 1.953
Some College .233 .121 3.727 1 .054 1.262
College .080 .125 .409 1 .523 1.083
Income .000 .000 .513 1 .474 1.000
Friendmix(1) .157 .091 2.988 1 .084 1.170
Neighbormix(1) -.051 .087 .346 1 .557 .950
Whites Overall
Closeness
4.617 3 .202
Whites Very Close -.206 .176 1.359 1 .244 .814
Whites Fairly Close -.033 .156 .045 1 .833 .968
Table 4.23 continued on next page.
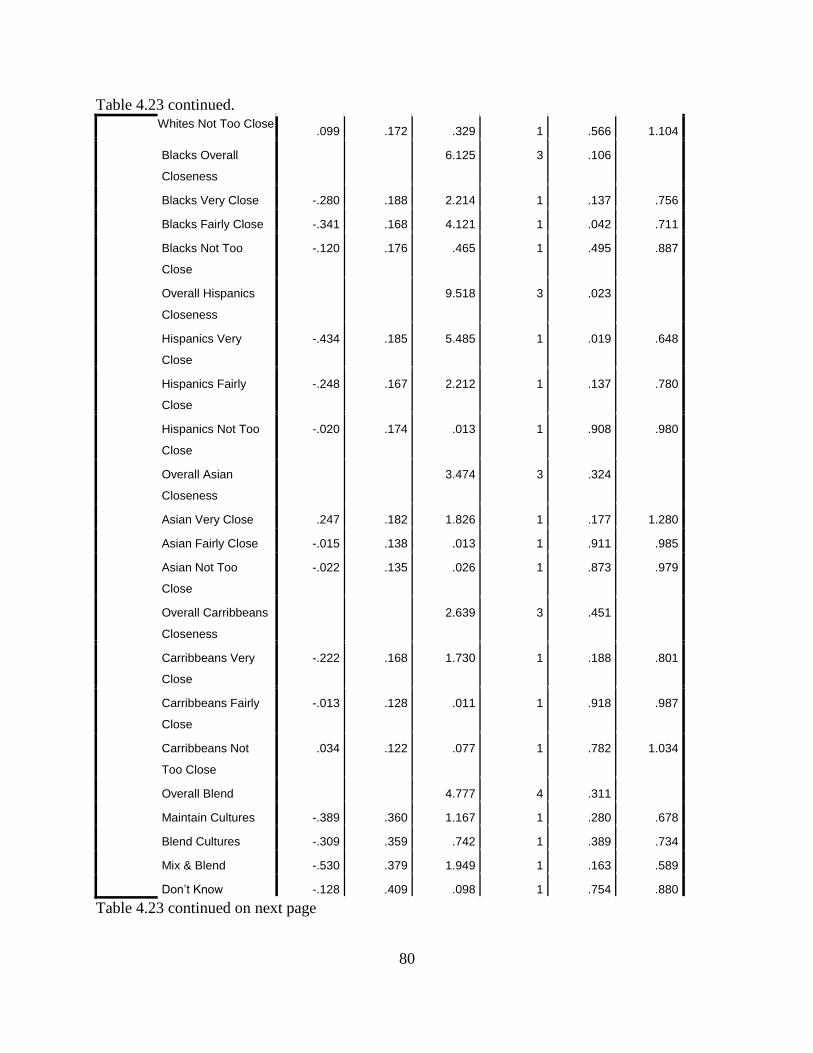
80
Table 4.23 continued. Whites Not Too Close
.099 .172 .329 1 .566 1.104
Blacks Overall
Closeness
6.125 3 .106
Blacks Very Close -.280 .188 2.214 1 .137 .756
Blacks Fairly Close -.341 .168 4.121 1 .042 .711
Blacks Not Too
Close
-.120 .176 .465 1 .495 .887
Overall Hispanics
Closeness
9.518 3 .023
Hispanics Very
Close
-.434 .185 5.485 1 .019 .648
Hispanics Fairly
Close
-.248 .167 2.212 1 .137 .780
Hispanics Not Too
Close
-.020 .174 .013 1 .908 .980
Overall Asian
Closeness
3.474 3 .324
Asian Very Close .247 .182 1.826 1 .177 1.280
Asian Fairly Close -.015 .138 .013 1 .911 .985
Asian Not Too
Close
-.022 .135 .026 1 .873 .979
Overall Carribbeans
Closeness
2.639 3 .451
Carribbeans Very
Close
-.222 .168 1.730 1 .188 .801
Carribbeans Fairly
Close
-.013 .128 .011 1 .918 .987
Carribbeans Not
Too Close
.034 .122 .077 1 .782 1.034
Overall Blend 4.777 4 .311
Maintain Cultures -.389 .360 1.167 1 .280 .678
Blend Cultures -.309 .359 .742 1 .389 .734
Mix & Blend -.530 .379 1.949 1 .163 .589
Don’t Know -.128 .409 .098 1 .754 .880
Table 4.23 continued on next page
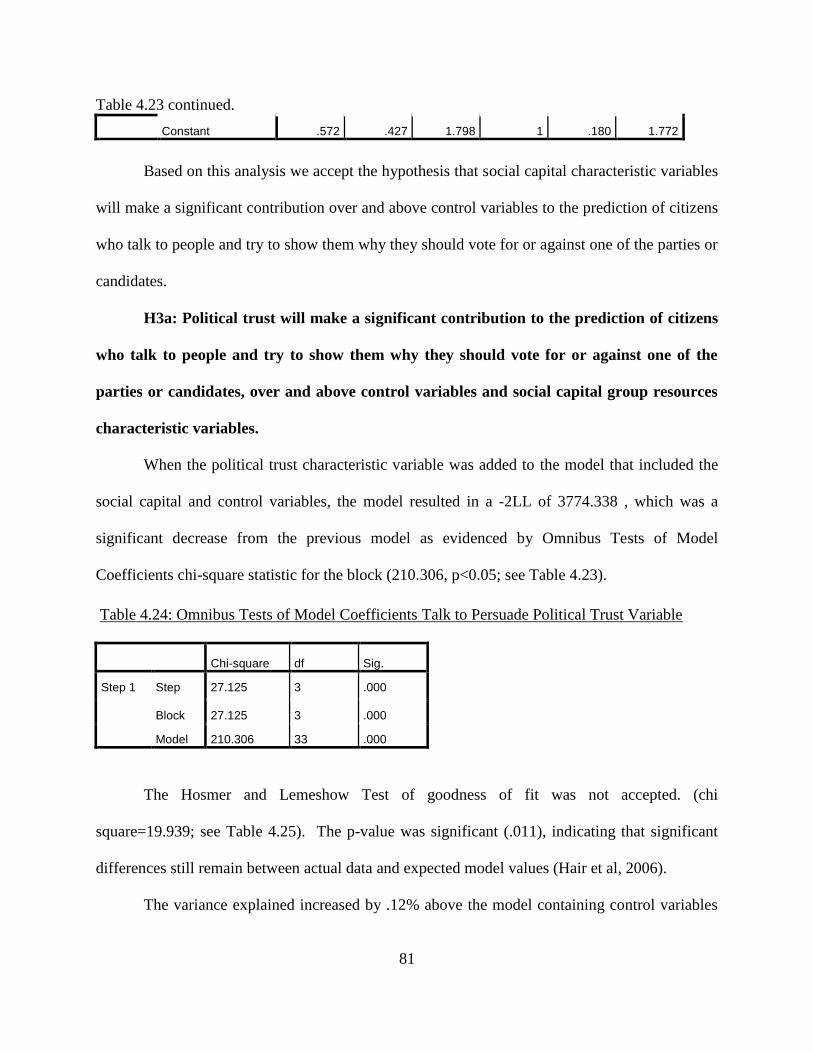
81
Table 4.23 continued.
Constant .572 .427 1.798 1 .180 1.772
Based on this analysis we accept the hypothesis that social capital characteristic variables
will make a significant contribution over and above control variables to the prediction of citizens
who talk to people and try to show them why they should vote for or against one of the parties or
candidates.
H3a: Political trust will make a significant contribution to the prediction of citizens
who talk to people and try to show them why they should vote for or against one of the
parties or candidates, over and above control variables and social capital group resources
characteristic variables.
When the political trust characteristic variable was added to the model that included the
social capital and control variables, the model resulted in a -2LL of 3774.338 , which was a
significant decrease from the previous model as evidenced by Omnibus Tests of Model
Coefficients chi-square statistic for the block (210.306, p<0.05; see Table 4.23).
Table 4.24: Omnibus Tests of Model Coefficients Talk to Persuade Political Trust Variable
Chi-square df Sig.
Step 1 Step 27.125 3 .000
Block 27.125 3 .000
Model 210.306 33 .000
The Hosmer and Lemeshow Test of goodness of fit was not accepted. (chi
square=19.939; see Table 4.25). The p-value was significant (.011), indicating that significant
differences still remain between actual data and expected model values (Hair et al, 2006).
The variance explained increased by .12% above the model containing control variables
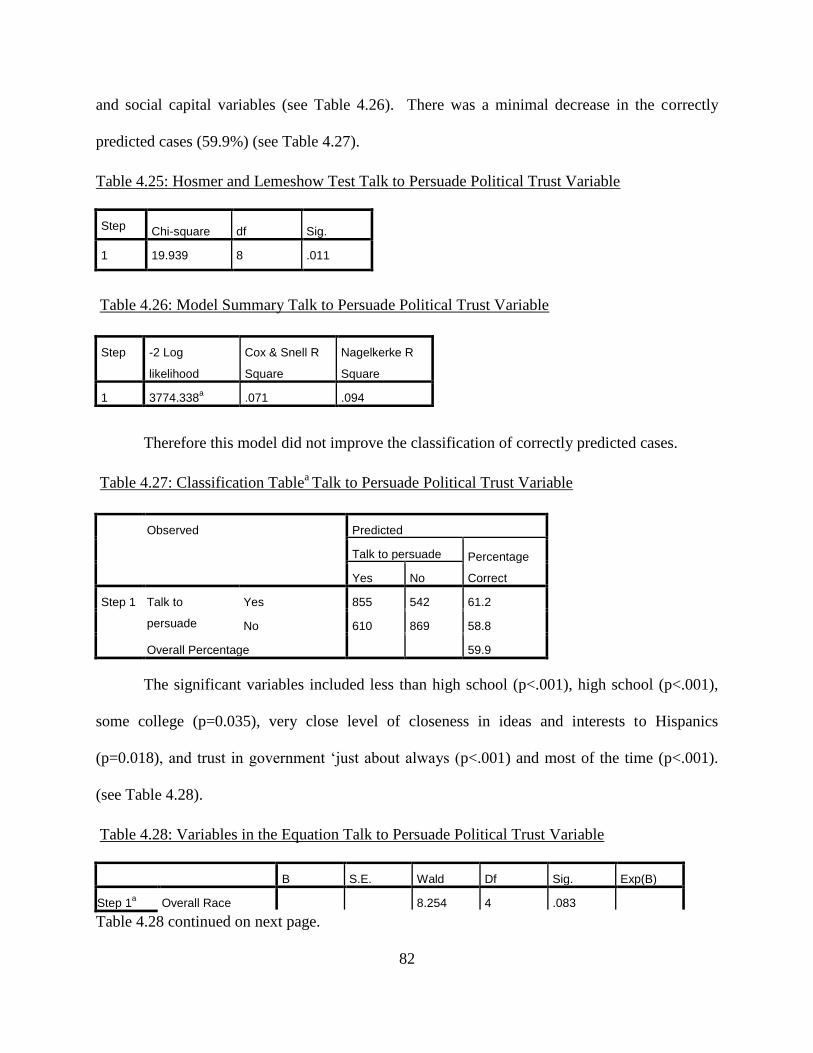
82
and social capital variables (see Table 4.26). There was a minimal decrease in the correctly
predicted cases (59.9%) (see Table 4.27).
Table 4.25: Hosmer and Lemeshow Test Talk to Persuade Political Trust Variable
Step Chi-square df Sig.
1 19.939 8 .011
Table 4.26: Model Summary Talk to Persuade Political Trust Variable
Step -2 Log
likelihood
Cox & Snell R
Square
Nagelkerke R
Square
1 3774.338a .071 .094
Therefore this model did not improve the classification of correctly predicted cases.
Table 4.27: Classification Tablea Talk to Persuade Political Trust Variable
Observed Predicted
Talk to persuade Percentage
Correct Yes No
Step 1 Talk to
persuade
Yes 855 542 61.2
No 610 869 58.8
Overall Percentage 59.9
The significant variables included less than high school (p<.001), high school (p<.001),
some college (p=0.035), very close level of closeness in ideas and interests to Hispanics
(p=0.018), and trust in government ‗just about always (p<.001) and most of the time (p<.001).
(see Table 4.28).
Table 4.28: Variables in the Equation Talk to Persuade Political Trust Variable
B S.E. Wald Df Sig. Exp(B)
Step 1a Overall Race 8.254 4 .083
Table 4.28 continued on next page.
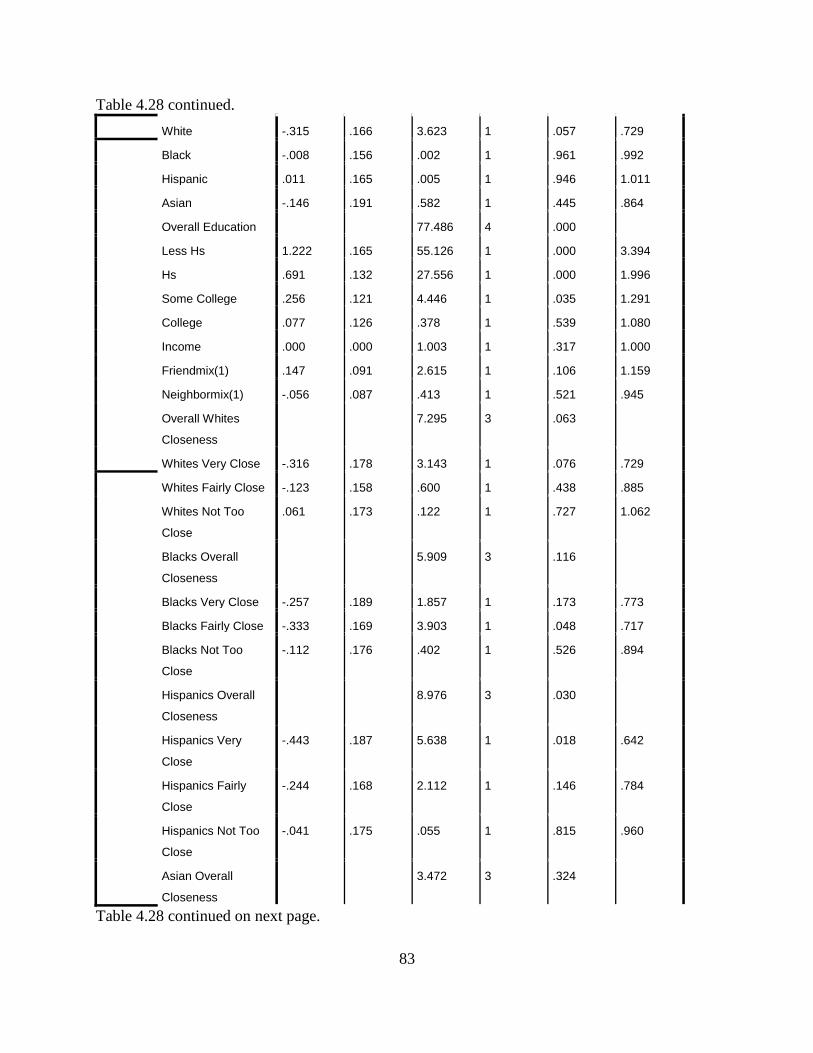
83
Table 4.28 continued.
White -.315 .166 3.623 1 .057 .729
Black -.008 .156 .002 1 .961 .992
Hispanic .011 .165 .005 1 .946 1.011
Asian -.146 .191 .582 1 .445 .864
Overall Education 77.486 4 .000
Less Hs 1.222 .165 55.126 1 .000 3.394
Hs .691 .132 27.556 1 .000 1.996
Some College .256 .121 4.446 1 .035 1.291
College .077 .126 .378 1 .539 1.080
Income .000 .000 1.003 1 .317 1.000
Friendmix(1) .147 .091 2.615 1 .106 1.159
Neighbormix(1) -.056 .087 .413 1 .521 .945
Overall Whites
Closeness
7.295 3 .063
Whites Very Close -.316 .178 3.143 1 .076 .729
Whites Fairly Close -.123 .158 .600 1 .438 .885
Whites Not Too
Close
.061 .173 .122 1 .727 1.062
Blacks Overall
Closeness
5.909 3 .116
Blacks Very Close -.257 .189 1.857 1 .173 .773
Blacks Fairly Close -.333 .169 3.903 1 .048 .717
Blacks Not Too
Close
-.112 .176 .402 1 .526 .894
Hispanics Overall
Closeness
8.976 3 .030
Hispanics Very
Close
-.443 .187 5.638 1 .018 .642
Hispanics Fairly
Close
-.244 .168 2.112 1 .146 .784
Hispanics Not Too
Close
-.041 .175 .055 1 .815 .960
Asian Overall
Closeness
3.472 3 .324
Table 4.28 continued on next page.
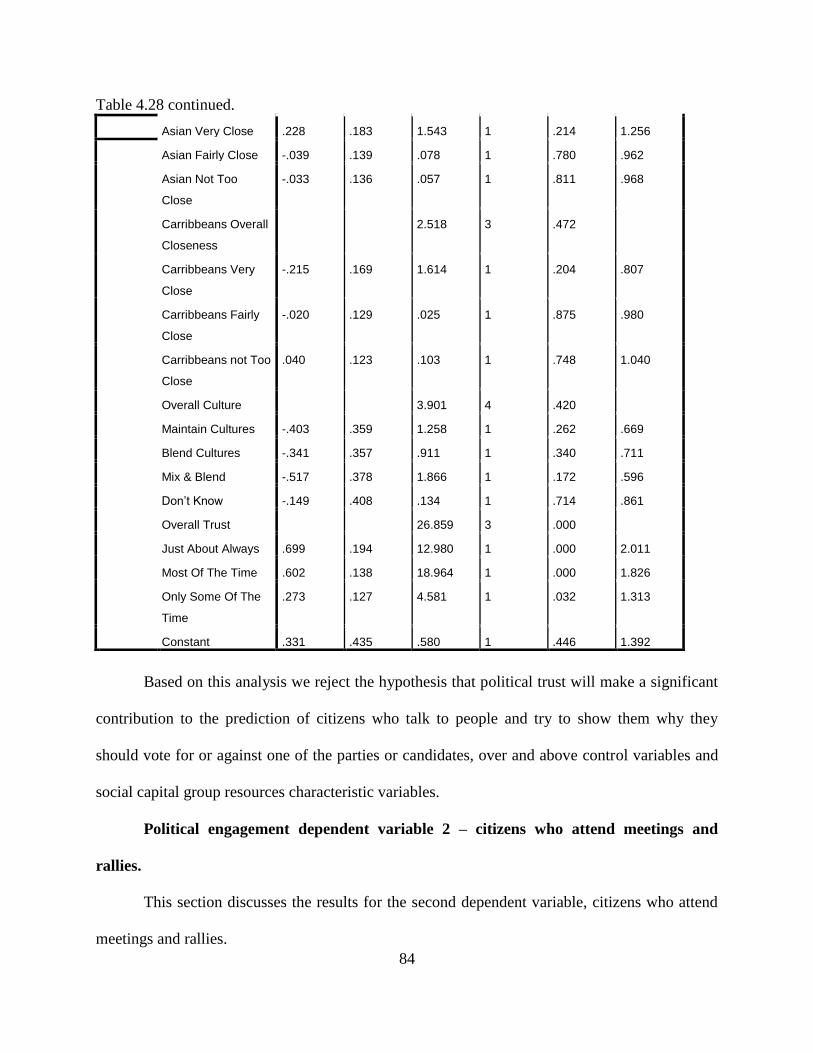
84
Table 4.28 continued.
Asian Very Close .228 .183 1.543 1 .214 1.256
Asian Fairly Close -.039 .139 .078 1 .780 .962
Asian Not Too
Close
-.033 .136 .057 1 .811 .968
Carribbeans Overall
Closeness
2.518 3 .472
Carribbeans Very
Close
-.215 .169 1.614 1 .204 .807
Carribbeans Fairly
Close
-.020 .129 .025 1 .875 .980
Carribbeans not Too
Close
.040 .123 .103 1 .748 1.040
Overall Culture 3.901 4 .420
Maintain Cultures -.403 .359 1.258 1 .262 .669
Blend Cultures -.341 .357 .911 1 .340 .711
Mix & Blend -.517 .378 1.866 1 .172 .596
Don’t Know -.149 .408 .134 1 .714 .861
Overall Trust 26.859 3 .000
Just About Always .699 .194 12.980 1 .000 2.011
Most Of The Time .602 .138 18.964 1 .000 1.826
Only Some Of The
Time
.273 .127 4.581 1 .032 1.313
Constant .331 .435 .580 1 .446 1.392
Based on this analysis we reject the hypothesis that political trust will make a significant
contribution to the prediction of citizens who talk to people and try to show them why they
should vote for or against one of the parties or candidates, over and above control variables and
social capital group resources characteristic variables.
Political engagement dependent variable 2 – citizens who attend meetings and
rallies.
This section discusses the results for the second dependent variable, citizens who attend
meetings and rallies.
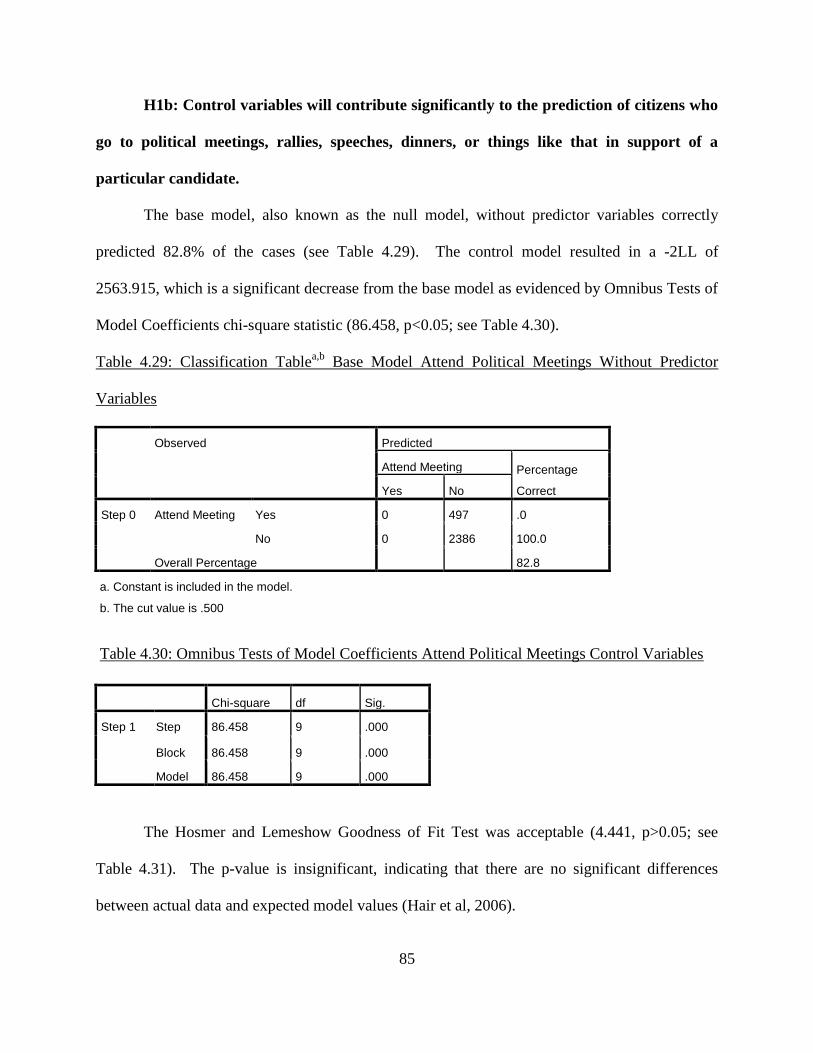
85
H1b: Control variables will contribute significantly to the prediction of citizens who
go to political meetings, rallies, speeches, dinners, or things like that in support of a
particular candidate.
The base model, also known as the null model, without predictor variables correctly
predicted 82.8% of the cases (see Table 4.29). The control model resulted in a -2LL of
2563.915, which is a significant decrease from the base model as evidenced by Omnibus Tests of
Model Coefficients chi-square statistic (86.458, p<0.05; see Table 4.30).
Table 4.29: Classification Tablea,b
Base Model Attend Political Meetings Without Predictor
Variables
Observed Predicted
Attend Meeting Percentage
Correct Yes No
Step 0 Attend Meeting Yes 0 497 .0
No 0 2386 100.0
Overall Percentage 82.8
a. Constant is included in the model.
b. The cut value is .500
Table 4.30: Omnibus Tests of Model Coefficients Attend Political Meetings Control Variables
Chi-square df Sig.
Step 1 Step 86.458 9 .000
Block 86.458 9 .000
Model 86.458 9 .000
The Hosmer and Lemeshow Goodness of Fit Test was acceptable (4.441, p>0.05; see
Table 4.31). The p-value is insignificant, indicating that there are no significant differences
between actual data and expected model values (Hair et al, 2006).

86
Table 4.31: Hosmer and Lemeshow Test Attend Political Meetings Control Variables
Step Chi-square df Sig.
1 4.441 8 .815
Though the variance predicted is 4.9% (see Table 4.32), Table 4.33 shows that 82.8
percent of the cases were correctly predicted. One-hundred percent (100%) of the correctly
predicted cases responded ‗no.‘ Therefore, this model can predict only for those that responded
that they do not attend political meetings, rallies, speeches, dinners, or things like that in support
of a particular candidate.
Table 4.34 shows the Asian race (p<.001) and education (p<.001) were significant at
predicting the dependent variable.
Table 4.32: Model Summary Attend Political Meetings Control Variables
Step
-2 Log likelihood
Cox & Snell R
Square
Nagelkerke R
Square
1 2563.915a .030 .049
a. Estimation terminated at iteration number 5 because parameter
estimates changed by less than .001.
Table 4.33: Classification Tablea Attend Political Meetings Control Variables
Observed Predicted
Attend Meeting Percentage
Correct Yes No
Step 1 Attend Meeting Yes 0 497 .0
No 0 2386 100.0
Overall Percentage 82.8
a. Estimation terminated at iteration number 5 because parameter estimates changed by less than
.001.
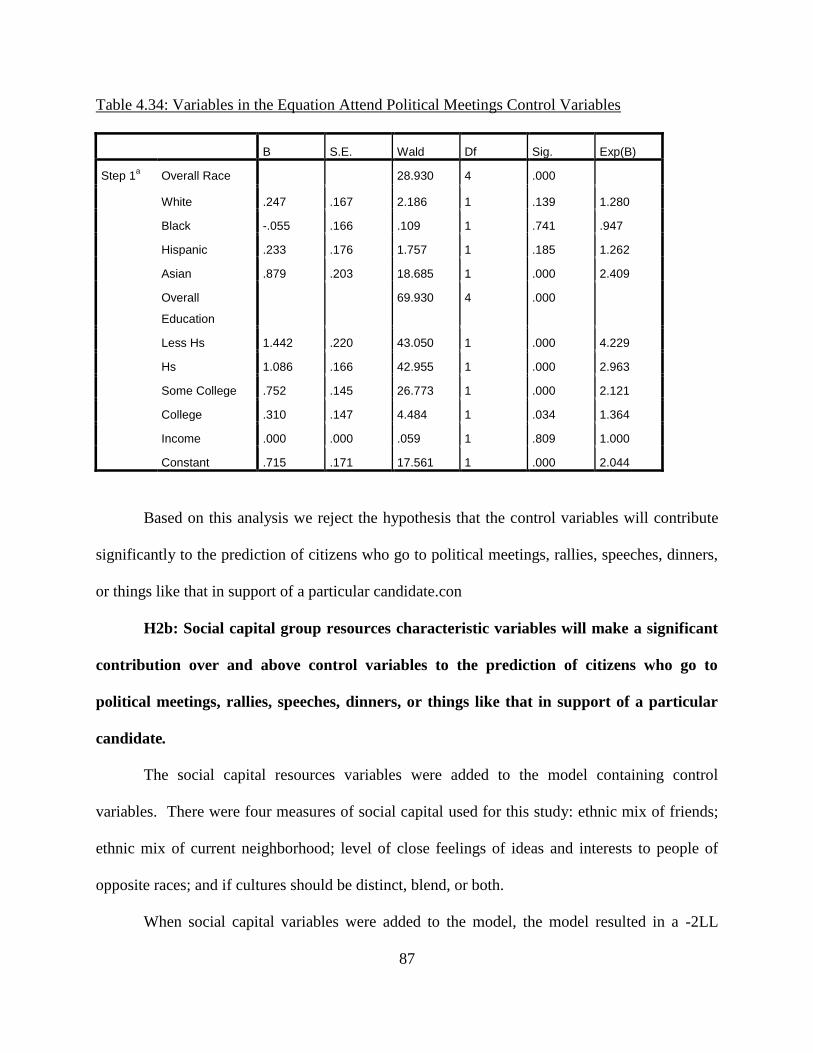
87
Table 4.34: Variables in the Equation Attend Political Meetings Control Variables
B S.E. Wald Df Sig. Exp(B)
Step 1a Overall Race 28.930 4 .000
White .247 .167 2.186 1 .139 1.280
Black -.055 .166 .109 1 .741 .947
Hispanic .233 .176 1.757 1 .185 1.262
Asian .879 .203 18.685 1 .000 2.409
Overall
Education
69.930 4 .000
Less Hs 1.442 .220 43.050 1 .000 4.229
Hs 1.086 .166 42.955 1 .000 2.963
Some College .752 .145 26.773 1 .000 2.121
College .310 .147 4.484 1 .034 1.364
Income .000 .000 .059 1 .809 1.000
Constant .715 .171 17.561 1 .000 2.044
Based on this analysis we reject the hypothesis that the control variables will contribute
significantly to the prediction of citizens who go to political meetings, rallies, speeches, dinners,
or things like that in support of a particular candidate.con
H2b: Social capital group resources characteristic variables will make a significant
contribution over and above control variables to the prediction of citizens who go to
political meetings, rallies, speeches, dinners, or things like that in support of a particular
candidate.
The social capital resources variables were added to the model containing control
variables. There were four measures of social capital used for this study: ethnic mix of friends;
ethnic mix of current neighborhood; level of close feelings of ideas and interests to people of
opposite races; and if cultures should be distinct, blend, or both.
When social capital variables were added to the model, the model resulted in a -2LL
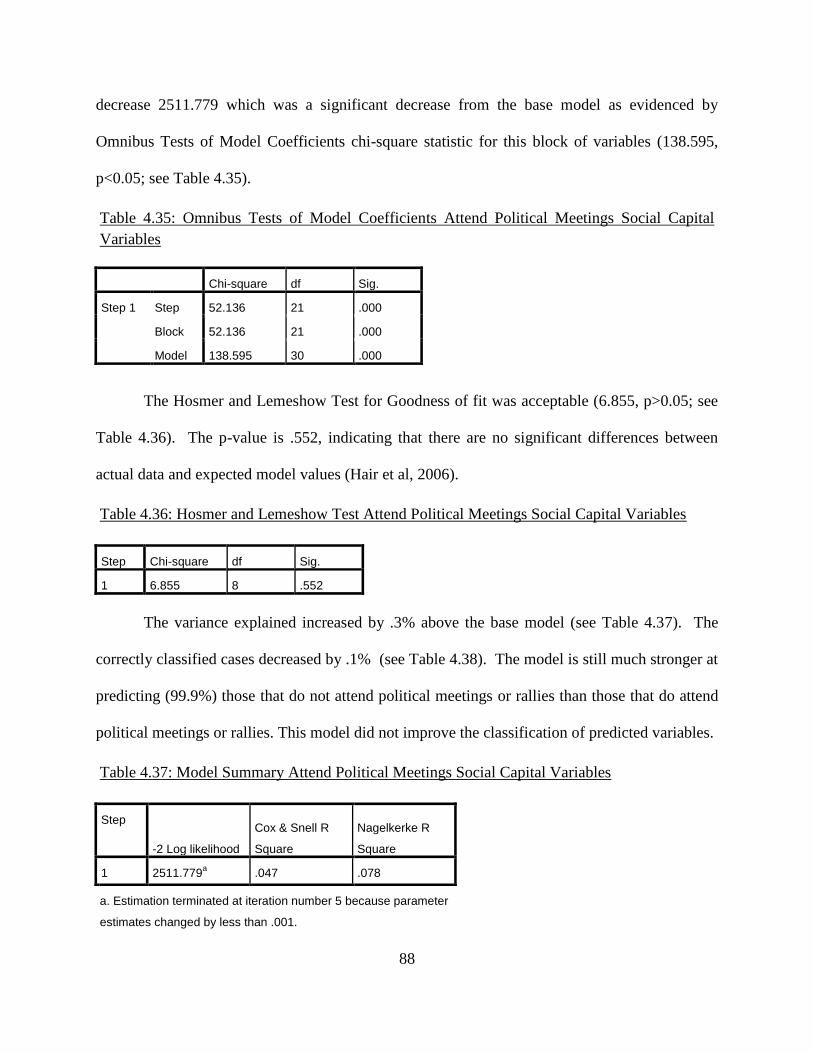
88
decrease 2511.779 which was a significant decrease from the base model as evidenced by
Omnibus Tests of Model Coefficients chi-square statistic for this block of variables (138.595,
p<0.05; see Table 4.35).
Table 4.35: Omnibus Tests of Model Coefficients Attend Political Meetings Social Capital
Variables
Chi-square df Sig.
Step 1 Step 52.136 21 .000
Block 52.136 21 .000
Model 138.595 30 .000
The Hosmer and Lemeshow Test for Goodness of fit was acceptable (6.855, p>0.05; see
Table 4.36). The p-value is .552, indicating that there are no significant differences between
actual data and expected model values (Hair et al, 2006).
Table 4.36: Hosmer and Lemeshow Test Attend Political Meetings Social Capital Variables
Step Chi-square df Sig.
1 6.855 8 .552
The variance explained increased by .3% above the base model (see Table 4.37). The
correctly classified cases decreased by .1% (see Table 4.38). The model is still much stronger at
predicting (99.9%) those that do not attend political meetings or rallies than those that do attend
political meetings or rallies. This model did not improve the classification of predicted variables.
Table 4.37: Model Summary Attend Political Meetings Social Capital Variables
Step
-2 Log likelihood
Cox & Snell R
Square
Nagelkerke R
Square
1 2511.779a .047 .078
a. Estimation terminated at iteration number 5 because parameter
estimates changed by less than .001.
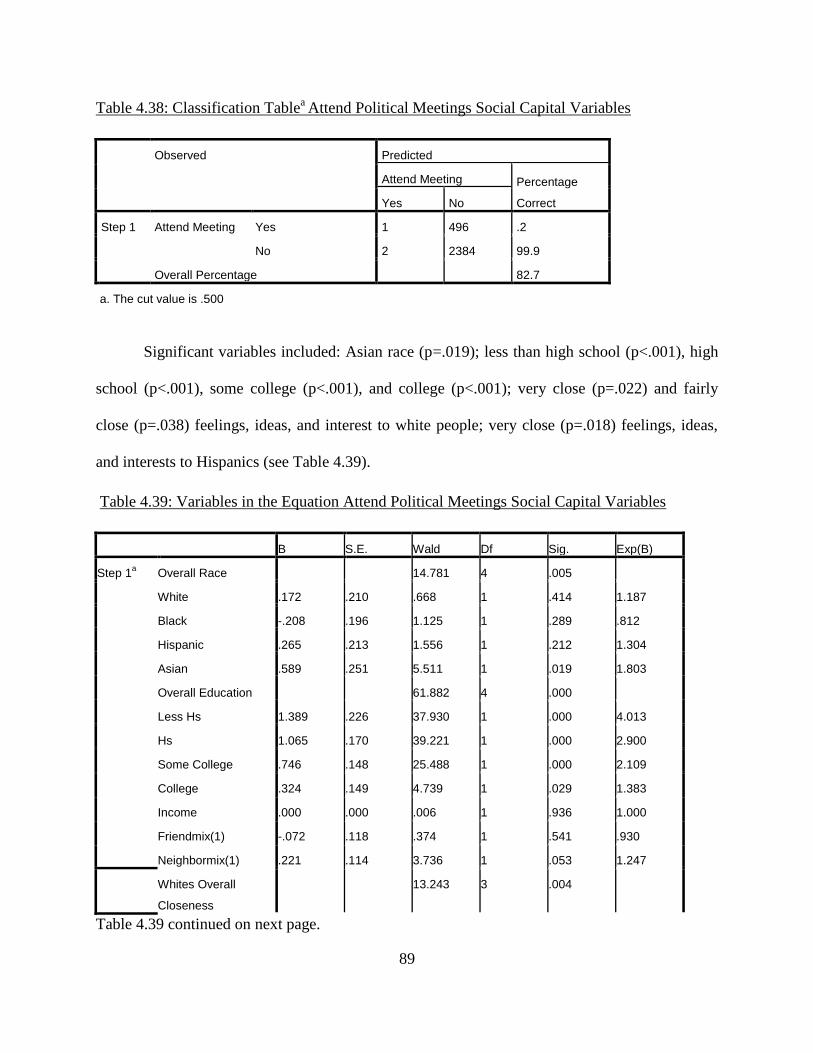
89
Table 4.38: Classification Tablea Attend Political Meetings Social Capital Variables
Observed Predicted
Attend Meeting Percentage
Correct Yes No
Step 1 Attend Meeting Yes 1 496 .2
No 2 2384 99.9
Overall Percentage 82.7
a. The cut value is .500
Significant variables included: Asian race (p=.019); less than high school (p<.001), high
school (p<.001), some college (p<.001), and college (p<.001); very close (p=.022) and fairly
close (p=.038) feelings, ideas, and interest to white people; very close (p=.018) feelings, ideas,
and interests to Hispanics (see Table 4.39).
Table 4.39: Variables in the Equation Attend Political Meetings Social Capital Variables
B S.E. Wald Df Sig. Exp(B)
Step 1a Overall Race 14.781 4 .005
White .172 .210 .668 1 .414 1.187
Black -.208 .196 1.125 1 .289 .812
Hispanic .265 .213 1.556 1 .212 1.304
Asian .589 .251 5.511 1 .019 1.803
Overall Education 61.882 4 .000
Less Hs 1.389 .226 37.930 1 .000 4.013
Hs 1.065 .170 39.221 1 .000 2.900
Some College .746 .148 25.488 1 .000 2.109
College .324 .149 4.739 1 .029 1.383
Income .000 .000 .006 1 .936 1.000
Friendmix(1) -.072 .118 .374 1 .541 .930
Neighbormix(1) .221 .114 3.736 1 .053 1.247
Whites Overall
Closeness
13.243 3 .004
Table 4.39 continued on next page.
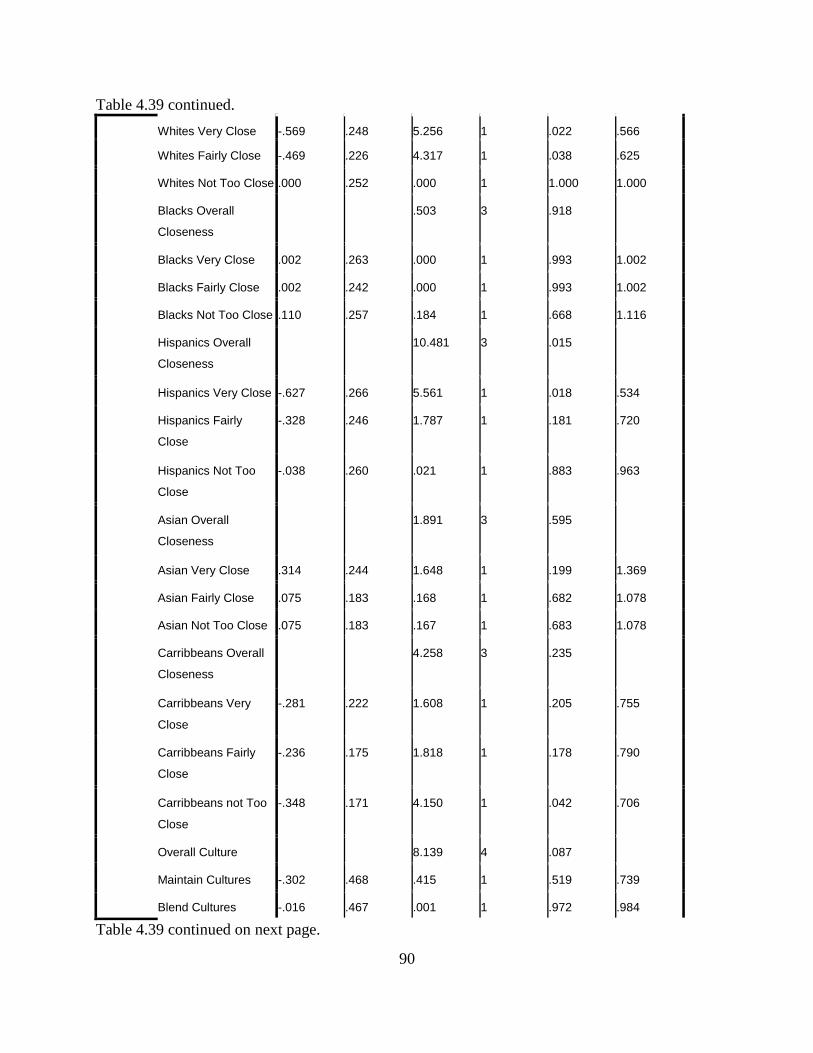
90
Table 4.39 continued.
Whites Very Close -.569 .248 5.256 1 .022 .566
Whites Fairly Close -.469 .226 4.317 1 .038 .625
Whites Not Too Close .000 .252 .000 1 1.000 1.000
Blacks Overall
Closeness
.503 3 .918
Blacks Very Close .002 .263 .000 1 .993 1.002
Blacks Fairly Close .002 .242 .000 1 .993 1.002
Blacks Not Too Close .110 .257 .184 1 .668 1.116
Hispanics Overall
Closeness
10.481 3 .015
Hispanics Very Close -.627 .266 5.561 1 .018 .534
Hispanics Fairly
Close
-.328 .246 1.787 1 .181 .720
Hispanics Not Too
Close
-.038 .260 .021 1 .883 .963
Asian Overall
Closeness
1.891 3 .595
Asian Very Close .314 .244 1.648 1 .199 1.369
Asian Fairly Close .075 .183 .168 1 .682 1.078
Asian Not Too Close .075 .183 .167 1 .683 1.078
Carribbeans Overall
Closeness
4.258 3 .235
Carribbeans Very
Close
-.281 .222 1.608 1 .205 .755
Carribbeans Fairly
Close
-.236 .175 1.818 1 .178 .790
Carribbeans not Too
Close
-.348 .171 4.150 1 .042 .706
Overall Culture 8.139 4 .087
Maintain Cultures -.302 .468 .415 1 .519 .739
Blend Cultures -.016 .467 .001 1 .972 .984
Table 4.39 continued on next page.
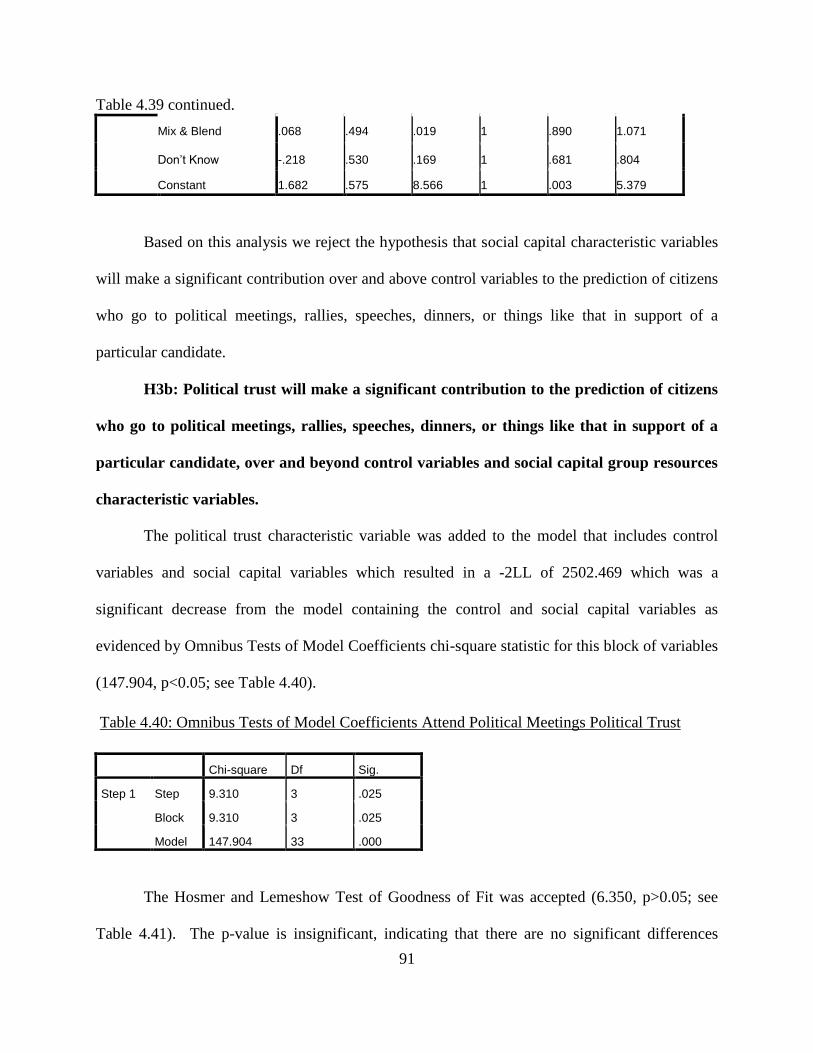
91
Table 4.39 continued.
Mix & Blend .068 .494 .019 1 .890 1.071
Don’t Know -.218 .530 .169 1 .681 .804
Constant 1.682 .575 8.566 1 .003 5.379
Based on this analysis we reject the hypothesis that social capital characteristic variables
will make a significant contribution over and above control variables to the prediction of citizens
who go to political meetings, rallies, speeches, dinners, or things like that in support of a
particular candidate.
H3b: Political trust will make a significant contribution to the prediction of citizens
who go to political meetings, rallies, speeches, dinners, or things like that in support of a
particular candidate, over and beyond control variables and social capital group resources
characteristic variables.
The political trust characteristic variable was added to the model that includes control
variables and social capital variables which resulted in a -2LL of 2502.469 which was a
significant decrease from the model containing the control and social capital variables as
evidenced by Omnibus Tests of Model Coefficients chi-square statistic for this block of variables
(147.904, p<0.05; see Table 4.40).
Table 4.40: Omnibus Tests of Model Coefficients Attend Political Meetings Political Trust
Chi-square Df Sig.
Step 1 Step 9.310 3 .025
Block 9.310 3 .025
Model 147.904 33 .000
The Hosmer and Lemeshow Test of Goodness of Fit was accepted (6.350, p>0.05; see
Table 4.41). The p-value is insignificant, indicating that there are no significant differences
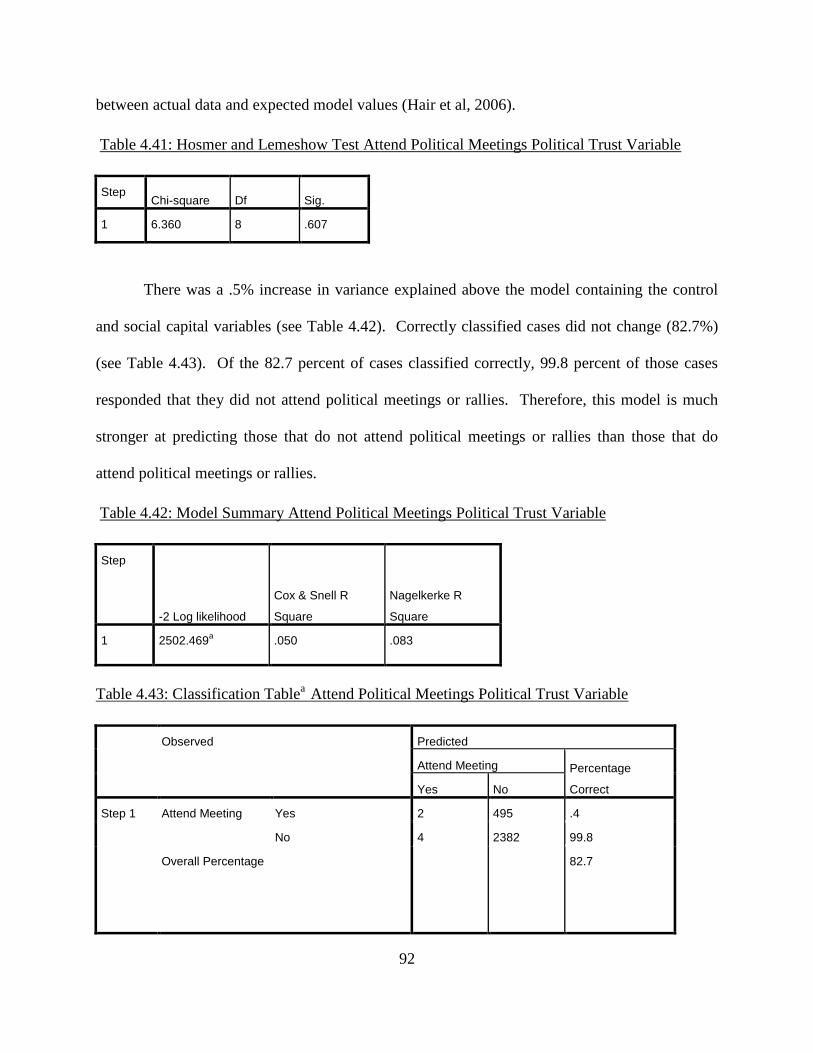
92
between actual data and expected model values (Hair et al, 2006).
Table 4.41: Hosmer and Lemeshow Test Attend Political Meetings Political Trust Variable
Step Chi-square Df Sig.
1 6.360 8 .607
There was a .5% increase in variance explained above the model containing the control
and social capital variables (see Table 4.42). Correctly classified cases did not change (82.7%)
(see Table 4.43). Of the 82.7 percent of cases classified correctly, 99.8 percent of those cases
responded that they did not attend political meetings or rallies. Therefore, this model is much
stronger at predicting those that do not attend political meetings or rallies than those that do
attend political meetings or rallies.
Table 4.42: Model Summary Attend Political Meetings Political Trust Variable
Step
-2 Log likelihood
Cox & Snell R
Square
Nagelkerke R
Square
1 2502.469a .050 .083
Table 4.43: Classification Tablea
Attend Political Meetings Political Trust Variable
Observed Predicted
Attend Meeting Percentage
Correct Yes No
Step 1 Attend Meeting Yes 2 495 .4
No 4 2382 99.8
Overall Percentage
82.7
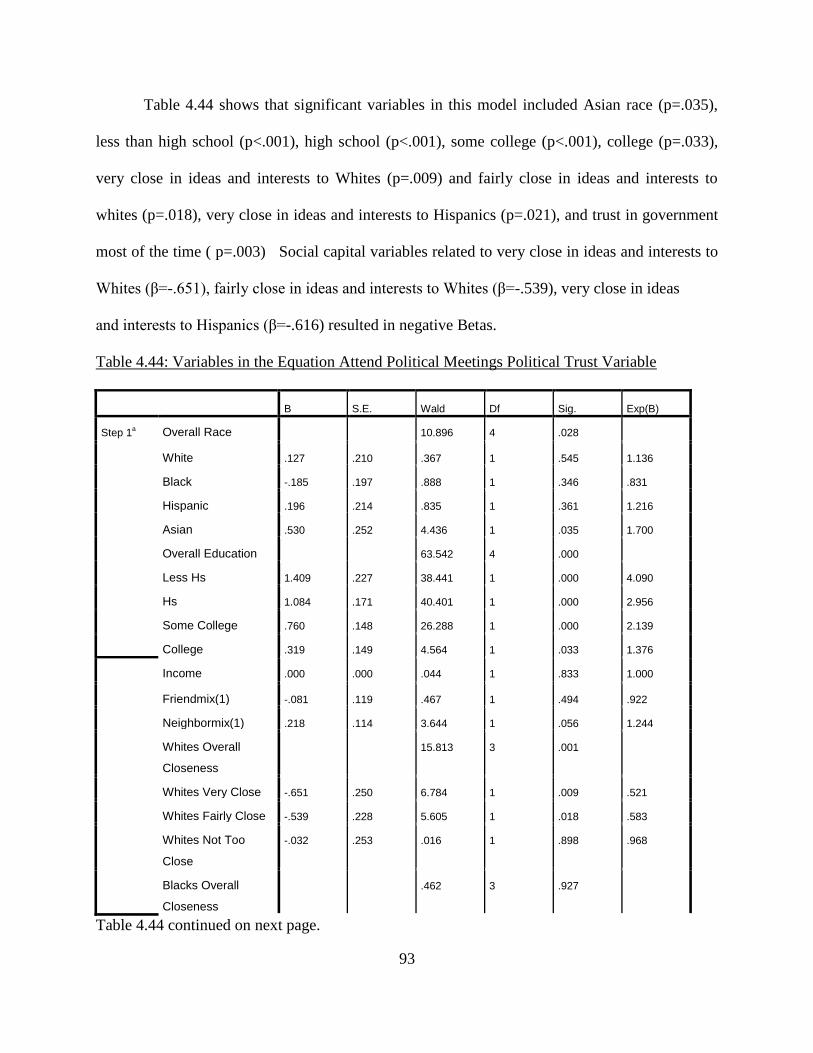
93
Table 4.44 shows that significant variables in this model included Asian race (p=.035),
less than high school (p<.001), high school (p<.001), some college (p<.001), college (p=.033),
very close in ideas and interests to Whites (p=.009) and fairly close in ideas and interests to
whites (p=.018), very close in ideas and interests to Hispanics (p=.021), and trust in government
most of the time ( p=.003) Social capital variables related to very close in ideas and interests to
Whites (β=-.651), fairly close in ideas and interests to Whites (β=-.539), very close in ideas
and interests to Hispanics (β=-.616) resulted in negative Betas.
Table 4.44: Variables in the Equation Attend Political Meetings Political Trust Variable
B S.E. Wald Df Sig. Exp(B)
Step 1a Overall Race 10.896 4 .028
White .127 .210 .367 1 .545 1.136
Black -.185 .197 .888 1 .346 .831
Hispanic .196 .214 .835 1 .361 1.216
Asian .530 .252 4.436 1 .035 1.700
Overall Education 63.542 4 .000
Less Hs 1.409 .227 38.441 1 .000 4.090
Hs 1.084 .171 40.401 1 .000 2.956
Some College .760 .148 26.288 1 .000 2.139
College .319 .149 4.564 1 .033 1.376
Income .000 .000 .044 1 .833 1.000
Friendmix(1) -.081 .119 .467 1 .494 .922
Neighbormix(1) .218 .114 3.644 1 .056 1.244
Whites Overall
Closeness
15.813 3 .001
Whites Very Close -.651 .250 6.784 1 .009 .521
Whites Fairly Close -.539 .228 5.605 1 .018 .583
Whites Not Too
Close
-.032 .253 .016 1 .898 .968
Blacks Overall
Closeness
.462 3 .927
Table 4.44 continued on next page.
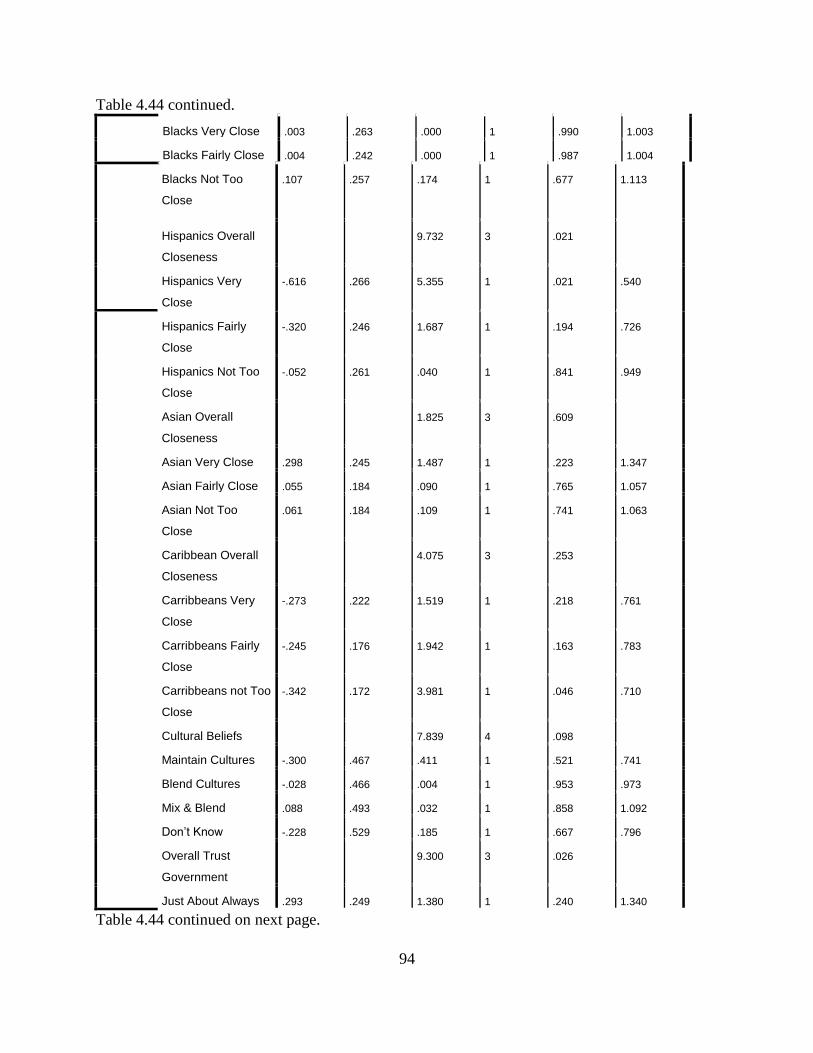
94
Table 4.44 continued.
Blacks Very Close .003 .263 .000 1 .990 1.003
Blacks Fairly Close .004 .242 .000 1 .987 1.004
Blacks Not Too
Close
.107 .257 .174 1 .677 1.113
Hispanics Overall
Closeness
9.732 3 .021
Hispanics Very
Close
-.616 .266 5.355 1 .021 .540
Hispanics Fairly
Close
-.320 .246 1.687 1 .194 .726
Hispanics Not Too
Close
-.052 .261 .040 1 .841 .949
Asian Overall
Closeness
1.825 3 .609
Asian Very Close .298 .245 1.487 1 .223 1.347
Asian Fairly Close .055 .184 .090 1 .765 1.057
Asian Not Too
Close
.061 .184 .109 1 .741 1.063
Caribbean Overall
Closeness
4.075 3 .253
Carribbeans Very
Close
-.273 .222 1.519 1 .218 .761
Carribbeans Fairly
Close
-.245 .176 1.942 1 .163 .783
Carribbeans not Too
Close
-.342 .172 3.981 1 .046 .710
Cultural Beliefs 7.839 4 .098
Maintain Cultures -.300 .467 .411 1 .521 .741
Blend Cultures -.028 .466 .004 1 .953 .973
Mix & Blend .088 .493 .032 1 .858 1.092
Don’t Know -.228 .529 .185 1 .667 .796
Overall Trust
Government
9.300 3 .026
Just About Always .293 .249 1.380 1 .240 1.340
Table 4.44 continued on next page.
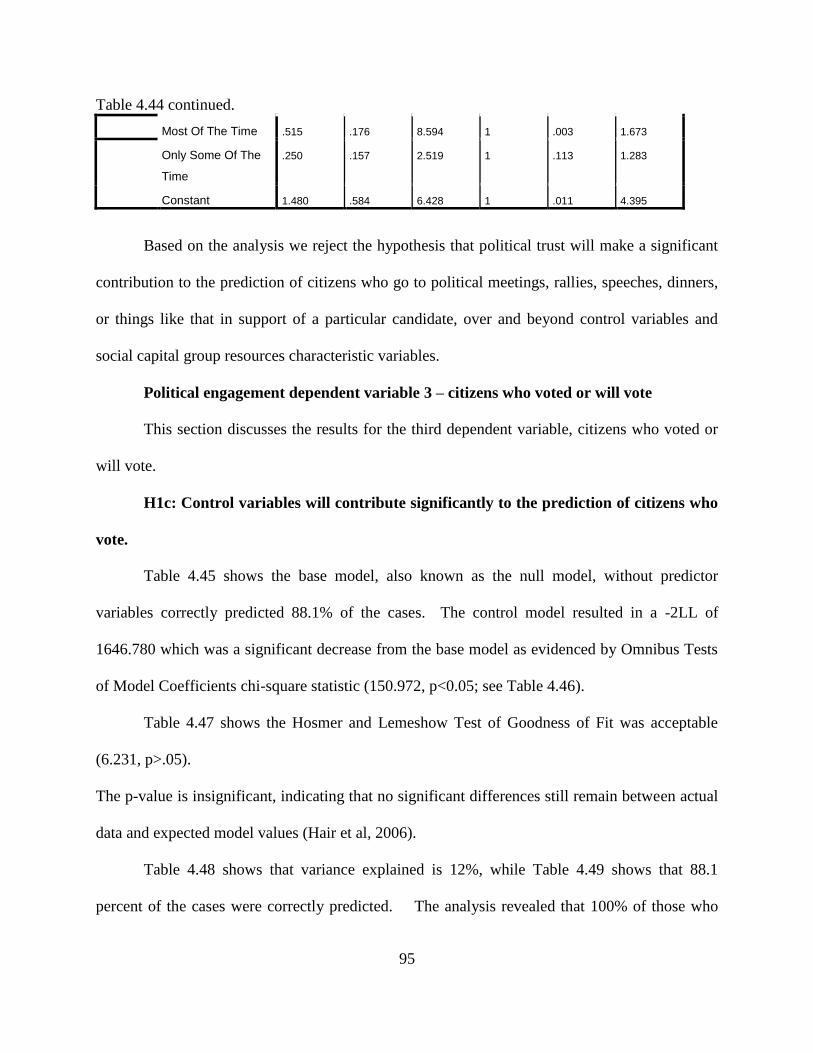
95
Table 4.44 continued.
Most Of The Time .515 .176 8.594 1 .003 1.673
Only Some Of The
Time
.250 .157 2.519 1 .113 1.283
Constant 1.480 .584 6.428 1 .011 4.395
Based on the analysis we reject the hypothesis that political trust will make a significant
contribution to the prediction of citizens who go to political meetings, rallies, speeches, dinners,
or things like that in support of a particular candidate, over and beyond control variables and
social capital group resources characteristic variables.
Political engagement dependent variable 3 – citizens who voted or will vote
This section discusses the results for the third dependent variable, citizens who voted or
will vote.
H1c: Control variables will contribute significantly to the prediction of citizens who
vote.
Table 4.45 shows the base model, also known as the null model, without predictor
variables correctly predicted 88.1% of the cases. The control model resulted in a -2LL of
1646.780 which was a significant decrease from the base model as evidenced by Omnibus Tests
of Model Coefficients chi-square statistic (150.972, p<0.05; see Table 4.46).
Table 4.47 shows the Hosmer and Lemeshow Test of Goodness of Fit was acceptable
(6.231, p>.05).
The p-value is insignificant, indicating that no significant differences still remain between actual
data and expected model values (Hair et al, 2006).
Table 4.48 shows that variance explained is 12%, while Table 4.49 shows that 88.1
percent of the cases were correctly predicted. The analysis revealed that 100% of those who
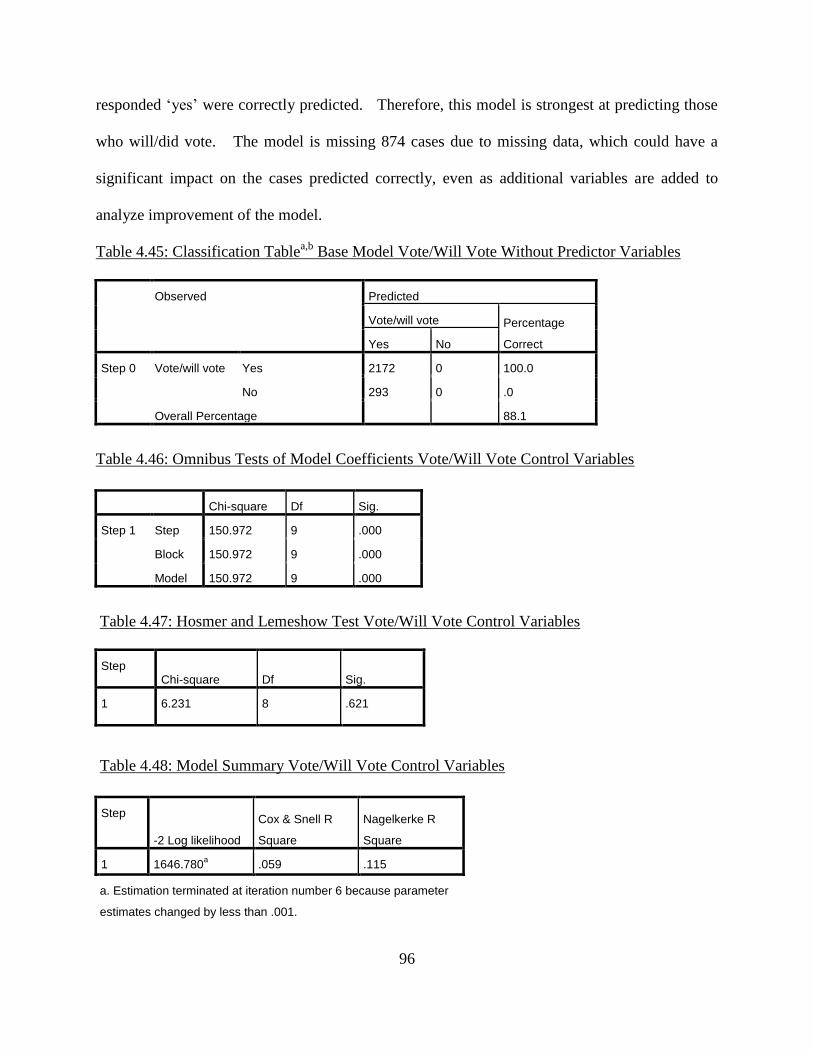
96
responded ‗yes‘ were correctly predicted. Therefore, this model is strongest at predicting those
who will/did vote. The model is missing 874 cases due to missing data, which could have a
significant impact on the cases predicted correctly, even as additional variables are added to
analyze improvement of the model.
Table 4.45: Classification Tablea,b
Base Model Vote/Will Vote Without Predictor Variables
Observed Predicted
Vote/will vote Percentage
Correct Yes No
Step 0 Vote/will vote Yes 2172 0 100.0
No 293 0 .0
Overall Percentage 88.1
Table 4.46: Omnibus Tests of Model Coefficients Vote/Will Vote Control Variables
Chi-square Df Sig.
Step 1 Step 150.972 9 .000
Block 150.972 9 .000
Model 150.972 9 .000
Table 4.47: Hosmer and Lemeshow Test Vote/Will Vote Control Variables
Step Chi-square Df Sig.
1 6.231 8 .621
Table 4.48: Model Summary Vote/Will Vote Control Variables
Step
-2 Log likelihood
Cox & Snell R
Square
Nagelkerke R
Square
1 1646.780a .059 .115
a. Estimation terminated at iteration number 6 because parameter
estimates changed by less than .001.
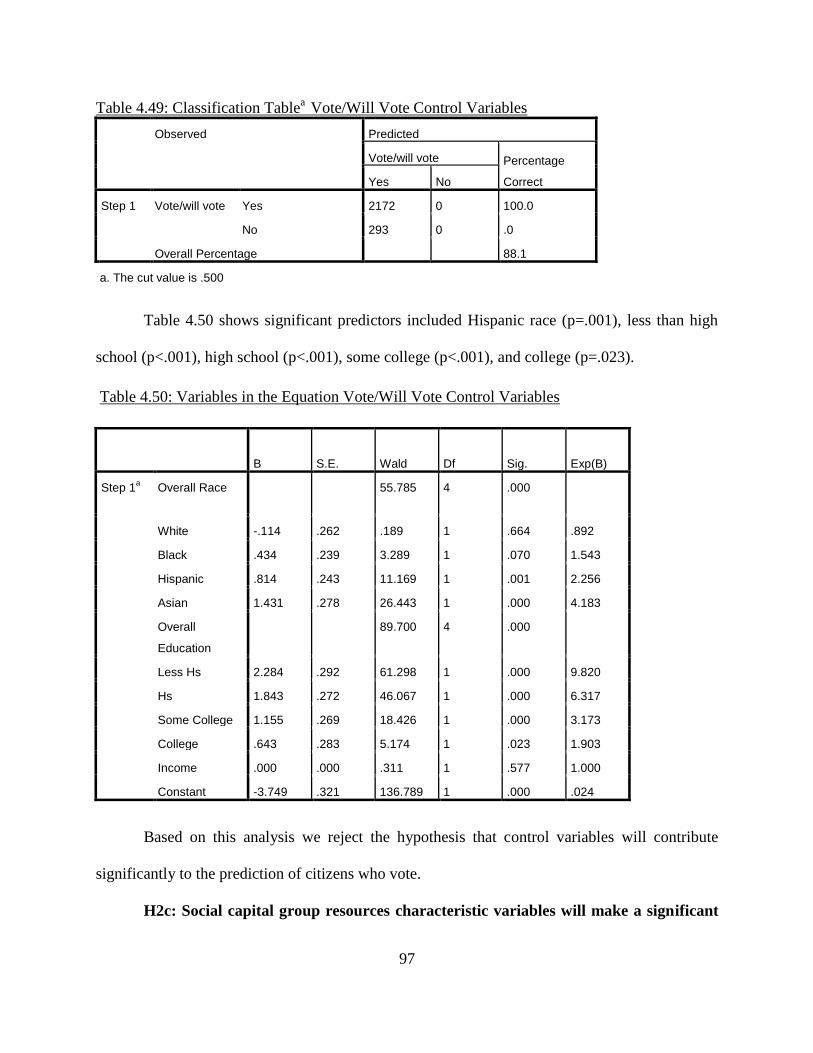
97
Table 4.49: Classification Tablea
Vote/Will Vote Control Variables
Observed Predicted
Vote/will vote Percentage
Correct Yes No
Step 1 Vote/will vote Yes 2172 0 100.0
No 293 0 .0
Overall Percentage 88.1
a. The cut value is .500
Table 4.50 shows significant predictors included Hispanic race (p=.001), less than high
school (p<.001), high school (p<.001), some college (p<.001), and college (p=.023).
Table 4.50: Variables in the Equation Vote/Will Vote Control Variables
B S.E. Wald Df Sig. Exp(B)
Step 1a Overall Race 55.785 4 .000
White -.114 .262 .189 1 .664 .892
Black .434 .239 3.289 1 .070 1.543
Hispanic .814 .243 11.169 1 .001 2.256
Asian 1.431 .278 26.443 1 .000 4.183
Overall
Education
89.700 4 .000
Less Hs 2.284 .292 61.298 1 .000 9.820
Hs 1.843 .272 46.067 1 .000 6.317
Some College 1.155 .269 18.426 1 .000 3.173
College .643 .283 5.174 1 .023 1.903
Income .000 .000 .311 1 .577 1.000
Constant -3.749 .321 136.789 1 .000 .024
Based on this analysis we reject the hypothesis that control variables will contribute
significantly to the prediction of citizens who vote.
H2c: Social capital group resources characteristic variables will make a significant
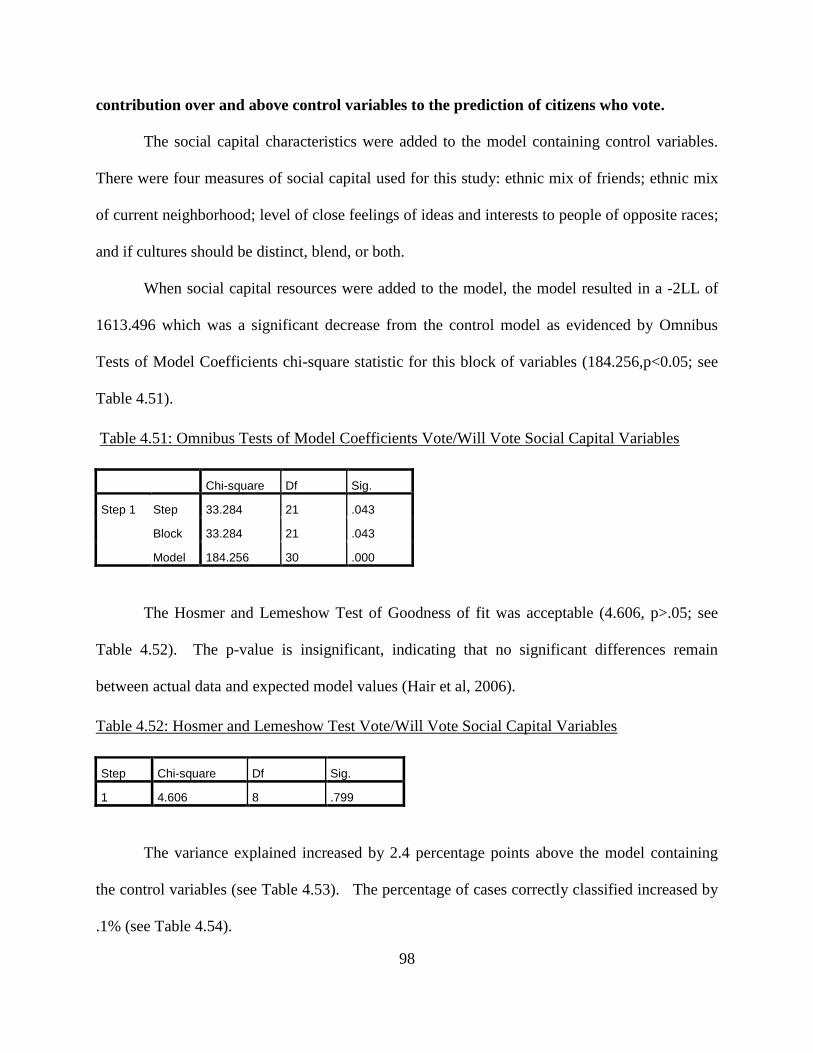
98
contribution over and above control variables to the prediction of citizens who vote.
The social capital characteristics were added to the model containing control variables.
There were four measures of social capital used for this study: ethnic mix of friends; ethnic mix
of current neighborhood; level of close feelings of ideas and interests to people of opposite races;
and if cultures should be distinct, blend, or both.
When social capital resources were added to the model, the model resulted in a -2LL of
1613.496 which was a significant decrease from the control model as evidenced by Omnibus
Tests of Model Coefficients chi-square statistic for this block of variables (184.256,p<0.05; see
Table 4.51).
Table 4.51: Omnibus Tests of Model Coefficients Vote/Will Vote Social Capital Variables
Chi-square Df Sig.
Step 1 Step 33.284 21 .043
Block 33.284 21 .043
Model 184.256 30 .000
The Hosmer and Lemeshow Test of Goodness of fit was acceptable (4.606, p>.05; see
Table 4.52). The p-value is insignificant, indicating that no significant differences remain
between actual data and expected model values (Hair et al, 2006).
Table 4.52: Hosmer and Lemeshow Test Vote/Will Vote Social Capital Variables
Step Chi-square Df Sig.
1 4.606 8 .799
The variance explained increased by 2.4 percentage points above the model containing
the control variables (see Table 4.53). The percentage of cases correctly classified increased by
.1% (see Table 4.54).

99
Table 4.55 shows significant predictors included Hispanic (p=.014) and Asian (p<.001)
race, less than high school (p<.001), high school (p<.001), some college (p<.001), college
(p=.031), very close in ideas and interests to Whites (p=.006) and fairly close in ideas and
interests to Hispanics (p=.048), and culture blending (p=.026).
Table 4.53: Model Summary Vote/Will Vote Social Capital Variables
Step
-2 Log likelihood
Cox & Snell R
Square
Nagelkerke R
Square
1 1613.496a .072 .139
a. Estimation terminated at iteration number 6 because parameter
estimates changed by less than .001.
Table 4.54: Classification Tablea
Vote/Will Vote Social Capital Variables
Observed Predicted
Vote/will vote Percentage
Correct Yes No
Step 1 Vote/will vote Yes 2170 2 99.9
No 290 3 1.0
Overall Percentage 88.2
a. The cut value is .500
Several of the significant variables revealed negative Betas: very close in ideas and
interests to Whites (β=-.544) and fairly close in ideas and interests to Hispanics (β-.629) and
cultural blending (β=-.498) – which suggests these variables reduce predictability to the
dependent variable.
Based on this analysis we accept the hypothesis that social capital group resources
characteristic variables will make a significant contribution over and above control variables to
the prediction of citizens who vote.
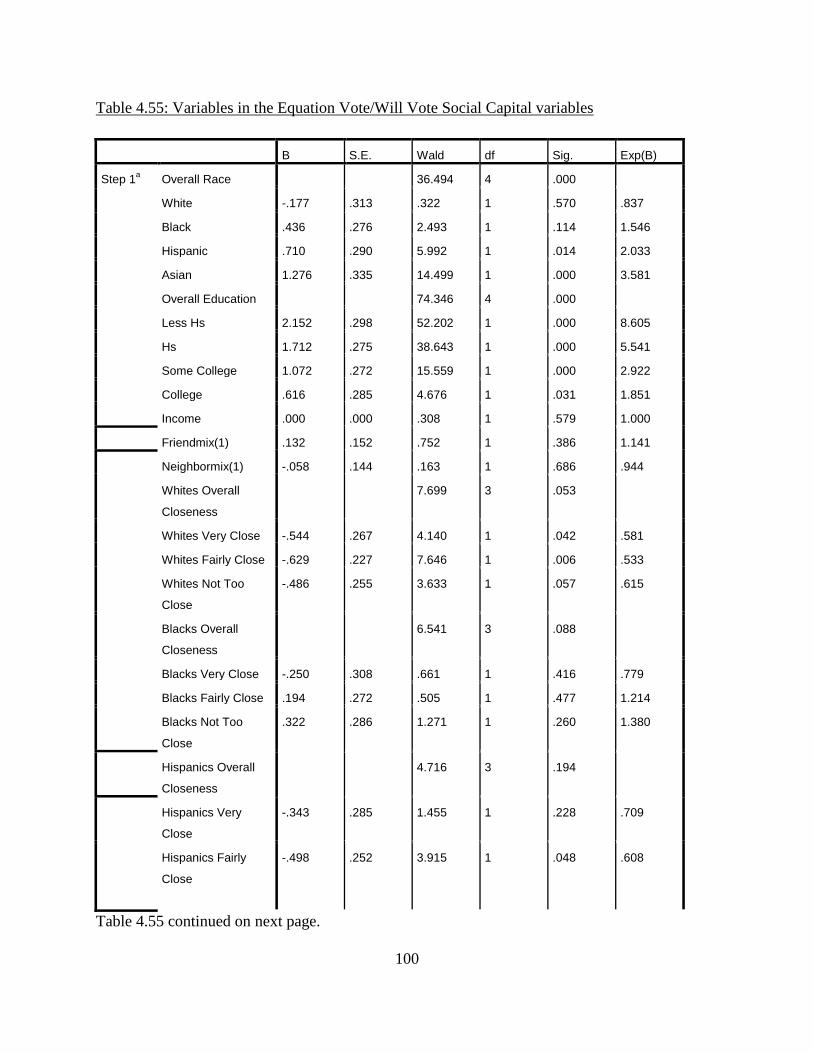
100
Table 4.55: Variables in the Equation Vote/Will Vote Social Capital variables
B S.E. Wald df Sig. Exp(B)
Step 1a Overall Race 36.494 4 .000
White -.177 .313 .322 1 .570 .837
Black .436 .276 2.493 1 .114 1.546
Hispanic .710 .290 5.992 1 .014 2.033
Asian 1.276 .335 14.499 1 .000 3.581
Overall Education 74.346 4 .000
Less Hs 2.152 .298 52.202 1 .000 8.605
Hs 1.712 .275 38.643 1 .000 5.541
Some College 1.072 .272 15.559 1 .000 2.922
College .616 .285 4.676 1 .031 1.851
Income .000 .000 .308 1 .579 1.000
Friendmix(1) .132 .152 .752 1 .386 1.141
Neighbormix(1) -.058 .144 .163 1 .686 .944
Whites Overall
Closeness
7.699 3 .053
Whites Very Close -.544 .267 4.140 1 .042 .581
Whites Fairly Close -.629 .227 7.646 1 .006 .533
Whites Not Too
Close
-.486 .255 3.633 1 .057 .615
Blacks Overall
Closeness
6.541 3 .088
Blacks Very Close -.250 .308 .661 1 .416 .779
Blacks Fairly Close .194 .272 .505 1 .477 1.214
Blacks Not Too
Close
.322 .286 1.271 1 .260 1.380
Hispanics Overall
Closeness
4.716 3 .194
Hispanics Very
Close
-.343 .285 1.455 1 .228 .709
Hispanics Fairly
Close
-.498 .252 3.915 1 .048 .608
Table 4.55 continued on next page.
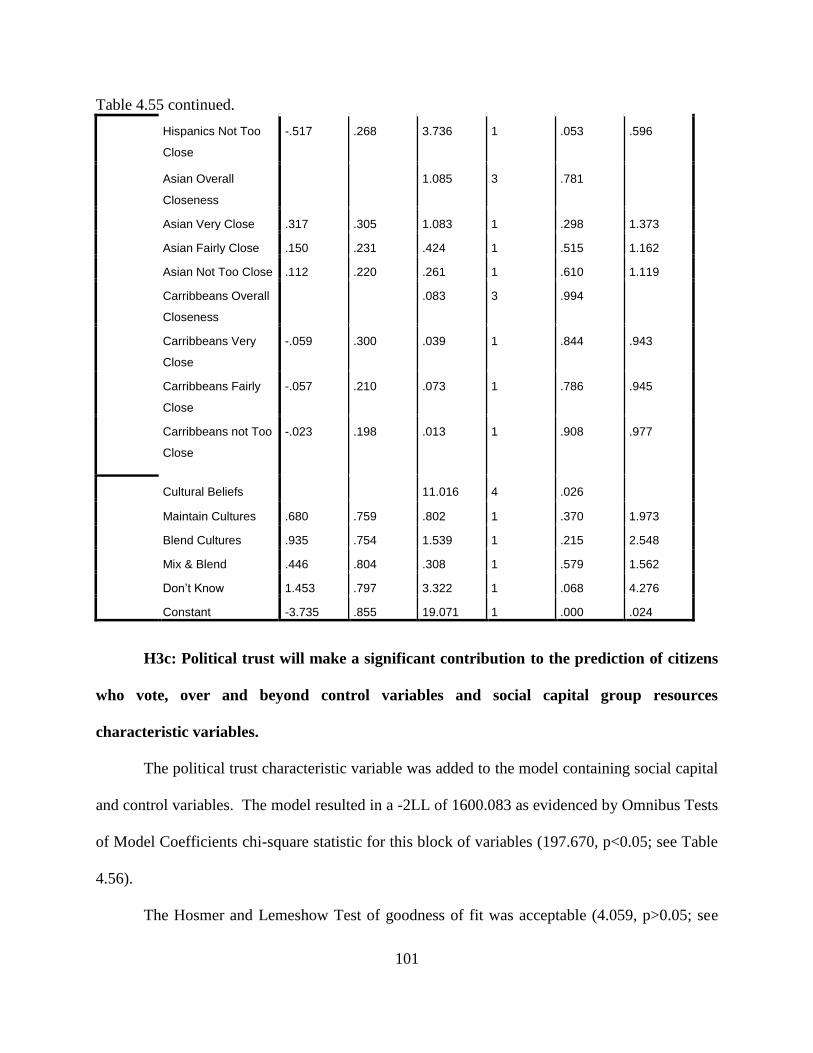
101
Table 4.55 continued.
Hispanics Not Too
Close
-.517 .268 3.736 1 .053 .596
Asian Overall
Closeness
1.085 3 .781
Asian Very Close .317 .305 1.083 1 .298 1.373
Asian Fairly Close .150 .231 .424 1 .515 1.162
Asian Not Too Close .112 .220 .261 1 .610 1.119
Carribbeans Overall
Closeness
.083 3 .994
Carribbeans Very
Close
-.059 .300 .039 1 .844 .943
Carribbeans Fairly
Close
-.057 .210 .073 1 .786 .945
Carribbeans not Too
Close
-.023 .198 .013 1 .908 .977
Cultural Beliefs 11.016 4 .026
Maintain Cultures .680 .759 .802 1 .370 1.973
Blend Cultures .935 .754 1.539 1 .215 2.548
Mix & Blend .446 .804 .308 1 .579 1.562
Don’t Know 1.453 .797 3.322 1 .068 4.276
Constant -3.735 .855 19.071 1 .000 .024
H3c: Political trust will make a significant contribution to the prediction of citizens
who vote, over and beyond control variables and social capital group resources
characteristic variables.
The political trust characteristic variable was added to the model containing social capital
and control variables. The model resulted in a -2LL of 1600.083 as evidenced by Omnibus Tests
of Model Coefficients chi-square statistic for this block of variables (197.670, p<0.05; see Table
4.56).
The Hosmer and Lemeshow Test of goodness of fit was acceptable (4.059, p>0.05; see
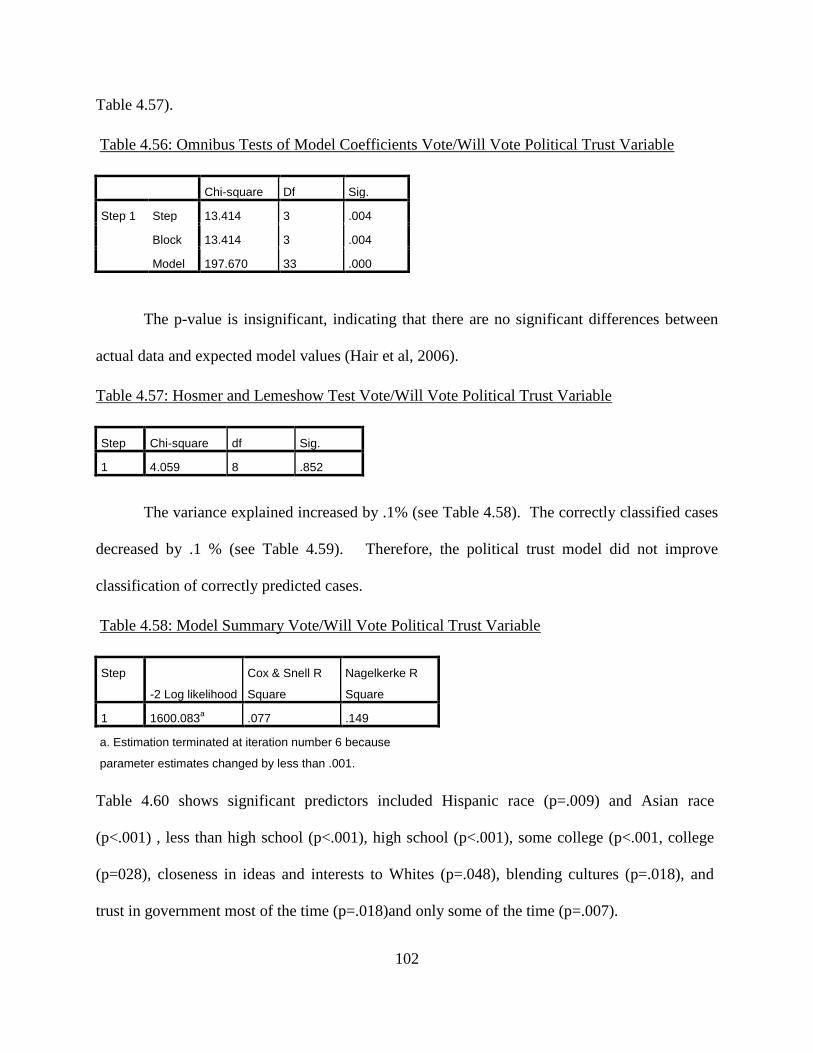
102
Table 4.57).
Table 4.56: Omnibus Tests of Model Coefficients Vote/Will Vote Political Trust Variable
Chi-square Df Sig.
Step 1 Step 13.414 3 .004
Block 13.414 3 .004
Model 197.670 33 .000
The p-value is insignificant, indicating that there are no significant differences between
actual data and expected model values (Hair et al, 2006).
Table 4.57: Hosmer and Lemeshow Test Vote/Will Vote Political Trust Variable
Step Chi-square df Sig.
1 4.059 8 .852
The variance explained increased by .1% (see Table 4.58). The correctly classified cases
decreased by .1 % (see Table 4.59). Therefore, the political trust model did not improve
classification of correctly predicted cases.
Table 4.58: Model Summary Vote/Will Vote Political Trust Variable
Step
-2 Log likelihood
Cox & Snell R
Square
Nagelkerke R
Square
1 1600.083a .077 .149
a. Estimation terminated at iteration number 6 because
parameter estimates changed by less than .001.
Table 4.60 shows significant predictors included Hispanic race (p=.009) and Asian race
(p<.001) , less than high school (p<.001), high school (p<.001), some college (p<.001, college
(p=028), closeness in ideas and interests to Whites (p=.048), blending cultures (p=.018), and
trust in government most of the time (p=.018)and only some of the time (p=.007).
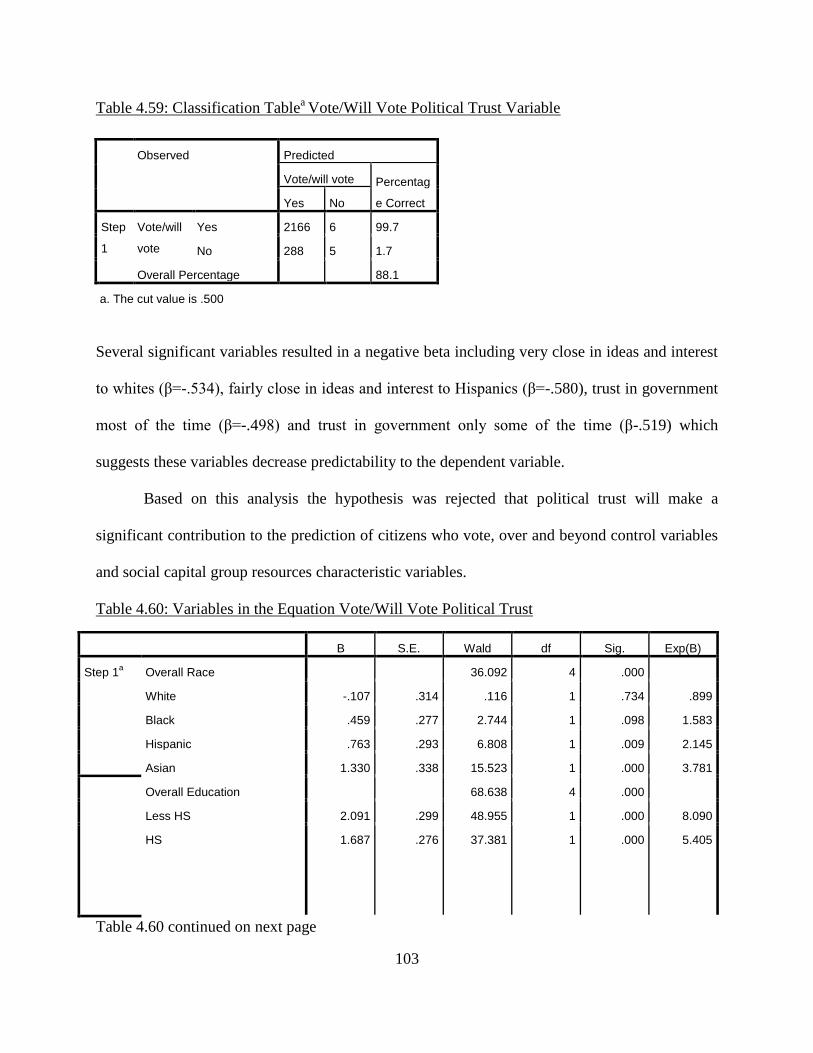
103
Table 4.59: Classification Tablea Vote/Will Vote Political Trust Variable
Observed Predicted
Vote/will vote Percentag
e Correct Yes No
Step
1
Vote/will
vote
Yes 2166 6 99.7
No 288 5 1.7
Overall Percentage 88.1
a. The cut value is .500
Several significant variables resulted in a negative beta including very close in ideas and interest
to whites (β=-.534), fairly close in ideas and interest to Hispanics (β=-.580), trust in government
most of the time (β=-.498) and trust in government only some of the time (β-.519) which
suggests these variables decrease predictability to the dependent variable.
Based on this analysis the hypothesis was rejected that political trust will make a
significant contribution to the prediction of citizens who vote, over and beyond control variables
and social capital group resources characteristic variables.
Table 4.60: Variables in the Equation Vote/Will Vote Political Trust
B S.E. Wald df Sig. Exp(B)
Step 1a Overall Race 36.092 4 .000
White -.107 .314 .116 1 .734 .899
Black .459 .277 2.744 1 .098 1.583
Hispanic .763 .293 6.808 1 .009 2.145
Asian 1.330 .338 15.523 1 .000 3.781
Overall Education 68.638 4 .000
Less HS 2.091 .299 48.955 1 .000 8.090
HS 1.687 .276 37.381 1 .000 5.405
Table 4.60 continued on next page
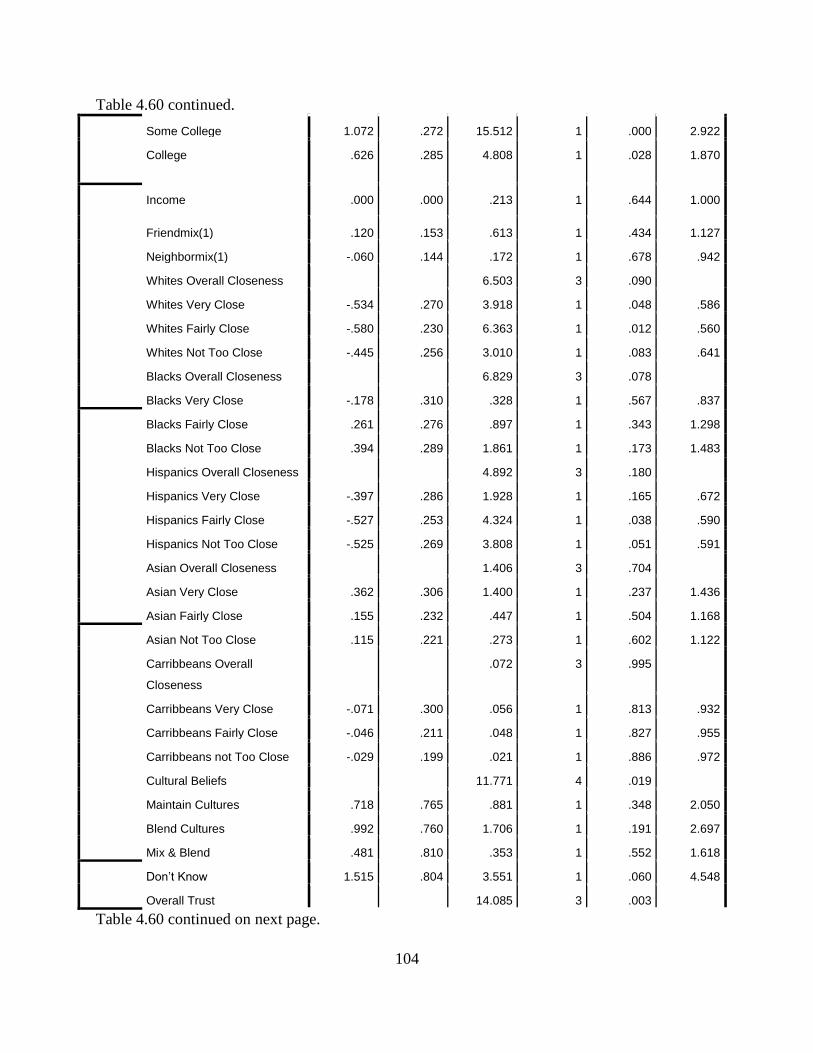
104
Table 4.60 continued.
Some College 1.072 .272 15.512 1 .000 2.922
College .626 .285 4.808 1 .028 1.870
Income .000 .000 .213 1 .644 1.000
Friendmix(1) .120 .153 .613 1 .434 1.127
Neighbormix(1) -.060 .144 .172 1 .678 .942
Whites Overall Closeness 6.503 3 .090
Whites Very Close -.534 .270 3.918 1 .048 .586
Whites Fairly Close -.580 .230 6.363 1 .012 .560
Whites Not Too Close -.445 .256 3.010 1 .083 .641
Blacks Overall Closeness 6.829 3 .078
Blacks Very Close -.178 .310 .328 1 .567 .837
Blacks Fairly Close .261 .276 .897 1 .343 1.298
Blacks Not Too Close .394 .289 1.861 1 .173 1.483
Hispanics Overall Closeness 4.892 3 .180
Hispanics Very Close -.397 .286 1.928 1 .165 .672
Hispanics Fairly Close -.527 .253 4.324 1 .038 .590
Hispanics Not Too Close -.525 .269 3.808 1 .051 .591
Asian Overall Closeness 1.406 3 .704
Asian Very Close .362 .306 1.400 1 .237 1.436
Asian Fairly Close .155 .232 .447 1 .504 1.168
Asian Not Too Close .115 .221 .273 1 .602 1.122
Carribbeans Overall
Closeness
.072 3 .995
Carribbeans Very Close -.071 .300 .056 1 .813 .932
Carribbeans Fairly Close -.046 .211 .048 1 .827 .955
Carribbeans not Too Close -.029 .199 .021 1 .886 .972
Cultural Beliefs 11.771 4 .019
Maintain Cultures .718 .765 .881 1 .348 2.050
Blend Cultures .992 .760 1.706 1 .191 2.697
Mix & Blend .481 .810 .353 1 .552 1.618
Don’t Know 1.515 .804 3.551 1 .060 4.548
Overall Trust 14.085 3 .003
Table 4.60 continued on next page.

105
Table 4.60 continued.
Just About Always .161 .281 .328 1 .567 1.174
Most of the Time -.498 .210 5.603 1 .018 .608
Only Some of the Time -.519 .192 7.353 1 .007 .595
Constant -3.506 .866 16.401 1 .000 .030
106
CHAPTER FIVE: CHARACTERISTICS OF DATASET, INTERPRETATIONS,
CONCLUSIONS, IMPLICATIONS, AND RECOMMENDATIONS
This chapter discusses biases of the NPS dataset related to the dependent variables used
in this study, lack of meaningfulness of the data, key findings related to statistical significance of
certain predictors, and opportunities for further research utilizing these study measures and other
measures of social capital and political trust to predict electoral and non-electoral forms of
political engagement.
Characteristics of the Dataset
The NPS dataset has certain characteristics that fundamentally shape the interpretation of
this study‘s findings. Thus, it is important to review these characteristics before interpreting the
findings.
Dependent Variable Variance Issues
Two of the dependent variables for this study had low variance in the responses making it
difficult to improve upon the prediction from the null model.
First, for the political engagement variable ‗attend political meetings or rallies,‘ eighty-
three percent (83%) of respondents responded that they did not attend political meetings or
rallies. Not surprisingly, the logistic regression analysis in this study found that eighty-three
percent (83%) of the cases were correctly predicted and one-hundred percent (100%) of the
correctly predicted cases represented those who responded ‗no‘ to attending political meetings or
rallies. Thus, there was only a minimal opportunity for improvement in the predictive model
related to attending political meetings or rallies, even after social capital and political trust
variables are added to the model.
Second, similar issues were found with the dependent political engagement variable for
voting. Eighty-eight (88%) of the respondents indicated they voted or intended to vote, which is
107
a twenty-two percentage point (22%) increase from the overall voter turnout in the 2004
Presidential election of 64% (http://www.census.gov/newsroom/releases/archives/voting/cb05-
73.html, US Census Bureau Reports, 2005). Eighty-eight (88%) percent of the cases were
correctly predicted by the null model, providing minimal opportunity for improvement in
prediction. One-hundred percent (100%) of the correctly predicted cases were biased towards
those who responded ‗yes‘ to voted or will vote. Unsurprisingly, once social capital and political
trust variables were added to the voting model, the overall percentage of correctly predicted
cases was unchanged (88%) – which demonstrates no improvement in predictability beyond the
control variables.
It is also important to note that the NPS data included a significant number of missing
cases related to voting. Respondents that responded ‗don‘t know‘ or ‗refused to answer‘ to
voting were not included in the logistical regression analysis, resulting in eight-hundred and
seventy-four (874) missing cases. If the 874 cases had responded ‗yes‘ or ‗no‘ instead of ‗don‘t
know‘ or ‗refused,‘ the model could have resulted in a higher variance among cases and a
stronger predictive model.
Unlike the political engagement activities related to ‗voted/will vote‘ and ‗attending
political meetings,‘ the dependent variable ‗talking to others to persuade them to vote for a
candidate or party‘ had a more equal balance of ‗no‘ and ‗yes‘ responses. The overall percentage
of cases correctly predicted for the null model was 51.4%, unlike ‗voting‘ (83%) and ‗attending
political meetings variables‘ (88%). Talking to others to persuade them to vote for a party or
candidate provided a better opportunity for the logistic regression to improve predictability once
social capital and political trust variables were added to the model.
Large Sample Size.
108
The NPS sample for this study was large (n=3,339) which provided unique opportunities
for this study. However, it is also important to note that it gave this study very high statistical
power enabling even the smallest effect sizes to be detected as significant. One has to be very
careful in interpreting the findings because the high power results in some statistically significant
predictors that have no practical meaning.
Interpretations of Key Findings
Because of the issues discussed above, the key findings of this study will be discussed by
dependent variable.
Attend Political Meetings or Rallies
Unfortunately the predictors used in this study did not result in any improvement in
predicting this dependent variable. As noted above, 83% of the respondents to the NPS study
reported not attending political meetings or rallies which provided the baseline comparison
prediction ratio. The final predictive model did not improve upon this.
Thus, even though steps in the hierarchical regression were significant and there were
some statistically significant predictors, they have no practical meaning. They are due entirely to
the high power of the study. The simple fact is our prediction without any predictor variables—
that 83% would not attend a meeting or rally—is as good as the final prediction model. The key
variables of interest in this study (social capital and political trust) failed to add to the accuracy
of predicting whether people would attend a meeting or rally.
Vote or Will Vote
Unfortunately the predictors used in this study did not result in any improvement in
predicting this dependent variable. As noted above, 88% of the respondents to the NPS study
reported they voted or will vote which provided the baseline comparison prediction ratio. The
109
final predictive model did not improve upon this.
Thus, even though steps in the hierarchical regression were significant and there were
some statistically significant predictors, they have no practical meaning. They are due entirely to
the high power of the study. The simple fact is our prediction without any predictor variables—
that 88% would vote or plan to vote—is as good as the final prediction model. The key variables
of interest in this study (social capital and political trust) failed to add to the accuracy of
predicting whether people did or would vote.
Talking to Others to Persuade Them to Vote for a Candidate or Party.
This dependent variable was the only one for which there was any improvement in the
classification ratio—and for which there was any substantial opportunity to improve upon the
classification. Unfortunately, the improvement from adding social capital and political trust was
small. Overall, the best model correctly classified 60.2% of the cases, an increase of 8.8% over
the null model. Interestingly, our prediction of ―yes‖ responses got worse while the prediction of
―no‖ responses improved. It is questionable whether these results have much practical
significance since the improvement was relatively small.
Despite the small improvement in classification, it is the only model for which it is
meaningful to talk about individual predictors though the reader is cautioned to remember that
the effect of these predictors is small. Results from this model show that:
Asians are more likely to talk to persuade others. This finding is
consistent with other literature which shows that ethnic Chinese who have made the
effort to become American citizens have stronger incentives to join organizations of both
varieties and are 16 percent more likely to participate in both American and Chinese
culture (Uslaner & Conley, 2003). Astonishingly, the same study (Uslaner & Conley,
110
2003) revealed that fifty-nine percent (59%) of ethnic Chinese between the ages of 18
and 24 take part in American national political life, compared to 35 to 40 percent of
middle-aged respondents (40-69 years old) and 20 percent of people 70 and older
(Uslaner & Conley, 2003).
Income was not a significant predictor. This finding is not consistent with
most literature related to income and political engagement. A Pew Research Center
Study (2010) revealed that income and education have a positive correlation to political
engagement (Smith, Schlozman, Verba, Brady, 2009). Though income does influence
political engagement, especially as related to political consumerism, Solt (2006) cited
(Schlozman, Burns, & Verba, 1999) theory that social networks established while
employed encourages engagement because the connections and relationships citizens
build while at work often lead to social and politically relevant discussions and activities
at work or outside of work.
Education was a significant predictor. When control variables were added
to the baseline model, the results revealed that education had significant levels of
prediction to talking to persuade others to vote for a candidate or party. Literature shows
education as a significant factor that influences political engagement (Solt, 2006; Farmer,
2006). The findings from the NPS data suggest that education is a significant predictor
among those who engage in politics by talking to others to persuade them to vote for a
particular candidate or party, when income, race, social capital, and political trust are the
independent variables. Therefore, the American educational system should focus on
providing resources to ensure that every citizen is educated and encourage citizens to
further their education to increase the likelihood that citizens will be politically engaged.
111
Social Capital variables related to closeness of ideas and interests to other
races were negative predictors. Social capital variables related to closeness of ideas and
interests to other races were negatively related. For example, respondents who felt very
close in ideas and interests to blacks had a 42% less chance of talking to others to
persuade them to vote for a particular candidate or party. Respondents who indicated that
they were very close to the ideas and interests of Hispanics had a 39% less chance of
talking to others to persuade them to vote for a particular candidate or party. These
findings suggest that closeness in ideas and interests to other races decreases the
likelihood that a person will talk to others to persuade them to vote.
Friendship ethnic mix and neighborhood ethnic mix were not significant
predictors. The 2001 Social Capital Community Benchmark survey
(http://www.cfsv.org/communitysurvey/results_pr.html) supports the findings in this
study that friendship and neighborhood ethnic mix have no significant relationship to
political engagement. The Social Benchmark Survey results show that the more diverse a
community, the less likely residents are to trust other people, connect across ethnic lines,
and participate in politics. The results also showed that people of more ethnically diverse
communities are more likely to feel that ‗people running my community don‘t really care
much what happens to me‘ (Social Capital Community Benchmark Survey, 2001).
Diverse neighborhoods had lower levels of trust for their neighbors, did not attend
meetings or rallies, were less likely to vote, less likely to participate in demonstrations or
protests, and were less likely to sign petitions (Social Capital Community Benchmark
Survey, 2001). This may suggest that having ethnically diverse friends and living in
112
ethnically neighborhoods are predictors of political disengagement, instead of political
engagement.
Political trust was related to talking to others. Political trust was
positively related to talking to others to persuade them to vote for a candidate or party.
Based on the results of this study, higher levels of political trust such as ‗just about
always,‘ ‗most of the time‘, and ‗some of the time‘ positively influenced talking to others
to persuade them to vote for a candidate or party and attend political meetings or rallies.
This may suggest that the higher the level of trust people have in government the greater
likelihood they will talk to others to persuade them to vote for a candidate or party. A
Pew Research Study (2010) recently revealed that 8 in 10 Americans don‘t trust the
federal government (Smith, Schlozman, Verba, Brady, 2009). The study also revealed
that more than 6 in 10 Americans (62%) believe that the government is unfair to certain
people or groups and fifty-six percent (56%) believe that government does not do enough
to help the average American (Smith, Schlozman, Verba, Brady, 2009). Unfortunately,
very minimal literature and research has attempted to explain the predictability of
political trust on political engagement.
Summary of Interpretations
As previously stated, due to the large sample (n=3339) in this study, statistical power was
high enough to detect even the smallest changes in variance explained. As power increases, the
chances of accepting a false null hypothesis (Type II error) decreases. The power of this study is
so high that the significant predictors are not meaningful to the purposes of this study.
Concluding that the hypotheses are significant, without recognizing and understanding
the biases in the study could lead to false conclusions regarding the ability of social capital and
113
political trust to predict political engagement. Though some of the results are statistically
significant, the minimal improvement of each model does not support the practical purposes of
this study to empower and encourage elected officials, public administrators, and government
agencies with the information needed to build trust among constituents, create programs that
provide individual and group resources to expand citizen social capital, and ultimately to create
opportunities for citizens to engage politically to address issues related to the responsiveness of
government to their needs.
The significant results in this study offer opportunities for further exploration into the
theory that social capital and political trust predict certain types of political engagement, despite
two dependent variables having little chance of improvement. Though the results found that
social capital and political trust did not have predictive power, there are opportunities for further
research related to these variables and their ability to predict political engagement.
Further Research
This section outlines recommendations for future research.
Non-biased Dataset
If this study is performed in the future, it is recommended that a sample that is less biased
in responses be used. In searching the Inter-University Consortium for University Research
(http://www.icpsr.umich.edu/icpsrweb/ICPSR/index.jsp) database, one other dataset besides the
National Politics Study was retrieved that included the variables related to this study. The
United States Citizenship, Involvement and Democracy Survey (CID) (Howard, Gibson, Stolle,
2005) dataset may offer a less biased sample than the National Politics Study, and offers a closer
representation of the U.S. population among these ethnic minorities and white Americans.
However the CID Study does not offer the unique opportunity to study a large sample of ethnic
114
minorities, since the study includes 111 Black respondents, 124 Hispanic respondents, and 706
White respondents (http://www8.georgetown.edu/centers/cdacs/cid/trust.pdf, 2005 p. 1).
Statistical Methodology
Future research should also consider using Structural Equation Modeling (SEM) or
Latent Class Analysis to study relationships among variables in this study. Structural Equation
Modeling is a technique that analyzes relationships between multiple independent and dependent
variables based on hypothesized constructs. Structural Equation Modeling moves beyond simply
measuring relationships allowing direct and indirect effects among independent and dependent
variables to be measured by producing a simultaneous estimation of all coefficients in the model.
Latent Class Analysis does the same thing but for nominal or ordinal data.
Political Engagement
Michael Donald and Samuel Popkin (2001) argue that a vast amount of statistics related
to political engagement, specifically voter turnout, tends to overestimate the decline. Donald &
Popkin (2001) argue that the statistics include ineligible voters and the research shows overall
voting rates have decreased. However the rate of decrease is less when excluding the non-
eligible voters and voting rates have not been diminishing as reported (McDonald & Popkin,
2001).
A fact sheet published by the Annie Casey Foundation entitled Race Matters: Unequal
Opportunities for Civic Participation (Annie Casey Foundation, 2006) cited (Frasure &
Williams, 2002) that Latinos are more likely not to be engaged in political activities because of
citizenship status in the United States, which make them non-eligible voters. Although residency
is a barrier to voting and participation in American civic activities, Bedolla (2004) cited
(Leighley and Vedlitz, 1999; Garcia, 1997; Garcia, Falcon and de la Garza, 1996) that there is

115
still a gap in Latino political participation even when controlling for socioeconomic status and
citizenship status.
Further research should explore contemporary non-electoral types of political
engagement. Voting has been over-studied as a variable of political engagement. Though the
variables in this study focused on traditional forms of electoral and non-electoral political
engagement, there is opportunity for further research to examine nontraditional and more
contemporary forms of political engagement such as e-deliberation, e-petitions, contributing
money online, political consumerism, political blogging, etc. Citizenship norms are changing
and affecting the way citizens are choosing to influence politics. Citizens are using informal
networks to build social capital and become politically engaged by meeting other people in
informal settings to share ideas, and mobilize for causes.
Many of these informal networks are initiated via online social networking websites. A
study by the Pew Research Center (Smith, Schlozman, Verba, & Brady, 2009) found that 33% of
internet users participated in online social networking websites and that these users also engaged
in political activities while online. Further research should explore whether these informal
connections lead to more formal organized networks and if these informal social networks
predict political engagement. If people in general, including younger generations, are joining
social networking sites and continue to use these sites as tools to build social capital, the question
must be answered if these social networking sites actually predict political engagement even into
adulthood. Further research should also explore how the digital divide among whites and ethnic
minorities, as well as low income and higher income Americans, impact citizens‘ ability to
engage in social networking and internet based political engagement. Americans may have flat
or decreasing electoral participation in voting but increasing participation in other forms of non-
116
electoral activities.
Social Capital
In this study racial minorities were analyzed to identify their types of social capital as
measured by friendship ethnic mix, neighborhood ethnic mix, closeness in ideas and interests to
other races, and belief in maintaining or blending cultures. Interacting with members of one‘s
own ethnicity requires an identification and understanding of one‘s collective identity and
closeness of ideas and interests to one‘s own race.
The results showed that race was not a strong predictor and these levels of significance
did not improve when social capital variables were added to the model. One may interpret this
and argue that citizens who have ethnically diverse friends, live in ethnically diverse
neighborhoods, share some level of ideas and interests of others, and who believe in cultural
blending, do not benefit enough to predict political engagement unless these relationships
involve political ties. Research (McClurg, 2003) suggests that if a citizen‘s social network does
not consist of discussions and activities that encourage political participation, then that type of
social network is not necessarily a good predictor of political engagement. Social networks that
provide civic and political resources allow citizens to find out who candidates are and where
candidates stand on issues, thereby increasing the likelihood that citizens will become politically
engaged and maybe even vote. Further research should examine social capital as it relates to
social connections and relationships, but also social capital as it relates to social political
activities such as political discussions in social networks, political traditions in social networks,
and political norms in social relationships. Social capital, as it relates to social activities centered
on politics, may yield better prediction of political engagement.
Political Trust
117
Measuring trust in government is multifaceted and demands more research, especially as
it relates to human social capital, government decision making processes, citizen policy
preferences, and government performance.
Unfortunately, very minimal literature was found that attempts to explain how political
trust predicts political engagement. Evaluations are based on government performance
indicators such as its ability to respond to the needs of individuals or groups of individuals, its
ability to be fiscally responsible with taxpayer dollars, and the integrity of government workers
and officials. A Pew Research study (2010) recently revealed that nearly 8 in 10 Americans say
they don‘t trust the federal government (Schlozman, Verba, & Brady, 2009). However,
declining trust in institutions is not only limited to government (Nye, 1997).
Gershtenson & Plane (2007) believe that the national government is too often the single
focus of studies related to political trust. The American federal government is very visible, yet
citizen perceptions towards government and levels of trust might also be created through media
and other non-governmental or social factors. However, there are other levels of government
that should be explored and other types of institutions that may influence citizen trust in
government. In the American democratic system, state governments retain some authority over
political and policy decisions that impact the lives of citizens, and local and state governments
have an influence on the programs and products of private and non-profit organizations.
Though this study focused on political trust in Washington, further research should
examine citizen trust towards local and state government as well as non-governmental
institutions.
―For individuals, social capital has been linked to improved health, earnings, and
happiness (Putnam, 2000:319,326), while at the organizational level, researchers have
118
found strong associations between social capital and ‘corporate entrepreneurship‘ (Chung
and Gibbons, 1997), firm mortality (Pennings, Lee, and Witteloostuijn, 1998), the
creation of human and intellectual capital (Coleman, 1988), the formation of start-up
companies (Walker, Kogut, and Shan, 1997), the strength of supplier relations (Baker,
1990; Uzzi, 1997), interfirm learning (Kraatz, 1998), the expansion of regional
production networks (Romo and Schwartz, 1995), and the formation of strategic alliances
(Chung, Singh, and Lee, 2000)‖ (Chung & Gibbons 1997 p. 17).
Citizens often expect government to set policies that regulate both private and non-profit
organizations and citizen confidence in the government‘s ability to do such could influence
citizen trust in government and these institutions.
Focus on Ethnic Minorities
Researchers must increase research related to factors that drive political activity in racial
minority communities and this study suggests predictors that should be explored further beyond
race, income, and education – especially among racial minorities. Other types of individual and
group resources besides income, education, race, friendship mix, attitudes towards connecting
with other races, and political trust may also predict political engagement among ethnic
minorities. Researchers should further explore minority levels of trust towards organizations
and institutions that were created to serve as a political voice and advocate on behalf of ethnic
minorities, and whether the individual and group resources these organizations created and
provided for citizens are effectively building citizen social capital that can predict citizen
political engagement. Examples of such institutions may be the National Association for the
Advancement of Colored People, PolicyLink, ACORN, and Rainbow Push Coalition.
Based on a review of literature, political trust has rarely been studied since the women‘s

119
rights and civil rights movements. ―The existence of distrustful citizens who are convinced that
government serves the interests of few rather than the interests of all is a barrier to the realization
of the democratic ideal‖ (Amberbach & Walker, 1970). A representative democracy cannot be
successful until racial and ethnic minorities are actively engaged in policies and feel politically
equal. During school desegregation and busing, the United States was divided across racial lines
as blacks became politically engaged to demand equal access to education and the resources
provided by government to educate their population. During this time, and into the 1970s
(Damico, Conway, Damico, 2000), blacks were least likely to trust others because of injustices
they felt were unfair and government‘s lack of urgency to provide equal access to education.
During this period in time, African Americans not only had interpersonal distrust for White
Americans, but studies show there was a lack of trust for government (Loury, 1977).
Further research should be done to explain if ethnic minorities are more trusting of
political leaders of their own race, which may explain the relationship between political trust and
political engagement – maybe even in highly white populated communities where social capital
is high. Or, are ethnic minorities more politically engaged in white communities being led by
white political leaders when they feel disconnected or their concerns are not being heard.
Implications for Human Resource Development
Civic and political engagement is an issue that garners the attention, resources, and
research of Human Resource Development (HRD) and adult learning professionals. Human
Resource Development, through research and interventions, can have a positive impact on civic
and political engagement among individuals, organizations, and society (systems) as a whole.
Human Resource Development professionals should study the roles political trust and social
capital play in political engagement, and also the individual and group level resources needed to

120
build social capital and encourage political engagement. The evidence supported by research
should then be followed by civic education and training programs in academic institutions, as
well as government, nonprofit, and private organizations that will result in a stronger democracy
for all American citizens.
Human Resource Development is an ever growing field of study that encompasses both
individual and organizational development strategies through learning and performance
improvement processes. ―Human Resource Development is a process for developing and
unleashing human expertise through organizational development and personnel training and
development for the purpose of improving performance‖ (Swanson & Holton, 2001 p. 4). A
study by Kaufman and Tepper (1999) noted that organizations that offer opportunities for formal
interactions such as arts/cultural organizations, mutual benefit societies, and sporting clubs had a
significantly positive relationship to higher voter turnout rates. Human Resource Development
professional must create these opportunities within organizations to foster social and political
engagement. ―Explanations for the relationship between membership in social organizations and
political involvement includes arguments that the membership stimulates a collective interest in
politics (e.g., Putnam 2000), makes people available to elites for mobilization (e.g., Leighley,
1996), and helps people learn skills that make participation easier (e.g., Verba et al. 1995)‖
(McClurg, 2003 p. 4).
Social Learning Theory
Gibson (2004) argues that the field of Human Resource Development has not reached its
full potential in connecting learning and development to citizen environment(s). Social learning
theory suggests that citizens can learn and develop through engagement and networking to
resolve issues that impact their communities. Communities and neighborhoods, particularly poor
121
and minority communities, sometimes lack the social capital needed to reach their maximum
personal and professional potential. People who lack the ability to access information, learn the
necessary steps to take actions, who do not have the self-efficacy to become politically engaged,
and who are unskilled at developing relationships, need to learn how to be politically engaged.
This offers opportunity for HRD professionals to train, coach, and mentor elected officials,
government agency employees, and community based organizations on:
Community organizing;
Advocacy and lobbying;
Coalition building;
Developing relationships;
Developing socially responsible leadership;
Conducting community needs assessments;
Training citizens on how to exercise the various forms of civic engagement (i.e.
voting, lobbying, writing letters to the editor, hosting town hall meetings, etc.)
Measuring and tracking community development progress.
Political engagement requires information sharing and relationship development that will
lead to a better informed and active citizenry. Political engagement involves engagement in
community activities including membership in organizations, strategic planning around
advocacy, coalition building, voting, lobbying, and other forms of individual and group or
organizational engagement. Human Resource professionals can help organizational leaders
engage personnel in activities that address community problems, as well as activities that connect
organizations with constituents and society. A key priority for organizations is the enhancement
of its leader pool (Rock & Garavan, 2006) and developmental relationships. Rock & Garavan
122
(2006) define development relationships as the act of initiating contact with others in hopes of
connecting and building relationships. HRD professionals can help organizations and
individuals develop skills in relationship building and create opportunities for organizations to
connect with communities and neighborhoods to address social issues – including issues related
to (mis)trust and (dis)engagement of local, state, and national government agencies. Human
Resource Development can help governmental agencies assess community needs, address
community needs, and identify gaps in services related to community needs – which will
increase community engagement and build citizen trust in government agencies
HRD: Community and Societal Level of Analysis
Garavan, McGuire, and O‘Donnel (2004) suggest that HRD is evolving into a field that
understands the link between social networks and how they build strong communities,
organizations, and people. HRD experts can benefit society from the community perspective by
working with community based organizations to produce outcomes from a broader perspective
that benefit society–and how they engage society. The Human Resource Development field of
study has opportunity to further engage in research and professional practices related to
connecting the community and society to human development and learning experiences
(Garavan et al., 2004). ―The HRD literature has given little consideration to the learning
community as a mechanism to facilitate change at a community-societal level (Boot & Reynolds,
1997; Brookfield, 1987; O‘Donnell, 1999)‖ (Garavan et. al, 2004 p. 425).
Conclusion
The minimal improvement in predictability of each model does not support the practical
purpose of the study: to empower elected officials with the confidence that political trust
encourages political engagement and encourage public administrators and elected officials to

123
develop interventions that help build citizen trust in government and encourage social networks
and ties across ethnicities and neighborhoods that encourage political engagement. However, the
significant results in this study do offer opportunities for further exploration into the theory that
social capital and political trust may predict certain types of political engagement.
If political engagement is essential to the survival of American democracy, and if the
political science, public administration, and organizational development literature lacks in
research that expands beyond the traditional explanations of how socioeconomic status (Brady,
Verba, Schlozman, 1995) relates or predicts political engagement, then this model provides an
opportunity for further examination into more contemporary factors that predict political
engagement related to social capital and political trust. Researchers must broaden their
conceptual thinking to assist government officials and government organizations in
understanding the benefits of social relations and government integrity and efficiency in
fostering social relationships and political trust that encourages political engagement. The model
created in this study establishes a foundation for further research related to social capital,
political trust, and the likelihood that both variables can predict political engagement. The
results of this study are worthy of further exploration, with a dataset that is less biased. To argue
that this model is invalid, as a result of the findings in this study, would be premature and hinder
opportunities to examine predictors other than race, income, and education. More meaningful
results from future studies could lead to a paradigm shift in how government encourages
engagement, how government behaves to foster citizen trust, and how government creates
policies and programs that respond to the needs of all citizens regardless of race and
socioeconomic status.

124
REFERENCES
Abravanel, M.D. & Busch, R.J. (1975). Political competence, political trust, and the action
orientations of university. The Journal of Politics, 37, 57-82.
Adler., P & Kwon, S.W. (2002). Social Capital: Prospects for a New Concept. The Academy of
Management Review, 27,1, pp. 17-40.
American National Election Study 2000 Data File. Retrieved from the Inter-university
Consortium for Political and Social Research.
Amberbach, J.D. & Walker, J.L. (1970). Political trust and racial ideology. The American
Political Science Review, 64, 1199-1219.
Annie Casey Foundation (2006) Race Matters Toolkit. Retrieved from online on February 16,
2009 at http://www.aecf.org/upload/publicationfiles/fact_sheet10.pdf
Bedolla, L. (2004). Resources and Civic Engagement: The Importance of Social Capital for
Latino Political Incorporation. Harvard Journal of Hispanic Policy, 17: 41-54.
Bourdieu, P. (1986). The forms of capital. In J. G. Richardson (Ed.), Handbook of theory and
research for the sociology of education (R. Nice, trans., pp. 241-258). New York:
Greenwood.
Brady, E.H., Verba, S. & Schlozman, K.L. (1995). Beyond SES: A resource model of political
participation. The American Political Science Review, 89, 271-294.
Brehm, J. & Rahn, W. (1997). Individual-level evidence for the causes and consequences of
social capital American Journal of Political Science, 41, 999-1023.
Chung, L. & Gibbons, P. T. (1997). Corporate Entrepreneurship: The roles of ideology
and social capital. Group and Organization Management 22:10–30.
Citrin, J. (1974). Comment: The Political Relevance of Trust in Government. American
Political Science Review 68, pp. 973-88.
Cleary, M. R. & Stokes, S. (2006). Democracy and the culture of skepticism. New York: Sage.
Cohen, J., Cohen, P., West, S.G. & Aiken, L.S. (2003). Applied multiple regression. Lawrence
Erlbaum Associates, Inc.
Coleman, J. (1987). Families and Schools. Educational Researcher, 16,6, pp. 32-38.
Coleman, J. (1988). Social Capital in the Creation of Human Capital. The American
Journal of Sociology, 94, pp.95-120.
125
Dalton, R. (2008). Citizenship Norms and the Expansion of Political Participation. Political
Studies 56 (1), 76-98.
Damico, A. J., Conway, M. M. & Damico, S. B. (2000). Patterns of political trust and
mistrust: Three moments in the lives of democratic citizens. Polity, 32(3), 377-400.
Farmer, G. L. (2006). African American males‘ civic engagement: The importance of social
organizational involvement and friendship diversity. Journal of African American
Studies, 10, 51-68.
Garavan, T.N., McGuire, D. & O‘Donnell, D. (2004): ―Exploring Human Resource
Development: A Level of Analysis Approach‖, Human Resource Development Review,
3(4), pp. 417 - 441.
General Social Survey. National Opinion Research Center, University of Michigan. Electronic
resources from the www.icpsr.umich.edu/gss. Ann Arbor, MI: University of Michigan,
National Opinion Research Center, 1972-2004
Gershtenson, J. & Plane, D. (2007). 2006 American National Election Studies Pilot Report.
Gibson, S. (2004). Social learning (cognitive) theory and implications for Human Resource
Development. Advances in Developing Human Resources, 6(2), 193-210.
Granovetter, J. (1973). The Strength of Weak Ties. American Journal of Sociology, 78,6, pp.
1360-1380.
Hair, J., Black, W., Babin, B., Anderson, R., Tatham, R. (2006). Multivariate Data Analysis 6th
ed. Pearson Prentice Hall.
Hero, R. E. (2003). Social capital and racial inequality in America. Perspectives on Politics, 1,
113-122.
Hetherington, M. & Globetti, S. (2002). Political trust and racial policy preferences. American
Journal of Political Science, 46, pp. 253-275.
Hetherington, M. J. (1998). The political relevance of political trust. The American
Political Science Review, 92, 791-808.
Hetherington, M. J. (2005). Why trust matters: Declining political trust and the demise of
American liberalism. Princeton: Princeton University Press.
Howard, M. H., Gibson, J. L. and Stolle, D. (2005) ‗The US Citizenship, Involvement,
Democracy Survey‘, Center for Democracy and Civil Society (CDACS) Survey Report,
Georgetown University. Retrieved from online on September 18, 2010 at
http://www8.georgetown.edu/centers/cdacs/cid/trust.pdf, 2005 p. 1).
126
Jackson, J., Hutchings, V., Brown, R., & Wong, C., (2004). National Politics Study, University
of Michigan, Institute for Social Research. Retrieved from online September, 23 2008 at
http://www.icpsr.umich.edu/icpsrweb/ICPSR/index.jsp
Kaufman, J. (1999). Three views of associationalism in nineteenth century America: An
empirical examination. American Journal of Sociology, 105(5), pp. 1296-1345.
Kaufman, J. & Tepper, S. (1999). Groups or Gatherings: Predicting Voter Turnout in 19th
Century American Cities. International Journal of Voluntary and Nonprofit
Organizations 10 (4), 299-322.
Krenz, B. (2006). Respondents report: National politics study 2004. University of Michigan,
Institute for Social Research.
Kwak, N., Shah, D. V., & Holbert, R. L. (2004). Connecting, trusting, and participating: The
interactive effects of social associations and generalized trust on collective action.
Political Research Quarterly, 57, 643-652.
Leighley, J. & Nagler, J. (2007). Who Votes Now? And Does It Matter?. Paper prepared for
presentation at 2007 Annual Meeting of the Midwest Political Science Association,
Chicago, Illinois, April 12-15.
Levi, M. & Stoker, L. (2000). Political trust and trustworthiness. Annual Review of Political
Science, 3, 475-507.
Lin, N. (1999). Social Networks and Status Attainment. Annual Review of Sociology, 25:467-
487.
Lin, N. (1999). Building a Network Theory of Social Capital. Connections, 22, 1, pp. 28-51.
Loury, G. (1977). A dynamic theory of racial income differences, in women, minorities and
employment discrimination., P. Wallace & A. LeMund, Eds. Lexington, MA: Lexington
Books.
Macedo, S., Alex-Assensoh, Y., Berry, J.M., Brintnall M., Campbell, D.E., Fraga, L.R., Fung,
A., Galston, W.A., Karpowitz, C.F., Levi, M., Levinson, M., Lipsitz, K., Niemi, R.G.,
Putnam, R.D, Rahn, W.M., Reeves, K., Reich, R., Rodgers, R.R., Swanstrom, T. &
Walsh, K.C., (2005). Democracy at risk: How political choices undermine citizen
participation, and what we can do about it. Washington DC: Brookings Institutional
Press.
Mayer, R. C., Davis, J. H. & Schoorman, F.D. (1995). An integrative model of organizational
trust . Academy of Management Review, 20(3), 709-734.
Mcclurg, S.D. (2003). Social networks and political participation: The role of social interaction
in explaining political participation. Political Research Quarterly, 56, 449-464.
127
McDonald, S., Lin, N., & Ao. (2009). Networks of Opportunity: Gender, Race, and Job Leads,
Social Problems, 56, 3, 358-402.
McDonald, M. and Popkin, S. (2001). The myth of the vanishing voter, American Political
Science Review, 95 (4), 963–74.
Miller, A. H. (1974). Political issues and trust in government, 1964-70. American
Political Science Review, 68, 951-72.
Mishler, W. & Rose, R., (2005). What are the Consequences of Political Trust: A Test of
Cultural and Institutional Theories in Russia. Comparative Political Studies
(November, 2005).
Nye, J. S., Jr. (1997). Introduction: The decline of confidence in government. In J. S. Nye, Jr., P.
D. Zelikow, & D. C. King (Eds.), Why people don’t trust government, pp. 1-18.
Cambridge, MA: Harvard University Press.
Oritsejafor, E. & Guseh, J.S. (2004). Civic Education Among College Students: A Case
Study. Journal of College and Character, Vol. 2.
Pasek, J., Kensi, K., Romer, D. & Jamieson, K.H. (2006). America‘s youth and community
engagement: How use of mass media is related to civic activity & political
awareness. Communication Research, 33, 115-135.
Petrocelli, J. V. (2003). Hierarchical multiple regression in counseling research: Common
problems and possible remedies. Measurement and Evaluation in Counseling and
Development, 36, 9-22.
Putnam, R. D. (1995b). Tuning in, tuning out: The strange disappearance of social capital in
America. PS: Political Science and Politics, 28, 664-83.
Putnam, R. D. (2000). Bowling Alone. New York: Simon & Schuster.
Putnam, R. D. (2003). Better Together: Restoring the American Community. New York: Simon
& Schuster.
Rock, A. & Garavan, T. (2006). Reconeptualizing developmental relationships. Human
Resource Development Review, 5(3), 330-354.
Scheufele, D.A., & Shah, D.V. (2000). Personality strength and social capital. Communication
Research, 27, 107-131.
Schneider, J.A. (2007). Connections and Disconnections between Civic Engagement and Social
Capital in Community-based Non-profits. Nonprofit and Volunteer Sector Quarterly
36: 572-596.
128
Sekou, B. (2008). Closing the Gap: Race, Associational Involvement, and Participation in
American Politics. University of Hartford The New England Journal of Political Science.
Senge, P. (2001). Social network analysis: A handbook. Thousand Oaks, CA: Sage.
Shah, D. V., McLeod, J. M., & Yoon, S. (2001). Communication, context, and community: An
exploration of print, broadcast and Internet influences. Communication Research, 28 (4),
464-506.
Smidt, C. (1999). Religion and civic engagement: A comparative analysis. Annals of the
American Academy of Political and Social Science, 565, 176-192.
Smith, A., Schlozman, K., Verba, S., & Brady, H. (2009). The Internet and Civic Engagement.
Retrieved from online May 5, 2010.
http://www.pewinternet.org/Reports/2009/15-The-Internet-and-Civic-Engagement.aspx.
Social Capital Benchmark Survey (2006). Retrieved from online at
http://www.cfsv.org/communitysurvey/results_pr.html
Solt, F. (2008). Economic inequality and democratic political engagement. American Journal of
Political Science, 52, 1, 48-60.
Soule, S. (2001). Will they engage? Political knowledge, participation and
attitudes of generations X and Y. Retrieved December 7, 2008 from the
World Wide Web: http://www.civiced.org/research_engage.pdf
Stolle, D., Hooghe, M. & Micheletti E. M. (2005). Politics in the supermarket: Political
consumerism as a form of political participation international political science review, 26,
3, 245-269.
Stolle, D. & Howard, M. (2008). Symposium on Civic Engagement and Civic Attitudes in Cross-
National Perspective", Political Studies, March 2008 - Vol. 56, No. 1
Swanson, R. A. & Holton, E. F. (2001). Foundations of human resource development. San
Francisco: Berrett-Koehler.
Timpone, R. J. (1998). Structure, behavior, and voter turnout in the United States. American
Political Science Review, 92, (1), 145-159.
US Census Bureau (2005). Retrieved on May 9, 2010 at
http://www.census.gov/newsroom/releases/archives/voting/cb05-73.html
US Census Bureau (2010). American Community Survey Retrieved on May 9, 2010 at
http://factfinder.census.gov/servlet/ADPTable?_bm=y&-geo_id=01000US&-
qr_name=ACS_2009_1YR_G00_DP5&-ds_name=&-_lang=en&-redoLog=false&-
format=.
129
Uslaner, E.M. (2001). Producing and consuming trust. Political Science Quarterly, Vol. 115,
No. 4, pp. 569-590.
Uslaner, E.M. & Conley, R.S. (2003). Civic engagement and particularized trust: The ties that
bind people to their ethnic communities. American Politics Research, 31, pp. 331-360.
Veenstra, G. (2002). Explicating Social Capital: Trust and participation in the civil space.
Canadian Journal of Sociology, 27 (4), pp. 547-572.
Verba, S. & Nie, N. (1972). Participation in America: Political democracy and social equality.
New York: Harper & Row.
Verba, S., Schlozman, K.L. & Brady, H.E. (1995). Voice of Equality: Civic volunteerism in
American Politics. Cambridge, MA: Harvard University Press.
Xu, Q., Perkins, D., Chow, J. (2010). Sense of Community, Neighboring, and Social Capital as
Predictors of Local Political Participation in China. American Journal of Community
Psychology, 45, pp. 259-271.
130
VITA
James Gilmore, Jr., is a native of Baton Rouge, Louisiana. He earned a Bachelor of Arts
degree in political science from Southern University. After Southern University, James attended
Louisiana State University and earned a master's in public administration. In 2005, James was
selected as a Fannie Mae Fellow and attended Harvard University's John F. Kennedy Senior
Executives in State and Local Government Program to expand his knowledge in the area of
community leadership and development. While working on his Doctor of Philosophy studies,
James co-authored and published two peer reviewed journal articles entitled Environmental
Leadership Development: A Framework for Designing and Evaluating a Training Program
which was published in the European Journal of Social Sciences and Developing Social
Entrepreneurs for Developing Pan-African Nations which was published in the Business
Renaissance Quarterly.
Upon completion of his masters degree, James was hired by United States Gypsum
Corporation as a Human Resources Supervisor and was later promoted to Human Resources
Manager. In both positions, James managed recruiting and hiring, workforce training and
development, safety, and employee relations.
In 2003, James joined Governor Kathleen Babineaux Blanco‘s administration as a Policy
Advisor on Social Services, Housing, and Community Development. His job activities included
researching, analyzing, and advising in the areas of temporary assistance to needy families,
childcare, foster care, affordable housing, and strategies to reducing poverty.
In 2006, James was appointed Vice-President of the Louisiana Housing Finance Agency.
While there, James assisted the Agency's President in formulating and implementing single-
family and multifamily housing policies and programs to help Louisiana increase its supply of

131
safe, decent and affordable housing. He was also responsible for providing workforce leadership
and training, assisted with the direction of the Agency's financial, administrative and business
affairs, managing its $12 million operating budget, $2 billion combined Mortgage Revenue Bond
portfolio, including Community Development Block Grant, HOME funds and Housing Trust
Fund.
James is the President of The Bayard Research Group, a government relations, public
policy, and strategic planning firm based in Slidell, Louisiana. The firm specializes in
coordinating local, state, and federal campaigns, writing and advocating public policy, and
strategic planning and organizational development.


![Explaining and Predicting Abnormal Expenses at Large Scale ... · In most of data mining [6] and machine learning [7] applications, patterns are learnt from data for detecting anomalies](https://img.pdfslide.net/doc/110x75/5ec629d0ae2d043997041518/explaining-and-predicting-abnormal-expenses-at-large-scale-in-most-of-data-mining.jpg)


![[Credit] scoring : predicting, understanding and ... · [CREDIT] SCORING: PREDICTING, UNDERSTANDING AND EXPLAINING CONSUMER BEHAVIOUR By ROBERT HAMILTON ABSTRACT Th1s thesis stems](https://img.pdfslide.net/doc/110x75/5c6a4bd809d3f20f298c6297/credit-scoring-predicting-understanding-and-credit-scoring-predicting.jpg)