Embed Size (px)
Citation preview

Explaining Extreme Events of 2019 from a Climate Perspective
Explaining Extreme Events of 2019 from a Climate Perspective
Special Supplement to theBulletin of the American Meteorological Society
Vol. 102, No. 1, January 2021
Special Supplement to theBulletin of the American Meteorological Society
Vol. 102, No. 1, January 2021Unauthenticated | Downloaded 04/06/22 10:57 AM UTC
EXPLAINING EXTREME EVENTS OF 2019 FROM A CLIMATE PERSPECTIVE
Editors
Stephanie C. Herring, Nikolaos Christidis, Andrew Hoell, Martin P. Hoerling, and Peter A. Stott
BAMS Special Editors for Climate
Andrew King, Thomas Knutson, John Nielsen-Gammon, and Friederike Otto
Special Supplement to the
Bulletin of the American Meteorological Society
Vol. 102, No. 1, January 2021
American Meteorological Society
Unauthenticated | Downloaded 04/06/22 10:57 AM UTC
Sii JANUARY 2021|
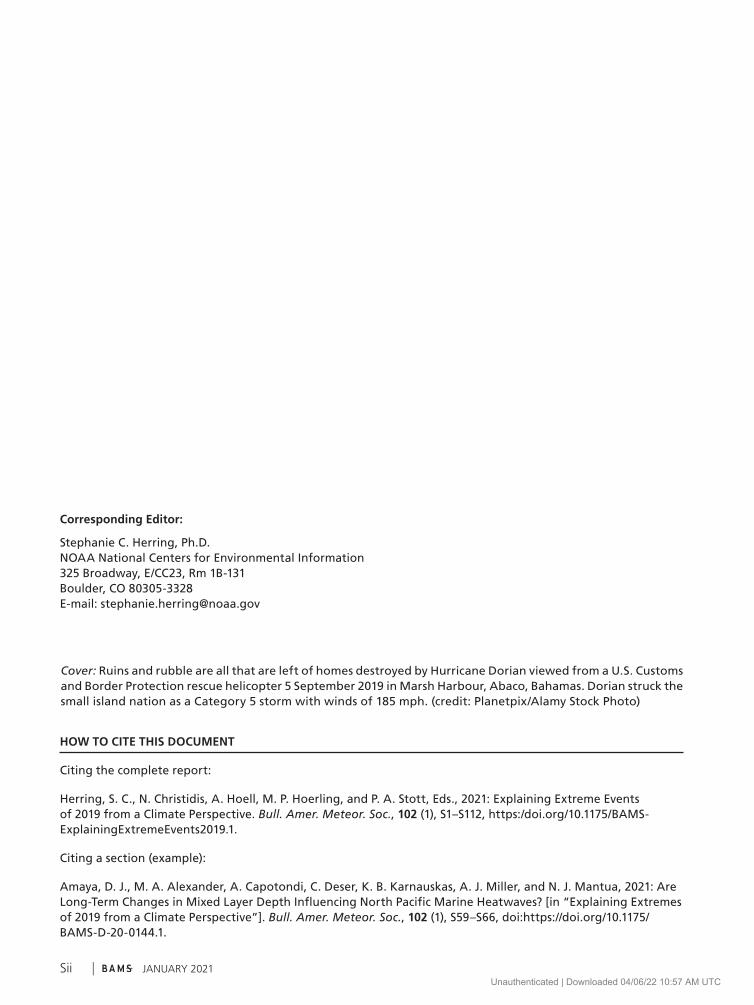
HOW TO CITE THIS DOCUMENT
Citing the complete report:
Herring, S. C., N. Christidis, A. Hoell, M. P. Hoerling, and P. A. Stott, Eds., 2021: Explaining Extreme Events of 2019 from a Climate Perspective. Bull. Amer. Meteor. Soc., 102 (1), S1–S112, https:/doi.org/10.1175/BAMS-ExplainingExtremeEvents2019.1.
Citing a section (example):
Amaya, D. J., M. A. Alexander, A. Capotondi, C. Deser, K. B. Karnauskas, A. J. Miller, and N. J. Mantua, 2021: Are Long-Term Changes in Mixed Layer Depth Influencing North Pacific Marine Heatwaves? [in “Explaining Extremes of 2019 from a Climate Perspective”]. Bull. Amer. Meteor. Soc., 102 (1), S59–S66, doi:https://doi.org/10.1175/BAMS-D-20-0144.1.
Cover: Ruins and rubble are all that are left of homes destroyed by Hurricane Dorian viewed from a U.S. Customs and Border Protection rescue helicopter 5 September 2019 in Marsh Harbour, Abaco, Bahamas. Dorian struck the small island nation as a Category 5 storm with winds of 185 mph. (credit: Planetpix/Alamy Stock Photo)
Corresponding Editor:
Stephanie C. Herring, Ph.D.NOAA National Centers for Environmental Information325 Broadway, E/CC23, Rm 1B-131Boulder, CO 80305-3328E-mail: [email protected]
Unauthenticated | Downloaded 04/06/22 10:57 AM UTC
SiiiJANUARY 2021AMERICAN METEOROLOGICAL SOCIETY |
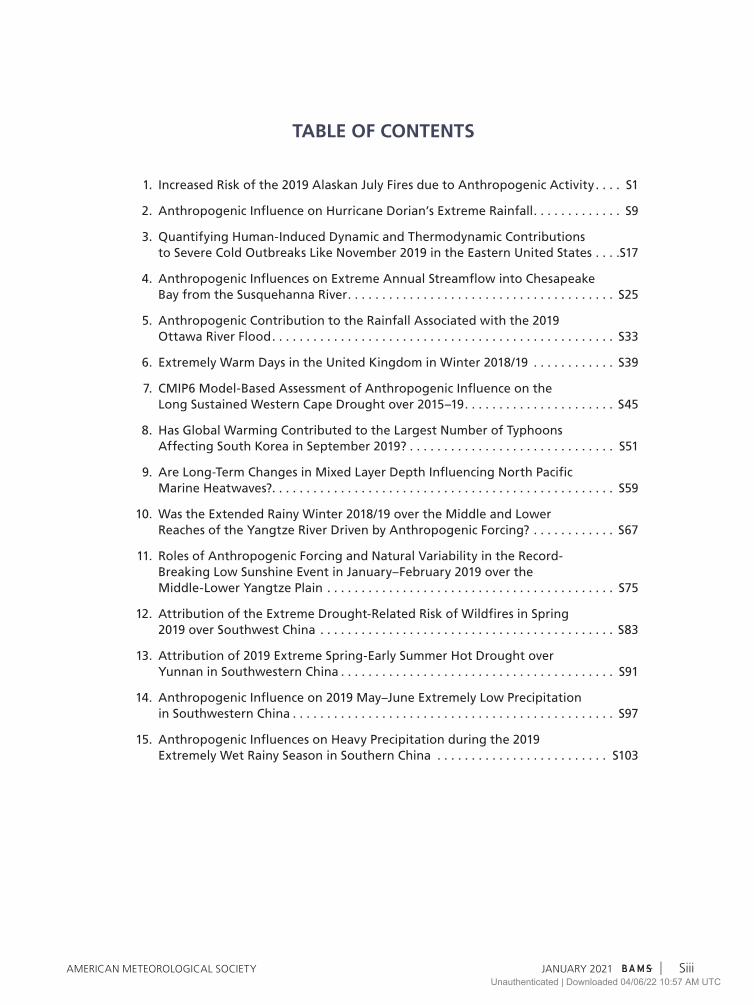
1. Increased Risk of the 2019 Alaskan July Fires due to Anthropogenic Activity . . . . S1
2. Anthropogenic Influence on Hurricane Dorian’s Extreme Rainfall . . . . . . . . . . . . . S9
3. Quantifying Human-Induced Dynamic and Thermodynamic Contributions to Severe Cold Outbreaks Like November 2019 in the Eastern United States . . . .S17
4. Anthropogenic Influences on Extreme Annual Streamflow into Chesapeake Bay from the Susquehanna River . . . . . . . . . . . . . . . . . . . . . . . . . . . . . . . . . . . . . . . S25
5. Anthropogenic Contribution to the Rainfall Associated with the 2019 Ottawa River Flood . . . . . . . . . . . . . . . . . . . . . . . . . . . . . . . . . . . . . . . . . . . . . . . . . . S33
6. Extremely Warm Days in the United Kingdom in Winter 2018/19 . . . . . . . . . . . . S39
7. CMIP6 Model-Based Assessment of Anthropogenic Influence on the Long Sustained Western Cape Drought over 2015–19 . . . . . . . . . . . . . . . . . . . . . . S45
8. Has Global Warming Contributed to the Largest Number of Typhoons Affecting South Korea in September 2019? . . . . . . . . . . . . . . . . . . . . . . . . . . . . . . S51
9. Are Long-Term Changes in Mixed Layer Depth Influencing North Pacific Marine Heatwaves? . . . . . . . . . . . . . . . . . . . . . . . . . . . . . . . . . . . . . . . . . . . . . . . . . . S59
10. Was the Extended Rainy Winter 2018/19 over the Middle and Lower Reaches of the Yangtze River Driven by Anthropogenic Forcing? . . . . . . . . . . . . S67
11. Roles of Anthropogenic Forcing and Natural Variability in the Record- Breaking Low Sunshine Event in January–February 2019 over the Middle-Lower Yangtze Plain . . . . . . . . . . . . . . . . . . . . . . . . . . . . . . . . . . . . . . . . . . S75
12. Attribution of the Extreme Drought-Related Risk of Wildfires in Spring 2019 over Southwest China . . . . . . . . . . . . . . . . . . . . . . . . . . . . . . . . . . . . . . . . . . . S83
13. Attribution of 2019 Extreme Spring-Early Summer Hot Drought over Yunnan in Southwestern China . . . . . . . . . . . . . . . . . . . . . . . . . . . . . . . . . . . . . . . . S91
14. Anthropogenic Influence on 2019 May–June Extremely Low Precipitation in Southwestern China . . . . . . . . . . . . . . . . . . . . . . . . . . . . . . . . . . . . . . . . . . . . . . . S97
15. Anthropogenic Influences on Heavy Precipitation during the 2019 Extremely Wet Rainy Season in Southern China . . . . . . . . . . . . . . . . . . . . . . . . . S103
TABLE OF CONTENTS
Unauthenticated | Downloaded 04/06/22 10:57 AM UTC

Siv JANUARY 2021|Unauthenticated | Downloaded 04/06/22 10:57 AM UTC
S33JANUARY 2021AMERICAN METEOROLOGICAL SOCIETY |
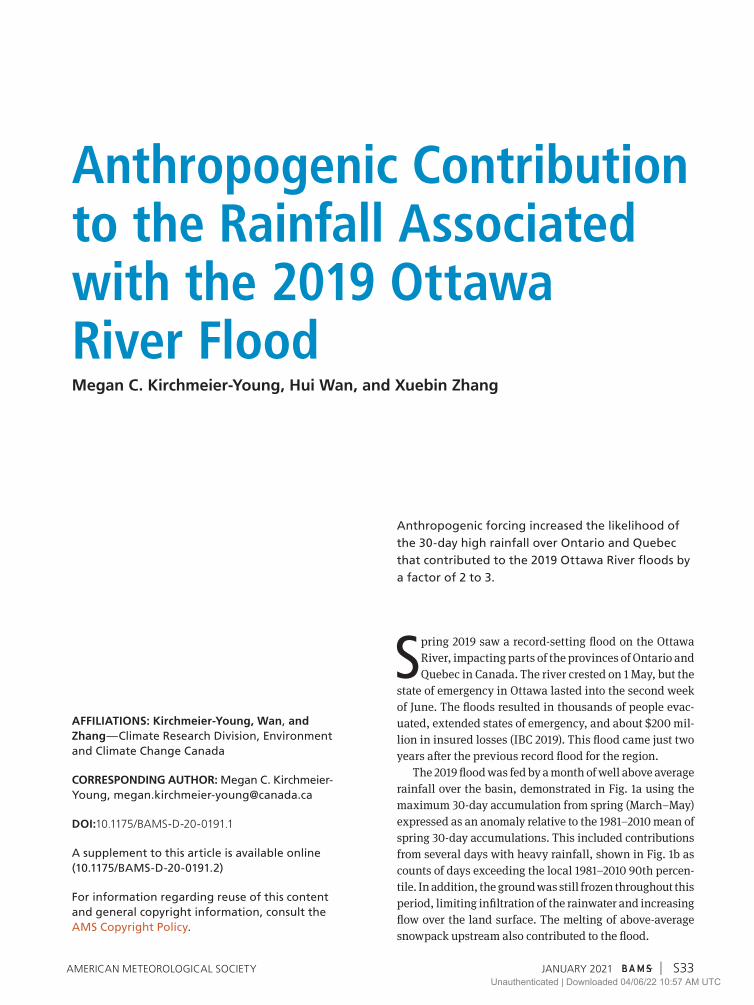
Anthropogenic Contribution to the Rainfall Associated with the 2019 Ottawa River Flood
AFFILIATIONS: Kirchmeier-Young, Wan, and Zhang—Climate Research Division, Environment and Climate Change Canada
CORRESPONDING AUTHOR: Megan C. Kirchmeier- Young, [email protected]
DOI:10.1175/BAMS-D-20-0191.1
A supplement to this article is available online (10.1175/BAMS-D-20-0191.2)
For information regarding reuse of this content and general copyright information, consult the AMS Copyright Policy.
Megan C. Kirchmeier-Young, Hui Wan, and Xuebin Zhang
Anthropogenic forcing increased the likelihood of the 30-day high rainfall over Ontario and Quebec that contributed to the 2019 Ottawa River floods by a factor of 2 to 3.
Spring 2019 saw a record-setting flood on the Ottawa River, impacting parts of the provinces of Ontario and Quebec in Canada. The river crested on 1 May, but the
state of emergency in Ottawa lasted into the second week of June. The floods resulted in thousands of people evac-uated, extended states of emergency, and about $200 mil-lion in insured losses (IBC 2019). This flood came just two years after the previous record flood for the region.
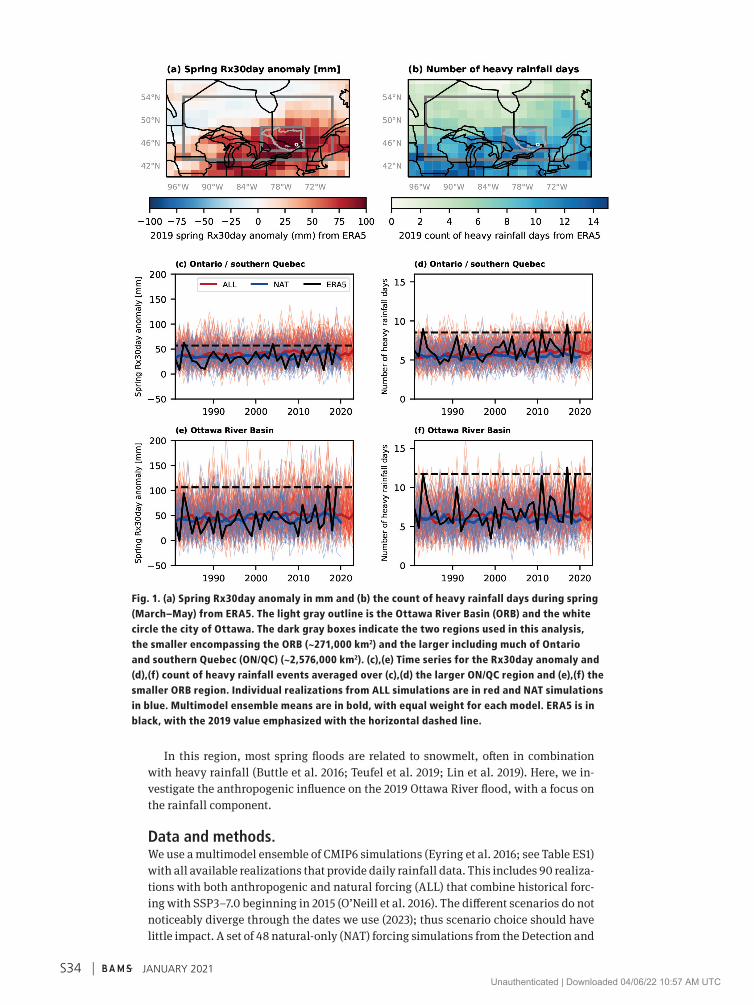
The 2019 flood was fed by a month of well above average rainfall over the basin, demonstrated in Fig. 1a using the maximum 30-day accumulation from spring (March–May) expressed as an anomaly relative to the 1981–2010 mean of spring 30-day accumulations. This included contributions from several days with heavy rainfall, shown in Fig. 1b as counts of days exceeding the local 1981–2010 90th percen-tile. In addition, the ground was still frozen throughout this period, limiting infiltration of the rainwater and increasing flow over the land surface. The melting of above-average snowpack upstream also contributed to the flood.
Unauthenticated | Downloaded 04/06/22 10:57 AM UTC
S34 JANUARY 2021|
Fig. 1. (a) Spring Rx30day anomaly in mm and (b) the count of heavy rainfall days during spring (March–May) from ERA5. The light gray outline is the Ottawa River Basin (ORB) and the white circle the city of Ottawa. The dark gray boxes indicate the two regions used in this analysis, the smaller encompassing the ORB (~271,000 km2) and the larger including much of Ontario and southern Quebec (ON/QC) (~2,576,000 km2). (c),(e) Time series for the Rx30day anomaly and (d),(f) count of heavy rainfall events averaged over (c),(d) the larger ON/QC region and (e),(f) the smaller ORB region. Individual realizations from ALL simulations are in red and NAT simulations in blue. Multimodel ensemble means are in bold, with equal weight for each model. ERA5 is in black, with the 2019 value emphasized with the horizontal dashed line.
In this region, most spring floods are related to snowmelt, often in combination with heavy rainfall (Buttle et al. 2016; Teufel et al. 2019; Lin et al. 2019). Here, we in-vestigate the anthropogenic influence on the 2019 Ottawa River flood, with a focus on the rainfall component.
Data and methods.We use a multimodel ensemble of CMIP6 simulations (Eyring et al. 2016; see Table ES1) with all available realizations that provide daily rainfall data. This includes 90 realiza-tions with both anthropogenic and natural forcing (ALL) that combine historical forc-ing with SSP3–7.0 beginning in 2015 (O’Neill et al. 2016). The different scenarios do not noticeably diverge through the dates we use (2023); thus scenario choice should have little impact. A set of 48 natural-only (NAT) forcing simulations from the Detection and
Unauthenticated | Downloaded 04/06/22 10:57 AM UTC
S35JANUARY 2021AMERICAN METEOROLOGICAL SOCIETY |
Attribution Model Intercomparison Project (DAMIP; Gillett et al. 2016) will represent the reference, or counterfactual world, for the attribution. The ERA5 reanalysis (C3S 2017) serves as a representation of the observations. ERA5 improves the biases of its predecessor, ERA-Interim, and in terms of driving a hydrologic model is as skillful as using observations in most regions of North America (Tarek et al. 2020). The ranges of the trend and variability of monthly precipitation over 1981–2019 from the CMIP6 models both include the values from ERA5. There is not sufficient station density in this region to estimate a regional average that is comparable to the models, but the timing of the 2019 spring maximum 30-day rainfall from ERA5 is similar to that from two stations in Ottawa, Ontario (see Fig. ES1 in the online supplemental material).
The Ottawa River system contains several reservoirs, particularly in the northern tributaries. The reservoirs are typically emptied prior to the spring freshet for flood prevention and receive contributions from snowmelt from almost half of the basin. Because of this regulation capacity, major flood events are usually caused by a long period of heavy rainfall over a few weeks, in combination with the snowmelt. As such, the spring maximum 30-day rainfall accumulation (Rx30day) was calculated for each year to represent rainfall contributing to a spring flood. Similarly, monthly precipita-tion was used in an event attribution study for a previous flood in this basin (Teufel et al. 2019). Rainfall accumulations were determined by summing precipitation from days with a mean temperature greater than 0°C, which should capture the distinction between rain and snow in most cases. Model anomalies were remapped to a common 1.5° grid. After calculating regional averages, the maximum 30-day period was cho-sen. Additional data processing details are described in the supplemental material. Regional averages were determined for a rectangle enclosing the Ottawa River Basin (ORB), which is where the flood occurred. Changes in extreme precipitation are often small compared to natural variability, especially at small scales. Since variability is smaller over a larger region, we also use an area covering the majority of Ontario and southern Quebec (Fig. 1). For attribution, the event threshold was the standardized (by subtracting the mean and dividing by the standard deviation; see supplemental material) 2019 spring Rx30day from ERA5. NAT anomalies and standardization were computed relative to ALL simulations of the same model.
To account for the role of heavy rainfall, we also calculated the number of heavy rainfall days during spring each year. Heavy rainfall days were defined for each grid box as those exceeding the 90th percentile from spring days over 1981–2010 and us-ing the method of Zhang et al. (2005). Exceedance counts were determined on each model’s native grid and then remapped to the common grid before the calculation of regional averages. NAT exceedances used the 90th percentile from an ALL simulation by the same model. For attribution, we used event thresholds from 7 to 12 days.
For event attribution, we use the standard risk (probability) ratio (PR) framework (e.g., NASEM 2016) to compare the ratio of the probability of occurrence between ALL and NAT forcing simulations. To calculate probabilities by counting exceedances, ALL data were pooled from ensemble members for 2014–23, a 10-yr period centered on the 2019 event, and NAT from 1996–2020. The NAT simulations end in 2020 and, given the general stationarity, a longer period can provide more robust estimates of smaller probabilities. The 5th to 95th percentile range was determined by randomly resam-pling both ALL and NAT independently.
Results.Maps of the 2019 spring Rx30day anomaly and the number of heavy rainfall days from the ERA5 reanalysis are shown in Figs. 1a and 1b, respectively. There is a large area of positive rainfall anomalies over the ORB, southeastern Ontario, and the Great Lakes region. This area coincides with some high counts of heavy rainfall days.
For the spring Rx30day anomalies using ERA5, the 2019 anomaly is one of the larg-est in the record (Figs. 1c,e). The 2017 value is only slightly larger and was associated
Unauthenticated | Downloaded 04/06/22 10:57 AM UTC
S36 JANUARY 2021|
with another high-impact spring flood. A slight positive trend is apparent in the re-analysis data between 1981 and 2019. In the CMIP6 ensemble, ALL anomalies are gen-erally more positive than NAT anomalies, indicating higher rainfall with ALL forcing. The ensemble mean is calculated giving equal weight to each model, but only minor differences were noted if equal weight is instead given to each realization. The ensem-ble spread covers a wide range of anomalies.
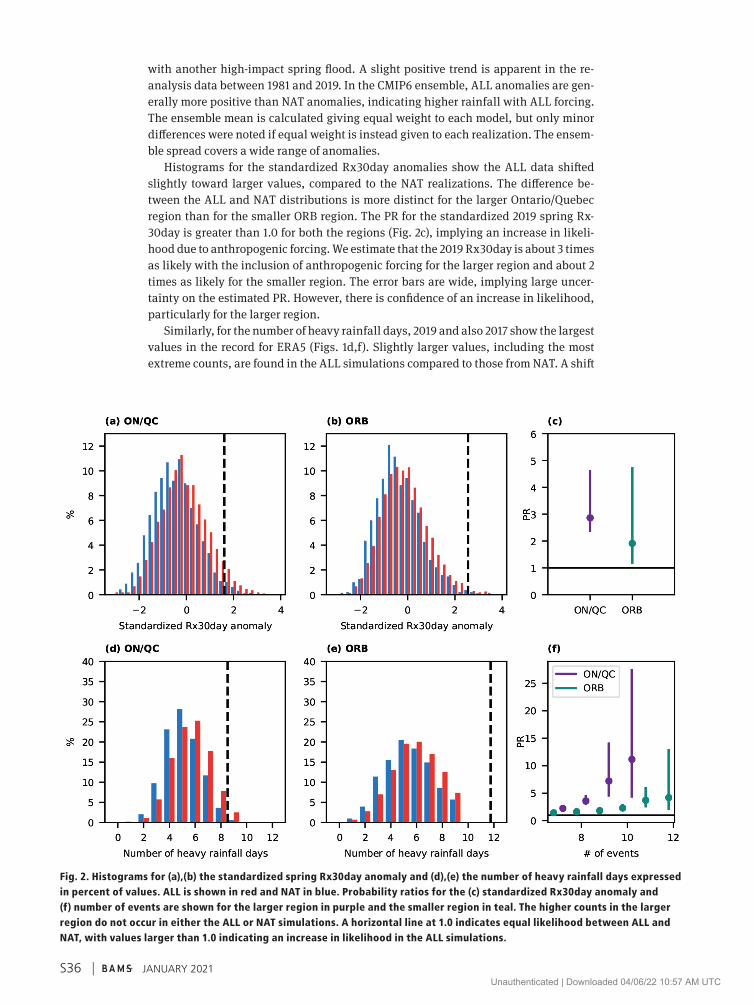
Histograms for the standardized Rx30day anomalies show the ALL data shifted slightly toward larger values, compared to the NAT realizations. The difference be-tween the ALL and NAT distributions is more distinct for the larger Ontario/Quebec region than for the smaller ORB region. The PR for the standardized 2019 spring Rx-30day is greater than 1.0 for both the regions (Fig. 2c), implying an increase in likeli-hood due to anthropogenic forcing. We estimate that the 2019 Rx30day is about 3 times as likely with the inclusion of anthropogenic forcing for the larger region and about 2 times as likely for the smaller region. The error bars are wide, implying large uncer-tainty on the estimated PR. However, there is confidence of an increase in likelihood, particularly for the larger region.
Similarly, for the number of heavy rainfall days, 2019 and also 2017 show the largest values in the record for ERA5 (Figs. 1d,f). Slightly larger values, including the most extreme counts, are found in the ALL simulations compared to those from NAT. A shift
Fig. 2. Histograms for (a),(b) the standardized spring Rx30day anomaly and (d),(e) the number of heavy rainfall days expressed in percent of values. ALL is shown in red and NAT in blue. Probability ratios for the (c) standardized Rx30day anomaly and (f) number of events are shown for the larger region in purple and the smaller region in teal. The higher counts in the larger region do not occur in either the ALL or NAT simulations. A horizontal line at 1.0 indicates equal likelihood between ALL and NAT, with values larger than 1.0 indicating an increase in likelihood in the ALL simulations.
Unauthenticated | Downloaded 04/06/22 10:57 AM UTC
S37JANUARY 2021AMERICAN METEOROLOGICAL SOCIETY |
toward higher counts of heavy rainfall days under ALL is also demonstrated through the histograms in Figs. 2d and 2e. PRs for the number of days are only slightly larger than 1.0 for the smaller count thresholds (Fig. 2f). Larger PRs but also larger uncertain-ties are found with most of the higher count thresholds. Overall, we find that anthro-pogenic forcing resulted in an increase in the likelihood of a higher number of heavy rainfall days.
Conclusions.An increased likelihood of flood-producing rainfall has been identified for other events in Canada and the neighboring regions of the United States (Teufel et al. 2019, 2017; Szeto et al. 2015; Winter et al. 2020). Our results are in agreement with those of Teufel et al. (2019), who performed an assessment of the 2017 Ottawa River floods. Us-ing a different set of model simulations at a much higher resolution, they found a small increase in likelihood for the flood-producing monthly rainfall. However, they did not identify an attributable change in surface runoff and it was suggested that a warm-ing-induced decrease in spring snowpack could offset the increased precipitation.
Event attribution PRs depend on the event definition, including the specific loca-tion and spatial and temporal scales used. For our analysis of flood-inducing precipi-tation, different regions, in size and/or location, different event thresholds, a different spring time period, or a different set of models in the ensemble may change the attribu-tion results. Exact PR values will likely depend on the specific choices, but we expect the finding of a small increase in likelihood to be consistent across slight changes in framing. This is confirmed in Fig. ES2, where the PRs change only slightly if an Rx-20day metric or a 15-year ALL period is used instead. Even with making different meth-odological choices, we reach the same general conclusion as Teufel et al. (2019) for the 2017 flood. Additionally, Kirchmeier-Young et al. (2019) demonstrated consistent changes in likelihood between Rx1day and Rx30day in this region. Finally, increases in extreme precipitation are consistent with a warming atmosphere.
Flood events are complex and often the result of the interaction of many variables, including rainfall, snowpack, and characteristics of the land surface. While increases in the likelihood of large positive precipitation anomalies are increasingly identified and attributed to anthropogenic climate change, the interaction of rainfall with other variables to produce a high-impact flood in a warming climate remains uncertain.
Acknowledgments. We thank the editors, three anonymous reviewers, and Nathan Gillett for their helpful comments on this manuscript and Megan Hartwell for providing the station data. We also thank the numerous modelling centers for their contributions to CMIP6 and Copernicus Climate Change Service for providing the ERA5 data.
References
Buttle, J. M., and Coauthors, 2016: Flood processes in Canada: Regional and special aspects. Can. Water Resour. J., 41, 7–30, https://doi.org/10.1080/07011784.2015.1131629.
C3S, 2017: ERA5: Fifth generation of ECMWF atmospheric reanalyses of the global climate. Copernicus Climate Change Service (C3S) Climate Data Store (CDS), accessed 19 February 2020, https://cds.climate.copernicus.eu/#!/search?text=ERA5&type=dataset.
Eyring, V., and Coauthors, 2016: Overview of the Coupled Model In-tercomparison Project Phase 6 (CMIP6) experimental design and organization. Geosci. Model Dev., 9, 1937–1958, https://doi.org/10.5194/gmd-9-1937-2016.
Gillett, N. P., and Coauthors, 2016: The Detection and Attribution Mod-el Intercomparison Project (DAMIP v1.0) contribution to CMIP6. Geosci. Model Dev., 9, 3685–3697, https://doi.org/10.5194/gmd-9-3685-2016.
IBC, 2019: Eastern Canada spring flooding caused close to $208 million in Insured Damage. Insurance Bureau of Canada, accessed 2020, http://www.ibc.ca/on/resources/media-centre/media-releases/eastern-can-ada-spring-flooding-caused-close-to-208-million-in-insured-damage.
Kirchmeier‐Young, M. C., H. Wan, X. Zhang, and S. I. Seneviratne, 2019: Importance of framing for extreme event attribution: The role of spatial and temporal scales. Earth’s Future, 7, 1192–1204, https://doi.org/10.1029/2019EF001253.
Unauthenticated | Downloaded 04/06/22 10:57 AM UTC
S38 JANUARY 2021|
Lin, H., R. Mo, F. Vitart, and C. Stan, 2019: Eastern Canada flooding 2017 and its subseasonal predictions. Atmos.–Ocean, 57, 195–207, https://doi.org/10.1080/07055900.2018.1547679.
NASEM, 2016: Attribution of Extreme Weather Events in the Context of Climate Change. The National Academies Press, 186 pp., https://doi.org/10.17226/21852.
O’Neill, B. C., and Coauthors, 2016: The Scenario Model Intercomparison Project (ScenarioMIP) for CMIP6. Geosci. Model Dev., 9, 3461–3482, https://doi.org/10.5194/gmd-9-3461-2016.
Szeto, K., J. Brimelow, P. Gysbers, and R. Stewart, 2015: The 2014 Ex-treme flood on the southeastern Canadian Prairies." [in "Ex-plaining Extreme Events of 2014 from a Climate Perspective"]. Bull. Amer. Meteor. Soc., 96, S20–S24, https://doi.org/10.1175/BAMS-D-15-00110.1.
Tarek, M., F. P. Brissette, and R. Arsenault, 2020: Evaluation of the ERA5 reanalysis as a potential reference dataset for hydrological modeling
over North America. Hydrol. Earth Syst. Sci., 24, 2527–2544, https://doi.org/10.5194/hess-24-2527-2020.
Teufel, B., and Coauthors, 2017: Investigation of the 2013 Alberta flood from weather and climate perspectives. Climate Dyn., 48, 2881–2899, https://doi.org/10.1007/s00382-016-3239-8.
—, and Coauthors, 2019: Investigation of the mechanisms leading to the 2017 Montreal flood. Climate Dyn., 52, 4193–4206, https://doi.org/10.1007/s00382-018-4375-0.
Winter, J. M., H. Huang, E. C. Osterberg, and J. S. Mankin, 2020: An-thropogenic impacts on the exceptional precipitation of 2018 in the mid-Atlantic United States [in “Explaining Extreme Events of 2018 from a Climate Perspective”]. Bull. Amer. Meteor. Soc., 101, S5–S10, https://doi.org/10.1175/BAMS-D-19-0172.1.
Zhang, X., G. Hegerl, F. W. Zwiers, and J. Kenyon, 2005: Avoiding inho-mogeneity in percentile-based indices of temperature extremes. J. Climate, 18, 1641–1651, https://doi.org/10.1175/JCLI3366.1.
Unauthenticated | Downloaded 04/06/22 10:57 AM UTC