Embed Size (px)
Citation preview
Explaining NSW long term trends in property and violent crime
Steve Moffatt and Lucy Snowball
NSW Bureau of Crime Statistics and Research
Purpose of research
• Determine the general structure of trends and seasonality
• Explain some exogenous influences on crime trends, particularly those useful for forecasting
• Forecasts for state and regions• Test scenarios
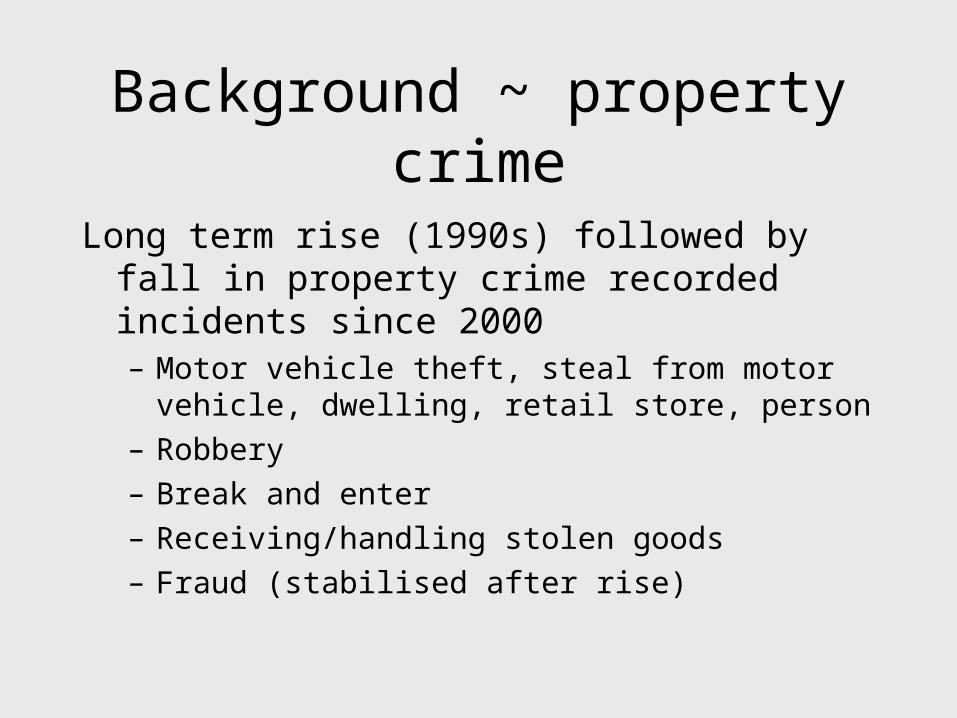
Background ~ property crime
Long term rise (1990s) followed by fall in property crime recorded incidents since 2000– Motor vehicle theft, steal from motor vehicle, dwelling,
retail store, person
– Robbery
– Break and enter
– Receiving/handling stolen goods
– Fraud (stabilised after rise)
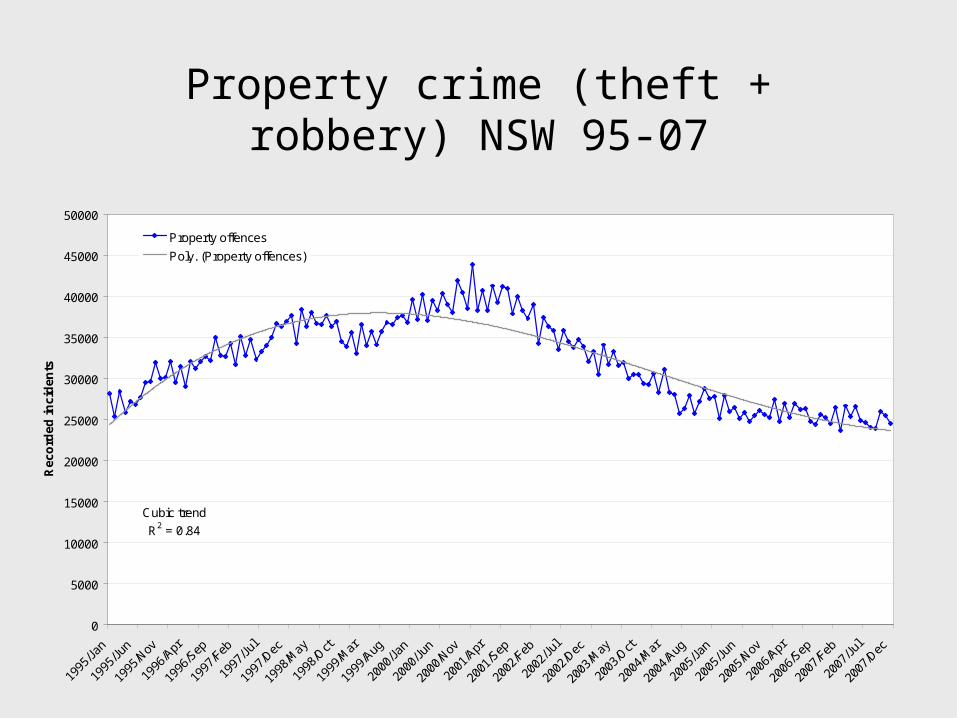
Property crime (theft + robbery) NSW 95-07
Cubic trend
R2 = 0.84
0
5000
10000
15000
20000
25000
30000
35000
40000
45000
50000
1995
/Jan
1995
/Jun
1995
/Nov
1996
/Apr
1996
/Sep
1997
/Feb
1997
/Jul
1997
/Dec
1998
/May
1998
/Oct
1999
/Mar
1999
/Aug
2000
/Jan
2000
/Jun
2000
/Nov
2001
/Apr
2001
/Sep
2002
/Feb
2002
/Jul
2002
/Dec
2003
/May
2003
/Oct
2004
/Mar
2004
/Aug
2005
/Jan
2005
/Jun
2005
/Nov
2006
/Apr
2006
/Sep
2007
/Feb
2007
/Jul
2007
/Dec
Re
cord
ed i
nci
den
ts
Property offences
Poly. (Property offences)
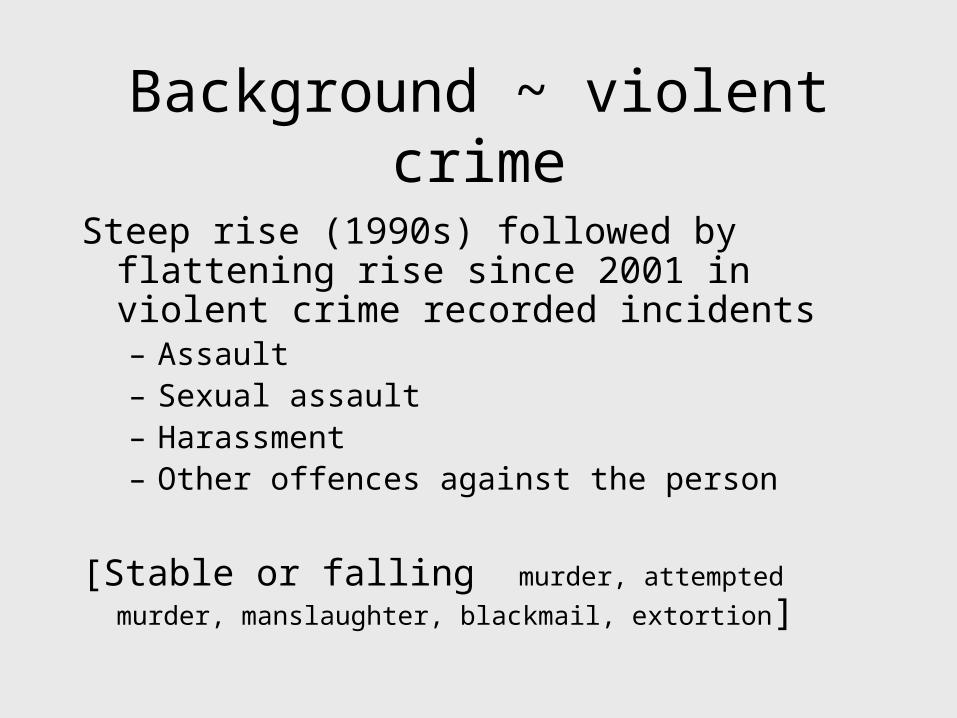
Background ~ violent crime
Steep rise (1990s) followed by flattening rise since 2001 in violent crime recorded incidents– Assault– Sexual assault– Harassment– Other offences against the person
[Stable or falling murder, attempted murder, manslaughter,
blackmail, extortion]
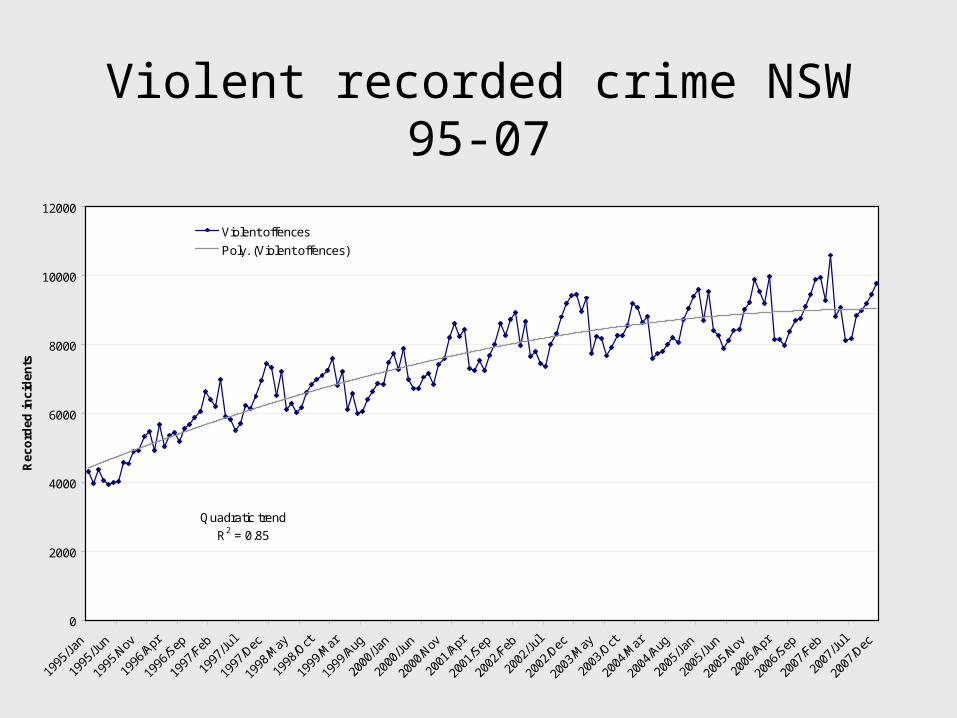
Violent recorded crime NSW 95-07
Quadratic trend
R2 = 0.85
0
2000
4000
6000
8000
10000
12000
1995
/Jan
1995
/Jun
1995
/Nov
1996
/Apr
1996
/Sep
1997
/Feb
1997
/Jul
1997
/Dec
1998
/May
1998
/Oct
1999
/Mar
1999
/Aug
2000
/Jan
2000
/Jun
2000
/Nov
2001
/Apr
2001
/Sep
2002
/Feb
2002
/Jul
2002
/Dec
2003
/May
2003
/Oct
2004
/Mar
2004
/Aug
2005
/Jan
2005
/Jun
2005
/Nov
2006
/Apr
2006
/Sep
2007
/Feb
2007
/Jul
2007
/Dec
Rec
ord
ed i
nci
den
ts
Violent offences
Poly. (Violent offences)
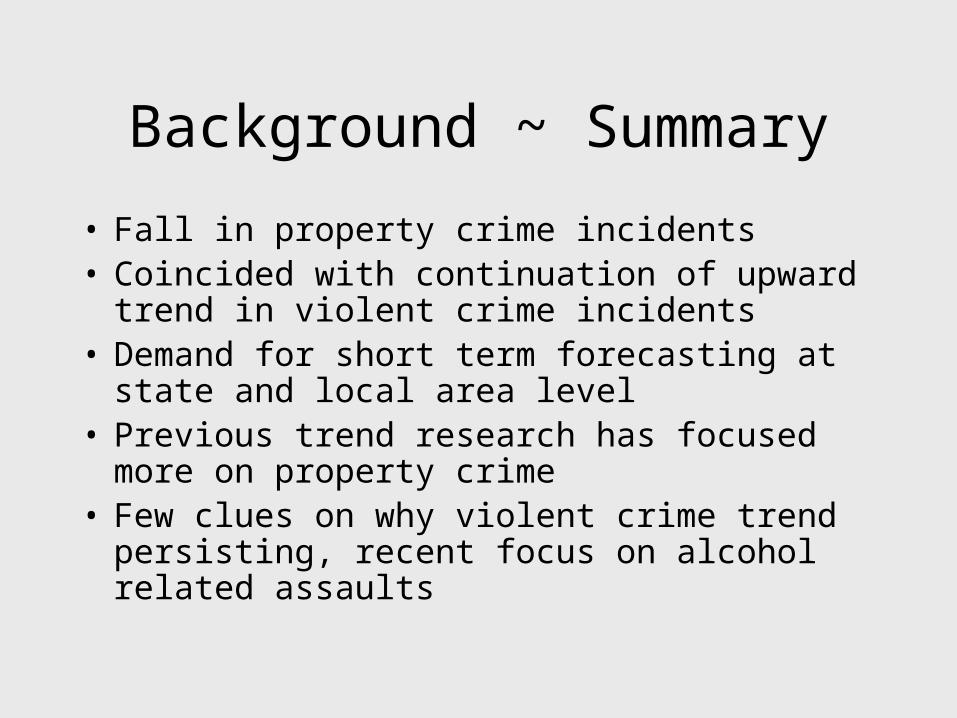
Background ~ Summary
• Fall in property crime incidents• Coincided with continuation of upward trend in
violent crime incidents• Demand for short term forecasting at state and
local area level• Previous trend research has focused more on
property crime• Few clues on why violent crime trend persisting,
recent focus on alcohol related assaults
Predictors
• Seasonality and month characteristics
• Police and Justice – Police activity, incapacitation, deterrence
• Alcohol and drug use
• Economic cycles
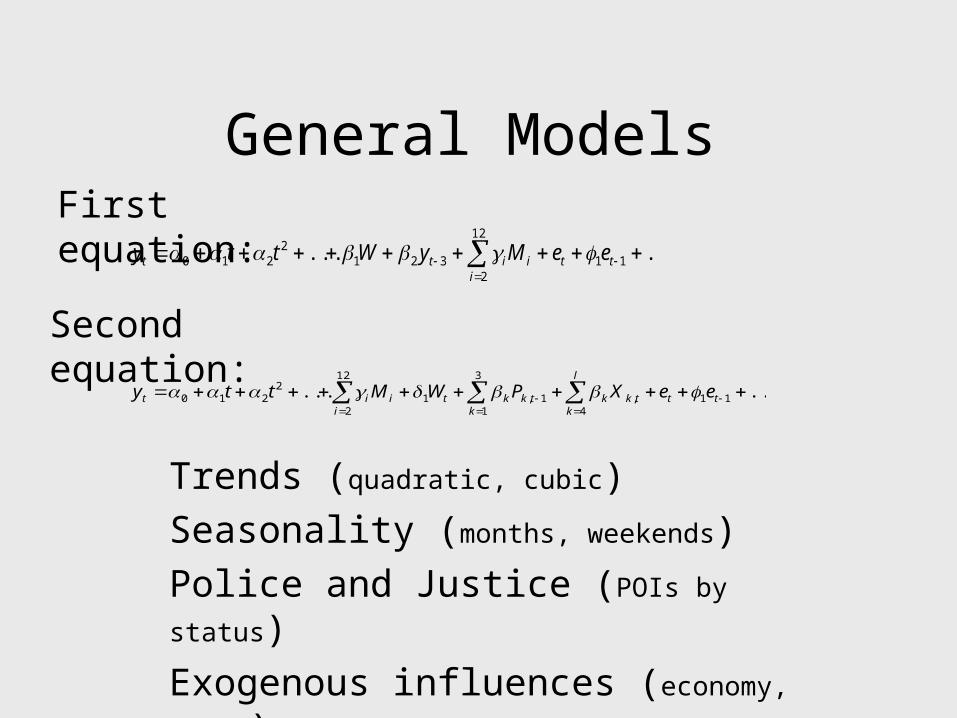
General Models
Trends (quadratic, cubic)
Seasonality (months, weekends)
Police and Justice (POIs by status)
Exogenous influences (economy, drugs)
First equation:...... 11
12
2321
2210
tt
iiitt eeMyWtty
Second equation:
...... 114
,
3
11,1
12
2
2210
tt
l
ktkk
ktkkt
iiit eeXPWMtty
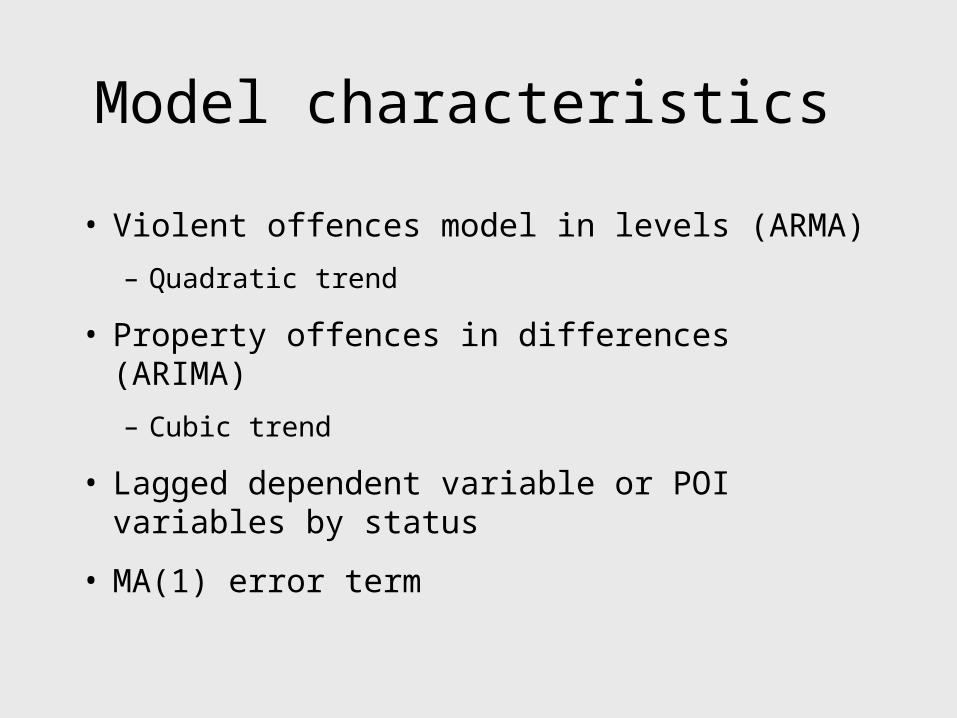
Model characteristics
• Violent offences model in levels (ARMA)
– Quadratic trend
• Property offences in differences (ARIMA)
– Cubic trend
• Lagged dependent variable or POI variables by status
• MA(1) error term
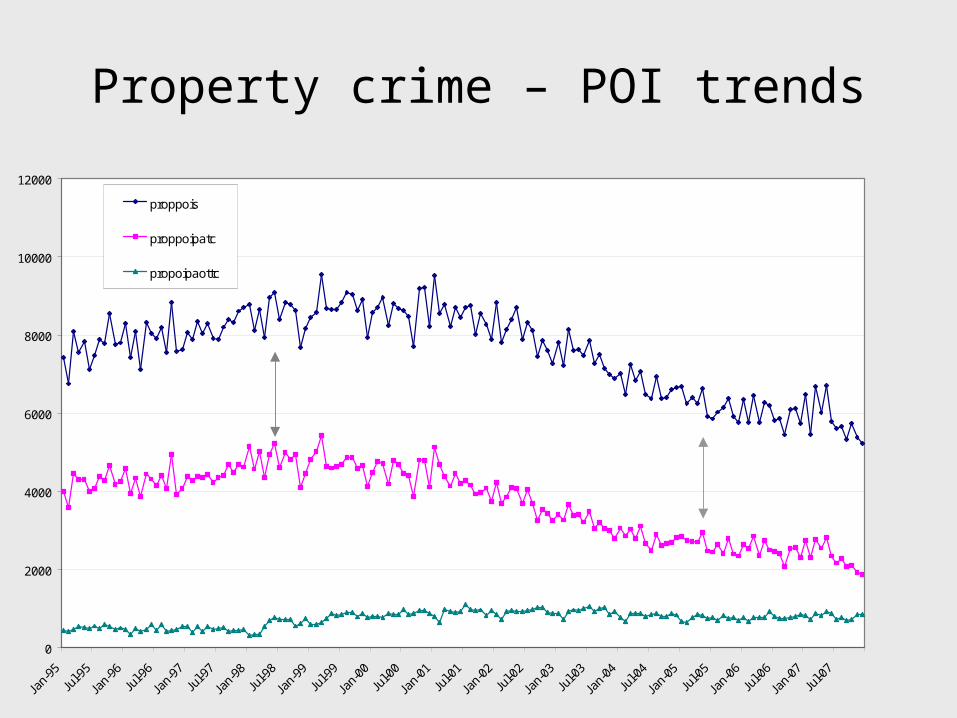
Property crime – POI trends
0
2000
4000
6000
8000
10000
12000
Jan-
95
Jul-9
5
Jan-
96
Jul-9
6
Jan-
97
Jul-9
7
Jan-
98
Jul-9
8
Jan-
99
Jul-9
9
Jan-
00
Jul-0
0
Jan-
01
Jul-0
1
Jan-
02
Jul-0
2
Jan-
03
Jul-0
3
Jan-
04
Jul-0
4
Jan-
05
Jul-0
5
Jan-
06
Jul-0
6
Jan-
07
Jul-0
7
proppois
proppoipatc
propoipaottc
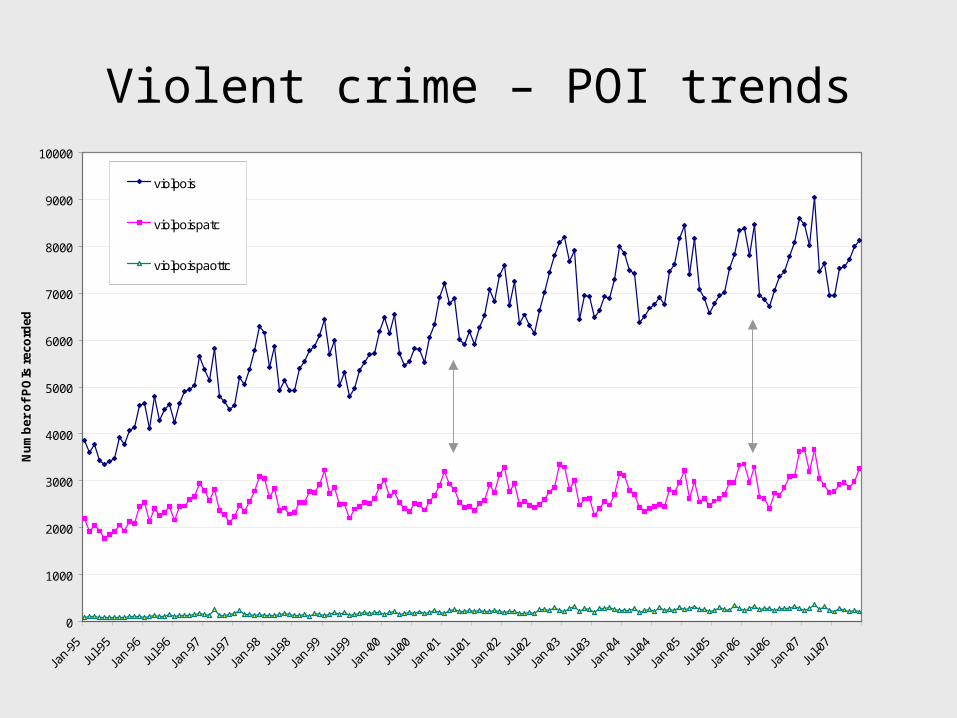
Violent crime – POI trends
0
1000
2000
3000
4000
5000
6000
7000
8000
9000
10000
Jan-
95
Jul-9
5
Jan-
96
Jul-9
6
Jan-
97
Jul-9
7
Jan-
98
Jul-9
8
Jan-
99
Jul-9
9
Jan-
00
Jul-0
0
Jan-
01
Jul-0
1
Jan-
02
Jul-0
2
Jan-
03
Jul-0
3
Jan-
04
Jul-0
4
Jan-
05
Jul-0
5
Jan-
06
Jul-0
6
Jan-
07
Jul-0
7
Nu
mb
er o
f P
OIs
rec
ord
ed
violpois
violpoispatc
violpoispaottc
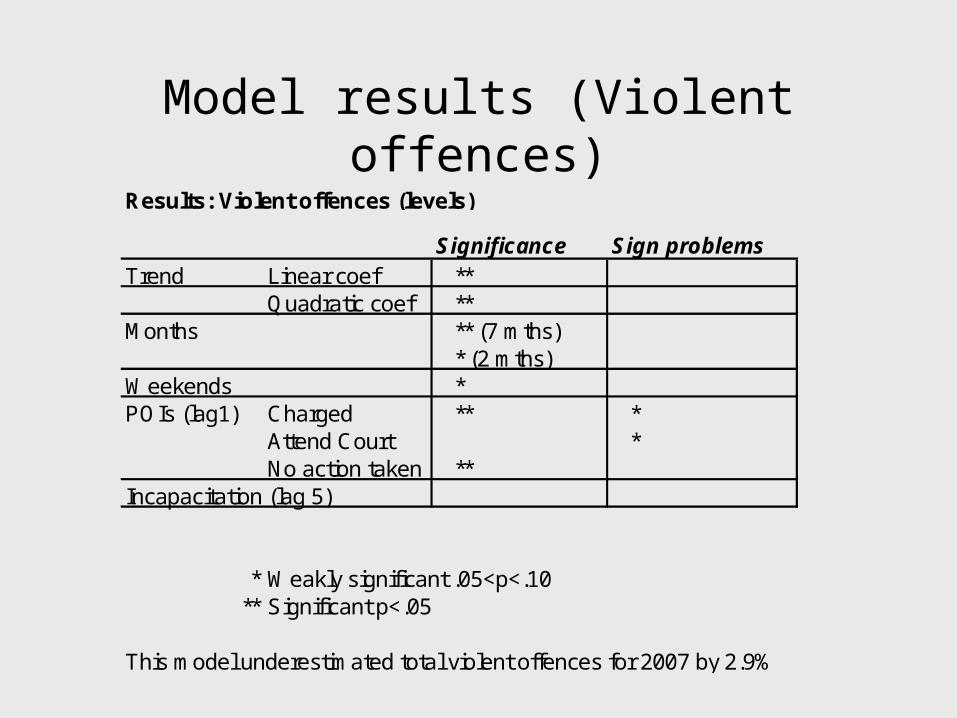
Model results (Violent offences)Results: Violent offences (levels)
Significance Sign problemsTrend Linear coef **
Quadratic coef **Months ** (7 mths)
* (2 mths)Weekends *POIs (lag1) Charged ** *
Attend Court *No action taken **
Incapacitation (lag 5)
* Weakly significant .05<p<.10** Significant p<.05
This model underestimated total violent offences for 2007 by 2.9%
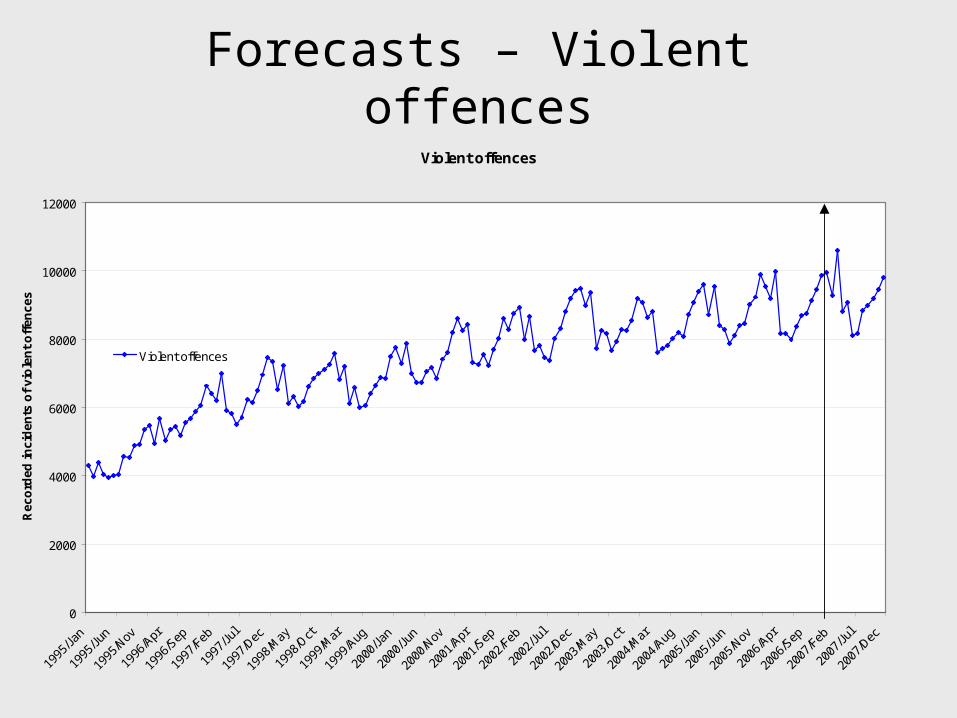
Forecasts – Violent offencesViolent offences
0
2000
4000
6000
8000
10000
12000
1995
/Jan
1995
/Jun
1995
/Nov
1996
/Apr
1996
/Sep
1997
/Feb
1997
/Jul
1997
/Dec
1998
/May
1998
/Oct
1999
/Mar
1999
/Aug
2000
/Jan
2000
/Jun
2000
/Nov
2001
/Apr
2001
/Sep
2002
/Feb
2002
/Jul
2002
/Dec
2003
/May
2003
/Oct
2004
/Mar
2004
/Aug
2005
/Jan
2005
/Jun
2005
/Nov
2006
/Apr
2006
/Sep
2007
/Feb
2007
/Jul
2007
/Dec
Rec
ord
ed i
nci
den
ts o
f vi
ole
nt
off
ence
s
Violent offences
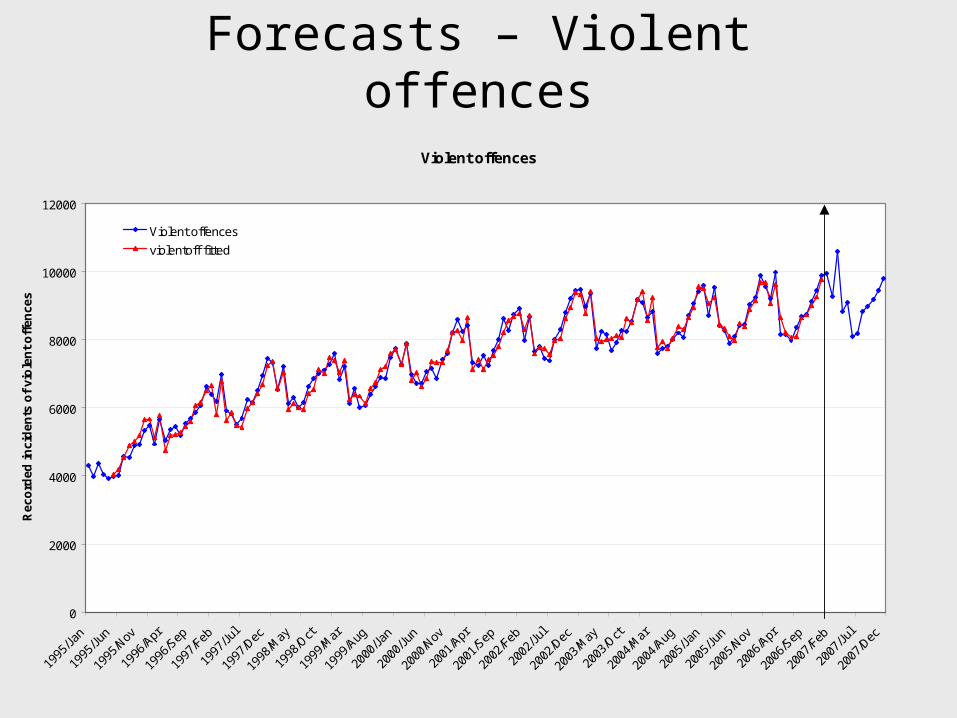
Forecasts – Violent offences
Violent offences
0
2000
4000
6000
8000
10000
12000
1995
/Jan
1995
/Jun
1995
/Nov
1996
/Apr
1996
/Sep
1997
/Feb
1997
/Jul
1997
/Dec
1998
/May
1998
/Oct
1999
/Mar
1999
/Aug
2000
/Jan
2000
/Jun
2000
/Nov
2001
/Apr
2001
/Sep
2002
/Feb
2002
/Jul
2002
/Dec
2003
/May
2003
/Oct
2004
/Mar
2004
/Aug
2005
/Jan
2005
/Jun
2005
/Nov
2006
/Apr
2006
/Sep
2007
/Feb
2007
/Jul
2007
/Dec
Rec
ord
ed i
nci
den
ts o
f vi
ole
nt
off
ence
s
Violent offences
violentoff fitted
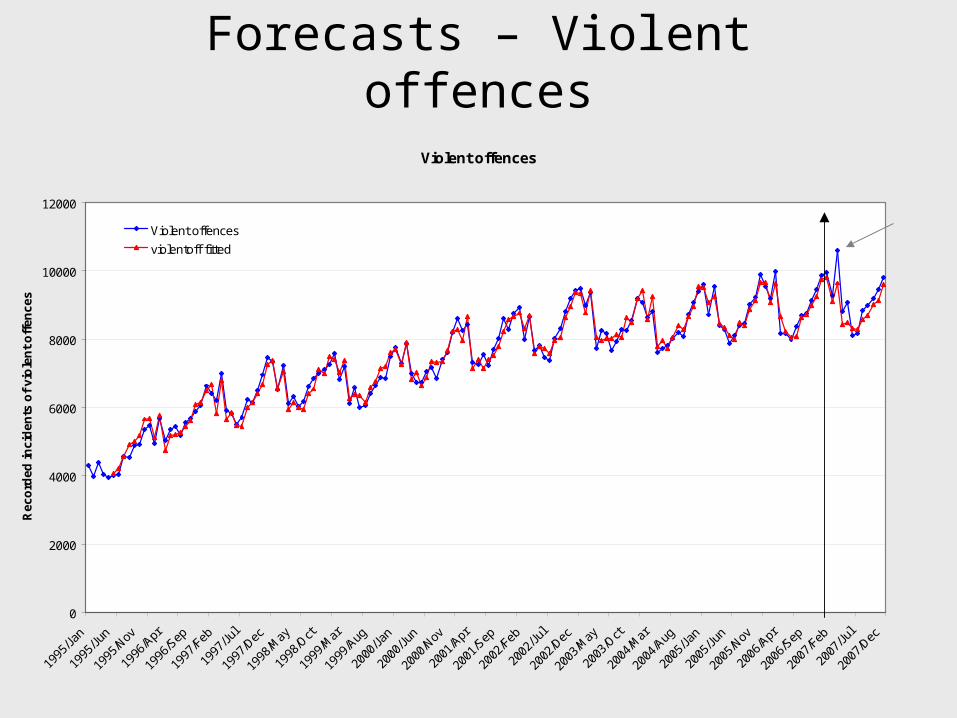
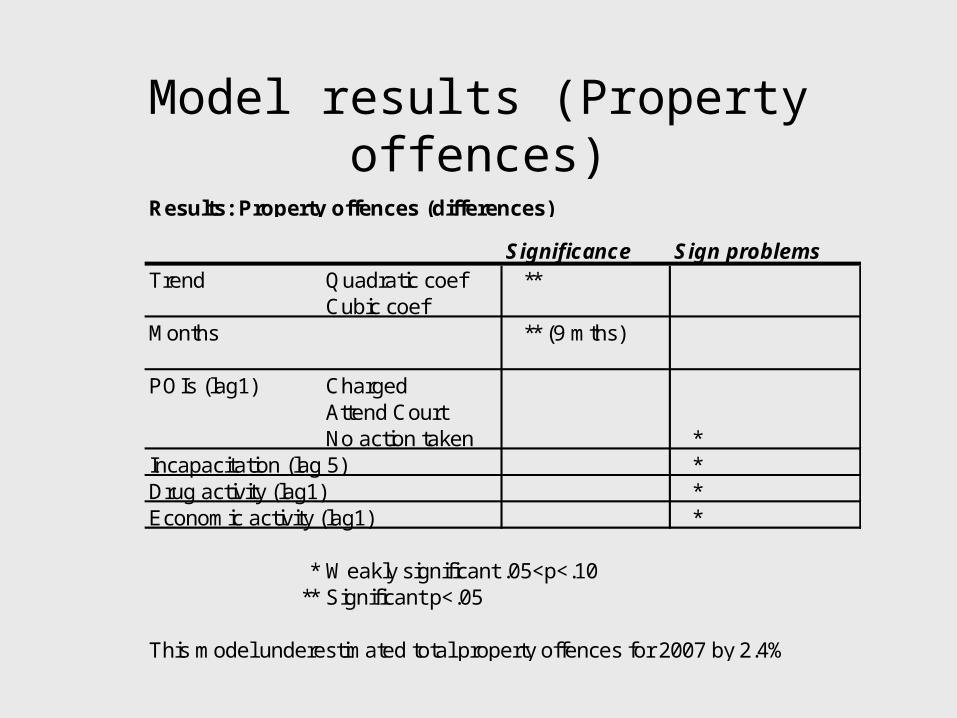
Model results (Property offences)
Results: Property offences (differences)
Significance Sign problemsTrend Quadratic coef **
Cubic coefMonths ** (9 mths)
POIs (lag1) ChargedAttend CourtNo action taken *
Incapacitation (lag 5) *Drug activity (lag1) *Economic activity (lag1) *
* Weakly significant .05<p<.10** Significant p<.05
This model underestimated total property offences for 2007 by 2.4%
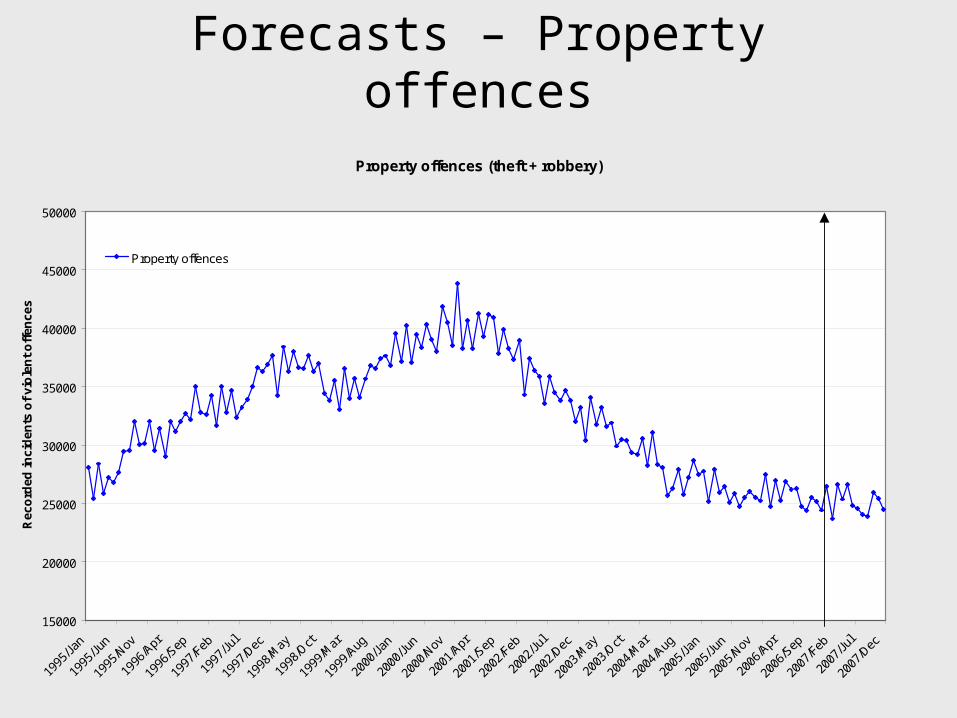
Forecasts – Property offences
Property offences (theft + robbery)
15000
20000
25000
30000
35000
40000
45000
50000
1995
/Jan
1995
/Jun
1995
/Nov
1996
/Apr
1996
/Sep
1997
/Feb
1997
/Jul
1997
/Dec
1998
/May
1998
/Oct
1999
/Mar
1999
/Aug
2000
/Jan
2000
/Jun
2000
/Nov
2001
/Apr
2001
/Sep
2002
/Feb
2002
/Jul
2002
/Dec
2003
/May
2003
/Oct
2004
/Mar
2004
/Aug
2005
/Jan
2005
/Jun
2005
/Nov
2006
/Apr
2006
/Sep
2007
/Feb
2007
/Jul
2007
/Dec
Rec
ord
ed i
nci
den
ts o
f vi
ole
nt
off
ence
s
Property offences
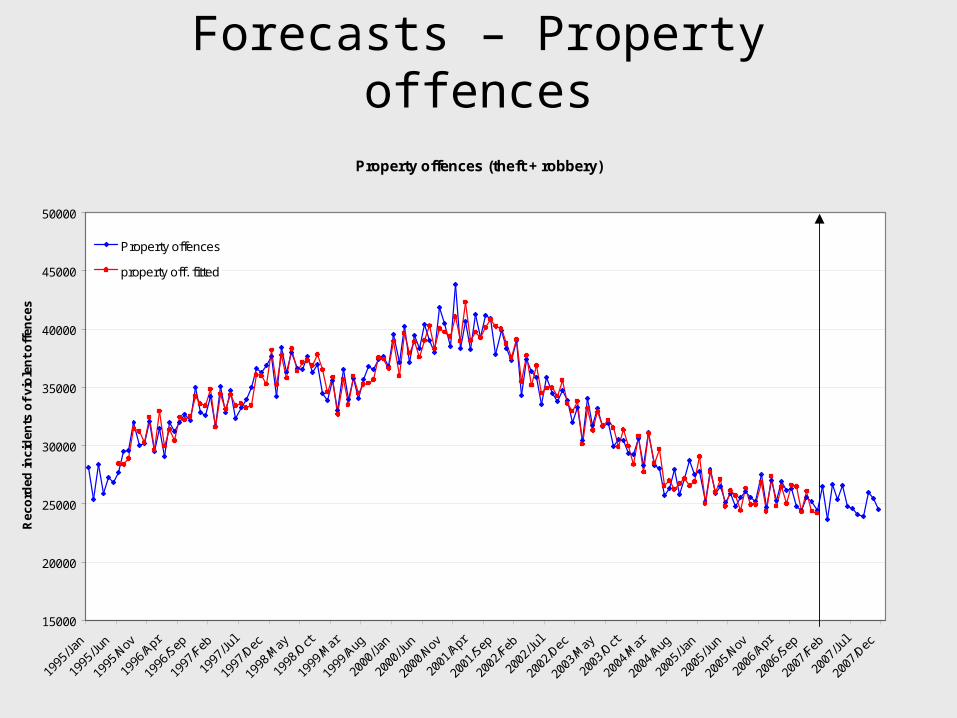
property off. fitted
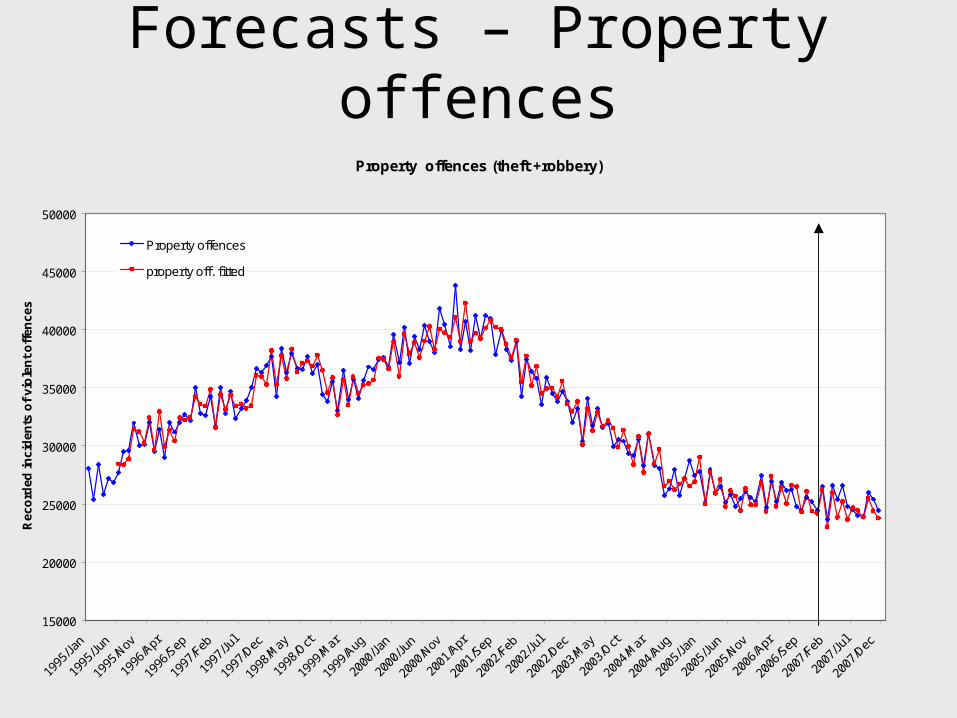
Forecasts – Property offences
Property offences (theft +robbery)
15000
20000
25000
30000
35000
40000
45000
50000
1995
/Jan
1995
/Jun
1995
/Nov
1996
/Apr
1996
/Sep
1997
/Feb
1997
/Jul
1997
/Dec
1998
/May
1998
/Oct
1999
/Mar
1999
/Aug
2000
/Jan
2000
/Jun
2000
/Nov
2001
/Apr
2001
/Sep
2002
/Feb
2002
/Jul
2002
/Dec
2003
/May
2003
/Oct
2004
/Mar
2004
/Aug
2005
/Jan
2005
/Jun
2005
/Nov
2006
/Apr
2006
/Sep
2007
/Feb
2007
/Jul
2007
/Dec
Rec
ord
ed i
nci
den
ts o
f vi
ole
nt
off
ence
s
Property offences
property off. fitted
Model selection and forecast accuracy
• Stationarity of dependent variable
• Most appropriate trend
• MLE ARMA/ARIMA
• Log likelihood and Wald Chi Sq
• Error tests and RMSE for forecast
Accuracy vs. Parsimony
• Over fitting (including non significant variables) improves forecast accuracy
• However reduction in significance of model
• Fit for purpose:– Overfitted models useful for forecasting– Parsimonious models useful for determining
which factors influence long term trends
Conclusions
• Can achieve well fitting models for violent and property crime with good forecasting power
• Majority of trend explained using structure (quadratic or cubic), seasonal (month) terms
• Weekend dummy and summer months a good proxy for alcohol consumption
• POIs (clear-up variables) act as a control for autocorrelation
Next steps
• Report state level trends, seasonal components and influences to NSW Police
• Project models from state level to regional level– Demand at local area command level
• Panel data sets for regions• Develop models for other crimes, particularly high
volume offences that are resilient to police activity– Malicious damage– Assault (domestic violence related and non-domestic
violence)– Harassment