Embed Size (px)
Citation preview

1
Explaining the Patterns of Public Participation in Agency Decision-Making
Milena I. Neshkova
Florida International University
School of International and Public Affairs
Campus Park, PCA 350B
11200 SW 8th Street
Miami, FL 33199
305-348-0486 (voice)
305-348-5848 (fax)
Hai (David) Guo
Florida International University
School of International and Public Affairs
Campus Park, PCA 352A
11200 SW 8th Street
Miami, FL 33199
305-348-0430 (voice)
305-348-5848
Abstract:
Why are some agencies more open to public input than others? Although many agree about the
normative desirability of involving citizens in administrative processes, there is a significant
variation across agencies in the extent of citizen involvement. This paper investigates the
factors that drive public managers‘ decision to solicit greater citizen input. We argue that
besides normative rationales, participation also serves instrumental considerations related to
agency legitimacy and constituent support. We draw on a rich body of literature on public
participation in the policy process to develop empirically testable hypotheses about the patterns
of participation in administration. Using data about the practices of citizen involvement in
setting the budget priorities at four state departments—environment, transportation, child
protection, and corrections—we find that the characteristics of target groups are strong
predictors of an agency‘s willingness to involve the public. Contrary to expectations, policy
characteristics are less important in administrative decisions regarding public participation.
Prepared for delivery at the 11th Annual Public Management Research Conference, June 2-4,
2011, Syracuse University

2
INTRODUCTION
Why are some agencies more open to public involvement than others? In an era where
transparency and inclusiveness are increasingly important, it is crucial to understand what
drives the decision of government agencies to involve the public in administrative processes.1
Although few would deny the normative desirability of citizen inclusion in the decision making
of a non-elected administrative branch (e.g., King, Fetley and Susel 1998, Roberts 1997,
Stivers 1990, 1994), the large discrepancies between public agencies in their efforts to include
the public indicate that there are also other considerations at play. We argue that besides its
ability to democratize the administrative decision-making process, public participation serves
important bureaucratic values such as achieving greater legitimacy and ensuring the support of
critical constituency (see Meier 2000 and Meier and O‘Toole 2006 for an insightful discussion
on the importance of bureaucratic values). Public managers have to decide on the appropriate
level of citizen involvement in administrative decision making, as well as the mechanisms
through which public input should be solicited. In doing so, managers face the complex task of
weighing the costs and benefits of citizen participation within their particular political, fiscal,
and cultural operational context.
Prior research has identified a number of important factors that determine the extent to
which administrators attempt to involve citizens (e.g., Alkadry 2003, Ebdon 2000, Handley and
Howell-Moroney 2010, Moynihan 2003, Roberts 1997, 2004, Thomas 1990, 1993,1995, Wang
2001, Yang and Callahan 2007, Yang and Pandey 2007), yet some critical links have remained
unexplored. One such link pertains to whether and how the characteristics of policies and their
target groups shape the decision of public managers to invite greater participation in
1 Over the last two decades the federal legislation greatly expanded the legal requirements for public participation
in administrative planning and programming. Although there was clear federal emphasis on citizen involvement,
the legislation has left it up to the agencies to devise their own policies to meet these legal mandates.

3
administrative decision-making. Theoretical work in public policy and political science (e.g.,
Gormley 1986, Lowi 1972, Schneider and Ingram 1993, 1997) has provided a rich set of
underpinnings regarding the patterns of participation in the policy process, yet their application
to public administration has not been fully explored. This study examines the incentives and
constraints faced by administrative actors in their attempts to seek greater participation and
how these are shaped by the characteristics of policies and their constituent groups. To address
these questions, we study the practices of public input seeking when setting the budget
priorities in four agencies across the 50 states – Environmental Protection Agency, Department
of Transportation, Department of Corrections, and Child Protection Services.
The data support the proposition that administrators are more likely to involve the
public when participation has the potential to enhance agency legitimacy: agencies tend to be
more open if policy target populations are politically powerful and positively perceived, and
less so if target groups are politically weak and negatively constructed. Further, our findings
indicate that state political culture influences agencies‘ public inclusion efforts with moralistic
states being more likely to seek citizen involvement than individualistic or traditionalistic
states. Contrary to the expectations, neither the characteristics of policy areas nor the specific
political context in which public agencies operate impact the administrative decisions regarding
participation.
The rest of the paper is organized as follows. We start with a discussion about the
incentives and constraints public managers face when deciding on how and the extent to which
the public should be involved. We then summarize the findings of prior research and present
our hypotheses about the factors affecting administrative decision regarding public
involvement. Next, we describe our data and the operationalization of the variables used to test

4
the hypothesized effects. Finally, we present the results and conclude with a discussion about
their implications.
WHY ENGAGE THE PUBLIC IN ADMINISTRATION
Although a large body of literature advocates for participation as beneficial to both
governments and citizens (e.g., Fung 2004, Moynihan 2003, Nabatchi 2010, Roberts 1997,
2004), it has also been acknowledged that participation could be a waste of time and resources
for both parties (e.g., Irvin and Stansbury 2004; Thomas 1990, 1995). In terms of benefits,
participation is seen as a way to alleviate the inherent tensions between the values of
bureaucracy and democracy. Many claim that citizen involvement promises greater democratic
legitimacy for decisions made by unelected bureaucrats (e.g., Stivers 1990, Nabatchi 2010).
Arriving at a consensus with the public is especially needed when making unpopular and
potentially conflicting decisions. Robert‘s study (1997) depicts an example of how
administrators could attain citizens‘ support for painful budget cuts. Moreover, participation
has been advocated as a trust-building process: by participating in government affairs, citizens
obtain a better understanding of the trade-offs inherent in government policies and, in turn,
develop a greater appreciation of the business of government (though Innes and Booher 2004,
Wang and Van Wart 2007). Finally, governments faced with increasingly complex social
problems might not be able to foresee all possible (including unintended) consequences of their
decisions and thus they might benefit from the practical knowledge and street wisdom of
citizens often dealing with these problems on a daily basis (Fung 2004, Sirianni 2009). As
Beierle and Cayford (2002, 6) sum it, ―public participation is being used not only to keep
government accountable but also to help agencies make good decisions, help resolve long-

5
standing problems of conflict and mistrust, and build capacity for solving the wicked problems
of the future.‖
Scholars have also recognized the administrative costs associated with public
participation (Ebdon and Franklin 2006; Irvin and Stansbury 2004; Robbins, Simonsen, and
Feldman 2008; Thomas 1990). Participation is time-consuming and has the potential to slow
down decision making since the public needs to be informed and even educated first in order to
meaningfully participate in administrative processes. As argued by Irvin and Stansbury (2004,
58), ―the per-decision cost of citizen participation groups is arguably more expensive than the
decision making done by a single administrator‖ with the appropriate expertise and experience.
There are also concerns about the loss of control over the process (Kweit and Kweit 1984;
Moynihan 2003) and that most actively involved citizens might represent private interests that
are very different than the broad public interest (Ebdon and Franklin 2004; Robbins, Simonsen,
and Feldman 2008).
An informal review of the participatory literature shows an extensive debate about the
pros and cons of public participation. Scholars and practitioners have developed detailed
guidelines on do‘s and don‘ts in the process of involving citizens. Less understood, however,
are the conditions under which administrators are more or less likely to include the public.
Since the legislation has left it up to public managers to decide about the mechanisms and the
extent to which citizens will be involved in administration, it is important to understand the
factors they consider in balancing its costs and benefits.
Previous work on public participation in administrative decision-making has focused
predominantly on the patterns observed at the level of city government. Although this research
has developed a number of useful insights (Ebdon 2000, Wang 2001, Yang and Callahan

6
2007), its focus on local governments has left some possibly critical determinants of public
inclusion unexamined. Factors that have been found to affect the patterns of participation at the
municipal level include the size and structure of government, pressures from elected officials
and other external stakeholders, and bureaucratic willingness to submit to accountability. In an
analysis of participation in state health and human service agencies, Yang and Pandey (2007)
found that clientele influence can also affect managers‘ willingness to engage the public
because client groups can either support or undermine agency‘s mission (see also Meier 2000).
Likewise, a recent study by Handley and Howell-Moroney (2010) finds that the ordering of
stakeholder relationships is a critical factor of how the bureaucrats will exercise their discretion
regarding the extent and role of citizen participation in administrative processes. The authors
assert that public managers make greater efforts to include the public if they feel greater
accountability to citizens in the community.
In this study, we extend this line of reasoning, drawing on the rich body of literature
examining the patterns of participation in the policy process. Specifically, we broaden the
analysis to include factors pertaining to political power and social construction of policy targets
groups as well as to characteristics of policy areas. We believe that these are important, albeit
overlooked, determinants of participation at the administrative agencies.
Lowi‘s (1972) seminal idea that ―policy creates politics‖ brought to life a stream of
theoretical and empirical research focused on the characteristics of policy types and the
mechanisms through which they influence political processes. Gormley‘s work (1986) on
regulatory bureaucracies suggested that different groups would be drawn into the policy
process depending on salience and complexity of policy areas. Schneider and Ingram (1993)
added another dimension by asserting that political power and social construction of policy

7
target populations shapes not only the distribution of benefits and costs among groups, but also
the patterns of their participation. The research presented here tests whether the propositions
about policy types and policy target groups are useful in explaining participation at
administrative agencies.
Since some constituent groups enjoy strong political power and are more positively
viewed by the society than others, their voice should be more important to administrators than
the voice of groups that are negatively constructed and lack political power. This expectation is
based on at least two reasons. First, groups with positive social construction can bring greater
legitimacy to administrative decisions. Second, powerful groups have more resources to
mobilize and fight against decisions that distribute burdens to them. In addition, complex
policy areas might discourage public involvement, since people usually lack the knowledge and
preparation needed to meaningfully participate in the decisions about resource distribution in
these areas.
RESEARCH HYPOTHESES
Drawing on the previous work on citizen involvement in administration and the rich theoretical
and empirical literature on political participation, we test two sets of factors that are likely to
influence agency‘s decision to seek greater public input: target group characteristics and policy
areas characteristics. We address each set of factors in detail below.
The Effect of Power and Social Construction of Policy Targets
According to Schneider and Ingram (1993, 1995), ‗target populations‘ affect the design and
tools of public policies. Target populations reflect the purposeful nature of public policies and
include all social groups that are positively or negatively affected by particular policies. For

8
Schneider and Ingram, the way target groups are portrayed by the society determines the types
of policies that would be directed toward them as well as their ability to mobilize and
participate in the policy process. Thus, some groups are viewed as being deserving and others
not so. Respectively, the former are treated by government and bureaucracies as ―clients‖ and
the latter are viewed as policies‘ objects. As Schneider and Ingram assert (1993, 334), ―Social
constructions become embedded in policy as messages that are absorbed by citizens and affect
their orientations and participation patterns.‖
They develop a two-by-two matrix to categorize target groups by their social
construction (positive or negative), and by their political power (strong or weak). Within this
scheme, ―advantaged‖ groups (e.g., business, scientific, elderly), are positively constructed and
powerful, and find it easy to get their items on the agenda. In contrast, ―deviant‖ groups (e.g.,
criminals) are negatively constructed and powerless. Consequently, it is hard for this group to
get heard by public officials, since the public views them negatively and generally approves the
punishment policies directed at them. Although the ―dependent‖ group (e.g., children, mothers)
lacks political power, it is positively constructed, thus ―officials want to appear to be aligned
with their interests‖ (1993, 338). Finally, the ―contenders‖ group (e.g., corporations,
contractors) is negatively constructed but powerful. Thus, they have a chance to get on the
agenda, but only in the context of low visibility.
We test if the propositions suggested by Schneider and Ingram can be extended to help
explain agency decisions to use public participation. Since some constituent groups enjoy
strong political power and are more positively viewed by the society than others, their voice
should be more important to administrators than the voice of groups that are negatively
constructed and lack political power. Thus, public managers should be more likely to be use
9
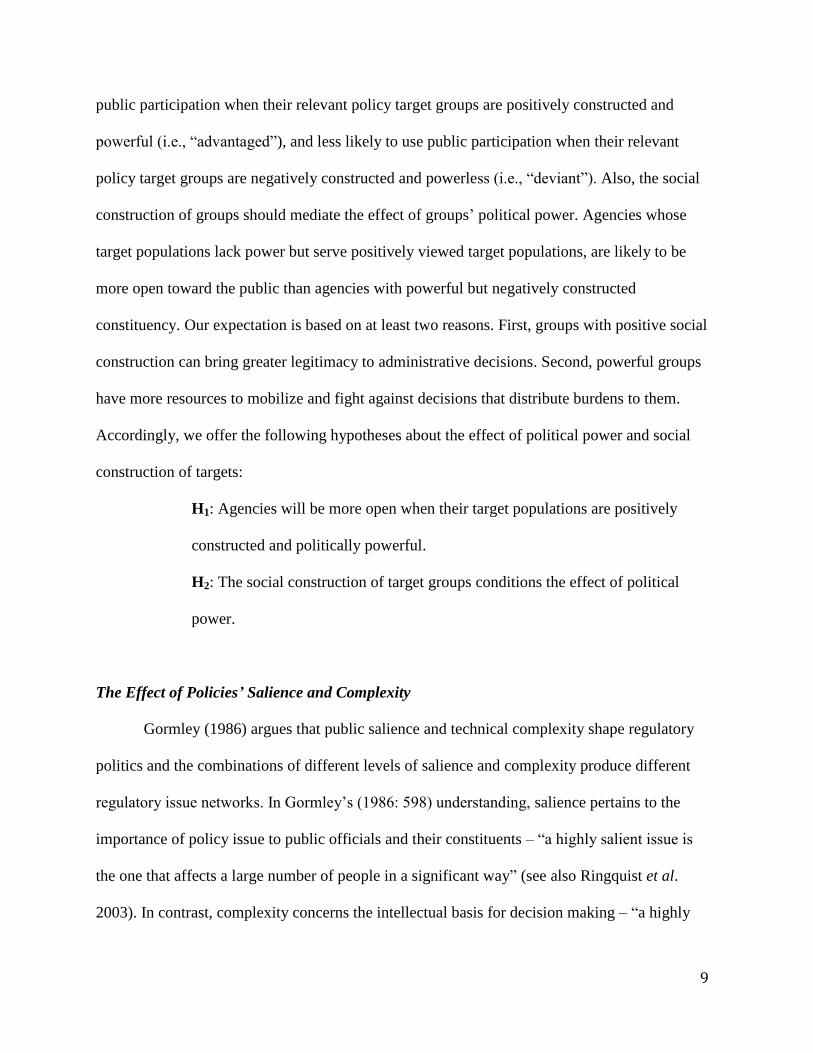
public participation when their relevant policy target groups are positively constructed and
powerful (i.e., ―advantaged‖), and less likely to use public participation when their relevant
policy target groups are negatively constructed and powerless (i.e., ―deviant‖). Also, the social
construction of groups should mediate the effect of groups‘ political power. Agencies whose
target populations lack power but serve positively viewed target populations, are likely to be
more open toward the public than agencies with powerful but negatively constructed
constituency. Our expectation is based on at least two reasons. First, groups with positive social
construction can bring greater legitimacy to administrative decisions. Second, powerful groups
have more resources to mobilize and fight against decisions that distribute burdens to them.
Accordingly, we offer the following hypotheses about the effect of political power and social
construction of targets:
H1: Agencies will be more open when their target populations are positively
constructed and politically powerful.
H2: The social construction of target groups conditions the effect of political
power.
The Effect of Policies’ Salience and Complexity
Gormley (1986) argues that public salience and technical complexity shape regulatory
politics and the combinations of different levels of salience and complexity produce different
regulatory issue networks. In Gormley‘s (1986: 598) understanding, salience pertains to the
importance of policy issue to public officials and their constituents – ―a highly salient issue is
the one that affects a large number of people in a significant way‖ (see also Ringquist et al.
2003). In contrast, complexity concerns the intellectual basis for decision making – ―a highly

10
complex issue is one that raises factual questions that cannot be answered by generalists or
laypersons‖(Gormley 1986: 598). It is high when the policy problem requires the
understanding of a specialist and low when the issue can be handled without any special skills
or preparation. According to Gormley, when the issues are highly complex, there will be a
higher demand for expertise, and policymaking would be best handled by professional
bureaucrats. Due to large organizational size, long time horizons, and continuity, bureaucrats
develop expertise in particular policy areas, which allows them to know more about these
policies than any political actor or the public in general. Complex policy areas might
discourage public involvement, since people usually lack the knowledge and preparation
needed to meaningfully participate in the decisions about resource distribution in these areas.
Thus, the public is expected to be more involved when the policy issues are salient and least
involved when the issues under consideration are complex.
Similarly, Thomas (1990) identifies two dimensions to judge the appropriate degree of
public inclusion in administrative processes: quality and acceptability of administrative
decisions. He argues that public involvement is more appropriate when there is need for greater
social acceptance of administrative decisions and less appropriate when there is a need for
quality. Following the expectations developed in public policy and public administration
literatures, we hypothesize that:
H3: Agencies dealing with salient policy issues will be more likely to engage the
public.
H4: Technical areas call for expertise and public managers will be less likely to
rely on advice from the public.

11
MODELING CITIZEN PARTICIPATION IN ADMINISTRATION
Data and Unit of Analysis
The expectations about the effects of characteristics of policy areas and their populations
guided our selection of four state agencies for our study: the Environmental Protection Agency
(EPA), the Department of Transportation (DOT), Child Protective Services (CPS), and the
Department of Corrections (DOC). Specifically, we selected departments to represent: 1) policy
areas with different combinations of salience and complexity; and 2) different types of target
populations, with one in each of the quadrants identifies by Schneider and Ingram (1993).
Funded by Pew Charitable Trusts, the Government Performance Project (GPP)2
provides data about citizen involvement utilized by these four agencies across the 50 states.
The main data collection instrument is an online survey sent to state officials, administrators,
staff, and managers. The information on corrections and child protection has been collected for
2008, while the information on DOTs and environment agencies is for 2004. The practices of
seeking citizen input are collected under the financial management area,3 where one of the
sections inquires whether ―the state provides citizens opportunities for public input about the
budget.‖ The respondents are asked about the strategies utilized by their agencies to generate
input from citizens about spending priorities, budget development and/or assessment. The
respondents can select among eight strategies, most often reported in the participatory
literature: citizen/clients surveys, budget simulation/contingency valuation exercises with
citizens, focus groups, open forums, public hearings, citizen advisory boards/commissions,
2 GPP, which seeks to grade financial performance of the U.S. states, started in 1998. The two most recent data
collections occurred in 2004 and 2008 (Pew Center on the States 2005; Barrett and Greene 2008). In order to
better assess states‘ management quality, the questionnaires not only address overall state government, but also
descend down to agency levels. 3 The management areas include financial management, human resources management, information technology
management and capital management

12
telephone hotlines, and websites. Survey respondents are provided with a matrix in which they
can check citizen input strategies at different stages of budget processes.4
Since the data are organized by department and state, we have a pooled data set with a
department-state as a unit of analysis. Out of all 50 states, forty Departments of Corrections
reported on their citizen participation practices. Each of the other three agencies—
transportation, environment, and child protection—provided 39 responses. This brings us to a
response rate of about 80 percent and a total of 157 department-state observations.
Dependent Variables
We construct two sets of indices of citizen input. The first index is additive and treats each
strategy of citizen input with the same weight. For instance, if the Department of Corrections in
a particular state uses eight mechanisms to gather citizen input during the stages of the budget
process, the index of citizen input for DOC in this state will be 8. In other words, the additive
index score indicates total number of strategies used by each of the four agencies during the
whole cycle of the budget process. Our rationale for having an additive index stems from the
assumption that each method for soliciting public input has its potential strengths and
weaknesses. Scholars agree that there is no perfect method for obtaining public input (Ebdon
and Franklin 2004; Robbins, Simonsen, and Feldman 2008). The utilization of different formats
allows for a greater number of exchanges between administrators and citizens. As Ebdon and
Franklin (2004, 35) comment, ―Governments using more than one method on a regular basis
might be more likely to attain effective participation by offsetting the weaknesses of one
4 The survey question identifies four stages of the budget process, namely, information sharing, budget discussion,
budget decision, and program assessment. This study utilizes citizen involvement strategies in the whole budget
process. Citizen involvement in different stages is not the focus here.

13
method with the advantages of another.‖ Table 1 presents the descriptive statistics of the
additive index.
[Tables 1 About Here]
The second set of indices treats the strategies differently. Participatory literature offers a
detailed examination of the different methods used during the budget process. Modes of
communication with the public vary in terms of their representativeness (Moynihan 2003;
Robbins, Simonsen and Feldman 2008), their informativeness to the administrative decision
makers (Robbins, Simonsen and Feldman 2008), and whether they involve one-way or two-
way communication (Ebdon and Franklin 2004, 2006). The International Association for Public
Participation (IAP2) has developed a spectrum of public participation, which classifies public
participation into five stages in terms of ―increasing level of public impact.‖ The five stages
include inform, consult, involve, collaborate, and empower. We construct our weighted index
following this classification.
The GPP survey question identifies seven strategies of seeking citizen participation,
namely telephone hotlines, citizen survey, focus group, open forum, public hearing, budget
simulation with citizens, and citizen advisory boards or commissions. Based on the
characteristics of each stage of IAP2 spectrum, we place these seven strategies into the three
stages in the middle, namely, consult, involve, and collaborate. Respectively, telephone
hotlines and citizen survey are categorized as processes that seek to consult the public; focus
group, open forum, public hearing, and budget simulations with citizens are considered as
processes aiming to involve the public; and finally citizen advisory boards or commissions are
coded as processes that attempt to collaborate with the public.

14
The processes at the consult stage aim to ―obtain public feedback on analysis,
alternatives and/or decisions‖ (IAP2, 2007). Telephone hotlines and citizen survey serve this
purpose. Yet, the degree of an administrator‘s effort and involvement is different between these
two strategies. Telephone hotlines require less amount of effort on the part of administrators,
because citizens initiate the ‗input‘ process by calling the agency. Citizen surveys require more
effort from the administrators than the telephone hotlines, because the administrators need to
initiate the process by designing and sending out the surveys. Therefore, in terms of specific
weights, telephone hotline is coded as 1 and 2 for citizen surveys.
Focus groups, open forums, public hearings, and budget simulations involve two-way
communication between administrators and citizens and thus allow for a greater amount of
information to be conveyed to decision makers. These four strategies are consistent with the
processes at the involve stage, which seek ―to work directly with the public throughout the
process to ensure that public concerns and aspirations are consistently understood and
considered‖(IAP2, 2007). Prior research shows that citizens have clear preferences for modes
that involve two-way communication (Heikkila and Isett 2007). Focus groups, open forums and
public hearings are coded as 3 and all three carry the same weight. Participation is considered
more beneficial when citizens have the opportunity to discuss issues with professional
administrators and develop in-depth knowledge about the trade-offs in public policies
(Kathlene and Martin 1991; King, Fetley, and Susel 1998; Robbins, Simonsen, and Feldman
2008; Thomas 1995). Thus, the budget simulation exercises are coded as 4, because they not
only employ two-way communication between citizens and administrators, but also allow
citizens to become aware of budget constraints and trade-offs, which, in turn, leads to more
informed decision making on the part of citizens (Carol and Franklin, 2004).

15
Finally, the citizen advisory boards carry the most weight of these seven mechanisms.
Within IAP2 classification, this method for gathering citizen input fits the description of the
collaborate stage. The processes at this stage seek to ―partner with the public in each aspect of
the decision including the development of alternatives and the identification of the preferred
solution‖ (IAP2, 2007). Although the quality of citizen advisory boards can vary greatly, their
members are more likely to develop extensive knowledge on policy issues and the types of
budget constraints and trade-offs governments face (Robbins, Simonsen, and Feldman 2008).
[Table 2 About Here]
As the descriptive statistics in Tables 1 and 2 show, the efforts of public managers in
soliciting public input vary across the states and across the departments. The state with most
extensive citizen involvement is Michigan, where all four departments claim a variety of
strategies used at different stages of the budget process. Some states indicate no use of citizen
input in one or two agencies. For instance, both New Hampshire DOC and EPA reported no
attempts to involve citizens in their budgetary decisions. Among the four agencies, the
descriptive statistics show that the departments of transportation have the greatest amount of
public participation in their budget processes. In contrast, the departments of corrections have
the least amount of public involvement.
Main Explanatory Variables
Characteristics of Policy Targets. As noted previously, Schneider and Ingram (1993,
1997) differentiate between four types of target populations formed by different combinations
of political power and social construction: advantaged (politically powerful and positively

16
constructed), contenders (politically powerful and negatively constructed), dependents
(positively constructed and powerless), and deviants (negatively constructed and powerless).
Since policy areas might have multiple target populations, and their social construction might
be subject to contention, specification of target population of each policy and agency presents
us with a challenge. Our approach was to follow as closely as possible the rational extended by
Schneider and Ingram when coding our variables.
The specification of target groups affected by the policies pursued by the child
protection agencies and the departments of corrections is quite straightforward, since they fit
perfectly Schneider‘s and Ingram typology for the groups of dependents and the groups of
deviants, respectively. Child Protective Services provides services to children and families
including assistance with child support, public housing, foster care, and adoption. It is also
responsible for investigating cases of child abuse and neglect. The policy target group is
children, which fits well with Schneider and Ingram‘s category of dependents, a group that is
positively constructed but politically powerless. Department of Corrections is responsible for
the custody of inmates in state prisons and the supervision of offenders sentenced to probation
or parole. The agency‘s policy target population consists of criminals, which fits well
Schneider and Ingram‘s group of deviants, a negatively constructed and powerless group.
Classifying the target groups of the other two agencies is rather challenging, because
target groups and clientele of these agencies might differ. We start with the state level EPAs.
The agency is charged with the development, implementation, and enforcement of states‘
environmental legislation. In doing so, it sets standards for the allowable level of air and water
pollution, issues environmental permits, and controls compliance. The most obvious target of
environmental regulations is business. Within Schneider and Ingram‘s classification business is

17
categorized as the advantaged group, that is, both politically powerful and positively
constructed. Although environmental regulation imposes burdens on this group, it does it in a
way prescribed by Schneider and Ingram. As they write (1993, 339), ―When burdens, rather
than benefits, are directed at the advantaged groups, … self-regulation that entrusts the group to
learn from its own behavior and voluntarily take actions to achieve policy goals will be
preferred, along with positive inducements. When these are not effective in inducing the
desired behavior, policies may shift toward ―standards and charges,‖ which do not stigmatize
the organization for its activities but simply attempt to discourage certain actions (such as
pollution) by charging for it.‖
Schneider and Ingram (1997) also argue that when a burdensome policy is directed to
some advantaged groups, other advantaged groups are intended as beneficiaries. The authors
provide the example with the Clear Air Act, which has been justified in terms of health
protection. Thus we categorize the target population of the state level EPA policies as being
both politically powerful and positively viewed.5 Finally, we turn to the Department of
Transportation‘s target populations. The state level DOTs are responsible for the state highway
systems and public transportation systems, as well as for air transit. This includes interstate
highway programs, managing federal aid for highway construction, road and bridge
construction and maintenance funds, and mass transit grants. For the major part of its services,
the agency relies on private contractors, and contracting for supplies and services is the
agency‘s top priority. Thus government contractors can be considered a major target population
of state DOTs. Within Schneider and Ingram‘s classification, government contractors fall under
5 Even, if we extend our examination beyond the target population to include the EPA‘s clientele – pro-
environmental groups and organizations – we are still presented with a positively constructed constituency. The
positive image of environmental protection as an area is reinforced by the constantly high support from the public,
measured as the number of respondents to the General Social Survey indicating that the U.S. government spends
―too little‖ for improving and protecting the environment.

18
the group of contenders, which ―have been portrayed as special interests who have too much
power, enjoy too many privileges, and have gotten more than they deserve‖ (Schneider and
Ingram 1997, 117). The benefits that the contending groups receive are largely hidden from the
public and hard to trace (often concealed as procedures or tax breaks). Thus we classify DOT‘s
target population as politically powerful but also associated with negative constructions.
In this way, each of the four departments has been matched to one of the quadrants of
Schneider and Ingram‘s typology. Now we proceed to the operationalization of concepts of
political power and social construction. Although not perfect, the number of organized interests
in each state per policy area can serve as a good proxy for their ability to mobilize and affect
policy outcomes6 and have been used in prior work on organized interests (e.g. Gray and
Lowery 1996, Gray et al. 2004). Thus, we operationalize political power as the number of
lobbyist organizations registered in each state by industry type (POWER). We include all
industry areas corresponding to the four agencies in our study.7 As described above, we expect
that the effect of political power to be conditional upon the way a target group is perceived by
society. That is, we anticipate that agencies will be more likely to solicit input from positively
constructed constituents groups than from those that are negatively viewed. To operationalize
this expectation, we employ two variables: POWERPOS takes on the value of the power
measure (the number of lobbying groups registered per state per policy area) for target groups
that are positively constructed, and zero otherwise, while POWERNEG takes on the value of
the power measure for populations that are associated with negative constructs, and zero
otherwise.
6 Admittedly, measuring the number of lobbying organizations captures only part of power, since we are not able
to gauge the intensity of their lobbying. 7 The figures are retrieved from the website http://www.lobbyists.info/

19
Characteristics of Policy Area. The salience of the policy area is also expected to affect
the degree of public involvement. We operationalize salience by the number of respondents
considering the particular issue ―the most important problem facing the country‖ weighted by
the total number of responses. The question was asked by the CBS/New York Times polls. We
use the response to this question in the poll of January 2006 as a measure of salience for this
study (SALIENT). Complexity is operationalized as a dichotomous variable (COMPLEX),
which takes a value of 1 if the agency deals with policy issues that require expertise to be
properly tackled (environmental protection and transportation) , and zero otherwise (child
protection and corrections).
Control Variables
Agency Resourcefulness. As noted above, seeking citizen input when making
administrative decisions can be costly. Prior research (Cohen 1995, Wang 2001) points to the
need for sufficient funding to ensure personnel and infrastructure needs associated with
participation. Thus, agencies with greater resources might have greater propensity to involve
citizens in their administrative decisions than agencies with scarce resources. To control for the
effect of agency resourcefulness, this study uses the share of agency‘s budget of the total state
budget as an indicator of relative resourcefulness of each agency (BUDSHARE). The annual
budget figures of each agency were obtained from the National Association of State Budget
Officers (NASBO)‘s annual expenditure reports of state governments. We took from the report
the budget figures for year 2006 for both the Departments of Corrections and Departments of
Transportation across the country. The report, however, lacks budget information on the state
branches of Child Protection Services and Environment Protection Agency. The figures for

20
these two agencies were taken from alternatives sources. Specifically, states‘ spending on child
protection were obtained from the ―Federal, State, and Local Spending to Address Child Abuse
and Neglect in SFY 2006‖ (DeVooght et al. 2008). State environmental agencies‘ budget
figures for the fiscal year 2006 were listed in a report on ―Impacts of Reductions in FY 2010 on
State Environmental Agency Budgets‖ (Victoria et al. 2010). The combination of the three
reports provides complete information on relative agency resourcefulness.
Political Context. Political environment can encourage the use of citizen input by
shaping expectations for public managers. First, the signals they receive regarding the role of
citizens in government might differ depending on the political preferences of elected officials.
Agencies operating in more liberal environments are expected to be more open to the public.
Second, the level of participation depends on the intensity of political conflict in the state. Prior
research on participation (e.g., Ebdon 2000, Wang 2001) finds that governments operating in a
politically divisive environment are more likely to invite greater participation from the public
in order to lend more legitimacy to their decisions and reduce the amount of potentially
problematic decisions.
Three different variables are utilized to control for the effect of political context on
public managers‘ decisions regarding participation. As argued above, divided government
increases the sense of uncertainty of institutions. To alleviate uncertainty, agencies might try to
obtain a greater support from their constituency and thus invite more participation. The Book of
the States by the Council of State Governments provides data on governors‘ party affiliation
and partisan composition of the state legislature, which allow us to construct the political
control measures. We use three dichotomous variables to model the expectations about the
effect of political context: REP, DEM and DGOV. The variable REP assumes a value of 1 if

21
the Republican Party holds the majority of seats in both senate and house and the governor is
also a Republican. DEM indicates that both houses are under the control of the Democratic
Party and the governor is a Democrat. DGOV stands for divided government: the variable is
coded as 1 if the governor‘s party does not control at least one chamber of state legislature and
the governor is a Democrat.
Political Culture. Participation patterns might be affected by the broader political
culture in the particular state (Ebdon 2000, Elazar 1972, Lieske 1993, Lowery and Sigelman
1982). Elazar‘s (1972) typology differentiates among three types of political subcultures:
moralistic culture (found predominantly in the Northern states), individualistic culture
(associated with middle parts of the country), and traditionalistic culture (reflecting the
attitudes and values of Southern states). Participation is greatly encouraged within the political
traditions of moralistic states. Individualistic states stress less participation, since they tend to
regard government more as business. Traditionalistic states employ paternalistic approach,
within which only the elites are expected to be active. Previous research tested the effect of
political culture in the context of city governments (Ebdon 2000, Ebdon and Franklin 2006)
and found that political cultures do affect the level of participation, with moralistic states
having the highest citizen involvement, individualistic states having the lowest, and
traditionalistic states falling in the middle.
To control for the effect of political culture, we use three dichotomous variables
following Elazar‘s typology, where MORALPOLCULT is coded as 1for states with moralistic
culture and zero otherwise; INDIVPOLCULT becomes 1for the states with individualistic
culture and zero otherwise, and TRADPOLCULT assumes a value of 1 for states with

22
traditionalistic political culture, and zero otherwise The descriptive statistics for all independent
variables are given in Table 3.
[Table 3 About Here]
Estimation Routine
Our expectations regarding the determinants of citizen input utilization at public agencies are
modeled using two different techniques – one for the model with the additive index and another
for the weighted index. We fit an OLS regression model to estimate the equation using the
weighted index of citizen input as the dependent variable. The weighting mechanism makes the
dependent variable an interval level variable. When the additive citizen input is used as the
dependent variable, we estimated a negative binomial regression model. Recall that the additive
index is just the count of citizen input strategies used by each state agency. A negative binomial
model is preferred when the assumptions of the Poisson distribution are violated and the mean
and the variance are not equal. Since the density of the mechanisms used by public agencies to
solicit citizen input does not meet the Poisson assumptions (the mean of the dependent variable
is 8.55 and the variance is 46.92), we estimate negative binomial. Finally, since it is highly
unlikely that the observations within one state are independent, thus violating the independence
assumptions, we employ robust standard errors that allow for the observations to be clustered
within each state.
FINDINGS AND DISCUSSION
[Table 4 About Here]
We start with the OLS regression models that use the weighted index of citizen input as the
dependent variable. Table 4 presents the estimation results. Model 1 is our basic model, while

23
Model 3 includes also policy area variables—salience and complexity. Models 2 and 4 test the
proposition that the political power of target groups is conditioned upon the way they are
socially constructed. The F-tests for all four models show statistical significance, which
provides evidence of a good fit, yet the R-square is not particularly high (around 11%).
The results indicate that the concept of target population can help us explain the patterns
of participation observed at the state level departments. The coefficients for our main variables
of interest, the political power variable (POWER) and the social construction variable
(POSTIVECON), show positive association with the amount of participation at the state level
agencies in both the base model (M1) and the full model (M3). All else equal, one more
lobbyist organization registered per state increases citizen participation index by around 0.11 at
the five percent significance level. On average, agencies with positively constructed target
populations are more likely to include citizens in their budgetary decisions, as indicated by the
positive and statistically significant coefficient of the social construction variable. After
controlling for the policy area characteristics (SALIENT and COMPLEX), the impact of the
social construction variable on the weighted index of citizen input increases from 12 to 16
(Model 3 and 4), and the effect is statistically significant at better than one percent level.
The data support the theoretical expectation about the existence of conditionality
between political power of target groups and their social construction. The results from Models
2 and 4 indicate that the effect of power varies depending on the social image of the target
group. The effect of power for positively constructed constituencies is systematically greater
than the effect of power for negatively perceived constituency.
Agency resourcefulness also affects its willingness to pursue greater public
participation. The variable BUDSHARE, our measure of agency‘s relative resourcefulness, has

24
a positive and statistically significant impact on participation, as seen in Model 1 and Model 2.
The results show that the expected weighted index of citizen input increases by about 2, if the
budget variable increases by 1 percentage point, all else equal. However, the variable loses its
statistical significance after policy area characteristics are accounted for.
Turning to the political context variables, only state political culture seems to affect the
pattern of citizen involvement at the agency level. The positive and statistically significant
coefficient of MORALPOLCULT (at the 10% level in Models 1 and 2 and at the 5% level in
Models 3 and 4) indicates that moralistic states are in fact more likely to foster greater
participation in their departments. Contrary to our expectations, divided government does not
contribute to greater openness to the public. The data further show that participation is more
likely when government institutions are controlled by Democrats and less likely when they are
dominated by Republicans, although the regression coefficients of both variables fail to achieve
significance at conventional levels.
[Tables 5 and 6 About Here]
Tables 5 and 6 present the results of the negative binomial models using the additive
index of citizen input as the dependent variable. The likelihood ratio test of the dispersion
parameter confirms the presence of overdispersion in the data, and thus our decision to
estimate a negative binomial model. The parameter is significantly different from zero,
suggesting that the Poisson technique is not an appropriate fit.
In addition, the coefficients of the negative binomial model show the logs of expected
counts, which makes interpretation difficult. Instead, we use incidence rate ratio (IRR)
approach to interpret the results. Our dependent variable is the count of the strategies used by
each agency-state to seek citizen input, which is essentially a rate. Therefore, the IRR approach

25
is appropriate.
In the base model and the full models (M5 and M7), the number of organized
interests—our power measure—has a positive impact on participation, at a significance level of
5%. All else being equal, an additional lobbying organization registered in a state increases the
expected additive index of citizen input by a factor of 1. Agencies with positively viewed
constituents are expected to utilize a greater number of mechanisms to solicit public input
compared to those with negatively constructed target populations. After controlling for the
policy area characteristics (SALIENT and COMPLEX) in Models 7 and 8, the expected
difference between agencies with positively viewed constituency versus agencies with
negatively viewed constituency increases from 1.66 to 1.93.
Further, Models 6 and 8 confirm the conditioning effect of social construction on
political power that has been registered in previous series of models. POWER has significant
positive impact on participation among agencies with positively viewed target groups but not
statistically significant impact among agencies with negatively constructed populations.
Turning to other variables, BUDSHARE, our measure of relative resources of a state
agency, has significant positive impact in M5 and M6. All other variables held constant, a
percentage point increase in budget share increases the additive index of citizen participation
by a factor of 1.09. Policy area variables (SALIENT and COMPLEX) do not have statistically
significant impact on the amount of participation measured as an additive index, which is
consistent with the results derived from the models with the weighted index of citizen input as
the dependent variable. Among the political factors, again, only state political culture shows
statistically significant impact on participation, while all three political variables fail to achieve
statistical significance. The variables INDIVPOLCULT and MORALPOLCULT exhibit the

26
expected positive signs indicating that agencies from individualistic and moralistic states tend
to seek greater citizen involvement in their administrative processes compared to agencies from
traditionalistic states (traditionalistic political culture is used as the base category). This result
is consistent with theoretical expectations. Specifically, our results show that agencies from
moralistic states are significantly more likely to utilize a greater number of participatory
mechanisms than are agencies from traditionalistic states.
In summary, regardless of whether the citizen input is measured as a weighted or
additive index, the OLS and negative binomial regression models demonstrate consistent
results. These results confirm our hypothesis that agencies with more powerful and positively
viewed target populations seek more citizen input than those whose target populations are
associated with negative constructs. Agencies with greater resources, measured as the share of
their budget relative to the total state budget, tend to solicit more participation. This result
substantiates the findings of prior research on participation at the city level, indicating that the
cost of participation is a major consideration for administrators. Departments in states with
moralistic political culture are, on average, more open toward public input than departments in
states with individualistic or traditionalistic political culture. Whether the government is
divided or unified does not impact the efforts of public agencies to involve citizens in the
process of resource allocation.
CONCLUSION
Citizen participation has attracted much attention during the last two decades, yet some
important considerations pointed out by the public policy scholars have been overlooked.
Additionally, most of the existing research on the patterns of citizen involvement has been

27
largely focused on the city government and the services provided at the local level. Research on
participation at the state level has been extremely limited (for an exception, see Yang and
Pandey 2007). This study complements and expands on the extant literature by developing
theoretically grounded hypotheses that consider a broader array of factors that may influence
the likelihood of seeking public input, including the characteristics of the different types of
policies pursued by state agencies, target populations affected by these policies, relative
resourcefulness of the agencies, and the political context in which they operate. By using data
on the participatory patterns within four state level departments, we were able to develop a
more nuanced picture of the drivers behind public managers‘ decision about the forms and the
extent of citizen involvement in administrative decision-making.
The results of the study demonstrate that the concept of social construction of target
populations, developed by Schneider and Ingram (1993), is an important predictor of
participation at state agencies. Our data show that the traditional concept of political power of
organized interests continues to matter: the greater the number of registered lobbying groups
per state, the higher the propensity for citizen involvement in the decision-making at state
agencies. Yet, the effect of groups‘ political power is conditioned upon the way they are
socially perceived: agencies are more likely to invest in participation when the affected groups
are depicted by the general public as deserving rather than when affected populations are
negatively viewed as undeserving.
Since the decision regarding the forms and the extent of participation resides solely with
the agency, we argued here that participation would be more likely when it has the ability to
enhance legitimacy. Negatively constructed or powerless target groups are not suitable for this
role, thus agencies will be more open when their target populations are positively constructed

28
and powerful. Our results confirmed this expectation. This means that although important, the
normative considerations about desirability of citizen inclusion in administration might be
refracted in practice through the instrumental considerations related to the social positing of the
agency and its attempt to lend greater legitimacy to its actions.

29
REFERENCES
Alkadry, Mohamad G. 2003. ―Deliberative Discourse between Citizens and Administrators: If
Citizens Talk, Will Administrators Listen?‖ Administration and Society 35(2): 184–209.
Brown, Steven. 2008. March 2008 Green Report Appendix-State Environmental Budgets and
Budget Plans, FY 2005-2008. Retrieved on April 03, 2010 from
http://www.ecos.org/section/green_reports/
Beierle, Thomas C. and Jerry Cayford. 2002. Democracy in Practice: Public Participation in
Environmental Decisions. Resources for the Future, Washington, DC.
Bryer, Thomas A. 2009. ―Explaining Responsiveness in Collaboration: Administrator and
Citizen Role Perceptions.‖ Public Administration Review 69(2): 271–283.
Devooght, Kerry, Tiffany Allen, and Rob Geen. 2008. Federal, State, and Local Spending to
Address Child Abuse and Neglect in SFY 2006. Retrieved on April 03, 2010 from
http://www.aecf.org/KnowledgeCenter/Publications.aspx?pubguid={307A447F-CB52-
4576-AB99-1EFB0E4FD48F}
Ebdon, Carol. 2000. ―The Relationship between Citizen Involvement in the Budget Process and
City Structure and Culture.‖ Public Productivity and Management Review 23(3): 383–
393.
Ebdon, Carol and Aimee L. Franklin. 2004. ―Searching for a Role for Citizens in the Budget
Process.‖ Public Budgeting and Finance 24 (1): 32–49.
Ebdon, Carol and Aimee L. Franklin. 2006. ―Citizen Participation in Budgeting Theory.‖ Public
Administration Review 66 (3): 437–447.
Elazar, Daniel J. 1972. American Federalism: A View from the States. New York: Thomas Y.
Crowell.
Gormley, William. 1986. ―Regulatory Issue Networks in a Federal System.‖ Polity 18 (4): 595-
620.
Gray, Virginia, David Lowery, Matthew Fellowes, and Andrea McAtee. 2004. ―Public Opinion,
Public policy, and Organized Interests in the American States.‖ Political Research
Quarterly 57(3): 411–420.
Gray, Virginia, and David Lowery. 1996. The Population Ecology of Interest Representation:
lobbying Communities in the American States. Ann Arbor: University of Michigan Press.
Handley, Donna Milam, and Michael Howell-Moroney. 2010. ―Ordering Stakeholder
Relationships and Citizen Participation: Evidence from the Community Development
Block Grant Program.‖ Public Administration Review 70(4): 601–609.

30
Innes, Judith E., and David E. Booher. 2004. ‖Reframing public participation: Strategies for the
21st century.‖ Planning Theory & Practice 5 (4): 419–436.
Irvin, Renée A., and John Stansbury. 2004. ―Citizen Participation in Decision Making: Is it
Worth the Effort?‖ Public Administration Review 64 (1): 55–65.
Kathlene, Lyn and John A. Martin. 1991. ―Enhancing Citizen Participation: Panel Designs,
Perspectives, and Policy Formation.‖ Journal of Policy Analysis and Management 10 (1):
46–63.
King, Cheryl., Simrell, Kathryn M. Fetley, and Bridget O‘Neill Susel. 1998. ―The Question of
Parrticipation: Toward Authentic Public Participation in Public Administration.‖ Public
Administration Review 58 (4): 317–326.
Kweit, Mary G. and Robert W. Kweit. 1984. The Politics of Policy Analysis: The Role of
Citizen Participation in Analytic Decisionmaking. Policy Studies Review 3(2): 234–45.
Lieske, Joel. 1993. ―Regional Subcultures of the United States.‖ Journal of Politics 55(4): 888–
913.
Lowery, David, and Lee Sigelman.1982. ―Political Culture and State Public Policy: The Missing
Link.‖ Western Political Quarterly 35(3): 376–384.
Meier, Kenneth J. 2000. Politics and the Bureaucracy: Policymaking in the Fourth Branch of
Government. 4th
ed. Forth Worth, TX: Harcourt Brace.
Meier, Kenneth J., and Laurence J. O‘Toole, Jr. 2006a. ―Political Control versus Bureaucratic
Values: Reframing the Debate.‖ Public Administration Review 66(2): 177–192.
Meier, Kenneth J., and Laurence J. O‘Toole, Jr. 2006b. Bureaucracy in a Democratic State: A
Governance Perspective. Baltimore, MD: Johns Hopkins University Press.
Moynihan, Donald P. 2003. ―Normative and Instrumental Perspectives on Public Participation:
Citizens Summits in Washington, D.C.‖ American Review of Public Administration
33(2): 164–188.
Nabatchi, Tina. 2010. ―Addressing the Citizenship and Democratic Deficits: The Potential of
Deliberative Democracy for Public Administration.‖ American Review of Public
Administration 40(4): 376-399.
National Association of State Budget Officers. 2006. State Expenditure. Retrieved on April 03,
2010, from http://www.nasbo.org/publications.php
Ringquist, Evan J., Jeff Worsham, and Marc Allen Eisner. 2003. ―Salience, complexity, and the
legislative direction of regulatory bureaucracies.‖ Journal of Public Administration
Research and Theory 13(2): 141–164.
31
Roberts, Nancy. 1997. ―Public Deliberation: An Alternative Approach to Crafting Policy and
Setting Direction.‖ Public Administration Review 57(2): 124–132.
Roberts, Nancy. 2004. ―Public Deliberation in an Era of Direct Citizen Participation.‖ American
Review of Public Administration 34:315–53.
Robbins, Mark D., Bill Simonsen and Barry Feldman. 2008. ―Citizens and Resource Allocation:
Improving Decision Making with Interactive Web-Based Citizen Participation.‖ Public
Administration Review 68 (3): 564-575.
Sirianni, Carmen. 2009. Investing in Democracy: Engaging Citizens in Collaborative
Governance. Washington, DC: Brookings Institution Press.
Schneider, Anne, and Helen Ingram. 1993. ―Social Construction of Target Populations:
Implications for Politics and Policy.‖ American Political Science Review 87(2): 334–347.
Schneider, Anne, and Helen Ingram. 1997. Policy Design for Democracy. Lawrence, KS:
University Press of Kansas.
Stivers, Camila. 1990. The Public Agency as Polis: Active Citizenship in the Administrative
State.‖ Administration and Society 22 (1): 86–105.
Stivers, Camila. 1994. The Listening Bureaucrat: Responsiveness in Public Administration.
Public Administration Review 54(4): 364–369.
Thomas, John Clayton. 1990. ―Public Involvement in Public Management: Adapting and testing
a Borrowed Theory.‖ Public Administration Review 50 (4): 435–445.
Thomas, John Clayton. 1993. ―Public Involvement and Governmental Effectiveness: A
Decision-Making Model for Public Managers.‖ Administration and Society 24(4): 444–
469.
Thomas, John Clayton. 1995. Public Participation in Public Decisions. San Francisco: Jossey-
Bass.
Wang, Xiaohu. 2001. ―Assessing Public Participation in U.S Cities.‖ Public Performance and
Management Review 24(4): 322–336.
Wang, XiaoHu, and Montgomery Van Wart. 2007. When Public Participation in Administration
Leads to Trust: An Empirical Assessment of Managers‘ Perceptions. Public
Administration Review 67 (2):265-278.
Yang, Kaifeng, and Kathe Callahan. 2007. ―Citizen Involvement Efforts and Bureaucratic
Responsiveness: Participatory Values, Stakeholders Pressures, and Administrative
Practicality.‖ Public Administration Review 67(2): 249–264.

32
Yang, Kaifeng and Sanjay K. Pandey. 2007. ―Public Responsiveness of Government
Organizations: Testing a Preliminary Model.‖ Public Performance and Management
Review 31(2): 215–240.

33
Table 1 Description of Additive Citizen Input Index for Four Agencies
State Agency Obs Mean Median Min Max Std
Correction 40 5.83 4 0 28 6.00
Child Protection 39 9.46 7 0 24 6.68
Transportation 39 10.54 8 0 25 7.09
Environment 39 8.46 6 0 25 6.92
Overall 157 8.55 7 0 28 6.85
Table 2 Description of Weighted Citizen Input Index for Four Agencies
State Agency Obs Mean Median Min Max Std
Correction 40 16 10.5 0 70 16.57
Child Protection 39 27.31 21 0 68 18
Transportation 39 31.64 24 0 81 21.21
Environment 39 26.41 18 0 80 21.41
Overall 157 25.28 19 0 81 20.06

34
Table 3 Descriptive Statistics
Variables Mean Std. Min Max
POWER Number of lobbying firms per state
per industry 268.50 188.33 42 529
POSITIVECON Indicator coded as 1 if target group
is positively perceived 0.50 0.50 0 1
BUDSHARE % of agency budget of the total
state budget 3.64 3.59 0.16 15.98
SALIENT % of respondents considering the
issues as most important 0.00 0.01 0 0.013
COMPLEX Indicator coded as 1 for agencies
with complex tasks 0.50 0.50 0 1
POWERPOS
Takes on the value of the power
measure for positively constructed
target groups,
2.17 11.77 0 160
POWERNEG
Takes on the value of the power
measure for negatively constructed
target groups
1.74 7.92 0 101
MORALPOLCULT Moralistic type of state political
culture 0.34 0.47 0 1
INDIVPOLCULT Individualistic type of state political
culture 0.34 0.47 0 1
TRADPOLCULT Traditionalistic type of state
political culture 0.32 0.47 0 1
DGOV
Indicator coded as 1 if the
government is divided and
Governor is from Democratic Party
0.43 0.50 0 1
DEM
Indicator coded 1 if the governor is
Democrat and both houses are
controlled by the Democratic party
0.14 0.35 0 1
REP
Indicator coded as 1 if the governor
is Republican and both houses are
controlled by Republican party
0.24 0.43 0 1

35
* p<0.10,
** p<0.05,
*** p<0.01
Table 4 OLS Regression Results For Weighted Citizen Input
BASE(M1) INTERACTION
BASE (M2) FULL (M3)
INTERACTION
FULL (M4)
POWER 0.11** 0.12**
(0.05) (0.05)
POSITIVECON 11.87*** 11.83*** 16.06*** 16.05***
(3.59) (3.61) (4.70) (4.73)
POWERPOS 0.12** 0.12***
(0.05) (0.04)
POWERNEG 0.09 0.12
(0.09) (0.09)
BUDSHARE 1.98*** 2.00*** 0.30 0.30
(0.61) (0.64) (1.50) (1.55)
SALIENT -1468.36 -1467.77
(1118.70) (1127.14)
COMPLEX 13.56 13.54
(10.15) (10.30)
INDIVPOLCULT 3.09 3.05 4.11 3.09
(3.66) (3.71) (3.75) (3.66)
MORALPOLCULT 8.44* 8.39* 9.35** 9.34**
(4.37) (4.40) (4.24) (4.29)
DGOV -1.99 -1.96 -1.35 -1.35
(3.64) (3.67) (3.43) (3.45)
DEM 5.21 5.17 4.58 4.58
(4.85) (4.89) (4.82) (4.86)
REP -3.18 -3.18 -1.60 -1.60
(5.18) (5.20) (5.16) (5.19)
Intercept 8.86** 8.86** 10.62** 10.62**
(4.12) (4.13) (4.82) (4.84)
N 156 156 156 156 F 3.738 3.399 4.782 4.315
Prob>F 0.0021 0.003 0.0001 0.002 R
2 0.11 0.11 0.13 0.13

36
* p<0.10,
** p<0.05,
*** p<0.01
Table 5 Negative Binomial Results for Additive Citizen Input
(Incident Rate Ratio)
BASE(M5) INTERACTION
BASE (M6) FULL (M7)
INTERACTION
FULL (M8)
POWER 1.00* 1.00**
(0.00) (0.00)
POSITIVECON 1.66*** 1.66*** 1.92*** 1.92***
(0.29) (0.29) (0.43) (0.43)
POWERPOS 1.09*** 1.09*** 1.05 1.05
(0.03) (0.03) (0.06) (0.06)
POWERNEG 1.00** 1.00**
(0.00) (0.00)
BUDSHARE 1.00 1.00
(0.00) (0.00)
SALIENT 0.00 0.00
(0.00) (0.00)
COMPLEXITY 1.32 1.32
(0.53) (0.53)
INDIVPOLCULT 1.12 1.12 1.14 1.14
(0.17) (0.17) (0.17) (0.17)
MORALPOLCULT 1.33 1.33 1.35* 1.35*
(0.23) (0.23) (0.23) (0.23)
DGOV 0.97 0.97 0.99 0.99
(0.15) (0.15) (0.14) (0.14)
DEM 1.26 1.26 1.23 1.23
(0.22) (0.22) (0.22) (0.22)
REP 0.96 0.96 0.99 0.99
(0.22) (0.22) (0.22) (0.22)
N 156 156 156 156 Wald 22.14 22.26 28.93 29.12
Prob>Chi2 0.00466 0.00808 0.00128 0.00218
0.553 0.553 0.548 0.548

37
Note: Models provide coefficients from negative binomial regression estimation; robust clustered standard
errors in parentheses. * p<0.10,
** p<0.05,
*** p<0.01
Table 6 Negative Binomial Results for Additive Citizen Input
BASE(M5) INTERACTION
BASE (M6) FULL (M7)
INTERACTION
FULL (M8)
POWER 0.004* 0.004**
(0.002) (0.002)
POSITIVECON 0.508*** 0.507*** 0.653*** 0.653***
(0.173) (0.174) (0.224) (0.225)
POWERPOS 0.088*** 0.089*** 0.051 0.051
(0.024) (0.025) (0.055) (0.057)
POWERNEG 0.004** 0.004**
(0.002) (0.002)
BUDSHARE 0.004 0.004
(0.003) (0.003)
SALIENT -39.722 -39.710
(43.953) (43.992)
COMPLEXITY 0.280 0.280
(0.398) (0.401)
INDIVPOLCULT 0.111 0.110 0.131 0.130
(0.150) (0.152) (0.147) (0.149)
MORALPOLCULT 0.286 0.286 0.303* 0.303*
(0.175) (0.175) (0.172) (0.172)
DGOV -0.035 -0.034 -0.011 -0.010
(0.151) (0.151) (0.146) (0.146)
DEM 0.228 0.228 0.208 0.208
(0.172) (0.173) (0.176) (0.176)
REP -0.045 -0.045 -0.010 -0.010
(0.230) (0.230) (0.226) (0.226)
Intercept 1.390*** 1.390*** 1.438*** 1.438***
(0.196) (0.196) (0.212) (0.212) N 156 156 156 156 Wald 22.14 22.26 28.93 29.12
Prob>Chi2 0.00466 0.00808 0.00128 0.00218
0.553 0.553 0.548 0.548