Embed Size (px)
Citation preview
EXPLAINING THE PRICE OF VOLUNTARY CARBON OFFSETS
MARC N. CONTE
Stanford University, Stanford, CA 94305, [email protected]
MATTHEW J. KOTCHEN
Yale University and NBER, New Haven, CT 06511, [email protected]
This paper identifies factors that explain the large variability in the price of voluntary carbonoffsets. We estimate hedonic price functions using a variety of provider- and project-levelcharacteristics as explanatory variables. We find that providers located in Europe sell offsets atprices that are approximately 30% higher than providers located in either North America orAustralasia. Contrary to what one might expect, offset prices are generally higher, by roughly20%, when projects are located in developing or least-developed nations. But this result doesnot hold for forestry-based projects. We find evidence that forestry-based offsets sell at lowerprices, and the result is particularly strong when projects are located in developing or least-developed nations. Offsets that are certified under the Clean Development Mechanism or theGold Standard, and therefore qualify for emission reductions under the Kyoto Protocol, sell at apremium of more than 30%; however, third-party certification from the Voluntary CarbonStandard, one of the popular certifiers, is associated with a price discount. Variables that have noeffect on offset prices are the number of projects that a provider manages and a provider’s statusas for-profit or not-for-profit.
Keywords: Voluntary carbon offsets; hedonic price method.
1. Introduction
There is widespread agreement on the need to reduce greenhouse gas (GHG) emissionsin order to mitigate the effects of global climate change, and attention is now focusedon setting emission targets and designing policies to help achieve them. The uniqueand difficult challenges associated with the design and implementation of GHG pol-icies are well-known and have given rise to a substantial academic literature (see, forexample, Aldy and Stavins, 2007). Among the significant challenges that must beovercome are concerns about the high costs of compliance and distributional equity. Inresponse to these concerns, nearly all GHG policies — regardless of whether they areimplemented at the regional, national, or international level — allow offsets to counttoward emission reductions. Moreover, while GHG policies struggle to address theseissues, a substantial market for voluntary carbon offsets has developed to allow
Climate Change Economics, Vol. 1, No. 2 (2010) 93–111© World Scientific Publishing CompanyDOI: 10.1142/S2010007810000091
93
emission-producing firms and individuals to reduce their carbon footprints even whennot required by law.
Offsets are based on the idea that agents need not reduce their own emissions inorder to reduce the amount of GHGs in the atmosphere; instead, they can pay someoneelse to reduce emissions and achieve the same effect on atmospheric concentrations.Agents prefer offsets, of course, if the payment required is less than their ownabatement costs. Though often controversial for reasons that we discuss below, offsetswork in principle because GHGs are uniformly mixed pollutants in the globalatmosphere, and the location of emissions (or reductions) has no effect on the impact ofclimate change. Only the net effect on overall GHG emissions is what matters.Typically, offsets arise through investments in renewable energy, energy efficiency,reforestation, or other projects that reduce emissions or sequester GHGs. Thoughusually referred to as “carbon offsets”, many projects focus on other GHGs, such asprojects based on biomass and industrial methane capture, and emission reductions aremeasured in carbon dioxide equivalent units (CO2e).
Carbon offsets provide the basis for two of the Kyoto Protocol’s primary mech-anisms for reducing GHG emissions in the context of an international environmentalagreement. Under Joint Implementation (JI), industrialized nations can purchase car-bon credits (effectively offsets) from emission-reducing projects located in otherindustrialized nations or nations with transition economies.1 Under the Clean Devel-opment Mechanism (CDM), industrialized countries can purchase offsets in much thesame way, though CDM credits are acquired through the finance of projects indeveloping nations.2 Questions about offsets are also playing a pivotal role in deter-mining the future of emission regulation in the United States. Recent drafts of suchlegislation, for example, allow businesses to offset up to 30% or 63% of their emissions(H.R. 2454).3
In a regulated setting, economic theory makes a clear prediction about whatdetermines the price of a carbon offset, assuming the offset market is perfectly com-petitive. Regardless of the means by which the offset occurs, the price will be deter-mined by the intersection of the marginal abatement costs of regulated entities and themarginal costs of abatement through offset projects. In this context, offsets would beexpected to follow the “law of one price”. In the market for voluntary carbon offsets,however, the way in which prices are determined is less clear. Driven by “purevoluntary” or “pre-compliance” buyers, private firms purchased 66% of the voluntary
1See Michaelowa (1998, 2002) for discussion of the challenges facing JI projects, with particular emphasis on baselinedefinition and information asymmetry between buyers and sellers.2See Victor et al. (2005), Wara (2007), and Wara and Victor (2008) for a series of papers that describe and critique theKyoto’s Protocol’s CDM.3Further along in the United States are state and regional policies, including the noteworthy examples of California’sAB 32 and the Regional Greenhouse Gas Initiative (RGGI) of 10 Northeastern and Mid-Atlantic states. Whilenegotiations are still underway about the amount of offsets that will be allowed under California’s AB 32, participants inthe RGGI are allowed to offset up to 10% of their emission reductions, depending on the price of permits in a cap-and-trade program.
94 M. N. Conte & M. J. Kotchen
offset volume in 2008, with corporate social responsibility and public relations themost common motivation (Hamilton et al., 2009). It follows that voluntary carbonoffsets are impure public goods based on the joint production of private and publiccharacteristics (Kotchen, 2006). Unlike offsets in a regulatory setting, therefore, offsetprices in the voluntary market may reflect not only marginal costs, but also preferencesfor a broader bundle of characteristics. For instance, above and beyond the desire toreduce GHG emissions, private firms and/or individuals may purchase offsets forassociated co-benefits such as poverty alleviation and biodiversity conservation. Theseco-benefits, while public goods unto themselves, may be provided because of privateincentives in the form of favorable public relations and reputation effects, giving rise toso-called “charismatic carbon”.
It is increasingly common for businesses, organizations, and individuals to volun-tarily purchase carbon offsets. According to Hamilton et al. (2009), the number ofoffsets traded in the voluntary, over-the-counter market increased by 87% from 2007 to2008, and transactions totaled 124.3 million metric tons of CO2e. While the quantity ofGHG reductions from voluntary offsets is relatively modest, representing 3% of theoffsets traded in regulated markets, the money being spent is not trivial. Expendituresin the voluntary market totaled more than US$700 million in 2008 alone, and forecastspredict further expansion of the market. Among businesses, organizations, and indi-viduals, the motives for voluntary offsets include not only strategies for corporateenvironmental management and public relations, but also the desire for guilt alleviation(see Kotchen, 2009a; 2009b). Along with the increased popularity of voluntary offsets,however, have come calls for more oversight of the market. In the United States, theFederal Trade Commission (FTC) has begun investigating concerns about the marketand whether there is a need for greater consumer protection.
In both regulatory and voluntary settings, offsets generate controversy. Despite thecost savings, there are those who object in principle to the idea of paying someone elseto reduce emissions, rather than doing it oneself. More pragmatic concerns tend tofocus on whether carbon offsets are additional, permanent, and credible. Offsets areadditional only if the project reduces emissions relative to an established baseline levelof emissions, typically meaning that the reductions would not have occurred withoutthe offset payment. Though the idea of establishing additionality is simple in theory,the practice of determining baseline trends against which to compare offset projects is achallenging problem without clear guidelines. There are also concerns about thepermanence of emission reductions or sequestration, particularly when it comes toforestry-based offsets, which are subject to future uncertainty about land use, foresthealth, and the risk of fire. These issues have led some to argue that the price offorestry-based offsets should be discounted to reflect the inherent uncertainty of suchprojects (Pfaff et al., 2000; Kim, McCarl and Murray, 2008). Further issues arisebecause of asymmetric information. Offset providers know a lot about the projects inwhich they invest, but offset buyers know only what the providers tell them. Theasymmetry gives rise to a standard source of market failure. Consequently, many
Explaining the Price of Voluntary Carbon Offsets 95
third-party organizations have emerged, particularly in the voluntary market, to setstandards, audit projects, and verify whether offset providers are delivering on thequality and quantity of their claims.
The present paper seeks to further the understanding of underlying patterns in themarket for voluntary carbon offsets. We focus on a fundamental question: Whatexplains the price of voluntary carbon offsets? To answer this question, we estimatehedonic price functions that focus on characteristics of offset providers and offsetprojects themselves. Characteristics of the offset providers that we consider includegeographic location, status as for-profit or not-for-profit, and size in terms of thenumber of projects being managed. Detailed data on specific offset projects include thenation in which the project is located, different types of third-party certification, andthe mechanism by which the project reduces emissions (wind, solar, biomass, forestry,etc.). Our primary source of data is the Carbon Catalog (CC), which is the mostcomprehensive online directory that provides detailed information on carbon offsetproviders and projects worldwide. The complete dataset consists of information on97 offset providers and 280 offset projects.
Some of the main findings of our econometric analysis include the following:Providers located in Europe sell offsets at prices that are approximately 30% higherthan providers located elsewhere. Contrary to what one might expect, offset prices arehigher, by roughly 20%, when projects are located in developing or least-developednations. We find evidence that forestry-based offsets sell at lower prices, and the resultis particularly strong when the projects are located in developing or least-developednations. Offsets that are certified to qualify under the Kyoto Protocol sell at a premiumof more than 30%, while third-party certification from the Voluntary Carbon Standard(VCS), one of the largest certifiers, is associated with a price discount of nearly 25%.
In the next section, we describe the data used in our analysis and report descriptivestatistics that characterize the market for voluntary carbon offsets. Section 3 describesour empirical methods and the results of our econometric analysis at both the provider-and project-level. We then discuss the results along with more general policy impli-cations in Section 4. Finally, Section 5 summarizes and concludes.
2. Data
The Carbon Catalog (CC) is our primary source of data. CC is a publicly available,online directory that provides the most comprehensive and up-to-date information oncarbon offset providers and projects worldwide.4 CC is a freely available service thatdoes not sell carbon offsets and whose mission is simply to increase transparency inthe market. Our dataset includes all providers and projects listed on CC through
4All information about the Carbon Catalog (CC), including most of the data used in this paper, is available at thefollowing url: http://www.carboncatalog.org.
96 M. N. Conte & M. J. Kotchen
December 2008. The complete dataset includes observations on 97 offset providersand 280 offset projects.
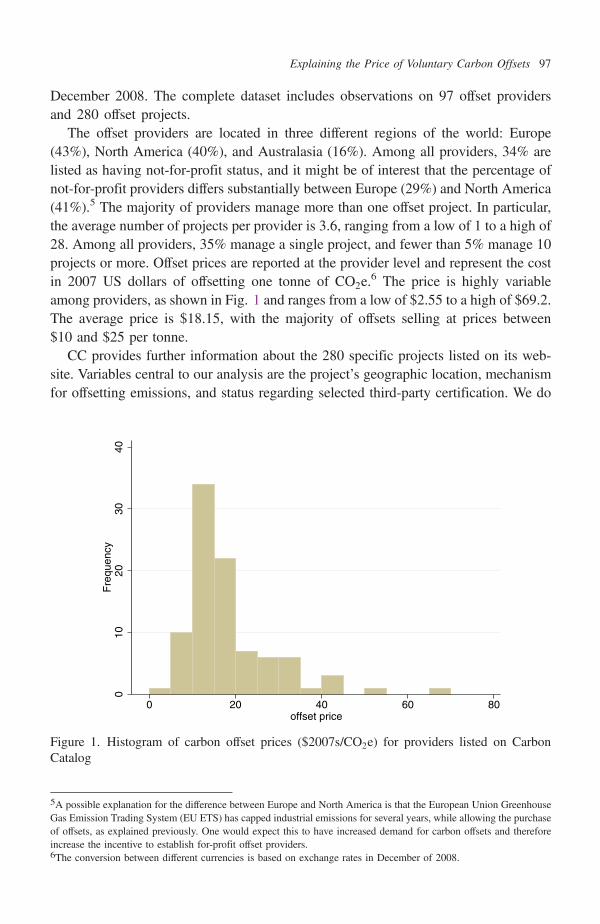
The offset providers are located in three different regions of the world: Europe(43%), North America (40%), and Australasia (16%). Among all providers, 34% arelisted as having not-for-profit status, and it might be of interest that the percentage ofnot-for-profit providers differs substantially between Europe (29%) and North America(41%).5 The majority of providers manage more than one offset project. In particular,the average number of projects per provider is 3.6, ranging from a low of 1 to a high of28. Among all providers, 35% manage a single project, and fewer than 5% manage 10projects or more. Offset prices are reported at the provider level and represent the costin 2007 US dollars of offsetting one tonne of CO2e.
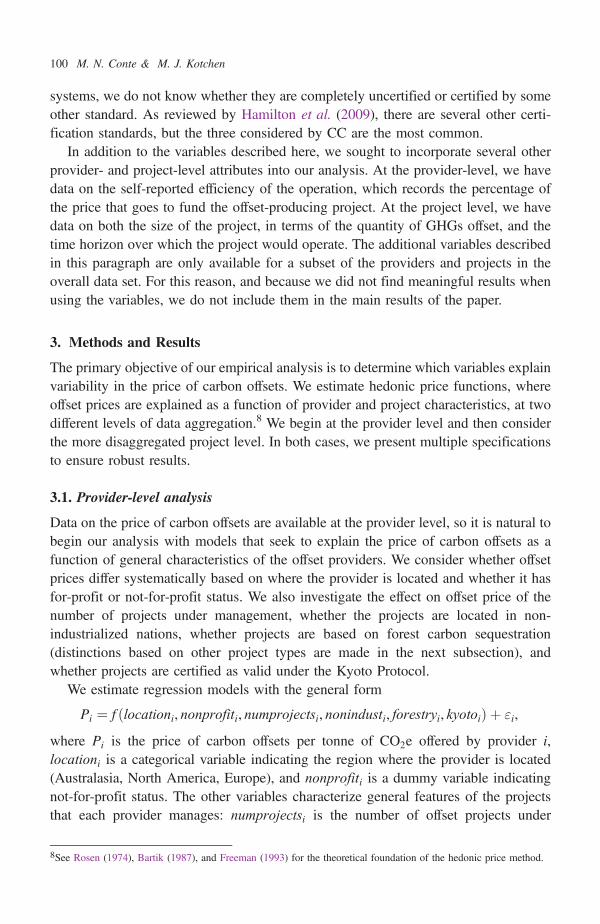
6 The price is highly variableamong providers, as shown in Fig. 1 and ranges from a low of $2.55 to a high of $69.2.The average price is $18.15, with the majority of offsets selling at prices between$10 and $25 per tonne.
CC provides further information about the 280 specific projects listed on its web-site. Variables central to our analysis are the project’s geographic location, mechanismfor offsetting emissions, and status regarding selected third-party certification. We do
5A possible explanation for the difference between Europe and North America is that the European Union GreenhouseGas Emission Trading System (EU ETS) has capped industrial emissions for several years, while allowing the purchaseof offsets, as explained previously. One would expect this to have increased demand for carbon offsets and thereforeincrease the incentive to establish for-profit offset providers.6The conversion between different currencies is based on exchange rates in December of 2008.
010
2030
40F
requ
ency
0 20 40 60 80offset price
Figure 1. Histogram of carbon offset prices ($2007s/CO2e) for providers listed on CarbonCatalog
Explaining the Price of Voluntary Carbon Offsets 97
not, however, observe offset prices at the project level. This is because providers thatmanage more than one project do not typically sell offsets for different pricesdepending on the particular project. Instead, a provider typically has one price thatreflects its portfolio of projects, and our analysis accounts for this feature of the data.
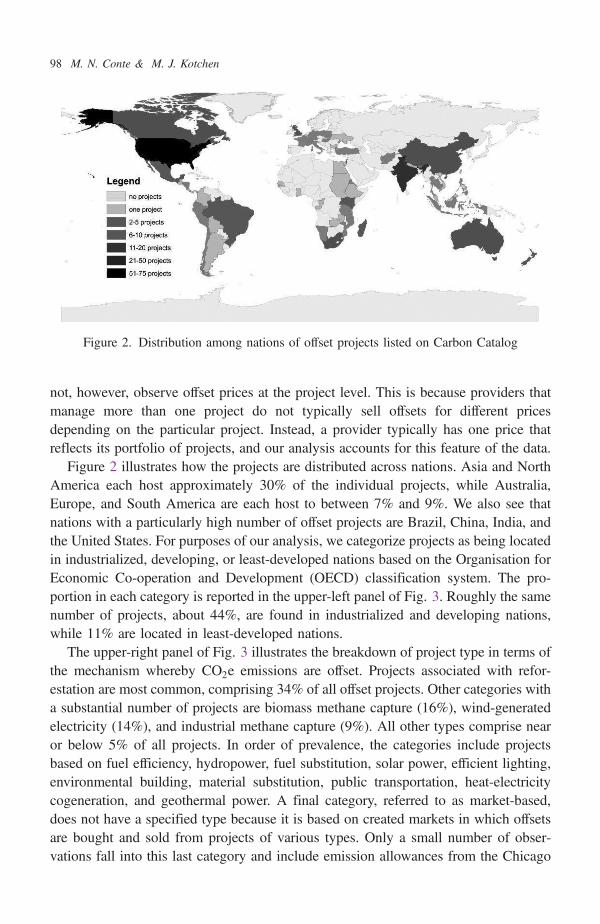
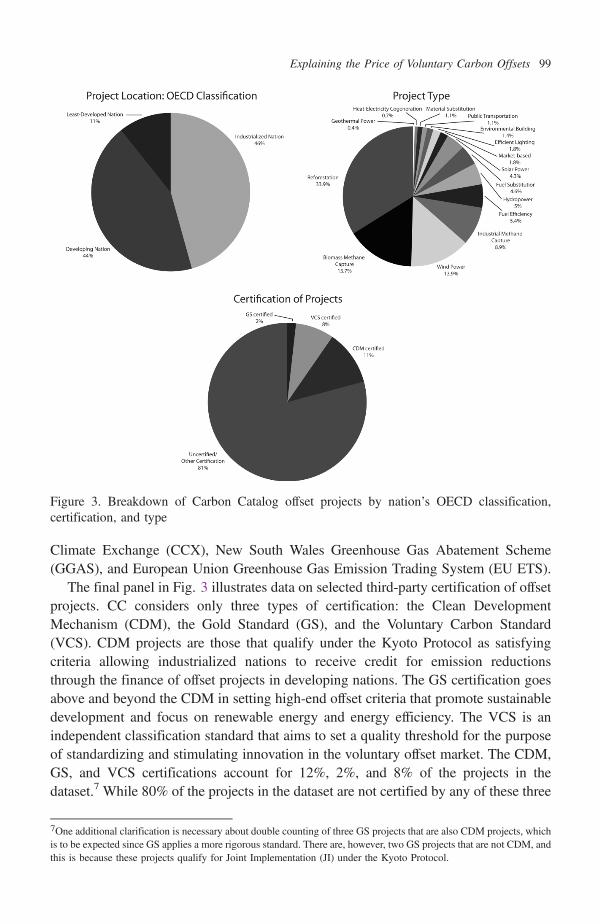
Figure 2 illustrates how the projects are distributed across nations. Asia and NorthAmerica each host approximately 30% of the individual projects, while Australia,Europe, and South America are each host to between 7% and 9%. We also see thatnations with a particularly high number of offset projects are Brazil, China, India, andthe United States. For purposes of our analysis, we categorize projects as being locatedin industrialized, developing, or least-developed nations based on the Organisation forEconomic Co-operation and Development (OECD) classification system. The pro-portion in each category is reported in the upper-left panel of Fig. 3. Roughly the samenumber of projects, about 44%, are found in industrialized and developing nations,while 11% are located in least-developed nations.
The upper-right panel of Fig. 3 illustrates the breakdown of project type in terms ofthe mechanism whereby CO2e emissions are offset. Projects associated with refor-estation are most common, comprising 34% of all offset projects. Other categories witha substantial number of projects are biomass methane capture (16%), wind-generatedelectricity (14%), and industrial methane capture (9%). All other types comprise nearor below 5% of all projects. In order of prevalence, the categories include projectsbased on fuel efficiency, hydropower, fuel substitution, solar power, efficient lighting,environmental building, material substitution, public transportation, heat-electricitycogeneration, and geothermal power. A final category, referred to as market-based,does not have a specified type because it is based on created markets in which offsetsare bought and sold from projects of various types. Only a small number of obser-vations fall into this last category and include emission allowances from the Chicago
Figure 2. Distribution among nations of offset projects listed on Carbon Catalog
98 M. N. Conte & M. J. Kotchen
Climate Exchange (CCX), New South Wales Greenhouse Gas Abatement Scheme(GGAS), and European Union Greenhouse Gas Emission Trading System (EU ETS).
The final panel in Fig. 3 illustrates data on selected third-party certification of offsetprojects. CC considers only three types of certification: the Clean DevelopmentMechanism (CDM), the Gold Standard (GS), and the Voluntary Carbon Standard(VCS). CDM projects are those that qualify under the Kyoto Protocol as satisfyingcriteria allowing industrialized nations to receive credit for emission reductionsthrough the finance of offset projects in developing nations. The GS certification goesabove and beyond the CDM in setting high-end offset criteria that promote sustainabledevelopment and focus on renewable energy and energy efficiency. The VCS is anindependent classification standard that aims to set a quality threshold for the purposeof standardizing and stimulating innovation in the voluntary offset market. The CDM,GS, and VCS certifications account for 12%, 2%, and 8% of the projects in thedataset.7 While 80% of the projects in the dataset are not certified by any of these three
Figure 3. Breakdown of Carbon Catalog offset projects by nation’s OECD classification,certification, and type
7One additional clarification is necessary about double counting of three GS projects that are also CDM projects, whichis to be expected since GS applies a more rigorous standard. There are, however, two GS projects that are not CDM, andthis is because these projects qualify for Joint Implementation (JI) under the Kyoto Protocol.
Explaining the Price of Voluntary Carbon Offsets 99
systems, we do not know whether they are completely uncertified or certified by someother standard. As reviewed by Hamilton et al. (2009), there are several other certi-fication standards, but the three considered by CC are the most common.
In addition to the variables described here, we sought to incorporate several otherprovider- and project-level attributes into our analysis. At the provider-level, we havedata on the self-reported efficiency of the operation, which records the percentage ofthe price that goes to fund the offset-producing project. At the project level, we havedata on both the size of the project, in terms of the quantity of GHGs offset, and thetime horizon over which the project would operate. The additional variables describedin this paragraph are only available for a subset of the providers and projects in theoverall data set. For this reason, and because we did not find meaningful results whenusing the variables, we do not include them in the main results of the paper.
3. Methods and Results
The primary objective of our empirical analysis is to determine which variables explainvariability in the price of carbon offsets. We estimate hedonic price functions, whereoffset prices are explained as a function of provider and project characteristics, at twodifferent levels of data aggregation.8 We begin at the provider level and then considerthe more disaggregated project level. In both cases, we present multiple specificationsto ensure robust results.
3.1. Provider-level analysis
Data on the price of carbon offsets are available at the provider level, so it is natural tobegin our analysis with models that seek to explain the price of carbon offsets as afunction of general characteristics of the offset providers. We consider whether offsetprices differ systematically based on where the provider is located and whether it hasfor-profit or not-for-profit status. We also investigate the effect on offset price of thenumber of projects under management, whether the projects are located in non-industrialized nations, whether projects are based on forest carbon sequestration(distinctions based on other project types are made in the next subsection), andwhether projects are certified as valid under the Kyoto Protocol.
We estimate regression models with the general form
Pi ¼ f ðlocationi, nonprofiti, numprojectsi, nonindusti, forestryi, kyotoiÞ þ "i,
where Pi is the price of carbon offsets per tonne of CO2e offered by provider i,locationi is a categorical variable indicating the region where the provider is located(Australasia, North America, Europe), and nonprofiti is a dummy variable indicatingnot-for-profit status. The other variables characterize general features of the projectsthat each provider manages: numprojectsi is the number of offset projects under
8See Rosen (1974), Bartik (1987), and Freeman (1993) for the theoretical foundation of the hedonic price method.
100 M. N. Conte & M. J. Kotchen
management, nonindusti is the proportion of projects located in either developing orleast-developed nations, forestryi is the proportion of projects with forestry-basedcarbon sequestration, and kyotoi is the proportion of projects that have CDM or GScertification.9 Finally, "i is an error term assumed to be normally distributed. Weestimate linear and log-linear specifications using ordinary least squares (OLS). Forreasons described below, we also estimate models in which the project-related vari-ables are defined in an alternative way as dummy variables indicating, respectively,whether the provider manages more than one project, whether all projects are locatedin non-industrialized nations, whether all projects are forestry-based, and whether allprojects qualify for inclusion in the Kyoto Protocol.
The empirical model is useful for testing several prior expectations about how thedifferent variables affect offset prices. With increasing returns to scale, providers with agreater number of projects would have lower prices. Given that one justification foroffsets in developing nations is to take advantage of low-cost emission reductions, onemight expect that prices would be lower for providers located in these nations. Greaterdemand for offsets certified under the Kyoto Protocol combined with more costlyrequirements means that providers with more projects certified would be expected tosell at higher prices. Other variables in the model are not associated with clear priorsabout their expected sign, as plausible factors affecting supply, demand, or both couldcause prices to be higher or lower. Nevertheless, based on hedonic price theory, if weobserve higher prices for some offset providers, then it must be true at the equilibriumquantities that their offsets are more expensive to produce (have higher marginal costs)and are more desirable to consumers (have higher marginal benefits).
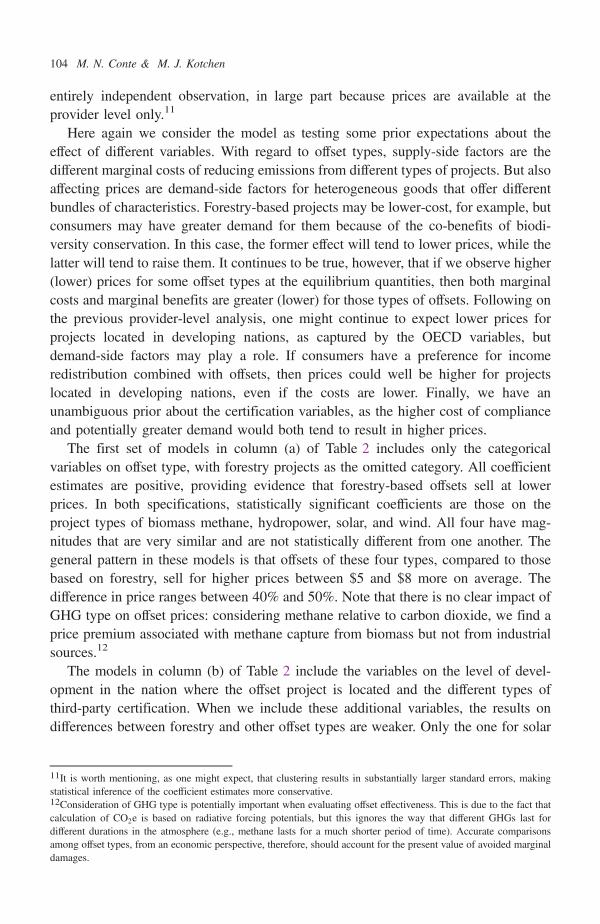
Table 1 reports the results of all provider-level regression models. The linear andlog-linear models in column (a) are the specifications with project-level variables asdefined initially. We find evidence that a provider’s location does have an effect on theprice it charges. Offset providers based in North America sell offsets at lower pricesthan those based in Europe. The difference is statistically significant and, according tothe two models, suggests a price discount in North America of $6.91 on average, or adifference of 29%. We also find evidence, with statistical significance in the linearspecification, that prices charged by providers located in Australasia are lower thanthose located in Europe. In this case, the difference is roughly $5.94, or 25% onaverage. There is no statistically significant difference between offset prices of pro-viders located in North America and Australasia.
Another result with statistical significance relates to the effect of CDM or GScertification, which as described above, implies that a project meets certificationstandards and generates offsets that qualify for emission reductions under the KyotoProtocol. Based on the linear model, the result is interpreted such that a 10% increase
9We do not account for VCS certification in the provider-level analysis. The reason is that CC does not report atransparency measure for providers that includes VCS certification. We did, however, separately collect data from CCon VCS certification and include it in our subsequent project-level analysis.
Explaining the Price of Voluntary Carbon Offsets 101
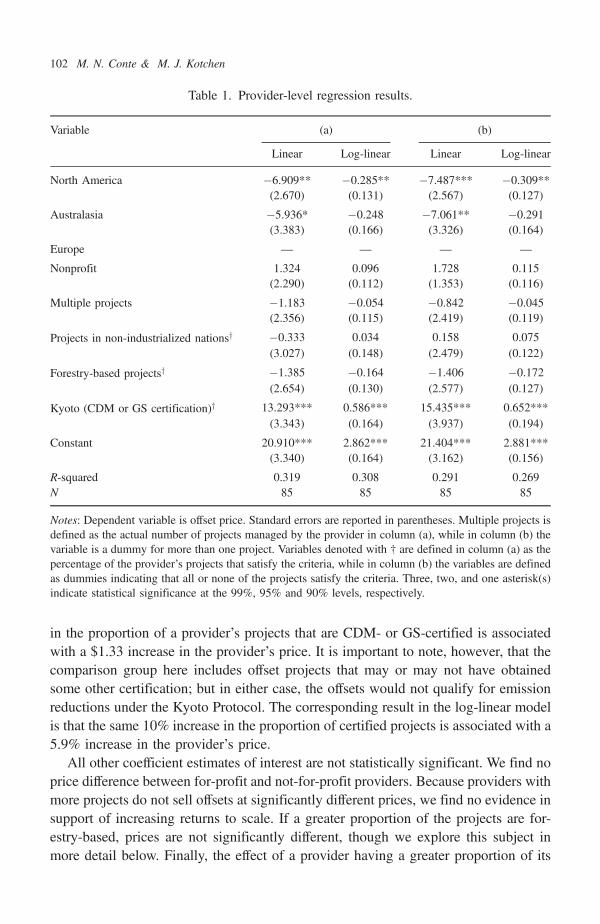
in the proportion of a provider’s projects that are CDM- or GS-certified is associatedwith a $1.33 increase in the provider’s price. It is important to note, however, that thecomparison group here includes offset projects that may or may not have obtainedsome other certification; but in either case, the offsets would not qualify for emissionreductions under the Kyoto Protocol. The corresponding result in the log-linear modelis that the same 10% increase in the proportion of certified projects is associated with a5.9% increase in the provider’s price.
All other coefficient estimates of interest are not statistically significant. We find noprice difference between for-profit and not-for-profit providers. Because providers withmore projects do not sell offsets at significantly different prices, we find no evidence insupport of increasing returns to scale. If a greater proportion of the projects are for-estry-based, prices are not significantly different, though we explore this subject inmore detail below. Finally, the effect of a provider having a greater proportion of its
Table 1. Provider-level regression results.
Variable (a) (b)
Linear Log-linear Linear Log-linear
North America �6.909** �0.285** �7.487*** �0.309**(2.670) (0.131) (2.567) (0.127)
Australasia �5.936* �0.248 �7.061** �0.291(3.383) (0.166) (3.326) (0.164)
Europe — — — —
Nonprofit 1.324 0.096 1.728 0.115(2.290) (0.112) (1.353) (0.116)
Multiple projects �1.183 �0.054 �0.842 �0.045(2.356) (0.115) (2.419) (0.119)
Projects in non-industrialized nationsy �0.333 0.034 0.158 0.075(3.027) (0.148) (2.479) (0.122)
Forestry-based projectsy �1.385 �0.164 �1.406 �0.172(2.654) (0.130) (2.577) (0.127)
Kyoto (CDM or GS certification)y 13.293*** 0.586*** 15.435*** 0.652***(3.343) (0.164) (3.937) (0.194)
Constant 20.910*** 2.862*** 21.404*** 2.881***(3.340) (0.164) (3.162) (0.156)
R-squared 0.319 0.308 0.291 0.269N 85 85 85 85
Notes: Dependent variable is offset price. Standard errors are reported in parentheses. Multiple projects isdefined as the actual number of projects managed by the provider in column (a), while in column (b) thevariable is a dummy for more than one project. Variables denoted with † are defined in column (a) as thepercentage of the provider’s projects that satisfy the criteria, while in column (b) the variables are definedas dummies indicating that all or none of the projects satisfy the criteria. Three, two, and one asterisk(s)indicate statistical significance at the 99%, 95% and 90% levels, respectively.
102 M. N. Conte & M. J. Kotchen
projects in developing or least-developed nations has no effect on price, despite therationale for low-cost emission reductions in developing nations.
The models in column (b) differ because of variable definitions. As describedabove, we redefine numprojectsi as a dummy variable indicating more than one pro-ject, and the variables nonindusti, forestryi, and kyotoi are indicators for whether 100%of the provider’s projects satisfy the respective categorization. We estimate thesemodels to test whether prices are different for the providers with more uniform criteriafor their projects. The information presented for transparency on CC is also formattedin this way. When compared with the models in column (a), the results also provide arobustness check. In general, both sets of models produce very similar results in termsof the sign and statistical significance of coefficient estimates. The new specificationsproduce larger magnitudes on the provider location results, but none of the redefinedvariables comes through differently with statistical significance. The interpretation ofthe coefficient on kyotoi, however, has a sharper interpretation: providers that obtainCDM or GS certification for all their projects, compared to those that obtain it forsome or none of their projects, set offset prices higher by $15.44. Based on the log-linear specification, this is an average mark-up of 65%.
3.2. Project-level analysis
The price of a carbon offset is determined at the provider level, but as we have seen, themajority of providers manage more than one offset project, with the average being 3.6.We now estimate hedonic price functions that take advantage of the more detailed dataon individual offset projects.
We begin with estimation of regression models that have the general form
Pi ¼ f ðoffsettypeij,OECDij, kyotoij,VCSijÞ þ "ij,
where the subscript i continues to index providers and j indexes projects. offsettypeij isa categorical variable indicating a project’s mechanism for offsetting emissions, whichwe aggregate into seven categories: forestry, industrial methane, biomass methane,wind, hydropower, solar, and other.10 OECDij is a categorical variable indicatingwhether the project is located in a nation with the OECD’s classification of industri-alized, developing, or least-developed. kyotoij is a dummy variable for whether theproject has CDM or GS certification, and therefore qualifies for emission reductionsunder the Kyoto Protocol. VCSij is a dummy variable for whether the project hasobtained third-party certification from the Voluntary Carbon Standard. Finally, "ij is anormally distributed error term. We again estimate and report both linear and log-linearspecifications. For the project-level analysis, however, we report standard errors thatare clustered at the provider level. This accounts for the fact that each project is not an
10The miscellaneous other category includes offsets in the categories mentioned previously as fuel efficiency, hydro-power, fuel substitution, efficient lighting, environmental building, material substitution, public transportation, geo-thermal power, heat-electricity cogeneration, and market-based.
Explaining the Price of Voluntary Carbon Offsets 103
entirely independent observation, in large part because prices are available at theprovider level only.11
Here again we consider the model as testing some prior expectations about theeffect of different variables. With regard to offset types, supply-side factors are thedifferent marginal costs of reducing emissions from different types of projects. But alsoaffecting prices are demand-side factors for heterogeneous goods that offer differentbundles of characteristics. Forestry-based projects may be lower-cost, for example, butconsumers may have greater demand for them because of the co-benefits of biodi-versity conservation. In this case, the former effect will tend to lower prices, while thelatter will tend to raise them. It continues to be true, however, that if we observe higher(lower) prices for some offset types at the equilibrium quantities, then both marginalcosts and marginal benefits are greater (lower) for those types of offsets. Following onthe previous provider-level analysis, one might continue to expect lower prices forprojects located in developing nations, as captured by the OECD variables, butdemand-side factors may play a role. If consumers have a preference for incomeredistribution combined with offsets, then prices could well be higher for projectslocated in developing nations, even if the costs are lower. Finally, we have anunambiguous prior about the certification variables, as the higher cost of complianceand potentially greater demand would both tend to result in higher prices.
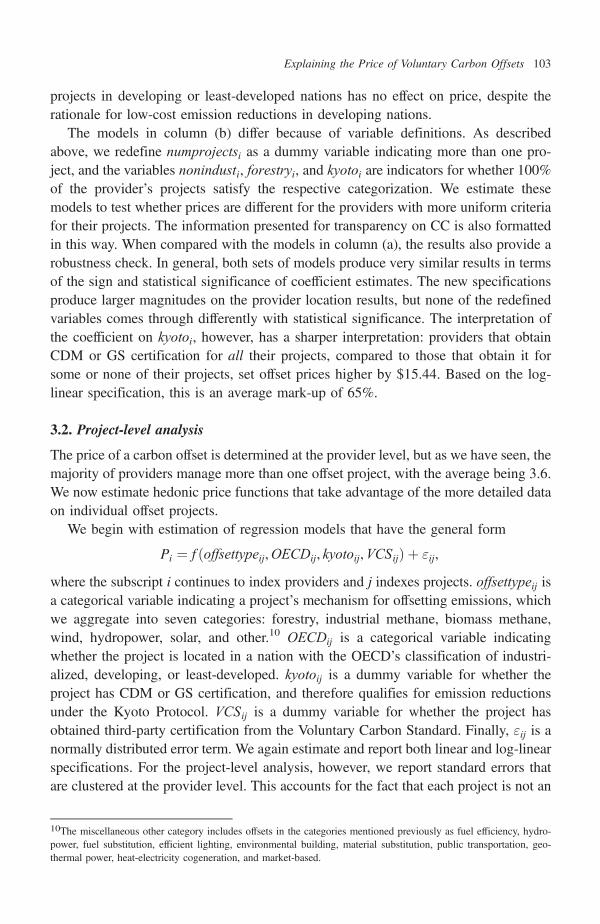
The first set of models in column (a) of Table 2 includes only the categoricalvariables on offset type, with forestry projects as the omitted category. All coefficientestimates are positive, providing evidence that forestry-based offsets sell at lowerprices. In both specifications, statistically significant coefficients are those on theproject types of biomass methane, hydropower, solar, and wind. All four have mag-nitudes that are very similar and are not statistically different from one another. Thegeneral pattern in these models is that offsets of these four types, compared to thosebased on forestry, sell for higher prices between $5 and $8 more on average. Thedifference in price ranges between 40% and 50%. Note that there is no clear impact ofGHG type on offset prices: considering methane relative to carbon dioxide, we find aprice premium associated with methane capture from biomass but not from industrialsources.12
The models in column (b) of Table 2 include the variables on the level of devel-opment in the nation where the offset project is located and the different types ofthird-party certification. When we include these additional variables, the results ondifferences between forestry and other offset types are weaker. Only the one for solar
11It is worth mentioning, as one might expect, that clustering results in substantially larger standard errors, makingstatistical inference of the coefficient estimates more conservative.12Consideration of GHG type is potentially important when evaluating offset effectiveness. This is due to the fact thatcalculation of CO2e is based on radiative forcing potentials, but this ignores the way that different GHGs last fordifferent durations in the atmosphere (e.g., methane lasts for a much shorter period of time). Accurate comparisonsamong offset types, from an economic perspective, therefore, should account for the present value of avoided marginaldamages.
104 M. N. Conte & M. J. Kotchen
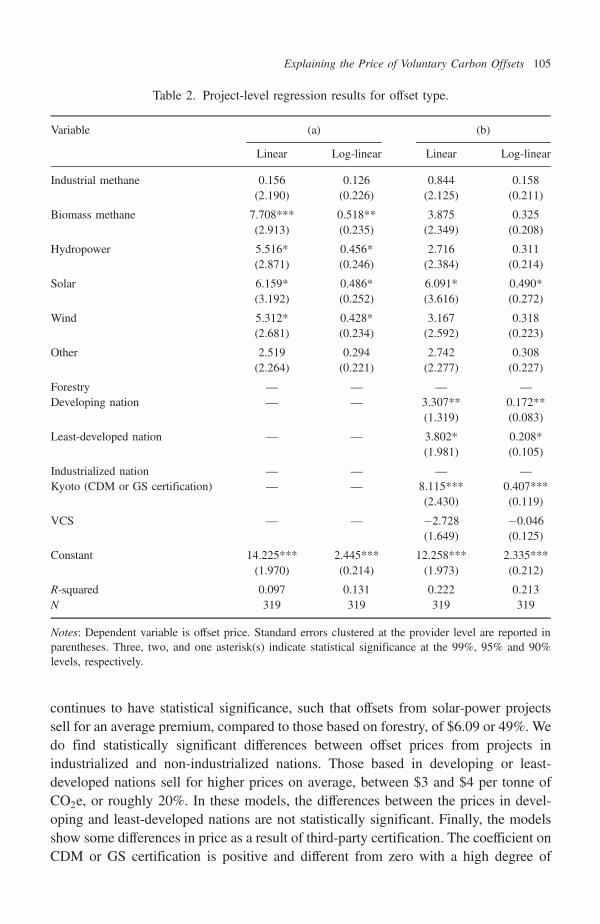
continues to have statistical significance, such that offsets from solar-power projectssell for an average premium, compared to those based on forestry, of $6.09 or 49%. Wedo find statistically significant differences between offset prices from projects inindustrialized and non-industrialized nations. Those based in developing or least-developed nations sell for higher prices on average, between $3 and $4 per tonne ofCO2e, or roughly 20%. In these models, the differences between the prices in devel-oping and least-developed nations are not statistically significant. Finally, the modelsshow some differences in price as a result of third-party certification. The coefficient onCDM or GS certification is positive and different from zero with a high degree of
Table 2. Project-level regression results for offset type.
Variable (a) (b)
Linear Log-linear Linear Log-linear
Industrial methane 0.156 0.126 0.844 0.158(2.190) (0.226) (2.125) (0.211)
Biomass methane 7.708*** 0.518** 3.875 0.325(2.913) (0.235) (2.349) (0.208)
Hydropower 5.516* 0.456* 2.716 0.311(2.871) (0.246) (2.384) (0.214)
Solar 6.159* 0.486* 6.091* 0.490*(3.192) (0.252) (3.616) (0.272)
Wind 5.312* 0.428* 3.167 0.318(2.681) (0.234) (2.592) (0.223)
Other 2.519 0.294 2.742 0.308(2.264) (0.221) (2.277) (0.227)
Forestry — — — —
Developing nation — — 3.307** 0.172**(1.319) (0.083)
Least-developed nation — — 3.802* 0.208*(1.981) (0.105)
Industrialized nation — — — —
Kyoto (CDM or GS certification) — — 8.115*** 0.407***(2.430) (0.119)
VCS — — �2.728 �0.046(1.649) (0.125)
Constant 14.225*** 2.445*** 12.258*** 2.335***(1.970) (0.214) (1.973) (0.212)
R-squared 0.097 0.131 0.222 0.213N 319 319 319 319
Notes: Dependent variable is offset price. Standard errors clustered at the provider level are reported inparentheses. Three, two, and one asterisk(s) indicate statistical significance at the 99%, 95% and 90%levels, respectively.
Explaining the Price of Voluntary Carbon Offsets 105
statistical significance, in parallel with the results of the provider-level analysis. Pro-jects with certification that qualifies them for emission reductions under the KyotoProtocol sell for an average premium of $8.12 or approximately 41%.
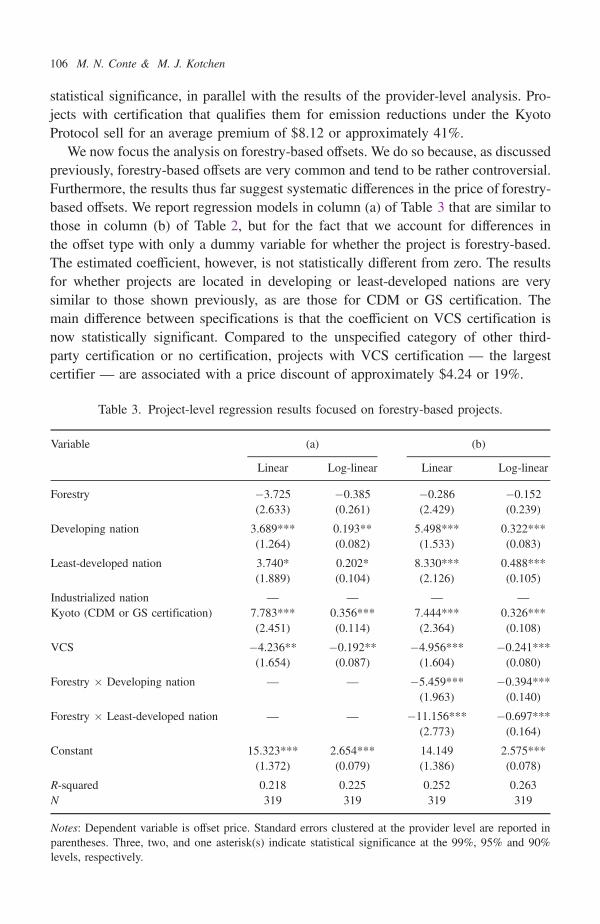
We now focus the analysis on forestry-based offsets. We do so because, as discussedpreviously, forestry-based offsets are very common and tend to be rather controversial.Furthermore, the results thus far suggest systematic differences in the price of forestry-based offsets. We report regression models in column (a) of Table 3 that are similar tothose in column (b) of Table 2, but for the fact that we account for differences inthe offset type with only a dummy variable for whether the project is forestry-based.The estimated coefficient, however, is not statistically different from zero. The resultsfor whether projects are located in developing or least-developed nations are verysimilar to those shown previously, as are those for CDM or GS certification. Themain difference between specifications is that the coefficient on VCS certification isnow statistically significant. Compared to the unspecified category of other third-party certification or no certification, projects with VCS certification — the largestcertifier — are associated with a price discount of approximately $4.24 or 19%.
Table 3. Project-level regression results focused on forestry-based projects.
Variable (a) (b)
Linear Log-linear Linear Log-linear
Forestry �3.725 �0.385 �0.286 �0.152(2.633) (0.261) (2.429) (0.239)
Developing nation 3.689*** 0.193** 5.498*** 0.322***(1.264) (0.082) (1.533) (0.083)
Least-developed nation 3.740* 0.202* 8.330*** 0.488***(1.889) (0.104) (2.126) (0.105)
Industrialized nation — — — —
Kyoto (CDM or GS certification) 7.783*** 0.356*** 7.444*** 0.326***(2.451) (0.114) (2.364) (0.108)
VCS �4.236** �0.192** �4.956*** �0.241***(1.654) (0.087) (1.604) (0.080)
Forestry � Developing nation — — �5.459*** �0.394***(1.963) (0.140)
Forestry � Least-developed nation — — �11.156*** �0.697***(2.773) (0.164)
Constant 15.323*** 2.654*** 14.149 2.575***(1.372) (0.079) (1.386) (0.078)
R-squared 0.218 0.225 0.252 0.263N 319 319 319 319
Notes: Dependent variable is offset price. Standard errors clustered at the provider level are reported inparentheses. Three, two, and one asterisk(s) indicate statistical significance at the 99%, 95% and 90%levels, respectively.
106 M. N. Conte & M. J. Kotchen
The final set of models that we report include interactions between whether theoffset project is forestry-based and is located in a developing or least-developed nation.Both of these interactions have coefficients that are negative and highly statisticallysignificant. The results indicate that forestry-based projects that are located in non-industrialized nations are associated with substantial price discounts. Compared tothose located in industrialized nations, forestry-based offsets in developing nations sellfor prices that are lower by $5.46 on average, or approximately 39%. The difference iseven greater for forestry-based projects in least-developed nations, where the averagediscount compared to industrialized nations is $11.16, or nearly 70%. The forestry-based difference between developing and least-developed nations is also statisticallysignificant (F ¼ 4:46, p ¼ 0:038), indicating an average price difference of $4.70. Inthese specifications, we also find that the non-forestry difference between developingand least-developed nations is statistically significant (F ¼ 3:01, p ¼ 0:087). Con-sidering all other offset types, average offset prices are $2.83 or 17% higher in least-developed nations compared to developing nations, and both remain significantlyhigher than the average price in industrialized nations.
4. Discussion
Among the more robust findings of our analysis is that the location of both providersand projects has a significant effect on offset prices. All providers included in thedataset are located in industrialized nations, but those located in Europe sell offsets foran average premium of nearly 30%. Many factors may be contributing to this pricedifferential. Both awareness about climate change and agreement on the need to takeaction are perhaps greater in Europe than anywhere else in the world. Moreover, asdiscussed previously, GHG emissions are regulated throughout the European Union,and offsets are allowed as part of both industrial and national compliance strategies.Each of these factors, along with a potential preference for more regional offset pro-viders, may contribute to an increase in demand, and therefore price, of carbon offsetssold by European providers.
Somewhat more surprising is the way that the location of projects themselves affectsprices. When considering all types of offset projects, we find that projects occurring indeveloping and least-developing nations are significantly more expensive than thosetaking place in industrialized nations, by an average of nearly 20%. Assuming thatthese nations do not have the most current technology in place, one might expect thecost of emissions abatement in these nations to be lower than that in industrializednations. This is, after all, the economic rationale for the Kyoto Protocol’s CDM. Butour empirical results, which show higher prices in non-industrialized nations, are notconsistent with this line of reasoning. One possible explanation for the price premiumassociated with offsets in non-industrialized nations is the desire for wealth redis-tribution, i.e., poverty alleviation, on the part of offset buyers in voluntary carbonmarkets. The plausibility of this explanation is strengthened even further by the fact
Explaining the Price of Voluntary Carbon Offsets 107
that in some specifications, we also find significantly higher offset prices when projectsare located in least-developed nations compared to developing nations. It is also thecase that establishing and managing offset projects in non-industrialized nations canhave further challenges that increase the cost due to weaker institutionalarrangements.13
Among all the types of offset projects considered in the dataset, forestry-basedprojects are the most common. It is also the case that forestry-based projects are themost controversial. As discussed previously, concerns tend to focus in particular onwhether projects that seek to avoid deforestation or promote reforestation are legiti-mately additional, permanent, or both. At the same time, forestry-based projects arefrequently promoted because of associated co-benefits. In addition to carbon seques-tration, standing forests provide additional benefits in the form of wildlife habitat andecosystem services more generally (for examples, see Foley et al., 2005; andMyers, 1997).14 We nevertheless find some evidence that forestry-based offsets sell forlower prices than offsets of other types, perhaps reflecting greater uncertainty aboutadditionality and permanence. The stronger result, however, is that forestry-basedoffsets sell for substantially lower prices than offsets of other types when projects arelocated in non-industrialized nations, with average prices lower by 40% and 70% indeveloping and least-developed nations, respectively. With respect to uncertainty, theseresults may reflect how these nations often lack the institutions required to ensure thequality of forestry offsets, such as secure property rights, good governance, andmonitoring infrastructure. Furthermore, lower prices in non-industrialized nations maybe related to the lower opportunity costs of land in developing and least-developednations when kept in forests. Distinguishing between these potential explanations forthe lower price of forestry-based offsets in non-industrialized nations is critical, as thereis significant international momentum to incorporate reduced emissions from defor-estation and degradation (REDD) offsets in the next round of climate negotiations, andthese decisions will have important implications for both GHG emissions and land usein the future (see, for example, Miles and Kapos, 2008).
Demonstrating that offsets represent actual reductions in GHG emissions is essentialfor the long-term viability of offsets in both a regulatory and voluntary setting. In orderto address the information asymmetry that exists between offset providers and buyers,emphasis is increasingly being placed on the importance of developing standards andestablishing third-party certifiers to ensure the credibility of provider claims. Such
13Though not reported in the paper, we also estimated project-level regression models that included a variable for thelevel of corruption in the host nation. The corruption variable was based on Transparency International’s 2008 Cor-ruption Perceptions Index, available at www.icgg.org. Though we did not find that corruption is associated with higheroffset prices, the results for price differences based on OECD classification continue to hold after controlling forcorruption.14We also estimated, though do not report, project-level regression models that included a variable that attempted tocapture the biodiversity benefits associated with the forestry-based projects. This indicator variable was created from theproject descriptions on the CC website, based on appearance of the terms “native species”, “native forest”, or “res-toration” in the description. We were unable to identify any impact on price due to the type of forestry project pursued.
108 M. N. Conte & M. J. Kotchen
certification might be expected to increase the price of offsets for reasons related toboth supply and demand. Obtaining certification and/or complying with standards isnot only costly; the additional information conveyed through certification might alsoincrease a buyer’s willingness to pay. Our results, however, suggest that the impact ofcertification on offset prices depends on the certifier.
A robust finding is that CDM or GS certification has a positive effect on offsetprices, with estimates of the premium ranging between 30% and 65%. Whether this isdriven by greater costs or greater willingness to pay is unclear, but a unique feature ofthese two certifications is that the offsets qualify for emission reductions under theKyoto Protocol. This feature clearly has an additional benefit in a regulated setting, andto the extent that offsets with this certification are selling in the voluntary market, thepremium indicates that offset buyers do in fact attach value to CDM and GS certifi-cation. We do not find a similar result for VCS certification. In fact, we find someevidence that VCS certification, the largest non-regulatory certifier, is associated withlower offset prices, when compared to offset projects that are either uncertified orcertified by some unspecified other third-party. We do not have a good explanation forthis result, though it is consistent with simple descriptive statistics reported inHamilton et al. (2009), where prices are lower for VCS-certified projects than forprojects with other third-party certification or no certification. One potential expla-nation for the VCS discount is that VCS certification, compared to other certificationsor no certification, may not allay concerns about additionality, permanence, and ver-ifiability. Other possible explanations range from low costs of compliance withpotentially weak VCS standards, an omitted variable in our analysis that is correlatedwith VCS certification and associated with lower prices, and the general possibility,discussed more below, that prices are not closely related to marginal costs because of athin market.
5. Summary and Conclusion
The primary aim of this paper is to investigate factors that help explain the largevariability in the price of voluntary carbon offsets. Using data listed on the CarbonCatalog (CC), we estimate hedonic price functions using a variety of provider- andproject-level characteristics as explanatory variables. We find that providers located inEurope sell offsets at prices that are approximately 30% higher than providers locatedin either North America or Australasia. Contrary to what one might expect, offsetprices are generally higher, by roughly 20%, when projects are located in developingor least-developed nations. But this result does not hold for forestry-based projects. Wefind evidence that forestry-based offsets sell at lower prices, and the result is par-ticularly strong when projects are located in developing or least-developed nations.Offsets that are CDM- or GS-certified, and therefore qualify under the Kyoto Protocol,sell at a premium of more than 30%, while third-party certification from the VCS, oneof the largest certifiers, is associated with a price discount. Variables that do not have a
Explaining the Price of Voluntary Carbon Offsets 109
significant effect on offset prices are the number of projects that a provider managesand a provider’s status as for-profit or not-for-profit.
We base our analysis on offset providers and projects listed on CC, which, to ourknowledge, is the most comprehensive listing of sellers in the voluntary offset market.While the CC dataset continues to expand and others will surely emerge, futureresearch should take advantage of greater sources of data. We expect that such cen-tralized listings that increase transparency will also promote more competition in theoffset market. Despite several robust findings, the market for carbon offsets is stillrelatively new, and one might reasonably question whether the market is thick enoughfor competitive pressures to be driving price differences. Also at play are otherimportant variables that we cannot measure directly, such as continuing concerns aboutadditionality, permanence, and credibility. Many of the results presented here areconsistent with the market recognizing these concerns, especially those related to apremium for CDM/GS certification and lower prices for forestry-based offsets. But asthe market continues to develop, there will be more opportunities to investigate theseeffects and separate them from potential co-benefits, for which we find no clear results.In conclusion, we emphasize that voluntary carbon offsets are associated with a bundleof characteristics making them well-suited to hedonic analysis, as we have done here,and that understanding what drives prices in this market is increasingly important.
Acknowledgments
We are grateful to Charlie Kolstad and Robert Mendelsohn for helpful comments on anearlier version of the paper.
References
Aldy, JE and RN Stavins (2007). Architectures for Agreement: Addressing Global ClimateChange in the Post-Kyoto World. Cambridge, Massachusetts: Cambridge University Press.
Bartik, TJ (1987). The estimation of demand parameters in hedonic price models. Journal ofPolitical Economy, 15, 111–127.
Foley, JA, R DeFries, GP Asner, C Barford, G Bonan, SR Carpenter, FS Chapin, MT Coe,GC Daily, HK Gibbs, JH Helkowski, T Holloway, EA Howard, CJ Kucharik, C Monfreda,JA Patz, IC Prentice, N Ramankutty and PK Snyder (2005). Global consequences of landuse. Science, 309, 570–574.
Freeman, AM (1993). The Measurement of Environmental and Resource Values: Theory andMethods. Washington, DC.: Resources For the Future.
Hamilton, K, M Sjardin, A Shapiro and T Marcello (2009). Fortifying the foundation: State ofthe voluntary carbon markets 2009. A Report by Ecosystem Marketplace and New CarbonFinance.
Kim, M, BA McCarl and BC Murray (2008). Permanence discounting for land-based carbonsequestration. Ecological Economics, 64, 763–769.
Kotchen, MJ (2006). Green markets and private provision of public goods. Journal of PoliticalEconomy, 114(4), 816–834.
110 M. N. Conte & M. J. Kotchen
Kotchen, MJ (2009a). Voluntary provision of public goods for bads: A theory of environmentaloffsets. Economic Journal, 119, 883–899.
Kotchen, MJ (2009b). Offsetting green guilt. Stanford Social Innovation Review, 7(2), 26–31.Michaelowa, A (1998). “Joint Implementation — The Baseline Issue”. Global Environmental
Change, 8, 81–92.Michaelowa, A (2002). The AIJ pilot phase as laboratory for CDM and JI. International
Journal of Global Environmental Issues, 2, 260–287.Miles, L and V Kapos (2008). Reducing greenhouse gas emissions from deforestation and
forest degradation: Global land-use implications. Science, 320, 1454–1455.Myers, N (1997). The world’s forests and their ecosystem services, in G. C. Daily (ed), in
Nature’s Services. Societal Dependence on Natural Ecosystems. Washington, DC.: IslandPress, 215–235.
Pfaff, A, S Kerr, RF Hughes, S Liu, A Sanchez, D Schimel, J Tosi and V Watson (2000). TheKyoto Protocol and payments for tropical forest: An interdisciplinary method for estimatingcarbon-offset supply and increasing the feasibility of a carbon market under the CDM.Ecological Economics, 35(2), 203–221.
Rosen, S (1974). Hedonic prices and implicit markets: Product differentiation in perfectcompetition. Journal of Political Economy, 82, 34–55.
Victor, DG, J House and S Joy (2005). A Madisonian approach to climate policy. Science, 309,1820–1821.
Wara, M (2007). Is the global carbon market working? Nature, 445, 595–596.Wara, MW and DG Victor (2008). A realistic policy on international carbon offsets. Working
Paper #74, Program on Energy and Sustainable Development, Stanford University.
Explaining the Price of Voluntary Carbon Offsets 111