Embed Size (px)
Citation preview

Exploiting Dynamic Information in IDEs Improves Speedand Correctness of Software Maintenance Tasks
David RöthlisbergerSoftware Composition Group
University of Bern, [email protected]
Marcel HärrySoftware Composition Group
University of Bern, [email protected]
Philippe MoretUniversity of Lugano
Danilo AnsaloniUniversity of Lugano
Alex VillazónUniversity of Lugano
Walter BinderUniversity of Lugano
Oscar NierstraszSoftware Composition Group
University of Bern, [email protected]
ABSTRACTModern IDEs such as Eclipse offer static views of the source code,but such views ignore information about the run-time behaviorof software systems. Since typical object-oriented systems makeheavy use of polymorphism and dynamic binding, static views willmiss key information about the run-time architecture. In this pa-per we show by means of a controlled experiment with 30 profes-sional developers that for typical software maintenance tasks inte-grating dynamic information into the Eclipse IDE yields a signif-icant 17.5% decrease of time spent while significantly increasingthe correctness of the solutions by 33.5%. Furthermore, we de-scribe several enhancements to the Eclipse IDE that integrate staticand dynamic information, with the goal of better supporting typi-cal software maintenance activities. We elaborate on a case studywhich further highlights the usefulness of dynamic informationfor performance optimizations. We also report on several impor-tant efficiency improvements to our dynamic information collectionframework, and we present benchmarks evaluating the overhead ofour approach.
Keywordsdynamic analysis, development environments, program compre-hension, software maintenance, empirical experiments
1. INTRODUCTIONIn many object-oriented systems, conceptually related code is
scattered over the entire source space. As this space can be verylarge, developers have difficulties to locate the code relevant fora particular software maintenance task. This problem is further
Permission to make digital or hard copies of all or part of this work forpersonal or classroom use is granted without fee provided that copies arenot made or distributed for profit or commercial advantage and that copiesbear this notice and the full citation on the first page. To copy otherwise, torepublish, to post on servers or to redistribute to lists, requires prior specificpermission and/or a fee.ICSE 2010 Cape Town, South AfricaCopyright 200X ACM X-XXXXX-XX-X/XX/XX ...$10.00.
exacerbated by object-oriented language features such as inheri-tance, interface types or polymorphism that often obscure the actualrun-time behavior. The primary tool used by software developers,the IDE, does usually not help them better understand source coderelying on polymorphism as it just shows the statically declaredtypes. Moreover, high-level collaborations are often inaccuratelypresented by the IDE, which is only aware of which classes imple-ment a given interface, not which ones are actually used at run-time.
To improve the understanding for Java-based software sys-tems employing polymorphism or abstract types, we extended theEclipse IDE to integrate dynamic information. Such informa-tion enables the programmer to explore and understand the inter-procedural control flow of a system or to see also the run-time typesin the source code views that are, for example, sub-types of the stat-ically defined types. Our extensions exploit behavioral informationto better understand and navigate the source space in a prototypeEclipse plugin called Senseo about which we reported in previouswork [20]1.
However, this previous work was considerably limited and hadseveral flaws: (i) dynamic information was just integrated locallyin the source code views on a method level, thus there was nooverview of the entire system, (ii) dynamic collaboration betweensource artifacts, such as packages or classes, was not made visible,and (iii) gathering of dynamic information such as run-time typeswas inefficient. Thus, we contribute in this paper several significantextensions to Senseo such as a collaboration view presenting all dy-namic collaborators of source artifacts on a package or class levelto make explicit the dynamic dependencies between entire sourceartifacts. Another enhancement, called Calling Context Ring Chart(CCRC), a navigable visualization of the system’s Calling ContextTree (CCT) [1], is useful for efficiently spotting performance bot-tlenecks. The CCT is a runtime data structure for calling contextprofiling. Each node in the CCT conveys the measured dynamicmetrics for that calling context. We also significantly reduced theoverhead of gathering the dynamic information.
We previously motivated the usefulness of Senseo purely withanecdotal evidence. To validate our claims, we conduct a con-trolled user experiment with 30 professional Java developers to ob-
1http://scg.unibe.ch/download/Senseo.pdf
1

tain reliable quantitative and qualitative feedback about the impacton developer productivity contributed by Senseo and the dynamicinformation it integrates in Eclipse. We ask the subjects to solvefive typical software maintenance tasks in an unfamiliar, medium-sized software system. We split the 30 subjects into two groups, anexperimental and a control group. The only difference in treatmentbetween these two groups is that the control group is provided withthe standard Eclipse IDE while the experimental group additionallycan use the Senseo plugin. Analyzed variables are time required tosolve the tasks and correctness of the answers. Evaluating the ob-tained results yields a significant decrease in time of 17.5% and asignificant increase in correctness of 33.5%.
In this paper we make the following contributions: (i) validat-ing the impact of the availability of dynamic information and theirpresentation in Eclipse on developer productivity during softwaremaintenance by conducting a controlled experiment with 30 pro-fessional Java developers, (ii) integrating higher-level means in theIDE to visualize and present dynamic information such as the col-laboration or the CCRC view, (iii) a case study reporting specifi-cally on the usefulness of the CCRC, and (iv) improving the effi-ciency of our aspect-based dynamic information collection frame-work called MAJOR and a thorough performance evaluation.
This paper is structured as follows: In Section 2 we describethe background of our work on integrating dynamic informationin IDEs. Section 3 illustrates enhancements to Senseo. Section 4introduces the controlled user experiment, discusses its design, re-sults and threats to validity. In Section 5 we present a case study,validating Senseo’s CCRC view. Section 6 thoroughly elaborateson the important efficiency issue of the employed dynamic infor-mation collection technique. Finally, Section 7 highlights relatedwork in the areas of dynamic analysis, IDEs and empirical studiesin software engineering while Section 8 concludes the paper.
2. BACKGROUNDIn a previous publication [20], we introduced a prototype of
Senseo integrating dynamic information in Eclipse about receiver,argument and return value types of message sends. Senseo presentsthis information in tooltips appearing when the mouse hovers overmethod declarations or invocations in source code. For a method,the tooltip shows the calling methods, the methods called in themethod body, the concrete argument, receiver, and return valuetypes. That is, if the statically declared type refers to an abstractor interface type, the tooltip shows the type actually occurred atrun-time (see Figure 1, (1)).
Furthermore, the former Senseo prototype also visualizes threedynamic metrics2 [8], the number of method invocations, the num-ber of object allocations, and the allocated bytes. In the Senseoprototype we presented such metrics in the ruler columns next tothe source code editor (Figure 1, (2) and (3)) and in the packagetree (Figure 1, (4)). Source artifacts heavily contributing to the cur-rently selected metric, such as methods creating many objects, aredisplayed in red in package tree and ruler columns while artifactswith lower activity are colored in blue. This means Senseo followsa heatmap coloring scheme with a color gradient from blue to red.
The analyzed application runs in a separate JVM in which MA-JOR [22] weaves a data gathering aspect in the application code,while the Eclipse IDE including Senseo runs in another JVM. The
2In this paper, the term dynamic metrics refers to numerically rep-resented dynamic information, such as the number of method invo-cations, the number of object allocations, or the number of executedbytecodes. The term dynamic information subsumes dynamic met-rics as well as information on run-time types.
aspect woven with MAJOR creates the CCT and collects the dy-namic information. Such an aspect-based approach for dynamic in-formation gathering is highly flexible as the aspect code is compactand easy to extend and customize. Furthermore, MAJOR enablesus to gather dynamic information for the entire bytecode used by asystem, including the Java class library and dynamically loaded orgenerated code.
Senseo aggregates the collected dynamic information of multi-ple executions of the program, thus the information presented inthe IDE is not bound to a specific execution as for instance in adebugger or a profiler. In comparison with debuggers or profilers,Senseo supports a wider range of software maintenance tasks andthe aggregated information is not volatile, but rather permanent andaggregated. Hence Senseo’s approach to dynamic analysis suffersless from typical problems of behavioral analysis, such as cover-age or completeness of the information, as the dynamic informa-tion stemming from various different system executions is typicallymore reliable and complete, depending on the executed scenarios.
While the former Senseo prototype and the dynamic informationit provided were already helpful to better understand systems heav-ily relying on polymorphic message sending or abstract interfacetypes [20], we realized that there were several types of softwaremaintenance tasks these extensions could not well support:
i. Understanding higher-level concepts, such as application lay-ers, models, or separation of concerns.
ii. Identifying collaboration patterns, that is, how various sourceartifacts communicate with each other at run-time.
iii. Locating design flaws, design “smells”, performance bottle-necks, and other code quality issues, such as classes heav-ily coupled to classes in other packages or classes residing inwrong packages.
iv. Gaining an overview of control flow and execution complexity,for instance to quickly locate performance bottlenecks.
In the next section we discuss how we enhanced Senseo to sup-port these kind of tasks by providing visualizations or other meansto use various dynamic information directly in Eclipse. The userexperiment presented in Section 4 shows how these enhancementsactually help developers performing such tasks.
3. ENHANCEMENTS TO SENSEOThis section discusses enhancements and new features integrated
in Senseo, which were not available in the prototype presentedin [20]. Whereas this earlier prototype of Senseo showed dynamicinformation only close to the source code and locally to specificsource artifacts (for instance, by extending the tooltip appearingwhen the mouse hovers over methods), the new version greatlyimproves the integration of behavioral information with additionalmeans such as the collaboration view which makes explicit depen-dencies between different source entities or the CCRC which givesan overview of the system’s calling context tree in order to supportdevelopers in software maintenance tasks, such as those mentionedin Section 2. Senseo now supports an additional metric, the numberof executed bytecodes, which is useful for program optimizations(see Section 5)
Collaboration View. In a separate view next to the source codeeditor (Figure 1, (6)), Senseo presents all dynamic collaboratorsfor the currently selected artifact. For instance, if a method hasbeen selected, the collaboration view shows the collaborators atthe package, class, or method level; that is, it lists all packagesor classes invoking methods of the package or class in which theselected method is declared (callers). Furthermore, the collabora-tion view shows all packages or classes with which the package orclass declaring the method is actively communicating (callees). For
2
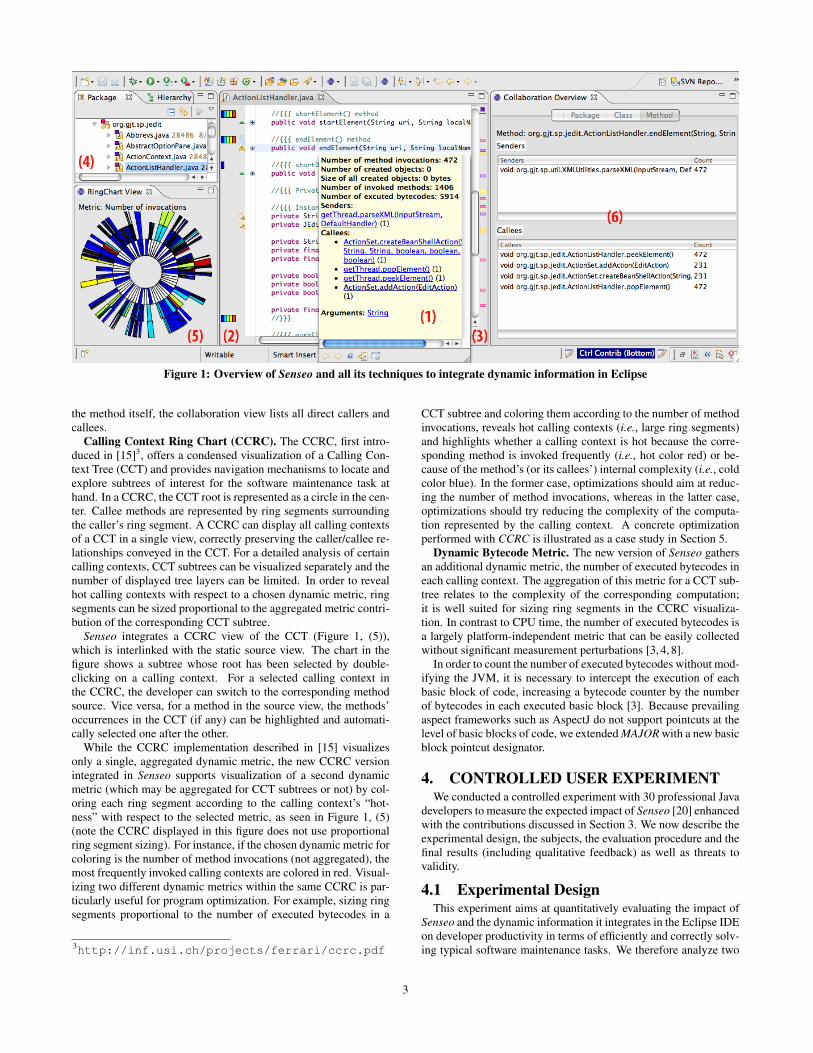
Figure 1: Overview of Senseo and all its techniques to integrate dynamic information in Eclipse
the method itself, the collaboration view lists all direct callers andcallees.
Calling Context Ring Chart (CCRC). The CCRC, first intro-duced in [15]3, offers a condensed visualization of a Calling Con-text Tree (CCT) and provides navigation mechanisms to locate andexplore subtrees of interest for the software maintenance task athand. In a CCRC, the CCT root is represented as a circle in the cen-ter. Callee methods are represented by ring segments surroundingthe caller’s ring segment. A CCRC can display all calling contextsof a CCT in a single view, correctly preserving the caller/callee re-lationships conveyed in the CCT. For a detailed analysis of certaincalling contexts, CCT subtrees can be visualized separately and thenumber of displayed tree layers can be limited. In order to revealhot calling contexts with respect to a chosen dynamic metric, ringsegments can be sized proportional to the aggregated metric contri-bution of the corresponding CCT subtree.
Senseo integrates a CCRC view of the CCT (Figure 1, (5)),which is interlinked with the static source view. The chart in thefigure shows a subtree whose root has been selected by double-clicking on a calling context. For a selected calling context inthe CCRC, the developer can switch to the corresponding methodsource. Vice versa, for a method in the source view, the methods’occurrences in the CCT (if any) can be highlighted and automati-cally selected one after the other.
While the CCRC implementation described in [15] visualizesonly a single, aggregated dynamic metric, the new CCRC versionintegrated in Senseo supports visualization of a second dynamicmetric (which may be aggregated for CCT subtrees or not) by col-oring each ring segment according to the calling context’s “hot-ness” with respect to the selected metric, as seen in Figure 1, (5)(note the CCRC displayed in this figure does not use proportionalring segment sizing). For instance, if the chosen dynamic metric forcoloring is the number of method invocations (not aggregated), themost frequently invoked calling contexts are colored in red. Visual-izing two different dynamic metrics within the same CCRC is par-ticularly useful for program optimization. For example, sizing ringsegments proportional to the number of executed bytecodes in a
3http://inf.usi.ch/projects/ferrari/ccrc.pdf
CCT subtree and coloring them according to the number of methodinvocations, reveals hot calling contexts (i.e., large ring segments)and highlights whether a calling context is hot because the corre-sponding method is invoked frequently (i.e., hot color red) or be-cause of the method’s (or its callees’) internal complexity (i.e., coldcolor blue). In the former case, optimizations should aim at reduc-ing the number of method invocations, whereas in the latter case,optimizations should try reducing the complexity of the computa-tion represented by the calling context. A concrete optimizationperformed with CCRC is illustrated as a case study in Section 5.
Dynamic Bytecode Metric. The new version of Senseo gathersan additional dynamic metric, the number of executed bytecodes ineach calling context. The aggregation of this metric for a CCT sub-tree relates to the complexity of the corresponding computation;it is well suited for sizing ring segments in the CCRC visualiza-tion. In contrast to CPU time, the number of executed bytecodes isa largely platform-independent metric that can be easily collectedwithout significant measurement perturbations [3, 4, 8].
In order to count the number of executed bytecodes without mod-ifying the JVM, it is necessary to intercept the execution of eachbasic block of code, increasing a bytecode counter by the numberof bytecodes in each executed basic block [3]. Because prevailingaspect frameworks such as AspectJ do not support pointcuts at thelevel of basic blocks of code, we extended MAJOR with a new basicblock pointcut designator.
4. CONTROLLED USER EXPERIMENTWe conducted a controlled experiment with 30 professional Java
developers to measure the expected impact of Senseo [20] enhancedwith the contributions discussed in Section 3. We now describe theexperimental design, the subjects, the evaluation procedure and thefinal results (including qualitative feedback) as well as threats tovalidity.
4.1 Experimental DesignThis experiment aims at quantitatively evaluating the impact of
Senseo and the dynamic information it integrates in the Eclipse IDEon developer productivity in terms of efficiently and correctly solv-ing typical software maintenance tasks. We therefore analyze two
3

variables in this experiment: time spent and correctness. This ex-periment also reveals which kind of tasks benefit the most from theavailability of dynamic metrics in the IDE. The experimental de-sign we opted for is similar to the one applied in the study of Cor-nelissen et al. [5] which evaluated a trace visualizing tool calledEXTRAVIS.
Study Hypotheses. We claim that the availability of the Senseoplugin reduces the amount of time it takes to solve software main-tenance tasks and that it increases the correctness of the solutions.Accordingly, we formulate the following two null hypotheses:
• H10: Having available Senseo does not impact the time forsolving the maintenance tasks.
• H20: Having available Senseo does not impact the correct-ness of the task solutions.
Congruently, we formulate these two alternative hypotheses:• H1: Having available Senseo reduces the time for solving the
maintenance tasks.• H2: Having available Senseo increases the correctness of the
task solutions.We test the two null hypotheses by assigning each subject to ei-
ther a control group or an experimental group. While the experi-mental group has Senseo available for answering typical softwaremaintenance tasks and questions, the control group uses a standard,unextended Eclipse IDE; otherwise there is no difference in treat-ment between the two subject groups. As both groups have nearlyequal expertise, differences in time or solution correctness can beattributed to the availability of Senseo.
Study Participants. We asked 30 software developers workingin industry (24) or with former industrial experience in softwaredevelopment (6) to participate in our experiment. Participation wasvoluntary and unpaid. All subjects answered a questionnaire askingfor their expertise with Java, Eclipse and specific skills in softwareengineering, such as how often they work with unfamiliar code orhow often they apply dynamic analysis. Most subjects (25) aremainly working with Java on their job, the others (5) mainly useanother language but rely on Java at least in some of their profes-sional projects. All participants are familiar with the Eclipse IDE.
The subjects have between one and 25 years of professional ex-perience as a software engineer (average 4.8 years, median 4 years).27 subjects have a university degree in computer science (Bache-lors or Masters from 18 different universities) while three subjectseither studied in another area or learned software engineering onthe job. The subjects are very heterogeneous and thus fairly repre-sentative (seven different nationalities, working for eight differentcompanies). In a Likert scale from 0 (no experience) to 4 (expert)subjects rated themselves on a level of 2.93 for Java experience,2.73 for Eclipse experience and 2.72 for experience in working withunfamiliar code. All these ratings refer to “very experienced”. Withan average rating of 2.20, experience in applying dynamic analysisis slightly lower, but this rating is still considered as “quite experi-enced”. Note that no subject claimed to have no experience in anyof these four areas.
To assign the 30 subjects to either the experimental or the con-trol group, we used the obtained expertise information to build twogroups with equal expertise. To assess the expertise we consideredfour variables as given by the subjects: number of years of profes-sional experience in software engineering, experience with Java,Eclipse and with maintaining unfamiliar code. For each subject wesearched for a pair with similar expertise concerning these variablesand then randomly assigned these two persons to either of the twogroups. This leads to a very similar overall expertise in both groupsas shown in Table 1.
Subject System and Tasks. As a subject system we have chosen
Table 1: Average expertise in control and experimental groupExpertise variable Control group Exper. groupYears of experience 4.73 4.40Java experience [0..4] 2.93 2.80Eclipse experience [0..4] 2.80 2.67Unfamiliar code exp. [0..4] 2.73 2.73Mean 3.30 3.15
jEdit4, an open-source text editor written in Java. JEdit consists of32 packages with 5275 methods in 892 classes totaling more than100 KLOC. We opted for jEdit as a subject system as it is medium-sized and representative for many software projects found in indus-try. JEdit has a long history of development spanning nearly tenyears and involving more than ten developers. Even though it hasbeen refactored several times, a careful analysis of the code qualityrevealed several design flaws, such as the use of deprecated code,tight coupling of many source entities to package-external artifacts,or lack of cohesion in almost all packages, which makes jEdit hardto understand. We expect many industrial systems to have similarquality problems, thus we consider jEdit to be a well-suited subjectapplication fairly typical for many industrial systems developerscome across on their job. Furthermore, the domain of a text ed-itor is familiar to everyone, thus no special domain-knowledge isrequired to understand jEdit.
The tasks we gave the subjects are concerned with analyzingand gaining an understanding for various features of jEdit. Whilechoosing the tasks, our main goal was to select tasks representativefor real maintenance scenarios. Furthermore, these tasks must notbe biased towards dynamic analysis. To assure that these criteriaare met we selected the tasks according to the framework proposedby Pacione et al. [16]. They identified nine principal activities forreverse engineering and software maintenance tasks covering bothstatic and dynamic analysis. Based on these activities they proposeseveral characteristical tasks including all identified activities. Wethus design our tasks following this framework to respect all nineprincipal activities, which avoids a potential bias towards Senseo.
This leads us to the definition of five tasks, each divided into twosubtasks, resulting in ten different questions we asked to the sub-jects. Table 2 outlines all five tasks and their subtasks and explainswhich of Pacione’s activities they cover. Task five is a special casesince we use it as a “time sink task” to avoid ceiling effects [2].Subjects that can answer the questions quickly might spend consid-erably more time on the last task when they notice that there is stillmuch time available, thus the addition of a time-consuming task atthe end which is not considered in the evaluation makes sure thatsubjects have a constant time pressure for all relevant tasks. Thefirst four tasks also cover all of Pacione’s activities.
All questions are open, that is, subjects cannot select from mul-tiple choices but have to write a text in their own words. We gradedthe subjects answers by assigning scores from zero to four for eachquestion. Before starting with the experiments, the two experi-menters (who are also authors of this paper) answered all preparedquestions. We compared and combined both solutions to form ananswer model which we then used to grade the subjects’ answers.
Experimental Procedure. We conducted the experiment withup to four subjects at the same time. We gave the subjects a shortfive minute introduction to the experiment setup. Subjects fromthe experimental group additionally received an introduction to theSenseo plugin lasting for 20 minutes. This introduction followeda script we prepared to ensure that every subject receives the same4http://www.jedit.org/
4
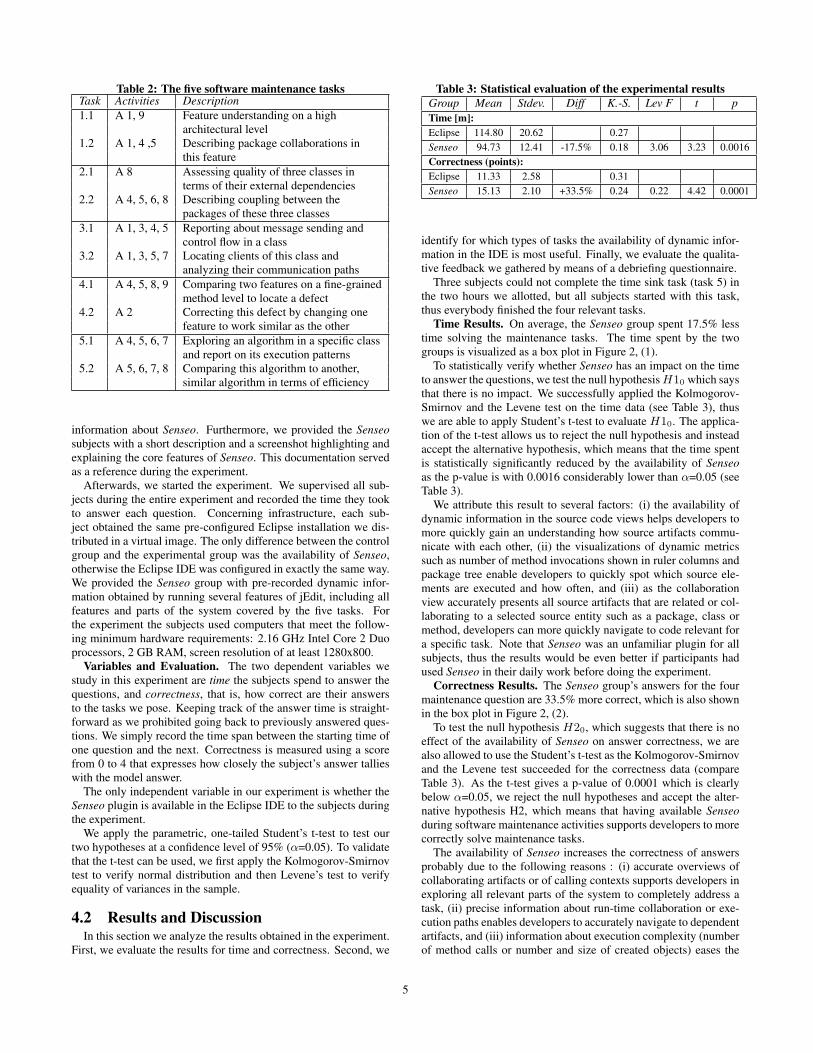
Table 2: The five software maintenance tasksTask Activities Description1.1 A 1, 9 Feature understanding on a high
architectural level1.2 A 1, 4 ,5 Describing package collaborations in
this feature2.1 A 8 Assessing quality of three classes in
terms of their external dependencies2.2 A 4, 5, 6, 8 Describing coupling between the
packages of these three classes3.1 A 1, 3, 4, 5 Reporting about message sending and
control flow in a class3.2 A 1, 3, 5, 7 Locating clients of this class and
analyzing their communication paths4.1 A 4, 5, 8, 9 Comparing two features on a fine-grained
method level to locate a defect4.2 A 2 Correcting this defect by changing one
feature to work similar as the other5.1 A 4, 5, 6, 7 Exploring an algorithm in a specific class
and report on its execution patterns5.2 A 5, 6, 7, 8 Comparing this algorithm to another,
similar algorithm in terms of efficiency
information about Senseo. Furthermore, we provided the Senseosubjects with a short description and a screenshot highlighting andexplaining the core features of Senseo. This documentation servedas a reference during the experiment.
Afterwards, we started the experiment. We supervised all sub-jects during the entire experiment and recorded the time they tookto answer each question. Concerning infrastructure, each sub-ject obtained the same pre-configured Eclipse installation we dis-tributed in a virtual image. The only difference between the controlgroup and the experimental group was the availability of Senseo,otherwise the Eclipse IDE was configured in exactly the same way.We provided the Senseo group with pre-recorded dynamic infor-mation obtained by running several features of jEdit, including allfeatures and parts of the system covered by the five tasks. Forthe experiment the subjects used computers that meet the follow-ing minimum hardware requirements: 2.16 GHz Intel Core 2 Duoprocessors, 2 GB RAM, screen resolution of at least 1280x800.
Variables and Evaluation. The two dependent variables westudy in this experiment are time the subjects spend to answer thequestions, and correctness, that is, how correct are their answersto the tasks we pose. Keeping track of the answer time is straight-forward as we prohibited going back to previously answered ques-tions. We simply record the time span between the starting time ofone question and the next. Correctness is measured using a scorefrom 0 to 4 that expresses how closely the subject’s answer tallieswith the model answer.
The only independent variable in our experiment is whether theSenseo plugin is available in the Eclipse IDE to the subjects duringthe experiment.
We apply the parametric, one-tailed Student’s t-test to test ourtwo hypotheses at a confidence level of 95% (α=0.05). To validatethat the t-test can be used, we first apply the Kolmogorov-Smirnovtest to verify normal distribution and then Levene’s test to verifyequality of variances in the sample.
4.2 Results and DiscussionIn this section we analyze the results obtained in the experiment.
First, we evaluate the results for time and correctness. Second, we
Table 3: Statistical evaluation of the experimental resultsGroup Mean Stdev. Diff K.-S. Lev F t pTime [m]:Eclipse 114.80 20.62 0.27Senseo 94.73 12.41 -17.5% 0.18 3.06 3.23 0.0016Correctness (points):Eclipse 11.33 2.58 0.31Senseo 15.13 2.10 +33.5% 0.24 0.22 4.42 0.0001
identify for which types of tasks the availability of dynamic infor-mation in the IDE is most useful. Finally, we evaluate the qualita-tive feedback we gathered by means of a debriefing questionnaire.
Three subjects could not complete the time sink task (task 5) inthe two hours we allotted, but all subjects started with this task,thus everybody finished the four relevant tasks.
Time Results. On average, the Senseo group spent 17.5% lesstime solving the maintenance tasks. The time spent by the twogroups is visualized as a box plot in Figure 2, (1).
To statistically verify whether Senseo has an impact on the timeto answer the questions, we test the null hypothesisH10 which saysthat there is no impact. We successfully applied the Kolmogorov-Smirnov and the Levene test on the time data (see Table 3), thuswe are able to apply Student’s t-test to evaluate H10. The applica-tion of the t-test allows us to reject the null hypothesis and insteadaccept the alternative hypothesis, which means that the time spentis statistically significantly reduced by the availability of Senseoas the p-value is with 0.0016 considerably lower than α=0.05 (seeTable 3).
We attribute this result to several factors: (i) the availability ofdynamic information in the source code views helps developers tomore quickly gain an understanding how source artifacts commu-nicate with each other, (ii) the visualizations of dynamic metricssuch as number of method invocations shown in ruler columns andpackage tree enable developers to quickly spot which source ele-ments are executed and how often, and (iii) as the collaborationview accurately presents all source artifacts that are related or col-laborating to a selected source entity such as a package, class ormethod, developers can more quickly navigate to code relevant fora specific task. Note that Senseo was an unfamiliar plugin for allsubjects, thus the results would be even better if participants hadused Senseo in their daily work before doing the experiment.
Correctness Results. The Senseo group’s answers for the fourmaintenance question are 33.5% more correct, which is also shownin the box plot in Figure 2, (2).
To test the null hypothesis H20, which suggests that there is noeffect of the availability of Senseo on answer correctness, we arealso allowed to use the Student’s t-test as the Kolmogorov-Smirnovand the Levene test succeeded for the correctness data (compareTable 3). As the t-test gives a p-value of 0.0001 which is clearlybelow α=0.05, we reject the null hypotheses and accept the alter-native hypothesis H2, which means that having available Senseoduring software maintenance activities supports developers to morecorrectly solve maintenance tasks.
The availability of Senseo increases the correctness of answersprobably due to the following reasons : (i) accurate overviews ofcollaborating artifacts or of calling contexts supports developers inexploring all relevant parts of the system to completely address atask, (ii) precise information about run-time collaboration or exe-cution paths enables developers to accurately navigate to dependentartifacts, and (iii) information about execution complexity (numberof method calls or number and size of created objects) eases the
5

60
80
100
120
140
Eclipse Senseo
Tim
e s
pe
nt
(min
ute
s)
13
17
4
6
8
10
12
14
16
18
20
Eclipse Senseo
Co
rre
ctn
ess (
po
ints
)
(1) (2)Figure 2: Box plots comparing time spent and correctness be-tween control and experimental group
Table 4: Task individual performance concerning time re-quired and correctness.
Task Time [m] Correctness (points)Eclipse Senseo Eclipse Senseo
Task 1 511 425 (-16.8%) 38 53 (+39.5%)Task 2 388 340 (-12.4%) 58 79 (+36.2%)Task 3 437 291 (-33.4%) 52 69 (+32.7%)Task 4 386 365 (-5.4%) 22 26 (+18.2%)
correct identification of inefficient code.Task-dependent Results. We also analyzed the two variables,
time spent and correctness, for each task individually to revealwhich kind of task benefit most from dynamic information inte-grated in Eclipse. Table 4 presents the aggregated results for timespent and correctness for each subject group and each task individ-ually. Tasks 1, 2 and 3 benefit significantly from the availability ofSenseo both in terms of time required to solve them and the cor-rectness of the solution. However, for task 4 the benefit of Senseois less pronounced. Coming back to the kind of tasks introduced inSection 2 that we wanted to support with Senseo, we can concludethat we successfully enhanced Senseo to aid developers performingsuch tasks. The experimental task 1 refers to task type (i), task 2to type (ii) and (iii), and task 3 to type (iv), while for task 4 weconsider lower level information as more relevant, for instance in-formation on a method body level.
Qualitative Feedback. In the experiment we also collectedqualitative feedback by means of a questionnaire to for instanceevaluate the impact of particular parts of Senseo on specific kinds ofmaintenance tasks. This evaluation yields answers to the questionwhich kind of dynamic information is actually relevant or useful inwhat kind of software maintenance tasks.
In Table 5 we illustrate for which tasks the subjects used whichdynamic information integrated by Senseo, and Table 6 presentshow useful subjects rated each technique of Senseo in a Likert scalefrom 0 (useless) to 4 (very useful).
From the evaluation asking for the use of dynamic information inspecific tasks, we draw the conclusion that there are basically threekinds of tasks whose solving process is very well supported by theavailability of dynamic information in IDEs: (i) tasks requiring de-velopers to understand how different source artifacts collaborate or
Table 5: Percentage of subjects using specific dynamic infor-mation in particular tasks
Dynamic Information Task 1 Task 2 Task 3 Task 4Run-time types (Tooltip) 33% 47% 47% 20%Number of invocations 53% 67% 40% 27%Number of created objects 33% 47% 27% 13%Number of exec. bytecodes 27% 33% 20% 7%CCRC 7% 7% 0% 0%Dynamic collaborators(callers, callees) 53% 80% 73% 33%
Table 6: Mean ratings of the subjects for each feature of Senseo
Dynamic Information Mean rating [0..4]Tooltip showing run-time types 3.6Ruler column incl. dynamic metrics 3.2Overview ruler column incl. dyn. metrics 3.0Package tree incl. dynamic metrics 2.4CCRC 2.1Collaboration view 3.7
depend on each other, (ii) tasks in which developers have to assesshow often code is executed or how complex it is, and (iii) tasksthat require the developer to understand which code is related toa given feature. This conclusion agrees with the quantitative re-sults discussed earlier where we revealed that task 1 (feature andcollaboration understanding), task 2 (quality assessment) and task3 (control flow understanding) benefited most from the availabilityof Senseo while for task 4 (low level defect correction) dynamicinformation was less useful.
From the results evaluating the different Senseo concepts, weconclude that developers particularly benefit from the availabilityof the collaboration views and run-time type information in sourcecode. Also considered useful are visualizations of dynamic metricsin the source code columns such as the presentation of number ofinvoked methods in a method or class. The aggregated dynamicmetrics presented in the package tree are perceived as less usefulby the developers, probably because it is not meaningful to studyrun-time complexity on a high package level. The subjects alsocould not benefit from the CCRC as this visualization serves therather specialized task of performance optimization which has notbeen directly covered by the maintenance tasks of the experiment.Thus we elaborate in a separated case study in Section 5 on theCCRC’s usefulness for performance optimizations.
4.3 Threats to ValidityIn this section we discuss several threats to validity concerning
this experiment. We distinguish between (i) construct validity, thatis, threats due to how we operationalized the time and correctnessmeasures, (ii) internal validity, that is, threats due to inferences be-tween treatment and effect during the analysis, and (iii) externalvalidity which refers to threats concerning the generalization of theexperiment results.
Construct Validity. Due to the operationalization of the timeand correctness variables, the results might not hold in real, non-experimental situations. For instance, subjects could have beenmore attentive than they would be in their daily job, or they mighthave guessed the experimental goal and acted accordingly, or weremore anxious as they were observed and could have assumed thattheir personal performance was evaluated. In general, the testing of
6

the treatment, the (un)availability of Senseo, could have influencedthe outcome of the experiment. However, we consider this threat tobe negligible as the experimental goal was not revealed to subjects.At the same time we made clear that we do not evaluate their per-sonal performance (we anonymised their answers), and tried to usea familiar, non-artificial atmosphere by conducting the experimentwith most subjects in their own office using their own computer ifit fulfilled the requirements for the experiment, see Section 4.1.
Internal Validity. Some threats to internal validity originatefrom the subjects. First, subjects might not have the required exper-tise to properly solve the maintenance tasks. This threat is largelyeliminated by preliminary assessing subject’s expertise concerningtheir Java, Eclipse, or software maintenance skills. Additionally,we required them to not have expert knowledge in developing jEdit.Second, the experimental group might have had more knowledgethan the control group. This threat is tackled by assigning the sub-jects in a randomized manner to the two groups in a way that bothgroups have nearly equal expertise (see Table 1).
Other threats to internal validity stem from the maintenance taskswe prepared. First, the tasks could have been too difficult or time-consuming to solve. This threat is refuted by the fact that nearly allsubjects from both groups could solve all tasks in time (except twofrom the control group and one from the Senseo group). Moreover,each question was answered fully correctly by at least one personfrom each group. Additionally, we asked subjects in the question-naire directly how they judged the time pressure and the difficulty.On average, the ratings were 2.8 for time pressure (representing“felt no time pressure”) and 3.1 for average difficulty of all tasks(which means “appropriately difficult”). Second, the threat thatwe formulated tasks favoring Senseo is largely limited as we usedPacione’s established framework [16] to find the tasks used in theexperiment. Third, a threat for the correctness evaluation is that theexperimenters might have favored Senseo while grading subjects’answers. By initially building an answer model according to whichthe subjects answers were graded, we mitigated this threat. For theobtained answers the experimenters gave points as pre-defined inthe answer model which in turn has been formulated and validatedby two persons individually.
External Validity. Generalizing the results of the experimentcould be unjustified due to the selection of tasks, subjects, or theapplication used in the experiment. This threat is mitigated sincewe selected the maintenance tasks carefully to follow Pacione’sframework [16] of representative maintenance tasks. We further-more asked open questions to the subjects to better model industrialreality than would be possible with multiple choice questions.
The literature suggests avoiding experimental groups consistingof only students [17]. We therefore selected subjects who all haveprofessional experience in industry as software developers as men-tioned in Section 4.1. As the subjects also work for different com-panies and have a high variety of education profiles, the study par-ticipants should be fairly representative for professional softwaredevelopers and thus not impose a threat to generalization.
In Section 4.1 we described several reasons why jEdit is rep-resentative for many industrial systems. Additionally, we askedsubjects at the end of the experiment how comparable in terms ofmaintainability they consider jEdit to be to systems they daily workwith. On average, they gave on a Likert scale from 0 (totally dif-ferent) to 4 (very representative) a rating of 3.1, which refers to“many similarities”. Hence we are confident to have found withjEdit a system representative for most industrial applications.
5. CCRC CASE STUDYThe CCRC is especially useful for locating performance bottle-
necks. As such a task was not directly part of our user experiment,we present here a case study inspired by [4], concerned with a per-formance optimization task using CCRC. In this case study, we il-lustrate how CCRC helps locate a performance problem in the lex-ical analyzer generator JLex [11], which is afterwards optimized.We use the aggregated number of executed bytecodes as dynamicmetric for sizing ring segments; in the CCRC, the ring segmentsare ordered counterclockwise by their corresponding metric contri-bution.
Figure 3 (top) shows a CCRC representing the execution ofthe original, unmodified JLex for a sample grammar included inthe JLex distribution. Looking at the aggregated bytecodes andnavigating through the different elements of the call stack, weimmediately locate a hot calling context, an invocation of thesortStates(...) method. This method executes a high num-ber of bytecodes, contributing 23.6% of the overall executed byte-codes. The large ring segment corresponding to this calling contextis highlighted in Figure 3 (top).
The sortStates(...) method uses a primitive selectionsort algorithm of complexity O(n2). In order to optimize thecode, we replace it with the merge sort algorithm of complexityO(n log n). Figure 3 (bottom) shows the resulting CCRC after theoptimization. The number of executed bytecodes in the previouslyhot calling context representing the sortStates(...) methodis reduced to 10.86% of the overall executed bytecode. Comparingthe top and bottom CCRCs in Figure 3 shows that the ring segmentcorresponding to the sorting functionality, which before had thelargest contribution of executed bytecodes, is shifted counterclock-wise after the optimization, since another ring segment has a highercontribution. In contrast to the primitive selection sort used in Fig-ure 3 (top), the merge sort algorithm visualized in Figure 3 (bot-tom) uses recursion, which explains the different shape of the cor-responding sub-segments of the sortStates(...) method.
In order to confirm that our optimization based on the numberof executed bytecodes also results in a speedup in execution time,we run both versions of JLex (original and optimized) on an IntelCore 2 Duo 2.33 Ghz computer with 2 GB RAM (Linux Fedora 10),using Sun JDK 1.6.0_12. Regarding the execution time, we takethe median of 15 runs. The original JLex executes 20,393,685 byte-codes in 37.04ms, whereas the optimized JLex executes 16,955,185bytecodes in 27.7ms. In the bytecode metric, the optimized versionis 20.3% “faster”, while in the CPU time metric, the optimized ver-sion is 33.7% faster. While the number of executed bytecodes is ex-actly reproducible in each run, the measured execution time variesconsiderably, but the optimized version is consistently faster.
6. PERFORMANCEThe prototype of Senseo [20] suffered from excessive overhead,
because it used a naive, non-optimized aspect for collecting dy-namic information and always transmitted the complete CCT to theEclipse plugin with Java’s standard serialization mechanism. Al-ready for medium-sized applications, serialization introduced longlatencies and yielded transmission data of several gigabytes.
The new version of Senseo includes two essential optimizations.First, we optimized the aspect that gathers dynamic information.Wherever run-time type information can be statically inferred, thenew aspect avoids expensive access to dynamic context informationthrough AspectJ’s reflection API. For example, if all formal methodarguments are of a primitive or final type, the actual argument typescannot vary at run-time and therefore need not be collected.
Second, we hand-crafted an optimized serialization mechanismthat transmits the CCT in an incremental way, sending only thosenodes where some dynamic information has changed since the pre-
7

Figure 3: CCRCs for JLex with the original (top) and opti-mized (bottom) sort algorithm
vious transmission. In addition, we optimized the data structuresthat store dynamic information, since they are accessed extremelyfrequently. Thanks to the principle of locality, typically only asmall subset of the CCT nodes is transmitted. Thus, it is now pos-sible to frequently update the dynamic information in the Eclipseplugin, such as once per second. Our new serialization format in-cludes a name table (types, methods, signatures), as well as com-pact representations of the CCT nodes and the gathered dynamicinformation using only integer arrays.
In order to validate that the new Senseo version offers sufficientperformance for coping with real-world workloads, we evaluatedthe different sources of overhead and analyzed the amount of trans-mitted data for the DaCapo benchmarks5. For our measurements,we use MAJOR6 version 0.6 with AspectJ7 version 1.6.5 and theSunJDK 1.6.0_13 Hotspot Server Virtual Machine. We executethe benchmarks on a quadcore machine running CentOS EnterpriseLinux 5.3 (Intel Xeon, 2.4GHz, 16GB RAM).
Figure 4 shows the overhead for CCT creation, collection of dy-namic information (including the number of method invocations,the number of object allocations, the estimated allocated bytes,the number of executed bytecodes, and the run-time receiver, ar-gument, and return value types), as well as serialization and datatransmission to the Eclipse plugin, including processing of the re-5http://dacapobench.org/6http://www.inf.usi.ch/projects/ferrari/7http://www.eclipse.org/aspectj/
!"##$ %"&#$'"#($ )")($ '"%($ )"!&$ )"*'$ )"+'$ )"),$ )"*)$
+"*&$
)"+($
,"('$ ,"!,$
)"(%$
#")%$
!"!)$
%"(%$
*"''$%"+($ %"#)$
''"'%$
'(")+$
+"!,$
&"%*$ &"'!$
&"&#$
&"!($
&"#!$
&")*$
'"!#$
&"'*$ &")&$
&"!)$
&"*&$
&"%&$
'$
!$
#$
*$
,$
''$
'!$
'#$
'*$
',$
)'$
)!$
)#$
)*$
-./01$ 203-/$ 45-1/$ 6407896$ :38$ 59;0<2$ =>/53.$ 0?7.<6@$ 0?96-145$ 8A<$ @-0-.$ B63"$
A6-.$
CD6156-<$E-4/31$
F617-07G-H3.I/1-.9A79973.$
J30064H3.$3:$<>.-A74$7.:31A-H3.$
JJK$416-H3.$
Figure 4: Senseo overhead for the DaCapo benchmarks
ceived data by the plugin. In this measurement setting, each bench-mark is executed 15 times and the median execution time is takenfor computing the overhead. For each run of each benchmark,the CCT and the gathered dynamic information are serialized andtransmitted once upon benchmark completion. To this end, wemodify the DaCapo benchmark harness in order to delay the endof a measurement until the transmitted data have been received andprocessed by the Eclipse plugin. Figure 4 also shows the averageoverhead (geometric mean) for the DaCapo suite.
On average (geometric mean), CCT creation alone causes anoverhead of factor 2.68. CCT creation and collection of dynamicinformation result in an overhead of factor 9.07. The total over-head, including serialization/transmission, is of factor 9.47. Forall benchmarks, the larger part of the overhead is due to the col-lection of dynamic information, where the collection of run-timetype information is particularly expensive. Serialization/transmis-sion causes only minor overhead, because in these measurementsettings serialization/transmission happens only once upon bench-mark completion.
We also measured the speedup of the new Senseo version relativeto the former prototype presented in [20] in the same settings usedfor Figure 4 (i.e., collection of all dynamic information, one seri-alization/transmission upon benchmark completion).8 On average(geometric mean for DaCapo), the new Senseo version is 31 timesfaster than the previous prototype.
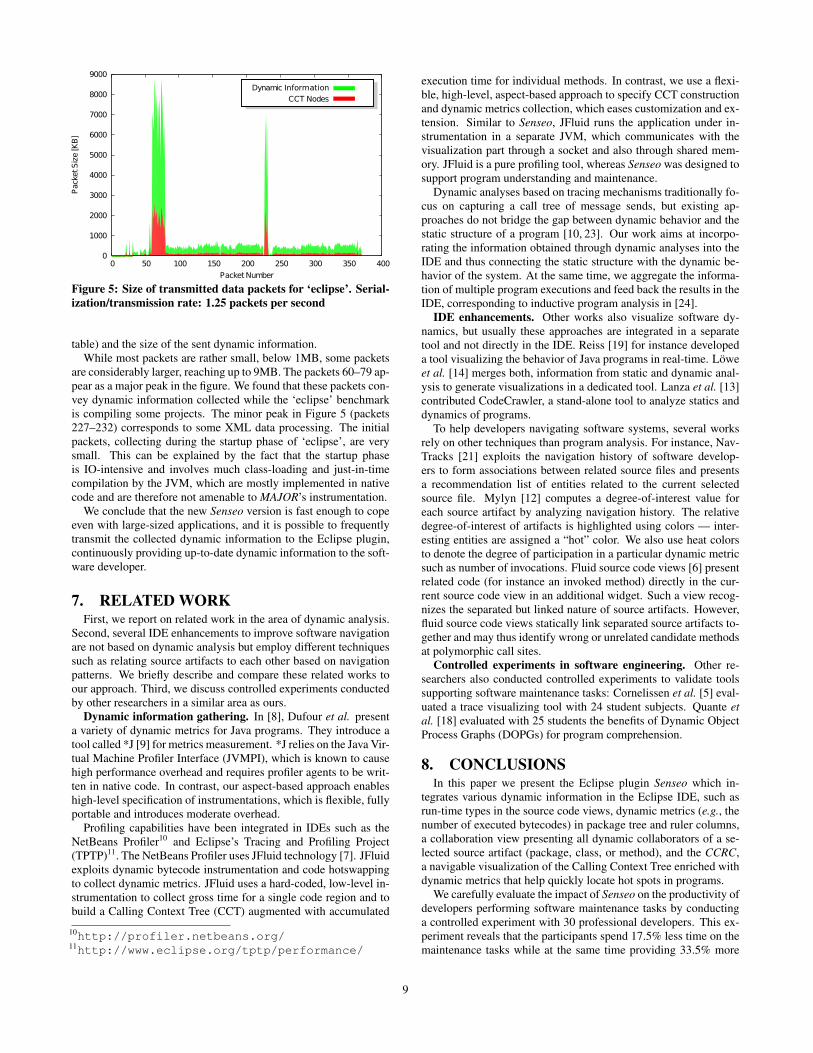
Thanks to the incremental serialization mechanism in the newSenseo version, it is possible to frequently transmit CCT and dy-namic information from a running application to the Eclipse plugin.Figure 5 illustrates the size of successively transmitted data pack-ets (including name table, CCT nodes, and dynamic information)for a single run of DaCapo’s ‘eclipse’ benchmark with a serializa-tion/transmission rate of 1.25 packets per second.9 Such a high se-rialization/transmission rate ensures that the developer always seesup-to-date dynamic information in the IDE, refreshed more thanonce per second, while the application under maintenance is run-ning in the MAJOR JVM. In total, 370 packets are sent, that is, thetotal run-time of ‘eclipse’ is about 296s in this setting (causing anoverhead factor of 14.8, whereas a single serialization/transmissionupon benchmark completion induces an overhead of factor 7.9 asshown in Figure 4). For each packet, Figure 5 differentiates be-tween the size of the transmitted CCT nodes (including the name
8Note that the measurements of the former prototype reportedin [20] are not comparable, because they excluded the collectionof run-time type information as well as serialization/transmission.9Here we evaluate the size of transmitted packets only for ‘eclipse’,which has the longest execution time in the DaCapo suite in ourmeasurement environment. Due to space limitations, figures show-ing packet sizes for the other benchmarks cannot be presented here.
8
0
1000
2000
3000
4000
5000
6000
7000
8000
9000
0 50 100 150 200 250 300 350 400
Pac
ket S
ize
[KB
]
Packet Number
Dynamic InformationCCT Nodes
Figure 5: Size of transmitted data packets for ‘eclipse’. Serial-ization/transmission rate: 1.25 packets per second
table) and the size of the sent dynamic information.While most packets are rather small, below 1MB, some packets
are considerably larger, reaching up to 9MB. The packets 60–79 ap-pear as a major peak in the figure. We found that these packets con-vey dynamic information collected while the ‘eclipse’ benchmarkis compiling some projects. The minor peak in Figure 5 (packets227–232) corresponds to some XML data processing. The initialpackets, collecting during the startup phase of ‘eclipse’, are verysmall. This can be explained by the fact that the startup phaseis IO-intensive and involves much class-loading and just-in-timecompilation by the JVM, which are mostly implemented in nativecode and are therefore not amenable to MAJOR’s instrumentation.
We conclude that the new Senseo version is fast enough to copeeven with large-sized applications, and it is possible to frequentlytransmit the collected dynamic information to the Eclipse plugin,continuously providing up-to-date dynamic information to the soft-ware developer.
7. RELATED WORKFirst, we report on related work in the area of dynamic analysis.
Second, several IDE enhancements to improve software navigationare not based on dynamic analysis but employ different techniquessuch as relating source artifacts to each other based on navigationpatterns. We briefly describe and compare these related works toour approach. Third, we discuss controlled experiments conductedby other researchers in a similar area as ours.
Dynamic information gathering. In [8], Dufour et al. presenta variety of dynamic metrics for Java programs. They introduce atool called *J [9] for metrics measurement. *J relies on the Java Vir-tual Machine Profiler Interface (JVMPI), which is known to causehigh performance overhead and requires profiler agents to be writ-ten in native code. In contrast, our aspect-based approach enableshigh-level specification of instrumentations, which is flexible, fullyportable and introduces moderate overhead.
Profiling capabilities have been integrated in IDEs such as theNetBeans Profiler10 and Eclipse’s Tracing and Profiling Project(TPTP)11. The NetBeans Profiler uses JFluid technology [7]. JFluidexploits dynamic bytecode instrumentation and code hotswappingto collect dynamic metrics. JFluid uses a hard-coded, low-level in-strumentation to collect gross time for a single code region and tobuild a Calling Context Tree (CCT) augmented with accumulated
10http://profiler.netbeans.org/11http://www.eclipse.org/tptp/performance/
execution time for individual methods. In contrast, we use a flexi-ble, high-level, aspect-based approach to specify CCT constructionand dynamic metrics collection, which eases customization and ex-tension. Similar to Senseo, JFluid runs the application under in-strumentation in a separate JVM, which communicates with thevisualization part through a socket and also through shared mem-ory. JFluid is a pure profiling tool, whereas Senseo was designed tosupport program understanding and maintenance.
Dynamic analyses based on tracing mechanisms traditionally fo-cus on capturing a call tree of message sends, but existing ap-proaches do not bridge the gap between dynamic behavior and thestatic structure of a program [10, 23]. Our work aims at incorpo-rating the information obtained through dynamic analyses into theIDE and thus connecting the static structure with the dynamic be-havior of the system. At the same time, we aggregate the informa-tion of multiple program executions and feed back the results in theIDE, corresponding to inductive program analysis in [24].
IDE enhancements. Other works also visualize software dy-namics, but usually these approaches are integrated in a separatetool and not directly in the IDE. Reiss [19] for instance developeda tool visualizing the behavior of Java programs in real-time. Löweet al. [14] merges both, information from static and dynamic anal-ysis to generate visualizations in a dedicated tool. Lanza et al. [13]contributed CodeCrawler, a stand-alone tool to analyze statics anddynamics of programs.
To help developers navigating software systems, several worksrely on other techniques than program analysis. For instance, Nav-Tracks [21] exploits the navigation history of software develop-ers to form associations between related source files and presentsa recommendation list of entities related to the current selectedsource file. Mylyn [12] computes a degree-of-interest value foreach source artifact by analyzing navigation history. The relativedegree-of-interest of artifacts is highlighted using colors — inter-esting entities are assigned a “hot” color. We also use heat colorsto denote the degree of participation in a particular dynamic metricsuch as number of invocations. Fluid source code views [6] presentrelated code (for instance an invoked method) directly in the cur-rent source code view in an additional widget. Such a view recog-nizes the separated but linked nature of source artifacts. However,fluid source code views statically link separated source artifacts to-gether and may thus identify wrong or unrelated candidate methodsat polymorphic call sites.
Controlled experiments in software engineering. Other re-searchers also conducted controlled experiments to validate toolssupporting software maintenance tasks: Cornelissen et al. [5] eval-uated a trace visualizing tool with 24 student subjects. Quante etal. [18] evaluated with 25 students the benefits of Dynamic ObjectProcess Graphs (DOPGs) for program comprehension.
8. CONCLUSIONSIn this paper we present the Eclipse plugin Senseo which in-
tegrates various dynamic information in the Eclipse IDE, such asrun-time types in the source code views, dynamic metrics (e.g., thenumber of executed bytecodes) in package tree and ruler columns,a collaboration view presenting all dynamic collaborators of a se-lected source artifact (package, class, or method), and the CCRC,a navigable visualization of the Calling Context Tree enriched withdynamic metrics that help quickly locate hot spots in programs.
We carefully evaluate the impact of Senseo on the productivity ofdevelopers performing software maintenance tasks by conductinga controlled experiment with 30 professional developers. This ex-periment reveals that the participants spend 17.5% less time on themaintenance tasks while at the same time providing 33.5% more
9

correct answers. Furthermore, we present a case study illustratinghow the CCRC is used for optimizing an application. A thoroughperformance evaluation with the DaCapo benchmarks confirms thatSenseo is able to cope with large-sized applications and enables ahigh refresh rate for displaying dynamic information on a runningapplication in Eclipse.
While Senseo currently focuses on the inter-procedural controlflow represented by the Calling Context Tree, our ongoing researchaims at capturing also the intra-procedural control flow, which willoffer additional support for program optimization. Moreover, weare integrating other dynamic analyses, such as memory leak anddata race detectors. Thanks to our aspect-oriented approach, the de-velopment and integration of such advanced features will be com-pleted shortly.
Acknowledgments. We gratefully acknowledge the financial support ofthe Swiss National Science Foundation for the projects “Bringing ModelsCloser to Code” (SNF Project No. 200020-121594, Oct. 2008 – Sept. 2010)and “FERRARI – Framework for Efficient Rewriting and ReificationApplying Runtime Instrumentation” (SNF Project No. 200021-118016/1,Oct. 2007 – Sept. 2010).
9. REFERENCES[1] G. Ammons, T. Ball, and J. R. Larus. Exploiting hardware
performance counters with flow and context sensitiveprofiling. In PLDI ’97: Proceedings of the ACM SIGPLAN1997 conference on Programming language design andimplementation, pages 85–96. ACM Press, 1997.
[2] E. Arisholm, H. Gallis, T. Dyba, and D. I. Sjoberg.Evaluating pair programming with respect to systemcomplexity and programmer expertise. IEEE Transactions onSoftware Engineering, 33(2):65–86, 2007.
[3] W. Binder, J. Hulaas, P. Moret, and A. Villazón.Platform-independent profiling in a virtual executionenvironment. Software: Practice and Experience,39(1):47–79, 2009.
[4] B. F. Cooper, H. B. Lee, and B. G. Zorn. ProfBuilder: Apackage for rapidly building Java execution profilers.Technical Report CU-CS-853-98, University of Colorado atBoulder, Department of Computer Science, Apr. 1998.
[5] B. Cornelissen, A. Zaidman, A. van Deursen, and B. vanRompaey. Trace visualization for program comprehension:A controlled experiment. In Proceedings 17th InternationalConference on Program Comprehension (ICPC), pages100–109. IEEE Computer Society, 2009.
[6] B. Desmet, J. Vallejos, and P. Costanza. Introducing mixinlayers to support the development of context-aware systems.In 3rd European Workshop on Aspects in Sofware, 2006.
[7] M. Dmitriev. Profiling Java applications using codehotswapping and dynamic call graph revelation. In WOSP’04: Proceedings of the Fourth International Workshop onSoftware and Performance, pages 139–150, 2004.
[8] B. Dufour, K. Driesen, L. Hendren, and C. Verbrugge.Dynamic metrics for Java. ACM SIGPLAN Notices,38(11):149–168, Nov. 2003.
[9] B. Dufour, L. Hendren, and C. Verbrugge. *J: A tool fordynamic analysis of Java programs. In OOPSLA ’03:Companion of the 18th Annual ACM SIGPLAN Conferenceon Object-Oriented Programming, Systems, Languages, andApplications, pages 306–307, New York, NY, USA, 2003.ACM Press.
[10] A. Dunsmore, M. Roper, and M. Wood. Object-orientedinspection in the face of delocalisation. In Proceedings of
ICSE ’00 (22nd International Conference on SoftwareEngineering), pages 467–476. ACM Press, 2000.
[11] Elliot Berk. JLex: A Lexical Analyzer Generator for Java.Web pages at http://www.cs.princeton.edu/~appel/modern/java/JLex/, 2003.
[12] M. Kersten and G. C. Murphy. Mylar: a degree-of-interestmodel for ides. In AOSD ’05: Proceedings of the 4thinternational conference on Aspect-oriented softwaredevelopment, pages 159–168, 2005. ACM Press.
[13] M. Lanza, S. Ducasse, H. Gall, and M. Pinzger. Codecrawler— an information visualization tool for programcomprehension. In Proceedings of ICSE 2005 (27th IEEEInternational Conference on Software Engineering), pages672–673. ACM Press, 2005.
[14] W. Löwe, A. Ludwig, and A. Schwind. Understandingsoftware - static and dynamic aspects. In 17th InternationalConference on Advanced Science and Technology, pages52–57, 2001.
[15] P. Moret, W. Binder, D. Ansaloni, and A. Villazón.Visualizing Calling Context Profiles with Ring Charts. InVISSOFT 2009: 5th IEEE International Workshop onVisualizing Software for Understanding and Analysis,Edmonton, Alberta, Canada, Sep. 2009.
[16] M. Pacione, M. Roper, and M. Wood. A novel softwarevisualisation model to support software comprehension. InProceedings of the 11th Working Conference on ReverseEngineering, pages 70–79. IEEE Computer Society, 2004.
[17] M. D. Penta, R. E. K. Stirewalt, and E. Kraemer. Designingyour next empirical study on program comprehension. InProceedings of the 15th International Conference onProgram Comprehension, pages 281–285, Washington, DC,USA, 2007. IEEE Computer Society.
[18] J. Quante. Do dynamic object process graphs supportprogram understanding? - a controlled experiment. InProceedings of the 16th International Conference onProgram Comprehension (ICPC’08), pages 73–82,Washington, DC, USA, 2008. IEEE Computer Society.
[19] S. P. Reiss. Visualizing Java in action. In Proceedings ofSoftVis 2003 (ACM Symposium on Software Visualization),pages 57–66, 2003.
[20] D. Röthlisberger, M. Härry, A. Villazón, D. Ansaloni,W. Binder, O. Nierstrasz, and P. Moret. Senseo: Enrichingeclipse’s static source views with dynamic metrics. InProceedings of the 25th International Conference onSoftware Maintenance (ICSM 2009), Los Alamitos, CA,USA, 2009. IEEE Computer Society. To appear.
[21] J. Singer, R. Elves, and M.-A. Storey. NavTracks:Supporting navigation in software maintenance. InInternational Conference on Software Maintenance(ICSM’05), pages 325–335, Washington, DC, USA, sep2005. IEEE Computer Society.
[22] A. Villazón, W. Binder, and P. Moret. Aspect Weaving inStandard Java Class Libraries. In PPPJ ’08: Proceedings ofthe 6th International Symposium on Principles and Practiceof Programming in Java, pages 159–167, 2008. ACM.
[23] N. Wilde and R. Huitt. Maintenance support forobject-oriented programs. IEEE Transactions on SoftwareEngineering, SE-18(12):1038–1044, Dec. 1992.
[24] A. Zeller. Program analysis: A hierarchy. In Proceedings ofthe ICSE 2003 Workshop on Dynamic Analysis, pages 6–9,2003.
10