Embed Size (px)
Citation preview

11
Exploration and Production:Exploration and Production:
Keys to Success and Common Reasons Keys to Success and Common Reasons for Failurefor Failure
Robert ArnottRobert ArnottOxford Institute for Energy StudiesOxford Institute for Energy Studies
22nd February 200522nd February 2005

22
Keys to Success and Common Reasons for Keys to Success and Common Reasons for FailureFailure
Understanding the EP businessUnderstanding the EP business–– Phases of the business and ‘best in class’ attributesPhases of the business and ‘best in class’ attributes
Understanding Strategies of Integrated CompaniesUnderstanding Strategies of Integrated Companies–– Key to independent EP company successKey to independent EP company success
Independent EP StrategiesIndependent EP Strategies–– Identifying opportunities and niches Identifying opportunities and niches
33
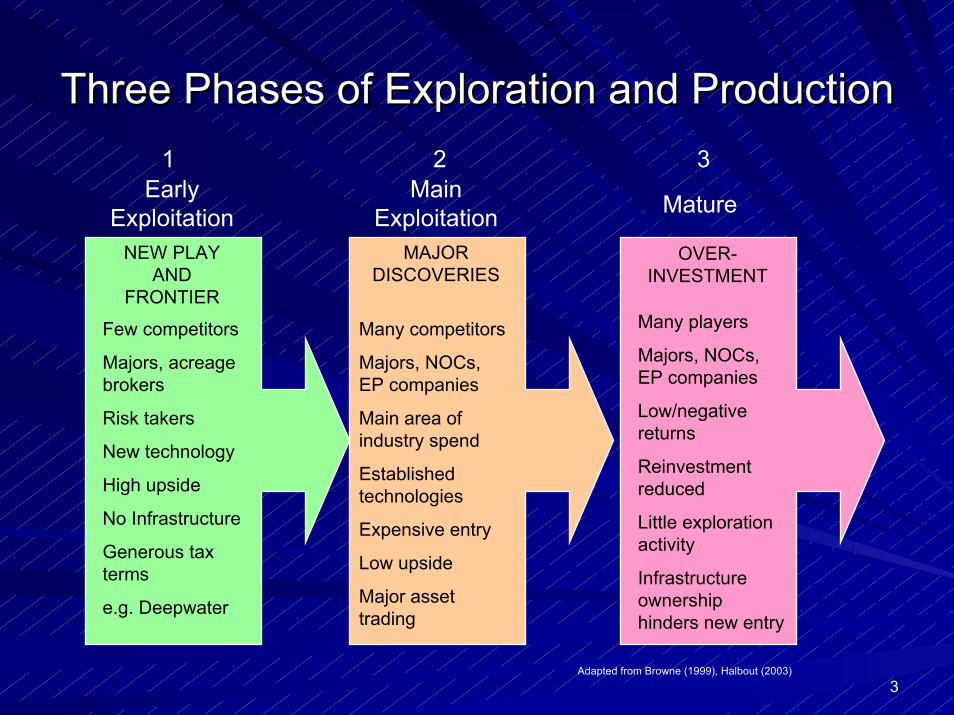
Three Phases of Exploration and ProductionThree Phases of Exploration and Production
Early Exploitation
Main Exploitation Mature
1 2 3
NEW PLAY AND
FRONTIER
MAJOR DISCOVERIES
OVER-INVESTMENT
Few competitors
Majors, acreage brokers
Risk takers
New technology
High upside
No Infrastructure
Generous tax terms
e.g. Deepwater
Many competitors
Majors, NOCs, EP companies
Main area of industry spend
Established technologies
Expensive entry
Low upside
Major asset trading
Adapted from Browne (1999), Halbout (2003)
Many players
Majors, NOCs, EP companies
Low/negative returns
Reinvestment reduced
Little exploration activity
Infrastructure ownership hinders new entry

44
Features of ‘Best In Class’Features of ‘Best In Class’Goal: A Portfolio of assets that minimises complex managerial Goal: A Portfolio of assets that minimises complex managerial structure and focuses on projects that offer the best opportunitstructure and focuses on projects that offer the best opportunity y for high profitability and growth in the near and long termfor high profitability and growth in the near and long term
VALUE CREATION
+ +
MATERIALITY CAPITAL EFFICIENCY
Number of high impact discoveries
Strategic focus
Preservation of regional knowledge
Optimised portfolio
Clear access strategy
Finding costs
Balances risk assessment
Optimised development of reserves
Clear exit strategy
Constant investment reviews
Cycle time to commercialisation
Realistic cycle times
Optimal shareholder management
Adapted from Wood (2000)

55
Integrated Oils: How do they fit this picture?Integrated Oils: How do they fit this picture?
Early Exploitation
Main Exploitation Mature
1 2 3
TOTAL
BP
EXXON
ROYAL DUTCH

66
Early Exploitation: Integrated Oil StrategyEarly Exploitation: Integrated Oil StrategyBecome a ‘basin master’Become a ‘basin master’–– Gain insight into ‘hot exploration areas’Gain insight into ‘hot exploration areas’–– Leverage longLeverage long--term relationshipsterm relationships–– First mover advantageFirst mover advantage
Example: Gulf of Mexico Deepwater Example: Aggregate Position in ‘hot’ exploration areas*
* Angola, Caspian, GoM, Nigeria
SHELL BP
EXXON
0%
5%
10%
15%
20%
25%
30%
0% 10% 20% 30%Relative Share of Acreage
Shar
e of
Res
erve
All Others
Source: J.S Herrold (2004)

77
Majors have flexibility to optimise the portfolioMajors have flexibility to optimise the portfolio
Average global success rate is 1 in 6Average global success rate is 1 in 6
Need to balance risk and rewardNeed to balance risk and reward
LOW
UK
Source: Wood Mackenzie (2003)
TYPICAL PROSPECT PORTFOLIO
RIS
K
REWARD HIGHLOW
DESIGNERFR
ON
TIE
R
Optimising the Risk
0%
10%
20%
30%
40%
50%
60%
0 200 400 600 800
Number of Wells Drilled (91-00)
Suc
cess
Rat
e
Average Commercial Success Rates
Angola (Deep)
US GoM
Source: After Wood (2000)
88
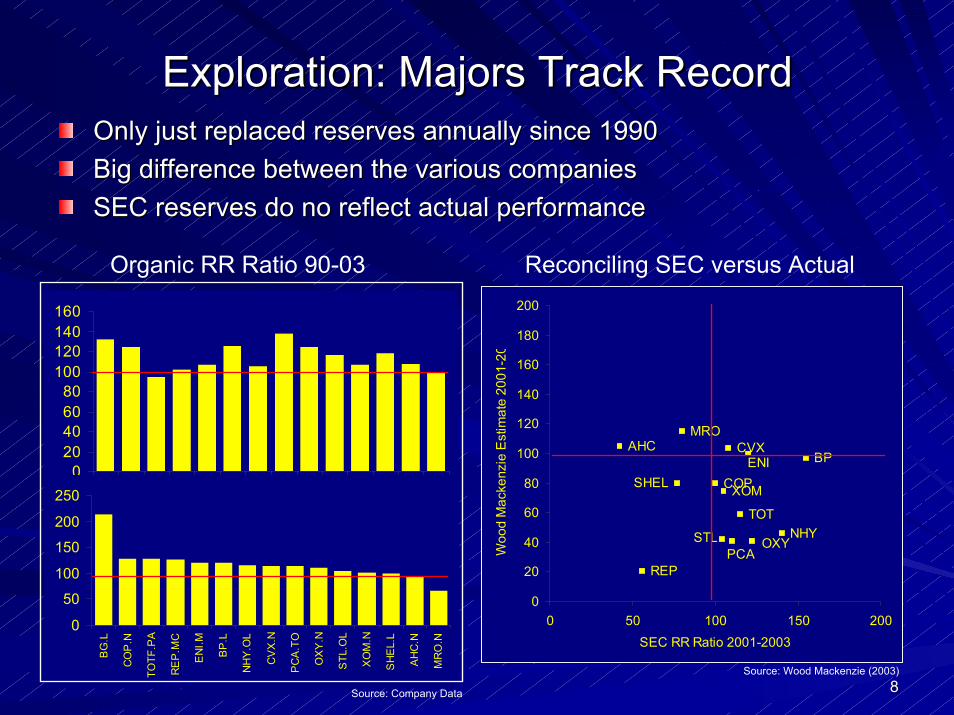
Exploration: Majors Track RecordExploration: Majors Track RecordOnly just replaced reserves annually since 1990Only just replaced reserves annually since 1990Big difference between the various companiesBig difference between the various companiesSEC reserves do no reflect actual performanceSEC reserves do no reflect actual performance
Source: Wood Mackenzie (2003)
020406080
100120140160
90 91 92 93 94 95 96 97 98 99 00 01 02 03
0
50
100
150
200
250
BG
.L
CO
P.N
TOTF
.PA
RE
P.M
C
EN
I.M
BP
.L
NH
Y.O
L
CV
X.N
PC
A.T
O
OX
Y.N
STL
.OL
XO
M.N
SH
EL.
L
AH
C.N
MR
O.N
Organic RR Ratio 90-03
MROAHC
SHEL XOM
STL OXYPCA
CVX
NHY
BPENI
REP
TOT
COP
0
20
40
60
80
100
120
140
160
180
200
0 50 100 150 200SEC RR Ratio 2001-2003
Woo
d M
acke
nzie
Est
imat
e 20
01-2
0
Reconciling SEC versus Actual
Source: Company Data

99
Exploration: Have the Majors Added Value?Exploration: Have the Majors Added Value?
Majors have invested $50 billion from 1996Majors have invested $50 billion from 1996--20012001Only created $23 billion in valueOnly created $23 billion in valueOnly 13 out of 25 companies have added valueOnly 13 out of 25 companies have added value
Exploration spend vs NPV Value Added vs Income
0
2000
4000
6000
8000
10000
12000
14000
96 97 98 99 00 01 02 03
US
D m
illio
Total Exploration CostNPV of Discoveries
XOMBPCHV
TOT]SHEL
TOT
SHELTOT
CHV XOMBP
SHEL
CHV
BP XOM
-8.0
-6.0
-4.0
-2.0
0.0
2.0
4.0
6.0
0.0 2.0 4.0 6.0 8.0 10.0
Net Income per Barrel
Valu
e A
dded
/USD
Spe
Source: OIES (2005)Source: Wood Mackenzie (2003)
1010
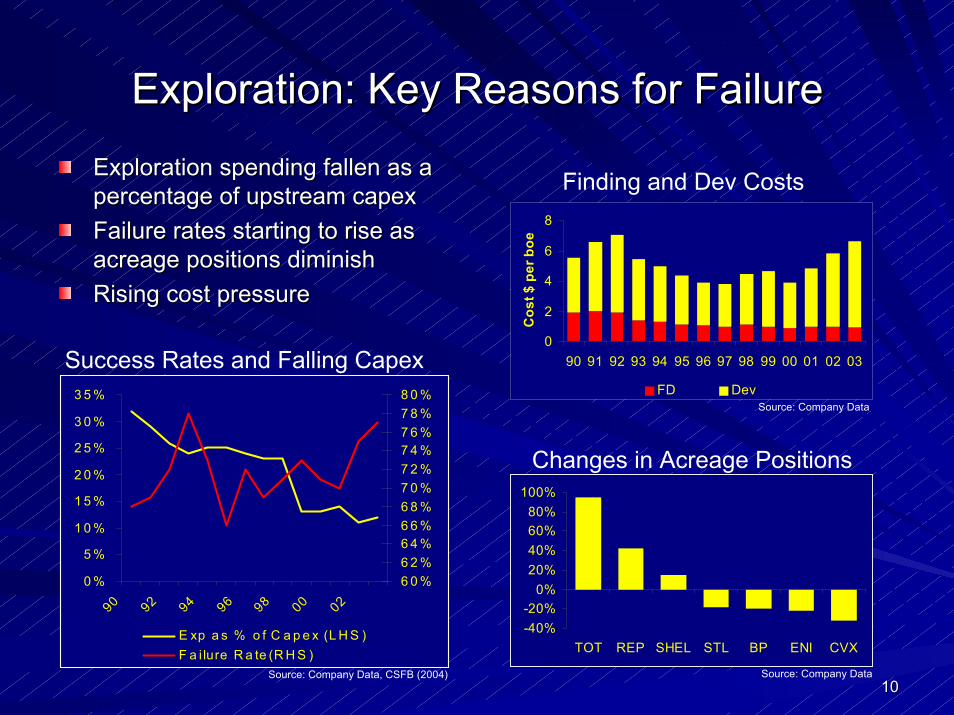
Exploration: Key Reasons for FailureExploration: Key Reasons for Failure
0 %
5 %
1 0 %
1 5 %
2 0 %
2 5 %
3 0 %
3 5 %
90 92 94 96 98 00 02
6 0 %6 2 %6 4 %6 6 %6 8 %7 0 %7 2 %7 4 %7 6 %7 8 %8 0 %
E xp a s % o f C a p e x (L H S )F a i lure R a te (R H S )
0
2
4
6
8
90 91 92 93 94 95 96 97 98 99 00 01 02 03
Cos
t $ p
er b
oe
FD Dev
-40%-20%
0%20%40%60%80%
100%
TOT REP SHEL STL BP ENI CVX
Finding and Dev Costs
Changes in Acreage Positions
Success Rates and Falling Capex
Source: Company Data, CSFB (2004)
Source: Company Data
Source: Company Data
Exploration spending fallen as a Exploration spending fallen as a percentage of upstream capexFailure rates starting to rise as Failure rates starting to rise as acreage positions diminishRising cost pressure
percentage of upstream capex
acreage positions diminishRising cost pressure
1111
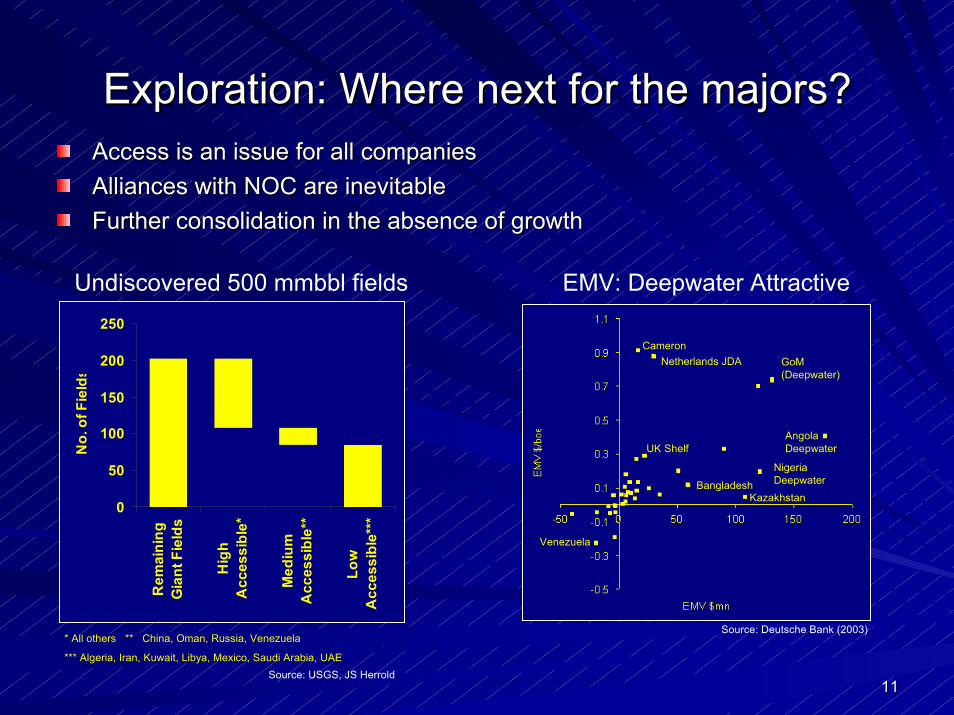
Exploration: Where next for the majors?Exploration: Where next for the majors?Access is an issue for all companiesAccess is an issue for all companiesAlliances with NOC are inevitableAlliances with NOC are inevitableFurther consolidation in the absence of growthFurther consolidation in the absence of growth
EMV: Deepwater Attractive
0
50
100
150
200
250
Rem
aini
ngG
iant
Fie
lds
Hig
hA
cces
sibl
e*
Med
ium
Acc
essi
ble*
*
Low
Acc
essi
ble*
**
No.
of F
ield
s
Undiscovered 500 mmbbl fields
CameronNetherlands JDA
UK ShelfAngola Deepwater
KazakhstanBangladesh
Venezuela
Source: Deutsche Bank (2003)
GoM (Deepwater)
Nigeria Deepwater
* All others ** China, Oman, Russia, Venezuela
*** Algeria, Iran, Kuwait, Libya, Mexico, Saudi Arabia, UAESource: USGS, JS Herrold

1212
Mature Provinces: Majors StrategyMature Provinces: Majors Strategy
01234567
90 91 92 93 94 95 96 97 98 99 00 01 02 03
Cos
t $ p
er b
oe
012345678
90 91 92 93 94 95 96 97 98 99 00 01 02 03
Cos
t $ p
er b
oe
0
2000
4000
6000
8000
10000
12000
90 92 94 96 98 00 02
mm
boe
Volume of Reserves Traded
Production costs reduced
Earnings enhanced
Source: Company Data
Source: Company Data
Source: Company Data
Focus on cost reductionFocus on maximising marginsFocus on portfolio optimisation
Focus on cost reductionFocus on maximising marginsFocus on portfolio optimisation

1313
Main Exploitation: ‘Cash Cow’ for MajorsMain Exploitation: ‘Cash Cow’ for MajorsMain area of investment but…Main area of investment but…Internal and external constraints on growthInternal and external constraints on growthMore money now returned to shareholders than invested upstreamMore money now returned to shareholders than invested upstream
0102030405060708090
100
Internal CashFlow
SharesDividends
Capex
Majors Internally Financed and…
Source: OIES, Company Data
0
10000
20000
30000
40000
50000
60000
90 92 94 96 98 00 02 04
$m
EP Capex Share Buybacks
Cash Returned to Shareholders
Source: OIES, Company Data
1414
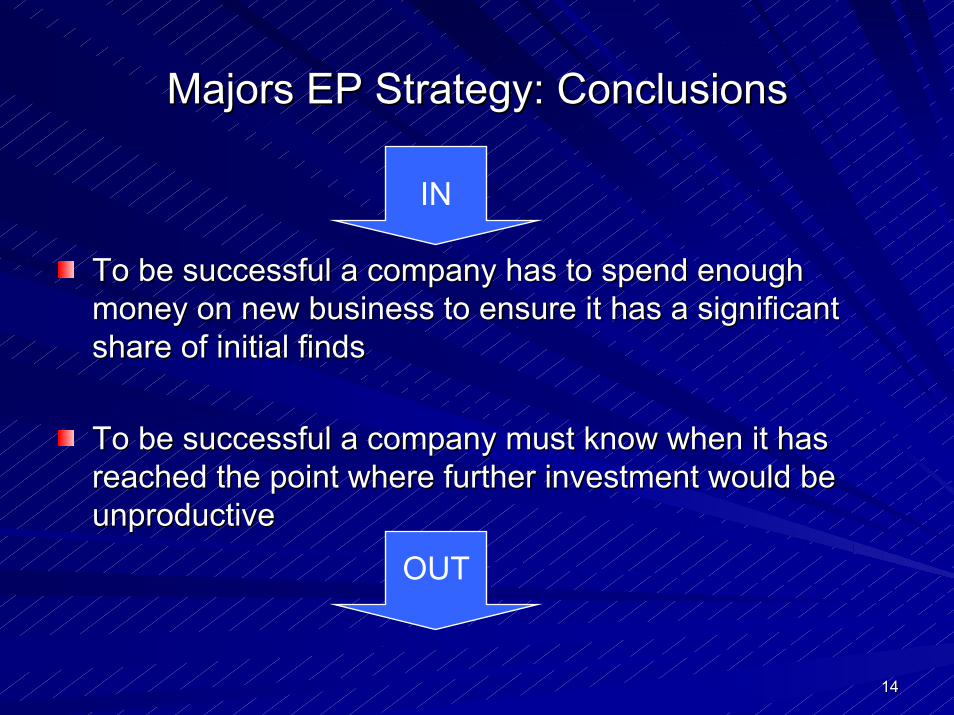
Majors EP Strategy: ConclusionsMajors EP Strategy: Conclusions
To be successful a company has to spend enough To be successful a company has to spend enough money on new business to ensure it has a significant money on new business to ensure it has a significant share of initial findsshare of initial finds
To be successful a company must know when it has To be successful a company must know when it has reached the point where further investment would be reached the point where further investment would be unproductiveunproductive
IN
OUT

1515
What Determines EP Company Success?What Determines EP Company Success?
Operations
Reserves Growth
Production Growth
Finance
Cash Flow Growth
NAV Growth
Equity Market
Where in the cycle?
Access to funding
Commodity Prices
Oil/Gas Prices
TOTAL SHAREHOLDER
RETURN
Growth in Capital
Return of Capital
WITHIN CONTROL OUT OF CONTROL

1616
EP Companies: Where do they fit?EP Companies: Where do they fit?
Early Exploitation
Main Exploitation Mature
1 2 3
e.g. Desire e.g. Venture e.g. Acorn
e.g. Cairn, Lundin e.g. Paladin
1717
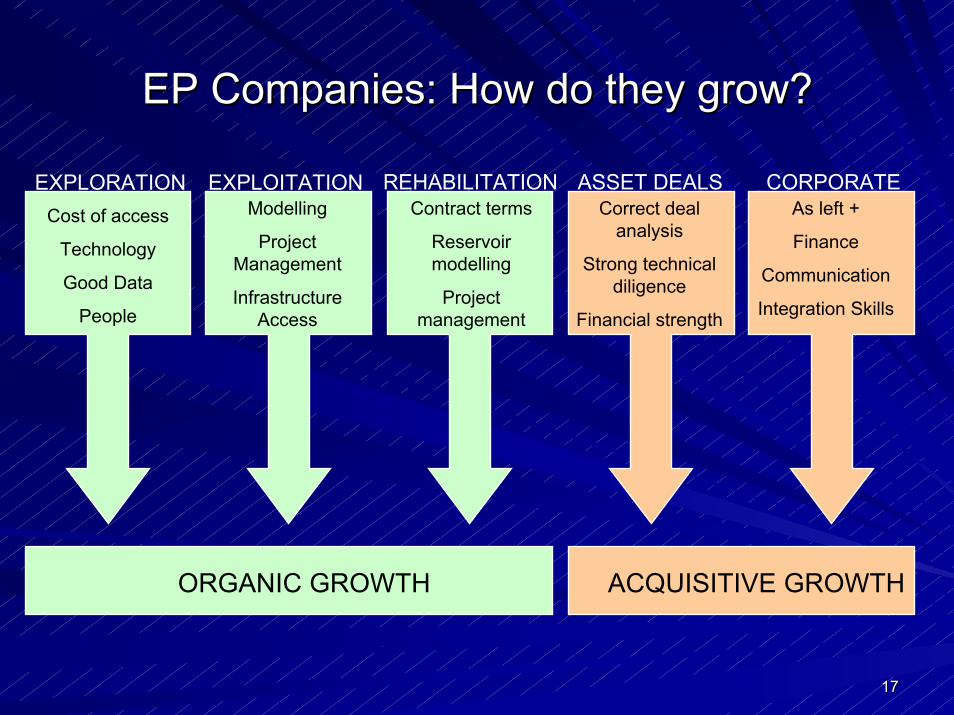
EP Companies: How do they grow?EP Companies: How do they grow?
CORPORATECost of Access
Technology
Data
People
EXPLORATION EXPLOITATION REHABILITATION ASSET DEALSModelling
Project Management
Infrastructure Access
Contract terms
Reservoir modelling
Project management
Correct deal analysis
Strong technical diligence
Financial strength
As left +
Finance
Communication
Integration Skills
Cost of access
Technology
Good Data
People
ORGANIC GROWTH ACQUISITIVE GROWTH
1818
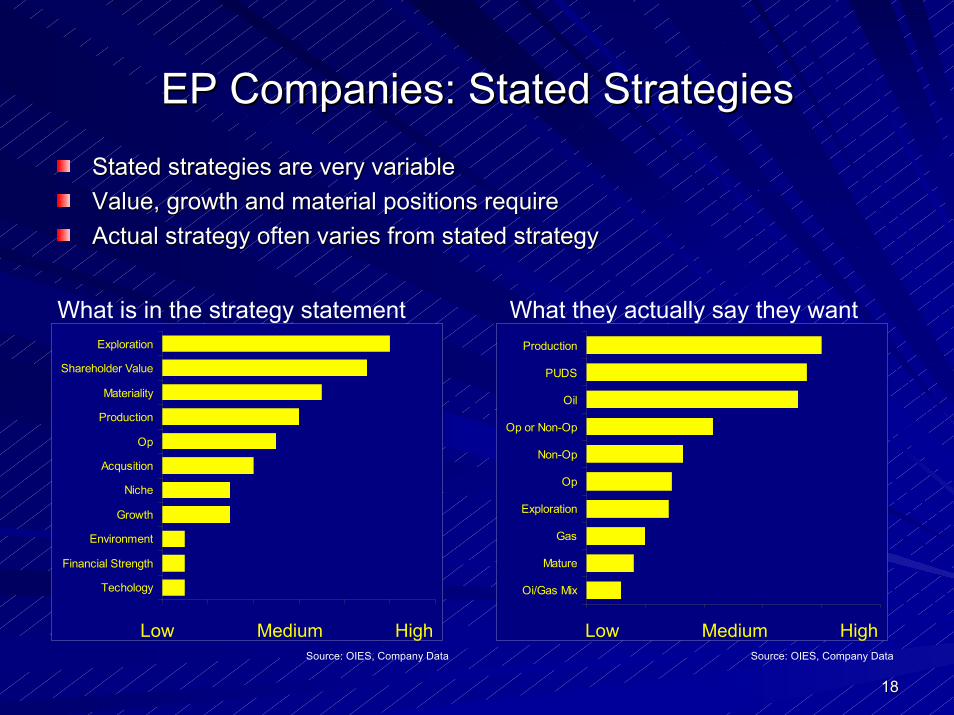
EP Companies: Stated StrategiesEP Companies: Stated Strategies
Stated strategies are very variableStated strategies are very variableValue, growth and material positions requireValue, growth and material positions requireActual strategy often varies from stated strategyActual strategy often varies from stated strategy
What is in the strategy statement What they actually say they want
Oi/Gas Mix
Mature
Gas
Exploration
Op
Non-Op
Op or Non-Op
Oil
PUDS
Production
Techology
Financial Strength
Environment
Growth
Niche
Acqusition
Op
Production
Materiality
Shareholder Value
Exploration
Low Medium High Low Medium HighSource: OIES, Company Data Source: OIES, Company Data

1919
EP Companies: Strategic DifferentiationEP Companies: Strategic DifferentiationDespite offering balance strategies clear distinction between :Despite offering balance strategies clear distinction between :–– Companies who have added all reserves through acquisitionsCompanies who have added all reserves through acquisitions–– Companies who have added all reserves through explorationCompanies who have added all reserves through exploration
0%
10%
20%
30%
40%
50%
60%
70%
80%
90%
100%
ED
G.L
CN
E.L
CU
X.L
JKX
.L
PM
O.L
MR
S.L
DN
O.N
O
VP
C.L
DN
X.L
TLW
.L
PLR
.L
SIA
.L
BU
R.L
RO
S.L
Acquisitions Exploration
Additions through E or A
-50%
0%
50%
100%
150%
200%
250%
-50.0% 0.0% 50.0% 100.0% 150.0%
Proportion of Cashflow Spent on Acquisitions
Pro
porti
on o
f Cas
hflo
w S
pent
on
Expl
orat
E Driven
A Driven
Capex is either E or A driven
Source: OIES, Company DataSource: OIES, Company Data

2020
EP Companies: Just how successful?EP Companies: Just how successful?Most of the growth in the sector comes through acquisitions (cheMost of the growth in the sector comes through acquisitions (cheaper)aper)Step change exploration success is rare (volatile)Step change exploration success is rare (volatile)
012345678
99 00 01 02 03
$/bo
e
Proved Acquistion Cost FD Cost
0%10%20%30%40%50%60%70%80%90%
100%
ED
G.L
SIA
.L
CN
E.L
PM
O.L
DN
X.L
SE
:LU
PE
DN
O.N
O
MR
S.L
TLW
.L
PLR
.L
JKX
.L
BU
R.L
CU
X.L
RO
S.L
Exploration Development Acqusitions
0
10
20
30
40
50
90 91 92 93 94 95 96 97 98 99 00 01 02 03
$/bo
e
0.7
42.638.9
6.9 4.00.8
11.3
3.6 5.3 7.1
19.1
2.7
23.7
0.50.05.0
10.015.020.025.030.035.040.045.0
BU
R.L
CN
E.L
CU
X.L
DN
X.L
DN
O.N
O
EDG
.L
JKX
.L
MR
S.L
PLR
.L
PM
O.L
RO
S.L
SIA
.L
TLW
.L
LUP
E:ST
$/bo
e
Erratic FD track record Cheaper to buy than explore
FD Cost 01-03 Hit or miss! Capital Allocation 01-03
Source: OIES, Company Data Source: OIES, Company Data
Source: OIES, Company DataSource: OIES, Company Data
2121
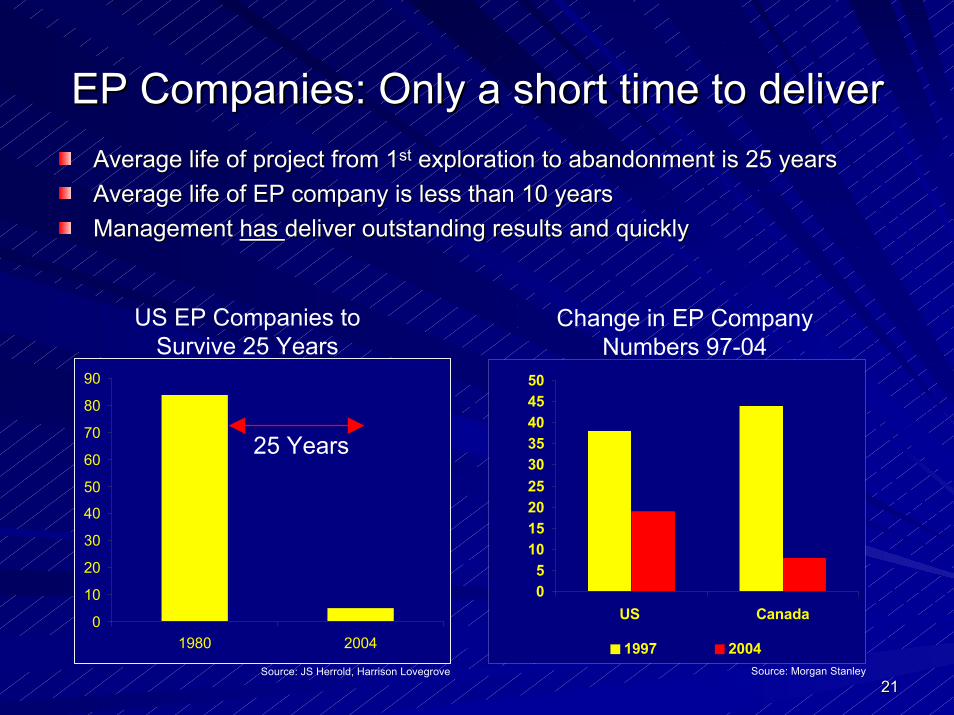
EP Companies: Only a short time to deliverEP Companies: Only a short time to deliverAverage life of project from 1Average life of project from 1stst exploration to abandonment is 25 yearsexploration to abandonment is 25 yearsAverage life of EP company is less than 10 yearsAverage life of EP company is less than 10 yearsManagement Management has has deliver outstanding results and quicklydeliver outstanding results and quickly
0
10
20
30
40
50
60
70
80
90
1980 2004
05
101520253035404550
US Canada
1997 2004
25 Years
US EP Companies to Survive 25 Years
Change in EP Company Numbers 97-04
Source: JS Herrold, Harrison Lovegrove Source: Morgan Stanley

2222
EP Companies Usually Capital ConstrainedEP Companies Usually Capital Constrained
Most EP companies rely on ‘Other Peoples Money’ to:Most EP companies rely on ‘Other Peoples Money’ to:–– Finance the gap between cash flow and explorationFinance the gap between cash flow and exploration–– Run the business as a going concernRun the business as a going concern
Failure to maintain a robust balance sheet is common concernFailure to maintain a robust balance sheet is common concern
020406080
100120140160180200
Internal CashFlow
OutsideFinance
Capex
Living Outside of Means (01-03)
Source: OIES, Company Data
EQUITY
FAILURESUCCESS
OPPORTUNITY BEGGING BOWL
A Fine Line between Success & Failure
Source: OIES
2323
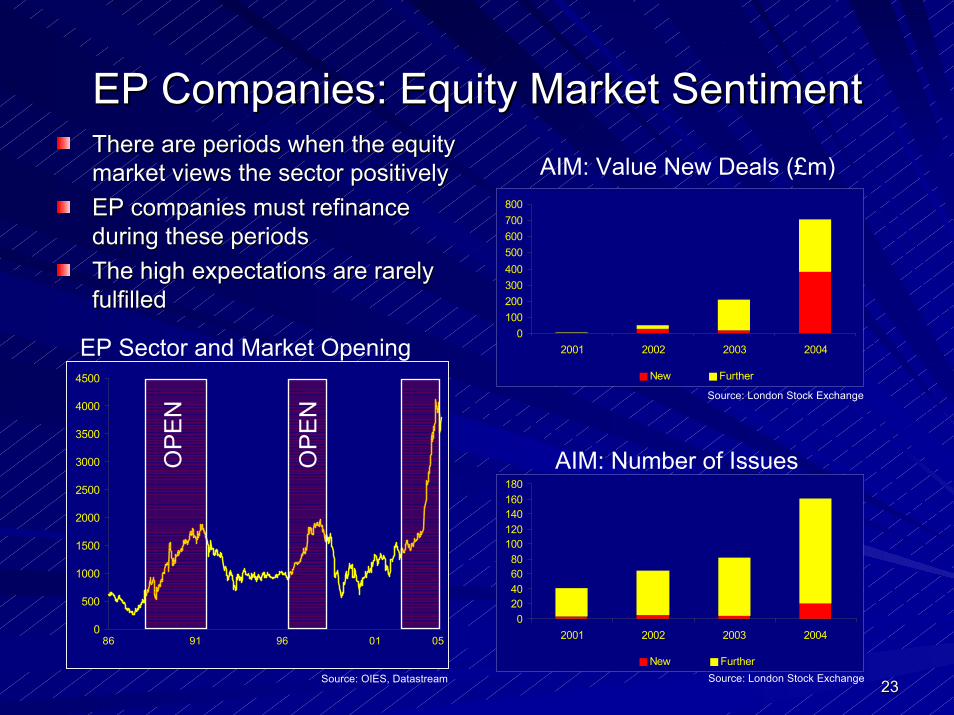
EP Companies: Equity Market SentimentEP Companies: Equity Market SentimentThere are periods when the equity There are periods when the equity market views the sector positivelyEP companies must refinance EP companies must refinance during these periodsThe high expectations are rarely The high expectations are rarely fulfilled
AIM: Value New Deals (£m)market views the sector positively
020406080
100120140160180
2001 2002 2003 2004
New Further
0100200300400500600700800
2001 2002 2003 2004
New Further
AIM: Number of Issues
Source: OIES, Datastream
Source: London Stock Exchange
Source: London Stock Exchange
0
500
1000
1500
2000
2500
3000
3500
4000
4500
OP
EN
OP
EN
EP Sector and Market Opening
86 91 96 01 05
during these periods
fulfilled
2424
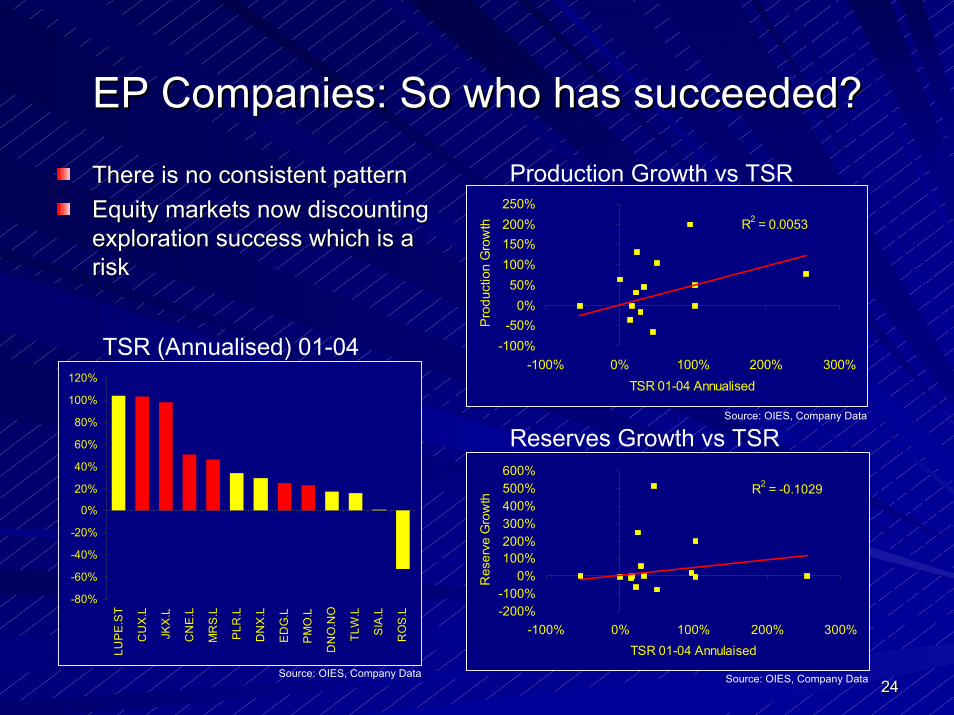
EP Companies: So who has succeeded?EP Companies: So who has succeeded?
R2 = 0.0053
-100%-50%
0%50%
100%150%200%250%
-100% 0% 100% 200% 300%TSR 01-04 Annualised
Pro
duct
ion
Gro
wth
Production Growth vs TSR
Reserves Growth vs TSR
Source: OIES, Company Data
Source: OIES, Company Data
-80%
-60%
-40%
-20%
0%
20%
40%
60%
80%
100%
120%
LUP
E.S
T
CU
X.L
JKX
.L
CN
E.L
MR
S.L
PLR
.L
DN
X.L
ED
G.L
PM
O.L
DN
O.N
O
TLW
.L
SIA
.L
RO
S.L
R2 = -0.1029
-200%-100%
0%100%200%300%400%500%600%
-100% 0% 100% 200% 300%TSR 01-04 Annulaised
Res
erve
Gro
wth
TSR (Annualised) 01-04
Source: OIES, Company Data
There is no consistent patternEquity markets now discounting Equity markets now discounting exploration success which is a exploration success which is a risk
There is no consistent pattern
risk

2525
EP Companies: Common Reasons for FailureEP Companies: Common Reasons for Failure
‘Scatter Gun’ approach to exploration‘Scatter Gun’ approach to explorationExtremely diversified portfolio and failure to deliver projects Extremely diversified portfolio and failure to deliver projects Weak balance sheet Weak balance sheet No clear exit strategyNo clear exit strategy
Source: Harris, Jeffs (1993)
Niche Domestic
DiversifiedUnder-capitalised
Size
Div
ersi
ty
Elephant Hunter
Chairman’s Folly
EntrepreneurCaptain Sensible
NewExisting
Exi
stin
gN
ew
2626
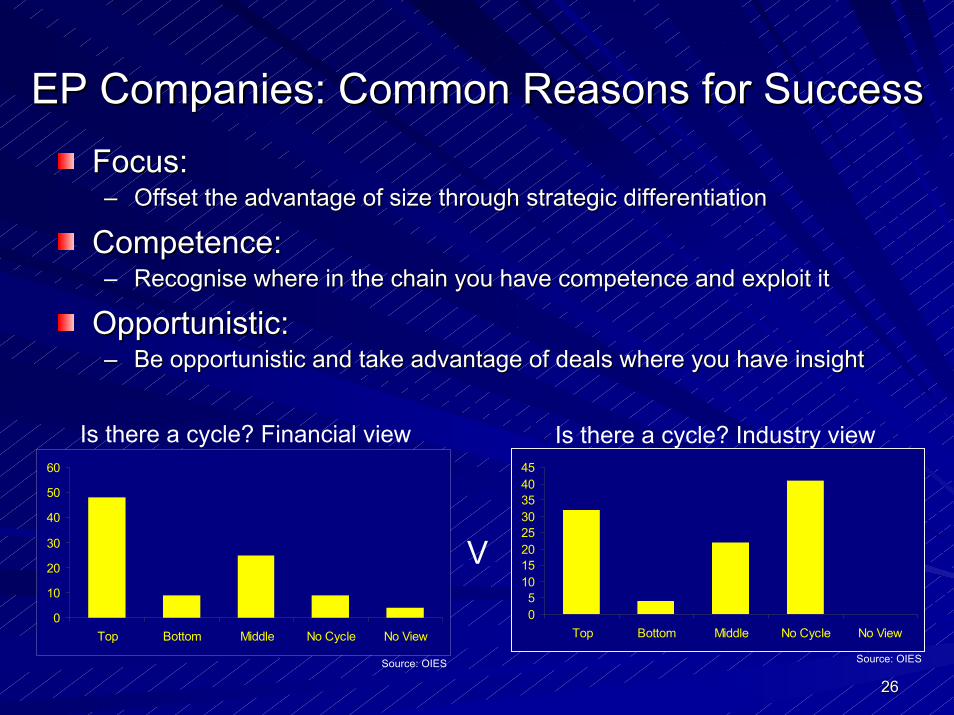
EP Companies: Common Reasons for SuccessEP Companies: Common Reasons for SuccessFocus:Focus:–– Offset the advantage of size through strategic differentiationOffset the advantage of size through strategic differentiation
Competence:Competence:–– Recognise where in the chain you have competence and exploit itRecognise where in the chain you have competence and exploit it
Opportunistic:Opportunistic:–– Be opportunistic and take advantage of deals where you have insiBe opportunistic and take advantage of deals where you have insightght
0
10
20
30
40
50
60
Top Bottom Middle No Cycle No View
05
1015202530354045
Top Bottom Middle No Cycle No View
Is there a cycle? Financial view Is there a cycle? Industry view
V
Source: OIESSource: OIES
2727
Even Fools are Lucky!Even Fools are Lucky!
But to achieve consistency need to:But to achieve consistency need to:
–– Deliver above average results. This typically occurs when a nichDeliver above average results. This typically occurs when a niche is exploitede is exploited
–– Remain entrepreneurial, flexible and opportunistic, keeping all Remain entrepreneurial, flexible and opportunistic, keeping all options openoptions open
–– Remember that teams are usually too small to deal with more thanRemember that teams are usually too small to deal with more than a 3 core a 3 core area strategy. area strategy.
Remember that:Remember that:–– The growth potential of an individual company that competently eThe growth potential of an individual company that competently exploits axploits a
niche is significantly higher than all the factors that infniche is significantly higher than all the factors that influence the entire groupluence the entire group

2828
Exploration and Production:Exploration and Production:
Keys to Success and Common Reasons Keys to Success and Common Reasons for Failurefor Failure
Robert ArnottRobert ArnottOxford Institute for Energy StudiesOxford Institute for Energy Studies
22nd February 200522nd February 2005