Embed Size (px)
Citation preview

A set is a group of items, such as a group of numbers. For example,the numbers that appear on a telephone keypad form a set. Theitems in a set are called elements.
1. One method of describing a set is to list its elements insidea pair of braces, {t} . Use this notation to write the set ofnumbers found on a telephone keypad.
2. You can also describe a set by describing its properties. Describe the set of numbers found on a telephone keypad without listing them.
3. List four numbers that are NOT included in the set youdescribed in Problem 2.
THINK AND DISCUSS 4. Explain how terms such as natural numbers, whole
numbers, and integers can help youdescribe a set.
5. Describe the set of numbers that appear on a football field.
50504040
4040
3030
3030
2020
20201010
1010
50504040
4040
3030
3030
2020
20201010
1010
5040
40
30
30
20
2010
10
5040
40
30
30
20
2010
10
Sets of Numbers1-1
{0, 1, 2, 3, 4, 5, 6, 7, 8, 9}
Possible answer: 0.5, 1.75, ��
8 , �
Possible answer: whole numbers less than 10
4. Possible answer: Using these types of terms to describe a set is sometimes easier than listing each element when a set is very large.
5. Possible answer: integer multiples of 10 that are greater than or equal to 10 and less than or equal to 50
ex plo rat i o n
1 Holt Algebra 2All rights reserved.

You may use a calculator to help you with the following problems.
Tell whether each statement is true or false.
1. 6 � ��2 � � ��2 � � 6 2. 8 � ��2 � � ��2 � � 8
3. 5 � 4 � 1 � 1 � 4 � 5 4. 20 � 5 � 2 � 2 � 5 � 20
5. 3 �7 � � 7 �3 � 6. 7 � 3 � 2 � 2 � 7 � 3
7. 9 � 3 � 3 � 9 8. 10 � 20 � 30 � 30 � 20 � 10
9. Based on your answers to Problems 1–8, for which operations(addition, subtraction, multiplication, and division) does theorder of the numbers make a difference in the result?
Tell whether each statement is true or false.
10. �8 � 4 � � 2 � 8 � �4 � 2 � 11. �9 � 4 � � 3 � 9 � �4 � 3 �
12. �5 � 4 � � 1 � 5 � �4 � 1 � 13. 21 � �32 � 43� � �21 � 32� � 43
14. Based on your answers to Problems 10–13, for which operations(addition, subtraction, multiplication, and division) does thegrouping of the numbers make a difference in the result?
THINK AND DISCUSS 15. Discuss how the properties you explored above might help
you find 13 � 20 � 5 by using mental math.
16. Discuss whether it would matter which operation you did firstif you had more than one operation in a problem.
Properties of Real Numbers1-2
subtraction and division
truefalse
false true
subtraction and division
true
true true
truefalse
false
falsefalse
15. Possible answer: The grouping of the numbers does not make a difference in multiplication. Group 20 and 5 because these two numbers are easy to multiply mentally. 13 � � 20 � 5 � � 13 � 100 � 1300
16. Possible answer: Yes; in some cases, the order of operations would matter. For example, if you simplified 2 � 3 � 4 by adding first, you would get 20. If you simplified 2 � 3 � 4 by multiplying first, you would get 14.
ex plo rat i o n
Copyright © by Holt, Rinehart and Winston. 2 Holt Algebra 2All rights reserved.

You can use a calculator to help youinvestigate some properties of square roots.
To enter square roots, press .
1. Find the value of each expression in thetable. Round to the nearest thousandth.
Expression Value Expression Value
��
��3 � ��
��5 ��
��15 �
���7 � �
���2 �
���14
��
��50 � ��
��2 ��
��100
2. Based on your answers to Problem 1, what can you sayabout ����a � �
���b ?
3. Find the value of each expression in the table. Round to thenearest thousandth.
Expression Value Expression Value
��
��15 ____�
���5
� ��
��3
��
��60 ____�
���12
��
��5
��
��100 _____�
���4
��
��25
4. Based on your answers to Problem 3, what can you sayabout �
���a ___�
���b
?
THINK AND DISCUSS 5. Explain how you can use one of the properties you
discovered above to simplify ��
��5 � ��
��20 by using mental math.
Square Roots1-3
3.873
3.742
10
3.873
3.742
10
Possible answer: �� a � �� b � ��
ab
1.732
2.236
5
1.732
2.236
5
Possible answer: �� a ___
�� b � �
� a _
b
5. Possible answer: Rewrite the expression as the square root of a product. Then simplify. �
� 5 · �
� 20 � �
� 5 · 20 � �
� 100 � 10
ex plo rat i o n
Copyright © by Holt, Rinehart and Winston. 3 Holt Algebra 2All rights reserved.

Simplifying Algebraic Expressions1-4
Order of Operations
Whenever you simplify numerical or algebraic expressions, it isimportant to perform the operations in the correct order.
Simplify each expression. In each case, think about the order in which you should do the operations.
1. �7 � 2 �2 � 5 2. [ �2 � 10 � � �4 � 1 �]2
3. 3 � 5 �21 � 19 �3 4. [ �3 3 � 1 � � 13 ]2
5. Check your answers to Problems 1–4 by entering eachexpression into a graphing calculator.
6. The order of operations tells you thesequence in which you should performoperations. Fill in the flow chart byarranging the steps given below inthe correct order.
• Add and subtract from left to right.
• Parentheses
• Multiply and divide from left to right.
• Exponents
THINK AND DISCUSS 7. Explain how you can use the order of operations to evaluate
x 2 � �x � y � when x � �3 and y � 4.
8. Discuss whether x � �y � 1 � and x � y � 1 are equivalentexpressions. How does the order of operations determine thevalue of the expressions?
1.
2.
3.
4.
76
�37
25
4
7. Possible answer: Substitute �3 for x and 4 for y : � �3 � 2 � � �3 � 4 � . Simplify the expression in parentheses, then square �3, and finally perform the subtraction. � �3 � 2 � � �3 � 4 � � � �3 � 2 � 1 � 9 � 1 � 8
8. No; possible answer: in the first expression, 1 is added to y and then the sum is subtracted from x. In the second expression, y is subtracted from x and then 1 is added to the difference.
from left to right.
from left to right.
Parentheses
Exponents
Multiply and divide
Add and subtract
ex plo rat i o n
Copyright © by Holt, Rinehart and Winston. 4 Holt Algebra 2All rights reserved.

Properties of Exponents1-5
You can use a calculator to help youinvestigate some properties of exponents.Use the key to indicate an exponent.
1. Find the value of each expression in the table.
Expression Value Expression Value
2 2 � 2 3 25
4 3 � 4 3 4 6
10 2 � 10 5 10 7
2. Based on your answers to Problem 1, what can you sayabout a m � a n?
3. Find the value of each expression in the table.
Expression Value Expression Value 2 5___22 2 3
5 3___5 1
5 2
10 6____10 3
10 3
4. Based on your answers to Problem 3, what can you say
about a m___a nn
?
THINK AND DISCUSS 5. Explain how you can use one of the properties you
discovered above to simplify 12 7____126 by_ using mental math.
32
4096
10,000,000
32
4096
10,000,000
8
25
1000
5. Possible answer: Rewrite the expression as a power of 12 by subtracting
the exponents. Then simplify. 12 7 ____ 12 6
� 12 7�6 � 12 1 � 12
Possible answer: a m __ a n
� a m�n
8
25
1000
Possible answer: a m
� a n � a
m�n
ex plo rat i o n
Copyright © by Holt, Rinehart and Winston. 5 Holt Algebra 2All rights reserved.

Relations and Functions1-6
A relation is a pairing of values that can be written as a set ofnordered pairs. A function is a special type of relation. Use theninformation below to explore what makes a function different from other types of relations.
Functions Not Functions
x y x y x y x y x y x y0 1 0 2 �2 3 0 1 1 �5 �2 11 1 2 1 0 2 0 2 2 �4 2 42 1 5 �1 2 4 1 3 3 �5 2 �43 1 9 �4 4 5 1 4 1 �4 �2 �1
1. Examine the x-values in the tables. Make a conjecture aboutxxthe x-values in a function.xx
2. Does your conjecture apply to y-values as well? Explain.yy
3. Use your conjecture to determine whether the ordered pairsin each table represent a function.
a. b.x �2 �1 0 �1 �2y 5 4 3 2 1
x �2 �1 0 1 2y 3 5 7 5 3
THINK AND DISCUSS 4. Describe what makes a relation a function.
Possible answer: The x-values in a function
never repeat.
No; possible answer: the first function has a y-value that repeats.
Possible answer: If a relation has only one y-value for each x-value, then it is a function.
no yes
ex plo rat i o n
6 Holt Algebra 2All rights reserved.

Felicia is driving to see her parents. When shestarts, she is at mile marker 50 on the interstate.She drives at an average speed of 60 mi/h. Inthe table, t stands for time in hours, and d �t �stands for the mile marker number at time t.tt
1. Complete the table to show the milemarker where Felicia is at each half hour.
You can also use a calculator to determineFelicia’s location at various times. Enter thefunction rule by pressing and entering 50 � 60X as shown. Then press to return to the home screen. Select the function you entered by pressing ,scrolling right to Y-VARS, selecting 1:Function, and choosing 1:Y1. You can evaluate the function for any x-value by xxentering a value in parentheses, as shown.
2. Use your calculator to find Y1 �3.5 � .
3. Explain what Y1 �3.5 � represents.
4. Felicia’s exit is at mile marker 362. Determine how manyhours it will take her to get there.
THINK AND DISCUSS 5. Describe the method you used to solve Problem 4.
6. Discuss whether Y1 �–3 � has meaning in the context of thisproblem.
Function Notation1-7
t d � t �
0 d �0 � � 50
0.5
1 d �1 � � 110
1.5
2
d � 0.5 � � 80
d � 1.5 � � 140
d � 2 � � 170
260
5.2 h � 5 h 12 min �
3. the mile marker where Felicia is after 3.5 h of driving 5. Possible answer: Solve the equation 362 � 50 � 60x for x. 6. Y1 � �3 � would represent Felicia’s location 3 h before she started, so it is not meaningful
in this context.
ex plo rat i o n
Copyright © by Holt, Rinehart and Winston. 7 Holt Algebra 2All rights reserved.

You can explore transformations by using the graph of a line on agraphing calculator.
Graph y � x on a graphing calculatorx by pressing andentering Y1 � X as shown. Then press to see the graph.
1. Enter and graph Y2 � X � 5. Describe the graph of Y2 as compared to the graph of Y1.
2. Enter and graph Y3 � X � 5. Describe the graph of Y3 as compared to the graph of Y1.
3. Make a conjecture about how a change in the value of k in kthe equation y � x � k affects the equation’s graph.k
THINK AND DISCUSS 4. Explain what equation you would use to move the graph of
y � x down 3 units.x
5. Describe how the graph of y � x � 100 differs from the graph of y � x.
Exploring Transformations1-8
y � x � 3
1. The graph of Y2 is the graph of Y1 shifted 5 units up (or 5 units left).
2. The graph of Y3 is the graph of Y1 shifted 5 units down (or 5 units right).
3. The graph shifts up (or left) k units if k is positive and down (or right) |k | units if k is negative.
5. The graph of y � x � 100 is the graph of y � x shifted 100 units up (or 100 units left).
ex plo rat i o n
Copyright © by Holt, Rinehart and Winston. 8 Holt Algebra 2All rights reserved.

Introduction toParent Functions1-9
Although there are an infi nite number of functions, many functionscan be grouped into families that have similar characteristics.
1. Use your calculator to graph y � x 2 by pressing ,entering Y1 � X 2, and pressing . Describe the graph.
2. Enter and graph Y2 � X 2 � 2. Describe the graph of Y2 ascompared to the graph of Y1.
3. Enter and graph Y3 � 2X2. Compare this graph to the graphsfrom Problems 1 and 2.
4. Enter and graph Y4 � 2X 2 � 6. Compare this graph to thegraphs above.
5. Make a conjecture about the shape of the graphs of functionsof the form y � ax 2 � b.
THINK AND DISCUSS 6. Explain what the graphs of functions of the form y � mx � b
look like. 1. Possible answer: The graph is U shaped, with the lowest point at � 0, 0 � .
2. The graph of Y2 is the graph of Y1 shifted 2 units up.
3. The graph of Y3 is narrower than the graphs of Y1 and Y2, with its lowest point at � 0, 0 � .
4. The graph of Y4 is narrower than the graphs of Y1 and Y2, with its lowest pointat � 0, �6 � .
5. Possible answer: The graphs are U shaped, with the lowest point at � 0, b � . The value of a determines how narrow the graphs are.
6. Possible answer: The graphs are lines that cross the y-axis at � 0, b � . The value of mdetermines how steep the lines are.
ex plo rat i o n
Copyright © by Holt, Rinehart and Winston. 9 Holt Algebra 2All rights reserved.

ex plo rat i o n
Copyright © by Holt, Rinehart and Winston. 10 Holt Algebra 2All rights reserved.
Solving Linear Equations and Inequalities2-1
A group of ten friends are on vacationin Canada. They decide to rent an ice-skating rink so they can play hockey.
1. Everyone in the group needs to rent equipment. Writean expression for the total cost of the equipment forx hours. x
2. Write an expression for the total cost of the rink and theequipment for x hours.x
3. Use your expression to help you complete the table.
Time � h � 1 2 3 4 5 6 7 8Total Cost � $ �
4. The rink and equipment can be rented only in whole-hourincrements. The friends want to spend less than $350. Forhow many hours can they rent the rink and equipment?
THINK AND DISCUSS 5. Describe another method you could use to solve Problem 4,
other than making a table.
6. Explain how the solution to Problem 4 would change if a10% tax were added to the bill.
$140 $180 $220 $260 $300 $340 $380 $420
50 � 15x
100 � 40x
6 hours
5. Write and solve the inequality 100 � 40x � 350. 6. In this case, they could afford only 5 hours because the cost for 5 hours would be
1.1 � $300 � $330.

ex plo rat i o n
Copyright © by Holt, Rinehart and Winston. 11 Holt Algebra 2All rights reserved.
Sara is a graphic artist. She has designedthis rectangular logo for a chain of supermarkets.
1. The logo will be available in different sizes, as shown in the table. Describe anypatterns formed by the numbers in the table.
Length (in.) 4 5 6 7 8Height (in.) 3 3.75 4.5 5.25 6
2. What should the height of the logo be if the length is9 inches?
3. What should the length of the logo be if the height is15 inches?
4. Sara sees the logo on a brochure. She wants to check that itis the correct shape, so she measures the length and height.How can she use the measurements to check the shape?
THINK AND DISCUSS 5. Discuss how you solved Problems 2 and 3. Describe as
many different solution methods as you can.
6. Give an equation that relates the length and height ofthe logo.
Proportional Reasoning2-2
4 in.
3 in.
6.75 in
20 in
1. As the length increases by 1 in., the height increases by 0.75 in. The height is always 3 __ 4
of the length. 4. Divide height by length to see if this is equal to 3 __
4 .
5. Possible answers: Extend the table; set up a proportion; solve an equation.
6. w � 3 __ 4 �
ex plo rat i o n
Copyright © by Holt, Rinehart and Winston. 12 Holt Algebra 2All rights reserved.
Jorge is fi lling the stock tank at his ranch. He starts when thewater in the tank is 5 feet deep. The water rises 1.5 inches perminute.
1. Write an equation that gives the depth of the water in inches yafter x minutes.x
2. Complete the table.
Time � min � 0 6 12 18 24 30Water Depth � in. � 60
3. Find the successive differences in the water depths, as indi-cated here. What do you notice?
Time � min � 0 6 12 18 24 30Water Depth � in. � 60
4. Use your graphing calculator to graphthe equation. What is the shape of thegraph?
THINK AND DISCUSS 5. Describe several different methods you could use to find the
depth of the water after 36 minutes.
6. Explain how you can find out how long it will take to fill thetank if it can hold 10 feet of water.
Graphing Linear Functions2-3
y � 60 � 1.5x
They are all 9 in.
9
The graph is a line.
5. Possible answers: Extend the table; substitute x � 36 in the equation; use the graph.
6. 10 feet is 120 inches, so solve 120 � 60 � 1.5x. � x � 40; 40 min �
69 78 87 96 105
69 78 87 96 105
9 9 9 9

ex plo rat i o n
Copyright © by Holt, Rinehart and Winston. 13 Holt Algebra 2All rights reserved.
Use a graphing calculator for this Exploration.
1. Press and enter the following functions as Y1 and Y2.
y � 3__4
x � 2 (Enter 3/4X�2).
y � �4__3x � 1 (Enter �4/3X�1).
2. Press and choose ZStandard.Then press and ZSquare to graph the functions in a square window.
3. What appears to be true about thegraphs?
4. Examine the two equations. What doyou notice about their slopes?
5. Repeat Problems 1–4 but instead usethe two linear equations below.y � �4x � 3
y � 1__4
x � 1
THINK AND DISCUSS 6. Make a generalization based on your findings.
7. Explain why you needed to set the shape of the viewingwindow using ZSquare for this Exploration.
Writing Linear Functions2-4
3. The lines are perpendicular.
4. The slopes are negative reciprocals of each other.
5. The lines are perpendicular. The slopes are negative reciprocals of each other.
6. The slopes of perpendicular lines are negative reciprocals.
7. This ensures that perpendicular lines actually appear to be perpendicular.
ex plo rat i o n
Copyright © by Holt, Rinehart and Winston. 14 Holt Algebra 2All rights reserved.
Linear Inequalitiesin Two Variables2-5
You can use a graphing calculator to explore inequalities.
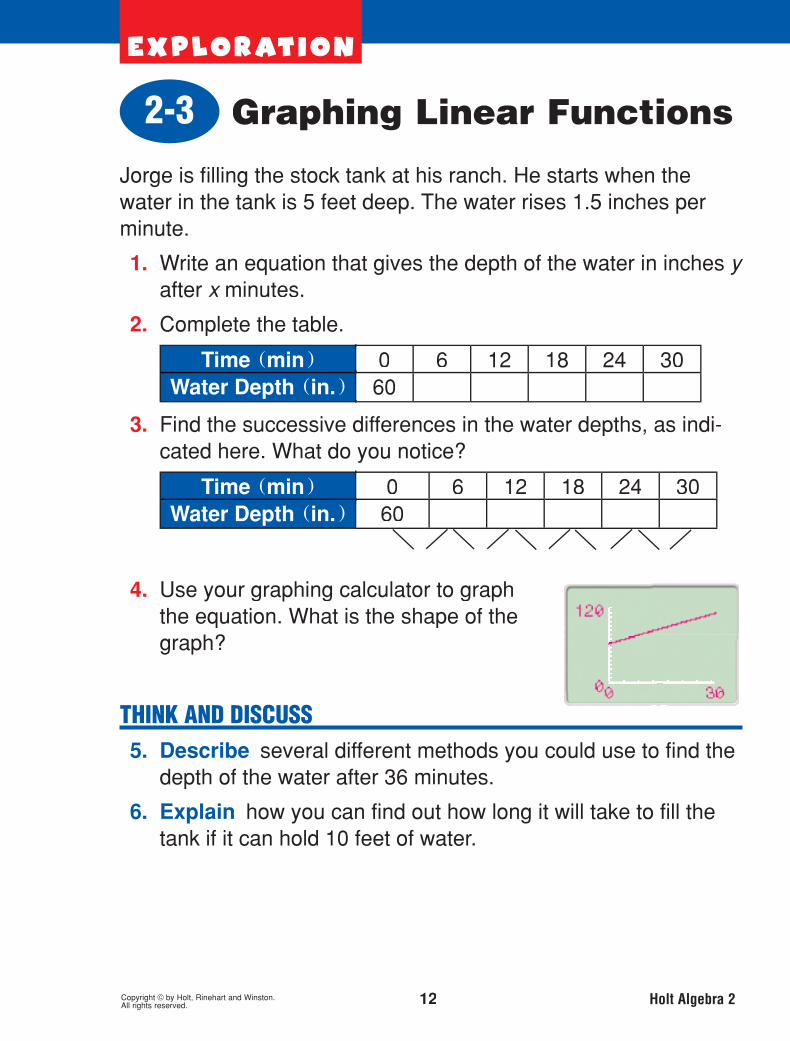
1. Press and enter the functiony � 2x � 1 as Y1.
2. You can graph the inequality y � 2x � 1 in the following way: Use the arrow keysto move the cursor to the extreme left ofthe line on which you entered Y1.Press until you see the shadedtriangle shown on the graph at right. Press .
3. What points along the y-axis are in theyyshaded region?
4. What points along the vertical linex � 2.5 are in the shaded region?
5. You can enter y � 2x � 1 by moving thecursor to the extreme left of the line onwhich you entered the function.Press until you see the shadedtriangle shown on the graph at right.Press .
THINK AND DISCUSS 6. Describe what would happen if you graphed y � 2x � 1 and
y � 2x � 1 on the same coordinate plane.
7. Explain how you can know whether the origin will be in theshaded region when you graph y � 2x � 1.
6. The regions above and below the line would be shaded. 7. � 0, 0 � is a solution to the inequality y � 2x � 1, so the point will be in the shaded region.
y �1
y 4

ex plo rat i o n
Copyright © by Holt, Rinehart and Winston. 14 Holt Algebra 2All rights reserved.
Linear Inequalitiesin Two Variables2-5
You can use a graphing calculator to explore inequalities.
1. Press and enter the functiony � 2x � 1 as Y1.
2. You can graph the inequality y � 2x � 1 in the following way: Use the arrow keysto move the cursor to the extreme left ofthe line on which you entered Y1.Press until you see the shadedtriangle shown on the graph at right. Press .
3. What points along the y-axis are in theyyshaded region?
4. What points along the vertical linex � 2.5 are in the shaded region?
5. You can enter y � 2x � 1 by moving thecursor to the extreme left of the line onwhich you entered the function.Press until you see the shadedtriangle shown on the graph at right.Press .
THINK AND DISCUSS 6. Describe what would happen if you graphed y � 2x � 1 and
y � 2x � 1 on the same coordinate plane.
7. Explain how you can know whether the origin will be in theshaded region when you graph y � 2x � 1.
6. The regions above and below the line would be shaded. 7. � 0, 0 � is a solution to the inequality y � 2x � 1, so the point will be in the shaded region.
y �1
y 4

ex plo rat i o n
Copyright © by Holt, Rinehart and Winston. 15 Holt Algebra 2All rights reserved.
Transforming Linear Functions2-6
Use a graphing calculator to exploretransformations of linear functions. Beginby graphing y � 2x.
1. Graph y � 2x � 3 on the same coordinate plane as y � 2x. How doesthe graph of this function compare tothat of y � 2x ?
2. Graph y � 2x � 2 on the same coordinate plane as y � 2x.How does the graph of this function compare to that ofy � 2x?
3. Graph y � 2 �x � 3 � on the same coordinate plane as y � 2x.How does the graph of this function compare to that ofy � 2x ?
4. Graph y � 2 �x � 2 � on the same coordinate plane as y � 2x. How does the graph of this function compare to that ofy � 2x ?
THINK AND DISCUSS 5. Describe how the graph of y � �4x � k is related to thek
graph of y � �4x.
6. Explain how you can use what you discovered to quicklygraph y � 3 �x � 5 �.
5. The graph of y � �4x is shifted by � k � units (up if k 0, down if k � 0).
6. Graph y � 3x and then shift the graph 5 units to the right.
The graph of y � 2x is shifted 3 units up.
The graph of y � 2x is shifted 2 units down.
The graph of y � 2x is shifted 3 units right.
The graph of y � 2x is shifted 2 units left.

ex plo rat i o n
Copyright © by Holt, Rinehart and Winston. 16 Holt Algebra 2All rights reserved.
The table shows the dates andwinning times for record holdersin the men’s 100-meter sprint. You can use a graphing calculator tohelp you see trends in the data.
1. Enter the years in list L1 bypressing and then 1. Let1983 be year 0 and 2005 be year 22. Then enter the times inlist L2.
2. Make a scatter plot in the following way: Press . Then select Plot1 and set up the plot as shown. When youare done, press . Adjust theviewing window as needed.
THINK AND DISCUSS 3. Describe the pattern of the data in the scatter plot.
4. Explain how you could use the scatter plot to makepredictions about future records in the 100-meter sprint.
Curve Fitting with Linear Models2-7
Date Record Holder Time (s)1983 Calvin Smith 9.931988 Carl Lewis 9.921991 Leroy Burrell 9.901991 Carl Lewis 9.861994 Leroy Burrell 9.851996 Donovan Bailey 9.841999 Maurice Green 9.792002 Tim Montgomery 9.782005 Asafa Powell 9.77
3. The data are close to a straight line with a negative slope. 4. Draw a line that is close to the data. Then use the line to help predict record times in
future years.
ex plo rat i o n
Copyright © by Holt, Rinehart and Winston. 17 Holt Algebra 2All rights reserved.
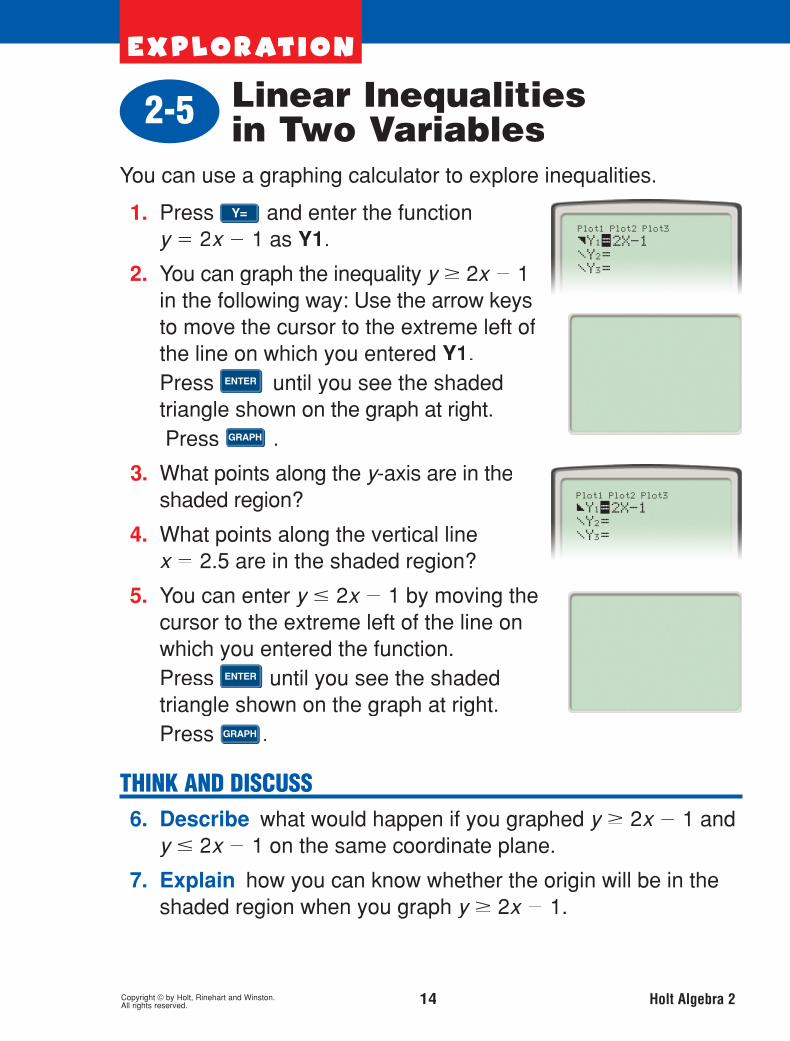
A carpenter prepares several wooden dowels whose lengths are27 cm � 0.3 cm.
1. What is the range of possible lengths for the dowels?
2. Use the number line to show the range of possible lengths.
3. The carpenter writes the following to show the range ofpossible lengths.
�0.3 � x � 27 � 0.3
This is equivalent to the two inequalities �0.3 � x � 27and x � 27 � 0.3. Solve the inequalities to show that theyrepresent the same range of lengths.
THINK AND DISCUSS 4. Describe different ways to write the range of values shown
on this number line.
5. Demonstrate how to write an inequality like the one inProblem 3 for the following situation: The weight of a GreatDane is within 5 pounds of 111 pounds.
Solving Absolute-ValueEquations and Inequalities2-8
26 27 28
60 70 80

ex plo rat i o n
Copyright © by Holt, Rinehart and Winston. 17 Holt Algebra 2All rights reserved.
A carpenter prepares several wooden dowels whose lengths are27 cm � 0.3 cm.
1. What is the range of possible lengths for the dowels?
2. Use the number line to show the range of possible lengths.
3. The carpenter writes the following to show the range ofpossible lengths.
�0.3 � x � 27 � 0.3
This is equivalent to the two inequalities �0.3 � x � 27and x � 27 � 0.3. Solve the inequalities to show that theyrepresent the same range of lengths.
THINK AND DISCUSS 4. Describe different ways to write the range of values shown
on this number line.
5. Demonstrate how to write an inequality like the one inProblem 3 for the following situation: The weight of a GreatDane is within 5 pounds of 111 pounds.
Solving Absolute-ValueEquations and Inequalities2-8
26 27 28
60 70 80
from 26.7 cm to 27.3 cm
26.7 x ; x 27.3
from 63 to 77; 70 � 7; �7 x � 70 7
�5 x � 111 5

ex plo rat i o n
Copyright © by Holt, Rinehart and Winston. 18 Holt Algebra 2All rights reserved.
You can use a graphing calculator to explore transformations ofthe function y � �x�.
1. Press . To enter the function y �
�x � press and then select NUMfrom the menu at the top of the screen.Then press . You can then com-plete Y1 as Y1�5abs �X �.
2. Graph the function in a square window.
3. Graph y � �x� � 3 on the same coordi-nate plane as y � �x �. How does thegraph of y � �x � � 3 compare to that ofy � �x �?
4. Graph y � �x � 4�. Describe thegraph. .
5. Write a function for the graph shownhere. Check your answer by graphingthe function on your graphing calculator.
THINK AND DISCUSS 6. Describe how you would sketch a graph of y � �x � 1� � 5.
7. Explain how you know whether a graph of an absolute valuefunction that horizontally shifts from y � �x� shifts to the left orto the right.
Absolute-Value Functions2-9
�5
�5 5
5
0 x
y
6. Shift the graph of y � � x � 1 unit right and 5 units up.
7. If the equation has the form y � � x � h � , the graph is shifted to the right when h 0 and to the left when h � 0.
The graph of y � � x � is shifted 3 units up.
The graph of y � � x � is shifted 4 units right.
y � � x � 1 � � 2

ex plo rat i o n
Copyright © by Holt, Rinehart and Winston. 19 Holt Algebra 2All rights reserved.
Using Graphs and Tables to Solve Linear Systems3-1
Felipe is driving 55 mi/h on the interstate and is currently at milemarker 125. Gina is driving in the same direction at 65 mi/h and iscurrently at mile marker 85.
1. Complete the table.
Time � h � Felipe’s Location Gina’s Location0 125 8512345
2. Write an equation for Felipe’s location. Let y representythe mile marker number, and let x represent the numberxof hours.
3. Write an equation for Gina’s location. Let y representythe mile marker number, and let x represent the numberxof hours.
4. How long does it take for Gina to catch Felipe? At whatlocation does she catch him?
THINK AND DISCUSS 5. Explain how you could write a system of equations to
represent this problem.
6. Describe how you could use a graph to solve this problem.
180 150
235 215
290 280
345 345
400 410
y � 55x � 125
y � 65x � 85
4 hours; mile marker 345
Solve 55x � 125 � 65x � 85.
Graph the two linear equations and find their intersection.

ex plo rat i o n
Copyright © by Holt, Rinehart and Winston. 20 Holt Algebra 2All rights reserved.
Using Algebraic Methods to Solve Linear Systems3-2
The monthly cost y for a factory to manufacture stereo headphonesyis $12,600 plus $17.50 per headphone. The headphones are then sold for $25 each.
1. Write an equation for the cost of manufacturing headphones.Let y represent the total cost, and let y x represent the numberxof headphones manufactured.
2. Write an equation for the revenue from the headphones. Lety represent the revenue and lety x represent the number ofxheadphones manufactured.
3. Set the expressions for cost and revenue equal to each otherand then solve the equation for x.
4. Interpret your solution. What is the result when the factorymanufactures this number of headphones?
THINK AND DISCUSS 5. Determine the number of headphones the factory should
manufacture to make a profit.
6. Discuss the advantages of solving this problem algebraicallyrather than by using a table or graph.
y � 12,600 � 17.5x
y � 25x
x � 1680
4. This is the break-even point (where cost equals revenue).
5. The factory should manufacture more than 1680 headphones.
6. The algebraic solution gives an exact answer. Using a table or graph may give only an approximate solution.

ex plo rat i o n
Copyright © by Holt, Rinehart and Winston. 21 Holt Algebra 2All rights reserved.
Solving Systems of LinearInequalities3-3
You can use a graphing calculator to graph a system of inequalities.
The menu shows the inequalititesy � 2x � 3 and y � �x � 1. Note that thesymbol to the left of Y indicate shading.
1. Graph only y � 2x � 3. Name a point inthe shaded region. What does it meanfor this point to lie in the shaded region?
2. Graph only y � �x � 1. Name a point in the shaded region.What does it mean for this point to lie in the shaded region?
3. The graph shows the two shaded regionson the same coordinate plane. Name apoint in the overlapping region. Whatdoes it mean for this point to lie in theoverlapping region?
THINK AND DISCUSS 4. Describe the steps you must take to find the solution region
of a system of inequalities on a graphing calculator.
5. Explain how the solution region would change if theinequalities were y � 2x � 3 and y � �x � 1.
Possible answer: � 0,0 � ; The point is a solution of the inequality y � 2x � 3.
Possible answer: � 0,0 � ; The point is a solution of the inequality y �x � 1.
Possible answer: � 0,0 � ;
The point is a solution of both inequalities.
4. Graph both inequalities on the same coordinate plane. The overlapping region is the solution to the system of inequalities.
5. In this case, there would be a different overlapping region.

ex plo rat i o n
Copyright © by Holt, Rinehart and Winston. 22 Holt Algebra 2All rights reserved.
Fred has two summer jobs. He can earn $15 per hour doing yard work and $10 per hour working at the mall. Each week, he mustwork less than 40 hours but earn at least $475.
1. Complete the table to determine if each combination satisfiesFred’s criteria.
PlanHours of
Yard WorkHours at the Mall
Wages from Yard Work
Wages from the Mall
Total Wages
A 10 25B 30 9C 20 15D 25 10E 30 7
2. Find another combination of work hours that meetsFred’s criteria.
3. Let x represent the number of hours Fred does yard work andxlet y represent the number of hours Fred works at the mall.yWrite an inequality that describes Fred’s goal for his weeklyincome.
THINK AND DISCUSS 4. Describe another inequality you can write to represent one
of Fred’s criteria.
5. Discuss whether Fred could work only at the mall and stillmeet his goals.
Linear Programming3-4
$150 $250 $400
$450 $90 $540
$300 $150 $450
$375 $100 $475
$450 $70 $520
15x � 10y � 475
x � y � 40
2. Possible answer: 28 hours of yard work, 8 hours at the mall
5. No; even if he worked 40 hours at the mall, his total wages would be only $400.

ex plo rat i o n
Copyright © by Holt, Rinehart and Winston. 23 Holt Algebra 2All rights reserved.
Pizza Simple sells three sizes of pizzas: small, medium, and large.It sells the small for $8, the medium for $10, and the large for $12.
1. The table shows the sales for the weekend, Friday throughSunday. Complete the table to find the total revenue foreach day.
Small Pizzas Sold
Medium Pizzas Sold
Large Pizzas Sold
Total Daily Revenue
Fri 37 103 195Sat 60 195 235Sun 52 131 210
2. Write an expression for the total daily revenue R. Let x rep-xresent the number of small pizzas sold. Let y represent theynumber of medium pizzas sold. Let z represent the number ofzlarge pizzas sold.
3. Write an equation for the total daily revenue R if the restau-Rrant sells exactly 40 small pizzas.
THINK AND DISCUSS 4. Explain how you can use your equation to find the number
of small pizzas sold if you know that 212 medium pizzas and213 large pizzas were sold and that the total revenue was$5476.
5. Determine two combinations of pizza sales that would resultin a revenue of $3600.
Linear Equations in ThreeDimensions3-5
$3666
$5250
$4246
R � 8x � 10y � 12z
R � 320 � 10y � 12z
4. Substitute y � 212 and z � 213 into the equation 8x � 10y � 12z � 5476. Then solve for x. y � 100
5. possible answers: 101 small, 20 medium, 216 large; 50 small, 200 medium, 100 large
ex plo rat i o n
Copyright © by Holt, Rinehart and Winston. 24 Holt Algebra 2All rights reserved.
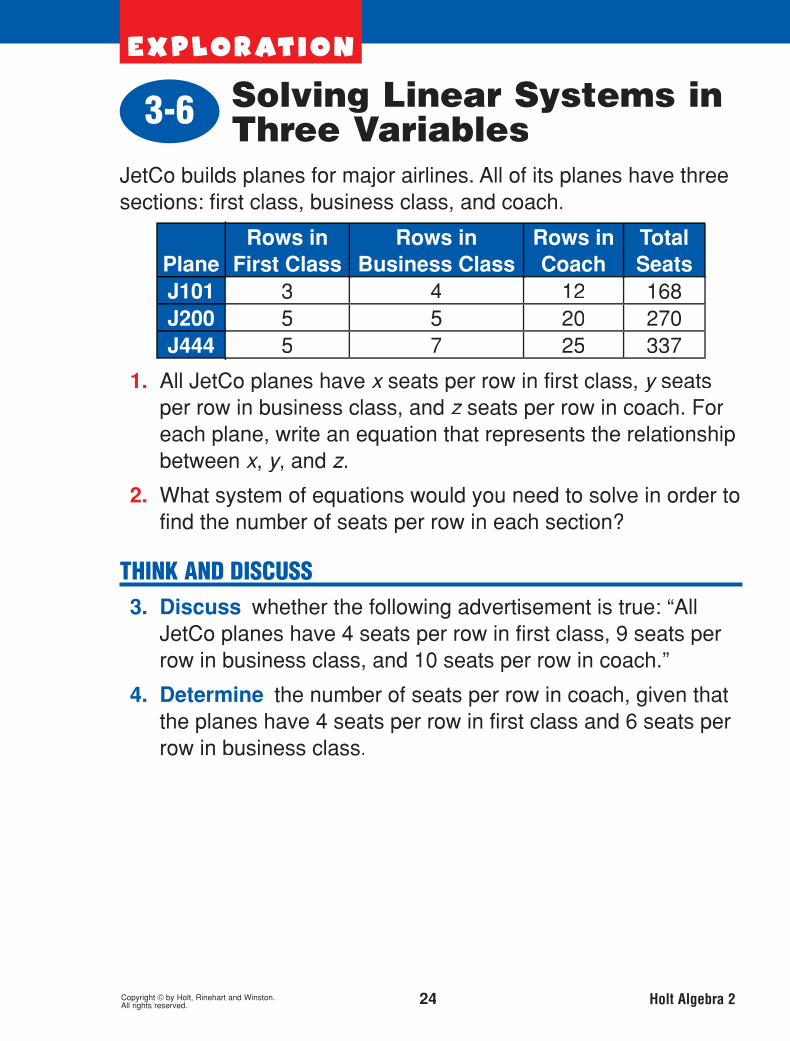
JetCo builds planes for major airlines. All of its planes have threesections: fi rst class, business class, and coach.
PlaneRows in
First ClassRows in
Business ClassRows in Coach
Total Seats
J101 3 4 12 168J200 5 5 20 270J444 5 7 25 337
1. All JetCo planes have x seats per row in first class,x y seatsyper row in business class, and z seats per row in coach. Forzeach plane, write an equation that represents the relationshipbetween x, y, and yy z.
2. What system of equations would you need to solve in order tofind the number of seats per row in each section?
THINK AND DISCUSS 3. Discuss whether the following advertisement is true: “All
JetCo planes have 4 seats per row in first class, 9 seats perrow in business class, and 10 seats per row in coach.”
4. Determine the number of seats per row in coach, given thatthe planes have 4 seats per row in first class and 6 seats perrow in business class.
Solving Linear Systems in Three Variables3-6
11
1. J101: 3x � 4y � 12z � 168; J200: 5x � 5y � 20z � 270; J444: 5x � 7y � 25z � 337
2. 5x � 5y � 20z � 270; 5x � 7y � 25z � 337; 3x � 4y � 12z � 168
3. No; although � 4, 9, 10 � is a solution for the J101 equation, it is not a solution for the other two equations.

ex plo rat i o n
Copyright © by Holt, Rinehart and Winston. 24 Holt Algebra 2All rights reserved.
JetCo builds planes for major airlines. All of its planes have threesections: fi rst class, business class, and coach.
PlaneRows in
First ClassRows in
Business ClassRows in Coach
Total Seats
J101 3 4 12 168J200 5 5 20 270J444 5 7 25 337
1. All JetCo planes have x seats per row in first class,x y seatsyper row in business class, and z seats per row in coach. Forzeach plane, write an equation that represents the relationshipbetween x, y, and yy z.
2. What system of equations would you need to solve in order tofind the number of seats per row in each section?
THINK AND DISCUSS 3. Discuss whether the following advertisement is true: “All
JetCo planes have 4 seats per row in first class, 9 seats perrow in business class, and 10 seats per row in coach.”
4. Determine the number of seats per row in coach, given thatthe planes have 4 seats per row in first class and 6 seats perrow in business class.
Solving Linear Systems in Three Variables3-6
11
1. J101: 3x � 4y � 12z � 168; J200: 5x � 5y � 20z � 270; J444: 5x � 7y � 25z � 337
2. 5x � 5y � 20z � 270; 5x � 7y � 25z � 337; 3x � 4y � 12z � 168
3. No; although � 4, 9, 10 � is a solution for the J101 equation, it is not a solution for the other two equations.

A car company has three plants: A, B, and C. The companyproduces three cars: the Zip, the Tip, and the Pip.
The table shows the productionnumbers for each model at eachplant during the fi rst half of the year.
1. Which plant produced the most cars?
2. For which model were the most cars produced?
3. The production numbers forthe second half of the year areshown in the table.
Make a new table that gives theproduction numbers for the entireyear.
THINK AND DISCUSS 4. Explain how you found the entries in the table that gives
the production numbers for the entire year.
5. Describe the dimensions of the table you would use todisplay data about a car company with four plants and sixdifferent models.
Matrices and Data4-1
Zip Tip PipA 2000 4200 7000B 1900 4400 6200C 450 1200 2500
Zip Tip PipA 2100 3900 6700B 2000 1200 6000C 430 1050 2500
Zip Tip PipABC
plant A
the Pip
4100 8100 13,700
3900 5600 12,200
880 2250 5,000
four rows, six columns
4. To find the number that goes in each cell of the table, add the entries in the correspond-ing cells of the tables for the first half of the year and the second half of the year.
ex plo rat i o n
Copyright © by Holt, Rinehart and Winston. 25 Holt Algebra 2All rights reserved.

Multiplying Matrices4-2
Three students sold T-shirtsfor a school fund-raiser.Short-sleeve and long-sleeveshirts were available. The tableshows the quantities sold byeach student.
1. Create a matrix A for the quantity data. What are the dimensions of the matrix?
2. The table shows the pricesfor the two types of T-shirts.Create a matrix B for theBpricing data. What are thedimensions of the matrix?
3. Complete this table to showthe total revenue that wasbrought in by each of thestudents.
4. Create a matrix C for theCrevenue data. What are thedimensions of the matrix?
THINK AND DISCUSS 5. Explain how you completed the revenue table.
6. Describe how the dimensions of matrix C are related to theCdimensions of matrices A and A B.
Short Sleeve
Long Sleeve
Colin 20 15Sue 8 6Lashonda 32 14
Price ($)Short Sleeve 10Long Sleeve 15
Total Revenue ($)
ColinSueLashonda
A � 20 158 6
32 14; 3 � 2
B � 1015
; 2 � 1
425
170
530
C �
425170530
; 3 � 1
5. For each student, take the quantity of short-sleeve shirts multiplied by the price of the short-sleeve shirts and add this to the quantity of long-sleeve shirts multiplied by the price of the long-sleeve shirts.
6. Matrix C has the same number of rows as matrix A and the same number of columns as matrix B.
ex plo rat i o n
Copyright © by Holt, Rinehart and Winston. 26 Holt Algebra 2All rights reserved.

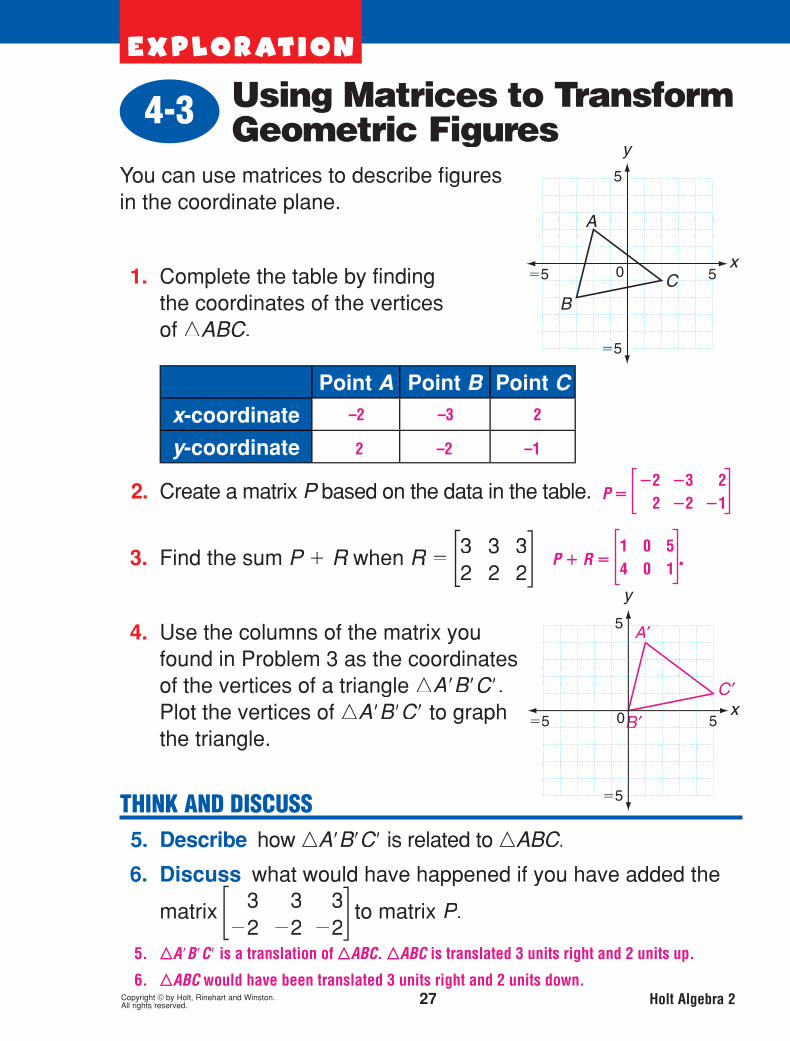
Using Matrices to Transform Geometric Figures4-3
You can use matrices to describe fi gures in the coordinate plane.
1. Complete the table by findingthe coordinates of the verticesof �ABC.
Point A Point B Point C
x-coordinate
y-coordinate
2. Create a matrix P based on the data in the table.P
3. Find the sum P � R whenR R �3 3 32 2 2
4. Use the columns of the matrix youfound in Problem 3 as the coordinatesof the vertices of a triangle �ABC.Plot the vertices of �ABC to graphthe triangle.
THINK AND DISCUSS 5. Describe how �ABC is related to �ABC.
6. Discuss what would have happened if you have added the
matrix 3 3 3�2 �2 �2
to matrix P.
–2 –3 2
2 –2 –1
P � �2 �3 2
2 �2 �1
P � R � 1 0 54 0 1 .
5. �ABC is a translation of �ABC. �ABC is translated 3 units right and 2 units up.
6. �ABC would have been translated 3 units right and 2 units down.
ex plo rat i o n
Copyright © by Holt, Rinehart and Winston. 27 Holt Algebra 2All rights reserved.

Every square matrix has an associated value called itsdeterminant. You can use a calculator to fi nd this value.tt
To fi nd the determinant of a squarematrix that you have already entered into
your calculator, press , scroll tothe right to MATH, and select1:det(. Then enter the name of the matrix by
pressing and selecting the matrixfrom the list. Close the parentheses and press .
Use your calculator to find the determinant of each matrix. Look for patterns.
1. 3 00 10
2. 3 15 10
3. 3 25 10
4. 2 310 5
5. 2 110 5
6. 1 3�2 10
THINK AND DISCUSS 7. Describe how the determinant is related to the entries of
a 2 2 matrix.
8. Explain how you can find the determinant of 2 110 5
withoutusing a calculator.
Determinants andCramer’s Rule4-4
30
20
0
25
�20
16
7. The determinant of a 2 � 2 matrix is the difference of the products of the diagonals. 8. The determinant is 3 � 6 � � 10 � 1 � � 18 � 10 � 8.
ex plo rat i o n
28 Holt Algebra 2All rights reserved.

Matrix Inverses and Solving Systems4-5
Use a calculator or paper and pencil for this Exploration.
1. Find the products AB and B BA for the following matrices.
A � �2 05 1
B ��0.5 0
2.5 1
2. Find the products PQ and Q QP for the following matrices.P
P � 8 56 4
Q � 2 �2.5�3 4
3. Find the products ST andT TS for the following matrices.S
S � 3 111 4
T � 4 �1�11 3
4. What do you notice about the products of the matrices inProblems 1–3?
THINK AND DISCUSS 5. Explain what is special about the matrix that you found to be
the product in Problems 1–3.
6. Describe how the pairs of matrices you multiplied are similar
to the numbers 3__5 and _ 5__
3 .
The products are all 1 00 1
.
AB � BA � 1 00 1
PQ � QP � 1 00 1
ST � TS � 1 00 1
It is the multiplicative identity matrix.
The product of 3 __ 5 and 5 __
3 is 1, which is the multiplicative identity for real numbers.
ex plo rat i o n
Copyright © by Holt, Rinehart and Winston. 29 Holt Algebra 2All rights reserved.

Matrix Inverses and Solving Systems4-5
Use a calculator or paper and pencil for this Exploration.
1. Find the products AB and B BA for the following matrices.
A � �2 05 1
B ��0.5 0
2.5 1
2. Find the products PQ and Q QP for the following matrices.P
P � 8 56 4
Q � 2 �2.5�3 4
3. Find the products ST andT TS for the following matrices.S
S � 3 111 4
T � 4 �1�11 3
4. What do you notice about the products of the matrices inProblems 1–3?
THINK AND DISCUSS 5. Explain what is special about the matrix that you found to be
the product in Problems 1–3.
6. Describe how the pairs of matrices you multiplied are similar
to the numbers 3__5
and _ 5__3 .
The products are all 1 00 1
.
AB � BA � 1 00 1
PQ � QP � 1 00 1
ST � TS � 1 00 1
It is the multiplicative identity matrix.
The product of 3 __ 5 and 5 __
3 is 1, which is the multiplicative identity for real numbers.
ex plo rat i o n
Copyright © by Holt, Rinehart and Winston. 29 Holt Algebra 2All rights reserved.
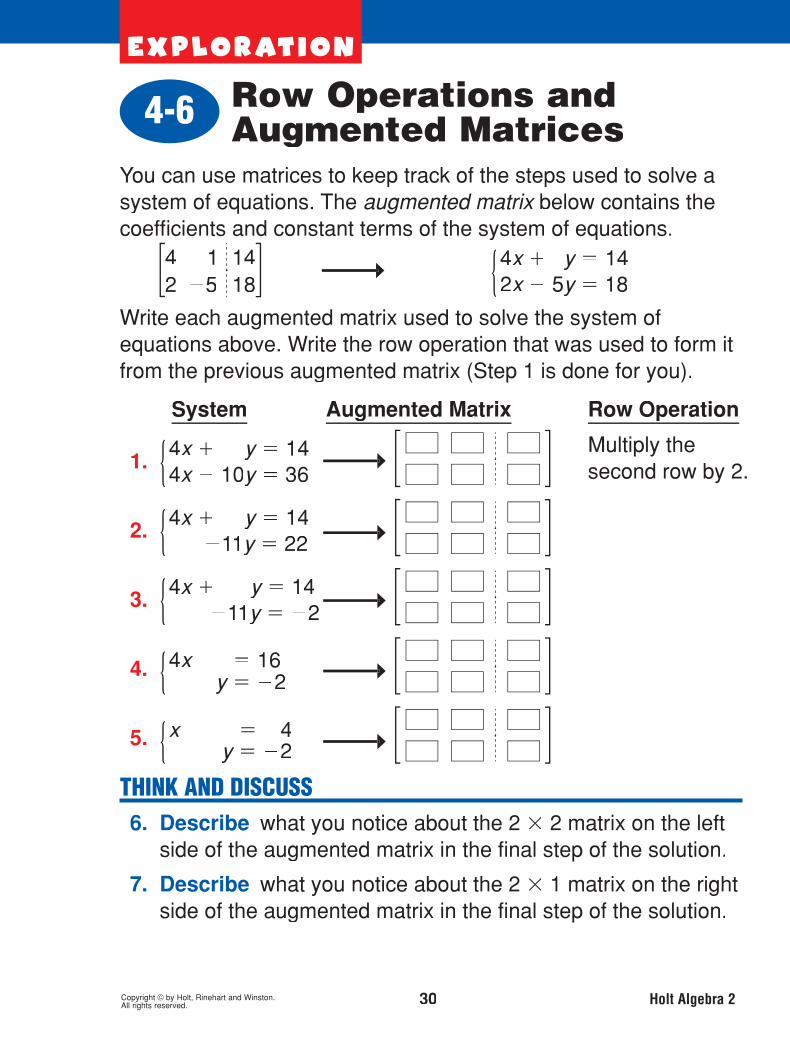
You can use matrices to keep track of the steps used to solve asystem of equations. The augmented matrix below contains thexcoeffi cients and constant terms of the system of equations.
4 1 142 �5 18 {4x � y � 14
2x � 5y � 18
Write each augmented matrix used to solve the system ofequations above. Write the row operation that was used to form itfrom the previous augmented matrix (Step 1 is done for you).
System Augmented Matrix Row Operation
1. {4x � y � 144x � 10
y � 36
2. {4x � y � 14
�11 y � 22
3. {4x � y � 14�11 y � �2
4. {4x � 16{{ y � �2
5. {x � 4 { { y � �2
THINK AND DISCUSS 6. Describe what you notice about the 2 2 matrix on the left
side of the augmented matrix in the final step of the solution.
7. Describe what you notice about the 2 1 matrix on the rightside of the augmented matrix in the final step of the solution.
Row Operations and Augmented Matrices4-6
Multiply thesecond row by 2.
Subtract the first row from the second row.
Divide the second row by –11.
Subtract the second row from the first row.
Divide the first row by 4.
4 1 14
4
4
0
4
0
�10
1
�11
1
1
36
14
22
�2
�2
�2
14
4
4
160
0
0
0
1
1
1
6. It is the identity matrix.
7. It is the solution of the system of equations.
ex plo rat i o n
Copyright © by Holt, Rinehart and Winston. 30 Holt Algebra 2All rights reserved.

ex plo rat i o n
Copyright © by Holt, Rinehart and Winston. 31 Holt Algebra 2All rights reserved.
Using Transformations to Graph Quadratic Functions5-1
The simplest quadratic function is f �x � � x 2 . You can plot points to explore the graphs of quadratic functions.
1. Complete the table for the function f �x � � x2.
x �3 �2 �1 0 1 2 3f � x �
2. Graph the function f by plottingfthe ordered pairs on thecoordinate plane.
3. Complete the table for thefunction g �x � � �x � 1 �2.
x �3 �2 �1 0 1 2 3g � x �
4. Graph the function g by plotting thegordered pairs on the coordinate plane.
THINK AND DISCUSS 5. Explain how the graph of g is related to the graph ofg f.ff
6. Describe the graph of h �x � � �x � 2 �2 as a transformation ofthe graph of f.ff
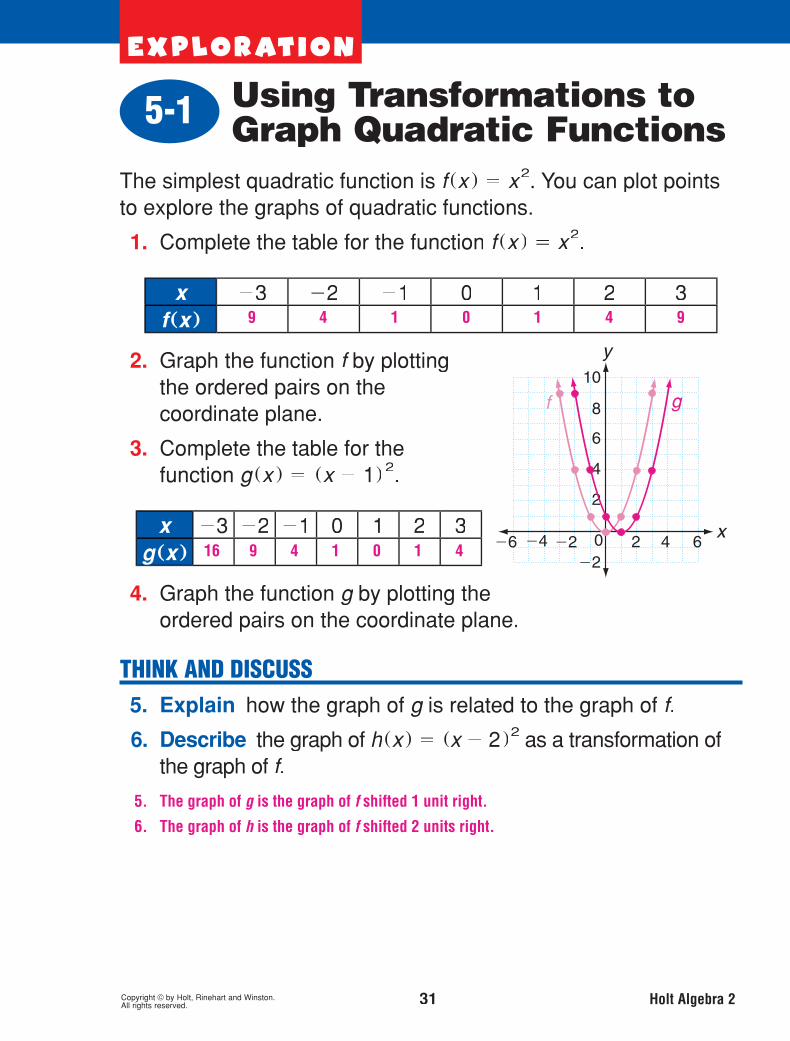
9 4 1 0 1 4 9
16 9 4 1 0 1 4
5. The graph of g is the graph of f shifted 1 unit right.
6. The graph of h is the graph of f shifted 2 units right.

ex plo rat i o n
Copyright © by Holt, Rinehart and Winston. 32 Holt Algebra 2All rights reserved.
Properties of Quadratic Functions in Standard Form5-2
You can use a calculator to explore properties of the graphs ofquadratic functions. To graph a quadratic function, press and enter the function rule. Then press to see the graph.
1. Use your calculator to graph each function listed below. Then complete the table.
FunctionParabola Opens
Upward or Downward? y-interceptf �x � � 2x 2 � 4x � 1f �x � � �3x 2 � 6x � 2f �x � � x 2 � 2x � 4f �x � � �x 2 � 3x � 5
2. The quadratic functions in Problem 1 are written in the formf �x � � a x 2 � bx � c. For each function, write the values ofa anda c.
Function Value of a Value of cf �x � � 2x 2 � 4x � 1f �x � � �3x 2 � 6x � 2f �x � � x 2 � 2x � 4f �x � � �x 2 � 3x � 5
THINK AND DISCUSS 3. Explain how the sign of a can help you determine whethera
the graph of a quadratic function opens upward or downward.
4. Explain the relationship between the value of c and thecy-intercept of a quadratic function.yy
Function y-interceptUpward 1
Downward 2
Upward �4
Downward �5
2 1
�3 2
1 �4
�1 �5
3. If a is positive, the graph opens upward. If a is negative, the graph opens downward.
4. The value of c and the y-intercept are the same.

ex plo rat i o n
Copyright © by Holt, Rinehart and Winston. 33 Holt Algebra 2All rights reserved.
Solving Quadratic Equations by Graphing and Factoring5-3
The zero of a function is a value of the input x that makes the xoutput f �x � equal to zero. The factored form of a quadraticfunction can help you determine its zeros.
1. Complete the table for the function f �x � � �x � 3 � �x � 2 � .
x �3 �2 �1 0 1 2 3f � x �
2. What are the zeros of the function f ?
3. Complete the table for the function g �x � � �x � 2 � �x � 1�.
x �3 �2 �1 0 1 2 3g � x �
4. What are the zeros of the function g ?
THINK AND DISCUSS 5. Explain the relationship between the zeros of a quadratic
function and the factored form of the function’s rule.
6. Describe how to find the zeros of the functionh �x � � �x � 1 � �x � 2 � without making a table or graph.
6 0 �4 �6 �6 �4 0
10 4 0 �2 �2 0 4
�2 and 3
�1 and 2
5. The zeros of a quadratic function are equal to the values that make the factors equal to zero.
6. Find the values that make each factor equal to zero. Because x � 1 � 0 when x � 1 and because x � 2 � 0 when x � �2, the zeros of the function h are 1 and �2.

ex plo rat i o n
34 Holt Algebra 2All rights reserved.
Completing the Square5-4
You can add a term to a quadratic expression of the form x2� bx
to form a perfect square trinomial. This is called completing thesquare.
The model shows completing the squarefor x2
� 6x by addingx9 unit tiles. Theperfect-square trinomialthat results isx2
� 6x�9 � �x � 3 �2.
Complete the square for each model by adding unit tiles. Then write the perfect square trinomial that results.
1. 2.
THINK AND DISCUSS 3. Tell how you can complete the square for x2
� 12x withoutxusing a model. Divide 12 by 2 and then square the quotient. Because
� 12 ___ 2 � 2 � 36, add 36 to x 2 � 12x to complete the square.

ex plo rat i o n
Copyright © by Holt, Rinehart and Winston. 35 Holt Algebra 2All rights reserved.
Complex Numbersand Roots5-5
Recall that the Product Property of Square Roots states that �
���ab � ����a : �
���b . Use this property to write each expression
as the product of an integer and �����1 .
1. ��
���36 2. � ��
���4
3. ��
���81 4. � ��
���144
The number �����1 is often represented by i. For example, ��
���25 can be written as ��
��25 � �����1 , or 5i. Write eachiiexpression in terms of i.ii
5. ��
���36 6. � ��
���4
7. ��
���81 8. � ��
���144
THINK AND DISCUSS 9. Explain why the square root of any negative number can be
written in terms of i.
10. Discuss how i can be used to express the solutions of theiquadratic equation x 2 � 4 � 0.
6 � ��
�1 �2 � ��
�1
9 � ��
�1 �12 � ��
�1
6i �2i
9i �12i
9. Any negative number can be written as the product of a positive number and �1. Therefore, the square root of any negative number can be written as the product of the square root of a positive number and �
� �1 , or i.
10. Solving the quadratic equation yields x � � ��
�4 . Because ��
�4 � ��
4 � ��
�1 � 2i, the solutions of the equation can be written as x � �2i.

ex plo rat i o n
Copyright © by Holt, Rinehart and Winston. 36 Holt Algebra 2All rights reserved.
The Quadratic Formula5-6
A quadratic equation may have two real solutions, one realsolution, or two nonreal complex solutions. For a quadraticequation of the form ax 2 � bx � c � 0, you can use the valuesof a, b, and c to determine the type and number of solutions.c
1. Complete the table. Use any method to solve each quadraticequation, and then use its values of a, b, and c to evaluate cthe expression b 2 � 4ac.
Equation Solutions Value of b 2 � 4ac x 2 � 5x � 6 � 0 x 2 � 2x � 1 � 0x2
� 4 � 0x2
� 6x � 9 � 0x2
� 10 � 0 x 2 � 3x � 4 � 0
2. Based on the table, what type and number of solutions doesa quadratic equation have if the value of b 2 � 4ac is 0?c
3. What type and number of solutions does a quadratic equationhave if the value of b 2 � 4ac is less than 0?c
4. What type and number of solutions does a quadratic equationhave if the value of b 2 � 4ac is greater than 0?c
THINK AND DISCUSS 5. Describe how you can determine the type and number of
solutions of x2� 4x � 30 � 0 without solving the equation.
�3, �2 1
�1 0
�2i �16
3 0
�i ��
10 �40
�4, 1 25
2 real solutions
2. 1 real solution
3. 2 nonreal complex solutions
5. Find the value of b 2 � 4ac. For the equation x 2 � 4x � 30 � 0, this value is 136. Because the value of b 2 � 4ac is greater than 0, the equation has 2 real solutions.

Graph style symbol
ex plo rat i o n
Copyright © by Holt, Rinehart and Winston. 37 Holt Algebra 2All rights reserved.
Solving Quadratic Inequalities5-7
You can use a graphing calculator to explore quadratic inequalities.
Graph the inequality y � x 2 � 4 as follows.Press and enter x 2 � 4 for Y1. Thenuse the arrow keys to move the cursor to the
left of Y1. Press until the graph style changes to the symbol shown. This symbolindicates that the area above the graph willbe shaded. Press to view the graph.
1. Describe the graph of the inequality y � x2� 4.
2. The shaded area of the graph represents the solution set ofthe inequality. Tell whether each of the following points is inthe solution set of y � x 2 � 4.
a. �0, 0� b. �3, 0�
c. �1, 6 � d. ��3, �3 �
3. What are the possible values of y for y x � 0?
4. What is the least possible value of y ?
THINK AND DISCUSS 5. Discuss how the graph of y � x 2 � 4 would differ from the
graph of y � x 2 � 4.
yes no
yes no
{ y |y � �4 }
�4
1. The graph is a parabola, and the area above the parabola is shaded.
5. The graphs would be identical except that for y x 2 � 4 the area below the parabola would be shaded instead of the area above the parabola.

ex plo rat i o n
Copyright © by Holt, Rinehart and Winston. 38 Holt Algebra 2All rights reserved.
Curve Fitting with Quadratic Models5-8
You can use differences to analyze patterns in data. Completeeach table by fi rst fi nding the missing y-values. Subtractyyconsecutive y-values to fi nd fi rst differences. Then subtractyyconsecutive fi rst differences to fi nd second differences.
1. y � x 2 � 1
x �3 �2 �1 0 1y 10 5 2
First Differences �5 �3Second Differences 2
2. y � 3x 2 � x � 2
x �1 0 1 2 3y
First DifferencesSecond Differences
3. y � 5x2� 2x
x �4 �3 �2 �1 0y
First DifferencesSecond Differences
THINK AND DISCUSS 4. Discuss any patterns you notice in the second differences of
the tables.
5. Explain how you can determine whether a set of data can berepresented by a quadratic function.
1 2
�1 1
2 2
4 2 6 16 32
�2 4 10 16
6 6 6
xy 88 51 24 7 0
�37 �27 �17 �7
10 10 10
The second differences are constant.
If the second differencesare constant for equally spaced x-values, then the data can be represented by aquadratic function.

ex plo rat i o n
Copyright © by Holt, Rinehart and Winston. 39 Holt Algebra 2All rights reserved.
Operations with Complex Numbers5-9
Recall that i � ��
���1 and that i 2 � �1. You can use these facts tosimplify other powers of i. For example, i3 � i2 � i � �1 � i � �i.
1. Complete the table by simplifying the powers of i.
i 1 � i i 2 � �1 i 3 � �i i 4 � 1
i5 � i i6 � �1 i7 � �i i8 � 1
i9 � i i10� �1 i11
� �i i12� 1
i 13� i i 14
� �1 i 15� �i i 16
� 1
2. What values are possible for the positive integer powers of i?
THINK AND DISCUSS 3. Discuss the pattern you notice in the table.
4. Explain how you can quickly find the value of i 64.
i
i
i
i
�1
�1
�1
�1 �i
�i
�i
�i
1
1
1
1
2. i, �1, �i, 1
3. As the exponents increase starting with 1, the values of the positive integer powers of i are i, �1, �i, and 1 in a repeating pattern.
4. If the exponent is a positive integer that is a multiple of 4, then the value of i raised to that exponent is 1. Because 64 is a positive integer multiple of 4, i 64 � 1.

ex plo rat i o n
Copyright © by Holt, Rinehart and Winston. 40 Holt Algebra 2All rights reserved.
Polynomials6-1
The table shows examples of expressions that are polynomialsand examples of expressions that are not polynomials.
Polynomials Not Polynomials
5x 2
3y 7 � 4y 2 � 11__3
x 4
��
��7 t0.13 a 3 � 5.12a 2
�m � 16__7
y _ 8
7x � 5
5 x �2
3y �7� 4 y 2 � 1x1/3
7��
��t 0.13 a 0.4
�m � 1�6___
7y 8
7x� 5
Use the examples to help you decide whether each of the following is a polynomial.
1. 14x 5 � 4x 2 � x 2. �3y 2 � y �2
3. m 0.5� m 12 4. 3 1/2
� x � 6
5. What do you notice about the exponents of the variables inthe expressions that are polynomials?
THINK AND DISCUSS 6. Describe the characteristics of expressions that are
polynomials.
7. Explain why �k5� 3q 4 � 8 w0.75 is not a polynomial.
no
no
yes
yes
5. The exponents are whole numbers.
6. Possible answer: Polynomials have no variables as denominators or exponents, have no roots or absolute values of variables, and have variables whose exponents are whole numbers.
7. The variable w has an exponent that is not a whole number.

ex plo rat i o n
Copyright © by Holt, Rinehart and Winston. 41 Holt Algebra 2All rights reserved.
Multiplying Polynomials 6-2
You can use a calculator to check whether you have correctlymultiplied polynomials. For example, to verify that �x � 1��x � 1�
is equal to x2� 1, enter the expressions as Y1 and Y2. The table
shows that the two expressions have the same value for all thelisted values of x. In addition, the graphs of the correspondingfunctions appear to coincide.
Use a calculator to determine whether each multiplicationwas performed correctly.
1. 5 x 2 �2 x 2 � 3 � � 10 x 4 � 3
2. �3x 2 � 2��x � 7 � � 3x 3 � 21x 2 � 2x � 14
3. �4 x 3 �2x � 3� � �8x 4 � 12x 3
4. �3x � 1� �4x3� 3 x2
� 1� � 12x4 � 9 x3
� 3x
THINK AND DISCUSS 5. Explain how to recognize that certain expressions are not
equivalent.
6. Explain how to multiply a monomial and a polynomial. 5. Possible answer: The second graph will not match the first graph exactly.
6. Possible answer: Use the distributive property to multiply each term of the polynomial by the monomial.
yes
yes
no
no
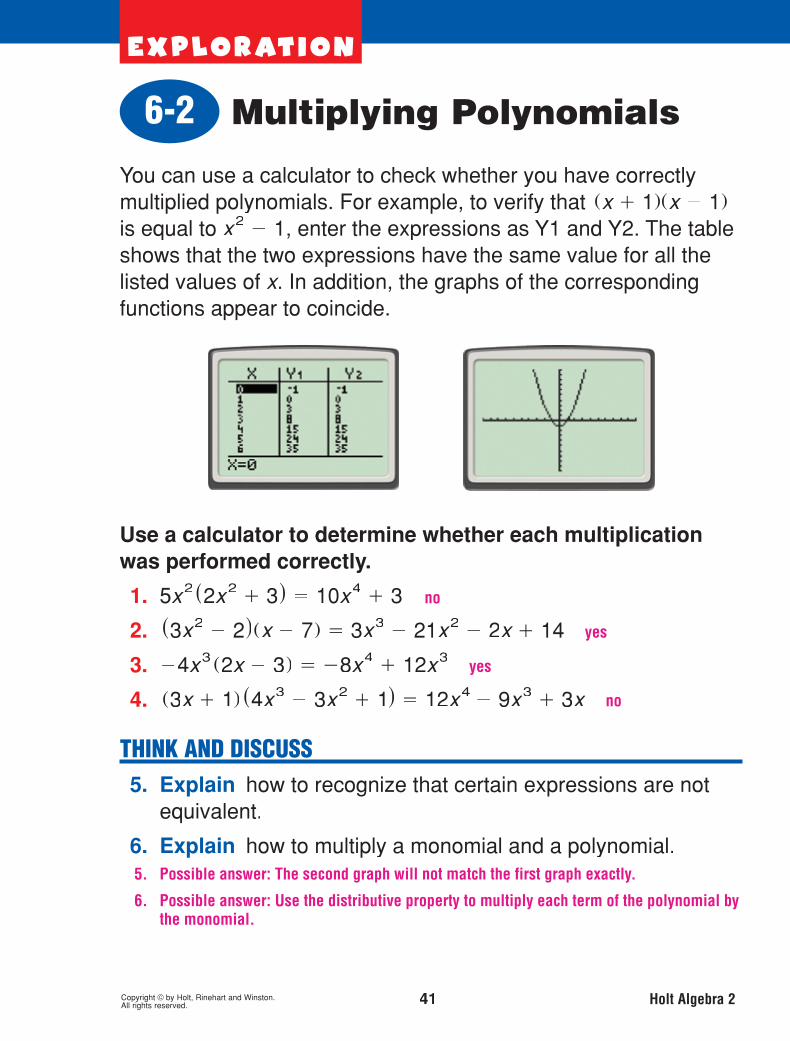

ex plo rat i o n
Copyright © by Holt, Rinehart and Winston. 42 Holt Algebra 2All rights reserved.
Dividing Polynomials6-3
To divide polynomials, you can use the same method as that fordividing numbers.
1. Use arithmetic long division to divide 693 � 21.
2. Use polynomial long division to divide�6x2
� 9x � 3 � � �2x � 1�.
3. Compare your answers in Problems 1 and 2. What can yousay about the coefficients of the quotients for each?
4. Use your answer to Problem 3 to make a conjecture about thequotient of �x2
� 6x � 8 � � �x � 4� based on the quotientof 168 � 14. Verify your conjecture by using polynomial longdivision.
THINK AND DISCUSS 5. Explain how you can find the quotient of
�x2� 6x � 5� � �x � 5 �.
6. Discuss whether every polynomial long division problemmatches exactly with a numerical long division problem.Give an example to support your response.
Possible answer: No, not every polynomial long division problem will match with a numerical long division problem. For example, � 10 x 2 � 23x � 12 � � � 5x � 4 � does not correspond to a numerical long division problem.
33
3x � 3
All the number values are multiples of 3.
x � 2
Use polynomial long division or compare the
polynomial division to the number problem 165 � 15.
ex plo rat i o n
Copyright © by Holt, Rinehart and Winston. 43 Holt Algebra 2All rights reserved.
Factoring Polynomials6-4
Recall from the Remainder Theorem that if a polynomial functionP �x � is divided by x � a, then the remainder is P �a �.
1. Use synthetic division to find the remainder when thepolynomial P �x � � x 3 � 3 x 2 � x � 3 is divided by x � 3.
2. What is P �3 �?
3. Use the results of the synthetic division in Problem 1 to write P�x � as the product of x � 3 and another polynomial.
4. Use synthetic division to find the remainder when thepolynomial Q �x � � 2 x 4 � 4x 3 � 4x 2 � 7x � 2 is dividedby x � 2.
5. What is Q �2 �?
6. Use the results of the synthetic division in Problem 4 to writeQ �x � as the product of x � 2 and another polynomial.
THINK AND DISCUSS 7. Describe what you can conclude about x � a if you know a
that P �a � � 0.
8. Explain why x � 1 must be a factor of x 6 � 1.
0
0
P � x � � � x � 3 � � x 2 � 1 �
0
0
Q � x � � � x � 2 � � 2 x 3 � 4x � 1 �
x � a is a factor of P � x � .
1 is a zero of P � x � � x 9 � 1, so x � 1 is a factor of P � x � .

ex plo rat i o n
Copyright © by Holt, Rinehart and Winston. 44 Holt Algebra 2All rights reserved.
Finding Real Roots ofPolynomial Equations6-5
Recall that you can fi nd the roots of the polynomial equationP �x � � 0 by setting each factor of P �x � equal to zero andsolving for x.
1. Complete the table. Write your answers in fraction form.
P � x � Factored Form
of P � x � Roots of P � x � � 0
12x 2 � 41x � 35 �3x � 5��4x � 7�
6 x 2 � 5x � 4 �2x � 1��3x � 4�
10 x 3 � 3 x 2 � 31x � 6 �2x � 3��5x � 1��x � 2 �
48x 3 � 32 x 2 � 27x � 18 �3x � 2��4x � 3 ��4x � 3 �
2. Look for a pattern in the table. The numerators of the rootsare factors of the coefficient of which term of the polynomial?
3. The denominators of the roots are factors of the coefficient ofwhich term of the polynomial?
THINK AND DISCUSS 4. Explain how you might complete the following statement:
If the polynomial P �x � has integer coefficients and if a__bb
is ab
root of P�x � � 0, then .
5. Explain how you know that 2__7 is not a root of 5 2_
7x2xx � x � 3 � 0.
2. the constant term
4. a is a factor of the constant term of P � x � , and b is a factor of the leading coefficient of P � x � .
5. 2 is not a factor of the constant term, and 7 is not a factor of the leading coefficient.
the leading term
2 __ 3 , � 3 __
4 , 3 __
4
3 __ 2 , 1 __
5 , � 2 __
1
� 1 __ 2 , 4 __
3
5 __ 3 , 7 __
4

ex plo rat i o n
Copyright © by Holt, Rinehart and Winston. 45 Holt Algebra 2All rights reserved.
Fundamental Theoremof Algebra6-6
In this Exploration you will make a conjecture about the number ofroots of a polynomial function.
1. Complete the table. Include multiplicities when finding thenumber of roots.
P � x � Factored Form
of P � x � Roots of P � x � � 0
Number of Roots
x 2 � 16
x3� 5x2
� 8x � 4 �x � 1� �x � 2�2
x 5 � x 4 � 2 x 3
x 4 � 9x 2
x 6 � x 5 � 16x 4 �20x 3 x 3 �x � 5 � �x � 2�
2. Look for a pattern in your table. How is the number of rootsrelated to P �x �?
THINK AND DISCUSS 3. Discuss how you can make a generalization based on your
findings.
4. Explain how you can use your generalization to make astatement about the roots of x 10
� 5 x 7 � 12x � 0.
The number of roots is the same as the degree of the polynomial.
The equation has 10 roots.
A polynomial of degree n has exactly n zeros, including multiplicities.
� x � 4 � � x � 4 � �4, 4 2
1, 2 3
x 3 � x � 1 � � x � 2 � �1, 0, 2 5
x 2 � x � 3 � � x � 3 � �3, 0, 3 4
�2, 0, 5 6

ex plo rat i o n
Copyright © by Holt, Rinehart and Winston. 46 Holt Algebra 2All rights reserved.
Investigating Graphs ofPolynomial Functions6-7
Use a calculator to explore the connection between the graph of apolynomial function and the degree of the polynomial.
Graph each of the following polynomial functions. 1. f �x � � x 2 � x � 8 2. f �x � � 2x3
� 3x � 4
3. f �x � � x 4 � 8x 2 � 8 4. f �x � � x 5 � 6 x 3 � 5x � 3
5. In general, what happens to the graph of a polynomialfunction as the degree of the polynomial increases?
6. Graph f �x � � x8� 2x2
� 1. Does this graph fit the relationship you observed in Problem 2? Why or why not?
THINK AND DISCUSS 7. Describe how the graphs of the functions with odd degrees are
different from the graphs of the functions with even degrees.
8. Describe what you would expect the graph of a 7th-degreepolynomial function to look like.
1. 2.
3. 4.
5. Possible answer: The graph becomes more complex, changing direction more often. The graphs are also steeper.
6. The graph of this function does not appear to change direction as many times as would be expected, but it does increase steeply.
7. The graphs of functions with odd degrees approach both �� and ��. The graphs of functions with even degrees approach �� or �� but not both.
8. The graph would most likely change direction many times. Since the degree is odd, it would approach both �� and ��.
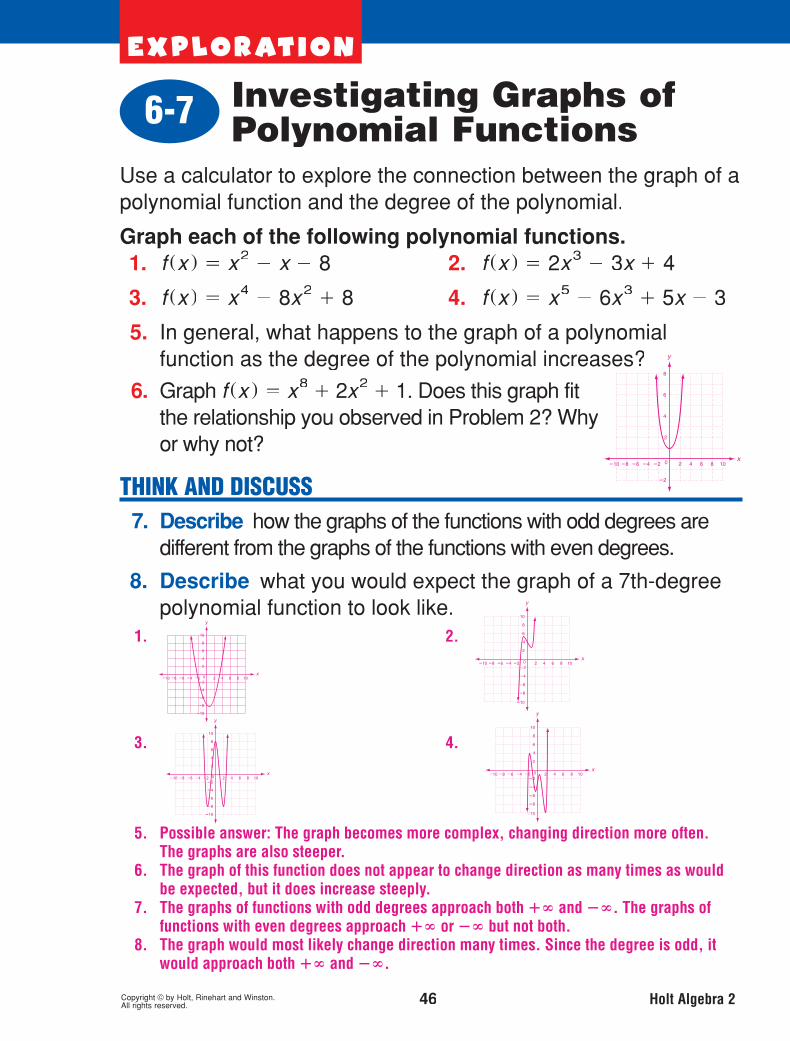

ex plo rat i o n
Copyright © by Holt, Rinehart and Winston. 47 Holt Algebra 2All rights reserved.
Transforming Polynomial Functions6-8
Use your calculator to investigate transformationsof polynomial functions.
1. Graph f �x � � x 3 � 6x � 2.
Graph each of the following functions in the same windowas f �x �. In each case, use the language of transformations to explain how the graph of g �x � is related to the graph of f �x �.
2. g �x � � x3� 6x � 5
3. g �x � � �x � 3 �3� 6 �x � 3 � � 2
4. g �x � � 1__2
x 3 � 3x � 1
5. g �x � � �1__3
x �3� 2x � 2
6. g �x � � �x3� 6x � 2
THINK AND DISCUSS 7. Explain how you can write a polynomial function whose graph
is the same as that of f�x � but is translated 6 units down.
8. Describe how you can graph Q �x � � �x � 2�5� 3 �x � 2�2
if you know what the graph of P �x � � x 5 � 3x 2 looks like. Graph P � x � and then translate the graph 2 units left to obtain Q � x � .
f � x � is translated 3 units up.
f � x � is translated 3 units right.
f � x � is vertically compressed by a factor of 1 __ 2 .
f � x � is horizontally stretched by a factor of 3.
f � x � is reflected across the x-axis.
Subtract 6 from f � x � ; g � x � � f � x � � 6 � x 3 � 6x � 4.

ex plo rat i o n
Copyright © by Holt, Rinehart and Winston. 48 Holt Algebra 2All rights reserved.
Curve Fitting with Polynomial Models6-9
You can discover an interesting property of polynomial functionsby investigating fi nite differences.
1. Complete the table by finding the y-values of the function yyy � x 3 � 2x and calculating the first, second, and thirdxdifferences of the y-values.yy
x �2 �1 0 1 2 3y
First DifferencesSecond DifferencesThird Differences
2. Complete the table by finding the y-values of the function yyy � x4
� 3x and calculating the first, second, and thirdxdifferences of the y-values.yy
x �1 0 1 2 3 4 5y
First DifferencesSecond DifferencesThird DifferencesFourth Differences
THINK AND DISCUSS 3. Discuss the relationship between finite differences and the
degree of a polynomial function.
4. Explain what conclusions you can draw from a table of datafor which the fifth differences are constant.
3. For a polynomial function of degree n, the nth differences are constant.
4. The data set is described by a fifth-degree polynomial function.
�4
�12 �3 0 3 12 33
9 3 3 9 21
�6 0 6 12
6 6 6
0 �2 10 72 244 6104
�2 12 62 172 366
2 14 50 110 194
24
12 36 60 84
24 24

A biologist is studying a type of cell that divides in two every hour.The biologist begins the experiment with a single cell. Thepopulation doubles every hour.
1. Complete the table.
Time (h) 0 1 2 3 4 5
Cells 1
2. How many hours will it take until there are more than 500 cells?
3. How many cells will there be after 10 hours?
4. How many cells will there be after n hours?n
THINK AND DISCUSS 5. Explain how you can write a function that models this situation.
6. Describe how your function would be different if the biologiststarted the experiment with 3 cells
Exponential Functions, Growth, and Decay7-1
2 4 8 16 32
9
1024
2 n
5. There are 2 times as many cells each hour as the previous hour and 1 cell initially, so f � x � � 2 x models the situation.
6. f � x � � 3 � 2 x � would model the situation.
ex plo rat i o n
Copyright © by Holt, Rinehart and Winston. 49 Holt Algebra 2All rights reserved.

The graph shows the distance of a particle from a location over time.
1. Complete the table based on the datain the graph.
Time � s � 0 1 2 3
Distance � ft �
2. Write an equation that gives the distance of the particle as afunction of time.
3. Complete the table showing the time it takes the particle toreach a given distance.
Distance � ft � 3 5 7 9
Time � s �
4. Plot the ordered pairs on the samecoordinate plane as the originalset of data.
THINK AND DISCUSS 5. Discuss how the two sets of data points in the graph are
related to each other. (Hint : Consider the line y � x.)
6. Explain how you could use your equation to find the time ittakes the particle to reach a given distance.
Inverses of Relationsand Functions7-2
3 5 7 9
y � 3 � 2x
0 1 2 3
5. The sets of points are reflection images of each other over the line y � x.
6. Substitute the given distance for y and then solve for x.
ex plo rat i o n
Copyright © by Holt, Rinehart and Winston. 50 Holt Algebra 2All rights reserved.

The population of a bacteria colony doubles every hour. The colony starts with one bacterium.
1. Complete the table.
Time 0 1 2 3 4
Population
2. Plot the ordered pairs to show the population growth over the first4 hours.
3. Write an equation that gives the population as a function ofthe time.
4. Complete this table to show the inverse relationship betweentime and population.
Population
Time 0 1 2 3 4
5. Plot the ordered pairs from this tableon the same coordinate plane.
THINK AND DISCUSS 6. Discuss the relationship between the graphs of the two sets
of data points.
7. Explain what you would need to do in order to use yourequation from Problem 3 to write a new equation that givesthe time as a function of the population.
Logarithmic Functions7-3
6. Each set of points is the reflection image of the other across the line y � x.
7. You would need to solve the exponential equation for x.
y � 2 x
1 2 4 8 16
1 2 4 8 16
ex plo rat i o n
Copyright © by Holt, Rinehart and Winston. 51 Holt Algebra 2All rights reserved.

The population of a bacteria colony doubles every hour. The colony starts with one bacterium.
1. Complete the table.
Time 0 1 2 3 4
Population
2. Plot the ordered pairs to show the population growth over the first4 hours.
3. Write an equation that gives the population as a function ofthe time.
4. Complete this table to show the inverse relationship betweentime and population.
Population
Time 0 1 2 3 4
5. Plot the ordered pairs from this tableon the same coordinate plane.
THINK AND DISCUSS 6. Discuss the relationship between the graphs of the two sets
of data points.
7. Explain what you would need to do in order to use yourequation from Problem 3 to write a new equation that givesthe time as a function of the population.
Logarithmic Functions 7-3
6. Each set of points is the reflection image of the other across the line y � x.
7. You would need to solve the exponential equation for x.
y � 2 x
1 2 4 8 16
1 2 4 8 16
ex plo rat i o n
Copyright © by Holt, Rinehart and Winston. 51 Holt Algebra 2All rights reserved.
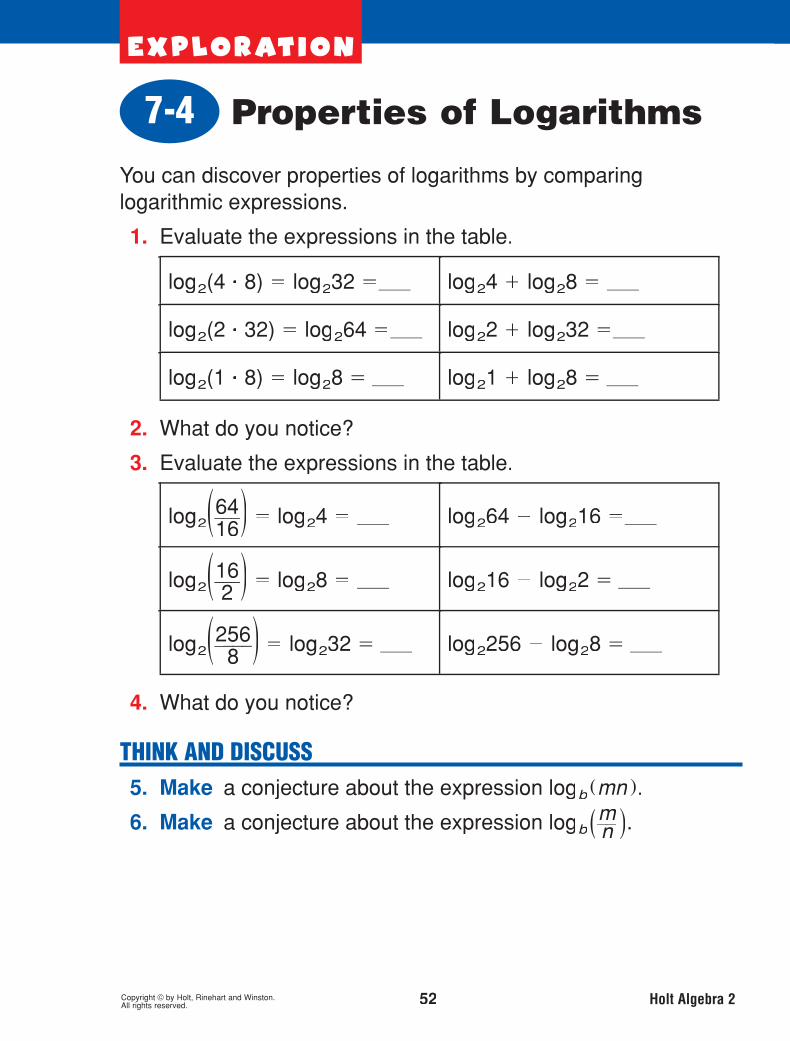
You can discover properties of logarithms by comparinglogarithmic expressions.
1. Evaluate the expressions in the table.
log2 (4 � 8) � log232 � log24 � log2 8 �
log2 (2 � 32) � log2 64 � log22 � log2 32 �
log2 (1 � 8) � log28 � log21 � log2 8 �
2. What do you notice?
3. Evaluate the expressions in the table.
log2�64___16� � log24 � log264 � log216 �
log2�16___2 � � log28 � log216 � log22 �
log2�256____8 � � log2 32 � log2256 � log28 �
4. What do you notice?
THINK AND DISCUSS 5. Make a conjecture about the expression logb �mn �.
6. Make a conjecture about the expression logb �m__nn � .
Properties of Logarithms7-4
5
3
6
2
3
5
5
3
6
2
3
5
The expressions in each row are equal.
The expressions in each row are equal.
5. log b � mn � � log b m � log b n
6. log b � m __ n � � log b m � log b n
ex plo rat i o n
Copyright © by Holt, Rinehart and Winston. 52 Holt Algebra 2All rights reserved.

To predict the number of prairie dogs in a region, a scientist usesthe equation P � 12,500 �0.9 � t where t P is the population afterP tyears.
1. Based on the equation, is the population of prairie dogsincreasing or decreasing? How do you know?
2. Find the initial population at time t � 0.
3. Enter the function into your calculator as
Y1. Press to set TblStart�0and �Tbl�1.
Then press to make a table forthe function.
4. After how many years will the population of prairie dogs be10,125?
5. After how many years will the population of prairie dogs fallbelow 6000?
THINK AND DISCUSS 6. Explain how you could write an equation that represents
Problem 4.
7. Explain how you could write an inequality that representsProblem 5.
Exponential and LogarithmicEquations and Inequalities7-5
12,500
2 years
7 years
1. Decreasing; the function has the form f � x � � a b x with 0 � b � 1.
6. 12,500 � 0.9 � t � 10,125
7. 12,500 � 0.9 � t � 6000
ex plo rat i o n
Copyright © by Holt, Rinehart and Winston. 53 Holt Algebra 2All rights reserved.

In this Exploration, you will investigate the expression �1 � 1__nn �n
.
1. Evaluate �1 � 1__nn �n
for n � 1.
2. Evaluate �1 � 1__nn �n
for n � 2.
3. You can use your calculator to help youevaluate the expression for larger valuesof n. First enter the expression as the
function Y1. Then press to return to the home screen.Press , scroll right to Y-VARS, select1:Function, and choose 1:Y1. Now you can evaluate the function for any input by entering a value inparentheses as shown.
4. Use your calculator to evaluate the expression for n � 10,000, n � 100,000, and n � 1,000,000.
THINK AND DISCUSS 5. Describe what happens to the value of the expression as n
gets larger.
6. Explain what you think the graph of the function
f �n � � �1 � 1__nn �n
would look like.
The Natural Base, e7-6
2
2.25
4. 2.718145927; 2.718268237; 2.718280469
5. The value of the expression approaches 2.7182818 ....
6. The graph would curve up and right and have a horizontal asymptote aty � 2.7182818....
ex plo rat i o n
Copyright © by Holt, Rinehart and Winston. 54 Holt Algebra 2All rights reserved.

Use a calculator to explore transformations of exponentialfunctions.
1. Enter the parent function y � e x by x
pressing and then
. Graph the function.
2. Enter each of the following functions as Y2 and graph themin the same window as the graph of y � e x. In each case, x
describe how the graph of the function is related to that ofy � e x.a. y � e x � 5 b. y � e x�4
c. y � �e x
d. y � e �x
THINK AND DISCUSS 3. Explain how the graph of y � e x�1
� 2 is related to thegraph of y � e x.
4. Describe how you would change the equation y � 4x ifx
you wanted to translate the graph of this function 3 units tothe left.
Transforming Exponentialand Logarithmic Functions7-7
The parent function is translated 5 units down.
The parent function is translated 4 units right.
The parent function is reflected across the x-axis.
The parent function is reflected across the y-axis.
The graph of y � e x is translated 1 unit right and 2 units up.
y � 4 x�3
ex plo rat i o n
Copyright © by Holt, Rinehart and Winston. 55 Holt Algebra 2All rights reserved.

Two scientists use two different models to predict populations ofelk in a national forest.
Model 1
Year t Population p0 32,000
1 33,500
2 35,000
3 36,500
1. For model 1, is p a linear function of p t, a quadratic function ofttt, or neither? How do you know? tt
2. For model 2, is p a linear function of p t, a quadratic function ofttt, or neither? How do you know?tt
3. For model 2, find the ratio of each y-value to the previous one.yyWhat do you notice?
4. Describe how the population of elk increases in model 2.
THINK AND DISCUSS 5. Explain what type of function is used to model the elk
population in model 2.
6. Discuss how you can recognize an exponential functionfrom a table of ordered pairs.
Curve Fitting with Exponential andLogarithmic Models
7-8
Model 2
Year t Population p0 32,000
1 33,600
2 35,280
3 37,044
Linear; first differences are constant.
The ratio is constant � 1.05 � .
exponential; y � 32,000 � 1.05 � x
2. Neither; neither the first differences nor second differences are constant.
4. The population increases by a factor of 1.05 (or by 5%) each year.
6. The ratio of function values is constant for equally spaced x-values.
ex plo rat i o n
Copyright © by Holt, Rinehart and Winston. 56 Holt Algebra 2All rights reserved.

0
100
200
300
12
8
6
4
3. Possible answer: The graph in Problem 1 is linear and passes through the origin. The graph in Problem 2 is nonlinear and does not pass through the origin.
4. As the amount of time Jorge travels increases, the distance he travels also increases. 5. As Leanne’s speed increases, the amount of time she needs for her trip decreases.
ex plo rat i o n
Copyright © by Holt, Rinehart and Winston. 57 Holt Algebra 2All rights reserved.
Variation Functions8-1
Distance traveled d can be determined by using the formuladd � rt, wherett r is the rate of travel andr t is the time traveled.t
1. Jorge’s averages 50 mi/h during a driving trip. Use thisinformation to complete the table. Then graph the data.
Time � h �
Distance � mi �
0246
2. Leanne is planning to drive 240 miles. Use this informationto complete the table. Then graph the data.
Rate � mi/h �
Time of Trip � h �
20304060
THINK AND DISCUSS 3. Tell how the graphs in Problems 1 and 2 are different. 4. Describe how the amount of time Jorge travels affects the
distance he travels. 5. Describe how Leanne’s rate, or speed, affects the amount of
time she needs for her trip.
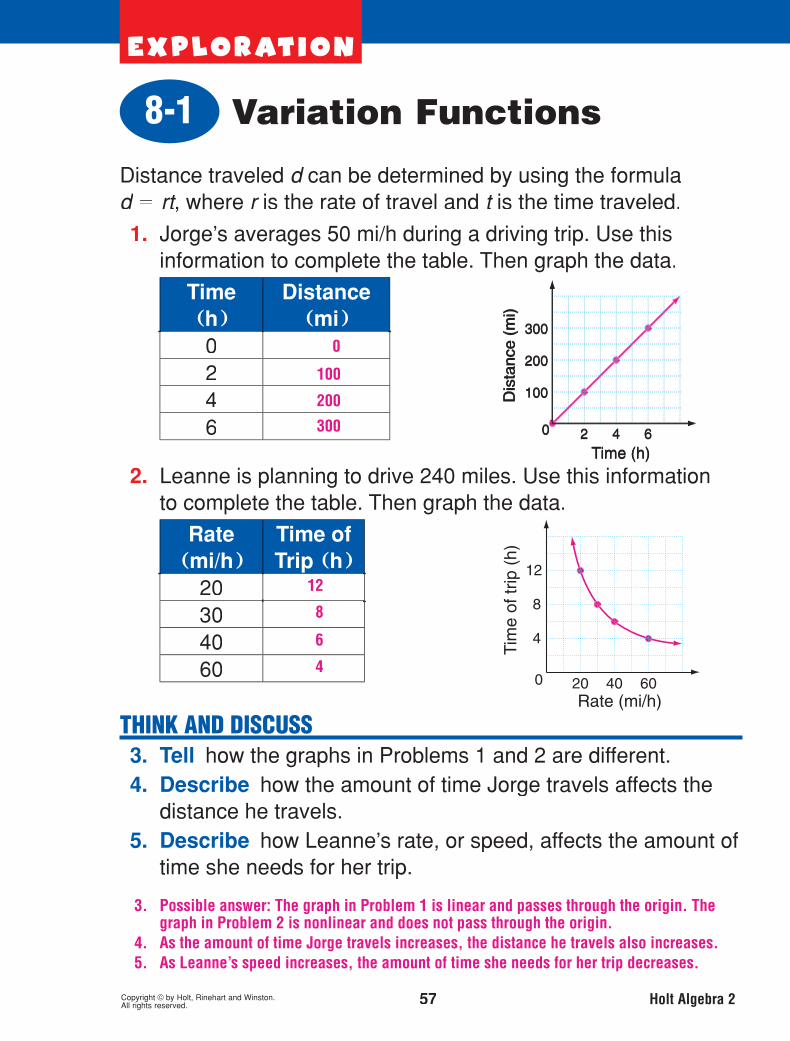

2 _ 9
6 __ 5x
7 _ 5 , or 1 2 _ 5
6 _ x
1 _ 4
y _ 8
4 _ 3 , or 1 1 _
3
y _ 3
3. Multiply numerators. Then multiply denominators. Divide out common factors of the numerator and denominator.
8. Multiply by the reciprocal of the divisor. Then divide out common factors of the numera-tor and denominator.
11. To multiply rational expressions, multiply numerators. Then multiply denominators. Divide out common factors of the numerator and denominator. To divide rational expressions, multiply by the reciprocal of the divisor. Then divide out common factors of the numerator and denominator.
ex plo rat i o n
Copyright © by Holt, Rinehart and Winston. 58 Holt Algebra 2All rights reserved.
Multiplying and Dividing Rational Expressions8-2
A rational expression is a quotient of two polynomials.nYou can multiply and divide rational expressions muchlike you would multiply and divide fractions.
Find each product. Simplify if necessary.
1. 1__3
� 2__3
2. 3___10
� 5__6
3. List the steps you used to multiply the fractions.
Find each product by using the steps you listed in Problem 3.Assume that x 0.
4. 2__5
� 3__xx 5. x__
8�
y__xx
Find each quotient. Simplify if necessary.
6. 7___10
� 1__2
7. 3__4
� 9___16
8. List the steps you used to divide the fractions.
Find each quotient by using the steps you listed in Problem 8. Assume that x 0.
9. 4__xx � 2__
310.
y__xx � 3__
xx
THINK AND DISCUSS 11. Discuss how to multiply and divide rational expressions.
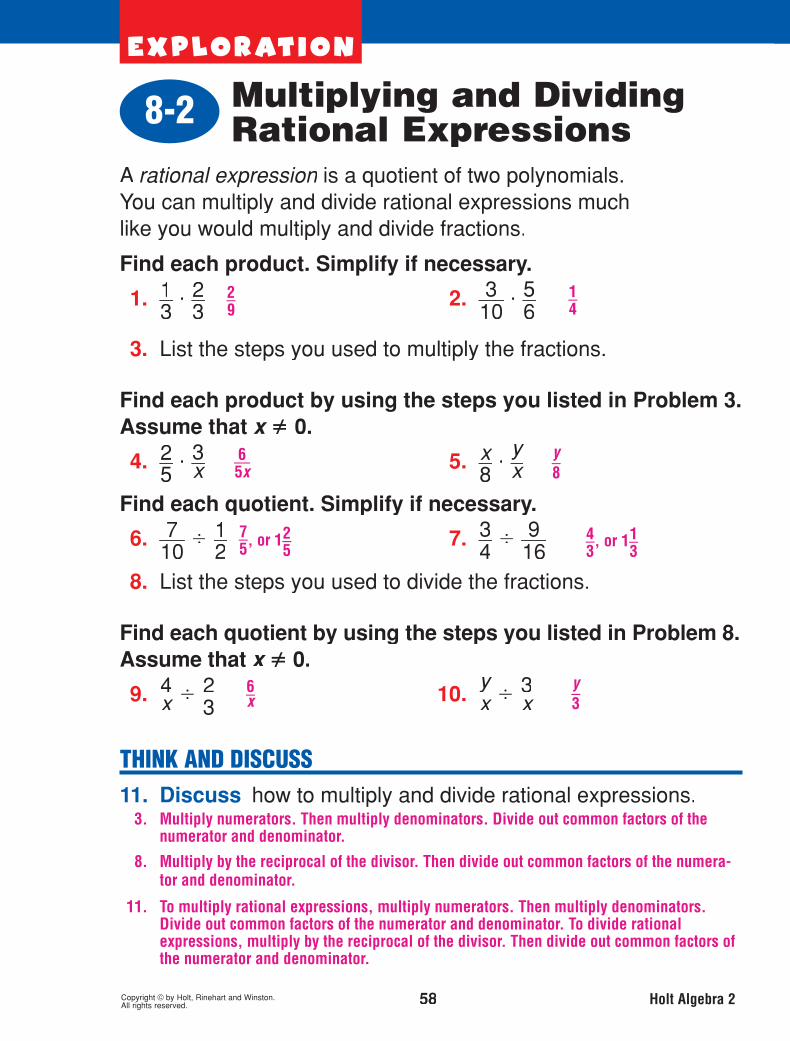

7 _ 5 , or 1 2 _ 5 6 _ 5 , or 1 1 _
5
7 _ x
1 _ 4
5 __ 4x
4 _ x
� 1 _ 3
1 _ x
3. Add the numerators. Write the sum of the numerators over the like denominator. Then divide out common factors of the numerator and denominator.
8. Subtract the numerators. Write the difference of the numerators over the like denomina-tor. Then divide out common factors of the numerator and denominator.
11. To add rational expressions with like denominators, add the numerators and write the sum over the like denominator. Then divide out common factors of the numerator and denominator. To subtract rational expressions with like denominators, subtract the numerators and write the difference over the like denominator. Then divide out common factors of the numerator and denominator.
ex plo rat i o n
Copyright © by Holt, Rinehart and Winston. 59 Holt Algebra 2All rights reserved.
You can add and subtract rational expressions much like youwould add and subtract fractions.
Find each sum. Simplify if necessary.
1. 3__5
� 4__5 5 2. 7___
10� 5___
10 3. List the steps you used to add the fractions.
Find each sum by using the steps you listed in Problem 3.Assume that x 0.
4. 2__xx � 5__
xx 5. 4___3x
� 8___3x
Find each difference. Simplify if necessary.
6. 5__8
� 3__8
7. 4___12
� 8___12
8. List the steps you used to subtract the fractions.
Find each difference by using the steps you listed in Problem 8. Assume that x 0.
9. 6___4x
� 1___4x
10. 12___5x
� 7___5x
THINK AND DISCUSS 11. Discuss how to add and subtract rational expressions with
like denominators.
Adding and SubtractingRational Expressions8-3

�10
�100
�1000
10
100
1000
1. Possible answer: The graph is nonlinear and has two unconnected branches.
3. If x � 2, the value of y gets smaller as x gets closer to 2. If x 2, the value of y gets larger as x gets closer to 2.
4. When x � 2, the denominator of the function rule becomes 2 � 2 � 0. Because division by 0 is undefined, the function is undefined at x � 2.
ex plo rat i o n
Copyright © by Holt, Rinehart and Winston. 60 Holt Algebra 2All rights reserved.
You can explore the behavior of the rational functionf �x � � 1______
x � 2 by using a graphing calculator. _
1. Enter the function rule by pressing and entering1/ �X � 2 �. Graph the function by pressing and selecting 4:ZDecimal. Describe the function’s graph.
Select the function you entered by pressing, scrolling right to Y-VARS, selecting
1:Function, and choosing 1:Y1. You can evaluate the function for any x-value by xxentering a value in parentheses as shown.
2. Complete the tables for the functionf �x � � 1______
x � 2 .
x y
1.9
1.99
1.999
x y
2.1
2.01
2.001
THINK AND DISCUSS 3. Explain what happens to the value of y as the value ofy x gets x
closer and closer to 2.
4. Discuss why the function f �x � � 1_____x � 2
is undefined at_ x � 2.
Rational Functions8-4

450 ___ w
2w
450 ___ w � 2w
w � �15
15 ft by 30 ft
6. Possible answer: Multiply both sides of the equation by w. Divide both sides of the equation by 2. Then take the square root of both sides.
7. Possible answer: Substitute each solution into the original equation and check whether it makes the equation true.
8. Because the width must be a positive value, use the solution w � 15, not w � �15.
ex plo rat i o n
Copyright © by Holt, Rinehart and Winston. 61 Holt Algebra 2All rights reserved.
Solving Rational Equationsand Inequalities8-5
A rancher wants to build a rectangular holding pen.
1. The pen will have an area of 450 ft 2 . Let w represent thewwidth of the pen. Write an expression in terms of w for thewlength of the pen.
2. The length of the pen will be twice the width. Use this infor-mation to write a second expression in terms of w for thewlength of the pen.
3. Write an equation by setting the two expressions you wrotefor the length of the pen equal to each other.
4. Solve the equation for w.ww
5. What will be the dimensions of the holding pen?
THINK AND DISCUSS 6. Describe the steps you used to solve the equation in
Problem 4.
7. Explain how you could check your solution to the equation.
8. Tell how you knew which value of w to use for the width ofwthe pen.

3. a number that is equal to a when raised to the third power
4. Possible answer: the fourth root of 16; find a number that is equal to 16 when raised to the fourth power.
1 1
8 2
27 3
64 4
125 5
6
ex plo rat i o n
Copyright © by Holt, Rinehart and Winston. 62 Holt Algebra 2All rights reserved.
You can use a graphing calculator toinvestigate the meaning of cube roots.To enter cube roots, press andselect 4: � 3 ���( �� .
1. Use your calculator to help you complete the table.
Cubes Cube Roots
13 3�3 ���1 �
23 3�3 ���8
33 3�3 ����27
43 3�3 ����64
53 3�3 ����125
2. Based on the pattern in the table, what is the cube rootof 6 3 ?
THINK AND DISCUSS 3. Explain what is meant by the cube root of a real number a.
4. Discuss the meaning of the expression 4� 4 ����16 and how you could determine its value.
Radical Expressions and Rational Exponents8-6
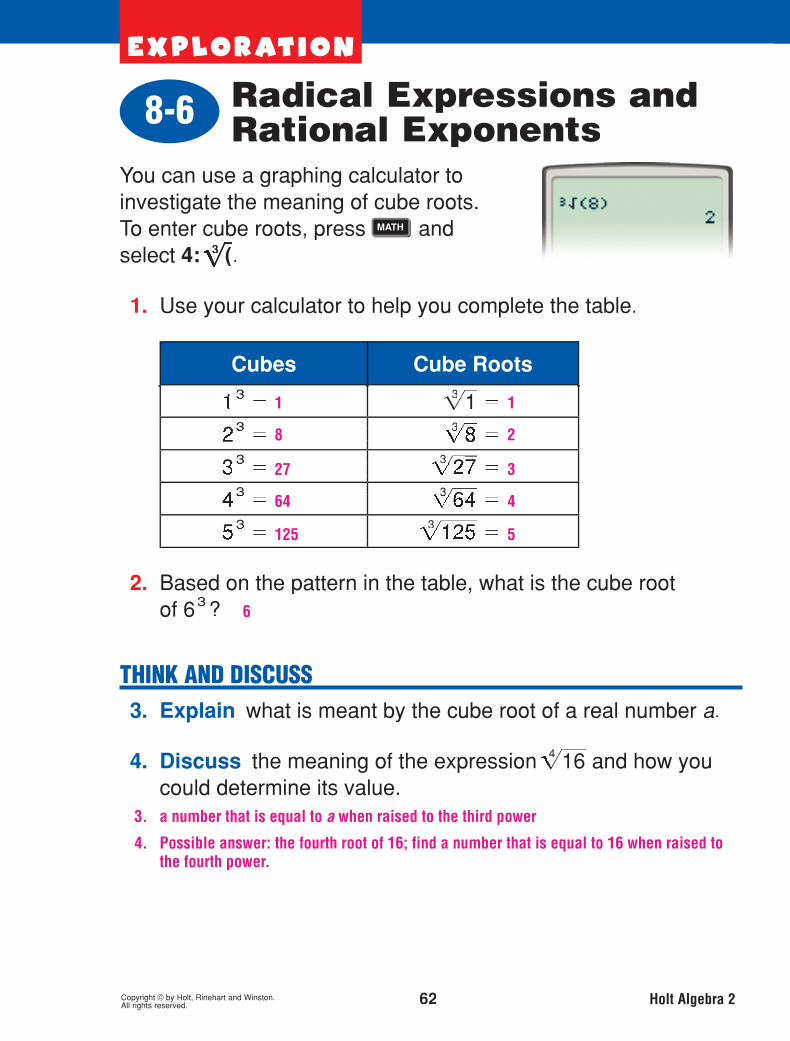

2. The value of x is restricted to nonnegative numbers because the square root of a negative number is not a real value.
7. The graph of y � ��
x � h is the graph of y � �� x translated h units to the right if h 0 and � h � units to the left if h � 0.
8. The expression under the radical must be nonnegative, so the domain is { x | x � h } .
{ x | x � 0 }
{ x | x � 2 }
{ x | x � �4 }
{ x | x � 5 }
{ x | x � �1 }
ex plo rat i o n
Copyright © by Holt, Rinehart and Winston. 63 Holt Algebra 2All rights reserved.
You can explore the behavior of radical functions by using agraphing calculator.
1. Enter the function f �x � � � ���x �� by pressing �x andentering � ���x �� . Graph the function in the standard square�xwindow by pressing and selecting 6:ZStandard and by pressing again and selecting 5:ZSquare. Based onthe graph, what is the domain of the function f �x � � � ���x �� ?�x
2. Why is the function f restricted to this domain?f
Graph each of the following functions on a graphingcalculator and give its domain.
3. f �x � � ������x�� � 2 {x |x 2} 4. f �x � �������x�� � 5
5. f �x � � ������x�� � 4 {x |x � �4} 6. f �x ��������x�� �1
THINK AND DISCUSS 7. Describe how the graph of y � ������x�� � h is related to the
graph of y � � ���x �� .x
8. Explain how you can determine the domain of the functiony � �
���x � h .
Radical Functions8-7

A � 8 s 2
10.5
11
11.5
12
12.5
s � � �� A _ 8
A � 1152 f t 2
Possible answer: A � 8 � 14 � 2 —simplify the right side of the equation;
14 � ��
A __ 8 — square both sides of the equation and then multiply both sides by 8.
Possible answer: A � 8 � 14 � 2 or 14 � �� A _ 8
ex plo rat i o n
64 Holt Algebra 2All rights reserved.
An architect is designing the layout of an offi ce building. Onesection of the building will consist of a row of 8 identical offi ces,each with a square-shaped fl oor.
1. Write an equation that represents the total area A of theoffices in terms of s, the side length of each office.
2. Solve your equation from Problem 1 for s.
3. Use your calculator to help you complete the table.
Total Area � ft 2 � Office Side Length � ft �
882
968
1058
1152
1250
4. For what values of A does each office have a side length of atleast 12 ft?
THINK AND DISCUSS 5. Give two equations you could use to determine the total area
of the offices when given that each office has a side length of
��
�14 ft.
6. Explain the steps you would use to solve each equation.
Solving Radical Equations and Inequalities8-8

Many real-world situations can be represented with a verbaldescription, a graph, a table, and an equation.
1. Complete the table for the graphshown here.
Time (min) Volume (gal) 010203040
2. Write a verbal description of thesituation shown on the graph.
3. How many gallons are drained from the tank every 10 minutes?How many gallons are drained every minute?
4. Write an equation for the situation, where x is the time inxminutes and y is the volume of water in the tank in gallons.y
THINK AND DISCUSS 5. Discuss the advantages and disadvantages of using a graph
to represent the situation.
6. Discuss the advantages and disadvantages of using anequation to represent the situation.
Multiple Representationsof Functions9-1
ex plo rat i o n
Copyright © by Holt, Rinehart and Winston. 65 Holt Algebra 2All rights reserved.

Many real-world situations can be represented with a verbaldescription, a graph, a table, and an equation.
1. Complete the table for the graphshown here.
Time (min) Volume (gal) 010203040
2. Write a verbal description of thesituation shown on the graph.
3. How many gallons are drained from the tank every 10 minutes?How many gallons are drained every minute?
4. Write an equation for the situation, where x is the time inxminutes and y is the volume of water in the tank in gallons.y
THINK AND DISCUSS 5. Discuss the advantages and disadvantages of using a graph
to represent the situation.
6. Discuss the advantages and disadvantages of using anequation to represent the situation.
Multiple Representationsof Functions9-1
600
450
300
150
0
2. A water tank starts with 600 gallons of water in it. It is drained at a constant rate until it is completely empty after 40 minutes.
4. y � 600 � 15x 5. The graph makes it easy to see at a glance that the tank is losing water at a constant
rate. However, it may be difficult to find the exact volume of water in the tank at a specific time.
6. The equation makes it easy to calculate the exact volume of water in the tank at any given time. However, it may be difficult to understand the situation just by looking at the equation.
150 gal; 15 gal
ex plo rat i o n
Copyright © by Holt, Rinehart and Winston. 65 Holt Algebra 2All rights reserved.

The graph shows a 10-hour trainingsession for a bicycle racer. The session consists of threedifferent stages.
1. Write a verbal description ofthe training session.
2. What is the cyclist’s speedduring each stage of the trainingsession?
3. Write a linear equation for each stageof the training session, where x represents the time in hoursxand y represents the cyclist’s distance in miles. (y Hint : Use thepoint-slope form for the equation of a line.)
4. What is the domain for each stage of the training session?
THINK AND DISCUSS 5. Explain how you can use only the graph to determine the
stage during which the cyclist had the greatest speed.
6. Describe how the graph would have been different if the cyclist had maintained the same speed during all three stages.
Piecewise Functions9-2
ex plo rat i o n
Copyright © by Holt, Rinehart and Winston. 66 Holt Algebra 2All rights reserved.
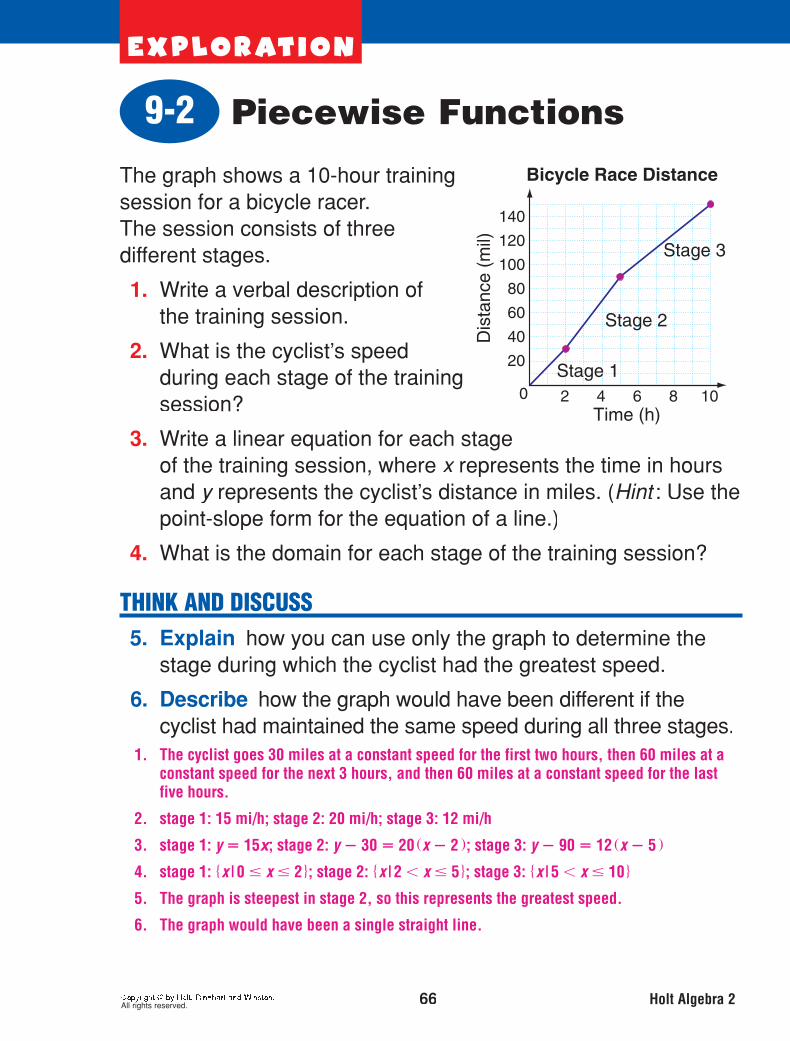
The graph shows a 10-hour trainingsession for a bicycle racer. The session consists of threedifferent stages.
1. Write a verbal description ofthe training session.
2. What is the cyclist’s speedduring each stage of the trainingsession?
3. Write a linear equation for each stageof the training session, where x represents the time in hoursxand y represents the cyclist’s distance in miles. (y Hint : Use thepoint-slope form for the equation of a line.)
4. What is the domain for each stage of the training session?
THINK AND DISCUSS 5. Explain how you can use only the graph to determine the
stage during which the cyclist had the greatest speed.
6. Describe how the graph would have been different if the cyclist had maintained the same speed during all three stages.
Piecewise Functions9-2
1. The cyclist goes 30 miles at a constant speed for the first two hours, then 60 miles at a constant speed for the next 3 hours, and then 60 miles at a constant speed for the last five hours.
2. stage 1: 15 mi/h; stage 2: 20 mi/h; stage 3: 12 mi/h
3. stage 1: y � 15x; stage 2: y � 30 � 20 � x � 2 � ; stage 3: y � 90 � 12 � x � 5 �
4. stage 1: { x | 0 � x � 2 } ; stage 2: { x | 2 � x � 5 } ; stage 3: { x | 5 � x � 10 }
5. The graph is steepest in stage 2, so this represents the greatest speed.
6. The graph would have been a single straight line.
ex plo rat i o n
66 Holt Algebra 2All rights reserved.

In this Exploration, you will investigate a transformation of apiecewise function.
1. Complete the table forthe piecewise function inthe graph.
x y
�8
�4
0
4
8
2. Add 2 to each x-value in the table and add 1 to eachxx y-value.yyPlot the new points and connect them to graph the resultingpiecewise function.
3. What are the intervals for the original piecewise function?
4. What are the intervals for the transformed function?
THINK AND DISCUSS 5. Explain how the graph of the transformed function compares
to the graph of the original function.
6. Explain how the intervals for the transformed function arerelated to the intervals for the original function.
Transforming Functions9-3
5. The original function is translated 2 units right and 1 unit up.
6. The original intervals are translated 2 units right. (2 is added to the endpoints of each interval.)
[�8, �4), [�4, 0), [0, 4), [4, 8]
[�6, �2), [�2, 2), [2, 6), [6, 10]
8
6
2
�6
�8
ex plo rat i o n
Copyright © by Holt, Rinehart and Winston. 67 Holt Algebra 2All rights reserved.

Safety experts use functions to model the distance a car travelsbefore stopping once the driver has noticed a hazard in the road.The table shows the reaction distance (the distance the cartravels before the driver hits the brake pedal) and the brakingdistance (the distance the car travels once the brake has beenapplied).
Speed (mi/h)Reaction Distance
(ft)Braking Distance
(ft)10 11 620 22 2430 33 5440 44 9650 55 150
1. Determine a function R �x � for the reaction distance, where xis the car’s speed in miles per hour.
2. The function for the braking distance B �x � is a quadratic function of the form B �x � � a x 2. Determine the value of a andawrite B �x �
3. Write a new function T�x � by adding the rules for R �x � and B �x � .
THINK AND DISCUSS 4. Explain what the function T �x � represents and use it to find
T �60 � .
5. Discuss the meaning of T �x � � B �x �.
Operations with Functions9-4
4. T � x � represents the total stopping distance; T � 60 � � 282.
5. T � x � � B � x � � R � x � , which is the function for the reaction distance.
R � x � � 1.1x
a � 0.06; B � x � � 0.06 x 2
T � x � � 0.06 x 2 � 1.1x
ex plo rat i o n
Copyright © by Holt, Rinehart and Winston. 68 Holt Algebra 2All rights reserved.

For this Exploration, set your calculator to the decimal window by pressing ���� and selecting 4:ZDecimal.
1. Enter the function f x x 4 as Y1 and view its graph.
2. To graph the inverse relation, return to
the home screen, press ��� ����
����
,
and select 8:DrawInv. Then press ����
and use the arrows keys to move to the Y-VARS menu. Select 1:Function and then 1:Y1. Press ����� to view the graph of f x and its inverse.
3. Graph each function in the table. Tell whether there is a horizontal line that passes through more than one point on the graph. Then graph the inverse relation and tell whether it is a function.
Function
Is there a horizontal line that passes through more
than one point on the graph?
Is the inverserelation a function?
y 2 x
y x 2 1
y x 3 x 1
THINK AND DISCUSS 4. Discuss any conclusions you can draw from the table.
Functions and Their Inverses9-5
exploration
Copyright © by Holt, Rinehart and Winston. 69 Holt Algebra 2All rights reserved.
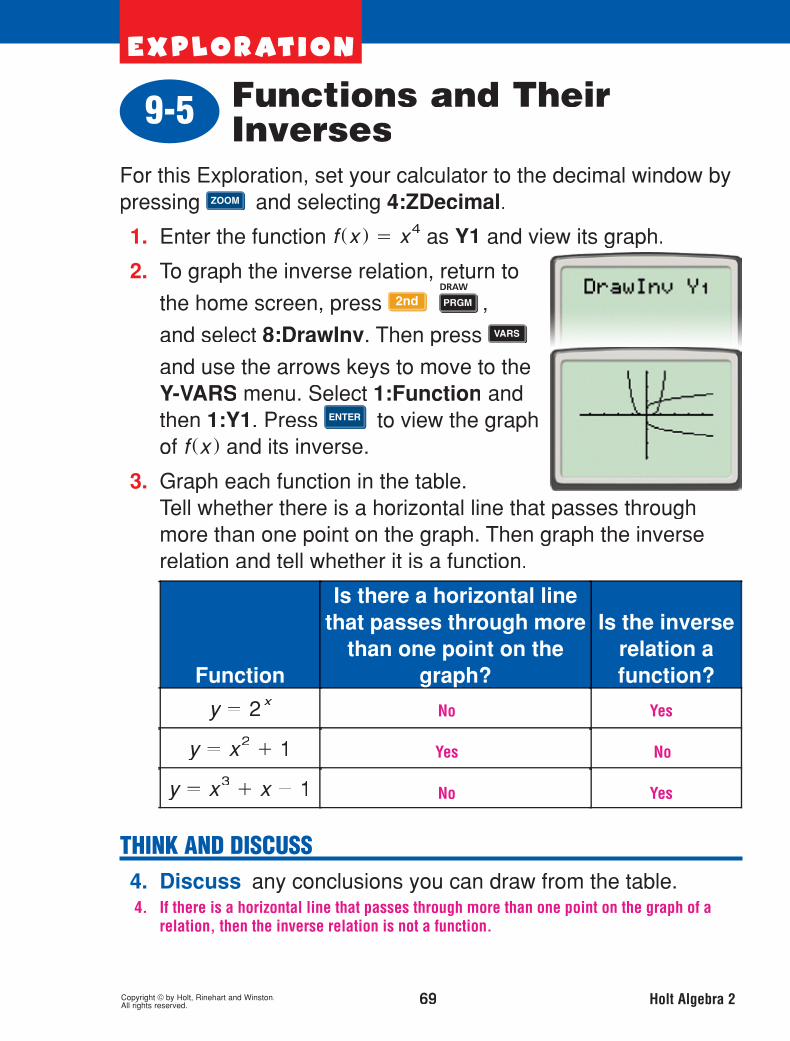
For this Exploration, set your calculator to the decimal window by pressing ���� and selecting 4:ZDecimal.
1. Enter the function f x x 4 as Y1 and view its graph.
2. To graph the inverse relation, return to
the home screen, press ��� ����
����
,
and select 8:DrawInv. Then press ����
and use the arrows keys to move to the Y-VARS menu. Select 1:Function and then 1:Y1. Press ����� to view the graph of f x and its inverse.
3. Graph each function in the table. Tell whether there is a horizontal line that passes through more than one point on the graph. Then graph the inverse relation and tell whether it is a function.
Function
Is there a horizontal line that passes through more
than one point on the graph?
Is the inverserelation a function?
y 2 x
y x 2 1
y x 3 x 1
THINK AND DISCUSS 4. Discuss any conclusions you can draw from the table.
Functions and Their Inverses9-5
4. If there is a horizontal line that passes through more than one point on the graph of a relation, then the inverse relation is not a function.
No Yes
Yes No
No Yes
exploration
Copyright © by Holt, Rinehart and Winston. 69 Holt Algebra 2All rights reserved.

For an object dropped from a height of x feet, the functionx y � ����x ___
4can be used to approximate the time in seconds that will passbefore the object reaches the ground.
1. The table shows the heights of various objects. Completethe table by finding the time that passes before the objectreaches the ground.
Height x 16 64 144 256 400 576
Time y
2. What do you notice about the times?
3. Find the first differences and second differences of theheights.
4. What do you notice about the differences?
5. Plot the data points on a coordinateplane.
6. Describe the general shape of thegraphed data.
THINK AND DISCUSS 7. Describe the parent function that best models this data set.
8. Explain how you can recognize a square-root function froma table of values.
Modeling Real-World Data9-6
1 2 3 4 5 6
The times are evenly spaced.
first differences: 48, 80, 112, 144, 176; second differences: 32, 32, 32, 32
The second differences are constant.
6. The graph has a shape similar to a square-root function. 7. f � x � � ��
x 8. There are constant second differences between the x-values for evenly spaced y-values.
ex plo rat i o n
Copyright © by Holt, Rinehart and Winston. 70 Holt Algebra 2All rights reserved.

To graph any relation, you can begin by plotting a few points.Recall that not all graphs represent functions.
1. Complete the table for the equation x 2 � y 2 � 25. Be sure tofind all the y-values for each yy x-value.xx
x �5 �4 �3 0 3 4 5
y 0 �3 �4 �5 �4 �3 0
2. Plot the points and graph the relation.
3. What type of shape is the graph? circle
4. Complete the table for the equation 4x2� 9 y 2 � 36.
Be sure to find all the y-values for eachyy x-value. Round xxyour answers to the nearest tenth if necessary.
x �3 �2 �1 0 1 2 3
y 0 �1.5 �1.9 �2 �1.9 �1.5 0
5. Plot the points and graph the relation.
THINK AND DISCUSS 6. Describe the graph of 4x2
� 9 y 2 � 36. How is it different from the graph of x2
� y 2 � 25? The graph of 4 x 2 � 9 y 2 � 36 is an
ellipse, whereas the graph of x 2 � y 2 � 25 is a circle.
7. Explain whether the relations that you graphed are functions. 2. 5.
7. No; they fail the vertical line test.
Introduction to Conic Sections10-1
ex plo rat i o n
Copyright © by Holt, Rinehart and Winston. 71 Holt Algebra 2All rights reserved.

Circles10-2
You can use your calculator to discover properties of circles.
For example, to graph �x � 1 �2� �y � 2�2
� 25, fi rst solvefor y as shown.y
�x � 1� �2� �y � 2 ��2
� 25�y � 2��2
� 25 � �x � 1��2
y � 2 � � ��
��25 � �x � 1 ��2
y � � ��
��25 � �x � 1 ��2� 2
Enter the positive and negative functionsin your calculator as Y1 and Y2 and graphthese in a square window. The graph showsthat the center of the circle is �1, 2� and the radius is 5.
1. Graph each equation of a circle. Find the center and radius ofeach circle to complete the table.
Equation Center Radius
x2� �y � 3 ��2
� 9 � 0, 3 � 3
�x � 5��2� �y � 3 ��2
� 16 � 5, �3 � 4
�x � 4��2� y 2 � 36 � �4, 0 � 6
THINK AND DISCUSS 2. Describe how to find the center and radius of the circle
�x � 5 ��2� �y � 9��2
� 4 without graphing the equation.
3. Explain how you know that the graph of the circle�x � 5 ��2
� �y � 9� �2� 4 does not intersect either axis.
2. According to the pattern in the table, the center of a circle whose equation is� x � h � 2 � � y � k � 2 � r 2 is � h,k � , and the radius is r. So the center of � x � 5 � 2 � � y � 9 � 2 � 4 is � �5, 9 � and the radius is 2.
3. Since the center is (�5, 9), and the radius is 2, the circle lies entirely in thesecond quadrant.
ex plo rat i o n
Copyright © by Holt, Rinehart and Winston. 72 Holt Algebra 2All rights reserved.

Ellipses10-3
You can discover properties of ellipses by plotting a fewpoints and sketching the graphs.
1. Complete the table for the
equation x2___25
�y 2__9
� 1. Then
plot these points to help you
sketch the graph of the ellipse.
2. Complete the table for the
equation y 2___25
� x 2__9
� 1. Then
plot these points to help you
sketch the graph of the ellipse.Use the above technique to sketch the graphs of the following ellipses. Look for patterns as you work.
3. x2___16
�y 2__4
� 1
5. x2___49
�y 2___36
� 1
4.yy2
___16
� x2__4
�1
6. y 2___49
� x 2___36
�1
THINK AND DISCUSS 7. Describe how the ellipses in Problems 1 and 2 are similar
and how they are different.
8. Explain how you can look at the equation of an ellipse todecide whether the ellipse is horizontal or vertical.
7. Both ellipses are centered at the origin and have the same shape. The ellipse inProblem 1 lies horizontally, and the ellipse in Problem 2 stands vertically.
8. The ellipse lies horizontally when the x 2 -term is divided by the greater value, and the ellipse stands vertically when the y 2 -term is divided by the greater value.
x y0 �3
�5 0
x y0 �5
�3 0
ex plo rat i o n
Copyright © by Holt, Rinehart and Winston. 73 Holt Algebra 2All rights reserved.
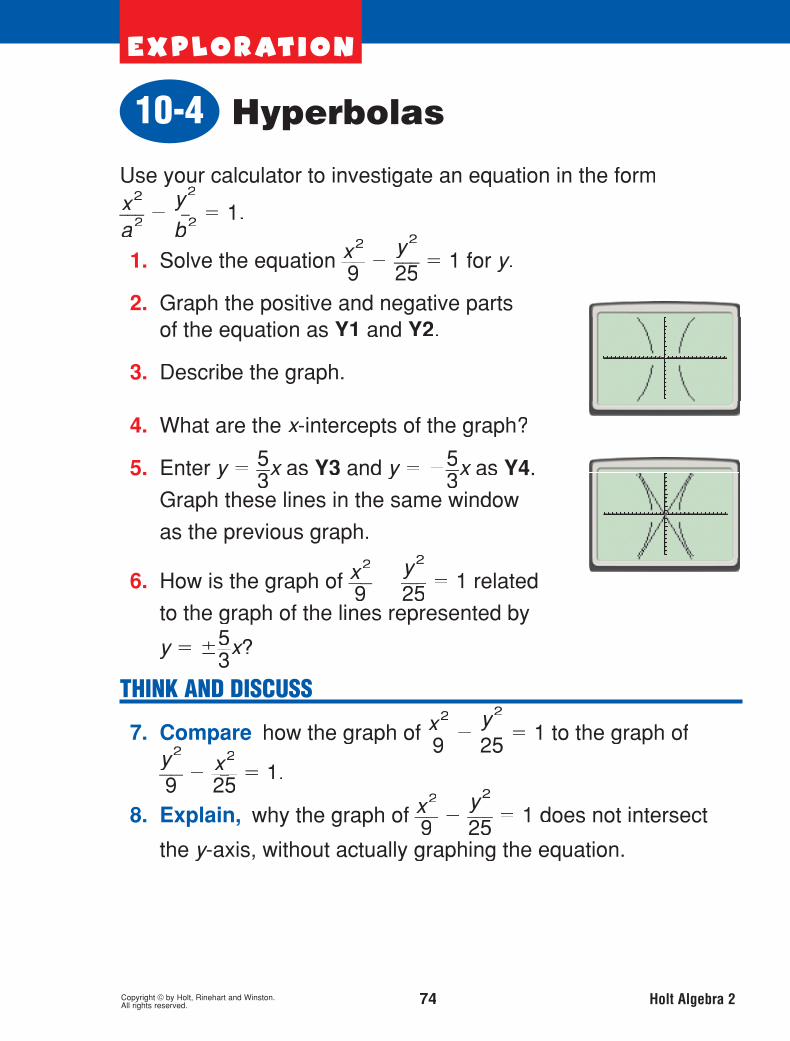
Hyperbolas10-4
Use your calculator to investigate an equation in the formx2___a 2
�y 2___b 2
� 1.
1. Solve the equation x2
__9
�y 2___25
� 1 for y.yy y � � ��
25 x 2 � 225 ____________ 3
2. Graph the positive and negative partsof the equation as Y1 and Y2.
3. Describe the graph. The graph consists of two
unconnected branches.
4. What are the x-intercepts of the graph?xx
5. Enter y � 5__3
x asx Y3 and y � �5__3
x asx Y4.
Graph these lines in the same window
as the previous graph.
6. How is the graph of x 2__9
�y 2___25
� 1 related
to the graph of the lines represented by
y � �5__3
x? xx The lines are asymptotes.
THINK AND DISCUSS
7. Compare how the graph of x 2__9 �
y 2___25
� 1 to the graph ofy 2__9
� x 2___25
� 1.
8. Explain, why the graph of x 2__9
�y 2___25
� 1 does not intersect
the y-axis, without actually graphing the equation.yy
7. The graphs of y 2
___ 9 � x 2 ___
25 � 1 and x 2 ___
9 �
y 2 ___
25 � 1 are both hyperbolas, but the graph of
y 2
___ 9 � x 2 ___
25 � 1 opens horizontally, and the graph of x 2 ___
9 �
y 2 ___
25 � 1 opens vertically.
8. On the y-axis, x � 0, which means � y 2
___ 25
� 1, or y 2 � �25. This has no real solution, so there are no y-intercepts.
�3
ex plo rat i o n
Copyright © by Holt, Rinehart and Winston. 74 Holt Algebra 2All rights reserved.

Parabolas10-5
The graph of an equation in the form y � 1___4p
x _ 2 or x � 1___4p
y _p
2 is
a parabola. Use your calculator to explore how the value of paffects the shape and position of the parabola.
1. Use your calculator to graph each equation in the table.
(Hint: For equations in:
the form x � 1___4p
y _ 2,
solve for y and graph two y
separate functions.) Tellwhether each parabolaopens upward, downward,to the left, or to the right.
2. Graph y � 1__4
x 2 , y � 1__8
x 2 , y � 1___12
x 2 , and y � 1___16
x 2
in the same window. What happens to the graph
as the value of p increap ses in the equation
y �1___4p x _p
2 ? As p increases, the parabola is
compressed vertically.
THINK AND DISCUSS 3. Explain how you can tell the direction in which a parabola
opens by looking at its equation.
4. Describe how the graph of x �1___32y _ 2 compares to the graph
of x � �1___32y _ 2.
3. For an equation in the form y � 1 ___ 4p
x 2 , the parabola opens upward when p 0 and down-
ward when p � 0. For an equation in the form x � 1 ___ 4p y 2 , the parabola opens to the right
when p 0 and to the left when p � 0. 4. The graphs are nearly identical parabolas. But x � 1 ___ 32 y 2 opens to the right, and x � � 1 ___ 32 y 2
opens to the left.
Equation Parabola Opens
y � 1__8
x 2 Upward
y � �1__8
x2Downward
x � 1__8
y _ 2To the Right
x ��1__8
y _ 2To the Left
ex plo rat i o n
Copyright © by Holt, Rinehart and Winston. 75 Holt Algebra 2All rights reserved.

Identifying Conic Sections10-6The equation of any conic section can be written in the generalform A x 2 � Bxy � C y 2 � Dx � Ey � F � 0.
1. Sketch the graph of �x � 2��2_______
9�
�y � 1��2_______
25� 1.
2. What type of conic section is this?hyperbola
3. To write the equation of the conic section ingeneral form, first multiply both sides of theequation by 225 (the LCM of 9 and 25), as shown.�x � 2��2_______
9�
�y � 1 ��2_______
25� 1
25 �x � 2 � �2� 9 �y � 1��2
� 225
Now expand the binomials and simplify to write theequation in general form. 25 x 2 � 9 y 2 � 100x � 18y � 134 � 0
4. What are the values of A, B, C, D, E, and F for thisFconic section? A � 25; B � 0; C � �9; D � �100; E � 18; F � �134
THINK AND DISCUSS
5. Explain how to write the equation of the ellipse�x � 3��2_______
4�
�y � 1��2_______
25� 1 in general form.
6. Discuss what type of conic section is representedby an equation in general form when A � B � 0.
5. Multiply both sides of the equation by 100, square the binomials, and simplify. The equation is 25 x 2 � 4 y 2 � 150x � 8y � 129 � 0.
6. A parabola is represented since there is only one squared term.
ex plo rat i o n
Copyright © by Holt, Rinehart and Winston. 76 Holt Algebra 2All rights reserved.

Use a square window on your calculator for this Exploration.
1. Graph the line y 3__4 x 25___
4 .
2. Graph the circle x 2 y 2 25 in the same window. What can you say about the relationship between the two graphs?The two graphs intersect at one point.
3. Use the intersect feature of your graphing
calculator to find the point of intersection of
the graphs. Press ��� �����
���the point of intersection of
���the point of intersection of
�the point of intersection of
�the point of intersection of
and select5:intersect. Use the arrow keys to move thecursor to the point of intersection. Note that you must use the positive part of the circle only. 3, 4
4. What is the solution to the system of equations
{y 3__4 x 25___
4
x 2 y 2 2 2
25 ? x 3, y 4
5. Use the above method to solve the system {y 3__4 x
x 2 y 2
2 25
.
THINK AND DISCUSS 6. Explain what happens when you try to solve the system
{y 3__4 x 7
x 2 y 2
2 2 25
. The graphs do not intersect, so there is no solution.
7. Describe the possible solutions for a system consisting of a line and a circle.
1. 2.
7. There may be one solution (if the line is a tangent to the circle), two solutions, or no solution.
4, 3 and 4, 3
1. 2.
exploration
Copyright © by Holt, Rinehart and Winston. 77 Holt Algebra 2All rights reserved.
Solving Nonlinear Systems10-7

At a juice bar, a customer who orders a smoothie gets to chooseone type of fruit and one type of yogurt. For example, customerswho order Simple Smoothies get to choose from 3 fruits (bananas,peaches, or blueberries) and 2 yogurts (plain or vanilla). The tree diagram shows that there are 6 possible Simple Smoothies.
Bananas Peaches Blueberries
Plain Vanilla Plain Vanilla Plain Vanilla
1. Use tree diagrams to help you complete the table.
Smoothie Name
Possible Fruits
Possible Yogurts
Number of Possible
Smoothies
Berry Smoothiestrawberries, blueberries
raspberry,blackberryy
Choco Smoothie
bananas,raspberries,strawberries
chocolate
TropicalSmoothie
papayas, mangos,bananas
coconut, lime,kiwi
THINK AND DISCUSS 2. Discuss how the number of fruit choices and the number of
yogurt choices are related to the number of possible smoothies.
3. Explain how you can find the number of possible smoothieswhen there are m choices for the fruit andm n choices for the yogurt.n
ex plo rat i o n
0-0
Copyright © by Holt, Rinehart and Winston. 78 Holt Algebra 2All rights reserved.
11-1 Permutations andCombinations
2. The number of possible smoothies is equal to the number of fruit choices multiplied by the number of yogurt choices.
3. Possible answer: Find the product mn.
4
3
9
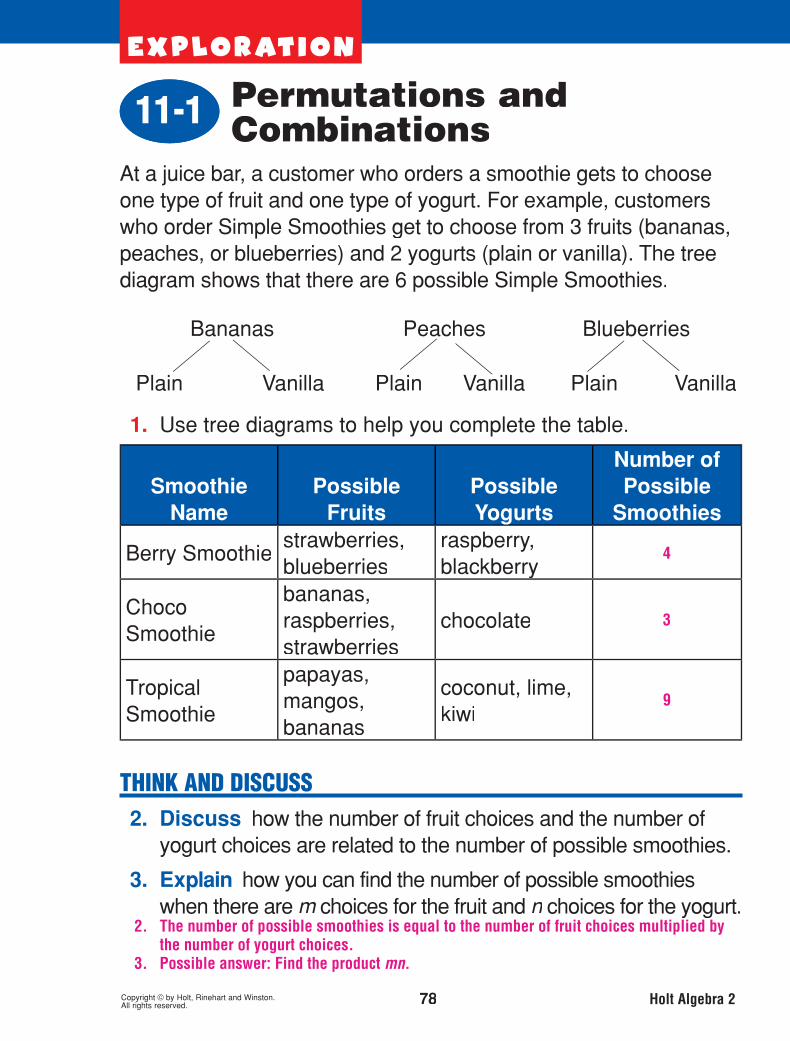

You can use a calculator to help you investigate probability.
1. A number cube has faces numbered 1 to 6. How many of thefaces are numbered with a multiple of 3?
2. What fraction of the faces is labeled with a multiple of 3?This fraction represents the theoretical probability of rolling amultiple of 3 because it is based on possible outcomes.
You can model rolling a number cube byusing the random integer feature of acalculator. Press , scroll right toPRB, and select 5:randInt(. Then enter 1
6 50 and press to see alist of 50 random integers from 1 to 6.Use the right arrow key to see all ofthe results.These numbers model 50 rollsof a number cube.
3. How many of the 50 rolls resulted in a multiple of 3?
4. What fraction of the 50 rolls resulted in a multiple of 3? Thisfraction represents the experimental probability of rolling amultiple of 3 because it is based on actual outcomes.
THINK AND DISCUSS 5. Discuss what you think will happen to the experimental
probability if you increase the number of rolls.
6. Predict the number of rolls that will result in a multiple of 3 ifa number cube is rolled 300 times. Justify your answer.
Theoretical and Experimental Probability11-2
ex plo rat i o n
Copyright © by Holt, Rinehart and Winston. 79 Holt Algebra 2All rights reserved.
2
1 __ 3
3. Possible answer: 17
4. Possible answer: 17 ___ 50
5. Possible answer: It will get closer to the theoretical probability of rolling a multiple of 3. 6. Possible answer: 100 times; based on the theoretical and experimental probability,
about 1 __ 3 of the rolls should result in a multiple of 3, and 1 __
3 (300) � 100.
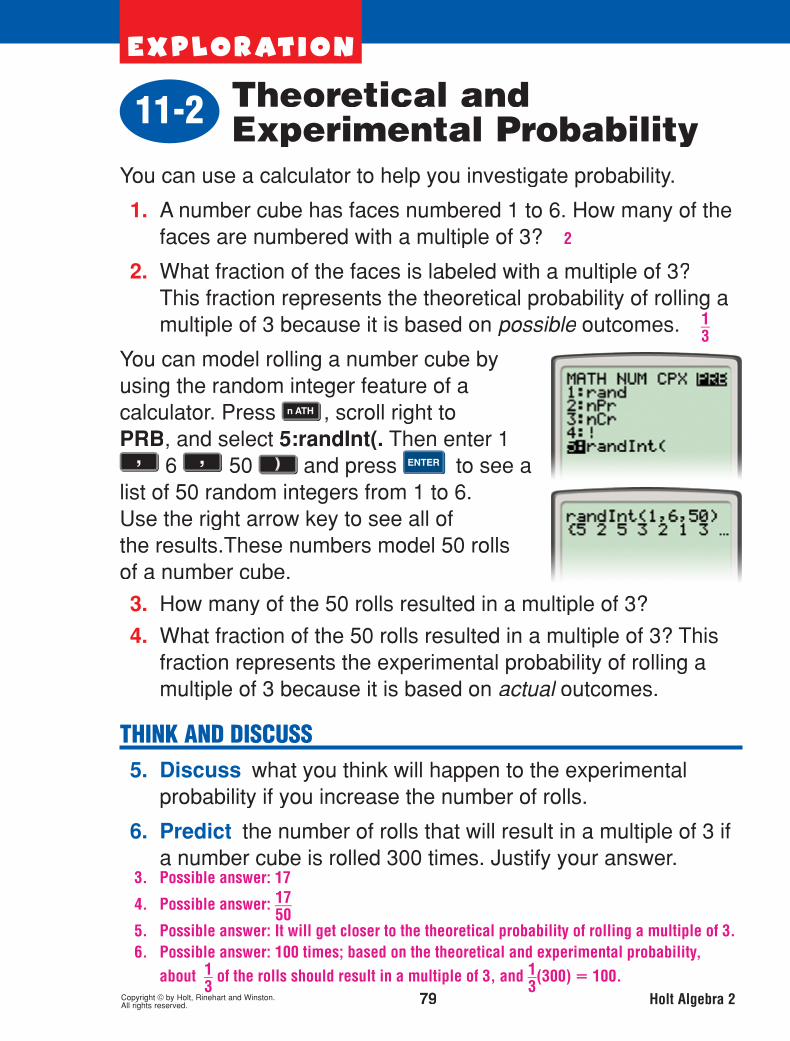

ex plo rat i o n
Copyright © by Holt, Rinehart and Winston. 80 Holt Algebra 2All rights reserved.
Independent andDependent Events11-3
Events are independent if the occurrence of one event does nottaffect the probability of the other. Events are dependent if theoccurrence of one event does affect the probability of the other.
1. Christie has 2 dimes and 1 penny in her pocket. If she takesone coin at random, what is the probability that it will be adime? What is the probability that it will be a penny?
Christie takes a dime from her pocket.
2. What are the possible outcomes if she takes a second coinfrom her pocket without replacing the first coin?
3. What is the probability that the second coin will be a dime?What is the probability that it will be a penny?
4. If Christie tosses one of her dimes, what is the probability thatit will land on heads?
5. Christie’s first dime lands on heads. If she tosses the seconddime, what is the probability that it will land on heads? Whatis the probability that it will land on tails?
THINK AND DISCUSS 6. Explain why the events described in Problems 2 and 3 are
dependent events.
7. Explain why the events described in Problems 4 and 5 areindependent events.
2 __ 3 ; 1 __
3
dime: 1 __ 2 ; penny: 1 __
2
1 __ 2
heads: 1 __ 2 ; tails: 1 __
2
6. The events are dependent because the probability of taking a penny or a dime changes after the first dime is taken.
7. The events are independent because the probability of getting heads or tails on the second dime does not change after the first dime is tossed.
taking the second dime or taking the penny

ex plo rat i o n
Copyright © by Holt, Rinehart and Winston. 81 Holt Algebra 2All rights reserved.
Compound Events11-4
The Math Club sponsors a booth at a school carnival. Visitors tothe booth can win prizes by spinning the wheel shown.
Find each probability.
1. the wheel landing on an odd number
2. the wheel landing on a multiple of 4
3. the wheel landing on a prime number
4. During the morning, a player can win a prize if the player’s spin lands on an odd number or a multiple of 4. Whichnumbers result in a player winning a prize?
5. What is the probability that a player will win a prize in onespin?
6. During the afternoon, a player can win a prize if the player’sspin lands on an odd number or a prime number. Which numbers result in a player winning a prize?
7. What is the probability that a player will win a prize in onespin?
THINK AND DISCUSS 8. Explain whether the two possible winning events in the
morning game are mutually exclusive. Mutually exclusive events cannot both occur in the same trial of an experiment.s
9. Explain whether the two possible winning events in theafternoon game are mutually exclusive.
1 __ 4
1 __ 2
5 ___ 12
3 __ 4
7 ___ 12
1, 3, 4, 5, 7, 8, 9, 11, 12
8. Yes; a player cannot spin a number that is both odd and a multiple of 4.
9. No; a player can spin the numbers 3, 5, 7, and 11, which are both odd and prime.
1, 2, 3, 6, 7, 9, 11

The advertised mass of a box of cereal is 453 grams. A quality control manager measures 13 boxes and records the following masses in grams.
450, 453, 451, 456, 455, 454, 456, 452, 452, 453, 495, 453, 456
Enter the data into a list in a calculator bypressing ���� and selecting 1:Edit.... Then
enter the data into list L1. Press ��� ����
����
to return to the home screen.
1. Find the average, or mean, of the data
by pressing ��� ����
����
, scrolling right to
MATH, and selecting 3:mean(. Then
press ��� ���
����� .
2. Find the middle value, or median, of the data by using the procedure described above but select 4:median( instead of3:mean(.
3. An outlier is a value that is much less than or much greater than the other values in a data set. Which value in the data set above is most likely to be considered an outlier?
4. How does the mean of the data set change if this outlier is removed? How does the median change?
THINK AND DISCUSS 5. Discuss whether the mean or median gives a better
measure of the center of the data set.
Measures of Central Tendency and Dispersion11-5
exploration
Copyright © by Holt, Rinehart and Winston. 82 Holt Algebra 2All rights reserved.
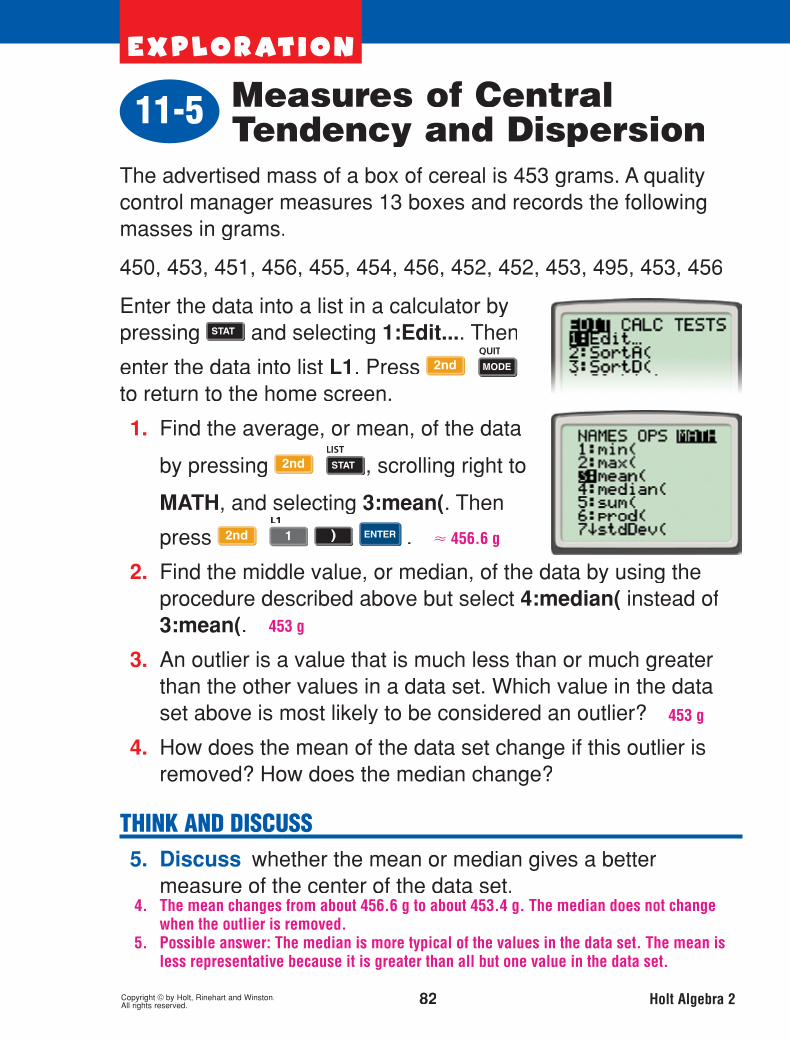
456.6 g
453 g
453 g
4. The mean changes from about 456.6 g to about 453.4 g. The median does not change when the outlier is removed.
5. Possible answer: The median is more typical of the values in the data set. The mean is less representative because it is greater than all but one value in the data set.

ex plo rat i o n
Copyright © by Holt, Rinehart and Winston. 83 Holt Algebra 2All rights reserved.
Binomial Distributions11-6
The fi gure shows the fi rst few rows of Pascal’s triangle. Each rowbegins and ends with 1. Any other entry in a row is the sum of thetwo entries to its upper left and upper right.
Row 0 1
Row 1 1 1
Row 2 1 2 1
Row 3 1 3 3 1
1. Write row 4 and row 5 of Pascal’s triangle.
2. Recall that nCrr � n!_________r ! �n � r �!
. Calculate 3C0, 3C1, 3C2,
and 3C3. How do these combinations relate to Pascal’striangle?
3. Calculate 4C0 , 4C1, 4C2, 4C3 and 4C4. How do thesecombinations relate to Pascal’s triangle?
4. List the combinations that could be used to determine row 5of Pascal’s triangle.
THINK AND DISCUSS 5. Discuss whether the pattern of combinations holds for row 0
and row 1 of Pascal’s triangle.
6. Explain how you could determine row n of Pascal’s triangle,nwhere n is a whole number.n
1. row 4: 1, 4, 6, 4, 1; row 5: 1, 5, 10, 10, 5, 1
2. 1, 3, 3, 1; the values are the same as those in row 3 of Pascal’s triangle.
3. 1, 4, 6, 4, 1; the values are the same as those in row 4 of Pascal’s triangle.
4. 5 C 0 , 5 C 1 , 5 C 2 , 5 C 3 , 5 C 4 and 5 C 5
5. yes, because 0 C 0 � 1 � row 0 � and 1 C 0 � 1 C 1 � 1 � row 1 �
6. Find n C 0 , n C 1 , n C 2 , n C 3 , ... n C n .

1. Each value is 1.1 times the previous one.
2. It increases the area by 10%.
3. stage 6: 161.051 in 2 ; stage 7: 177.1561 in 2 ; stage 8: 194.87171 in 2
4. Exponential; the ratios of the areas are constant.
5. natural numbers
6. Multiply 100 by 1.1 nine times. The area is 100 � 1.1 � 9 in 2 .
7. Multiply the area at stage 10 by 1.1.
ex plo rat i o n
0-0
Copyright © by Holt, Rinehart and Winston. 84 Holt Algebra 2All rights reserved.
12-1 Introduction to Sequences
A graphic designer uses software to enlarge a square repeatedly.The original dimensions of the square (stage 1) are 10 inches by10 inches. The table shows the square’s area as it is enlarged.
Stage 1 2 3 4 5Area � in 2 � 100 110 121 133.1 146.41
1. Look for a pattern in the table. How is each value in the list ofareas related to the previous one?
2. By how much does the software enlarge the square at eachstage?
3. Find the area of the square at the next three stages.
4. What type of function models the data in the table? Why?
5. What is the domain of the function in this situation?
THINK AND DISCUSS 6. Explain how you can find the area of the square at stage 10.
7. Explain how you can find the area of the square at stage 11once you know the area of the square at stage 10.
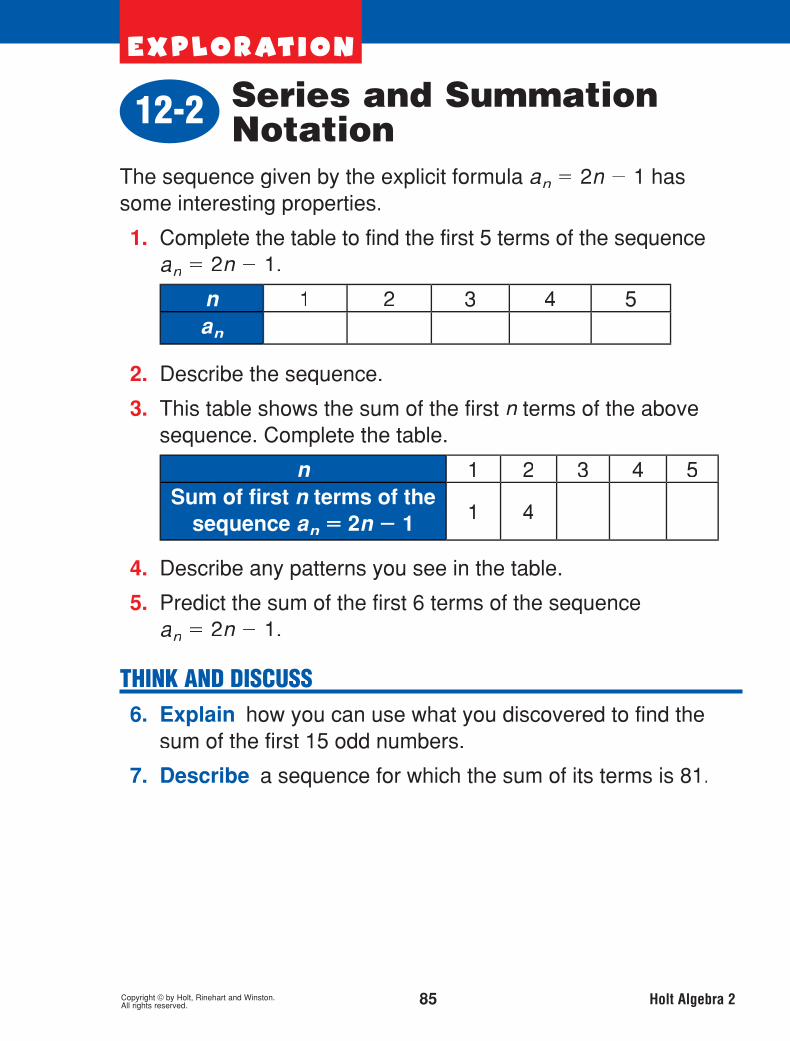
1 3 5 7 9
odd numbers
9 16 25
4. The sum of the first n terms is n 2 .
6. The sum is � 15 � 2 � 225.
7. the first 9 odd numbers: 1, 3, 5, 7, 9, 11, 13, 15, 17
36
ex plo rat i o n
Copyright © by Holt, Rinehart and Winston. 85 Holt Algebra 2All rights reserved.
Series and Summation Notation12-2
The sequence given by the explicit formula an � 2n � 1 has some interesting properties.
1. Complete the table to find the first 5 terms of the sequencean � 2n � 1.
n 1 2 3 4 5 a n
2. Describe the sequence.
3. This table shows the sum of the first n terms of the abovensequence. Complete the table.
n 1 2 3 4 5Sum of first n terms of the
sequence a n � 2n � 1 1 4
4. Describe any patterns you see in the table.
5. Predict the sum of the first 6 terms of the sequencean � 2n � 1.
THINK AND DISCUSS 6. Explain how you can use what you discovered to find the
sum of the first 15 odd numbers.
7. Describe a sequence for which the sum of its terms is 81.

11
14
17
20
3
4. Linear; the numbers of DVDs have constant first differences.
5. an � 8 � � n � 1 � 3
6. Let n � 12 and use the rule a 12 � 8 � � 12 � 1 � 3 � 41.
7. He will never have bought exactly 75 DVDs because there is no natural number that is a solution to the equation 75 � 8 � � n � 1 � 3.
ex plo rat i o n
Copyright © by Holt, Rinehart and Winston. 86 Holt Algebra 2All rights reserved.
Arithmetic Sequencesand Series12-3
Bryan joins a DVD club that sends him 8 DVDs the fi rstmonth and 3 DVDs every month thereafter.
1. Complete the table showing the number of DVDsBryan buys through the club.
MonthTotal Number
of DVDs1 82345
2. Graph the data in the table.
3. What is the difference of the successive terms in thesequence formed by the total number of DVDs?
4. What type of function describes the data? Why?
5. Write an explicit formula for the nth term of the sequence nnformed by the total number of DVDs.
THINK AND DISCUSS 6. Show how you can use your rule to find the number of DVDs
Bryan will have bought after 12 months.
7. Discuss how you can use your rule to determine whether ornot Bryan will ever have bought exactly 75 DVDs.
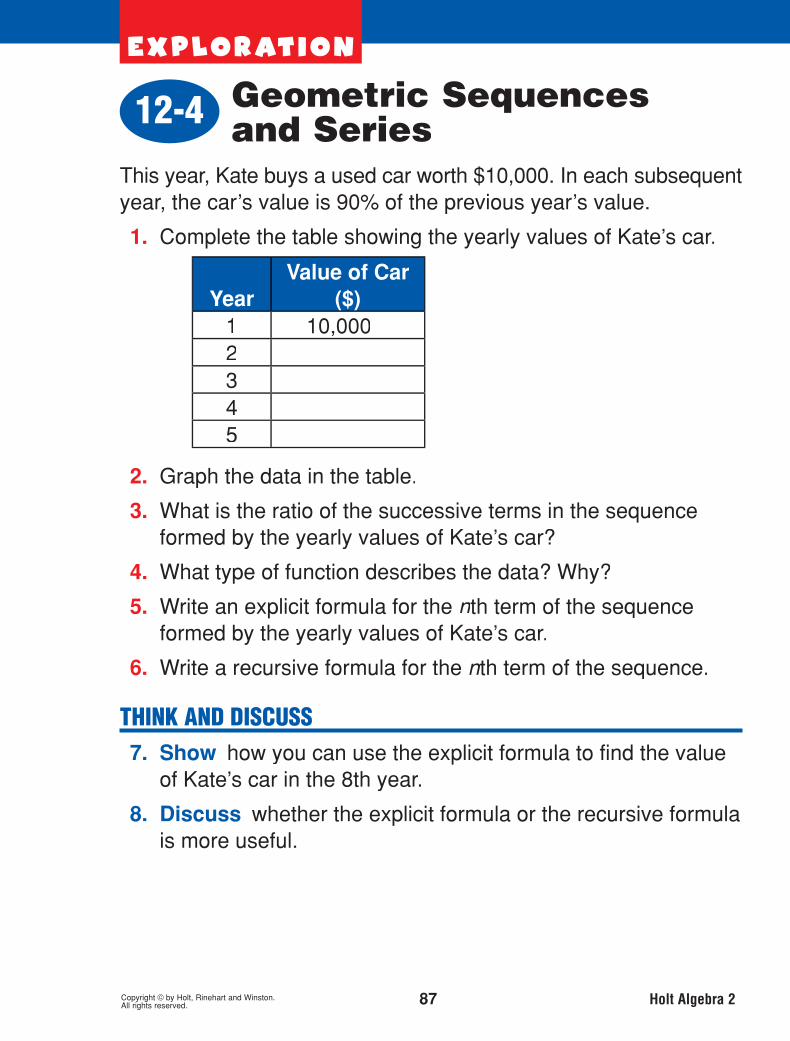
0.9
4. Exponential; the ratios of the values are constant. 5. an � 10,000 � 0.9 � n�1 6. an � a n�1 � 0.9 � 7. Let n � 8 ; a 8 � 10,000 � 0.9 � 8�1 � 4782.97. 8. Possible answer: The explicit formula is more useful because it makes it easier to the
find the value of the car in a given year.
9,000
8,100
7,290
6,561
ex plo rat i o n
Copyright © by Holt, Rinehart and Winston. 87 Holt Algebra 2All rights reserved.
Geometric Sequencesand Series12-4
This year, Kate buys a used car worth $10,000. In each subsequentyear, the car’s value is 90% of the previous year’s value.
1. Complete the table showing the yearly values of Kate’s car.
YearValue of Car
($)1 10,0002345
2. Graph the data in the table.
3. What is the ratio of the successive terms in the sequenceformed by the yearly values of Kate’s car?
4. What type of function describes the data? Why?
5. Write an explicit formula for the nth term of the sequence nnformed by the yearly values of Kate’s car.
6. Write a recursive formula for the nth term of the sequence.nn
THINK AND DISCUSS 7. Show how you can use the explicit formula to find the value
of Kate’s car in the 8th year.
8. Discuss whether the explicit formula or the recursive formulais more useful.
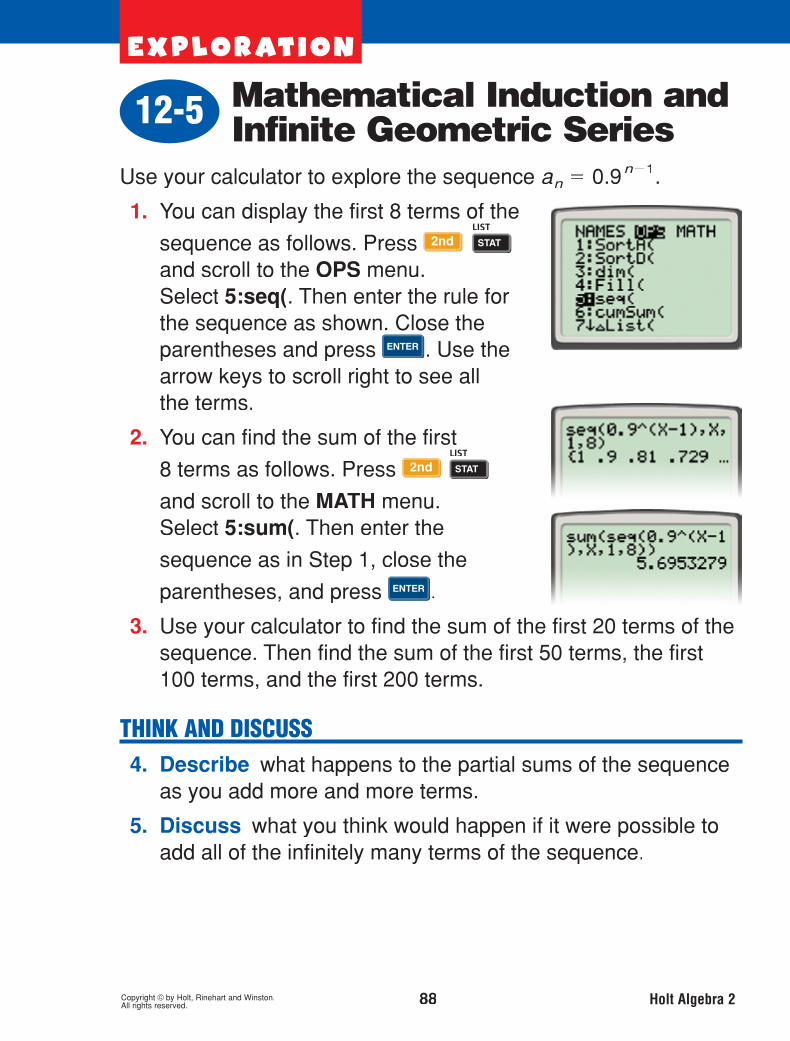
exploration
Copyright © by Holt, Rinehart and Winston. 88 Holt Algebra 2All rights reserved.
Mathematical Induction and Infinite Geometric Series12-5
Use your calculator to explore the sequence an 0.9 n1.
1. You can display the first 8 terms of the
sequence as follows. Press ��� ����
����
and scroll to the OPS menu. Select 5:seq(. Then enter the rule for the sequence as shown. Close the parentheses and press ����� . Use the arrow keys to scroll right to see all the terms.
2. You can find the sum of the first
8 terms as follows. Press ��� ����
����
and scroll to the MATH menu. Select 5:sum(. Then enter the
sequence as in Step 1, close the
parentheses, and press ����� .
3. Use your calculator to find the sum of the first 20 terms of the sequence. Then find the sum of the first 50 terms, the first 100 terms, and the first 200 terms.
THINK AND DISCUSS 4. Describe what happens to the partial sums of the sequence
as you add more and more terms.
5. Discuss what you think would happen if it were possible to add all of the infinitely many terms of the sequence.

3. 20 terms: 8.784233454; 50 terms: 9.948462248; 100 terms: 9.999734386; 200 terms: 9.999999993
4. The partial sums get closer and closer to 10.
5. The sum would be 10.
exploration
Copyright © by Holt, Rinehart and Winston. 88 Holt Algebra 2All rights reserved.
Mathematical Induction and Infinite Geometric Series12-5
Use your calculator to explore the sequence an 0.9 n1.
1. You can display the first 8 terms of the
sequence as follows. Press ��� ����
����
and scroll to the OPS menu. Select 5:seq(. Then enter the rule for the sequence as shown. Close the parentheses and press ����� . Use the arrow keys to scroll right to see all the terms.
2. You can find the sum of the first
8 terms as follows. Press ��� ����
����
and scroll to the MATH menu. Select 5:sum(. Then enter the
sequence as in Step 1, close the
parentheses, and press ����� .
3. Use your calculator to find the sum of the first 20 terms of the sequence. Then find the sum of the first 50 terms, the first 100 terms, and the first 200 terms.
THINK AND DISCUSS 4. Describe what happens to the partial sums of the sequence
as you add more and more terms.
5. Discuss what you think would happen if it were possible to add all of the infinitely many terms of the sequence.

��2 2 �
�2 3 �
�2
Each ratio is equal to ��
2 ___ 2 .
5. The ratios are equal.
6. The legs have the same lengths. The length of the hypotenuse is equal to the length of a leg multiplied by �
� 2 .
7. Possible answer: Use the ratio to set up and solve a
proportion: ��
2 ___ 2 � x __
4 , so x � 2 �
� 2 .
ex plo rat i o n
0-0
Copyright © by Holt, Rinehart and Winston. 89 Holt Algebra 2All rights reserved.
13-1 Right-Angle Trigonometry
You can use the Pythagorean Theorem to help you discoverproperties of special right triangles.
Use the Pythagorean Theorem to find the length of thehypotenuse c of each right triangle. Write your answers in csimplest radical form.
1. 2. 3 .
4. For each triangle in Problems 1–3, find the ratio of the length
of a leg to the length of the hypotenuse.
5. What pattern do you notice about the ratios you calculated?
THINK AND DISCUSS 6. Describe how the side lengths are related to each other in a
45�-45�-90� triangle.
7. Explain how you can use the ratioyou discovered above to find the valueof x in this triangle.x

5. Possible answer: Problem 1: Subtract 45� from 180�; Problem 2: Add 45� to 180°; Problem 3: Subtract 45� from 360�; Problem 4: Add 45� to 360�.
135� 225�
315� 405°
ex plo rat i o n
Copyright © by Holt, Rinehart and Winston. 90 Holt Algebra 2All rights reserved.
Angles of Rotation13-2
Imagine a ray on the positive x-axis withxxits vertex at the origin. As the ray rotatescounterclockwise about the origin, youcan use what you know about anglemeasures to determine the number of degrees through which the ray rotates.
Find the number of degrees x through which each ray has xrotated. (Hint : A complete rotation is equal to 360�.)
1. 2.
3. 4.
THINK AND DISCUSS 5. Explain how you found the number of degrees through which
the ray rotated in Problems 1–4.
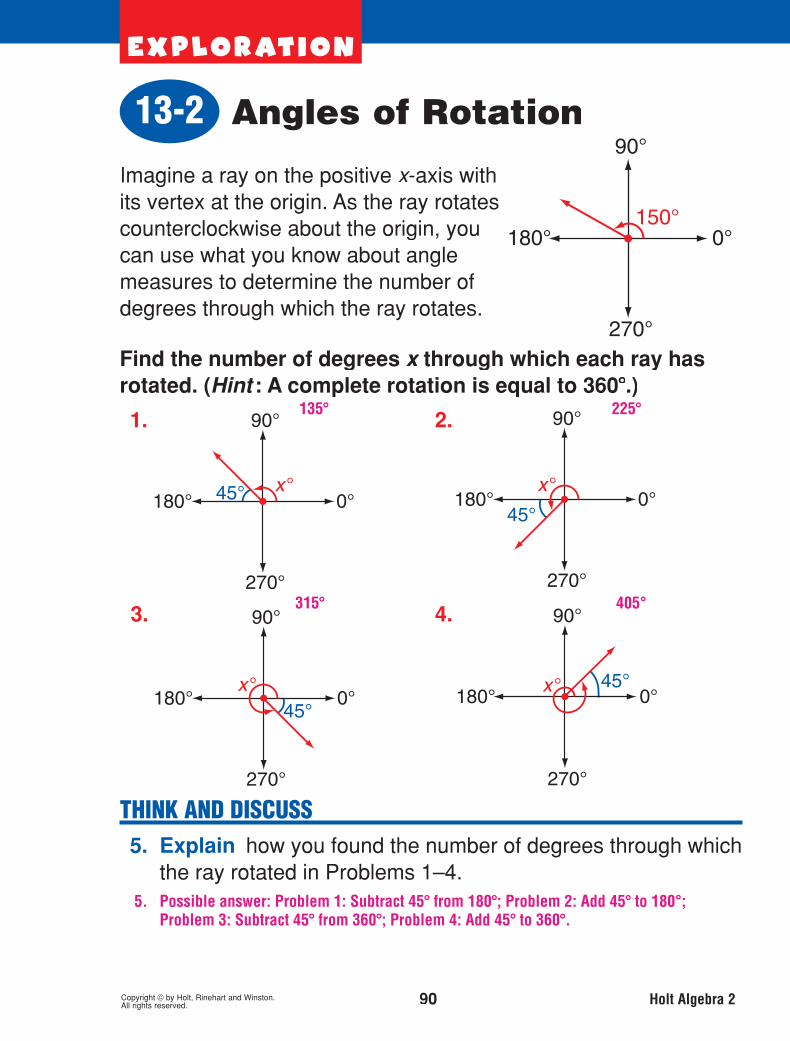

1. 1; the hypotenuse is a radius of the unit circle.
4. cos 60� � 1 __ 2 ; sin 60� � �
� 3 ___ 2
5. The coordinates of point P are � cos 60�, sin 60� � . 6. Possible answer: Based on the 45�-45�-90� Triangle Theorem, x � �
� 2 ___ 2 , and y � �
� 2 ___ 2 .
Therefore, the coordinates of point Q are � �� 2 ___
2 , �
� 2 ___
2 � .
7. The coordinates of point Q are � cos 45�, sin 45� � .
x � 1 __ 2 ; y � �
� 3 ___
2
� 1 __ 2 , �
� 3 ____
2 �
ex plo rat i o n
91 Holt Algebra 2All rights reserved.
The Unit Circle13-3
A unit circle is a circle with a radius of 1 unit. You can useetrigonometric ratios to determine the coordinates of points on aunit circle that is centered at the origin.
1. The figure shows a unit circle and a 60�
angle in standard position. What is thelength of the hypotenuse of the 30�-60�-90� triangle? How do you know?
2. Use what you know about special righttriangles to find the lengths of the legs ofthe 30�-60�-90� triangle.
3. What are the coordinates of point P?
4. What are the exact values of cos 60� and sin 60�?
5. How are the values of cos 60� and sin 60� related to thecoordinates of point P ?
THINK AND DISCUSS 6. Describe how you can use a similar
method to find the coordinates ofpoint Q.
7. Explain how the values of cos 45�
and sin 45� are related to thecoordinates of point Q.

exploration
Copyright © by Holt, Rinehart and Winston. 92 Holt Algebra 2All rights reserved.
Inverses of Trigonometric Functions13-4
The inverse sine feature of a graphing calculator can be used to determine the measures of acute angles in right triangles.
To fi nd the measure of an angle that has
a sine of 1_a sine of _a sine of 2 , press _ , press _ ��� ���
�����
and
enter 1_enter _enter 2 as shown. The calculator shows _ as shown. The calculator shows _
that a 30° angle has a sine of 1_2.
For each triangle, write the exact value of the sine ratio for . Then use the inverse sine feature to find the value of to the nearest tenth of a degree.
1. 2.
3. 4.
THINK AND DISCUSS 5. Discuss how you could use the
inverse cosine feature of a calculator to find the value of in the triangle shown.
��
���
�
����
���
� ����
�
��
�

3 _ 5 ; 36.9°
3 __ 7 ; 25.4°
9 __ 10
; 64.2°
6 __ 7 ; 59.0°
5. Possible answer: Find the value of cos by writing the ratio of the length of the adjacent side to the length of the hypotenuse. Then use the inverse cosine feature to find the measure of the acute angle with this cosine value.
exploration
Copyright © by Holt, Rinehart and Winston. 92 Holt Algebra 2All rights reserved.
Inverses of Trigonometric Functions13-4
The inverse sine feature of a graphing calculator can be used to determine the measures of acute angles in right triangles.
To fi nd the measure of an angle that has
a sine of 1_a sine of _a sine of 2 , press _ , press _ ��� ���
�����
and
enter 1_enter _enter 2 as shown. The calculator shows _ as shown. The calculator shows _
that a 30° angle has a sine of 1_2.
For each triangle, write the exact value of the sine ratio for . Then use the inverse sine feature to find the value of to the nearest tenth of a degree.
1. 2.
3. 4.
THINK AND DISCUSS 5. Discuss how you could use the
inverse cosine feature of a calculator to find the value of in the triangle shown.
��
���
�
����
���
� ����
�
��
�
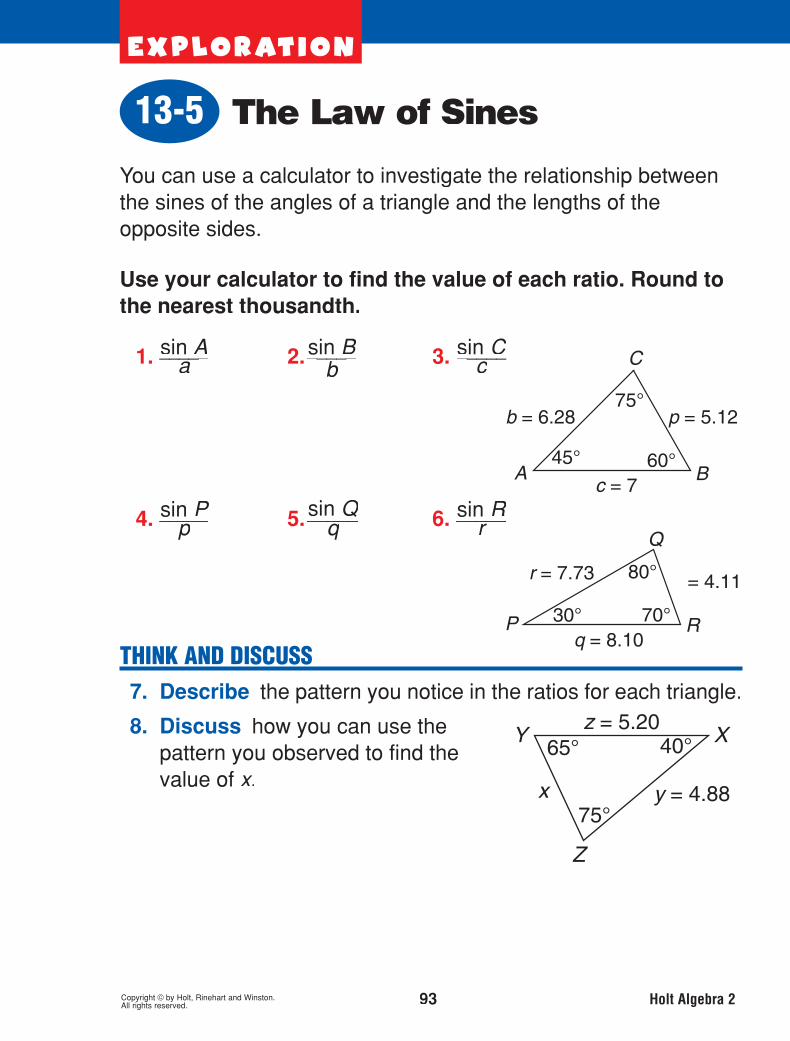
7. For each triangle, the ratios are equal.
8. Possible answer: Write the proportion sin X _____ x � sin Y _____ y ,
which relates the sines of angles in the triangle to the
lengths of the opposite sides. Substitute known values and then solve. sin 40° ______ x � sin 65° ______ 4.88
,
so x ; 3.46.
0.138 0.138
0.122 0.122
0.138
0.122
ex plo rat i o n
Copyright © by Holt, Rinehart and Winston. 93 Holt Algebra 2All rights reserved.
The Law of Sines13-5
You can use a calculator to investigate the relationship betweenthe sines of the angles of a triangle and the lengths of theopposite sides.
Use your calculator to find the value of each ratio. Round to the nearest thousandth.
1. sin A_____a a 2. sin B_____
bb 3. sin C_____
c c
4. sin P_____pp 5. sin Q_____
qq 6. sin R_____rr
THINK AND DISCUSS 7. Describe the pattern you notice in the ratios for each triangle.
8. Discuss how you can use the pattern you observed to find thevalue of x.

3. ;91.3°; possible answer: subtract the measures of �A and �C from 180°.
4. Possible answer: To use the Law of Sines to find the value of a, you would first need to know the measure of either �B or �C.
5. Possible answer: Find the values of the ratios sin A _____ a , sin B _____ b , and sin C _____ c . If the values of
these ratios are approximately equal, the triangle has probably been solved correctly.
; 6.1
; 38.7°
ex plo rat i o n
Copyright © by Holt, Rinehart and Winston. 94 Holt Algebra 2All rights reserved.
The Law of Cosines13-6
The lengths of two sides and the measure of the included angleare given for �ABC. To solve this triangle, you must use the Lawof Cosines. For �ABC, the Law of Cosines states thata 2 � b 2 � c 2 � 2bc cosc A.
1. Substitute the known measures intothe Law of Cosines and solve forthe value of a. Round to the nearesttenth.
2. Use the Law of Sines to find themeasure of �C to the nearest Ctenth of a degree.
3. Find the measure of �B to the nearest tenth of a degree.BExplain how you determined your answer.
THINK AND DISCUSS 4. Explain why you cannot use the Law of Sines to find the
value of a ina �ABC.
5. Describe how you could use the Law of Sines to check thatyou solved �ABC correctly.C

0 0.5 0.71 0.87 1 0.87 0.71 0.5
0 �0.5 �0.71 �0.87 �1 �0.87 �0.71 �0.5
The maximum value is 1, and the minimum value is �1.
The graph will repeat the same shape.
ex plo rat i o n
Copyright © by Holt, Rinehart and Winston. 95 Holt Algebra 2All rights reserved.
Graphs of Sine and Cosine14-1
You can investigate the graph of the function y � sin x byxmaking a table of values and plotting points.
1. Use your calculator to complete the table for the functiony � sin x. Round each y-value to the nearest hundredth yyif necessary.
x � ° � 0, 360 30 45 60 90 120 135 150
y
x � ° � 180 210 225 240 270 300 315 330
y
2. Plot the points from yourtable on a coordinate plane like the one shown.Connect the points to forma smooth curve.
THINK AND DISCUSS 3. Describe the maximum and minimum values of the function.
4. Discuss what will happen if you continue the graph another360° to the right.

Undefined �1.73 �1 �0.58 0 0.58 1 1.73 Undefined
The y-values approach �� and ��. The lines x � 90� and x � �90� are asymptotes.
The graph would repeat the same shape.
ex plo rat i o n
Copyright © by Holt, Rinehart and Winston. 96 Holt Algebra 2All rights reserved.
Graphs of OtherTrigonometric Functions14-2
You can investigate the graph of the function y � tan x by makingxa table of values and plotting points.
1. Use your calculator to complete the table for the functiony � tan x. Round each y-value to the nearest hundredthyyif necessary.
x � ° � �90 �60 �45 �30 0 30 45 60 90
y
2. Plot the points from yourtable on a coordinateplane like the one shown.Connect the points toform a smooth curve.
THINK AND DISCUSS 3. Explain what happens when x approaches 90° orx �90°.
4. Describe what you think would happen if you continued thegraph another 180° to the right.

All are equal to 1.
The value of the function is 1 for every value of x.
si n 2 � � __ 6 � � co s 2 � � __
6 � � � 1 __
2 � 2 � � ��
3 ___ 2 � 2 � 1 __
4 � 3 __
4 � 1
si n 2 � � __ 4 � � co s 2 � � __
4 � � � ��
2 ___ 2 � 2 � � ��
2 ___ 2 � 2 � 1 __
2 � 1 __
2 � 1
si n 2 � � __ 3 � � co s 2 � � __
3 � � � ��
3 ___ 2 � 2 � � 1 __
2 � 2 � 3 __
4 � 1 __
4 � 1
se c 2 x � ta n 2 x � 1
co t 2 x � cs c 2 x � �1
ex plo rat i o n
Copyright © by Holt, Rinehart and Winston. 97 Holt Algebra 2All rights reserved.
Fundamental Trigonometric Identities14-3
You can discover properties of trigonometric functions by evaluat-ing expressions.
Evaluate each of the following expressions.
1. si n 2 ��__6 � � co s 2 ��__
6 �
2. si n 2 ��__4 � � co s 2 ��__
4 �
3. si n 2 ��__3 � � co s 2 ��__
3 �
4. What do you notice about the expressions in 1–3?
5. Enter the function y � si n 2 x � co s 2 xinto your calculator and view a tableof values. What do you find ?
THINK AND DISCUSS
6. Derive a new identity by investigating the expressionse c 2 x � ta n 2 x.
7. Derive a new identity by investigating the expressionco t 2 x � cs c 2 x.
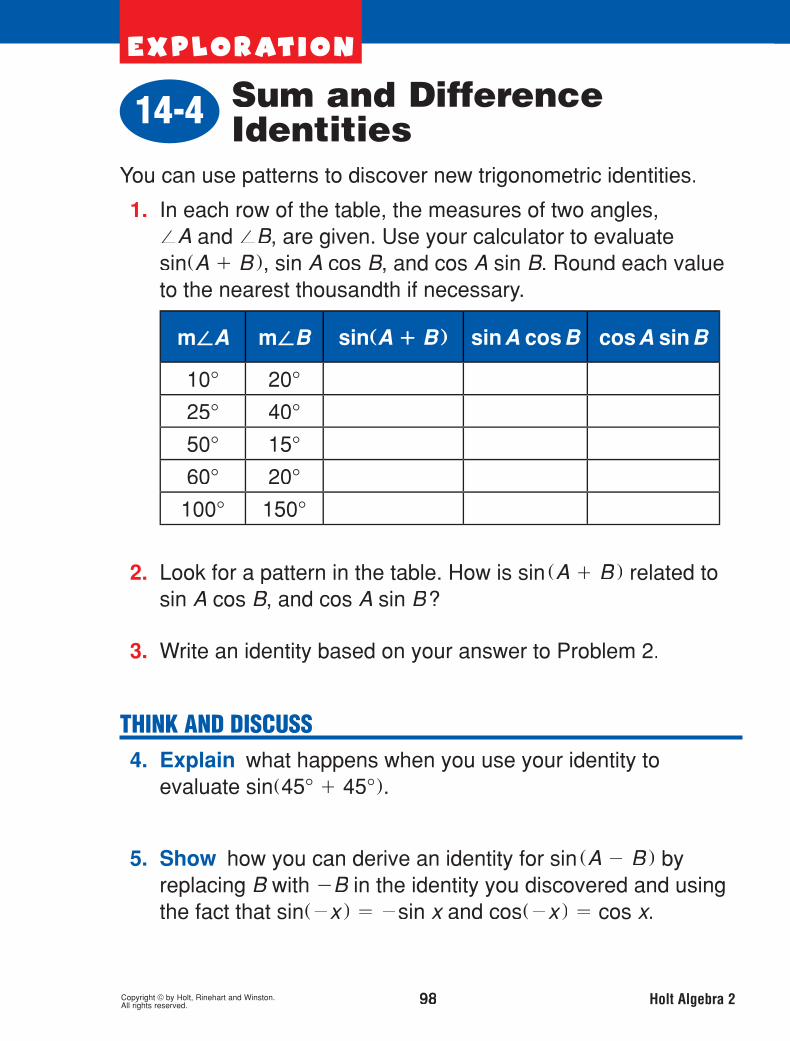
0.5 0.163 0.337
0.906 0.324 0.583
0.906 0.740 0.166
0.985 0.814 0.171
�0.940 �0.853 �0.087
sin � A � B � is the sum of sinA cosB and cosA sinB.
sin � A � B � � sinA cosB � cosA sinB
sin �45� � 45� � � sin45� cos45� � cos45� sin45�
� ��
2 ___ 2 • �
� 2 ___
2 � �
� 2 ___
2 • �
� 2 ___
2 � 1 __
2 � 1 __
2 � 1. This makes sense because sin 90� � 1.
sin � A � B � � sinA cos � �B � � cosA sin � �B � � sinA cosB � cosA sinB
ex plo rat i o n
Copyright © by Holt, Rinehart and Winston. 98 Holt Algebra 2All rights reserved.
Sum and Difference Identities14-4
You can use patterns to discover new trigonometric identities.
1. In each row of the table, the measures of two angles,�A and �B, are given. Use your calculator to evaluatesin �A � B �, sin A cos B, and cos A sin B. Round each valueto the nearest thousandth if necessary.
m�A m�B sin � A � B � sin A cos B cos A sin B
10° 20°
25° 40°
50° 15°
60° 20°
100° 150°
2. Look for a pattern in the table. How is sin�A � B � related tosin A cos B, and cos A sin B?
3. Write an identity based on your answer to Problem 2.
THINK AND DISCUSS 4. Explain what happens when you use your identity to
evaluate sin �45° � 45° �.
5. Show how you can derive an identity for sin�A � B � byreplacing B with B �B in the identity you discovered and usingBthe fact that sin ��x � � �sin x and cos x ��x � � cos x.

0.342 0.171
0.866 0.433
0.766 0.383
0.342 0.171
�0.866 �0.433
sin 2� is twice the value of sin� cos�.
sin 2� = 2sin� cos�
4. Enter sin 2� and 2sin� cos� into a calculator as two separate functions. Check to see that the graphs are identical and that the two functions have identical tables of values.
5. When � � 45�, the left side of the identity is sin � 2 • 45� � � sin 90� � 1, and the right
side is 2sin 45� cos45� � 2 • ��
2 ___ 2 • �
� 2 ___
2 � 1.
ex plo rat i o n
Copyright © by Holt, Rinehart and Winston. 99 Holt Algebra 2All rights reserved.
Double-Angle and Half-Angle Identities14-5
It is often useful to rewrite trigonometric expressions involving2� in terms of � only. You can use your calculator to develop anidentity for sin 2�.
1. In each row of the table, the measure of angle � is given.Use your calculator to find sin 2� and sin � cos�. Round each value to the nearest thousandth if necessary.
� sin 2� sin � cos �
10°
30°
65°
80°
150°
2. Look for a pattern in the table. How is sin 2� related to sin � cos �?
3. Write an identity based on your findings.
THINK AND DISCUSS 4. Explain how you could use a graph or table to verify the
identity you discovered.
5. Describe what happens when � � 45° in the identity.

0.342 0.171
0.866 0.433
0.766 0.383
0.342 0.171
�0.866 �0.433
sin 2� is twice the value of sin� cos�.
sin 2� = 2sin� cos�
4. Enter sin 2� and 2sin� cos� into a calculator as two separate functions. Check to see that the graphs are identical and that the two functions have identical tables of values.
5. When � � 45�, the left side of the identity is sin � 2 • 45� � � sin 90� � 1, and the right
side is 2sin 45� cos45� � 2 • ��
2 ___ 2 • �
� 2 ___
2 � 1.
ex plo rat i o n
Copyright © by Holt, Rinehart and Winston. 99 Holt Algebra 2All rights reserved.
Double-Angle and Half-Angle Identities14-5
It is often useful to rewrite trigonometric expressions involving2� in terms of � only. You can use your calculator to develop anidentity for sin 2�.
1. In each row of the table, the measure of angle � is given.Use your calculator to find sin 2� and sin � cos�. Round each value to the nearest thousandth if necessary.
� sin 2� sin � cos �
10°
30°
65°
80°
150°
2. Look for a pattern in the table. How is sin 2� related to sin � cos �?
3. Write an identity based on your findings.
THINK AND DISCUSS 4. Explain how you could use a graph or table to verify the
identity you discovered.
5. Describe what happens when � � 45° in the identity.

��, �
� � 2�n, where nis an integer; there are infinitely many solutions.
�n, where n is an integer
4. sin� cos� � sin� � 0sin� �cos� � 1 � � 0sin� � 0 or cos� � �1� � �n or � � � � 2�n where n is an integer� � �n
5. The value of the cosine function is �1 at � � �. Since the period is 2�, the value of the function will also be �1 at � plus any integer multiple of 2�.
6. This method would omit the values of � where sin � � 0.
ex plo rat i o n
Copyright © by Holt, Rinehart and Winston. 100 Holt Algebra 2All rights reserved.
Solving TrigonometricEquations14-6
You can use your calculator to help yousolve trigonometric equations. Set yourcalculator to the trigonometry window bypressing and selecting 7:ZTrig.The x-axis will now display values fromxx�2� to 2� � if you are in� RADIAN mode.
1. Solve the equation cos � � �1 for values of � within thisviewing window by entering the functions y � cos � andy � �1 and finding all the points of intersection.
2. How many solutions are there if you do not restrict thepossible values of � ? What are the solutions?
3. Use the same method to find all the solutions of the equationlsin � cos � � �sin �.
4. You can also solve sin � cos � � �sin � algebraically byadding sin � to both sides of the equation and then factoring.Show that this method results in the same set of solutions.
THINK AND DISCUSS 5. Explain how the solutions of cos � � �1 are related to the
period of the cosine function.
6. Explain why you cannot solve sin � cos � � �sin � by simply dividing both sides by sin � and then solving cos � � �1.