Embed Size (px)
Citation preview
Exploration of Dipeptidyl Peptidase IV and
Recombinant Fasciola hepatica Cathepsin LI
as Potential Biocatalysts
By
Deborah M. Ruth B.Sc. (Hons)
A thesis submitted for the degree of
Doctor of Philosophy
Supervised by Dr. Ciarán Ó’Fágáin
Dublin City University June 2004

Dedicated to the memory o f my best friend Boo All dogs go to heaven
Think o f the world like a big fruitcake It wouldn ft be complete Without a few nuts in it!
(author unknown)
DECLARATION
I herby certify that this material, which I now submit for assessment on the programme
of study leading to the award of Doctor of Philosophy, is entirely my own work and has
not been taken from the work of others save and to the extent that such work has been
cited and acknowledged within the text of my work.
Signed: «O ehtâ*/) ' M 1 St udent Number: 50162195
Deborah M. Ruth
ACKNOWLEDGEMENTS
Dr. Ciarán Ó Fágáin
Thank you Ciarán for allowing me the opportunity to carry out this research. I greatly
appreciate your immense support, guidance, enthusiasm and advice over the last three
and half years.
Technical Staff
A very big and special thank you to all the biology technical staff (past and present),
Allison, Theresa, Ben, David, Deirdre, Evelyn, Graham, Janice, Kathy, Patricia C.,
Robert, Teresa, Patricia F. Thanks for all your help with the orders, undergraduate labs,
and that Christmas dinner party (2002), treasured memories, I will never forget.
Dr. Gillian McMahon, School of Chemical Science. NCSR, Dublin City University
Thank you for your invaluable advice and help on peptide synthesis protocol set-up and
for performing LC-MS analysis on peptide samples.
Professor John Dalton’s Research Group, formerly based at Dublin City University
Thank you to the entire group for their invaluable advice and help especially Mr. Peter
Collins for purification of recombinant Fasciola hepatica cathepsin LI. Memories of
the Christmas dinner party (2002) are still fresh in my mind.
Dr. Brendan O ’C onnor’s Research G roup, Dublin C ity U niversity
Thanks to all members past and present for advice/help in purification and use of
equipment.
The Lab
Goodbye!
Thank You
Technical Staff, School of Chemical Science. Library Staff.

They say diam onds are a girl’s best friends, not true - friends are!
IT-TALLAGHT GANG: Thank you all for being there in of sickness & health, richer &
poorer (bit like a marriage) it has been fun, may we continue to soiree forever.
Ann-Marie & Dave: Thanks for always having a wicked sense of humour, looking after
me in DCU and for being great friends.
LOUISE & G irls: Thanks for all your support from our days as undergraduates until
now. I have become a connoisseur of wine with your help and many late nights. To the
girls never lose that sense of humour.
MELANIE AND Robbie: Thanks for everything over the years, from our humble
beginnings in IT-Tallaght, to our exciting new paths to come - “The winner takes it all”.
MICHELLE and IAN: Thanks for the many Russian coffees, Irish coffees, weekends
away, and numerous parties to remember, long may they continue!
The Von-Trapp Family Singers
JlMMY, Daniel & Jamie: A source of great distraction since my first day in college, may
you continue to remain so!
LYNDA & Kevin: Thank you both for the numerous holidays, the trekking around
Europe and allowing me to become so cosmopolitan. I’ll pay you back promise!
Thanks to, my super parents ELIZABETH & JAMES, for their support, encouragement and
patience from the very beginning of my existence.
Finally Ian, cheers big ears, your investment has finally matured, Love Fathead xxxx.
The financial support of County Dublin Vocational Education Committee, Enterprise
Ireland and Dublin City University are gratefully acknowledged.
ABBREVIATIONS
GENERAL ABBREVIATIONS
ACN acetonitrile
ADA adenosine deaminase
AMC 7-ami no-4-mcthycoumarin
BAA Bacillus amyloliquefaciens
BCA Bicinchoninic Acid
BLA Bacillus licheniformis
t-Boc tertiary-Butoxycarbonyl
BSA bovine serum albumin
Bz benzoyl
C50 solvent concentration at which half-inactivation of enzyme is
observed
CBZ benzyloxycarbonyl
CD cyclodextrin
CHES 2 -[N-Cyclohexylamino]ethanesulfonic acid)
CLEC® cross-linked enzyme crystal
CGTase cyclodextrin glucanotransferase
Da dalton
DC Denaturation Capacity
DCC N,N’-dicyclohexylcarbodiimide
DMF dimethylformamide
DMSO dimethylsulfoxide
iv
DNA deoxyribonucleic acid
cDNA complementary DNA
DPP IV Dipeptidyl Peptidase IV [EC 3.4.14.5]
DTT dithiothreitol
E-64 trans-Epoxysuccinyl-L-Leucylamido(4-Guanidino)-Butane
EDC 1-ethyl-3-(3-dimethylaminopropyl) carbodiimide hydrochloride
EDTA diaminoethanetetra-acetic acid
EG-NHS ethylene glycol-bis(Succinic acid N-hydroxysuccinimide ester)
EG-rFheCLl modified rFheCLl
eu enzyme units
F-moc 9-fluorenylmethoxycarbonyl
rFheCLl recombinant Fasciola hepatica cathepsinLl [EC.3.4.22.15]
HEPES (N-[2-Hydroxyethyl]piperazine-N'-[2-ethane-sulfonic acid])
HIC hydrophobic interaction chromatography
HPLC high performance liquid chromatography
HR high resolution
HRP horseradish peroxidase
•̂cat catalytic constant
Km Michaelis-Menten constant
LC-MS liquid chromatography mass spectrometry
Log logarithm
LogP partition coefficient of a solvent in water/octanol biphasic system
M molar
MES (2- [N-Morpholino] ethanesulfonic acid)
min minute
mM millimolar
MOPS (3-[N-Morphol i no]propanesul foni c acid)
MPEG methoxypolyethylene glycols
mw molecular Weight
nm nanometre
OEt ethoxy
OMe methoxy
ONp 4-nitrophenyloxy
PAGE polyacrylamide gel electrophoresis
PEG polyethylene glycol
pHEMA-GMA poly (2 -hydroxyethyl methacrylate-glycidyl methacrylate)
PO Prolyl oligopeptidase
PS phenyl Sepharose
QAE quaternary anion exchange
Rr relative mobility
RNA ribonucleic acid
mRNA messenger RNA
rRNA ribosomal RNA
IRNA transfer RNA
Rpm revolutions per minute
SA-NHS suberic acid N-hydroxysuccinimide ester
SDS sodium dodecyl sulphate
t» half-life
vi
t 50 half-inactivation temperature
TEMED N,N,N'N'tetramethylene-ethylenediamine
THF teträhydrofuran
TNBS 2,4,6-Trinitrobenzenesulfonic acid
Tris Tris(hydroxymethyl) ami nom ethane
(0.M micromolar
V max maximum velocity
v/v volume per volume
w/v weight per volume
z benzyloxycarbonyl
A m i n o A c i d A b b r e v i a t i o n s
Name Abbreviation Symbol Name
Alanine Ala A
Arginine Arg R
Asparagine Asn N
Aspartic Acid Asp D
Cysteine Cys C
Glutamic Acid Glu E
Glutamine Gin Q
Glycine Gly G
Histidine His H
Isoleucine lie I
Leucine Leu L
Lysine Lys Kvii
Methionine Met M
Phenylalanine Phe F
Proline Pro P
Serine Ser S
Threonine Thr T
Tryptophan Trp W
Tyrosine Tyr Y
Valine Val V
viii
T a b l e o f C o n t e n t s
D e c l a r a t i o n i
A c k n o w l e d g e m e n t s ii
A b b r e v i a t i o n s iv
T a b l e o f c o n t e n t s ix
A b s t r a c t xvii
C h a p t e r O n e : In t r o d u c t io n
1 .0 . I n t r o d u c t i o n 1
1.1. Chemical Peptide Synthesis 2
1.1.1. Solution-phase synthesis 3
1.1.2. Solid-phase peptide synthesis (SPPS) 4
1.2. Recombinant DNA Techniques 5
1.3. Proteases and Enzymatic Peptide Synthesis 6
1.3.1. Serine proteases 7
1.3.2. Cysteine proteases 7
1.3.3. Aspartic proteases 7
1.3.4. Metalloproteases 8
1.4. Strategies for Enzymatic Peptide Synthesis 9
1.4.1. Equilibrium-controlled peptide synthesis 10
1.4.2. Kinetically-controlled peptide synthesis 10
1.5. Enzyme Catalysis in Aqueous and Non-Aqueous Systems 13
1.6. Stability of Proteases 19
1.6.1. Chemical modification with monofunctional reagents 21
1.6.2. Chemical cross-linking with bi- or multifunctional reagents 22
1.6.3. Hydrophilization 25
ix
1.6.4. Immobilization 28
1.6.4.1. Enzyme immobilization by carrier binding 29
1.6.4.2. Enzyme entrapment 31
1.6.4.3. Chemical aggregation 33
1.6.4.4. PEGylation of enzymes 34
1.7. Protein Engineering 36
1.8. Applications of Proteases 36
1.9. Mammalian Dipeptidyl Peptidase IV (DPP IV) 38
1.10. Fluke (Fasciola hepatica) Cathepsin LI 43
1.11. DPP IV and rFheCLl as candidates for study 45
C h a p t e r T w o : M a t e r ia l s a n d M e t h o d s
2.1. Equipment 47
2.2. Materials 47
2.3. Purification and Activation
2.3.1. Purification of Bovine Serum Dipeptidyl Peptidase IV (DPP IV)
2.3.1.1. Seram Preparation 50
2 .3.1.2. Phenyl Sepharose HIC 50
2.3.1.3. Sephacryl S-300 HR Gel Filtration Chromatography 51
2.3.1.4. Quaternary Sepharose Anion Exchange Chromatography 52
2.3.2. Activation of rFasciola hepatica Cathepsin Ll(rFheCLl) 53
2.4. General Assays
2.4.1. Fluorescence Quantification of 7-Amino-4-Methyl-Coumarin
2.4.1.1. AMC Standard Curves 54
2.4.1.2. Inner Filter Effect 55
2.4.1.3. AMC Excitation and Emission Wavelengths 55
2.4.2. Protein Determination
2.4.2.1. Biuret Assay 55
2.4.2.2. Standard BCA Assay 56
2.4.3. Enzyme Assays
2.4.3.1. Quantitative Measurement of DPP IV Activity 57
2.4.3.2. Non-Quantitative Measurement of DPP IV Activity 58
2.4.3.3. Measurement of rFheCLl Activity 58
2.4.3.4. Esterase Activity of rFheCLl 59
2.5. Assay Development
2.5.1. Autodigestion Assay 60
2.5.2. Linearity o f Enzyme Assay with Respect to Time
2.5.2.1. Dipeptidyl Peptidase IV (DPP IV) 60
2.5.2.2. rFasciola hepatica Cathepsin LI (rFheCLl) 61
2.5.3. Linearity of Assay with Respect to Enzyme Concentration
2.5.3.1. Dipeptidyl Peptidase IV (DPP IV) 62
2.5.3.2. rFasciola hepatica Cathepsin LI (rFheCLl) 62
2.6. Kinetic Analysis
2.6.1. Km and VmiX determination for Gly-Pro-AMC 63
2.6.2. Km and Fmax determination for Z-Phe-Arg-AMC 63
2.7. Temperature Studies
2.7.1. Temperature Profile
2.7.1.1. Dipeptidyl Peptidase IV (DPP IV) 64
2.7.1.2. rFasciola hepatica Cathepsin LI (rFheCLl) 64
xi
65
65
66
67
68
69
69
70
70
71
72
73
74
75
2.7.2. Thermoinactivation
2.7.2.1. Dipeptidyl Peptidase IV (DPP IV)
2.7.2.2. rFasciola hepatica Cathepsin L1 (rFheCLl)
Organotolerance Studies
2.8.1. Solvent Stability Studies
2.8.1.1. Dipeptidyl Peptidase IV (DPP IV)
2.8 .1.2. rFasciola hepatica Cathepsin LI (rFheCLl)
pH Studies on Dipeptidyl Peptidase IV (DPP IV)
2.9.1. Effect of pH on Activity and Kinetics
2.9.2. pH Temperature Profile
Active Site Titration
2.10.1. rFasciola hepatica cathepsin LI (rFheCLl)
Chemical Modification
2.11.1. Cross-linking of rFasciola hepatica Cathepsin LI with EG-NHS
2.11.2. Sephadex™ G-25 Gel Filtration
2.11.3. Amino Group Estimation - TNBS Assay
Polyacrylamide Gel Electrophoresis (PAGE)
2.12.1. Sample Preparation
2.12.2. SDS Gel Preparation
2.12.3. Visualisation of Proteins
Enzymatic Peptide Synthesis
2.13.1. Synthesis of model tripeptide Z-Phe-Arg-SerNH2
xii
2.14 Sequence Alignment
2.14.1. Sequence alignment of fluke and recombinant Fasicola hepatica
cathepsinLl 76
C h a p t e r T h r e e : P u r if ic a t io n o f D ipe pt id y l P e pt id a se IV
3.1. Introduction 77
3.2. Results - Purification of DPP IV
3.2.1. Optimum AMC Excitation and Emission Wavelengths 78
3.2.2. AMC Standard Cuives and the Inner Filter Effect 79
3.2.3. Protein Determination 81
3.2.4. Purification of Bovine Serum DPP IV
3.2.4.1 Serum Preparation 83
3.2.4.2. Phenyl Sepharose Hydrophobic Interaction Chromatography 83
3.2.4.3. Sephacryl S-300 HR Gel Filtration Chromatography 83
3.2.4.4. Quaternary Sepharose Anion Exchange Chromatography 84
3.2.4.5. Effectiveness of Purification Procedure 84
3.2.5. Determination of Enzyme Purity
3.2.5.1. SDS Polyacrylamide Gel Electrophoresis 89
3.2.6. Discussion 91
C h a p t e r F o u r : St u d ie s o n D ip e p t id y l P e p t id a se IV
4.1. Results - Assay and Stability Studies on DPP IV
4.1.1. Assay Development
4.1.1.1. Autodigestion Assay 98
4.1.1.2. Linearity of Enzyme Assay with Respect to Time 98
xiii
4.1.1.3. Linearity of Assay with Respect to Enzyme Concentration 98
4.1.2. Temperature Studies
4.1.2.1. Temperature Profile 101
4.1.2.2. Thermo inactivation of DPP IV 102
4.1.3. Organotolerance Studies
4.1.3.1. Solvent Stability Studies 104
4.1.3.2. Temperature Profile of DPP IV in Organic Solvents 104
4.1.3.3. Thermo inactivation of DPP IV in Organic Solvents 105
4.1.4. pH Studies
4.1.4.1. Effect of pH on DPP IV Activity 108
4.1.4.2. Effect of pH on DPP IV Kinetics 108
4.1.4.3. pH Thermostability 109
4.2. Discussion 114
C h a p t e r F iv e : Recombinant Fasciola hepatica Cathepsin LI Studies
5.1. Introduction 124
5.2. Results - Assays and Stability Studies on rFheCLl
5.2.1. AMC Standard Curves and the Inner Filter Effect 125
5.2.2. Protein Determination 126
5.2.3. Assay Development
5.2.3.1. Autodigestion Assay 126
5.2.3.2. Linearity of Enzyme Assay with Respect to Time 126
5.2.3.3. Linearity of Assay with Respect to Enzyme Concentration 126
xiv
5.2.4. Temperature Studies
5.2.4.1. Temperature Profile 130
5.2.4.2. Thermoinactivation of rFheCLl 130
5.2.5. Organotolerance Studies
5.2.5.1. Solvent Stability Studies 132
5.2.6. Active Site Titration of rFheCLl 134
5.2.7. rFheCLl Kinetics 135
5.2.8. Esterase Activity 135
5.3. Discussion 137
C h a p t e r Si x : C h e m ic a l M o d if ic a t io n St u d ie s
6.1. Introduction 147
6.2, Results - Assay and Stability Studies on EG-rFheCLl
6.2.1. Cross-linking of rFheCLl 149
6.2.2. SDS Polyacrylamide Gel Electrophoresis 149
6.2.3. Effect of Modification on rFheCLl Kinetics 150
6.2.4. Temperature Studies
6.2.4.1. Temperature Profile 151
6 .2.4.2. Thermoinactivation of Native and Modified rFheCLl 151
6.2.5. Organotolerance Studies
6.2.5.1. Solvent Stability Studies 153
6.2.5.2. Thermoinactivation of Native and Modified rFheCLl 153
6.3. Discussion 156
XV
C h a p t e r S e v e n : P e p t i d e S y n t h e s i s
7.1. Introduction 159
7.2. Results - Peptide Synthesis with Native rFheCLl
7.2.1. LC Conditions 160
7.2.2. Concentration of Enzyme, Ester and Nucleophile 160
7.2.3. Tripeptide Formation 160
7.2. Discussion 165
Chapter Eight: Conclusion8.0. Conclusion 168
Bibliography 172
Appendix 201
xvi
A b s t r a c t
The aim of this project was to study the stability characteristics of the serine protease dipeptidyl peptidase IV (DPP IV) and recombinant Fasciola hepatica cysteine protease cathepsin LI (rFheCLl), with a view to using them in peptide synthesis.
DPP IV was purified from bovine serum. The chromatographic techniques used were phenyl-Sepharose hydrophobic interaction, Sephacryl S-300-HR gel filtration and quaternary-Sepharose anion exchange, producing an overall purification factor of 35. The enzyme was shown to have a subunit molecular weight of 77,224 Da, by SDS- PAGE; native weight was not determined. DPP IV activity remained stable up to 62°C and over a broad pH range, with a preference for neutral pH. The estimated T5o was 71°C. With regard to solvent tolerance DPP IV was most stable in acetonitrile, at all concentrations tested. THF was the most deleterious solvent with little or no activity exhibited above 40% (v/v) concentration. Michaelis-Menten kinetics of DPP IV were determined at different pH values, pK values were observed at pH 6.5 and 9.5. The lower pK value is likely due to the ionisation of the active site histidine side chain of soluble DPP IV; however, the upper pK value possibly belongs to the a-amino group of the Gly moiety of the Gly-Pro-AMC substrate.
rFheCLl was characterised and compared with the enzyme purified from liver fluke (Fasciola hepatica). rFheCLl was also stabilised by the reaction of the enzyme with ethylene glycol-bis(succinic acid N-hydroxy-succinimide ester) (EG-NHS). The enhanced stability of the modified enzyme is likely due to an intramolecular crosslink(s) being formed in the enzyme. The estimated T5o of modified rFheCLl was 87°C as compared to native rFheCLl, which had an estimated T50 of 78°C. At 70°C modified rFheCLl retained 100% amidase activity for up to 60 minutes compared to native rFheCLl, which showed an 80% loss in activity under the same assay conditions. Modified rFheCLl also demonstrated enhanced stability in the solvents acetone and acetonitrile; however, modification did not enhance stability in THF. Kinetic studies indicate that the active site of the enzyme has not been affected by cross-linking and that stability gain has not been at a cost of poorer catalysis. Native rFheCLl was used to catalyse the synthesis of the model tripeptide Z-Phe-Arg-SerNH2. LC-MS analysis indicated that formation of the new tripeptide occurred within ten minutes.

C h a pter 1
In tr o d u c tio n
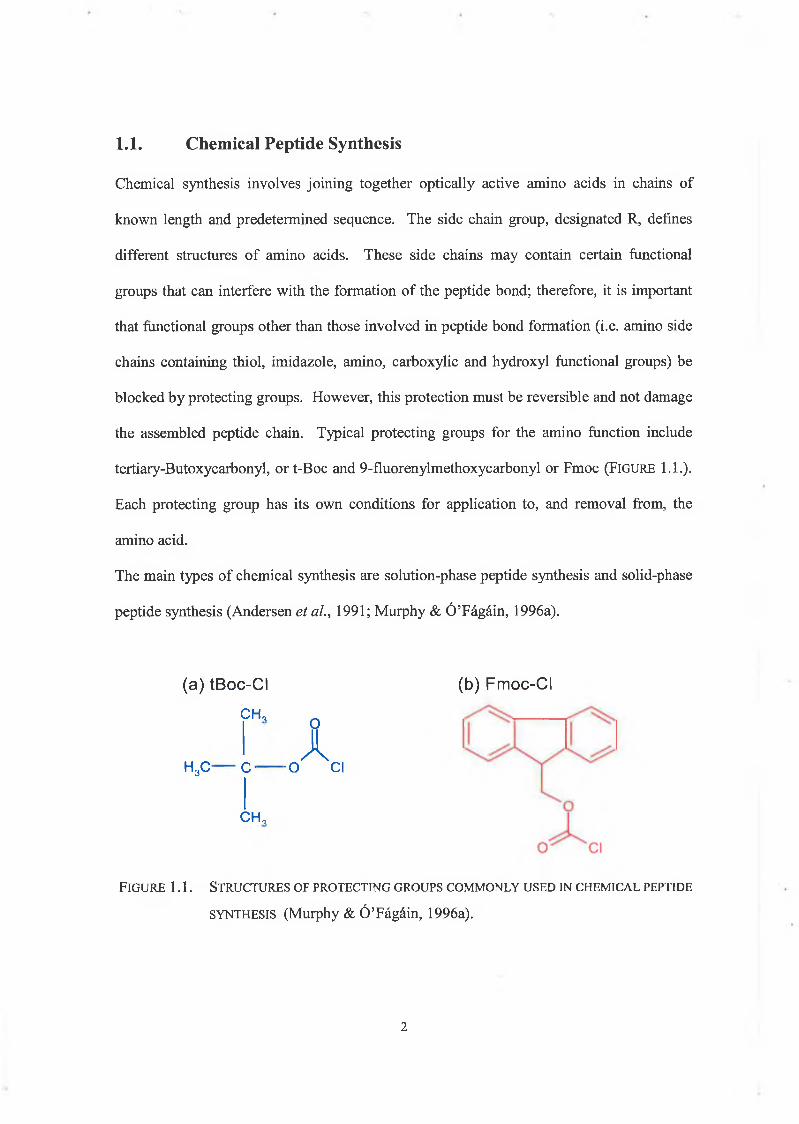
Chemical synthesis involves joining together optically active amino acids in chains of
known length and predetermined sequence. The side chain group, designated R, defines
different structures of amino acids. These side chains may contain certain functional
groups that can interfere with the formation of the peptide bond; therefore, it is important
that functional groups other than those involved in peptide bond formation (i.e. amino side
chains containing thiol, imidazole, amino, carboxylic and hydroxyl functional groups) be
blocked by protecting groups. However, this protection must be reversible and not damage
the assembled peptide chain. Typical protecting groups for the amino function include
tertiary-Butoxycarbonyl, or t-Boc and 9-fluorenylmethoxycarbonyl or Fmoc (FIGURE 1.1.).
Each protecting group has its own conditions for application to, and removal from, the
amino acid.
The main types of chemical synthesis are solution-phase peptide synthesis and solid-phase
peptide synthesis (Andersen et al., 1991; Murphy & Ô’Fâgâin, 1996a).
1.1. Chemical Peptide Synthesis
(a) tBoc-CI
CH,
H3C C •
O
A■o Cl
CH,
F i g u r e 1.1. S t r u c t u r e s o f p r o t e c t i n g g r o u p s c o m m o n ly u s e d in c h e m i c a l p e p t id e
s y n t h e s i s (Murphy & Ô ’F â g â in , 1996a).
(b) Fmoc-CI
2
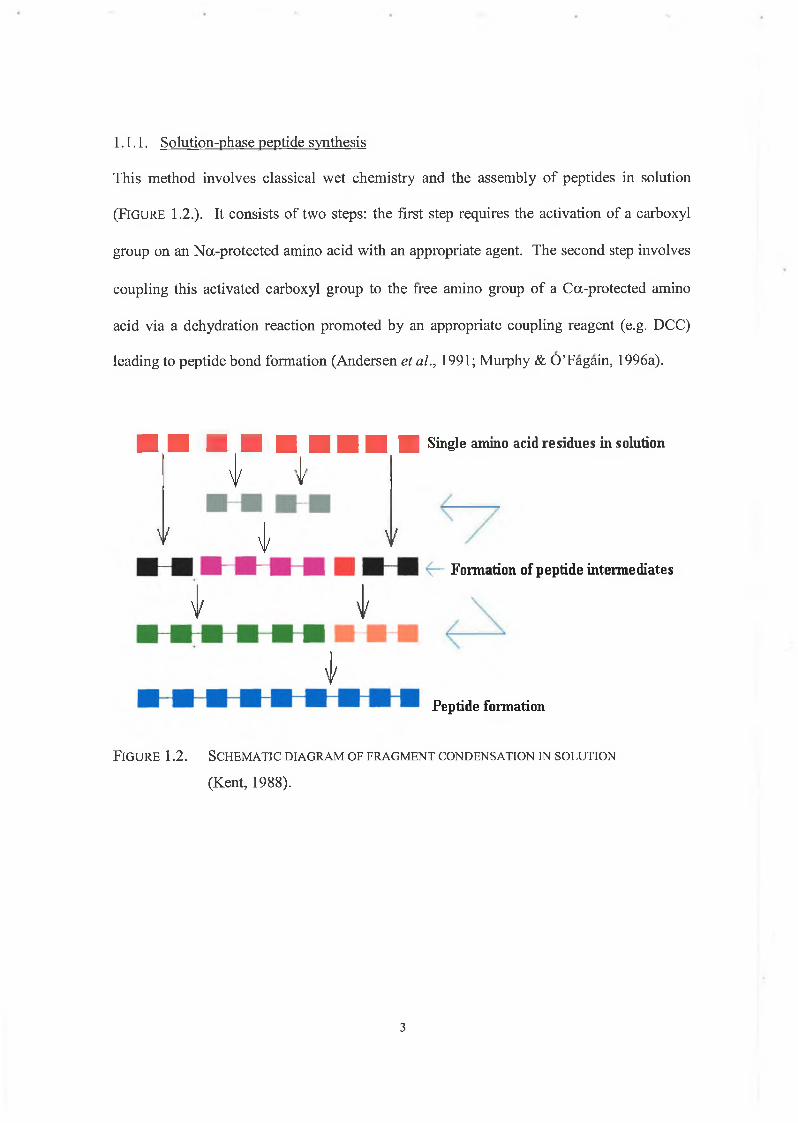
This method involves classical wet chemistry and the assembly of peptides in solution
( F i g u r e 1.2.). It consists of two steps: the first step requires the activation of a carboxyl
group on an Na-protected amino acid with an appropriate agent. The second step involves
coupling this activated carboxyl group to the free amino group of a Ca-protected amino
acid via a dehydration reaction promoted by an appropriate coupling reagent (e.g. DCC)
leading to peptide bond formation (Andersen et al., 1991; Murphy & O’Fagain, 1996a).
1.1.1. Solution-phase peptide synthesis
Single amino acid residues in solution
V v
V V VFormation of peptide intermediates
V V
VPeptide formation
F ig u r e 1 .2. Sc h e m a t ic d ia g r a m o f f r a g m e n t c o n d e n s a t io n in s o l u t io n
(Kent, 1988).
3
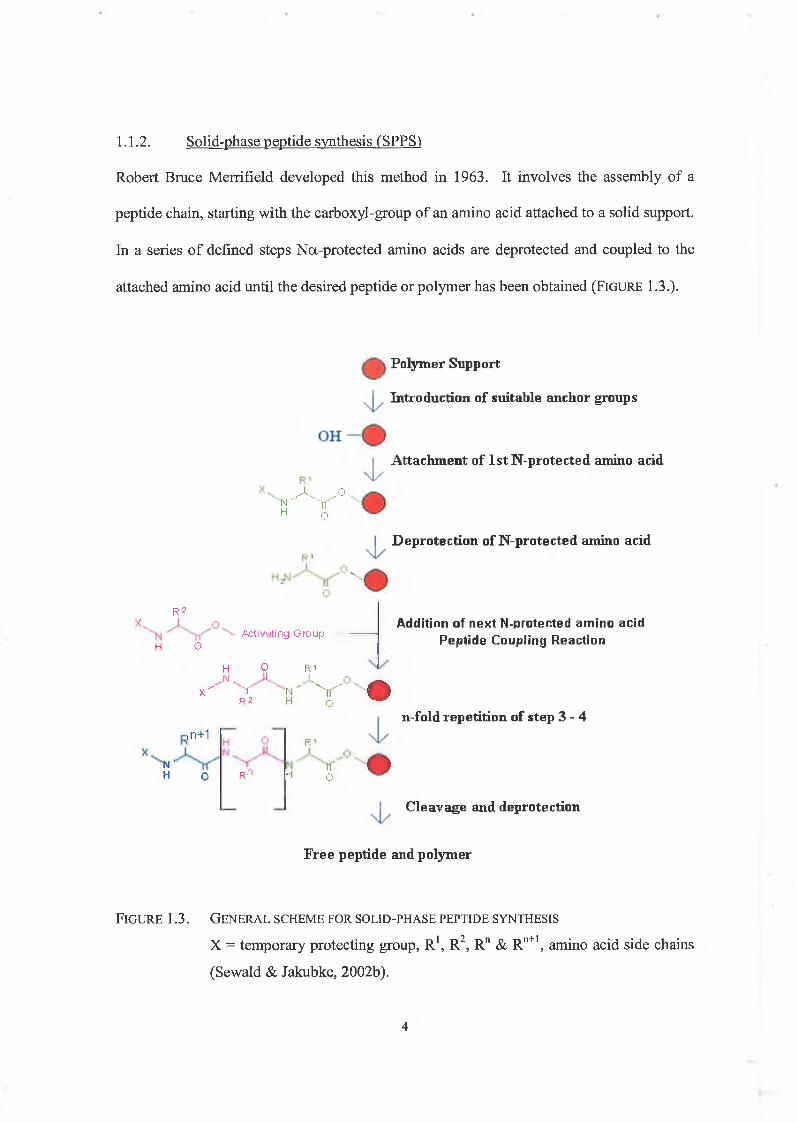
Robert Bruce Merrifield developed this method in 1963. It involves the assembly of a
peptide chain, starting with the carboxyl-group of an amino acid attached to a solid support.
In a series of defined steps Na-protected amino acids are deprotected and coupled to the
attached amino acid until the desired peptide or polymer has been obtained ( F ig u r e 1.3.).
1.1.2. Solid-phase peptide synthesis (SPPS)
Polymer Support
Introduction of suitable anchor groups
Attachment of 1st N-protected amino acid
,-k ...o.N - ilH n
Deprotection of N-protected amino acid
R2
' Acti vati ng G ro up ---------H O
H O R (
X" T 'N " V " #R 2 H o
Addition of next N-protected amino acid Peptide Coupling Reaction
■,n+1
N ’H O pH
n-fold repetition of step 3 -4R<
H ^ i 5n o
Cleavage and deprotection
Free peptide and polymer
F ig u r e 1.3. G e n e r a l s c h e m e f o r s o l id -p h a s e p e p t id e s y n t h e s is
X = temporary protecting group, R1, R2, Rn & Rn+1, amino acid side chains
(Sewald & Jakubke, 2002b).
4
1.2. Recombinant DNA Techniques
This is a preparative technique for ribosomal synthesis of polypeptides and proteins based
on the principle of gene technology. Expression of peptides and proteins in organisms such
as bacteria e.g. Escherichia coli is possible. This technique relies on the recombination of
the microorganism’s genetic material with the DNA fragment encoding for the desired
protein and consists of a number of steps (Sewald & Jakubke, 2002c):
(1) Isolation of the encoding DNA fragment from the donor organism.
(2) Insertion of the DNA into a vector.
(3) Transfection of the vector into the host organism.
(4) Cultivation of host organism, leading to gene amplification, mRNA and protein
synthesis.
(5) Isolation of the recombinant protein.
Lueking et al. (2000) used this technology to successfully develop a novel Pichia
pastoris/Escherichia coli dual expression vector for the production of recombinant protein
in both host systems.
5
1.3. Proteases and Enzymatic Peptide Synthesis
Proteolytic enzymes, or proteases, catalyse a single reaction, the hydrolysis of a peptide
bond. This reaction is one of the most frequent and important enzymatic modifications of
proteins. They can, however catalyse the reverse reaction, i.e. formation of the peptide
bond leading to oligopeptide synthesis. Enzymatic peptide synthesis has been used to
produce a number of peptides. Oyama et al. (1981) used the enzyme thermolysin to
catalyse the condensation between L-phenylalanine methyl ester and N-CBZ-L-aspartic
acid, to produce the well-known sweetener aspartame. There are a number of advantages
associated with enzymatic peptide synthesis as opposed to chemical methods. These are:
(1) Enzymes catalyse reactions with high regiospecificity reducing the need for side
chain protection of reactants
(2) Owing to the stereospecificity of enzymes, no racemization is observed
(3) Reactions take place under mild conditions
(4) No requirement of protection/deprotection steps; this simplifies the process (Gill, et
a l, 1996; Sears & Wong, 1996).
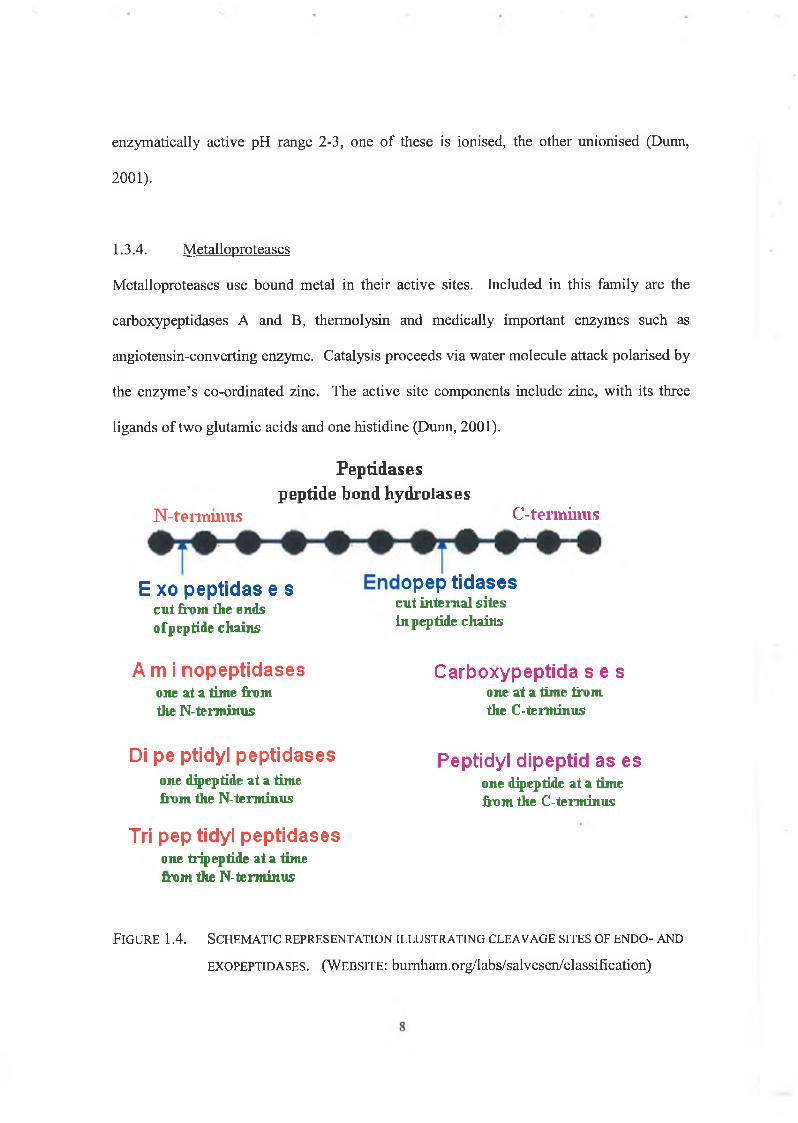
Proteases are divided into two categories on the basis of where they cleave the protein
exopeptidases and endopeptidases (F ig u r e 1.4.). Exopeptidases require the presence of an
unsubstituted N- or C- terminus in the substrate and remove a single amino acid, di- or
tripeptides from one or other terminus, producing small peptides or amino acids. This mode
of action is the basis for the classification of the exopeptidases. The same consideration of
specificity cannot be applied to the endopeptidases, as they cleave within the protein chain,
producing large peptides. Therefore, the classification of these peptidases is dependent on
the catalytic mechanism of their active sites to yield four main classes: serine, cysteine,
aspartic and metallo-endopeptidases. The same catalytic mechanisms are functional among
6
the exopeptidases; hence, some can be further subdivided on the same basis (Creighton,
1993b; Kenny, 1999; Barrett, 2001).
1.3.1. Serine proteases
Two distinct families are present in this group: the mammalian serine proteases e.g. Trypsin
EC 3.4.21,4 and the bacterial serine proteases e.g. Subtilisin EC 3.4.21.14. They are
characterized by the presence of a highly reactive serine residue. This is included in the
active site arrangement of their catalytic triad Ser-His-Asp. Catalysis proceeds by covalent
attack of polarised serine side-chain and the formation of an acyl-enzyme intermediate.
The same type of mechanism underlies the action of all serine protease (Creighton, 1993b;
Dunn, 2001).
1.3.2. Cysteine proteases
Included in this group are several mammalian lysosomal cathepsins and the plant proteases
papain and actinidin. Cysteine proteases are the most comparable to the serine proteases,
with a cysteine side chain playing the role of the serine. Catalysis proceeds by covalent
attack of the polarised cysteine side chain and the formation of a thiol ester intermediate.
The active site arrangement is Cys-His charge transfer (Creighton, 1993b; Dunn, 2001).
1.3.3. Aspartic proteases
Bacterial penicillopepsin EC 3.4.23.6. mammalian pepsin EC 3.4.23.1., chymosin EC
3.4.23.4. and certain fungal proteases belong to this family. The active site is composed of
two aspartic acid residues, which lie in close proximity to each other. Catalysis proceeds
via water molecule attack polarised by the enzyme’s aspartic acid side chains. In the
7
enzymatically active pH range 2-3, one of these is ionised, the other unionised (Dunn,
2001).
1.3.4. Metalloproteases
Metalloproteases use bound metal in their active sites. Included in this family are the
carboxypeptidases A and B, thermolysin and medically important enzymes such as
angiotensin-converting enzyme. Catalysis proceeds via water molecule attack polarised by
the enzyme’s co-ordinated zinc. The active site components include zinc, with its three
ligands of two glutamic acids and one histidine (Dunn, 2001).
Peptidases peptide bond hydrolases
N-teimmns C-terminus
E xo peptidas e scut from the ends of pep tide chains
opep tidasescut internal sites in peptide chains
A m i nopeptidasesone at a time from the N-terminus
Di pe ptidyl peptidasesone dipeptide at a time from the N-terminus
Tri pep tidyl peptidasesone tripeptide at a time from the N-terminus
Carboxypeptida s e sone at a time from the C-terminus
Peptidyl dipeptid as esone dipeptide at a time from the C-terminus
F ig u r e 1.4. S c h e m a t ic r e p r e s e n t a t io n il l u s t r a t in g c l e a v a g e s it e s o f e n d o - a n d
e x o p e p t id a s e s . (W e b s it e : b u m h a m .o rg /la b s /s a lv e se n /c la s s if ic a tio n )
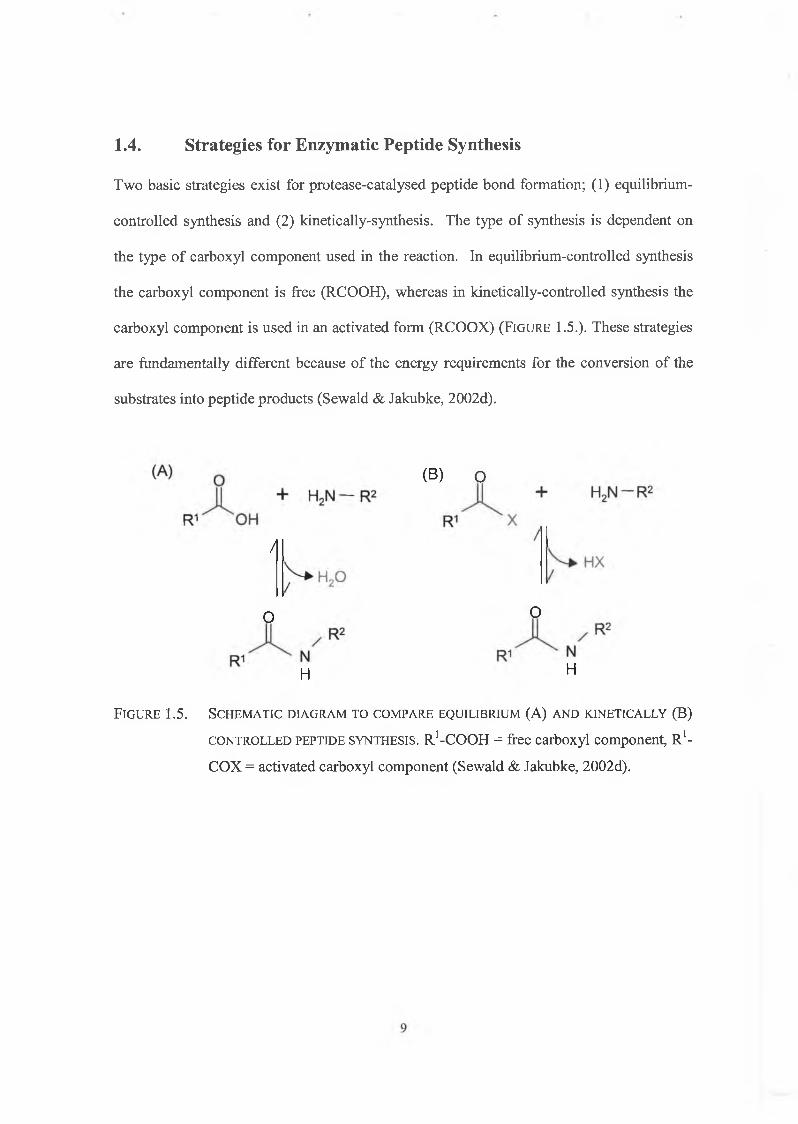
1.4. Strategies for Enzymatic Peptide Synthesis
Two basic strategies exist for protease-catalysed peptide bond formation; (1) equilibrium-
controlled synthesis and (2) kinetically-synthesis. The type of synthesis is dependent on
the type of carboxyl component used in the reaction. In equilibrium-controlled synthesis
the carboxyl component is free (RCOOH), whereas in kinetically-controlled synthesis the
carboxyl component is used in an activated form (RCOOX) ( F i g u r e 1 .5.). These strategies
are fundamentally different because of the energy requirements for the conversion of the
substrates into peptide products (Sewald & Jakubke, 2002d).
(B) O
/
O o
H H
F i g u r e 1.5. S c h e m a t i c d i a g r a m t o c o m p a r e e q u i l i b r i u m (A ) a n d k i n e t i c a l l y (B)
c o n t r o l l e d p e p t id e s y n t h e s i s . R'-COOH = free carboxyl component, R1-
COX = activated carboxyl component (Sewald & Jakubke, 2002d).
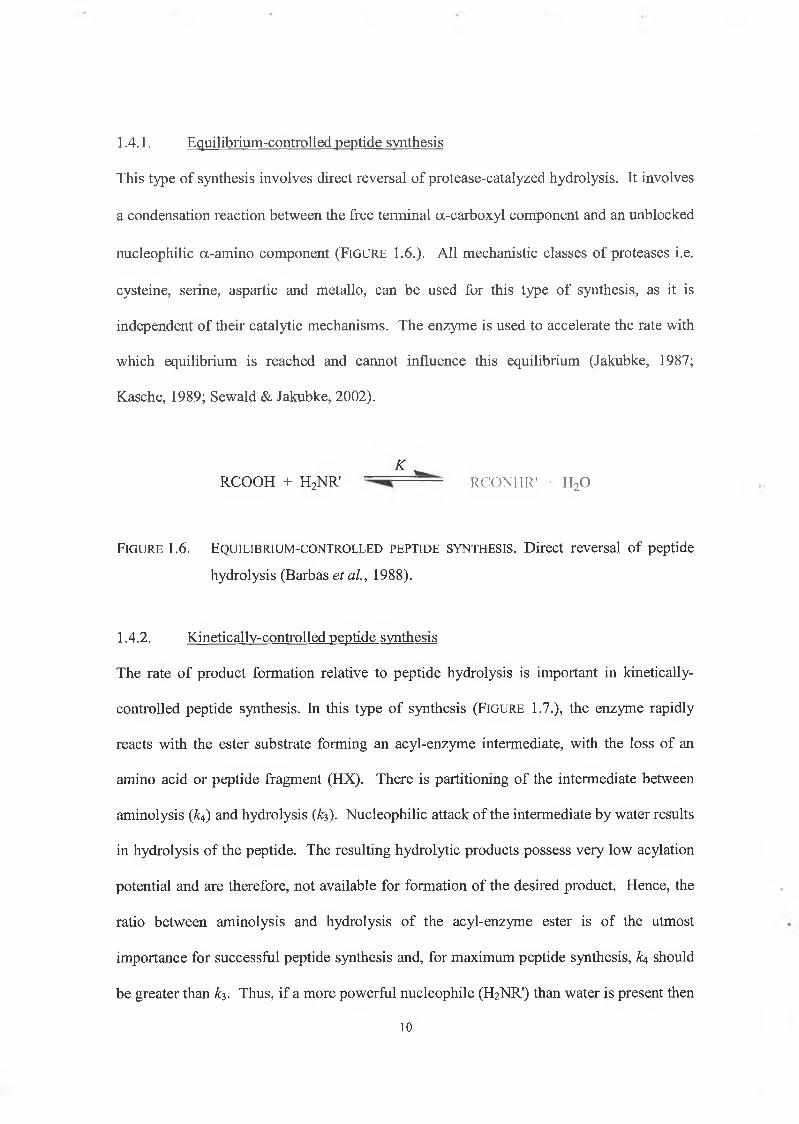
1.4.1. Equilibrium-controlled peptide synthesis
This type of synthesis involves direct reversal of protease-catalyzed hydrolysis. It involves
a condensation reaction between the free terminal a-carboxyl component and an unblocked
nucleophilic a-amino component ( F i g u r e 1 .6.). A ll mechanistic classes of proteases i.e.
cysteine, serine, aspartic and metallo, can be used for this type of synthesis, as it is
independent of their catalytic mechanisms. The enzyme is used to accelerate the rate with
which equilibrium is reached and cannot influence this equilibrium (Jakubke, 1987;
Kasche, 1989; Sewald & Jakubke, 2 0 0 2 ).
K w
RCOOH + H2NR' --------- RCONHR' + H20
F ig u r e 1.6. E q u il ib r iu m -c o n t r o l l e d p e p t id e s y n t h e s is . Direct reversal o f peptide
hydrolysis (Barbas et al., 1988).
1.4.2. Kinetically-controlled peptide synthesis
The rate of product formation relative to peptide hydrolysis is important in kinetically-
controlled peptide synthesis. In this type of synthesis (F ig u r e 1.7.), the enzyme rapidly
reacts with the ester substrate forming an acyl-enzyme intermediate, with the loss of an
amino acid or peptide fragment (HX). There is partitioning of the intermediate between
aminolysis (k4) and hydrolysis (h). Nucleophilic attack of the intermediate by water results
in hydrolysis of the peptide. The resulting hydrolytic products possess very low acylation
potential and are therefore, not available for formation of the desired product. Hence, the
ratio between aminolysis and hydrolysis of the acyl-enzyme ester is of the utmost
importance for successful peptide synthesis and, for maximum peptide synthesis, k$ should
be greater than ks. Thus, if a more powerful nucleophile (H2NR') than water is present then
10
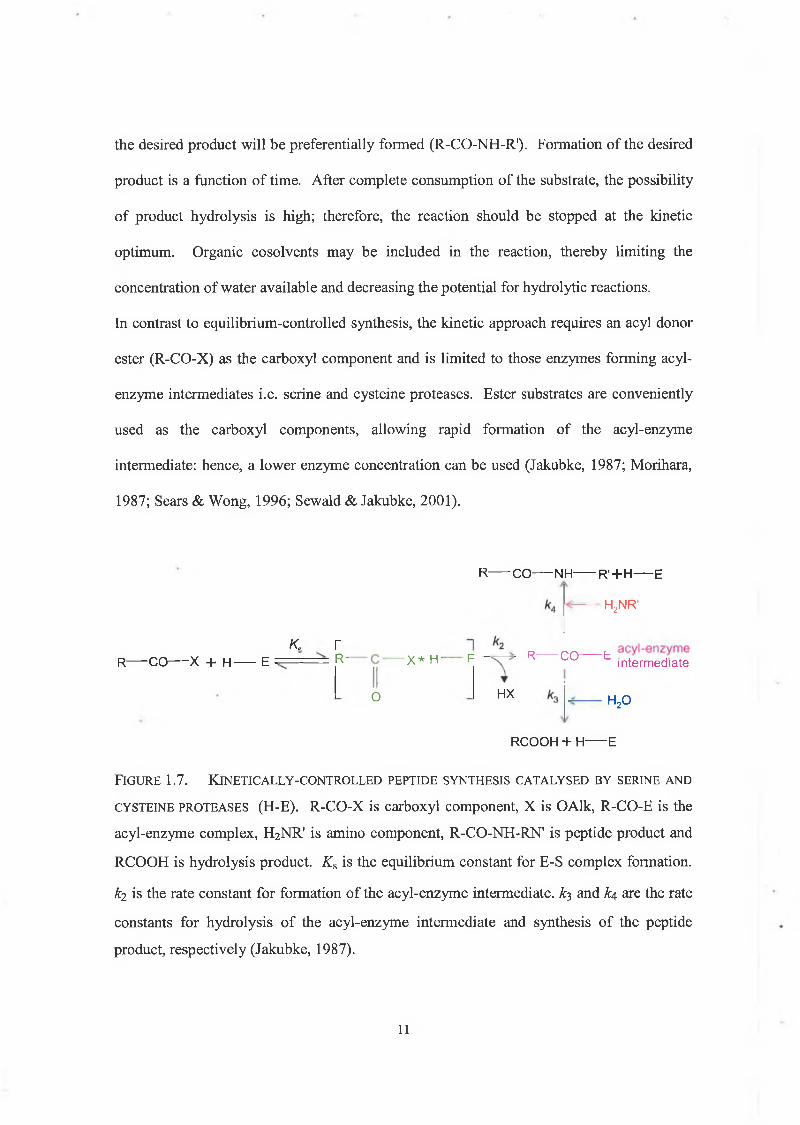
the desired product will be preferentially formed (R-CO-NH-R1). Formation of the desired
product is a function of time. After complete consumption of the substrate, the possibility
of product hydrolysis is high; therefore, the reaction should be stopped at the kinetic
optimum. Organic cosolvents may be included in the reaction, thereby limiting the
concentration of water available and decreasing the potential for hydrolytic reactions.
In contrast to equilibrium-controlled synthesis, the kinetic approach requires an acyl donor
ester (R-CO-X) as the carboxyl component and is limited to those enzymes forming acyl-
enzyme intermediates i.e. serine and cysteine proteases. Ester substrates are conveniently
used as the carboxyl components, allowing rapid formation of the acyl-enzyme
intermediate: hence, a lower enzyme concentration can be used (Jakubke, 1987; Morihara,
1987; Sears & Wong, 1996; Sewald & Jakubke, 2001).
K.R CO X + H E
rR- X * H-
O
R CO NH R' + H E
H2NR'
F R— CO— E intermediate
HX H20
RCOOH + H E
F ig u r e 1.7. K in e t ic a l l y -c o n t r o l l e d p e p t id e s y n t h e s is c a t a l y s e d b y s e r in e a n d
c y s t e in e p r o t e a s e s (H-E). R-CO-X is carboxyl component, X is OAlk, R-CO-E is the
acyl-enzyme complex, H2NR' is amino component, R-CO-NH-RN' is peptide product and
RCOOH is hydrolysis product. Ks is the equilibrium constant for E-S complex formation.
&2 is the rate constant for formation of the acyl-enzyme intermediate. £3 and Æ4 are the rate
constants for hydrolysis of the acyl-enzyme intermediate and synthesis of the peptide
product, respectively (Jakubke, 1987).
11
Haensler et al. (1999) used a-Chymotrypsin and papain to catalyse peptide synthesis in
frozen aqueous systems. They successfully synthesised a number of dipeptides, using
different nucleophiles, achieving yields up to 90%.
Getun et al. (2001) catalysed the synthesis of tetra-peptides containing multifunctional
amino acid residues in ethanol using subtilisin. They obtained yields of up to 92%; this
was dependent on the duration of assay and the acyl donor structure.
Zhou et al. (2003) succeeded in synthesizing the tripeptide Bz-RGD-OEt in a two step
procedure, utilizing a chemo-enzymatic method, obtaining a 72.5% yield. The first step
involved chemical synthesis of the Gly-Asp-diethyl ester (OEt)2. Linkage of the third
amino acid Bz-Arg-OEt to the previously synthesized dipeptide was completed by the
enzymatic method in organic solvents. This formed tripeptide can act as both an acyl donor
and as a nucleophile for peptide chain extension directly (without deprotection/activation).
12
1.5. Enzyme Catalysis in Aqueous and Non-Aqueous Systems
In previous years, conventional notions assumed that enzymes were active only in water.
Indeed, it was more or less accepted that organic solvents destabilized protein molecules;
however, this notion is fast becoming obsolete and in more recent years many solvent
systems have been employed for non-aqueous enzymatic reactions. These may be divided
into the following categories: (1) water:water-miscible (hydrophilic) organic cosolvents (2 )
water:water-immiscible (hydrophobic, biphasic) organic solvent systems and (3) nearly
non-aqueous or anhydrous organic solvents (Krishna, 2002). There are a number of
advantages to using enzymes in organic media, some of which are highlighted in TABLE
1. The catalysis of reactions unfavourable in water, e.g. reversal of hydrolysis reactions
in favour of synthesis.
2. Solubilization of hydrophobic substrates.
3. Ease of recovery for some products.
4. Enhanced biocatalyst thermostability.
5. Suppression of water-induced side reactions.
T a b l e 1.1. A d v a n t a g e s o f u s i n g e n z y m e s in o r g a n i c a s o p p o s e d t o a q u e o u s m e d ia
(Bell et al., 1995)
13
In the natural environment, enzymes function in aqueous solutions and exhibit their
catalytic properties to the full extent when they have a strictly defined conformation. In
solution, a network of interactions determines the conformation of an enzyme e.g. hydrogen
bonding, ionic interactions, van der Waals and hydrophobic forces. Water mediates all of
the above non-covalent interactions and also acts as a lubricant, allowing the
conformational mobility required for catalysis. Therefore, in order to maintain these
interactions, the enzyme molecule requires a definite hydration shell and, thus, removal of
this hydration shell will result in distortion of the enzyme structure and denaturation
(Khmelnitsky et al., 1988; Klibanov, 1997; Krishna, 2002). Numerous studies have
investigated the use of enzymes in organic solvents and the effects of these solvents on
conformation and function.
Gorman and Dordick (1992) demonstrated that organic solvents had the ability to strip
water from enzymes (Subtilisin Carlsberg, a-chymotrypsin, HRP) a phenomenon known as
“water stripping”. In their study, the enzyme bound water exchanged with tritiated water
(T2O) and they monitored its desoiption into the solvent system under study. Exposure to
polar solvents resulted in the highest degree of T2O desorption i.e. methanol desorbed 56-
62% of the bound T2O, whereas exposure to nonpolar solvents resulted in the lowest degree
of desorption i.e. hexane desorbed 0.4-2% of the bound T2O. They also concluded that at
least two fractions of enzyme-bound water must exist, as methanol (most polar solvent used
in this study) managed only to desorb 62% of T2O. Indeed, in lyzozyme four distinct
hydration levels have been shown to exist (T a b l e 1.2.).
14
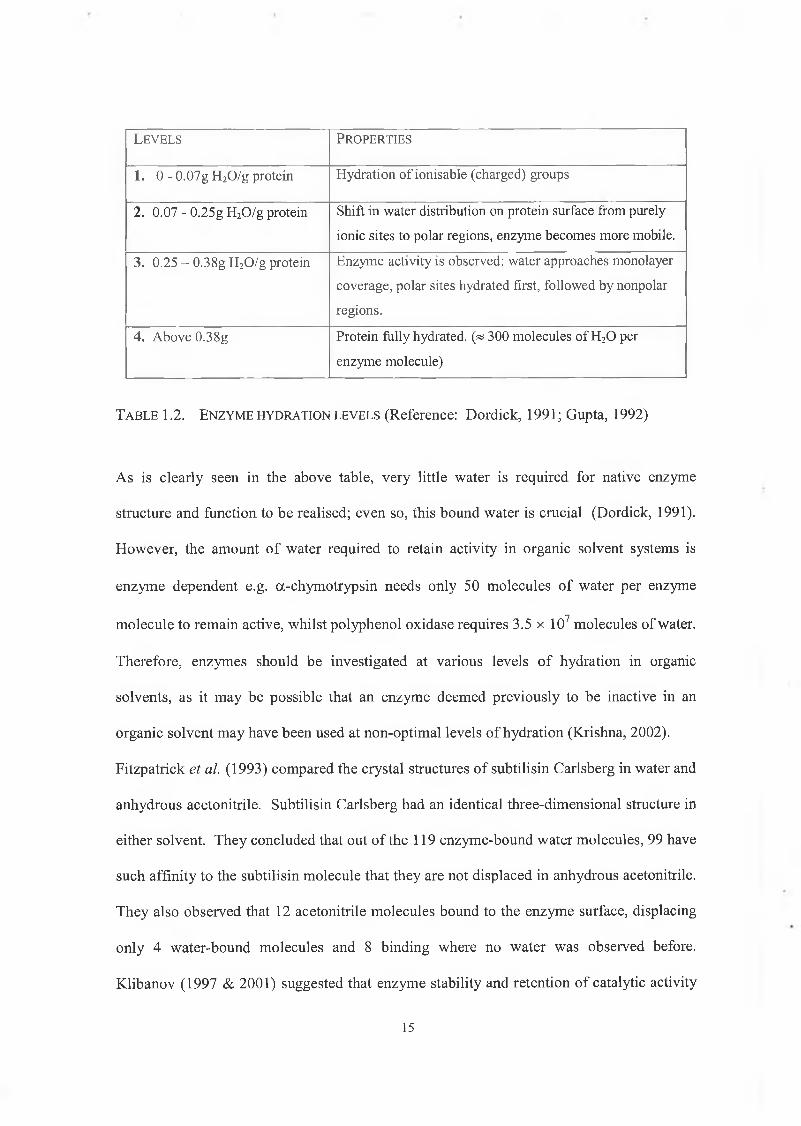
L e v e l s P r o p e r t ie s
1. 0 - 0.07g H 20 /g protein H ydration o f ionisable (charged) groups
2. 0.07 - 0 .25g H 20 /g protein Shift in w ater d istribution on protein surface from purely
ionic sites to polar regions, enzym e becom es m ore mobile.
3. 0.25 - 0.38g H 20 /g protein E nzym e activity is observed: w ater approaches m onolayer
coverage, polar sites hydrated first, follow ed by nonpolar
regions.
4. A bove 0 .38g Protein fully hydrated. (« 300 m olecules o f H 20 per
enzym e m olecule)
T a b l e 1.2. E n z y m e h y d r a t io n l e v e l s (Reference: Dordick, 1991; Gupta, 1992)
As is clearly seen in the above table, very little water is required for native enzyme
structure and function to be realised; even so, this bound water is crucial (Dordick, 1991).
However, the amount of water required to retain activity in organic solvent systems is
enzyme dependent e.g. a-chymotrypsin needs only 50 molecules of water per enzyme
molecule to remain active, whilst polyphenol oxidase requires 3.5 x 10⁷ molecules of water.
Therefore, enzymes should be investigated at various levels of hydration in organic
solvents, as it may be possible that an enzyme deemed previously to be inactive in an
organic solvent may have been used at non-optimal levels of hydration (Krishna, 2002).
Fitzpatrick et al. (1993) compared the crystal structures of subtilisin Carlsberg in water and
anhydrous acetonitrile. Subtilisin Carlsberg had an identical three-dimensional structure in
either solvent. They concluded that out of the 119 enzyme-bound water molecules, 99 have
such affinity to the subtilisin molecule that they are not displaced in anhydrous acetonitrile.
They also observed that 12 acetonitrile molecules bound to the enzyme surface, displacing
only 4 water-bound molecules and 8 binding where no water was observed before.
Klibanov (1997 & 2001) suggested that enzyme stability and retention of catalytic activity
15
in anhydrous solvents is in part due to (1) the ability of the enzyme to strongly bind and
retain some “essential water” and (2 ) the absence of bulk water (which acts as a molecular
lubricant), thereby leading to a rigid enzyme structure. Thus, even though the drive to
unfold in these solvents may be great, the pliability and conformational flexibility
necessary to proceed is lacking.
All solvents are not the same and will exhibit differences in properties such as
hydrophobicity, hydrogen-bonding capacity and miscibility in water; these in turn will have
an effect on the enzyme's structural integrity and catalytic activity (Mattos & Ringe, 2001).
A number of attempts have been made to establish the ideal parameter for the selection of
organic cosolvents for use in enzymatic reactions. Log P (P is the partition coefficient of a
solvent in a water/octanol biphasic system) is a common parameter used to correlate the
denaturing efficiency of organic solvents with their hydrophobicity. This parameter
revealed good correlation with denaturing strength: the higher the log P value, the stronger
the denaturing effect. However, this parameter is only valid when applied to solvents of the
same functionality e.g. alcohols. When solvents of a different functionality are included,
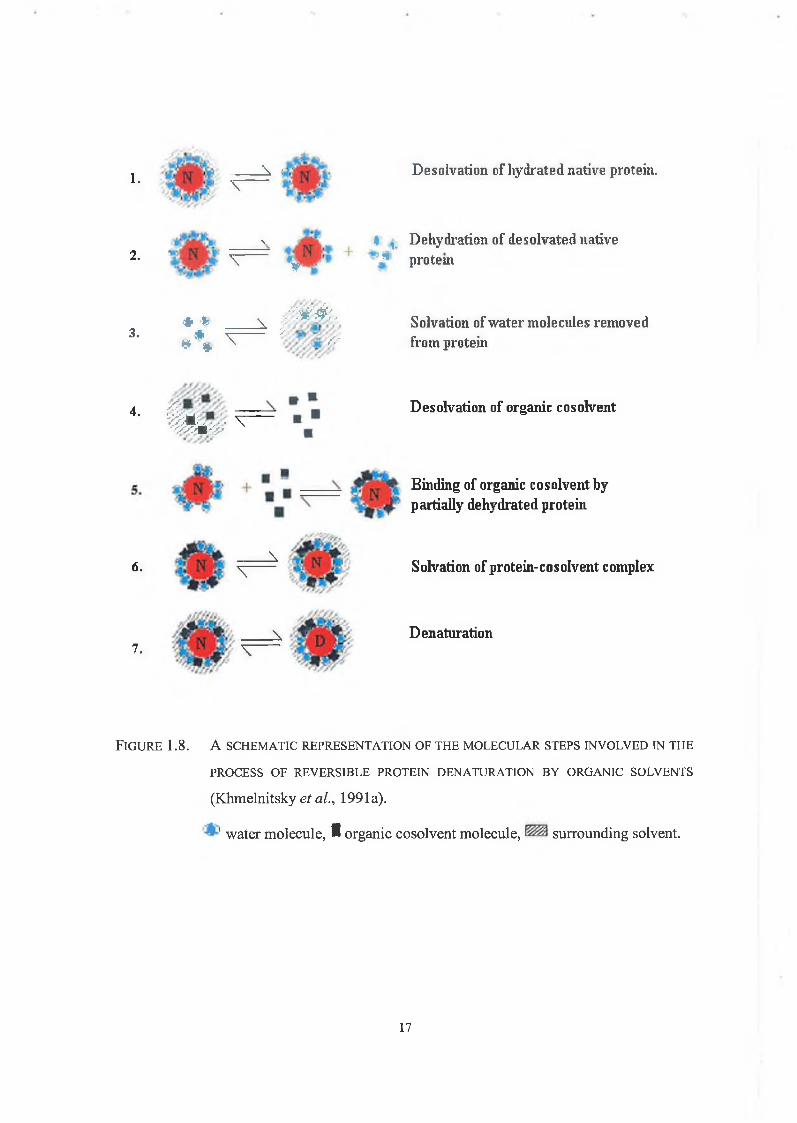
the correlation breaks down (Mozhaev et al., 1989). Khmelnitsky et al. (1991a) developed
the thermodynamic model of protein denaturation by organic solvents in solution (F ig u r e
1.8.). This model explained the molecular mechanism of the denaturation process,
establishing a quantitative relationship between the physicochemical properties of organic
solvents and their denaturing effect, allowing construction of the denaturation capacity
scale (DC) of organic solvents. Organic solvents are arranged in accordance with their DC
value, thus forming the scale. This scale can then be used to quantitatively predict the
threshold concentration (C50) of various organic solvents at which half-inactivation of the
enzyme is observed.
16
1. A <\
Desolvation of hydrated native protein.
2. \v i , Dehydration of desolvated native
* protein'wm
3.* * _
• X~ # « N
A fftë-éh s.: s.-Solvation of water molecules removed from protein
4 . ÉS .■ o y s m -::y
VDesolvation of organic cosolvent
6.A
V
Binding of organic cosolvent by partially dehydrated protein
Solvation of protein-cosolvent complex
7.A
VDénaturation
F ig u r e 1.8. A s c h e m a t ic r e p r e s e n t a t io n o f t h e m o l e c u l a r s t e p s in v o l v e d in t h e
PROCESS OF REVERSIBLE PROTEIN DENATURATION BY ORGANIC SOLVENTS
(Khmelnitsky et al., 1991a).
1 water molecule, ® organic cosolvent molecule, surrounding solvent.
17
There are many advantages to employing enzymes as catalysts in organic as opposed to
aqueous media ( T a b l e 1.1.) and the stability of certain enzymes is greater in the presence
of organic media than aqueous media, e.g. the half-life of LST-03 lipase from Pseusomonas
aeruginosa in «-decane was > 1 0 0 days; in the absence of organic solvent the half-life
decreased to 12.5 days. However, most enzymes are denatured and inactivated in the
presence of organic media. Because of this several methods have been devised for
enhancing the stability of enzymes e.g. immobilization and chemical modification, which
will be discussed in the next section (Ogino & Ishikawa, 2001).
18
1.6. Stability of Proteases
The increasing use of proteins and their stability in-vitro remains a critical issue in
biotechnology. In particular, the stabilization of enzymes without diminishing and diluting
their activity is crucial for their use as industrial biocatalysts (Govardhan, 1999).
The complicated structure of proteins renders them subject to chemical and physical
instability. Chemical instability refers to covalent modifications of the protein molecules
resulting in the formation of a new chemical entity that can have different biological
activities. Chemical instability occurs at high temperatures or at extreme pH values. The
main degradation processes are hydrolysis, oxidation, racemization, elimination of Cys-Cys
bridges and disulfide exchange. Chemical degradation processes may be controlled by
adjusting environmental conditions or by adding stabilizers such as sugars or polyols.
The native structure of a protein is usually regarded as the conformation that is exhibited by
proteins within the cellular environment or by isolated proteins at their maximum biological
activity. Physical instability is mainly associated with processes that change the local
spatial arrangement of (1) the protein backbone (2) subunits or (3) three-dimensional
structures. These spatial changes can lead to dénaturation, aggregation or precipitation;
however, they do not involve covalent bond breakage, except in disulfide exchange. These
processes may eventually lead to a loss of biological activity or inactivation (Gianfreda &
Scarfi, 1991; Sowdhamini & Balaram, 1993; Wong & Parasrampuria, 1997).
Mozhaev (1993) described the reversible and irreversible inactivation of enzymes as:
N t; D -> I
Where N, D and I represent the native, reversibly denatured and irreversibly inactivated
forms of the protein, respectively. Reversible dénaturation is a two state-transition unlike
irreversible inactivation, which is a multi-step process. Reversible dénaturation, also
referred to as thermodynamic stability, is concerned with the resistance of the folded19
protein conformation to dénaturation, while irreversible inactivation measures the protein’s
long-term stability (O’Fâgâin, 1997a).
Dénaturation studies generally involve exposing the protein of interest to a variation of
temperature (e.g. heat/cold dénaturation) or the addition of chaotropic agents (e.g. urea,
guanidine) as a means of inducing unfolding. Once the protein has unfolded, numerous
factors may lead to irreversible damage to the protein, thereby rendering the protein
inactive (Sowdhamini & Balaram, 1993).
By definition, stabilization of protein molecules means preventing these changes and
preserving the native structure of the protein. Assuming that unfolding of the protein is the
initial and essential step leading to inactivation, extensive research and experimental studies
have been carried out on different chemical modification methods to approach the problem
of enzyme stabilization (Gianfreda & Scarfi, 1991).
Chemical modification refers to any chemical alteration of the protein structure, with or
without changes in biological function (Tyagi & Gupta, 1993). It is a valuable tool for
altering and extending the activities of enzymes in-vitro. Chemically modifying specific
functional groups of the protein can lead to an increase in the protein’s stability, improve its
solubility, alter patterns of inhibition and activation, and change its pH optimum or
substrate specificity (Hilvert, 1991). A number of chemical modification techniques exist
which will be discussed in detail including the following: modification with
monofunctional reagents, cross-linking with bi- or multifunctional reagents,
hydrophilization, immobilisation, coupling to polyethylene glycol (PEG) and aggregation.
20
1.6.1. Chemical modification with mono functional reagents
These modifications occur when the free functional groups of the protein react with
monofunctional (small molecular weight) reagents (Tyagi & Gupta, 1993).
Eisner et al. (2000) modified trypsin by succinylation of its lysine residues. This process
did not influence the catalytic behaviour of trypsin; however, succinyl-trypsin displayed
high stability against autodigestion. In particular, modified trypsin retained 100% amidase
activity over a 5-hour period, while native trypsin showed a 95% loss in activity over the 5-
h o u r p e r io d . T ry p s in h y d ro ly se s L -a rg in in y l a n d L -ly sy l b o n d s o f p o ly p e p tid e s . It
undergoes rapid autolytic inactivation at neutral pH due to hydrolysis of these bonds.
However, autolysis may be prevented by chemically modifying the s-amino group of lysine
residues and the guanidine group of arginine residues (Nureddin & Inagami, 1975; &
O’Fagain, 1996b). Succinylation of trypsin results in a change in the surface charge of the
protein. In native trypsin, the ratio of positively charged and negatively charged amino acid
residues is 15/10, in succinyl-trypsin 2/23. Hence, Eisner et al. (2000) hypothesised that
the high stability of succinyl-trypsin was as a consequence of the negatively charged
protein surface. A negative electrostatic field exists in the substrate-binding pocket of
trypsin. This negative field attracts the solvated arginine and lysine substrate side chains
and helps to stabilize their postive charges in the enzyme-substrate complex. Therefore,
changing the charge on the lysine residue by modification will prevent lysine binding in the
negative substrate-binding pocket and hence, prevent autolysis (Briand et al., 1999).
Khajeh et al. (2001) chemically modified lysine residues in two bacterial a-amylases, a
mesophilic enzyme from Bacillus amyloliquefaciens (BAA) and a thermophilic enzyme
from Bacillus licheniformis (BLA) using citraconic anhydride. They observed an
enhancement in the thermostability of the modified mesophilic BAA. In particular, at
80°C, this modified enzyme retained 40% activity over a 10-minute assay period compared21
with native BAA, of which activity fell to less than 5% over the same assay time. A
dramatic enhancement of activity at 37°C was observed for the modified thermophilic
BLA, resulting in a 3-fold increase in the kcJ K m (1523 mM/sec) when compared to native
BLA (486mM/sec).
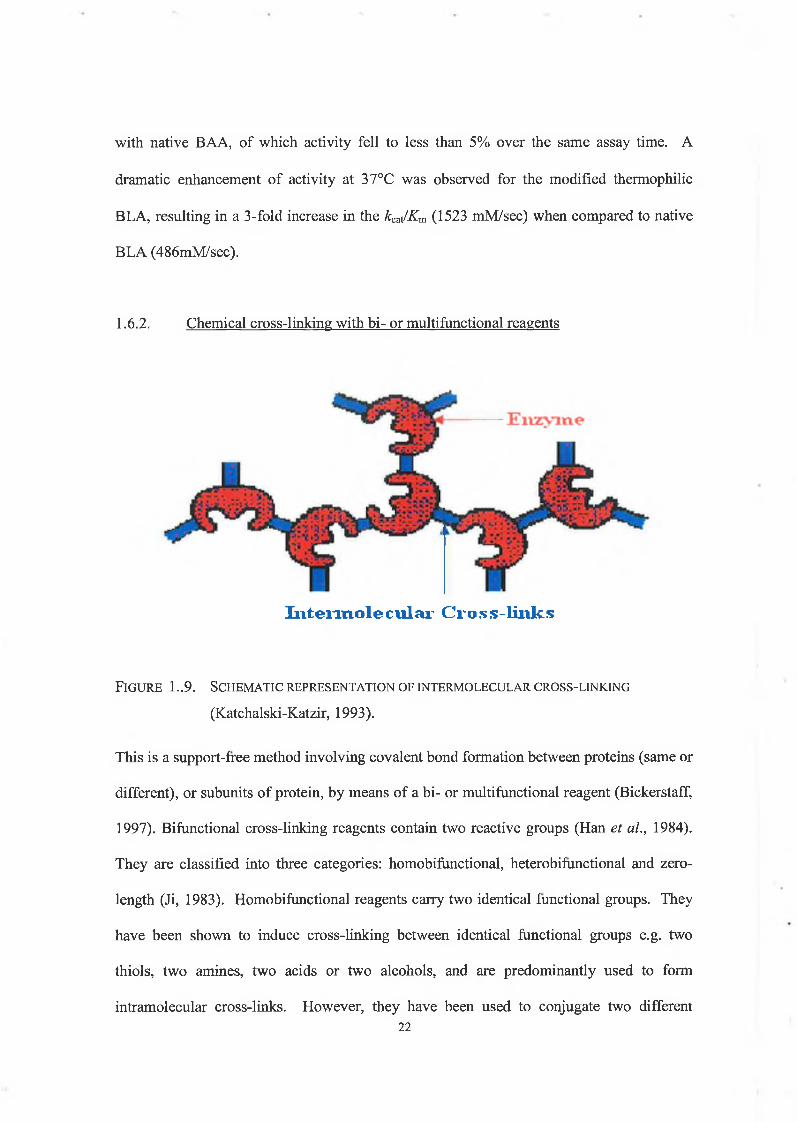
1.6.2. Chemical cross-linking with bi- or multifunctional reagents
Intermole cular Cross-liiiks
F ig u r e 1..9. Sc h e m a t ic r e p r e s e n t a t io n o f in t e r m o l e c u l a r c r o s s -l in k in g
(Katchalski-Katzir, 1993).
This is a support-free method involving covalent bond formation between proteins (same or
different), or subunits of protein, by means of a bi- or multifunctional reagent (Bickerstaff,
1997). Bifunctional cross-linking reagents contain two reactive groups (Han et al., 1984).
They are classified into three categories: homobifimctional, heterobifunctional and zero-
length (Ji, 1983). Homobifunctional reagents carry two identical functional groups. They
have been shown to induce cross-linking between identical functional groups e.g. two
thiols, two amines, two acids or two alcohols, and are predominantly used to form
intramolecular cross-links. However, they have been used to conjugate two different22
biomolecules e.g. an enzyme to an antibody (Ji, 1983). Examples of these reagents include:
glutaraldehyde, succinimidyl esters, imidoesters, dianhydrides and diisocyanates (Gleich et
al., 1992). Heterobifunctional reagents contain two dissimilar functional groups e.g.
photosensitive azide and conventional imidate, allowing the formation of cross-links
between unlike functional groups (Ji, 1983). The zerolength reagents form a chemical bond
between two chemical groups without being incorporated themselves into the product. A
feature of their reaction is a shortening of the distance between the two reacted groups upon
cross-linking. An example of this type of reagent/reaction is the water-soluble
carbodiimide 1-ethyl-3-(3-dimethylaminopropyl) carbodiimide hydrochloride (EDC). This
reagent couples a carboxylic acid to a primary amino group, forming an amide bond (Ji,
1983).
Cross-linking reagents can be used to introduce both intra- and intermolecular bridges into
proteins. Intramolecular bridges are principally used to stabilize the tertiary structure of
proteins and are useful in determining the intramolecular distances between groups.
Intermolecular cross-links may join similar molecules (homopolymers) or dissimilar
(heteropolymers) together. The products can then be used as models for the study of
protein interactions e.g. antibody-antigen interactions or hormone-receptor interactions (Ji,
1983: Han et al., 1984). Ryan et al. (1994) chemically modified horseradish peroxidase
(HRP) with the homobifunctional cross-linking reagents, suberic acid N-
hydroxysuccinimide ester (SA-NHS) and ethylene glycol bis-succinimidyl succinate (EG-
NHS). They observed a 6 - to 23-fold increase in the thermostability of modified HRP
(depending on the NHS ester used) as compared to native HRP. Native and succinimide
derivatives of HRP were also studied by Miland et al. (1996). They investigated the
stability properties of both native and modified HRP in various water/organic solvent
mixtures. In each of the systems tested, increasing the solvent concentration resulted in a
23
loss of activity for native HRP; however, modification of HRP resulted in improved
tolerance in these cosolvent systems, e.g. in a 50% (v/v) THF cosolvent system at 25°C,
SA-NHS HRP retained 50% of its original activity in comparison to native HRP, where
activity fell to less than 20%. Both modified peroxidases also exhibited improved
resistance to the denaturant guanidine hydrochloride.
Cheon et al. (2000) observed from previous work that the homotetramer enzyme D-
hydantoinase from B. stearothermophilus dissociated to a monomer under operational
conditions and that the dissociated monomer was very unstable. They hypothesized that
intersubunit cross-linking of tetrameric D-hydantoinase would reduce the dissociation of
subunits, and hence stabilise the enzyme. Cross-linking was performed using EDC (1-
ethyl-3-(3-di-methylaminopropyl) carbodiimide hydrochloride). The cross-linked enzyme
was shown to exhibit maximum activity at 70°C, considerably higher than the native
enzyme, where maximal activity was determined at 60°C. They investigated the stability of
the cross-linked and native enzyme at 55°C, where the calculated half-life was 37 and 9.5
hours, respectively.
24
1.6.3. Hvdrophilization
Structural analysis of proteins by X-ray crystallography suggests that about one half of the
surface area of a protein is occupied by non-polar amino acids. These residues are very
often organized as hydrophobic surface clusters, which play an important role in-vivo,
enabling the protein to bind via hydrophobic interactions to other proteins forming multi
enzyme complexes, to lipids in biological membranes and to polysaccharides in cell walls.
However, the contact of these non-polar residues with water is thermodynamically
unfavourable and can affect protein stability in-vitro. Therefore, reducing the non-polar
surface area should stabilize the protein (Mozhaev et al., 1988). The process of
hydrophilization can achieve this. It involves the preferential modification by alkylation or
acylation of -NH 2 groups on the protein surface, e.g. transformation of protein -NH2
groups into -NHCH2COOH groups, giving rise to an artificial hydrophilization of the
surface area of the protein globule and resulting in increased enzyme stability. This effect
can be explained by a decrease of non-polar clusters located on the protein surface, contact
of which with water is thought to destabilize the enzyme (Gianfreda & Scarfi, 1991).
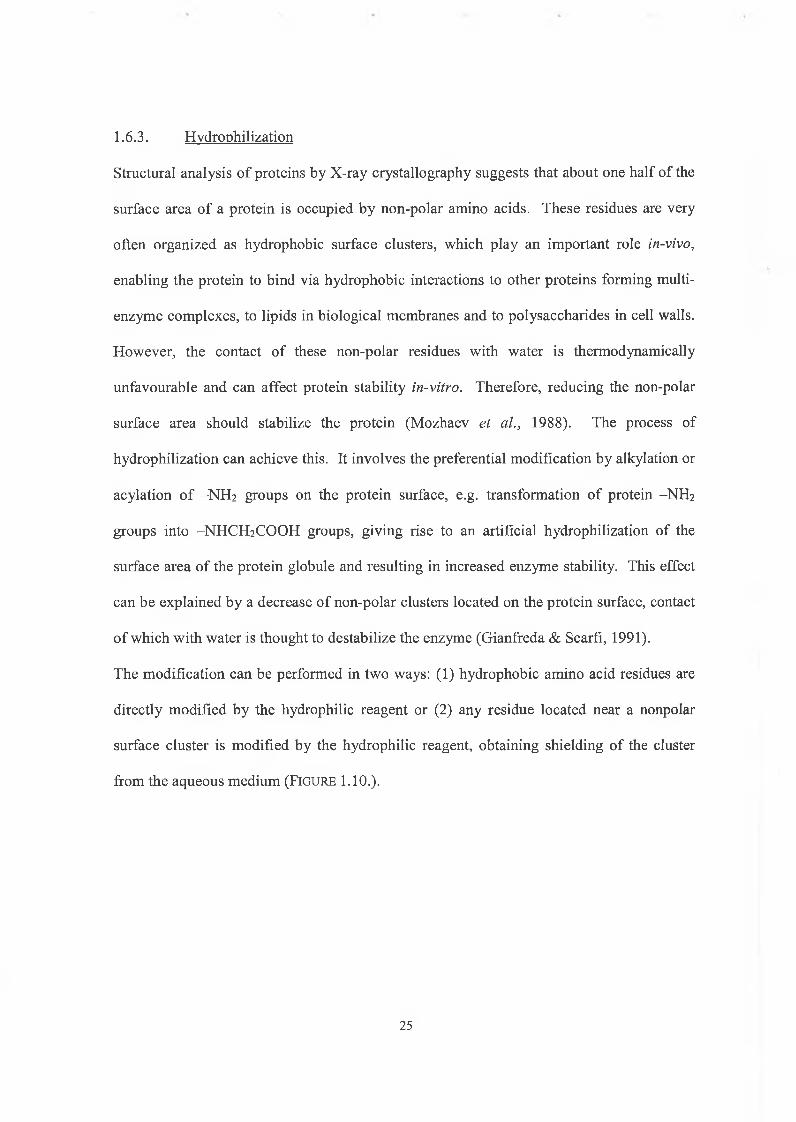
T h e m o d if ic a t io n c a n b e p e rfo rm e d in tw o w ay s: (1 ) h y d ro p h o b ic a m in o a c id re s id u es are
d ire c t ly m o d if ie d b y th e h y d ro p h ilic re a g e n t o r (2 ) a n y re s id u e lo c a te d n e a r a n o n p o la r
su rfa c e c lu s te r is m o d if ie d b y th e h y d ro p h ilic re a g e n t, o b ta in in g sh ie ld in g o f th e c lu s te r
f ro m th e a q u e o u s m e d iu m ( F i g u r e 1.10.).
25
Hydrophilic Modifier
Hydrophilic M o difier
F i g u r e 1 .10. S c h e m a t i c r e p r e s e n t a t i o n o f a p p r o a c h t o h y d r o p h i l i z a t i o n o f n o n
p o l a r s u r f a c e a r e a s in A p r o t e i n (Mozhaev et al., 1988).
Mozhaev et al. (1 9 8 8 ) successfully used this method to artificially hydrophilize trypsin and
a-chymotrypsin. In a two-step procedure the hydrophilic reagent directly modified the
surface hydrophobic tyrosine residues of trypsin (F ig u r e 1 .11 .). They determined that
modified trypsin became up to 100 times more stable to the effects of thermoinactivation.
In particular, at 56°C, modified trypsin showed 50% residual activity over a 2-hour period.
In comparison, native trypsin was shown to have less than 10% residual activity over the
same period. However, Mozhaev et al. (1 9 8 8 ) concluded that the extent of stabilization
depended exclusively on the number of aminotyrosines introduced; hence, the stabilizing
effect increased with the number of aminotyrosine residues in trypsin. From spectral
investigations it was deduced that only four tyrosines are entirely exposed to the solvent
and can therefore undergo modification more readily than the other tyrosine residues in
trypsin.
26
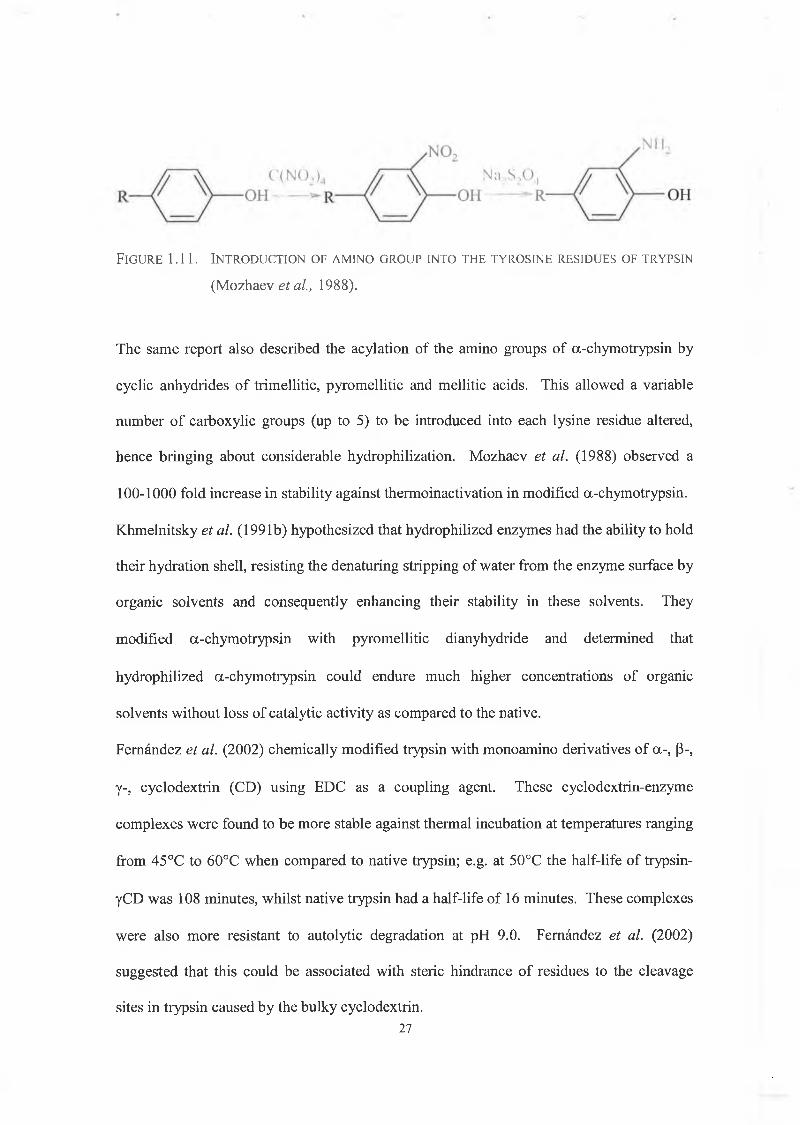
F ig u r e 1.11. In t r o d u c t io n o f a m in o g r o u p in t o t h e t y r o s in e r e s id u e s o f t r y p s in
(Mozhaev et al., 1988).
The same report also described the acylation of the amino groups of a-chymotrypsin by
cyclic anhydrides of trimellitic, pyromellitic and mellitic acids. This allowed a variable
number of carboxylic groups (up to 5) to be introduced into each lysine residue altered,
hence bringing about considerable hydrophilization. Mozhaev et al. (1988) observed a
1 0 0 -1 0 0 0 fold increase in stability against thermoinactivation in modified a-chymotrypsin.
Khmelnitsky et al. (1991b) hypothesized that hydrophilized enzymes had the ability to hold
their hydration shell, resisting the denaturing stripping of water from the enzyme surface by
organic solvents and consequently enhancing their stability in these solvents. They
modified a-chymotrypsin with pyromellitic dianyhydride and determined that
hydrophilized a-chymotrypsin could endure much higher concentrations of organic
solvents without loss of catalytic activity as compared to the native.
Fernández et al. (2002) chemically modified trypsin with monoamino derivatives of a-, p-,
y-, cyclodextrin (CD) using EDC as a coupling agent. These cyclodextrin-enzyme
complexes were found to be more stable against thermal incubation at temperatures ranging
from 45 °C to 60°C when compared to native trypsin; e.g. at 50°C the half-life of trypsin-
yCD was 108 minutes, whilst native trypsin had a half-life of 16 minutes. These complexes
were also more resistant to autolytic degradation at pH 9.0. Fernández et al. (2002)
suggested that this could be associated with steric hindrance of residues to the cleavage
sites in trypsin caused by the bulky cyclodextrin.27
1.6.4. Immobilization
The term “immobilized enzyme” is used to denote a protein that is localized or physically
confined in a defined region of space, with retention of catalytic activity and which can be
used repeatedly and continuously. The immobilization of an enzyme closely resembles the
state of the enzyme within the intracellular microenvironment of living cells and hence,
provides a model system to study and solve basic problems in enzymology (Gianfreda &
Scarfi, 1991; Katchalski-Katzir, 1993). Immobilization by multipoint attachment to a
support may enhance stability and prevent inactivation of the enzyme. The support
rigidities the protein conformation, thus preventing unfolding and may also stabilize the
protein by means of steric hindrance and diffusion restrictions (Wong & Parasrampuria,
1997). Enzymes can be immobilized by a number of methods, which result in: (1) enzyme-
carrier conjugates, in which the enzyme is adsorbed or covalently bound to its carrier, (2 )
entrapment of the enzyme in gels, fibres or beads and (3) chemical aggregation, (Gianfreda
& Scarfi, 1991; Katchalski-Katzir, 1993).
The chosen immobilization technique should allow retention of enzyme catalytic activity
while diminishing processes that are detrimental to the enzyme, such as autolysis (Diaz &
Balkus, 1996). There are a number of advantages associated with this technique. Because
the enzyme is immobilized, contamination of the product with the immobilized enzyme can
be avoided, permitting an easier recovery of the product. Better quality products are also
obtained. Once the product has been recovered the biocatalyst can be re-used. Under
optimum assay conditions both thermal and storage stability of an enzyme can be increased
by this method, provided the tertiary and/or quaternary structure of the protein can be
stabilized (Huckel et al., 1996).
28
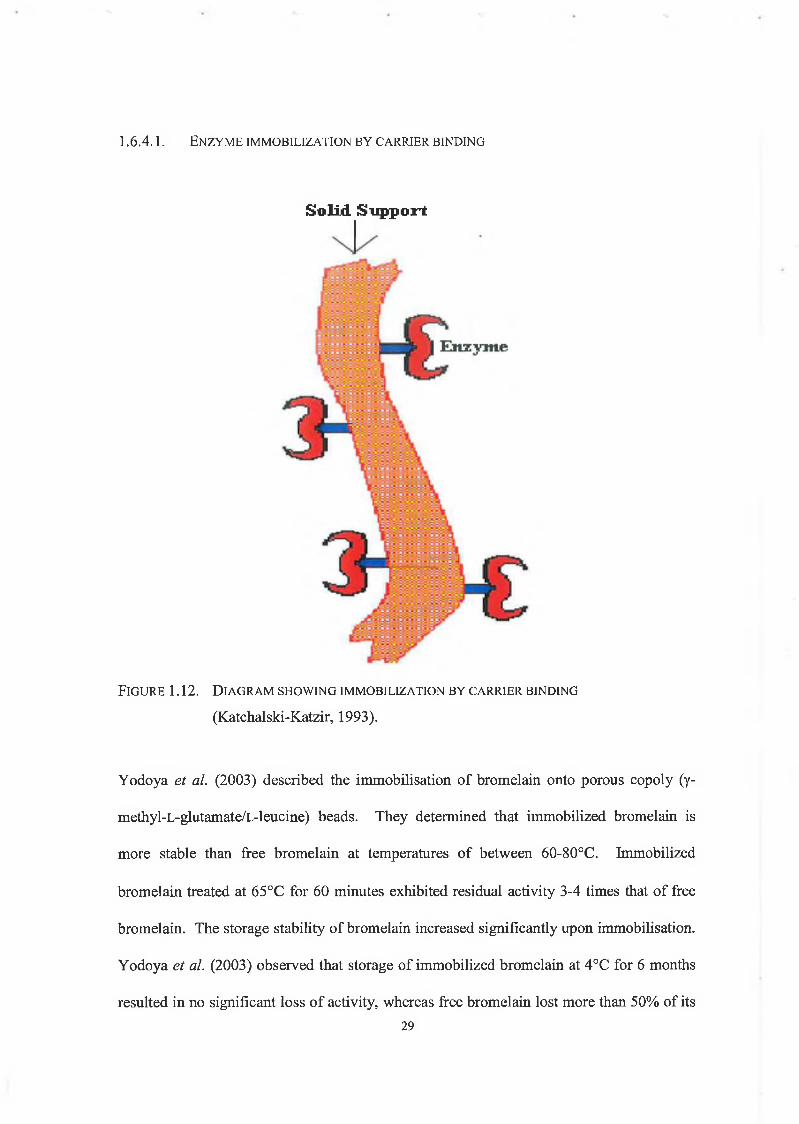
1 .6 .4 .1 . E n z y m e im m o b il iz a t io n b y c a r r ie r b in d in g
Solid Support
F i g u r e 1.12. D i a g r a m s h o w in g im m o b i l i z a t i o n b y c a r r i e r b in d in g
(Katchalski-Katzir, 1993).
Yodoya et al. (2003) described the immobilisation of bromelain onto porous copoly (y-
methyl-L-glutamate/L-leucine) beads. They determined that immobilized bromelain is
more stable than free bromelain at temperatures of between 60-80°C. Immobilized
bromelain treated at 65°C for 60 minutes exhibited residual activity 3-4 times that of free
bromelain. The storage stability of bromelain increased significantly upon immobilisation.
Yodoya et al. (2003) observed that storage of immobilized bromelain at 4°C for 6 months
resulted in no significant loss of activity, whereas free bromelain lost more than 50% of its29
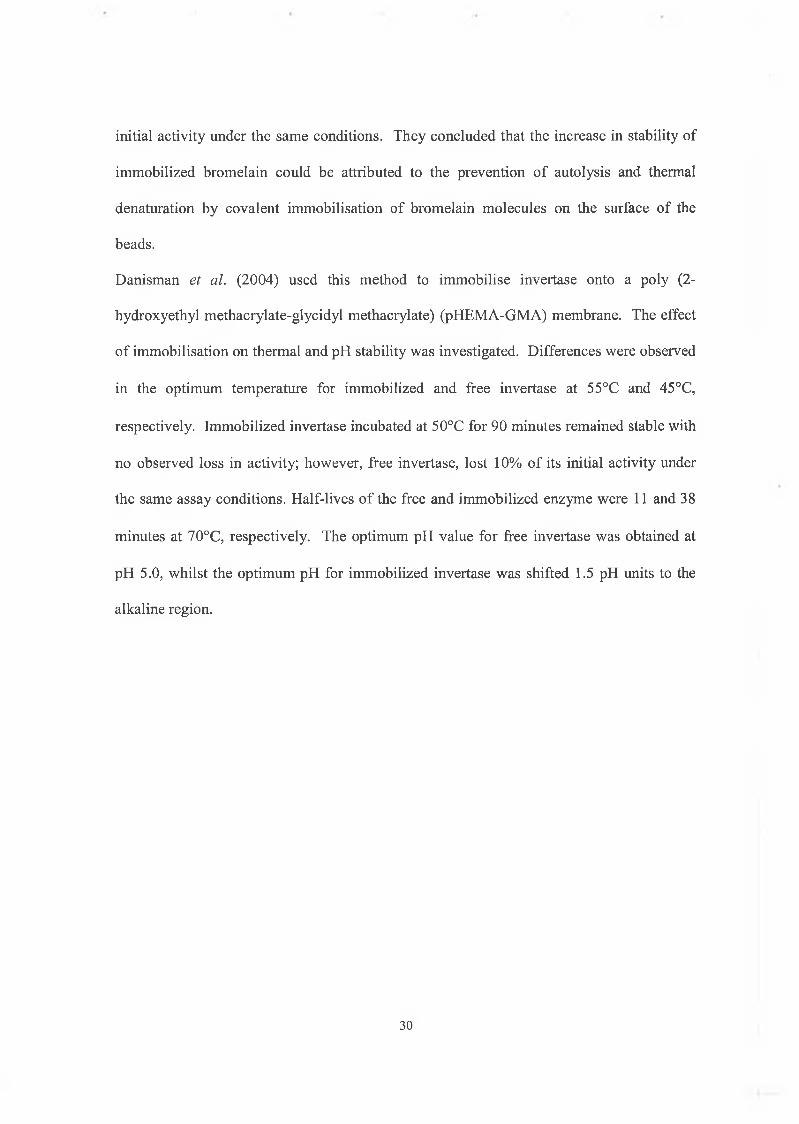
initial activity under the same conditions. They concluded that the increase in stability of
immobilized bromelain could be attributed to the prevention of autolysis and thermal
denaturation by covalent immobilisation of bromelain molecules on the surface of the
beads.
Danisman et al. (2004) used this method to immobilise invertase onto a poly (2-
hydroxyethyl methacrylate-glycidyl methacrylate) (pHEMA-GMA) membrane. The effect
of immobilisation on thermal and pH stability was investigated. Differences were observed
in the optimum temperature for immobilized and free invertase at 55°C and 45°C,
respectively. Immobilized invertase incubated at 50°C for 90 minutes remained stable with
no observed loss in activity; however, free invertase, lost 10% of its initial activity under
the same assay conditions. Half-lives of the free and immobilized enzyme were 11 and 38
minutes at 70°C, respectively. The optimum pH value for free invertase was obtained at
pH 5.0, whilst the optimum pH for immobilized invertase was shifted 1.5 pH units to the
alkaline region.
30
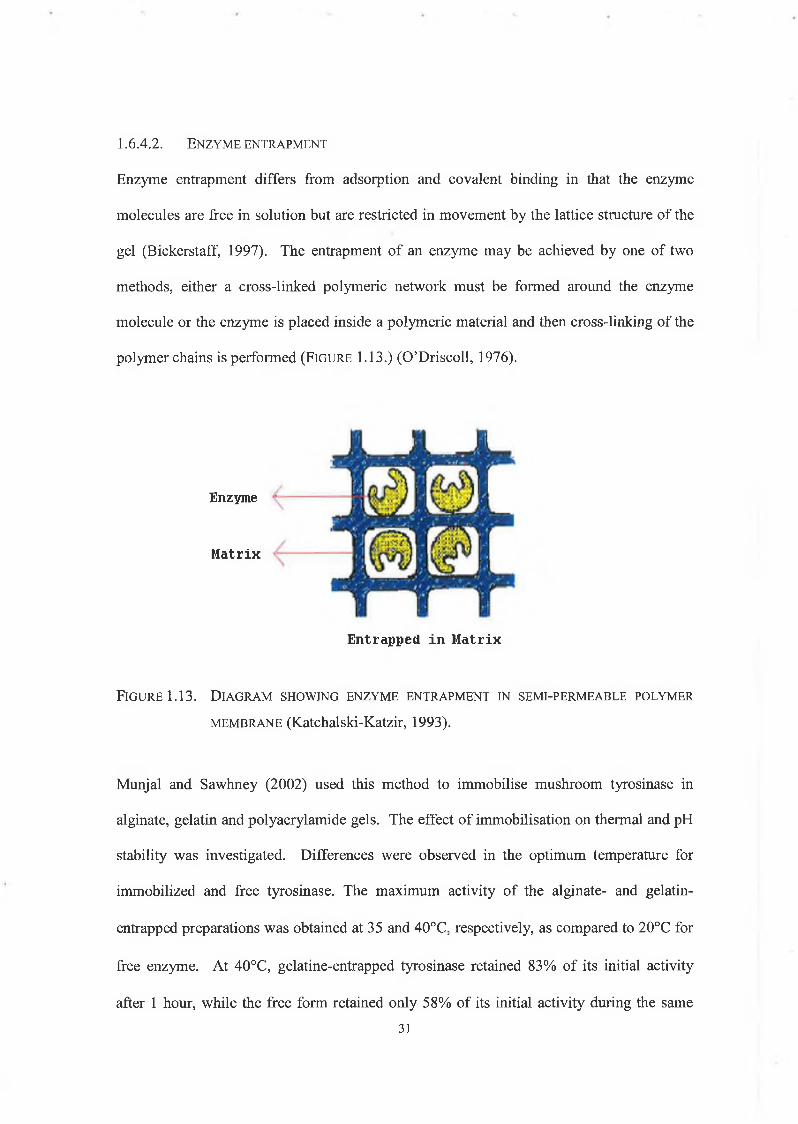
1.6 .4 .2 . E n z y m e e n t r a p m e n t
Enzyme entrapment differs from adsorption and covalent binding in that the enzyme
molecules are free in solution but are restricted in movement by the lattice structure of the
gel (Bickerstaff, 1997). The entrapment of an enzyme may be achieved by one of two
methods, either a cross-linked polymeric network must be formed around the enzyme
molecule or the enzyme is placed inside a polymeric material and then cross-linking of the
polymer chains is performed ( F ig u r e 1.13.) (O’Driscoll, 1976).
Enzyme
Matrix
Entrapped in Matrix
F i g u r e 1.13. D i a g r a m s h o w in g e n z y m e e n t r a p m e n t in s e m i- p e r m e a b le p o ly m e r
m e m b r a n e (fCatchalski-Katzir, 1993).
Munjal and Sawhney (2002) used this method to immobilise mushroom tyrosinase in
alginate, gelatin and polyacrylamide gels. The effect of immobilisation on thermal and pH
stability was investigated. Differences were observed in the optimum temperature for
immobilized and free tyrosinase. The maximum activity of the alginate- and gelatin-
entrapped preparations was obtained at 35 and 40°C, respectively, as compared to 20°C for
free enzyme. At 40°C, gelatine-entrapped tyrosinase retained 83% of its initial activity
after 1 hour, while the free form retained only 58% of its initial activity during the same31
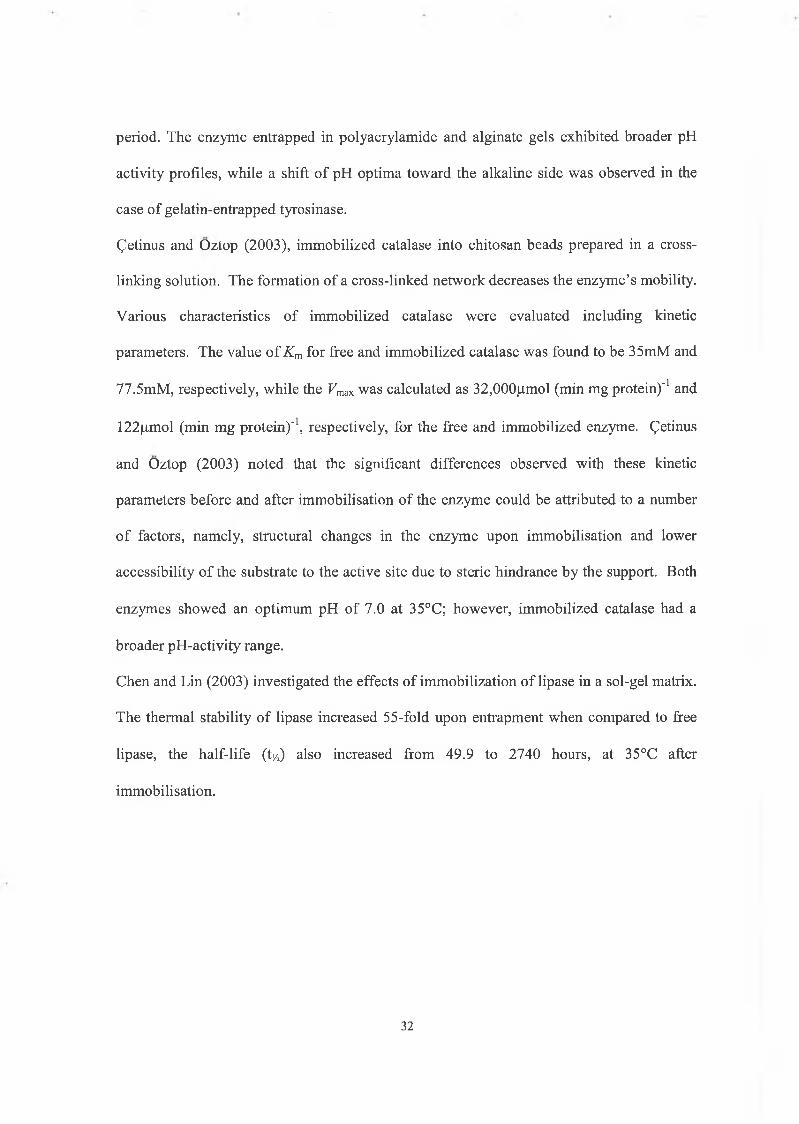
period. The enzyme entrapped in polyacrylamide and alginate gels exhibited broader pH
activity profiles, while a shift of pH optima toward the alkaline side was observed in the
case of gelatin-entrapped tyrosinase.
Cetinus and Oztop (2003), immobilized catalase into chitosan beads prepared in a cross-
linking solution. The formation of a cross-linked network decreases the enzyme’s mobility.
Various characteristics of immobilized catalase were evaluated including kinetic
parameters. The value of Km for free and immobilized catalase was found to be 35mM and
77.5mM, respectively, while the Vmax was calculated as 32,000(J.mol (min mg protein)'1 and
122|nmol (min mg protein)'1, respectively, for the free and immobilized enzyme. Qetinus
and Oztop (2003) noted that the significant differences observed with these kinetic
parameters before and after immobilisation of the enzyme could be attributed to a number
of factors, namely, structural changes in the enzyme upon immobilisation and lower
accessibility of the substrate to the active site due to steric hindrance by the support. Both
enzymes showed an optimum pH of 7.0 at 35°C; however, immobilized catalase had a
broader pH-activity range.
Chen and Lin (2003) investigated the effects of immobilization of lipase in a sol-gel matrix.
The thermal stability of lipase increased 5 5-fold upon entrapment when compared to free
lipase, the half-life (t/2) also increased from 49.9 to 2740 hours, at 35°C after
immobilisation.
32
1 .6 .4 .3 . C h e m ic a l a g g r e g a t io n
The aggregation method involves using high concentrations of cross-linking agents to
produce an insoluble aggregate of enzymes. The formation of this aggregate is attributed to
both intramolecular and intermolecular cross-links in the protein molecule. This method
has also been used to retain proteins on the surface of porous materials, thereby anchoring
the protein onto its matrix. It has also been used together with inclusion to increase the
mean size of enzyme molecules entrapped in a gel or microcell, allowing the use of lager
gel pore sizes and reducing diffusion constraints (Broun, 1976; Khare et al., 1991; Tyagi et
al., 1999).
Tyagi et al. (1999) used glutaraldehyde to prepare chemical aggregates of three enzymes,
i.e. acid phosphatase, (3-glucosidase and polyphenol oxidase. They investigated the thermal
and solvent stability of the native and modified forms. An enhancement in thermal stability
was observed for the modified forms. They also determined increased C50 values
(concentration of organic cosolvent required to inactivate the enzyme by 50%) for the
modified enzymes in the co-solvent systems tested (acetonitrile, DMF & THF), each at
50% (v/v).
A more recent technique known as cross-linked enzyme crystal technology (CLEC®),
involves the cross-linking of enzymes in their crystalline state to produce particles which
are insoluble in both water and organic solvents. This process consists of two major steps:
first, the crystallization of the enzyme followed by the chemical cross-linking of the
crystals with a suitable cross-linking reagent (e.g. glutaraldehyde) in such a manner that
protein activity is maintained and the crystalline lattice is not disrupted. This process
results in both stabilisation and immobilisation of the enzyme without dilution of activity.
Channels formed within the CLEC® allow for easy diffusion of substrates and products.
(Govardhan, 1999; Kim et al., 2003; O’Fagain, 2003).
33
Kim et al. (2003) used this method to synthesise CLECs of cyclodextrin glucanotransferase
(CGTase). They studied the effect of temperature on the stability of CGTase-CLECs and
soluble CGTase. At 70°C CGTase-CLECs retained more than 70% of its original activity
as compared to soluble CGTase, where an 85% loss in activity was exhibited at the same
temperature. Soluble CGTase exhibited no activity at 80°C whilst CGTase-CLECs
retained 48% of its original activity at the same assay temperature. They also investigated
the activity of both enzymes in 15% (v/v) solutions of water miscible organic solvents. The
cross-linked enzyme was found to be stable in all of the tested solvents (2-butanol, DMSO,
formamide, isopropanol) retaining more than 80% of its original activity, whereas soluble
CGTase lost more than 50% of activity in the same solvents.
1 .6 .4 .4 . P E G y l a t io n o f b n y z m e s
Enzymes are becoming the main tools for specific bioconversion in organic synthesis;
however, they suffer from insolubility in most organic solvents (Veronese, 2001). Linking
an enzyme to the amphipathic compound polyethylene glycol (PEG) has led to solubility in
both aqueous solutions and organic solvents. The solubility of enzymes in organic solvents
is due to the strongly hydrated PEG chains creating an aqueous shell around the enzyme
molecule thus protecting it from denaturation by the organic solvent (Ogino & Ishikawa,
2001). It has been found that PEG-modified enzymes are also generally more stable
against temperature that their native counterparts (Zhang et al., 1999). Attachment of the
long-chain PEG molecule to an enzyme molecule surface may make the protein less
flexible, thus minimizing unfolding and thereby enhancing the stability of the enzyme at
high temperatures (Yang et al., 1996).
34
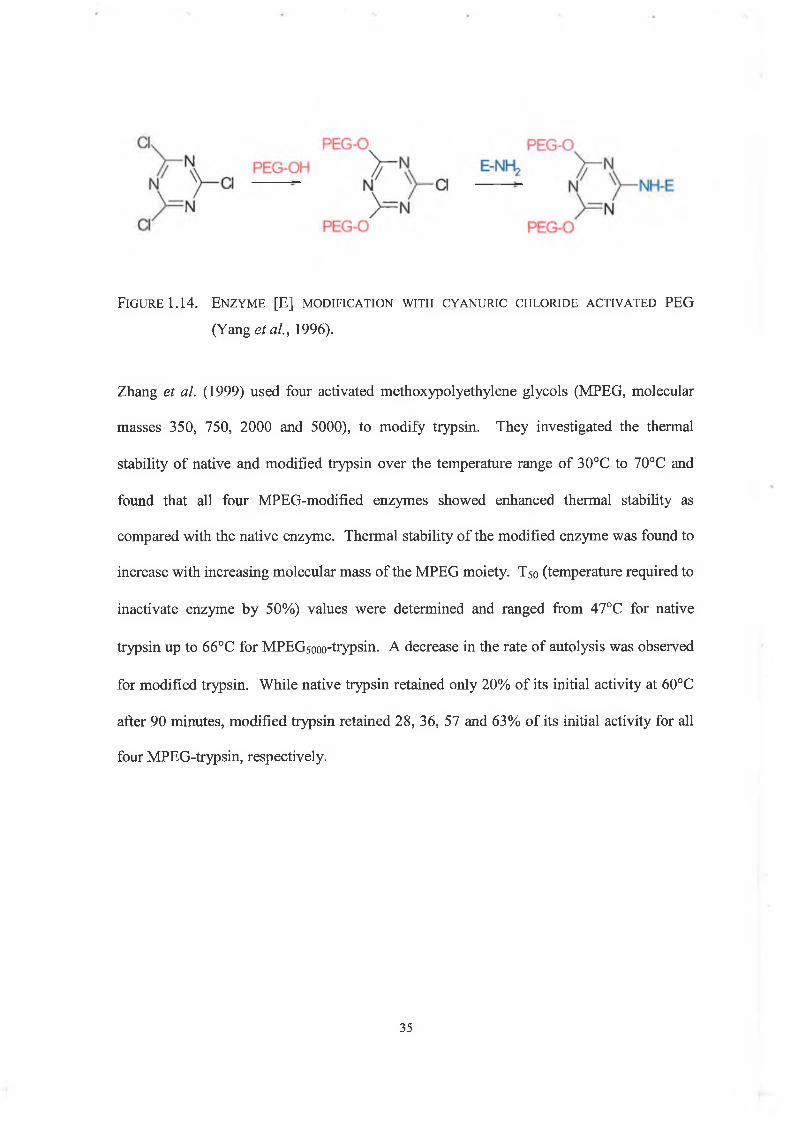
F ig u r e 1.14. E n z y m e [E ] m o d if ic a t io n w it h c y a n u r ic c h l o r id e a c t iv a t e d PEG
(Yang et al., 1996).
Zhang et al. (1999) used four activated methoxypolyethylene glycols (MPEG, molecular
masses 350, 750, 2000 and 5000), to modify trypsin. They investigated the thermal
stability of native and modified trypsin over the temperature range of 30°C to 70°C and
found that all four MPEG-modified enzymes showed enhanced thermal stability as
compared with the native enzyme. Thermal stability of the modified enzyme was found to
increase with increasing molecular mass of the MPEG moiety. T50 (temperature required to
inactivate enzyme by 50%) values were determined and ranged from 47°C for native
trypsin up to 6 6 °C for MPEGsooo-trypsin. A decrease in the rate of autolysis was observed
for modified trypsin. While native trypsin retained only 20% of its initial activity at 60°C
after 90 minutes, modified trypsin retained 28, 36, 57 and 63% of its initial activity for all
four MPEG-trypsin, respectively.
35
1.7. Protein Engineering
Protein engineering involves using genetic manipulation techniques to alter the protein of
interest in specific ways. This can be accomplished by site-directed mutagenesis, random
mutagensis and directed evolution. Site directed mutagenesis allows the introduction of
one or more defined changes at a time. Random mutagenesis is a broader method of
introducing changes into the enzyme and involves the introduction of random mutations
followed by screening the resultant mutants. These methods have been used to improve
enzyme stability, substrate specificity and to create novel and efficient catalysts (Sears &
Wong, 1996; O’Fagain, 1997c). Sears and Wong (1996), Van Den Burg and Eijsink (2002)
and Torrez et al. (2003) have all written reviews dealing with this area.
1.8. Application of Proteases
Enzymes have been used in the industrial field for many applications e.g. brewing, animal
feeds and detergents. The composition of dirt and stains on most clothes includes lipids,
carbohydrates, proteins, dyes, soil and small inert particles. Normal detergents do not
remove proteinaceous stains. However, the addition of enzymes such as bacterial alkaline
proteases e.g. subtilisins from Bacillus licheniformis and Bacillus amyloliquifaceins has led
to better cleansing power of these detergents by hydrolytic degradation of difficult protein-
containing solids, e.g. blood, egg-yolk and chocolate (Khaparde & Singhal, 2001).
Developments in molecular biology have led to the application of proteolytic enzymes as
therapeutic agents. Proteases have been used as an alternative to mechanical debridement,
to aid in the removal of dead skin in bums patients. Success of this treatment was variable,
possibly due to the poor stability of the enzymes used. However, recombinant vibriolysin,
a proteolytic enzyme from Vibrio proteolyticus, a marine micoorganism, was assessed
topically in phase 1 clinical trials, for use as a debridement agent. Tolerability and36
effectiveness of this topically applied enzyme for the debridement of bums has shown
encouraging results (Vellard, 2003).
As industrialization of the planet has grown, so too has concern for the environment.
Hence, finding more benign methods for the production and provision of services has led to
further interest in enzymes. A number of examples exist where the use of enzymes has
made a significant difference environmentally: laundry detergents where phosphates have
been replaced with enzymes (proteases) and breadmaking where lipases have replaced
chemical emulsifiers. This list is evergrowing and will continue to bring with it significant
medical, social and environmental benefits (Cherry & Fidantsef, 2003).
This research describes the investigation and possible applications of two interesting
candidate proteases, a proline-specific serine protease dipeptidyl peptidase IV (DPP IV)
and a recombinant parasite cysteine protease cathepsin LI (rFheCLl), neither of which
undergo autolysis.
37
1.9. Mammalian Dipeptidyl Peptidase IV (DPP IV)
Dipeptidyl peptidase IV [DPP IV, EC 3.4.14.5] was first discovered by Hopsu-Havu and
Glenner (1966) in rat homogenates and in commercial enzyme preparations as an activity
liberating naphthylamine from Gly-Pro-2-naphthylamide and was initially termed
glycylproline naphthamidase (Mentlein, 1999). It has also been known under different
names such as "dipeptidyl aminopeptidase IV", "post-proline dipeptidyl aminopeptidase
IV", "X-Pro dipeptidyl aminopeptidase" and "Gly-Pro naphthylamidase" (Sentandreu &
Toldra, 2001).
Since the amino acid sequence Gly-Pro is frequently found in collagens, a possible
metabolic significance in collagen metabolism was proposed. However, the enzyme is
unable to cleave Pro-Pro or Pro-Hyp bonds which mostly follow the Gly-Pro sequence in
collagens and hence the physiological functions of dipeptidyl peptidase IV remained
obscure for many years (Mentlein, 1999). Dipeptidyl peptidase IV has been isolated from
various mammalian species and is present in most vertebrate tissues and body fluids;
however, their activities often vary (Mentlein, 1999). The enzyme fulfils a variety of
functions including the activation and inactivation of a number of bioactive peptides, e.g. P-
casomoiphin and substance P (Lambeir et al., 2003). Inhibition of DPP IV activity
increases insulin secretion, improving glucose control in diabetics. Thus, inhibition of DPP
IV is a promising new strategy for treating type 2 diabetes (Rasmussen et al., 2003)
The entire amino acid sequence of DPP IV for human, rat and mouse have been determined
by cDNA cloning and sequencing. CD 26, a surface marker of T lymphocytes was found to
be identical to DPP IV. DPP IV is a homodimeric type II transmembrane glycoprotein
located on the surface of tissues. The enzyme is anchored to the membrane by a single
hydrophobic helix with a short N-terminal cytoplasmic tail. The extracellular domain
consists of a flexible stalk linking the membrane anchor to a highly glycosylated region38
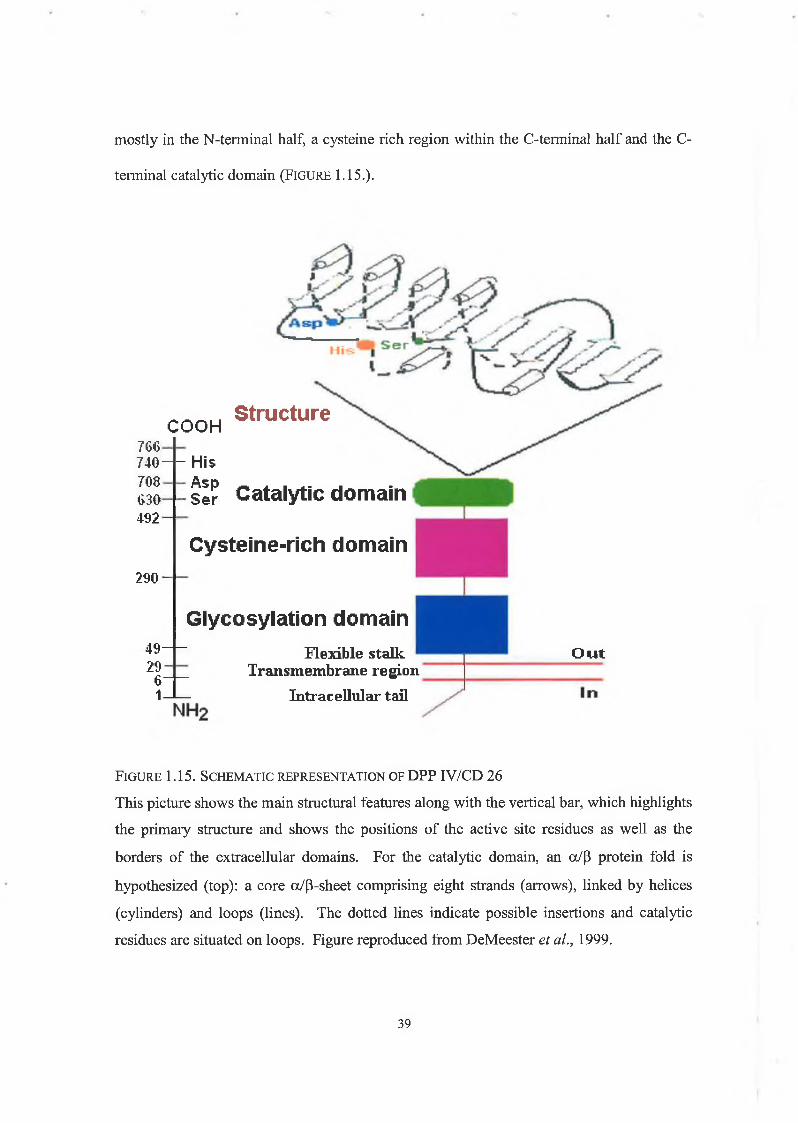
mostly in the N-terminal half, a cysteine rich region within the C-terminal half and the C-
terminal catalytic domain (F ig u r e 1.15.).
COOH766- 740—1— His 708 Asp 630 492
Structure
290
ser Catalytic domain
Cysteine-rich domain
Glycosylation domain49-29
61-
Flexible stalk Transmembrane region
Intracellular tail
Out
F ig u r e 1 .15. S c h e m a t ic r e p r e s e n t a t io n o f DPP IV/CD 26
This picture shows the main structural features along with the vertical bar, which highlights
the primary structure and shows the positions of the active site residues as well as the
borders of the extracellular domains. For the catalytic domain, an a/p protein fold is
hypothesized (top): a core a/p-sheet comprising eight strands (arrows), linked by helices
(cylinders) and loops (lines). The dotted lines indicate possible insertions and catalytic
residues are situated on loops. Figure reproduced from DeMeester et al., 1999.
39
Proteolytic cleavage of the membrane bound DPP IV results in a soluble protein migrating
as a homodimer with a molecular weight range of 210-290kDa. Both membrane-bound and
the soluble forms show identical enzymatic activity (Lambeir et al., 1997; Engel et al.,
2003; Lambeir et al., 2003; Rasmussen et al., 2003).
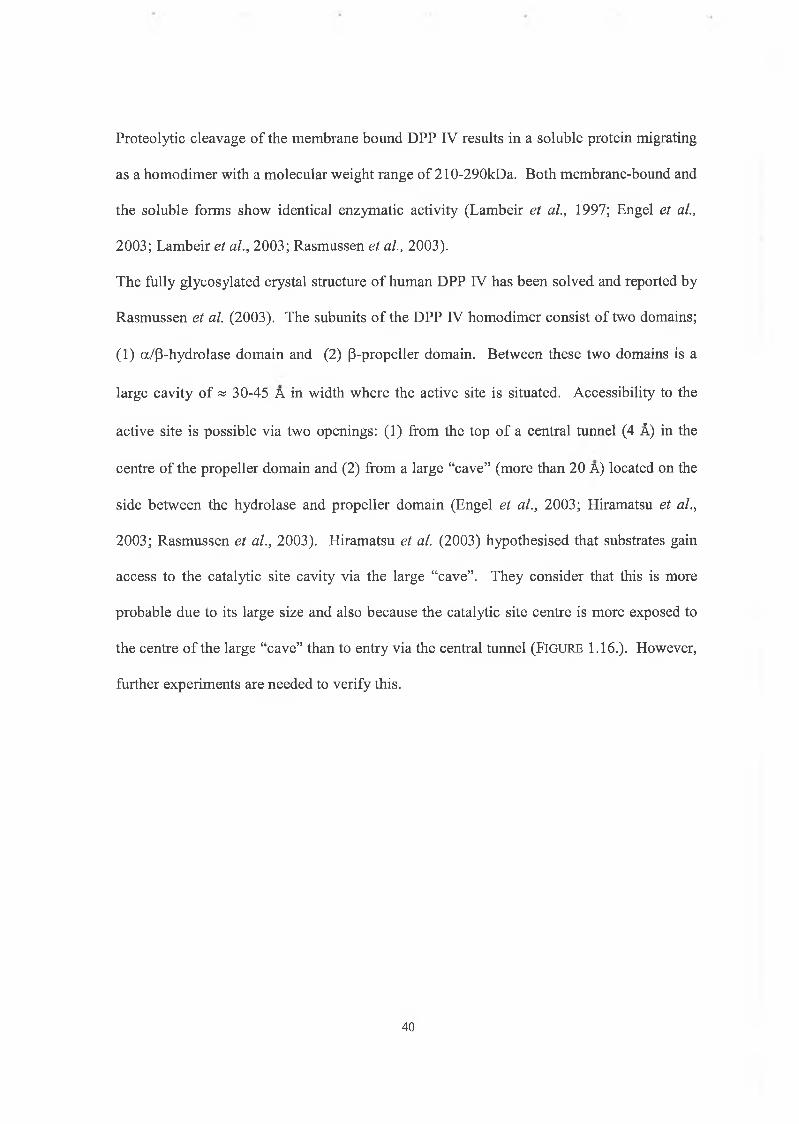
The fully glycosylated crystal structure of human DPP IV has been solved and reported by
Rasmussen et al. (2003). The subunits of the DPP IV homodimer consist of two domains;
(1) a/p-hydrolase domain and (2) (3-propeller domain. Between these two domains is a
large cavity of » 30-45 A in width where the active site is situated. Accessibility to the
active site is possible via two openings: (1) from the top of a central tunnel (4 A) in the
centre of the propeller domain and (2) from a large “cave” (more than 20 A) located on the
side between the hydrolase and propeller domain (Engel et al., 2003; Hiramatsu et al.,
2003; Rasmussen et al., 2003). Hiramatsu et al. (2003) hypothesised that substrates gain
access to the catalytic site cavity via the large “cave”. They consider that this is more
probable due to its large size and also because the catalytic site centre is more exposed to
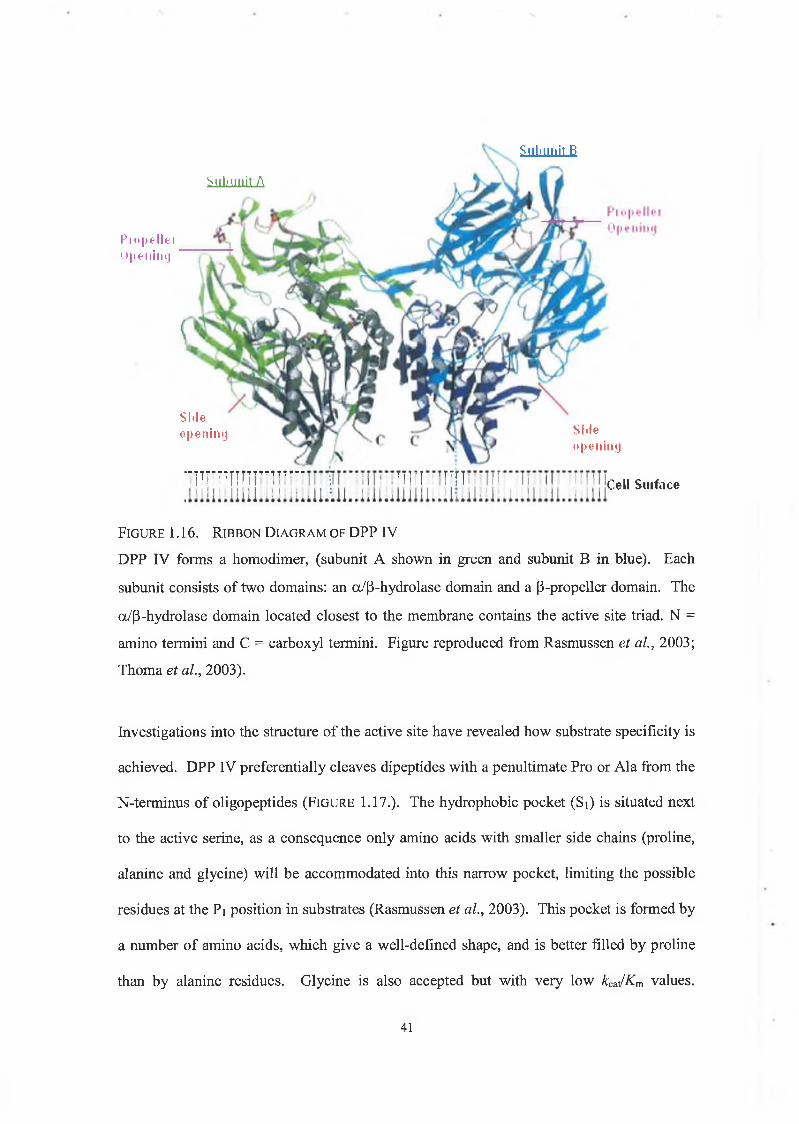
the centre of the large “cave” than to entry via the central tunnel (F ig u r e 1.16.). However,
further experiments are needed to verify this.
40
Pi o |> e lie iOpeniii'j
F ig u r e 1.16. R ib b o n D ia g r a m o f DPP IV
DPP IV forms a homodimer, (subunit A shown in green and subunit B in blue). Each
subunit consists of two domains: an a/(3-hydrolase domain and a P-propeller domain. The
a/p-hydrolase domain located closest to the membrane contains the active site triad. N =
amino termini and C = carboxyl termini. Figure reproduced from Rasmussen et al., 2003;
Thoma et al., 2003).
Investigations into the structure of the active site have revealed how substrate specificity is
achieved. DPP IV preferentially cleaves dipeptides with a penultimate Pro or Ala from the
N-terminus of oligopeptides (F ig u r e 1.17.). The hydrophobic pocket (Si) is situated next
to the active serine, as a consequence only amino acids with smaller side chains (proline,
alanine and glycine) will be accommodated into this narrow pocket, limiting the possible
residues at the Pj position in substrates (Rasmussen et al., 2003). This pocket is formed by
a number of amino acids, which give a well-defined shape, and is better filled by proline
than by alanine residues. Glycine is also accepted but with very low kcJ K m values.
T T ^ T T T T - - [ T i l l r n u
Sitle openimj
" T T H T T T n
Si<leopening
Cell Surface
Subunit A
Subunit B
41
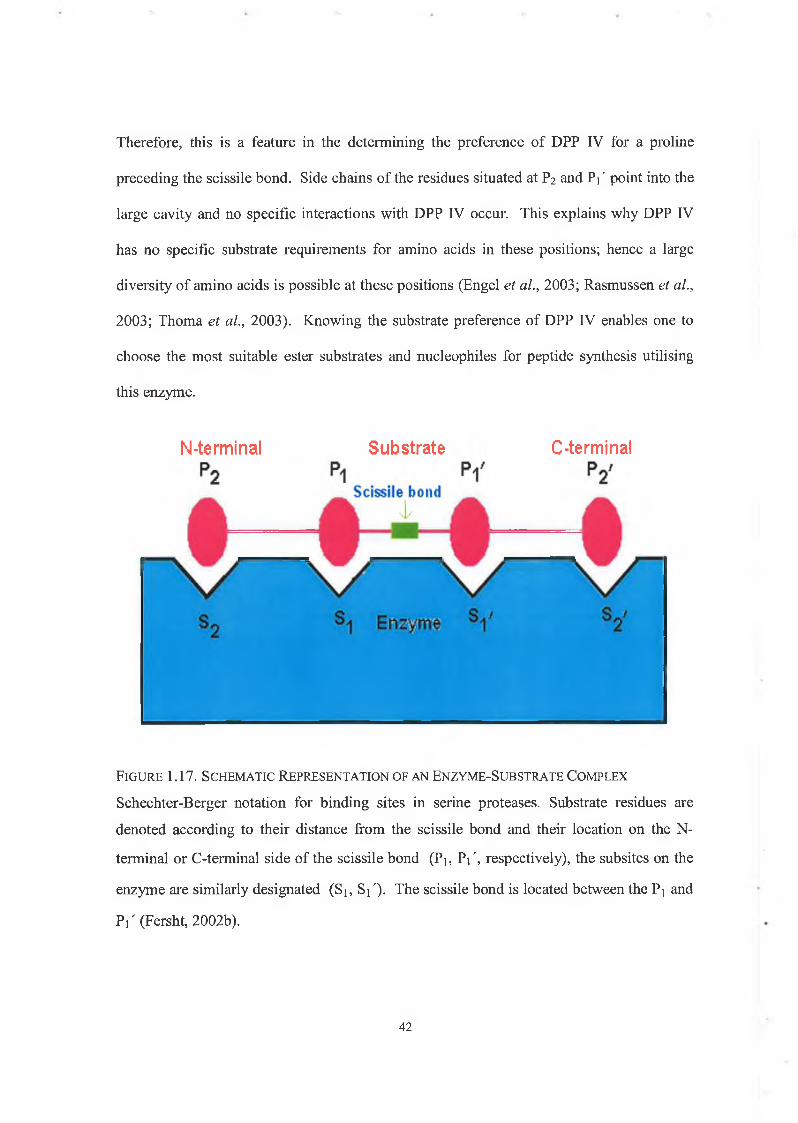
Therefore, this is a feature in the determining the preference of DPP IV for a proline
preceding the scissile bond. Side chains of the residues situated at P2 and Pi' point into the
large cavity and no specific interactions with DPP IV occur. This explains why DPP IV
has no specific substrate requirements for amino acids in these positions; hence a large
diversity of amino acids is possible at these positions (Engel et al., 2003; Rasmussen et al.,
2003; Thoma et al., 2003). Knowing the substrate preference of DPP IV enables one to
choose the most suitable ester substrates and nucleophiles for peptide synthesis utilising
this enzyme.
N-terminal Substrate C-terminal
F ig u r e 1 .17. S c h e m a t ic R e p r e s e n t a t io n o f a n En z y m e -S u b s t r a t e C o m p l e x
S c h e c h te r -B e rg e r n o ta tio n fo r b in d in g s ite s in se rin e p ro te a se s . S u b s tra te re s id u e s a re
d e n o te d a c c o rd in g to th e ir d is ta n c e f ro m th e sc iss ile b o n d a n d th e ir lo c a tio n o n th e N -
te rm in a l o r C -te rm in a l s id e o f th e sc is s ile b o n d (P), P]', re sp e c tiv e ly ) , th e su b s ite s o n th e
e n z y m e a re s im ila r ly d e s ig n a te d (S i , S i ') . T h e sc iss ile b o n d is lo c a te d b e tw e e n th e P] an d
P i' (F e rsh t, 2 0 0 2 b ).
42
1.10. Fluke (Fasciola hepatica) Cathepsin LI
The helminth parasite Fasciola hepatica is the causative agent of liver fluke disease in
cattle and sheep and has recently emerged as an important pathogen of humans. This
infection causes a loss of millions to the agricultural sector worldwide. The protease
cathepsin L [3.4.22.15] a lysosomal cysteine protease belonging to the papain superfamily
is secreted by this parasite. It plays an important role in many aspects of its pathogenicity,
such as nutrient acquisition by catabolizing host proteins to absorbable peptides. Cathepsin
L also cleaves matrix proteins such as fibronectin and collagen thereby facilitating the
migration of this parasite through host tissue e.g. liver and intestine and has been implicated
in the inactivation of host immune defences by cleaving immunoglobulins. (Dowd et al.,
1994; Dowd et al., 2000; Dalton et al., 2003; Collins et al., 2004). Cathepsin L has been
isolated from mammalian tissues such as rabbit, human and rat liver (Mason et al., 1984;
Mason et al., 1985; Bromme et al., 1993). The enzyme is also present in vertebrate tissues
(fish) such as Carp hepatopancreas (Aranishi et al., 1997).
Cathepsin L has only endopeptidase activity and preferentially cleaves peptide bonds with
hydrophobic amino acid residues in P2 and P3 sites (Mort, 1998). It is synthesised as
procathepsin L, and requires activation to the active monomer. Activation involves
regeneration of the reactive thiol fuction (blocked as disulfide or metal complex) by
addition of activators such as DTT together with chelate forming reagents e.g. EDTA
(Creighton, 1993b). The crystal structure of human cathepsin L reveals that it contains two
domains, (1) a-helical domain and (2) (3-barrel domain. The domains separate on the top in
a “V”-shaped active site cleft. The catalytic cysteine residue is situated at the top of the
central a-helix and faces the catalytic histidine residue, forming the active site (FIGURE
1.18.) (Guncar et al., 1999; Turk et al., 2002).
43
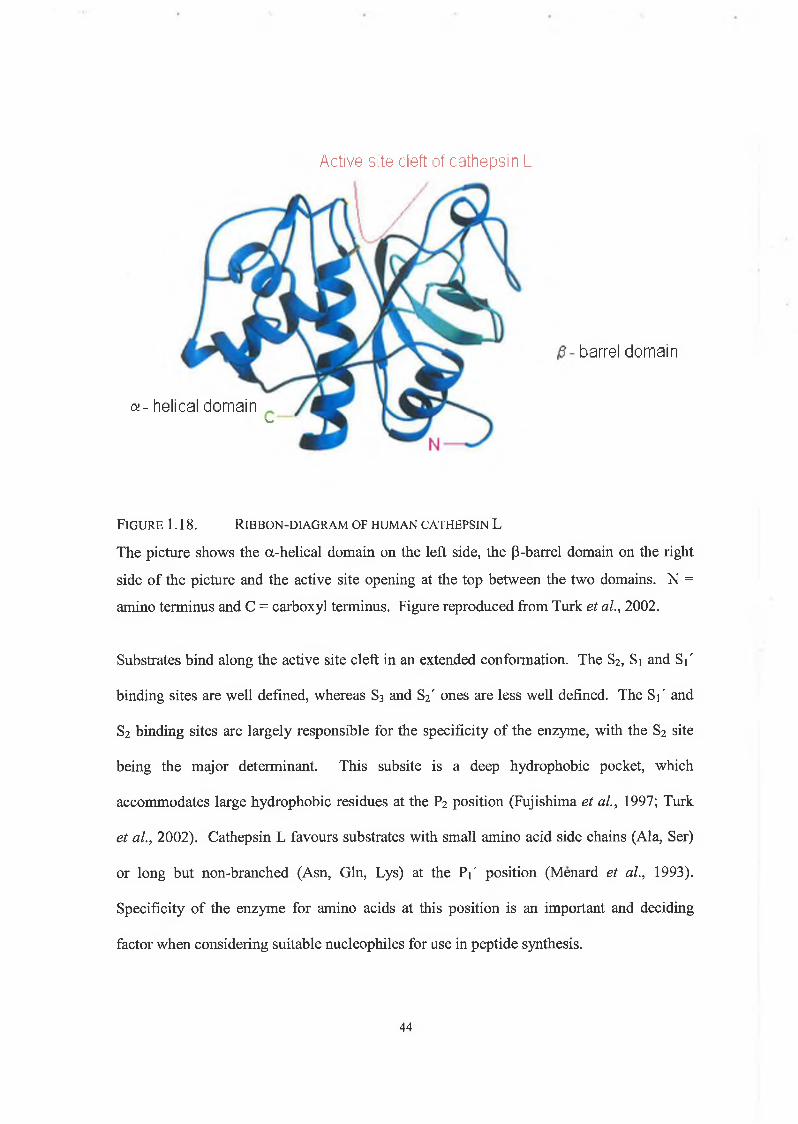
Active site cleft of cathepsin L
barrel domain
a - helical domainV
F ig u r e 1 .18 . R ib b o n -d ia g r a m o f h u m a n c a t h e p s in L
The picture shows the a-helical domain on the left side, the (3-barrel domain on the right
side of the picture and the active site opening at the top between the two domains. N =
amino terminus and C = carboxyl terminus. Figure reproduced from Turk et al., 2002.
Substrates bind along the active site cleft in an extended conformation. The S2, Si and ST
binding sites are well defined, whereas S3 and S2' ones are less well defined. The ST and
S2 binding sites are largely responsible for the specificity of the enzyme, with the S2 site
being the major determinant. This subsite is a deep hydrophobic pocket, which
accommodates large hydrophobic residues at the P2 position (Fujishima et al., 1997; Turk
et al., 2002). Cathepsin L favours substrates with small amino acid side chains (Ala, Ser)
or long but non-branched (Asn, Gin, Lys) at the P i' position (Menard et al., 1993).
Specificity of the enzyme for amino acids at this position is an important and deciding
factor when considering suitable nucleophiles for use in peptide synthesis.
44
1.11. DPP IV and rFheCLl as candidates for study
Considering the cheap and ample supply of the crude materials from which both dipeptidyl
peptidase IV (DPP IV) and cathepsin L enzymes are sourced, investigation of their stability
characteristics and classic enzyme kinetics in-vitro has been neglected to date. Due to the
high selectivity of many proteases and their inability to cleave peptide bonds involving
proline, it is not surprising that specific enzymes are involved in the cleavage of proline-
containing peptide bonds, although they are few in number. Therefore, it was deemed a
worthwhile project to investigate these stability and kinetic parameters for DPP IV, owing
to its substrate specificity towards proline-containing bonds. This enzyme can also be
considered as a suitable candidate to catalyse peptide synthesis, as the active site of many
enzymes may not fit the bulky amino acid proline residue.
The development of a potential liver fluke vaccine targeting the fluke {Fasciola hepatica)
cathepsin LI protease is being undertaken at present. Yeast systems have been successfully
employed for high-level expression of recombinant Fasciola hepatica cathepsin LI
(rFheCLl) with a view to targeting vaccines against the recombinant enzyme (rFheCLl).
Therefore, elucidating the stability characteristics (pH, temperature, solvent) of this
recombinant enzyme is essential for comparison to fluke (Fasciola hepatica) cathepsin LI
and also ascertaining its shelf-life as stability is a key attribute of any vaccine. The notable
stability of fluke {Fasciola hepatica) cathepsin LI makes rFheCLl a useful candidate for
chemical modification and peptide synthesis. Also, a review of the literature has indicated
that very few cysteine proteases have been used for enzymatic peptide synthesis when
compared with serine proteases, again making this enzyme a suitable candidate for
enzymatic peptide synthesis.
The aims of the research described in this thesis involve exploring and elucidating the
stability of bovine serum dipeptidyl peptidase IV (DPP IV) and recombinant Fasciola45
hepatica cathepsin LI (rFheCLl). DPP IV was fully investigated with regards to the
stability of the enzyme at elevated temperatures (Results; section 4.1.2.), and in the
presence of organic solvents commonly used in peptide synthesis (Results; section 4.1.3.).
The effect of pH on the enzyme’s stability and kinetic parameters was also determined at
acidic, neutral and alkaline pH (Results; section 4.1.4.). The stability characteristics of both
native and chemically modified rFheCLl were studied. The effect of exposing both forms
of the enzyme to increasing temperatures (Results; section 5.2.4 & 6.2.4., respectively) and
organic solvents (Results; section 5.2.5. & 6.2.5., respectively) was fully elucidated and a
comparison made. Hence, the direct effect of chemical modification upon the enzyme was
determined. Chapter seven clearly outlines the usefulness of rFheCLl with regards to
enzymatic peptide synthesis.
46
C ha pter 2
Material a n d M e th o d s
2 .1 . E q u i p m e n t
Centrifugations were performed using an ALC Multispeed PK 121 bench centrifuge
(modification studies) and Beckman J2-MC high-speed centrifuge (serum isolation). Gel
electrophoresis was performed using a Biorad Mini Gel Box with ATTO vertical
electrophoresis system and power pac 1000. Images of gels were taken with Plustek
OpticPro 482p scan maker (DPP IV) or Pharmacia Biotech Imagemaster® Video
Documentation System for gel electrophoresis (rFheCLl). Enzyme and protein assays
were performed using a Perkin Elmer LS-50 Luminescence Spectrometer, Unicam2
UV/Vis spectrophotomer and Labsystems Multiskan MS microplate reader. A Coming pH
Meter 240 determined pH of buffers and solutions. LC-MS analysis utilised a Bruker Mass
Spectrometer with electrospray ionisation and ion-trap detector linked to a Hewlett-Packard
Esquire Liquid chromatograph 1100 with photo diode array detector.
2 .2 . M a t e r i a l s
Suppliers of key chemicals used in these studies are listed below.
Amersham Biosciences UK Ltd., Bucks, England.
Sephadex™ G-25 Superfine
Bachem Feinchemikalein AG (Bebendorf, Switzerland)
Gly-Pro-AMC-HBr, Z-Lys-ONp HCl, Z-Phe-Arg-AMC-HCl, Z-Phe-Arg-OMe-HCl, H-
SerNHrHCl
47
Sodium sulphite
Fisher Scientific UK Ltd., Loughborough, England.
Acetic acid glacial, acetone, acetonitrile HPLC grade, dimethylformamide HPLC grade
(DMF), diaminoethanetetra-acetic acid (EDTA), ethanol 100% (v/v), glycerol, hydrochloric
acid (HC1 37%, (v/v)), sodium acetate anhydrous, sodium chloride (NaCl), sodium
hydroxide (NaOH), tetrahydrofuran HPLC Grade (THF), Tris-(hydroxymethyl)
aminomethane (Tris).
Kepak Meats (Clonee, Co. Meath, Ireland)
Bovine Whole Blood
Pierce Chemical Company, Illinois, USA.
BCA (Bicinchoninic acid) Protein Assay Kit, GelCode®, Blue Stain Reagent.
Riedel-de-Haen, Laborchemikalien, GmbH.
Acetonitrile CHROMASOLV®, water CHROMASOLV®.
Sigma Chemical Company (Poole, Dorset, England)
2-Mercaptoethanol, 7-amino-4-methylcoumarin (AMC), Acrylamide/bis-Acrylamide 30%
(w/v) solution, Na-Acetyl-L-Lysine, albumin bovine serum (BSA), ammonium acetate,
ammonium persulfate, ammonium sulfate, borax, Bradford reagent, brilliant blue R,
bromophenol blue, cellulose membrane dialysis tubing (33mm x 21mm), 2-[N-
Cyclohexylamino] ethane-sulfonic acid (CHES), dimethylsulfoxide HPLC grade (DMSO),48
BDH Limited Ltd., Poole, Dorset, England
DL-dithothreitol (dl-DTT), iran,s-epoxysuccmyl-L-leucylamido-(4-Guanidino)-butane (E-
64), ethylene glycol-bis(succinic acid N-hydroxysuccinimide ester) (EG-NHS), glycine, N-
[2-Hydroxyethyl]piperazine-N'-[2-ethane-sulfonic acid] (HEPES), 2-[N-Morpholino]
ethanesulfonic acid (MES), 3-[N-Morpholino] propanesulfonie acid (MOPS),
pierylsulfonic acid (2,4,6-Trinitrobenzenesulfonic acid; TNBS), phenyl-Sepharose® CL-
4B, polyethylene glycol (m.w 10,000), potassium phophate monobasic (KH2PO4),
potassium phosphate dibasic (K2HPO4), quaternary-Sepharose fast flow anion exchanger,
Sephacryl S-300-HR, sodium bicarbonate, sodium dodecyl sulfate (SDS), sodium
phosphate monobasic (NaH2P0 4 ), SigmaMarker™ low range (m.w. 6,500- 66,000),
SigmaMarker™ wide range (m.w. 6,500-205,000), total protein reagent, trypsin (Bovine),
N,N,N',N' -tetramethylene-ethylenediamine (TEMED).
All reagents were analytical reagent grade unless otherwise stated.
49
2.3.1. P u r i f i c a t i o n o f B o v i n e S e r u m D i p e p t i d y l P e p t i d a s e IV (DPP IV)
2.3. P u r i f i c a t i o n a n d A c t i v a t i o n
The purification of dipeptidyl peptidase IV (DPP IV) was based on the method of Buckley
et al., (2004) and includes the following steps in sections 2.3.1.1, 2.3.1.2, 2.3.1.3 and
2.3.1.4.
2.3.1.1. Serum Preparation
Bovine whole blood was collected from a freshly slaughtered animal and transported to a
4°C cold room. A clot was allowed to form and shrink over 24 hours. The remaining
unclotted whole blood was then decanted and centrifuged at 6000 rpm for 1 hour using a
Beckman J2-MC refrigerated centrifuge fitted with a JL-10.5 rotor (radius 10cm). The
supernatant and loose cellular debris was decanted and re-centrifuged at 2 0 ,0 0 0 rpm for 15
minutes at 4°C using a JL-20 rotor (radius 6cm). The serum thus produced was collected,
pooled and stored in 20ml aliquots at -20°C.
2.3.1.2 Phenyl Sepharose Hydrophobic Interaction Chromatography (HIC)
A 30ml phenyl-Sepharose® CL-4B hydrophobic interaction column (2.5cm x 13cm) was
equilibrated with 100ml 50mM HEPES, pH 8.0, containing 5mM EDTA and 1M
ammonium sulphate at a flow rate of 2ml/min. A 20ml aliquot of crude serum was thawed
at 37°C and solid ammonium sulphate was added to give a final ammonium sulphate
concentration of 0.5M. Salted serum (20ml) was applied to the equilibrated column
followed by a 100ml wash of the equilibration buffer to elute any unbound protein. Bound
protein was eluted using a 50ml linear gradient of 50mM HEPES, pH 8.0, containing 5mM
EDTA and 1M ammonium sulphate to 50mM HEPES, pH 8.0, containing 5mM EDTA. A
further 50ml wash of 50mM HEPES, pH 8.0, containing 5mM EDTA ensured all bound
protein was eluted. Fractions (4ml) were collected throughout the run. Loading, washing
and elution steps were earned out at a flow rate of 1.5ml/min. Fractions were assayed for
DPP IV activity as described in section 2.4.3. Protein was determined using the Biuret
assay as described in section 2.4.2.1. Fractions containing Gly-Pro-AMC degrading
activity were combined and the volume recorded to yield post-phenyl Sepharose DPP IV.
The phenyl-Sepharose resin was regenerated with a 100% ethanol (v/v) wash and then re
equilibrated with 100ml 50mM HEPES, pH 8.0, containing 5mM EDTA and 1M
ammonium sulphate at a flow rate of 2ml/min.
2.3.1.3. Sephacryl S-300 High Resolution (HR) Gel Filtration Chromatography
The post-phenyl-Sepharose DPP IV (typically 35ml) was dialysed against 50mM HEPES,
pH 8.0, containing 5mM EDTA (2 litres) for a minimum of 3 hours at 4°C to remove
interfering salts. The dialysed sample was then concentrated via osmosis using solid
polyethylene glycol. Glycerol was added to the concentrated sample to give a final
glycerol concentration of 10% (v/v). The 100ml Sephacryl S-300-HR gel filtration column
was equilibrated with 200ml 50mM HEPES, pH 8.0, containing 5mM EDTA at a flow rate
of 2ml/min. The concentrated sample was loaded under the buffer head and the column
washed with 150ml equilibration buffer at a flow rate of 1.5ml/min. Fractions of 5ml were
collected and assayed for DPP IV activity as described in section 2.4.3. Protein was
determined using the standard BCA assay as described in section 2.4.2.2. Fractions
containing Gly-Pro-AMC degrading activity were combined and the volume recorded to
yield post-Sephacryl S-300 DPP IV and stored at 4°C.
51
2.3.1.4. Quaternary (Q) Sepharose Strong Anion Exchange Chromatography
The post-Sephaeryl S-300 DPP IV was concentrated via osmosis using solid polyethylene
glycol. A 30ml Q-Sepharose strong anion exchange column (2.5cm x 13cm) was
equilibrated with 100ml 50mM HEPES, pH 8.0, containing 5mM EDTA. The concentrated
sample was applied onto the column followed by a 100ml wash with equilibration buffer.
Bound protein was eluted using a 50ml linear gradient of 50mM HEPES, pH 8.0,
containing 5mM EDTA to 50mM HEPES, pH 8.0, containing 5mM EDTA and 0.5M NaCl.
A further 50ml wash of 50mM HEPES, pH 8.0, containing 5mM EDTA and 0.5M NaCl
ensured all bound protein was eluted. Fractions (4ml) were collected throughout the run.
Loading, washing and elution steps were carried out at a flow rate of 1.5ml/min. Fractions
were assayed for DPP IV activity as described in section 2.4.3. Protein was determined
using the standard BCA assay as described in section 2.4.2.2. Fractions containing Gly-
Pro-AMC degrading activity were combined and the volume recorded. The post-Q-
Sepharose DPP IV pooled fractions (typically 50ml) were dialysed against 50mM HEPES,
pH 8.0, containing 5mM EDTA (2 litres) for a minimum of 3 hours at 4°C to remove
interfering salts and stored at -20°C until required. The Q-Sepharose resin was regenerated
with 2M NaCl and re-equilibrated with equilibration buffer. Future reference to purified
DPP IV indicates post-Q-Sepharose DPP IV.
52
2.3.2. A c t i v a t i o n o f rFasciota hepatica Cathepsin LI (rFheCLl)
Mr Peter Collins, Parasitology Research Group, formerly based at Dublin City University
performed the purification step and generously supplied purified unactivated recombinant
Fasciola hepatica Cathepsin LI (rFheCLl) as a gift. rFheCLl was activated to a protein
concentration of 0.1 mg/nil preparation based on a method by . Example of activation
procedure:
Composition
rFheCLl (0.5mg/ml)
DTT(lOOmM)
EDTA (500mM)
Volume
0 .1ml
0.04ml
0 .0 1 ml
These solutions were combined and made up to total volume of 0.5ml with 0.1M sodium
acetate, pH 5.0. The solution was then incubated at 37°C for 2 hours, when the preparation
was stored at -20°C until use.
Final Concentration
0.1 mg/ml
8m M
lOmM
53
2 .4 .1 . F l u o r e s c e n c e Q u a n t i f ic a t io n o f 7 -A m i n o -4 - M e t h y l - C o u m a r in
2.4.1.1. AMC Standard Curves
AMC (lOmM in 100% DMSO (w/v)) was diluted to 100/xM using 50mM HEPES, pH 8.0,
containing 5mM EDTA when analysing dipeptidyl peptidase IV (DPP IV) or 0.1M sodium
acetate, pH 5.0 containing 2mM DTT and 2.5mM EDTA when analysing recombinant
Fasciola hepatica cathepsin LI (rFheCLl). Stock solutions were stored in brown glass
containers at 4°C to minimise any fluorescence. To form standard curves of 0-15/xM, lower
AMC concentrations were prepared using 50mM HEPES, pH 8.0, containing 5mM EDTA
or 0.1M sodium acetate, pH 5.0, containing 2mM DTT and 2.5mM EDTA. All curves were
prepared in a 96-well microplate in triplicate as follows:
• 25^1 Buffer (HEPES or sodium acetate as above)
• lOOjul appropriate AMC concentration
• 175/xl 1.7.M acetic acid
Fluorometric analysis of these samples was achieved using a Perkin Elmer LS-50
Luminescence Spectrometer at excitation and emission wavelengths of 370nm and 440nm,
respectively. The excitation slit width was maintained at lOnm while the emission slit
width was adjusted according to the fluorescence intensity observed.
2.4 . G e n e r a l A ssa y s
54
2.4.1.2. Inner Filter Effect
The inner filter effect or ‘quenching5 was determined as in section 2.4.1.1; however, 25fil
buffer was substituted by 25^1 crude bovine serum/enzyme sample. These samples were
also prepared and assayed in triplicate.
2.4.1.3. AMC Excitation and Emission Wavelengths
The optimum AMC excitation and emission wavelengths were determined using the scan
function option of the fluorimeter. A 5j.lM AMC solution was prepared by 1:20 dilution of
the 1 OOpM stock solution using 50mM HEPES, pH 8.0, containing 5mM EDTA or 0.1M
sodium acetate, pH 5.0 containing 2mM DTT and 2.5mM EDTA. A pre-scan was
performed on 1.5ml of 5|J.M AMC placed in a glass cuvette. The excitation wavelength
obtained from the pre-scan was set and an emission scan was performed from 400-600nm
at 5nm increments. Similarly an excitation scan was performed between 300nm and 500nm
using the previously determined optimum emission wavelength. Optimum wavelengths
were taken to be those at which fluorescence was at a maximum.
2.4.2. P r o t e i n D e t e r m i n a t i o n
2.4.2.1. Biuret Assay
The Biuret assay was used to quantify the protein concentration in samples of 2-10mg/ml.
These samples include bovine serum and post-phenyl Sepharose pooled samples (DPP IV
purification). Samples (typically 20-35ml) were dialysed against 50mM HEPES, pH 8.0
containing 5mM EDTA (2 litres) for a minimum of 3 hours at 4°C to remove possible
interfering substances such as incompatible buffers or salts. This assay was also used to
determine the protein concentration of rFheCLl samples. Samples with a protein55
concentration higher than lOmg/ml were diluted with the appropriate buffer to achieve a
suitable protein concentration with respect to the assay limits. To quantify the protein
concentration, a BSA standard curve was included from O-lOmg/ml in triplicate. The assay
was performed on a 96 well microplate as follows:
• 50pl Sample/BSA standard
• 200fil Biuret Reagent
• Incubation at 37°C for 30 minutes
The absorbance of each well at 560nm was determined using a Labsystems Multiskan MS
microplate reader. Where necessary a standard curve was constructed and the protein
concentration of the unknown samples was estimated.
2.4.2.2. Standard BCA Assay
The standard BCA assay protocol, based on the method of Smith et al. (1985), was used to
quantify protein concentrations of samples that could not be determined accurately using
the less sensitive Biuret assay. To determine the amount of protein present in samples,
BSA standard curves in the range 0-2mg/ml were prepared. The assay was performed on a
96 well microplate in triplicate as follows:
• 50|il Sample/BSA standard
• 200^1 BCA Reagent
• Incubation at 37°C for 30 minutes
The absorbance of each well was recorded as described in previous section and standard
curves were plotted.
56
2.4.3. E n z y m e A s s a y s
Quantitative and non-quantitative enzyme assays were performed based on a method by
Buckley et al. (2004).
2.4.3.1. Quantitative Measurement of Dipeptidyl Peptidase IV (DPP IV) Activity
Dipeptidyl peptidase IV activity was determined by the degradation of Gly-Pro-AMC. A
lOmM Gly-Pro-AMC stock solution was prepared in 100% ethanol (w/v). This stock
solution was diluted 1:100 to O.lmM with 50mM HEPES, pH 8.0, containing 5mM EDTA
with a final ethanol concentration of 1% (v/v). One hundred microlitres of this solution
was added to 25fil enzyme sample in triplicate and incubated at 37°C for 1 hour. Both
enzyme sample and substrate were pre-incubated separately at 37°C for 15 minutes to allow
them to reach thermal equilibrium. The reaction was terminated by the addition of 175(0.1
1.7 M acetic acid. Negative controls were prepared by adding 175|xl 1.7M acetic acid to
the substrate prior to the addition of the sample. The controls were also incubated at 37°C
for 1 hour. Liberated AMC was determined fluorometrically from standard plots prepared
as described in section 2.4.1.1. Enzyme units (defined as nanomoles of AMC released per
minute at 37°C) were calculated using the relevant quenched AMC standard curve (section
2.4.1.2.).
57
2.4.3.2. Non-Quantitative Measurement of Dipeptidyl Peptidase IV (DPP IV) Activity
Gly-Pro-AMC degrading activity in post column chromatography fractions was detected
using a non-quantitative assay. A 200(il solution of O.lmM Gly-Pro-AMC in 50mM
HEPES, pH 8.0, containing 5mM EDTA, was added to lOOpl of sample in each well on a
microplate. The plate was then incubated at 37°C for 1 hour. AMC released was
determined fluorometrically as outlined in section 2.4.1.1 using the Perkin-Elmer LS-50
Luminescence Spectrometer.
2.4.3.3. Measurement of rFasciola hepatica Cathepsin LI (rFheCLl) Activity
rFheCLl activity was determined by the degradation of Z-Phe-Arg-AMC. A ImM Z-Phe-
Arg-AMC stock solution was prepared in 100% DMSO (w/v). This stock solution was
diluted 1:100 to O.OlmM with 0.1M sodium acetate, pH 5.0, containing 2mM DTT and
2.5mM EDTA with a final DMSO concentration of 1% (v/v). This solution (lOOfil) was
added to 25(j,l enzyme sample in triplicate and incubated at 37°C for 30 minutes. Both
enzyme sample and substrate were pre-incubated separately at 37°C for 15 minutes to allow
them to reach thermal equilibrium. The reaction was terminated by the addition of 175pl
1.7M acetic acid. Negative controls were prepared by adding 175(xl 1.7M acetic acid to the
substrate prior to the addition of the sample. The controls were also incubated at 37°C for
30 minutes. Liberated AMC was determined fluorometrically as described in section
2.4.1.1. Fluorometric intensities observed were converted to nanomoles of AMC released
per minute per ml using the relevant quenched AMC standard curve (section 2.4.1.2.).
Enzyme units were defined as nanomoles of AMC released per minute at 37°C.
58
2.4.3.4. Esterase Activity of rFasciola hepatica Cathepsin LI (rFheCLl)
rFheCLl esterase activity was determined by the degradation of Z-Lys-ONp, procedure
taken from Shaw and Green (1981). A lOmM Z-Lys-ONp stock solution was prepared in
100% DMSO (w/v). Assays were performed in 0 .1M sodium acetate, pH 5.0 (buffer). On
a 96-well microtitre plate 12.5pl of substrate stock solution was combined with 250jal
buffer. The reaction was initiated by the addition of 25pl activated rFheCLl (0.1 mg/ml).
Immediately after initiation, the plate was placed on a Labsystems Multiskan MS
microplate reader, programmed in kinetic mode, and read every minute for a period of 20
minutes at 405nm. Blank controls were prepared, where 0 .1M sodium acetate, pH 5.0,
containing 8mM DTT and lOmM EDTA was substituted for rFheCLl. All assays were
carried out in triplicate.
59
2 .5 . A s s a y D e v e l o p m e n t
2 .5 .1 . A u t o d ig e s t io n A s s a y
The rate of autolysis was determined based on the method of Bickerstaff and Zhou (1993).
Purified DPP IV (1ml) in 50mM HEPES, pH 8.0, containing 5mM EDTA was incubated in
a test tube at 37°C. At set time intervals, a 10|U.l sample was removed and transferred to a
96 well microtitre plate. This sample was immediately mixed with 250jal Bradford dye
reagent. After 15 minutes incubation at room temperature, the absorbance at 620nm was
measured. Activated rFheCLl was assayed similarly. Blank controls were prepared, where
50mM HEPES, pH 8.0, containing 5mM EDTA was substituted for DPP IV, while 0.1M
sodium acetate, pH 5.0, containing 8mM DTT and lOmM EDTA was substituted for
rFheCLl. Trypsin (O.lmg/ml) prepared in 0.2M sodium phosphate, pH 7.0, was used as a
positive control. Controls were assayed as described above for enzyme-containing samples.
2.5.2. L i n e a r i t y o f E n z y m e A s s a y w i t h R e s p e c t t o T im e
2.5.2.1. Dipeptidyl Peptidase IV (DPP IV)
Purified DPP IV (400/al) and O.lmM Gly-Pro-AMC (1600fxl) substrate were pre-incubated
separately in a waterbath at 37°C for 15 minutes prior to assay to ensure that solutions had
reached thermal equilibrium. Enzyme and substrate were then combined in a test tube held
at 37°C to begin the reaction (t = 0). At appropriate time intervals, 125|_il of the combined
enzyme/substrate solution was removed and added to 175pl acetic acid (1.7M) on a 96 well
microplate to terminate the reaction. Blank controls were prepared, where 400|j,1 50mM
HEPES, pH 8.0, containing 5mM EDTA was substituted for enzyme. Fluorescence
60
intensity was measured as described in section 2.4.3.1. All assays were carried out in
triplicate. A plot of fluorescence intensity versus time was constructed.
2.5.2.2. rFasciola hepatica Cathepsin LI (rFheCLl)
Activated rFheCLl was diluted 1/50 with 0.1M sodium acetate, pH 5.0, and gently stirred
to ensure equilibrium. This solution (700pl) and 2800|ul O.OlmM Z-Phe-Arg-AMC
substrate were pre-incubated separately in a waterbath at 37°C for 15 minutes prior to assay
to ensure that solutions had reached thermal equilibrium. Enzyme and substrate were then
combined in a test tube held at 37°C to begin the reaction (t = 0). At appropriate time
intervals, 125|j.l of the combined enzyme/substrate solution was removed and added to
175 ,̂1 1.7M acetic acid on a 96 well microplate to terminate the reaction. Blank controls
were prepared, where 0.1M sodium acetate, pH 5.0 containing 8mM DTT and lOmM
EDTA was substituted for enzyme. Fluorescence intensity was measured as described in
section 2.4.3.3. All assays were carried out in triplicate. A plot of fluorescence intensity
versus time was constructed.
61
2.5.3. L i n e a r i t y o f A s s a y w i t h R e s p e c t t o E n z y m e C o n c e n t r a t i o n
2.5.3.1. Dipeptidyl Peptidase IV (DPP IV)
Purified DPP IV was diluted with 50mM HEPES, pH 8.0, containing 5mM EDTA to
achieve enzyme concentrations ranging from 0-100% of initial stock solution. The enzyme
at these different concentrations was assayed in triplicate with O.lmM Gly-Pro-AMC as
described in section 2.4.3.1. All assays were carried out in triplicate. A plot of
fluorescenec intensity versus enzyme concentration (%) was constructed.
2.5.3.2. rFasciola hepatica Cathepsin LI (rFheCLl)
Activated rFheCLl was diluted 1/50 with 0.1M sodium acetate, pH 5.0, and gently stirred
to ensure equilibrium. From this 1/50 stock solution a range of concentrations (0-100%)
was prepared in 0.1M sodium acetate, pH 5.0. The enzyme at these different
concentrations was assayed in triplicate with O.OlmM Z-Phe-Arg-AMC as described in
section 2.4.3.3. All assays were carried out in triplicate. A plot of fluorescence intensity
versus enzyme concentration (%) was constructed.
62
2 .6 . K in e t ic A n a l y s is
2.6.1. Km and Fmax determination for Gly-Pro-AMC
Gly-Pro-AMC (lOmM in 100% ethanol (w/v)) was diluted to 0.5mM with 0.1M HEPES,
pH 8.0, containing 5mM EDTA. This solution was further diluted in buffer to a range of
Gly-Pro-AMC concentrations. Purified DPP IV was assayed at each substrate
concentration as described in section 2.4.3.1. The Michaelis-Menten constant (Km) and
maximum velocity value (Fmax) were determined using Michaelis-Menten plot analysis
(Enzfitter Programme, Biosoft, Cambridge, UK).
2.6.2. Km and Vm!lx determination for Z-Phe-Arg-AMC
Z-Phe-Arg-AMC (lOmM in 100% DMSO (w/v)) was diluted to 100/iM Z-Phe-Arg-AMC
with 0.1M sodium acetate, pH 5.0, containing 2mM DTT and 2.5mM EDTA. This solution
was further diluted in buffer to a range of Z-Phe-Arg-AMC concentrations. Activated
rFheCLl (native and chemically modified; section 2.11.) was assayed at each substrate
concentration, as described in section 2.4.3.3. The Michaelis-Menten constant (Km) and
maximum velocity value (Fmax) were determined using Michaelis-Menten plot analysis
(Enzfitter Programme, Biosoft, Cambridge, UK).
63
2 .7 . T e m p e r a t u r e S t u d i e s
2.7.1. T e m p e r a t u r e P r o f i l e
2.7.1.1. Dipeptidyl Peptidase IV (DPP IV)
Aliquots of purified DPP IV were incubated for ten minutes at temperatures ranging
between 37-90°C. The samples were cooled rapidly on ice and residual activity was
assayed as described in section 2.4.3.1. Blank controls were prepared, where 50mM
HEPES, pH 8.0, containing 5mM EDTA was substituted for enzyme. All assays were
earned out in triplicate. A plot of % residual activity versus temperature (°C) was
constructed and the temperature of half-inactivation (T50) determined by inspection.
2.7.1.2. rFasciola hepatica Cathepsin LI (rFheCLl)
Activated rFheCLl was diluted 1/50 with 0.1M sodium acetate, pH 5.0 and gently stirred to
ensure equilibrium. Aliquots of this 1/50 dilution were incubated for ten minutes at
temperatures ranging between 37-90°C. The samples were cooled rapidly on ice and
residual activity was assayed as described in section 2.4.3.3. Blank controls were prepared,
where 0.1M sodium acetate, pH 5.0, containing 8mM DTT and lOmM EDTA was
substituted for enzyme. All assays were carried out in triplicate. A plot of % residual
activity versus temperature (°C) was constructed and the T50 determined by inspection.
64
2 .7 .2 . T h e r m o i n a c t iv a t i o n
2.7.2.1. Dipeptidyl Peptidase IV (DPP IV)
Purified DPP IV was maintained at a constant temperature in a heated waterbath
(temperature-dependent on assay). At appropriate time intervals, aliquots were removed
from the incubating solution and their activities assayed as described in section 2.4.3.1.
Blank controls were prepared, where 50mM HEPES, pH 8.0, containing 5mM EDTA was
substituted for enzyme. A plot of % residual activity versus time (minutes) was
constructed. Data were fitted to a first-order exponential decay using the Enzfitter
programme (Biosofit, Cambridge, UK) in order to estimate the rate constant (k) and, hence,
the half-life (t/2).
2.1.2.2. rFasciola hepatica Cathepsin LI (rFheCLl)
Activated rFheCLl was diluted 1/50 with 0.1M sodium acetate, pH 5.0 and gently stirred to
ensure equilibrium. The enzyme was then maintained at a constant temperature in a heated
waterbath (temperature dependent on assay). At appropriate time intervals, aliquots were
removed from the incubating solution and their activities assayed as described in section
2.4.3.3. Blank controls were prepared, where 0.1M sodium acetate, pH 5, containing 8mM
DTT and lOmM EDTA was substituted for activated enzyme. A plot of % residual activity
versus time (minutes) was constructed. Data were fitted to a first-order exponential decay
using the Enzfitter programme (Biosoft, Cambridge, UK) in order to estimate the rate
constant (k) and, hence, the half-life (ty2).
65

2 .8 . O r g a n o t o l e r a n c e S t u d i e s
2.8.1. S o l v e n t S t a b i l i t y S t u d ie s
2.8.1.1. Dipeptidyl Peptidase IV (DPP IV)
Aliquots of purified DPP IV were incubated for 1 hour at room temperature with a range of
solvents (acetonitrile, DMF, DMSO, THF) to achieve final solvent concentrations ranging
from 0-90% (T a b l e 2.1). The enzyme/solvent solution was adjusted to a final volume of
0.5 ml with 50mM HEPES pH 8.0, containing 5mM EDTA. Blanks containing no enzyme
were included for each solvent, at each solvent concentration. Enzyme activity was
assayed as described in section 2.4.3.1. All assays were carried out in triplicate. A plot of
% residual activity versus solvent concentration (%) was constructed and the C50
determined by inspection. A temperature profile was performed as described in section
2.7.1.1. on each solvent at 50% (v/v) concentration. Thermoinactivation at 37°C was
performed as detailed in section 2.7.2.1. on each solvent, also at 50% (v/v) concentration.
T a b l e 2.1 P r e p a r a t io n o f e n z y m e / s o l v e n t s o l u t io n (v /v )
Solvent Concentration (%) 0 10 20 30 40 50 60 70 80 90
Volume of Enzyme (pi) 50 50 50 50 50 50 50 50 50 50
Volume of Buffer (pi) 450 400 350 300 250 2 0 0 150 100 50 ——
Volume of Solvent (pi) 50 100 150 20 0 250 300 350 400 450
66
2.8.1.2. rFasciola hepatica Cathepsin LI (rFheCLl)
Activated rFheCLl (native and chemically modified; section 2.11.) was diluted 1/5 with
0.1M sodium acetate, pH 5.0 and gently stirred to ensure equilibrium. Aliquots of this
stock solution were incubated for 1 hour at room temperature with a range of solvents
(acetone, acetonitrile, DMF, DMSO, THF) to achieve final solvent concentrations ranging
from 0-90% (T a b l e 2.1). The enzyme/solvent solution was adjusted to a final volume of
0.5ml with 0.1M sodium acetate, pH 5.0. Blank controls containing no enzyme were
included for each solvent, at each solvent concentration (%). Enzyme activity was assayed
as described in section 2.4.3.3. All assays were carried out in triplicate. A plot of %
residual activity versus solvent concentration (%) was constructed and the C50 determined
by inspection. Thermoinactivation of rFheCLl (chemically modified; section 2.11.) at
37°C and 50°C was performed as detailed in section 2.1.22. on acetonitrile and DMF, each
at 50% (v/v) concentration.
67
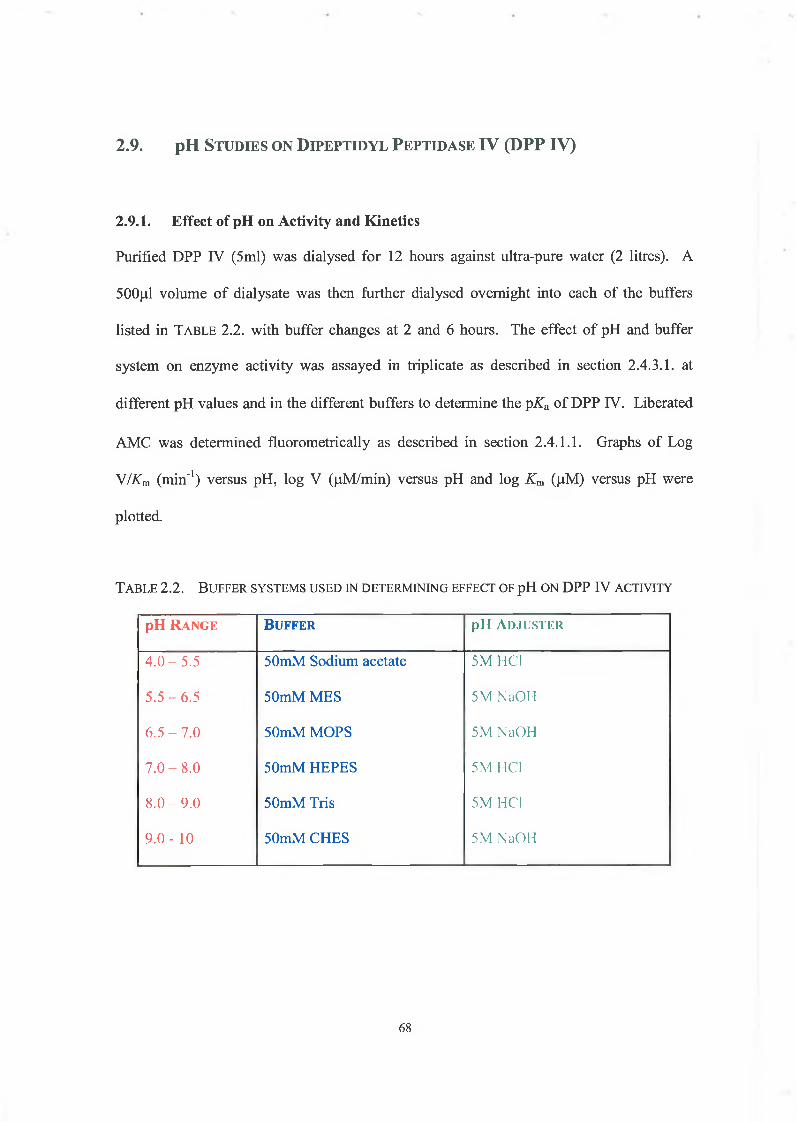
2.9. pH Studies on D ipeptidyl Peptidase IV (DPP IV)
2.9.1. Effect of pH on Activity and Kinetics
Purified DPP IV (5ml) was dialysed for 12 hours against ultra-pure water (2 litres). A
500(j,l volume of dialysate was then further dialysed overnight into each of the buffers
listed in T a b l e 2 .2 . with buffer changes at 2 and 6 hours. The effect o f pH and buffer
system on enzyme activity was assayed in triplicate as described in section 2 .4 .3 .1. at
different pH values and in the different buffers to determine the pKa of DPP IV. Liberated
AMC was determined fluorometrically as described in section 2 .4 .1.1. Graphs of Log
V/Km (min'1) versus pH, log V (^M/min) versus pH and log Km (|jM) versus pH were
plotted.
T a b l e 2.2. B u f f e r sy st e m s u s e d in d e t e r m in in g effect of pH o n DPP IV a c t iv it y
pH R a n g e B uf fer pH A djuster
4 .0 -5 .5 50mM Sodium acetate 5M HCI
5 .5-6 .5 50mM MES 5M NaOH
6 .5 -7 .0 50mM MOPS 5M NaOH
7 .0 -8 .0 50mM HEPES 5M HCI
8.0 -9 .0 50mM Tris 5M HCI
9.0- 10 50mM CHES 5M NaOH
68
Purified DPP IV (5ml) was dialysed for 12 hours against 2L ultra-pure water. A 300|il
volume of dialysate was then further dialysed overnight into each of the buffers listed in
T a b l e 2.2. (but at 20mM concentration instead of 50mM) with buffer changes at 2 and 6
hours. A temperature profile was performed as described in section 2.7.1.1.
2.10. A ctive Site T itration
2.10.1. rFasciola hepatica Cathepsin LI (rFheCLl)
This procedure is based on a method by Barrett et al. (1982). ¿raws-epoxysuccinyl-L-
leucylamido(4-guanidino)-butane (E-64) (ImM initially dissolved in 0.1ml DMSO,
brought to 10ml final volume) was diluted to a 2 0 |aM working solution using ultra-pure
water. Lower E-64 concentrations were prepared (0-2.5/xM) by dilution of the working
solution with ultra-pure water. A titration of activated rFheCLl with E-64 was prepared.
At each point, 25/zl of activated rFheCLl (diluted 1/5 with 0.1M sodium acetate, pH 5.0)
was reacted with an equal volume of 0-2.5 (iM E-64 and brought to a total volume of 100(xl
with 0.1M sodium acetate, pH 5.0, containing 8mM DTT and lOmM EDTA. Samples were
incubated at 37°C for 15 minutes. Activity was then determined (section 2.4.3.3.). All
assays were carried out in triplicate. A plot of fluorescence intensity versus E-64
concentration (fJ-M) was plotted and the operational molarity of rFheCLl determined.
2.9.2. pH Temperature Profile
69
2 .11 . C h e m ic a l M o d if ic a t io n
2.11.1. Cross-linking of rFasciola hepatica Cathepsin LI (rFheCLl) with EG-NHS
The protocol for the ester reaction was based on that of Ryan et al. (1994). Activated
rFheCLl (2ml) in 0.1M sodium acetate, pH 5.0, containing 8mM DTT and lOmM EDTA
was dialysed extensively for at least 3 hours against 0.1M potassium phosphate, pH 7.5.
Ethylene glycol-bis(succinic acid N-hydroxy-succinimide ester) (EG-NHS) (5mg) was
dissolved in 0.125ml DMSO. Cross-linking was commenced by addition of the EG-NHS
solution to rFheCLl (2ml) in 0.1M potassium phosphate, pH 7.5. This reaction solution
was stirred gently at room temperature for 20 minutes after which the reaction was
terminated by removal of excess reagent as described in section 2.11.2. below. The
modified enzyme was re-dialysed into 0.1M sodium acetate, pH 5.0, containing 8mM DTT
and lOmM EDTA. Enzyme activity was determined pre- and post modification.
2.11.2. Sephadex™ G-25 Gel Filtration
The method was based on that of Helmerhorst and Stokes (1980). Sephadex™ G-25 (5g)
was swollen in 50ml 0.1M potassium phosphate, pH 7.5. This mixture was stirred slowly
overnight. A slurry of the above mixture (20ml) was poured into a 10ml column and
capped. The column was then centrifuged at 1800 rpm for 3 minutes in a bench centrifuge
to remove excess buffer (rotor radius 12cm). Modified enzyme solution (2ml) was applied
to the semi-dry Sephadex™ G-25 column and re-centrifuged as described above, to remove
unreacted and excess ethylene glycol-bis(succinic acid N-hydroxy-succinimide ester) (EG-
NHS).
70
The method was based on that of Fields (1971) using 2,4,6-trinitrobenzenesulphonic acid
(TNBS) for the estimation of free amino groups in native and modified rFheCLl. A 20mM
(w/v) Na-acetyl-L-Lysine stock solution was prepared in ultra-pure water. Lower Na-
acetyl-L-Lysine concentrations were prepared in ultra-pure water to form standard curves in
the range of 0-20mM. The TNBS assay was performed in test tubes as follows:
• 0.1ml rFheCLl (native/modified)/Na-acetyl-L-Lysine standard
• 0.5ml 0.1M borate buffer, pH 9.6
• 0.4ml ultra-pure water
• The reaction was initiated by addition of 0.02ml 0.5% (v/v) TNBS. Tubes were mixed
by inversion and reaction proceeded at room temperature in the dark. After 5 minutes,
the reaction was terminated by the addition of 2ml 0.1M monobasic sodium phosphate
(Na^PCU) containing 1.5mM sodium sulphite.
Absorbance at 420nm was determined on a Unicam2 UV/Vis spectrophotometer. Blank
controls were included, substituting buffer for enzyme samples. All solutions were assayed
in triplicate and their mean absorbance calculated.
2.11.3. Amino Group Estimation - TNBS Assay
71
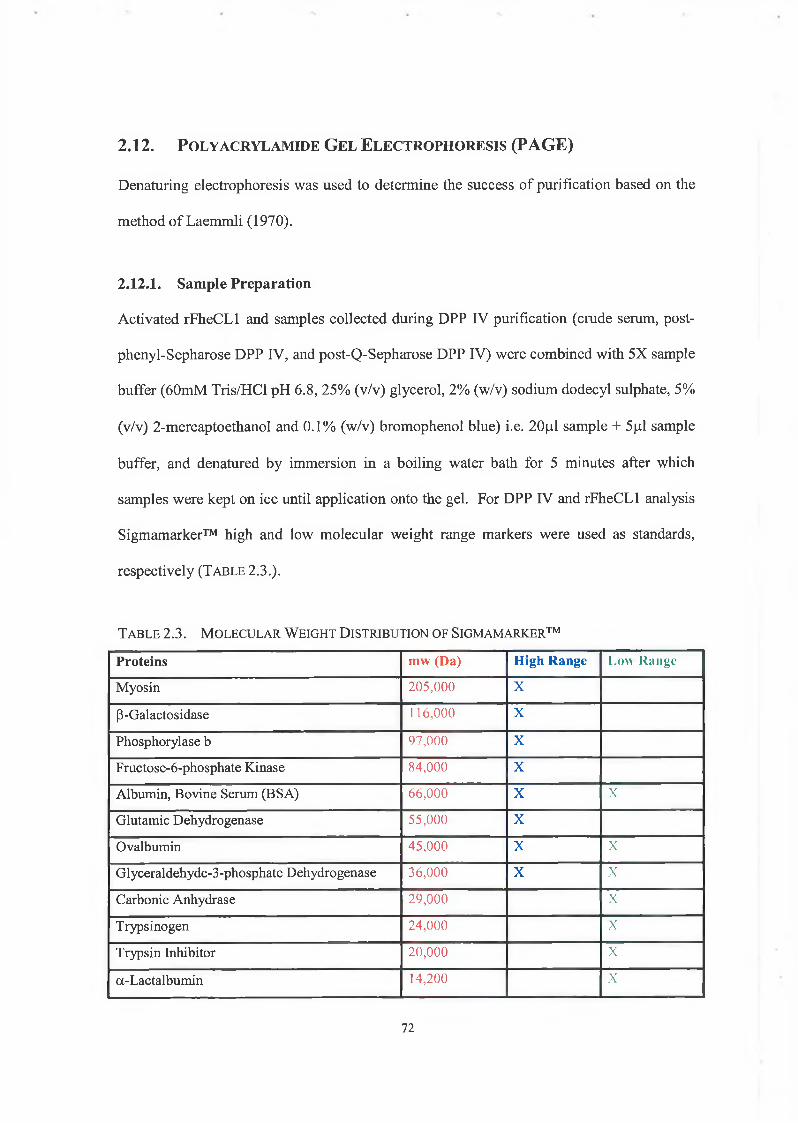
Denaturing electrophoresis was used to determine the success of purification based on the
method of Laemmli (1970).
2.12.1. Sample Preparation
Activated rFheCLl and samples collected during DPP IV purification (crude serum, post-
phenyl-Sepharose DPP IV, and post-Q-Sepharose DPP IV) were combined with 5X sample
buffer (60mM Tris/HCl pH 6.8, 25% (v/v) glycerol, 2% (w/v) sodium dodecyl sulphate, 5%
(v/v) 2-mercaptoethanol and 0.1% (w/v) bromophenol blue) i.e. 20|il sample + 5(0.1 sample
buffer, and denatured by immersion in a boiling water bath for 5 minutes after which
samples were kept on ice until application onto the gel. For DPP IV and rFheCLl analysis
Sigmamarker™ high and low molecular weight range markers were used as standards,
respectively (T a b l e 2.3.).
2.12 . P o l y a c r y l a m id e G el E l e c t r o p h o r e s is (P A G E )
T a b l e 2.3. M o l e c u l a r W e ig h t D is t r ib u t io n o f S ig m a m a r k e r ™
Proteins mw (Da) High Range Low Range
Myosin 205,000 X
ß-Galactosidase 116,000 X
Phosphorylase b 97,000 X
Fructose-6-phosphate Kinase 84,000 X
Albumin, Bovine Serum (BSA) 66,000 X X
Glutamic Dehydrogenase 55,000 X
Ovalbumin 45,000 X X
Glyceraldehyde-3-phosphate Dehydrogenase 36,000 X X
Carbonic Anhydrase 29,000 X
Trypsinogen 24,000 X
Trypsin Inhibitor 20,000 X
a-Lactalbumin 14,200 X
72
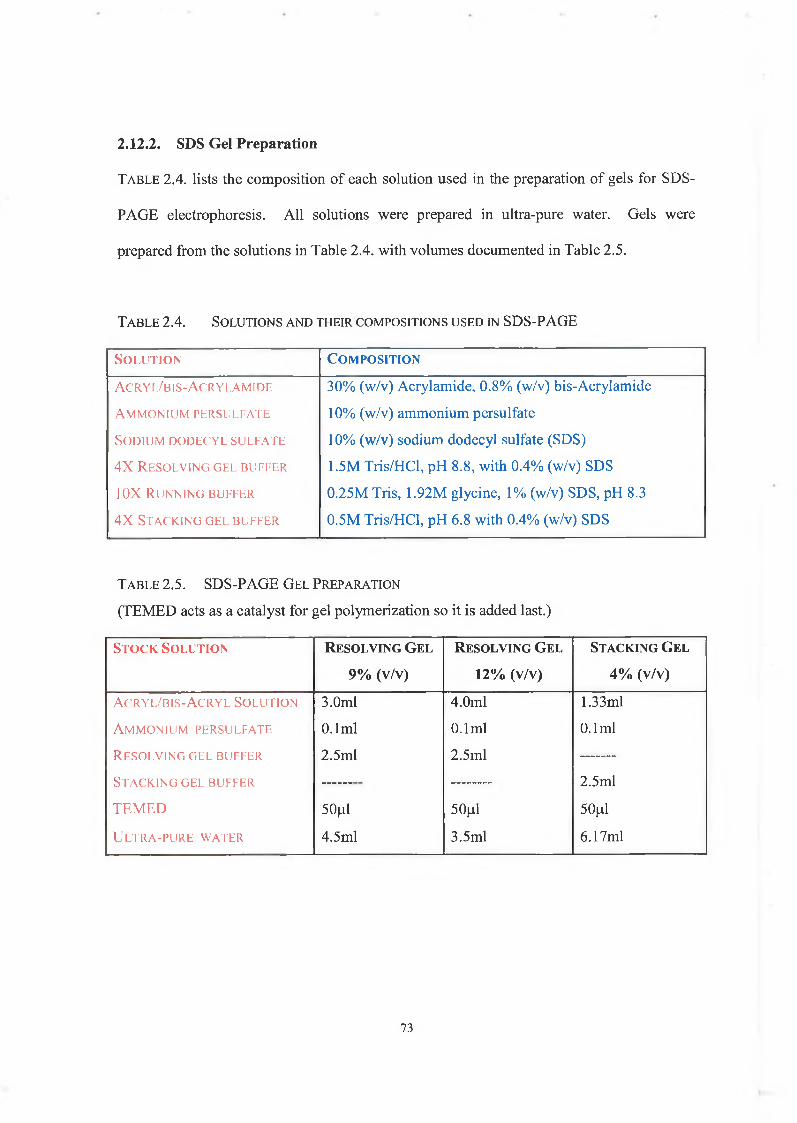
T a b l e 2.4. lists the composition of each solution used in the preparation of gels for SDS-
PAGE electrophoresis. All solutions were prepared in ultra-pure water. Gels were
prepared from the solutions in Table 2.4. with volumes documented in Table 2.5.
2.12.2. SDS Gel Preparation
T a b l e 2.4. So l u t io n s a n d t h e ir c o m p o s it io n s u s e d in SDS-PAGE
So l u t io n C o m p o s it io n
A c r y l / b 1 s -A c r y l a m i d e
A m m o n iu m p e r s u l f a t e
So d iu m d o d e c y l s u l f a t e
4 X R e s o l v in g g e l b u f f e r
10X R u n n in g b u f f e r
4 X S t a c k in g g e l b u f f e r
30% (w/v) Acrylamide, 0.8% (w/v) bis-Acrylamide
10% (w/v) ammonium persulfate
10% (w/v) sodium dodecyl sulfate (SDS)
1.5M Tris/HCl, pH 8.8, with 0.4% (w/v) SDS
0.25M Tris, 1.92M glycine, 1% (w/v) SDS, pH 8.3
0.5M Tris/HCl, pH 6.8 with 0.4% (w/v) SDS
T a b l e 2.5. SDS-PAGE G e l P r e p a r a t io n
(TEMED acts as a catalyst for gel polymerization so it is added last.)
St o c k S o l u t io n R e s o l v in g G e l R e s o l v in g G e l St a c k in g G e l
9% (v /v ) 12% (v /v ) 4% (v /v )
A c r y l / b is -A c r y l So l u t io n 3.0ml 4.0ml 1.33ml
A m m o n iu m p e r s u l f a t e 0.1ml 0.1ml 0.1ml
R e s o l v in g g e l b u f f e r 2.5ml 2.5ml
St a c k in g g e l b u f f e r 2.5ml
T E M E D 50jj,1 50|il 50^1
U l t r a - pu r e w a t e r 4.5ml 3.5ml 6.17ml
73
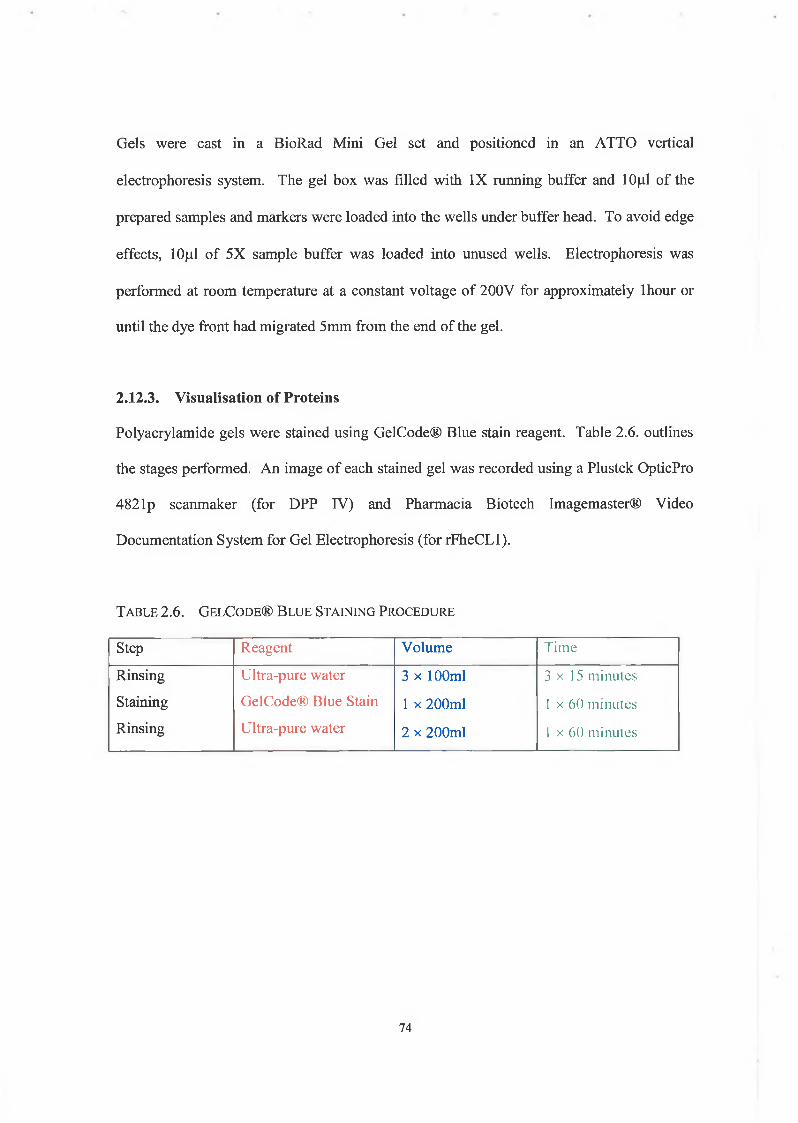
Gels were cast in a BioRad Mini Gel set and positioned in an ATTO vertical
electrophoresis system. The gel box was filled with IX running buffer and 1Ojal of the
prepared samples and markers were loaded into the wells under buffer head. To avoid edge
effects, 10|il of 5X sample buffer was loaded into unused wells. Electrophoresis was
performed at room temperature at a constant voltage of 200V for approximately lhour or
until the dye front had migrated 5mm from the end of the gel.
2.12.3. Visualisation of Proteins
Polyacrylamide gels were stained using GelCode® Blue stain reagent. Table 2.6. outlines
the stages performed. An image of each stained gel was recorded using a Plustek OpticPro
482 lp scanmaker (for DPP IV) and Pharmacia Biotech Imagemaster® Video
Documentation System for Gel Electrophoresis (for rFheCLl).
T a b l e 2 .6 . G e l C o d e ® B l u e S t a in in g P r o c e d u r e
Step Reagent Volume Time
Rinsing
Staining
Rinsing
Ultra-pure water
GelCode® Blue Stain
Ultra-pure water
3 x 100ml
1 x 200ml
2 x 200ml
3 x 1 5 minutes
1 x 60 minutes
1 x 60 mi nules
74
2.13. E n z y m a t i c P e p t i d e S y n t h e s i s
2.13.1. Synthesis of model tripeptide Z-Phe-Arg-SerNH2
The enzymatic synthesis of Z-Phe-Arg-SerNH2 using Z-Phe-Arg-OMe (ester) and SerNH2
(amine) was performed based on similar methods described by Stehle et al. (1990) and
Lozano et al. (1992). rFheCLl was activated to a final protein concentration of 0.05mg/ml.
Z-Phe-Arg-OMe was prepared as a 20mM stock solution in 100% acetonitrile (w/v). The
nucleophile, SerNH2, was prepared in 0.1M ammonium acetate, pH 9.0, giving a final
concentration of 50mM. Enzyme, nucleophile and ester were separately pre-incubated in a
waterbath at 37°C for 15 minutes prior to assay to ensure that solutions had reached thermal
equilibrium. Into a 5ml volume test tube, 0.25ml of 20mM Z-Phe-Arg-OMe and 0.4ml
SerNH2 were combined. Reaction volume was adjusted to 2ml with 0.1M ammonium
acetate, pH 9.0. The reaction was initiated by the addition of 0.25ml rFheCLl (0.05mg/ml)
and incubated at 37°C with gentle stirring. Aliquots (200j.il) were removed at several time
intervals from the reaction mixture and mixed with 25pl acetonitrile:water:formic acid
(50:25:25 v/v/v) to quench the reaction. Analysis was performed by liquid chromatography
mass spectrometry (LC-MS) (instrument - Bruker Mass Spectrometer with electrospray
ionisation and ion-trap detector linked to a Hewlett-Packard Esquire Liquid chromatograph
1100 with photo diode array detector). The LC isocratic method used a Zorbax SB-C18, 50
x 2.1 mm, 3.5fim narrow bore column with a mobile phase 25:75:0.1 (v/v/v)
acetonitrile:water:formic acid at a flow rate of 0.2ml/min. Monitoring was performed using
a photodiode array detector at 200nm and injection volume 2pl.
75
2.14. S e q u e n c e A l ig n m e n t
2.1.14. Sequence alignment of fluke and recombinant Fasciola hepatica cathepsin LI
Comparative analysis of the amino acid sequences for fluke {Fasciola hepatica) cathepsin
LI and recombinant Fasciola hepatica cathepsin LI were aligned using ClustalW. The
amino acid sequence for fluke {Fasciola hepatica) cathepsin LI, accession number
Q24940, was obtained from Protein Data Bank. Sequence for recombinant Fasciola
hepatica cathepsin LI (rFheCLl) was obtained from Mr Peter Collins, Parasitology
Research Group, formerly based at Dublin City University.
76
C ha pter 3
P u r if ic a tio n of D ipeptid yl P eptid a se IV
3.1. In tro d u c tio n
Dipeptidyl peptidase IV (DPP IV) is a serine protease enzyme with exopeptidase activity.
It is specific for a Pro residue at the Pi position hydrolysing, on the carboxyl side of the Pro
(Burleigh & Andrews, 1998). The amide substrate, Gly-Pro-AMC when hydrolyzed by
DPP IV releases AMC, which is monitored fluorimetrically, making this a sensitive and
suitable substrate. The enzyme was purified from an ample supply of bovine serum, using
a variety of techniques, based on a method by Buckley et al. (2004). Protein concentration,
enzyme activity, and yield were determined after each purification stage. The extent of
purity and subunit molecular weight of the enzyme were determined.
The undertaken studies differed from those of Buckley et al. (2004) who previously
characterised the enzyme with regards to pH optimum, catalytic classification, substrate
specificity and inhibition studies. This study focused on investigating the temperature and
solvent stability of DPP IV. A temperature profile was determined for the enzyme and the
temperature at half-inactivation (T50) estimated. The effect of organic solvents on DPP IV
activity was investigated following exposure to a range of organic solvents at various
concentrations and the half-inactivation concentration (C 5 0 ) determined. The effect of pH
on DPP IV activity and kinetics was also examined, with two pK values observed. The
effect of changing the buffer on DPP IV activity was also investigated.
77
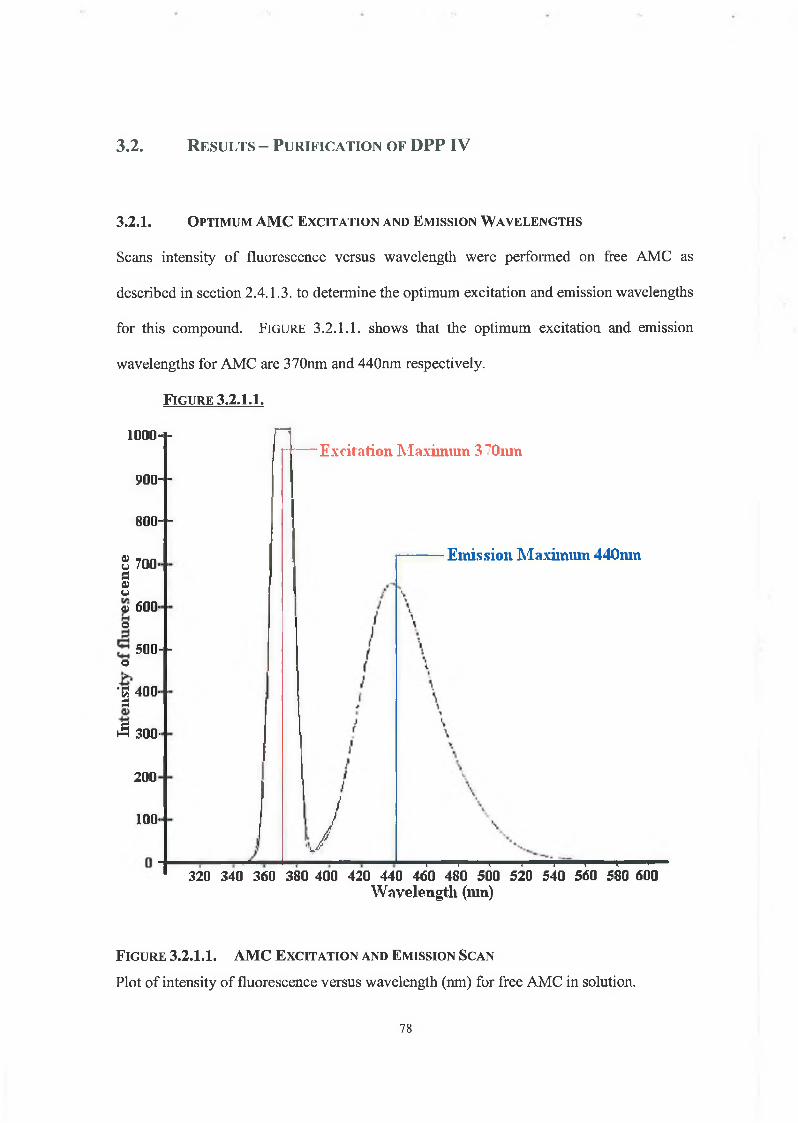
3.2. Results - P urification of DPP IV
3 .2 .1 . O p tim u m AMC E x c i t a t i o n a n d E m is s io n W a v e l e n g t h s
Scans intensity of fluorescence versus wavelength were performed on free AMC as
described in section 2.4.1.3. to determine the optimum excitation and emission wavelengths
for this compound. F ig u r e 3.2.1.1. shows that the optimum excitation and emission
wavelengths for AMC are 370nm and 440nm respectively.
F ig u r e 3 .2 .I .I .
1000- -
90 0 - -
80 0 - -
£ 700- a 0)o4» 600-D
o500- -
■s 400- a
A 300-
200
100-
n Excitation Maxiinmn 3 ’’Omn
iJ
Emission Maxiinmn 440mn
i i \ i ! ■ i > i320 340 360 380 400 420 440 460 480 500 520 540 560 580 600
Wavelength (mn)
F i g u r e 3 .2 .I .I . AMC E x c i t a t i o n a n d E m is s io n S c a n
Plot of intensity of fluorescence versus wavelength (nm) for free AMC in solution.
78
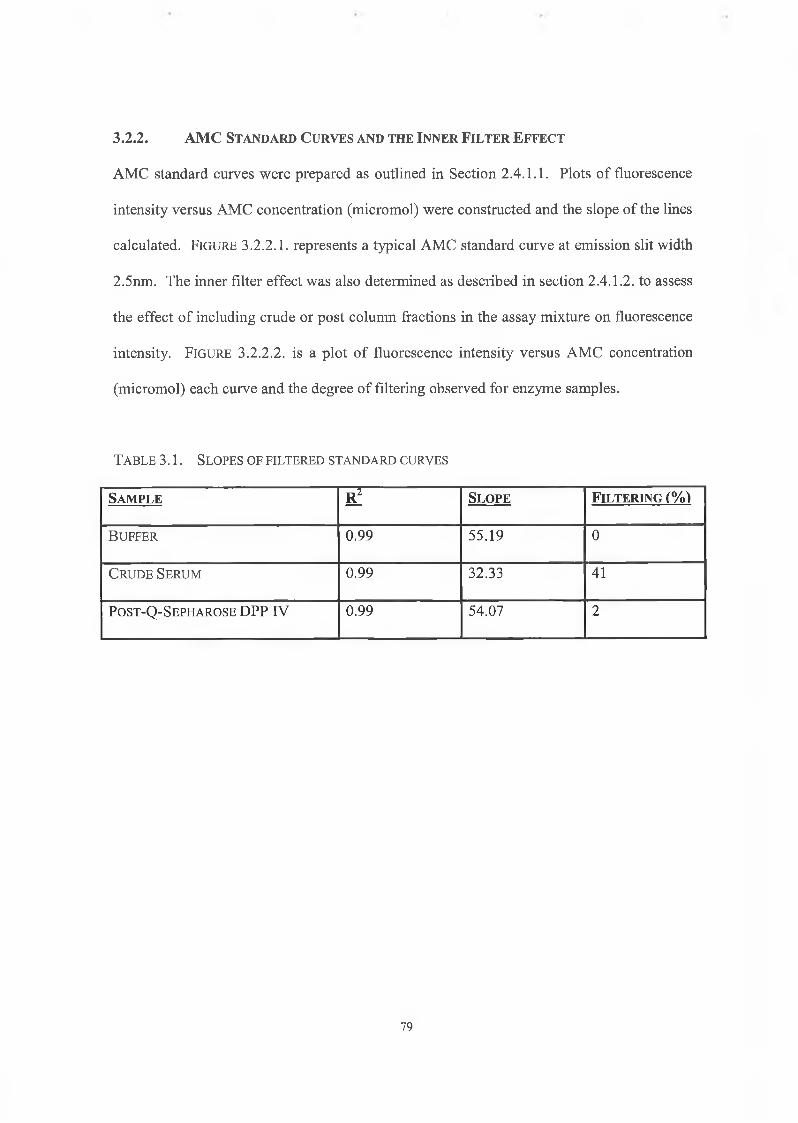
3 .2 .2 . A M C S t a n d a r d C u r v e s a n d t h e I n n e r F i l t e r E f f e c t
AMC standard curves were prepared as outlined in Section 2.4.1.1. Plots of fluorescence
intensity versus AMC concentration (micromol) were constructed and the slope of the lines
calculated. F ig u r e 3.2.2.1. represents a typical AMC standard curve at emission slit width
2.5nm. The inner filter effect was also determined as described in section 2.4.1.2. to assess
the effect of including crude or post column fractions in the assay mixture on fluorescence
intensity. FIGURE 3.2.2.2. is a plot of fluorescence intensity versus AMC concentration
(micromol) each curve and the degree of filtering observed for enzyme samples.
T a b l e 3 .1 . S l o p e s o f f il t e r e d s t a n d a r d c u r v e s
S a m p l e e ! S l o p e F i l t e r i n g (%)
B u f f e r 0.99 55.19 0
C r u d e Se r u m 0.99 32.33 41
P o s t -Q -S e p h a r o s e DPP IV 0.99 54.07 2
79
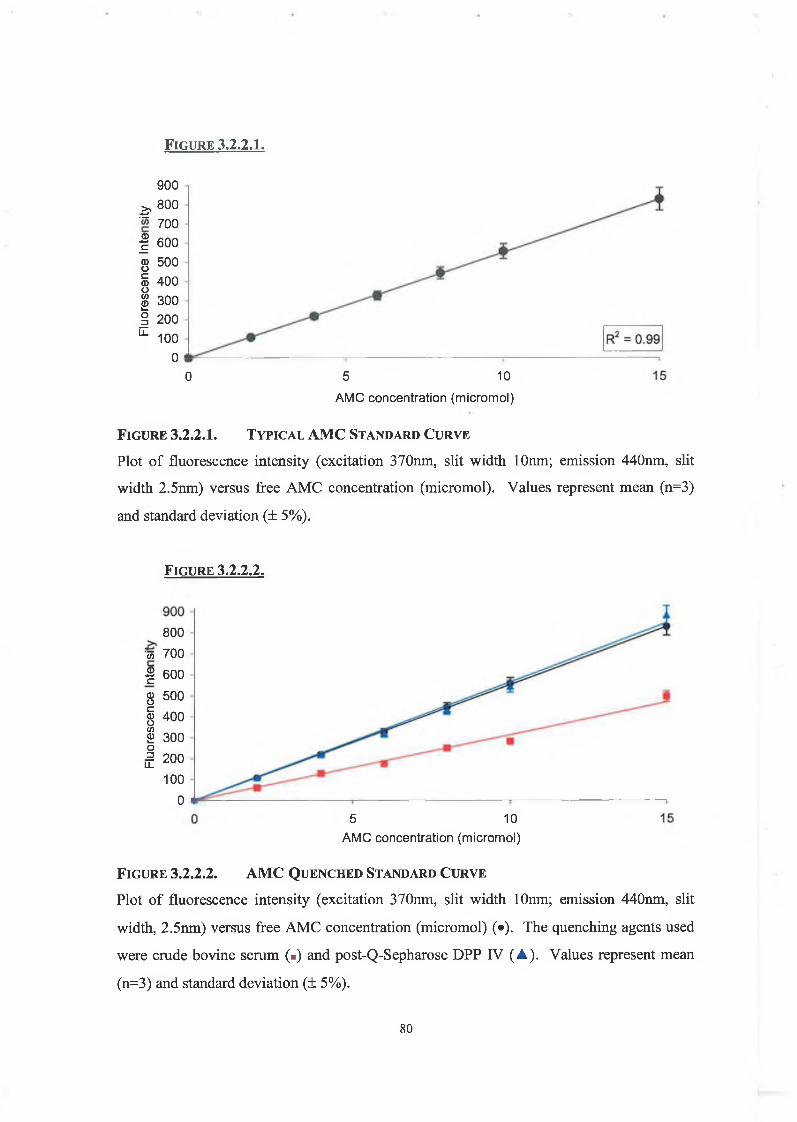
F ig u r e 3 .2 .2 .I .
900
£ 800 700
| 600
g 500
§ 400
| 300| 200^ 100
00 5 10
AMC concentration (m icrom ol)
F ig u r e 3 .2 .2 .I . T y p ic a l AMC S t a n d a r d C u r v e
Plot of fluorescence intensity (excitation 370nm, slit width lOnm; emission 440nm, slit
width 2.5nm) versus free AMC concentration (micromol). Values represent mean (n=3)
and standard deviation (± 5%).
F ig u r e 3 .2 .2 .2 .
800
=5 700
| 600
g 500
§ 400CA£ 300
I 200 100
05 10
AMC concentration (m icromol)
F ig u r e 3 .2 .2 .2 . AMC Q u e n c h e d S t a n d a r d C u r v e
Plot of fluorescence intensity (excitation 370nm, slit width lOnm; emission 440nm, slit
width, 2.5nm) versus free AMC concentration (micromol) (•). The quenching agents used
were crude bovine serum (■) and post-Q-Sepharose DPP IV (A). Values represent mean
(n=3) and standard deviation (± 5%).
80
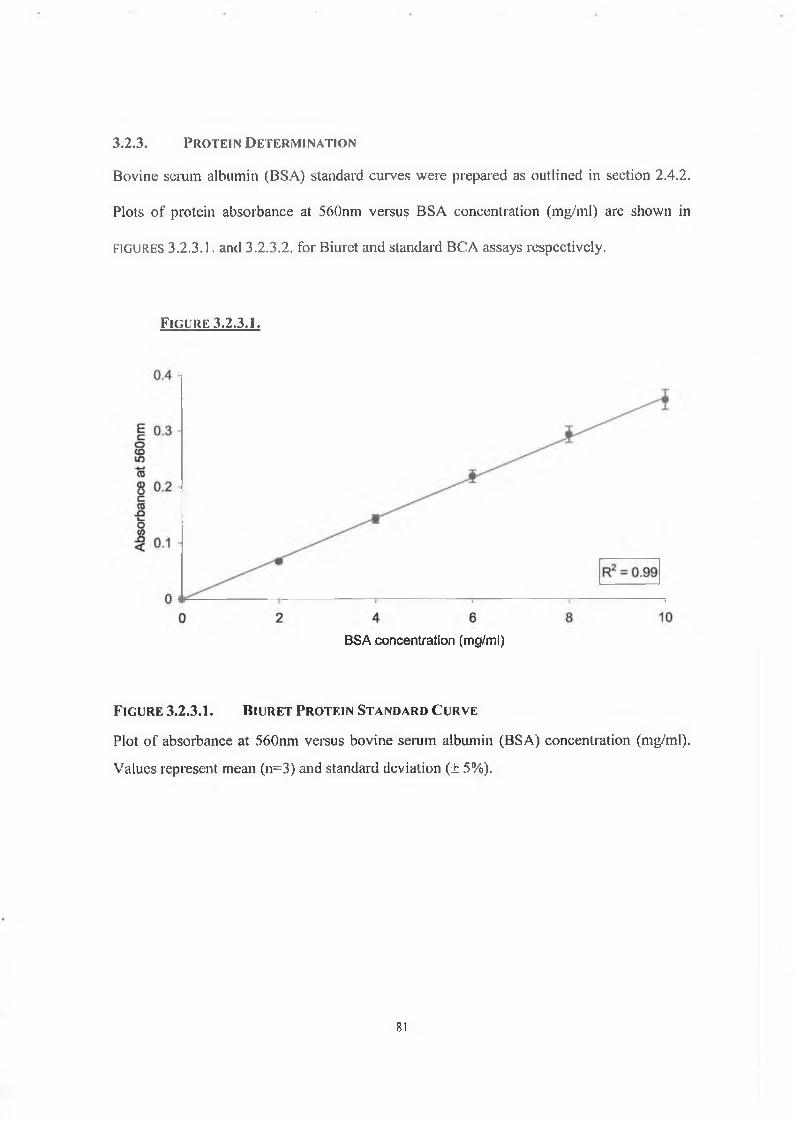
3 .2 .3 . P r o t e in D e t e r m in a t io n
Bovine serum albumin (BSA) standard curves were prepared as outlined in section 2 .4 .2 .
Plots of protein absorbance at 560nm versus BSA concentration (mg/ml) are shown in
f ig u r e s 3 .2 .3 .1 . and 3 .2 .3 .2 . for Biuret and standard BCA assays respectively.
F ig u r e 3 .2 .3 .I .
BSA concentration (mg/ml)
F ig u r e 3 .2 .3 .I . B iu r e t P r o t e in S t a n d a r d C u r v e
Plot of absorbance at 560nm versus bovine serum albumin (BSA) concentration (mg/ml).
Values represent mean (n=3) and standard deviation (± 5%).
81
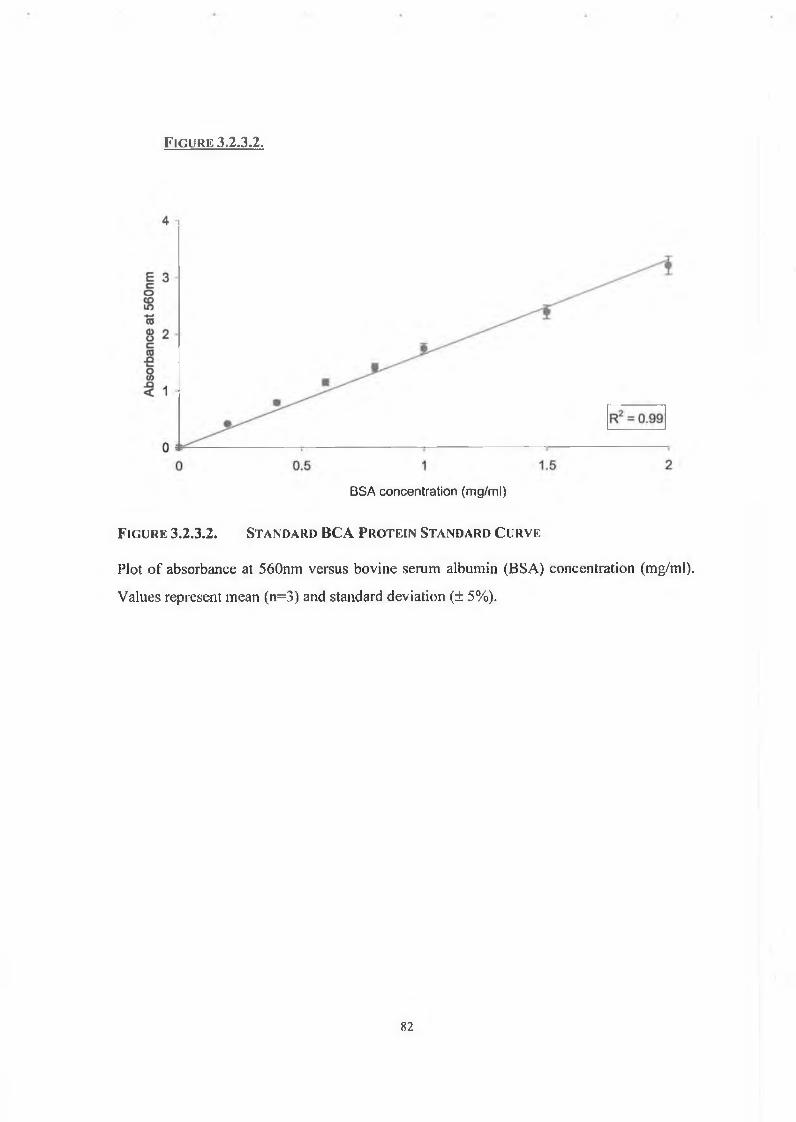
F ig u r e 3 .2 .3 .2 .
BSA concentration (mg/m l)
F ig u r e 3.2.3.2. St a n d a r d BCA P r o t e in St a n d a r d C u r v e
Plot of absorbance at 560nm versus bovine serum albumin (BSA) concentration (mg/ml).
Values represent mean (n=3) and standard deviation (± 5%).
8 2
3.2.4. P u r if ic a t io n o f B o v in e S e r u m D P P IV
3.2.4.1. Serum Preparation
12 litres of fresh bovine whole blood was collected and allowed to clot at 4°C as described
in section 2.3.1.1. This resulted in the formation of 2.5 litres unclotted serum and
particulate matter. Centrifugation yielded 2 litres of serum.
3.2.4.2. Phenyl Sepharose Hydrophobic Interaction Chromatography
Crude serum containing 1M ammonium sulphate was applied to a phenyl Sepharose
hydrophobic interaction chromatography column as outlined in section 2.3.1.2. A run-
through DPP IV activity peak was observed from this column as shown in F ig u r e
3.2.4.2.1. This activity was well separated from a significant proportion of bound protein.
Fractions containing DPP IV activity were combined to yield a post-phenyl Sepharose DPP
IV pool. A 1ml aliquot of this pool was retained to determine protein concentration and
total enzymatic activity as described in section 2.4.2.1. and 2.4.3.1.
3.2.4.3. Sephacryl S-300 High Resolution (HR) Gel Filtration Chromatography
Following concentration of the post-phenyl Sepharose DPP IV pool by osmosis using solid
polyethylene glycol, the concentrated sample was applied onto a Sephacryl S-300-HR gel
filtration column as described in section 2.3.1.3. F ig u r e 3.2.4.3.I. shows the molecular
sieving effect of this column on the enzyme’s purification. Fractions containing DPP IV
activity were combined to yield a post-Sephacryl-S-300 DPP IV pool. A 1ml aliquot of
this pool was retained to determine protein concentration and total enzymatic activity as
described in section 2.4.2.2. and 2.4.3.1.
83
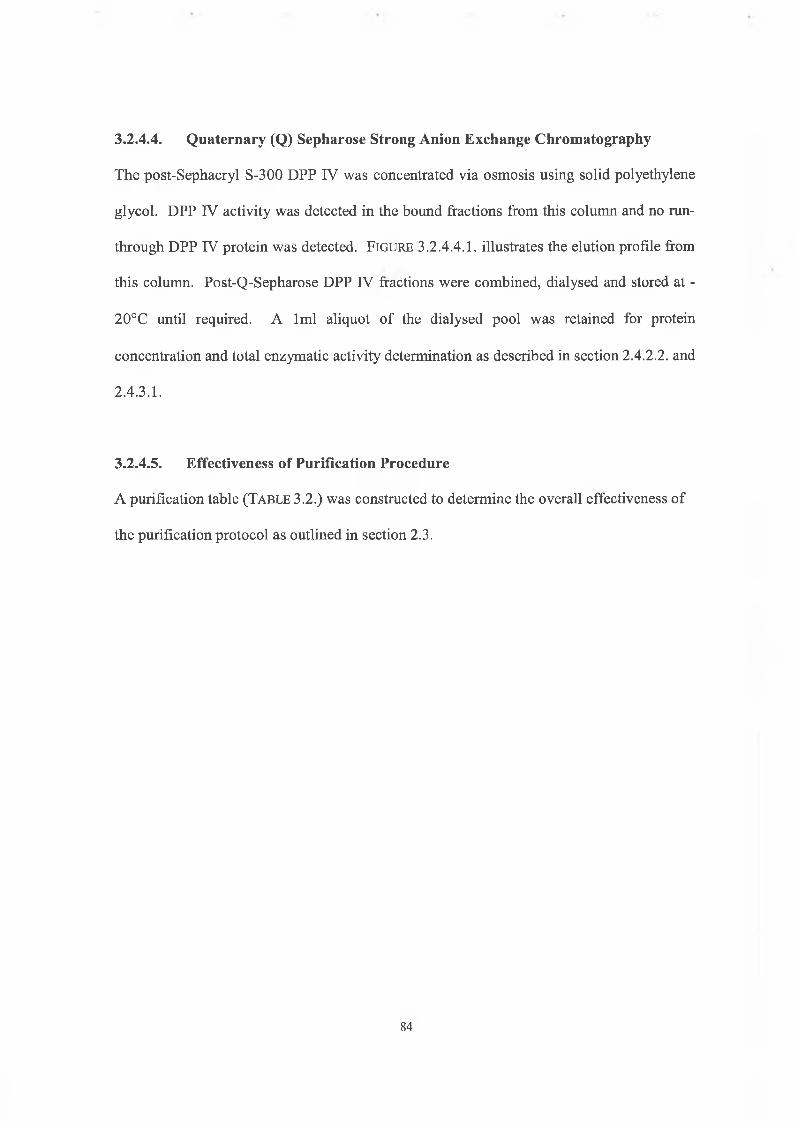
3.2.4.4. Quaternary (Q) Sepharose Strong Anion Exchange Chromatography
The post-Sephacryl S-300 DPP IV was concentrated via osmosis using solid polyethylene
glycol. DPP IV activity was detected in the bound fractions from this column and no run-
through DPP TV protein was detected. F ig u r e 3 .2 .4 .4 .I . illustrates the elution profile from
this column. Post-Q-Sepharose DPP IV fractions were combined, dialysed and stored at -
20°C until required. A 1ml aliquot of the dialysed pool was retained for protein
concentration and total enzymatic activity determination as described in section 2.4.2.2. and
2 .4 .3 .1 .
3.2.4.5. Effectiveness of Purification Procedure
A p u r if ic a t io n ta b le (T a b l e 3 .2 .) w as c o n s tru c te d to d e te rm in e th e o v e ra ll e ffe c tiv en e ss o f
th e p u r if ic a tio n p ro to c o l a s o u tlin e d in se c tio n 2 .3 .
84
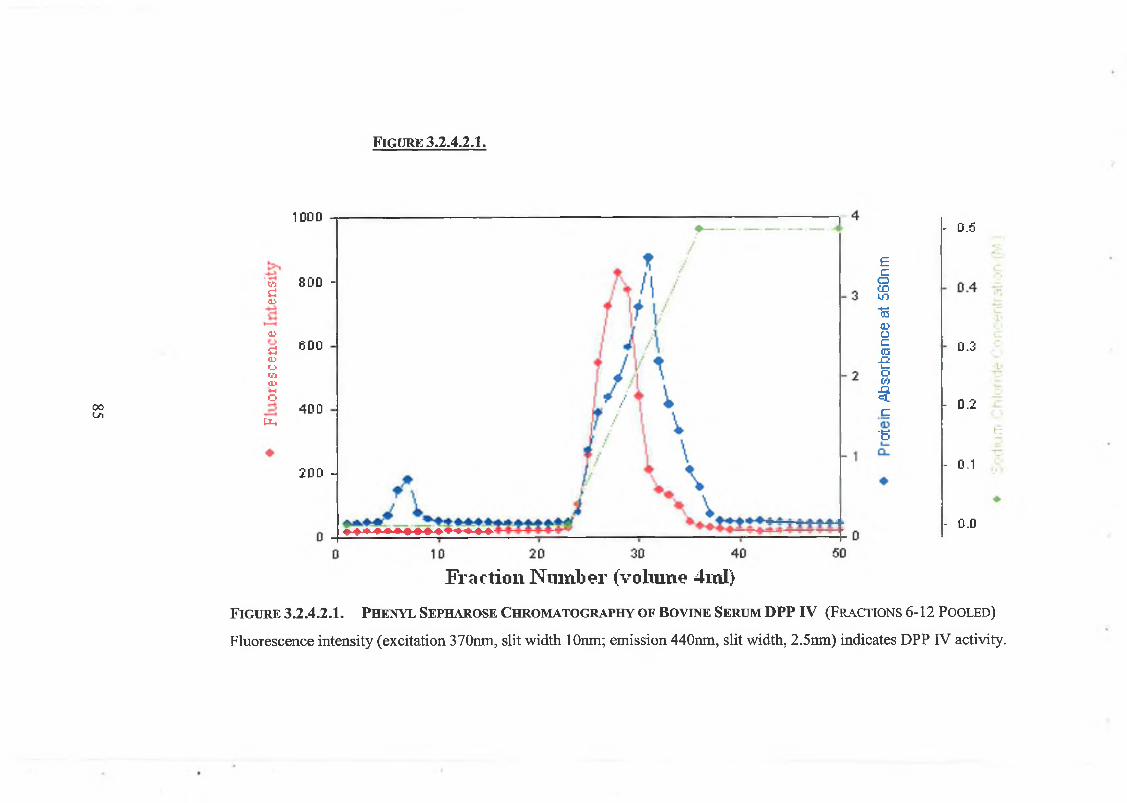
F i g u r e 3.2.4.2.I.
ooL/i
wd<r>
4)a<LrOMa>+Ho
IX
10DD
8DD -
6 0 0
4DD
200 J
EcoCDin-ss<L>0 C<n_Q 1_____o«§c■5
- 0.5
D.3
- 0.2
t
- 0.1
- 0.0
Fraction Number (volume 4ml)
F ig u r e 3.2.4.2.I. P h e n y l S e p h a r o s e C h r o m a t o g r a p h y o f B o v in e S e r u m D P P IV (F r a c t io n s 6-12 P o o l e d )
Fluorescence intensity (excitation 370nm, slit width lOnm; emission 440nm, slit width, 2.5nm) indicates DPP IV activity.
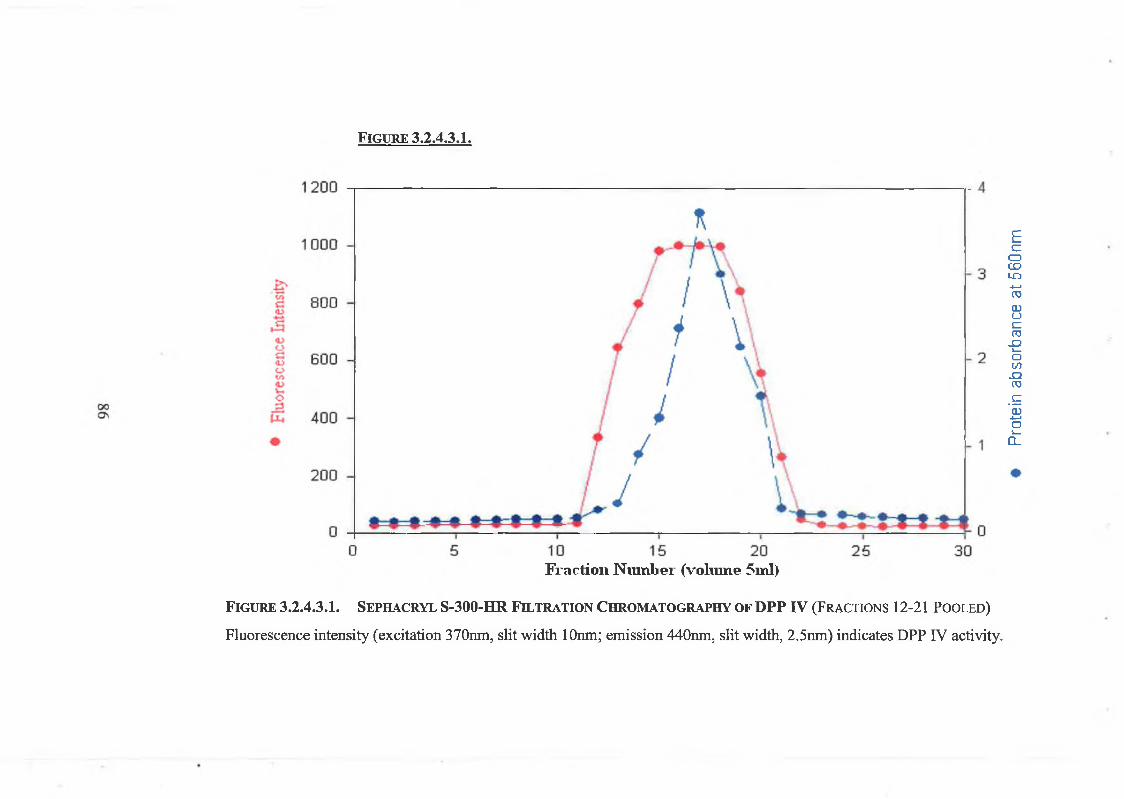
F ig u r e 3.2.4.3.I.
Fraction Num ber (voliune 5ml)
F ig u r e 3.2.4.3.I. S e p h a c r y l S-300-HR F i l t r a t i o n C h r o m a t o g r a p h y o f DPP IV (F r a c t io n s 12-21 P o o l e d )
Fluorescence intensity (excitation 370nm, slit width lOnm; emission 440nm, slit width, 2.5nm) indicates D P P IV activity.
Prot
ein
abso
rban
ce
at56
Gnm
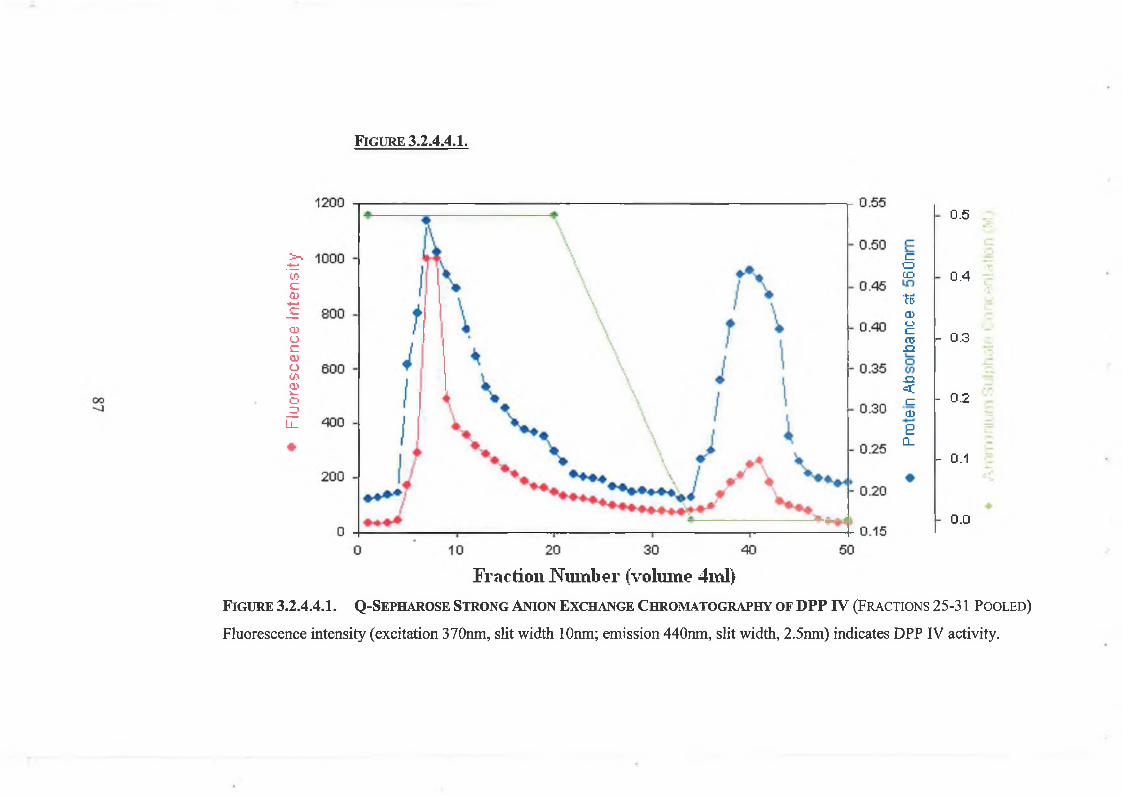
Fluo
resc
ence
In
tens
ity
F ig u r e 3 .2 .4 .4 .I .
coCD
■55ajocCO-Q
_Q<c0)S
Cl
0.5
0.4
- 0.3
- 0.2
- 0.1
0.0
Fraction Number (volume 4ml)F i g u r e 3 .2 .4 .4 .1 . Q - S e p h a r o s e S t r o n g A n io n E x c h a n g e C h r o m a t o g r a p h y o f DPP IV (F r a c t io n s 25-31 P o o l e d )
Fluorescence intensity (excitation 370nm, slit width lOnm; emission 440nm, slit width, 2.5nm) indicates DPP IV activity.
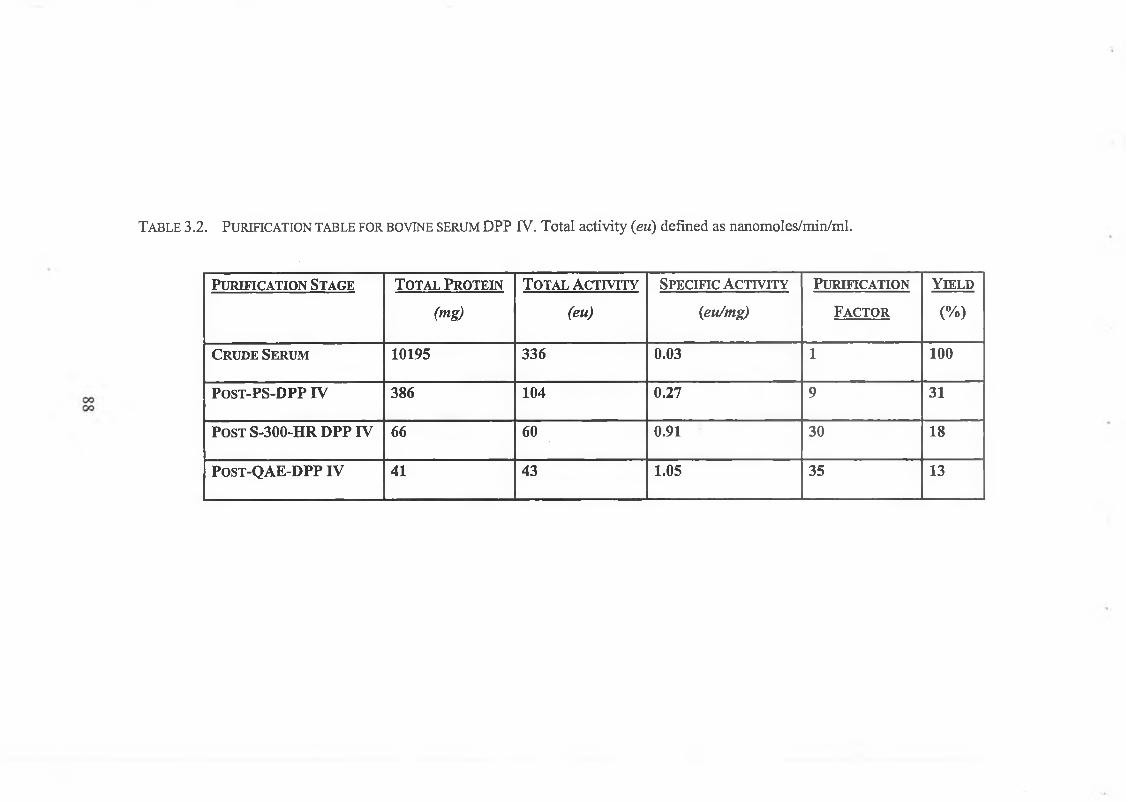
T a b l e 3.2. P u r if ic a t io n t a b l e f o r b o v in e s e r u m DPP IV. Total activity (eu) defined as nanomoles/min/ml.
P u r if ic a t io n S t a g e T o t a l P r o t e i n
(mg)
T o t a l A c t i v i t y
(eu)
S p e c i f i c A c t i v i t y
(eu/mg)
P u r if ic a t io n
Fa c t o r
Y ie l d
(% )
C r u d e Se r u m 10195 336 0.03 1 100
P o s t-P S -D P P IV 386 104 0.27 9 31
P o s t S-300-HR D P P IV 66 60 0.91 30 18
P o s t-Q A E -D P P IV 41 43 1.05 35 13
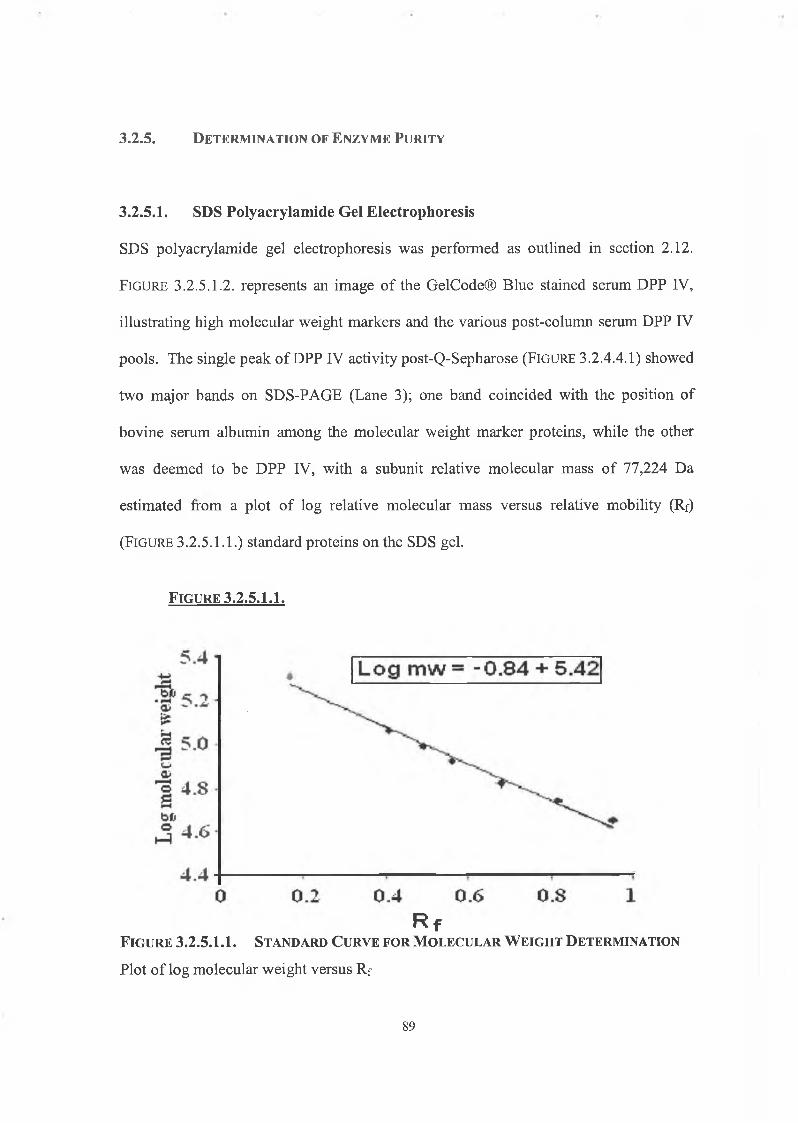
3 .2 .5 . D e t e r m in a t io n o f E n z y m e P u r it y
3.2.5.1. SDS Polyacrylamide Gel Electrophoresis
SDS polyacrylamide gel electrophoresis was performed as outlined in section 2.12.
F ig u r e 3.2.5.1.2. represents an image of the GelCode® Blue stained serum DPP IV,
illustrating high molecular weight markers and the various post-column serum DPP IV
pools. The single peak of DPP IV activity post-Q-Sepharose (F ig u r e 3.2.4.4.1) showed
two major bands on SDS-PAGE (Lane 3); one band coincided with the position of
bovine serum albumin among the molecular weight marker proteins, while the other
was deemed to be DPP IV, with a subunit relative molecular mass of 77,224 Da
estimated from a plot of log relative molecular mass versus relative mobility (Rf)
(F ig u r e 3.2.5.1.1.) standard proteins on the SDS gel.
F i g u r e 3.2.5.I.I.
R fF i g u r e 3.2.5.I.I. S t a n d a r d C u r v e f o r M o l e c u l a r W e i g h t D e t e r m i n a t i o n
Plot of log molecular weight versus Rf
89
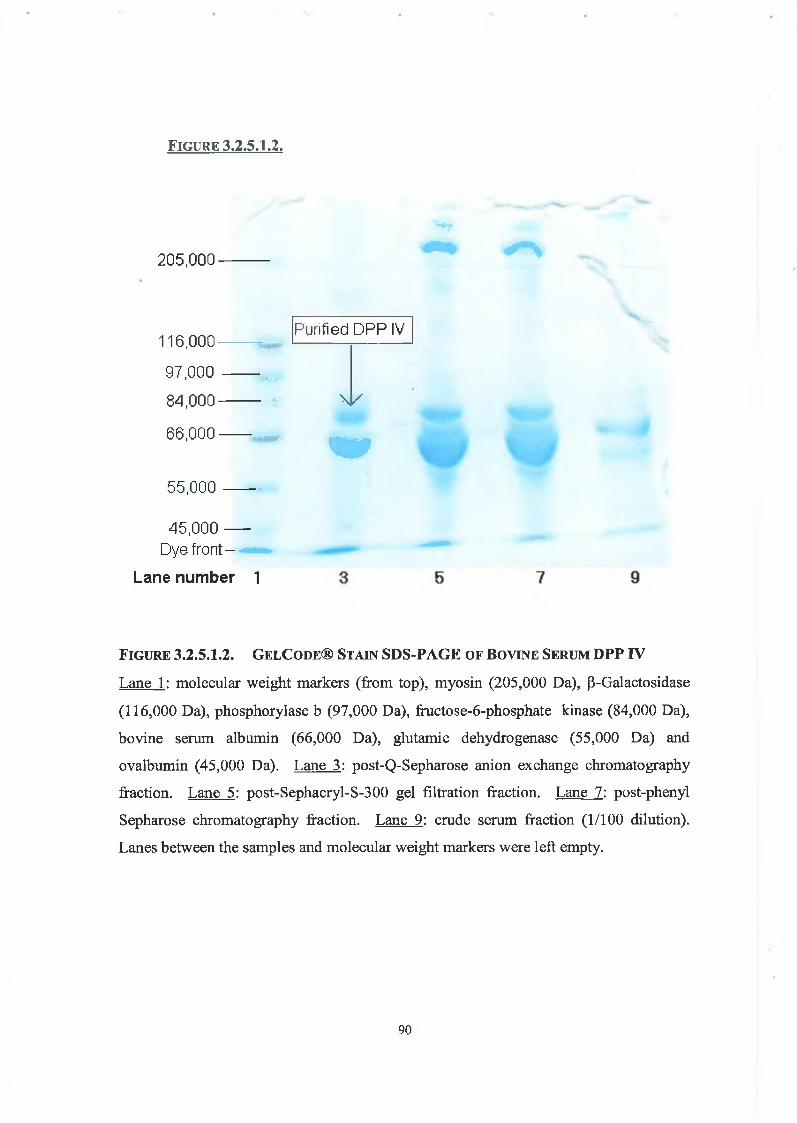
F ig u r e 3 .2 .5 .I .2 .
205 ,000 -
116,000
97.000
84 .000 -
66 .00 0 -
55.000
Purified DPP IV
45,000 -------
Dye front-
Lane number 1
\ K
m
F i g u r e 3 .2 .5 .1 .2 . G e lC o d e ® S t a in S D S -P A G E o f B o v in e S e r u m D P P IV
Lane 1: molecular weight markers (from top), myosin (205,000 Da), P-Galactosidase
(116,000 Da), phosphorylase b (97,000 Da), fructose-6-phosphate kinase (84,000 Da),
bovine serum albumin (66,000 Da), glutamic dehydrogenase (55,000 Da) and
ovalbumin (45,000 Da). Lane 3: post-Q-Sepharose anion exchange chromatography
fraction. Lane 5: post-Sephacryl-S-300 gel filtration fraction. Lane 7: post-phenyl
Sepharose chromatography fraction. Lane 9: crude serum fraction (1/100 dilution).
Lanes between the samples and molecular weight markers were left empty.
90
3.3. Discussion
Fluorometric assays rely upon the excitation of a fluorophore by electromagnetic
radiation at a specific wavelength, and the subsequent detection of emitted
electromagnetic radiation at a higher specific wavelength. The observed fluorescence
signal generally decreases as the solution becomes increasingly concentrated. This
phenomenon is known as the inner filter effect and includes all light-attenuating
processes - due not only to the fluorophore but also to any other chromophores that may
be present (Lloyd, 1981). There are other concentration-dependent processes that
reduce fluorescence intensities: intermolecular processes involving either ground or
excited states of a fluorophore or both are a common cause. Quenching molecules may
be present, e.g. oxygen in aerated solvents, or heavy atom perturbers such as residues of
halogenated solvents (Lloyd, 1981). In crude biological samples, the effect of this
phenomenon can be quite significant, leading to inaccurate determination of free AMC
concentrations within a particular reaction mixture.
To determine the extent of this effect and overcome this problem, free AMC standard
carves were constructed in a manner replicating standard assay conditions as outlined in
section 2 .4 .1 .1 . Results were recorded in section 3 .2 .2 . A significant difference in
fluorescence detection was observed when biological samples were added; the effect of
this on standard curves is clearly demonstrated in FIGURE 3 .2 .2 .2 . Both samples
contributed to the inner filter effect and 4 1 % of filtering was observed when crude
bovine serum was added, yet only 2% filtering was demonstrated after the final step in
the purification was performed. However, it is important to account for this effect when
quantifying the enzymatic activity present in a sample and, therefore, the preparation of
“filtered” standard curves is a useful method to ensure the accuracy of results obtained
91
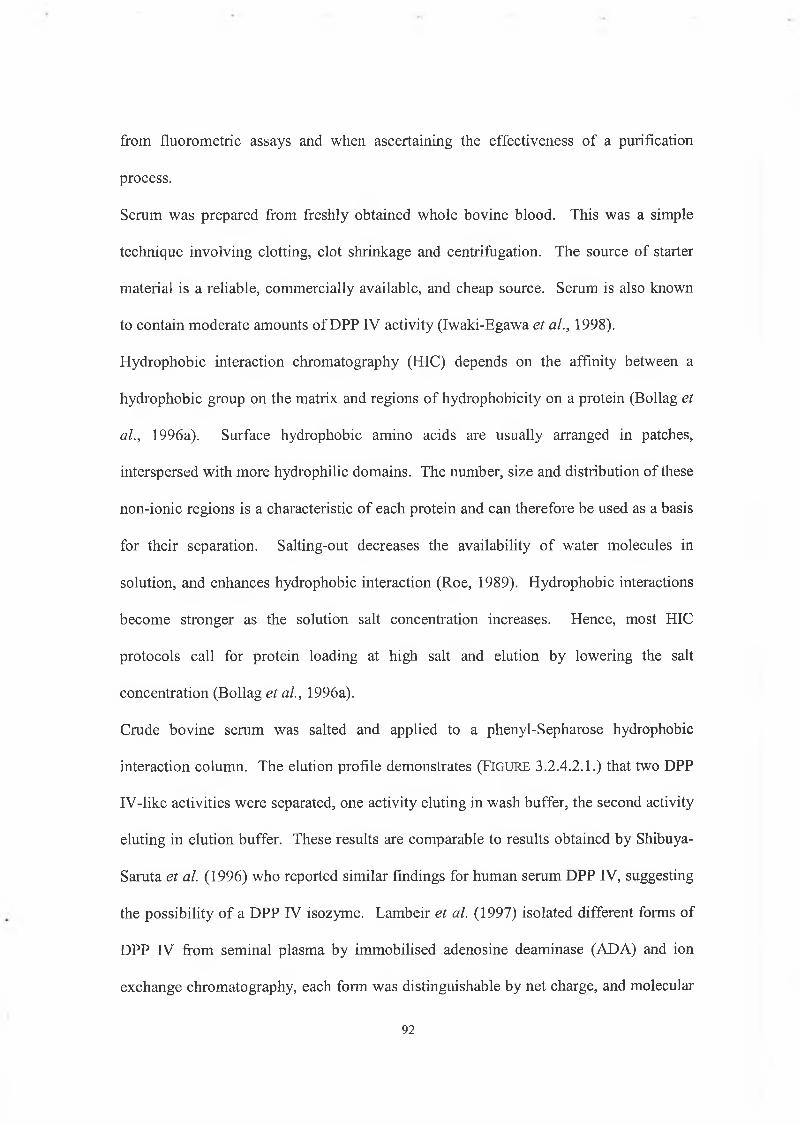
from fluorometric assays and when ascertaining the effectiveness of a purification
process.
Serum was prepared from freshly obtained whole bovine blood. This was a simple
technique involving clotting, clot shrinkage and centrifugation. The source of starter
material is a reliable, commercially available, and cheap source. Serum is also known
to contain moderate amounts of DPP IV activity (Iwaki-Egawa et al., 1998).
Hydrophobic interaction chromatography (HIC) depends on the affinity between a
hydrophobic group on the matrix and regions of hydrophobicity on a protein (Bollag et
al., 1996a). Surface hydrophobic amino acids are usually arranged in patches,
interspersed with more hydrophilic domains. The number, size and distribution of these
non-ionic regions is a characteristic of each protein and can therefore be used as a basis
for their separation. Salting-out decreases the availability of water molecules in
solution, and enhances hydrophobic interaction (Roe, 1989). Hydrophobic interactions
become stronger as the solution salt concentration increases. Hence, most HIC
protocols call for protein loading at high salt and elution by lowering the salt
concentration (Bollag et al., 1996a).
Crude bovine serum was salted and applied to a phenyl-Sepharose hydrophobic
interaction column. The elution profile demonstrates (F ig u r e 3.2.4.2.1.) that two DPP
IV-like activities were separated, one activity eluting in wash buffer, the second activity
eluting in elution buffer. These results are comparable to results obtained by Shibuya-
Saruta et al. (1996) who reported similar findings for human serum DPP IV, suggesting
the possibility of a DPP IV isozyme. Lambeir et al. (1997) isolated different forms of
DPP IV from seminal plasma by immobilised adenosine deaminase (ADA) and ion
exchange chromatography, each form was distinguishable by net charge, and molecular
92
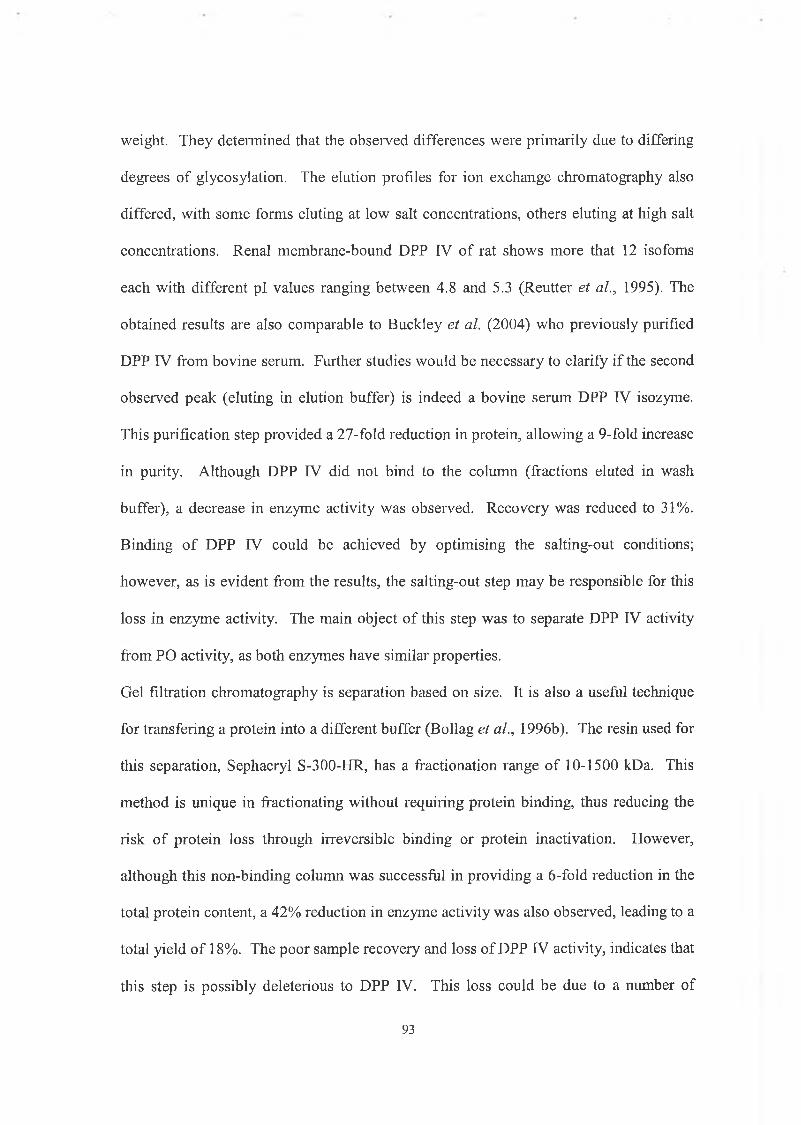
weight. They determined that the observed differences were primarily due to differing
degrees of glycosylation. The elution profiles for ion exchange chromatography also
differed, with some forms eluting at low salt concentrations, others eluting at high salt
concentrations. Renal membrane-bound DPP IV of rat shows more that 12 isofoms
each with different pi values ranging between 4.8 and 5.3 (Reutter et al., 1995). The
obtained results are also comparable to Buckley et al. (2004) who previously purified
DPP IV from bovine serum. Further studies would be necessary to clarify if the second
observed peak (eluting in elution buffer) is indeed a bovine serum DPP IV isozyme.
This purification step provided a 27-fold reduction in protein, allowing a 9-fold increase
in purity. Although DPP IV did not bind to the column (fractions eluted in wash
buffer), a decrease in enzyme activity was observed. Recovery was reduced to 31%.
Binding of DPP IV could be achieved by optimising the salting-out conditions;
however, as is evident from the results, the salting-out step may be responsible for this
loss in enzyme activity. The main object of this step was to separate DPP IV activity
from PO activity, as both enzymes have similar properties.
Gel filtration chromatography is separation based on size. It is also a useful technique
for transfering a protein into a different buffer (Bollag et al., 1996b). The resin used for
this separation, Sephacryl S-300-HR, has a fractionation range of 10-1500 kDa. This
method is unique in fractionating without requiring protein binding, thus reducing the
risk of protein loss through irreversible binding or protein inactivation. However,
although this non-binding column was successful in providing a 6-fold reduction in the
total protein content, a 42% reduction in enzyme activity was also observed, leading to a
total yield of 18%. The poor sample recovery and loss of DPP IV activity, indicates that
this step is possibly deleterious to DPP IV. This loss could be due to a number of
93
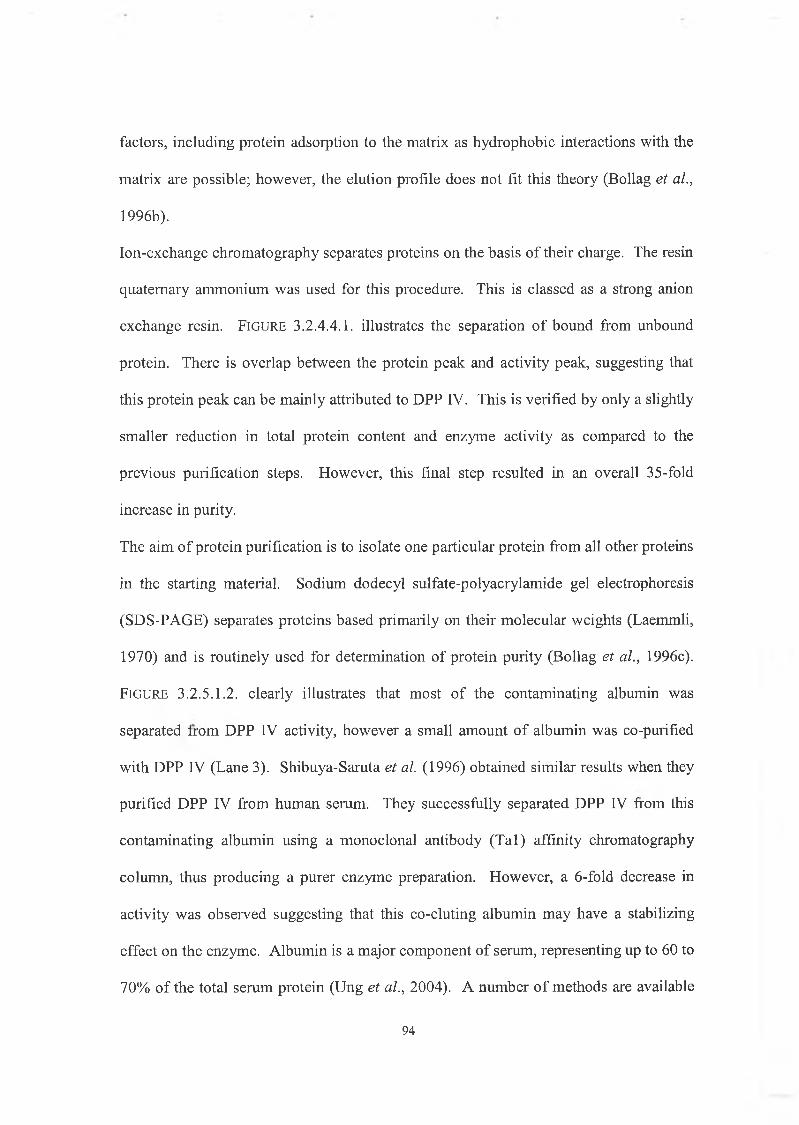
factors, including protein adsoiption to the matrix as hydrophobic interactions with the
matrix are possible; however, the elution profile does not fit this theory (Bollag et al.,
1996b).
Ion-exchange chromatography separates proteins on the basis of their charge. The resin
quaternary ammonium was used for this procedure. This is classed as a strong anion
exchange resin. F ig u r e 3.2.4.4.I. illustrates the separation of bound from unbound
protein. There is overlap between the protein peak and activity peak, suggesting that
this protein peak can be mainly attributed to DPP IV. This is verified by only a slightly
smaller reduction in total protein content and enzyme activity as compared to the
previous purification steps. However, this final step resulted in an overall 35-fold
increase in purity.
The aim of protein purification is to isolate one particular protein from all other proteins
in the starting material. Sodium dodecyl sulfate-polyacrylamide gel electrophoresis
(SDS-PAGE) separates proteins based primarily on their molecular weights (Laemmli,
1 9 7 0 ) and is routinely used for determination of protein purity (Bollag et al., 19 9 6 c).
F ig u r e 3 .2 .5 .1 .2 . clearly illustrates that most of the contaminating albumin was
separated from DPP IV activity, however a small amount of albumin was co-purified
with DPP IV (Lane 3 ). Shibuya-Saruta et al. (1 9 9 6 ) obtained similar results when they
purified DPP IV from human serum. They successfully separated DPP IV from this
contaminating albumin using a monoclonal antibody (Tal) affinity chromatography
column, thus producing a purer enzyme preparation. However, a 6-fold decrease in
activity was observed suggesting that this co-eluting albumin may have a stabilizing
effect on the enzyme. Albumin is a major component of serum, representing up to 6 0 to
7 0 % of the total serum protein (Ung et al., 2 0 0 4 ) . A number of methods are available
94
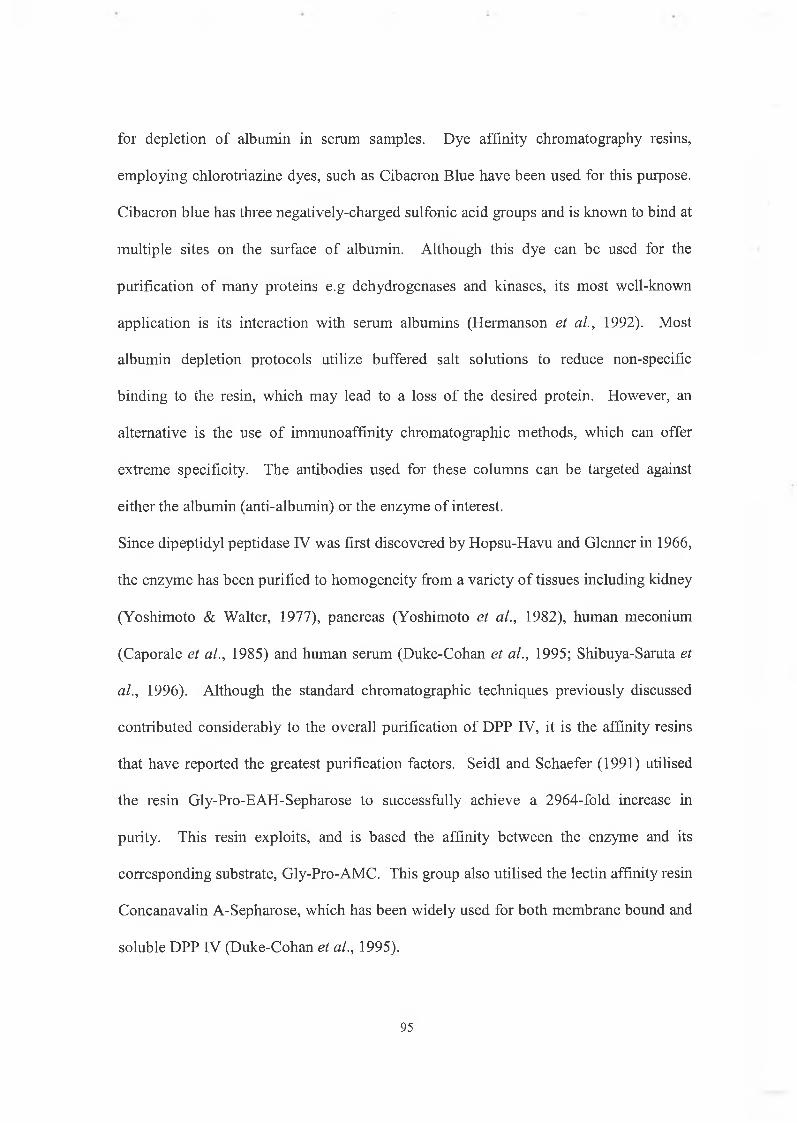
for depletion of albumin in serum samples. Dye affinity chromatography resins,
employing chlorotriazine dyes, such as Cibacron Blue have been used for this purpose.
Cibacron blue has three negatively-charged sulfonic acid groups and is known to bind at
multiple sites on the surface of albumin. Although this dye can be used for the
purification of many proteins e.g dehydrogenases and kinases, its most well-known
application is its interaction with serum albumins (Hermanson et al., 1992). Most
albumin depletion protocols utilize buffered salt solutions to reduce non-specific
binding to the resin, which may lead to a loss of the desired protein. However, an
alternative is the use of immunoaffinity chromatographic methods, which can offer
extreme specificity. The antibodies used for these columns can be targeted against
either the albumin (anti-albumin) or the enzyme of interest.
Since dipeptidyl peptidase IV was first discovered by Hopsu-Havu and Glenner in 1966,
the enzyme has been purified to homogeneity from a variety of tissues including kidney
(Yoshimoto & Walter, 1977), pancreas (Yoshimoto et al., 1982), human meconium
(Caporale et al., 1985) and human serum (Duke-Cohan et al., 1995; Shibuya-Saruta et
al., 1996). Although the standard chromatographic techniques previously discussed
contributed considerably to the overall purification of DPP IV, it is the affinity resins
that have reported the greatest purification factors. Seidl and Schaefer (1991) utilised
the resin Gly-Pro-EAH-Sepharose to successfully achieve a 2964-fold increase in
purity. This resin exploits, and is based the affinity between the enzyme and its
corresponding substrate, Gly-Pro-AMC. This group also utilised the lectin affinity resin
Concanavalin A-Sepharose, which has been widely used for both membrane bound and
soluble DPP IV (Duke-Cohan et al., 1995).
95
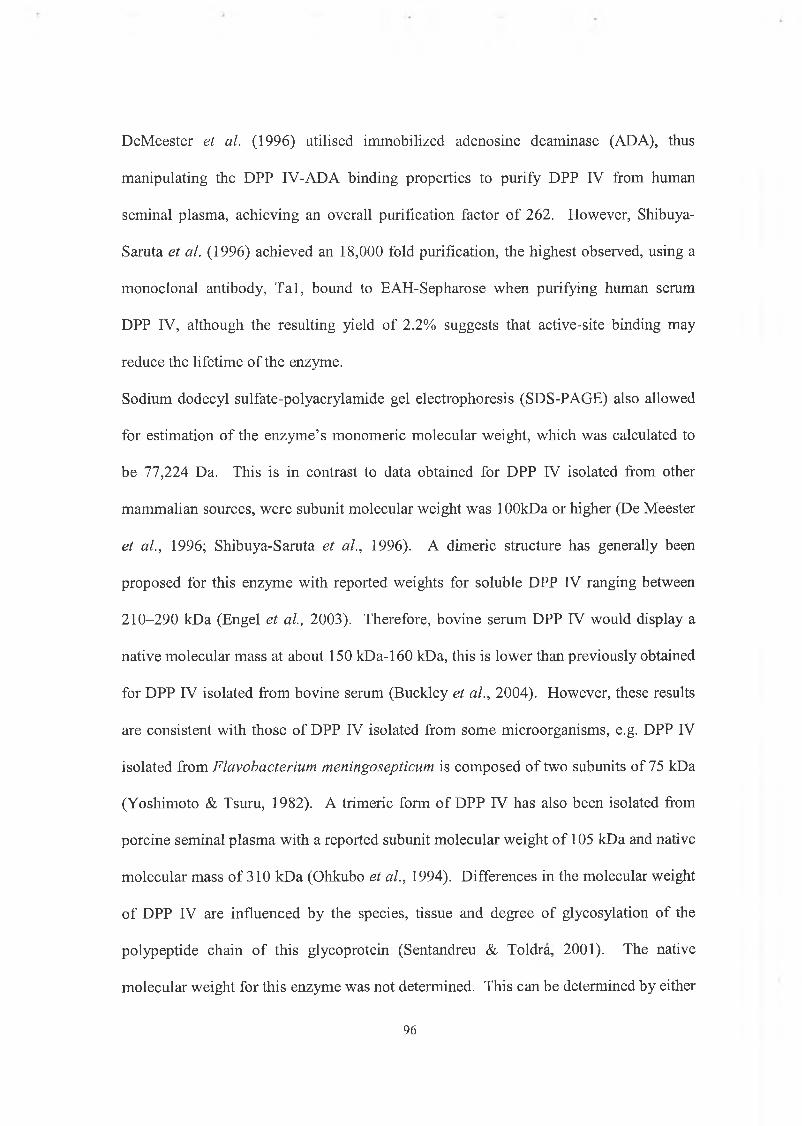
DeMeester et al. (1996) utilised immobilized adenosine deaminase (ADA), thus
manipulating the DPP IV-AD A binding properties to purify DPP IV from human
seminal plasma, achieving an overall purification factor of 262. However, Shibuya-
Saruta et al. (1996) achieved an 18,000 fold purification, the highest observed, using a
monoclonal antibody, Tal, bound to EAH-Sepharose when purifying human serum
DPP IV, although the resulting yield of 2.2% suggests that active-site binding may
reduce the lifetime of the enzyme.
Sodium dodecyl sulfate-polyacrylamide gel electrophoresis (SDS-PAGE) also allowed
for estimation of the enzyme’s monomeric molecular weight, which was calculated to
be 77,224 Da. This is in contrast to data obtained for DPP IV isolated from other
mammalian sources, were subunit molecular weight was lOOkDa or higher (De Meester
et al., 1996; Shibuya-Saruta et al., 1996). A dimeric structure has generally been
proposed for this enzyme with reported weights for soluble DPP IV ranging between
210-290 kDa (Engel et al., 2003). Therefore, bovine serum DPP IV would display a
native molecular mass at about 150 kDa-160 kDa, this is lower than previously obtained
for DPP IV isolated from bovine serum (Buckley et al., 2004). However, these results
are consistent with those of DPP IV isolated from some microorganisms, e.g. DPP IV
isolated from Flavobacterium meningosepticum is composed of two subunits of 75 kDa
(Yoshimoto & Tsuru, 1982). A trimeric form of DPP IV has also been isolated from
porcine seminal plasma with a reported subunit molecular weight of 105 kDa and native
molecular mass of 310 kDa (Ohkubo et al., 1994). Differences in the molecular weight
of DPP IV are influenced by the species, tissue and degree of glycosylation of the
polypeptide chain of this glycoprotein (Sentandreu & Toldra, 2001). The native
molecular weight for this enzyme was not determined. This can be determined by either
96
native polyacrylamide gel electrophoresis or by gel filtration (Bollag et al., 1996b).
Performing this step would have established whether the enzyme has a dimeric or
trimeric structure. However the main purpose of SDS-PAGE was to determine the
purity of the purified enzyme preparation.
97
C h a p te r 4
S tud ies o n D ipeptidyl Peptidase IV
4 .1 . R e su l t s - A ssa y a n d S t a b il it y S t u d ie s o n D P P IV
All of the upcoming graphs illustrate data points that represent the average of triplicate
fluorescence intensity or absorbance readings (n=3), minus the blank measurement,
standard deviation ± 5%. All error bars represent the standard error.
4.1.1. A s s a y D e v e l o p m e n t
4.1.1.1. Autodigestion Assay
The process of DPP IV autodigestion was examined as described in section 2.5.1.
F ig u r e 4.1.1.1.1. demonstrates that at 37°C no autodigestion was observed over a
period of 240 minutes.
4.1.1.2. Linearity of Enzyme Assay with Respect to Time
The stability of DPP IV and its ability to cleave its corresponding substrate Gly-Pro-
AMC with respect to time was examined as described in section 2.5.2.1. F ig u r e
4.1.1.2.1. demonstrates that serum DPP IV activity is linear (R2: 0.99) over a period of
120 minutes.
4.1.1.3. Linearity of Assay with Respect to Enzyme Concentration
Linearity of purified DPP IV degrading activity with respect to enzyme concentration
was determined as outlined in section 2 .5 .3 .1 . F ig u r e 4 .1 .1 .3 .1 . illustrates that th e
enzyme assay is linear (R2: 0.98) with respect to enzyme concentration.
98
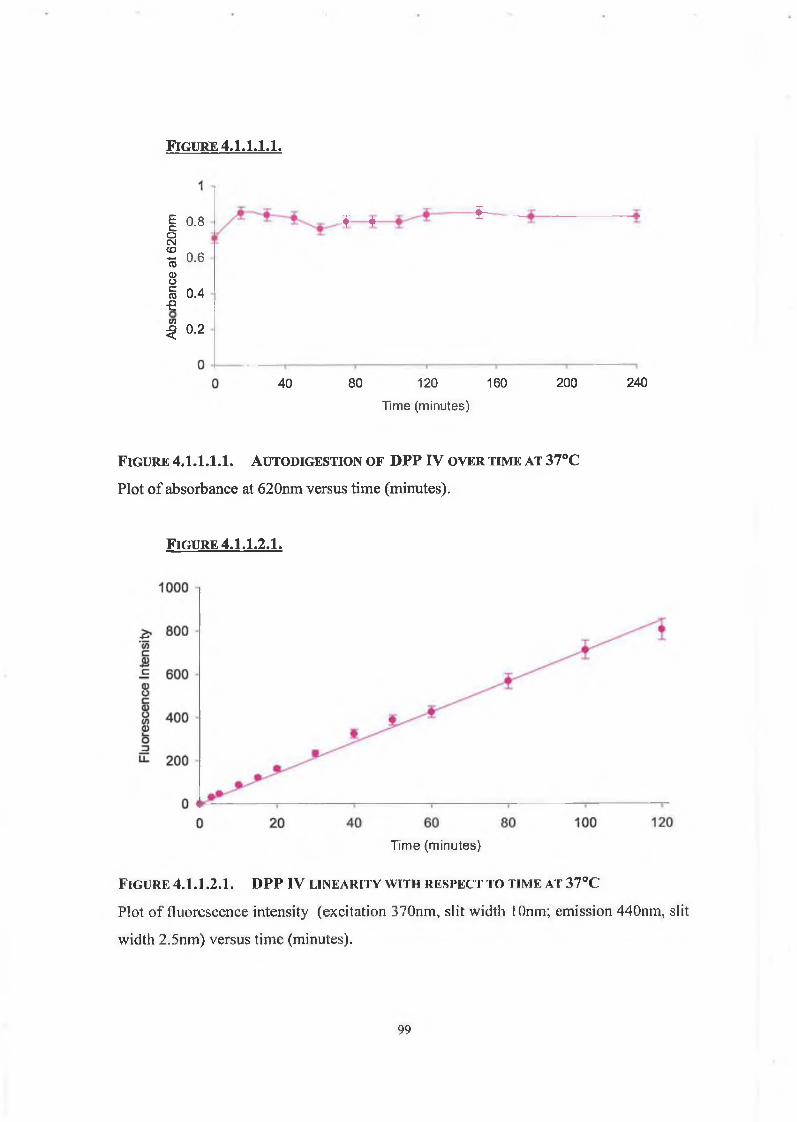
F i g u r e 4.I.I.I.I.
I 0.8oCM CD - 0.6 CD
8g 0.4-eI 0.2
40
* r - i r ■Î--------
80 120 160 Time (minutes)
200 240
F ig u r e 4.1.1.1.1, a u t o d ig e s t io n o f DPP IV o v e r t im e a t 3 7 °C
Plot of absorbance at 620nm versus time (minutes).
F ig u r e 4 .1 .L 2.1»
Time (minutes)
F ig u r e 4.1.1.2.1. DPP IV l in e a r it y w it h r e s p e c t t o t im e a t 3 7 °C
Plot of fluorescence intensity (excitation 370nm, slit width 1 Onm; emission 440nm, slit
width 2.5nm) versus time (minutes).
99
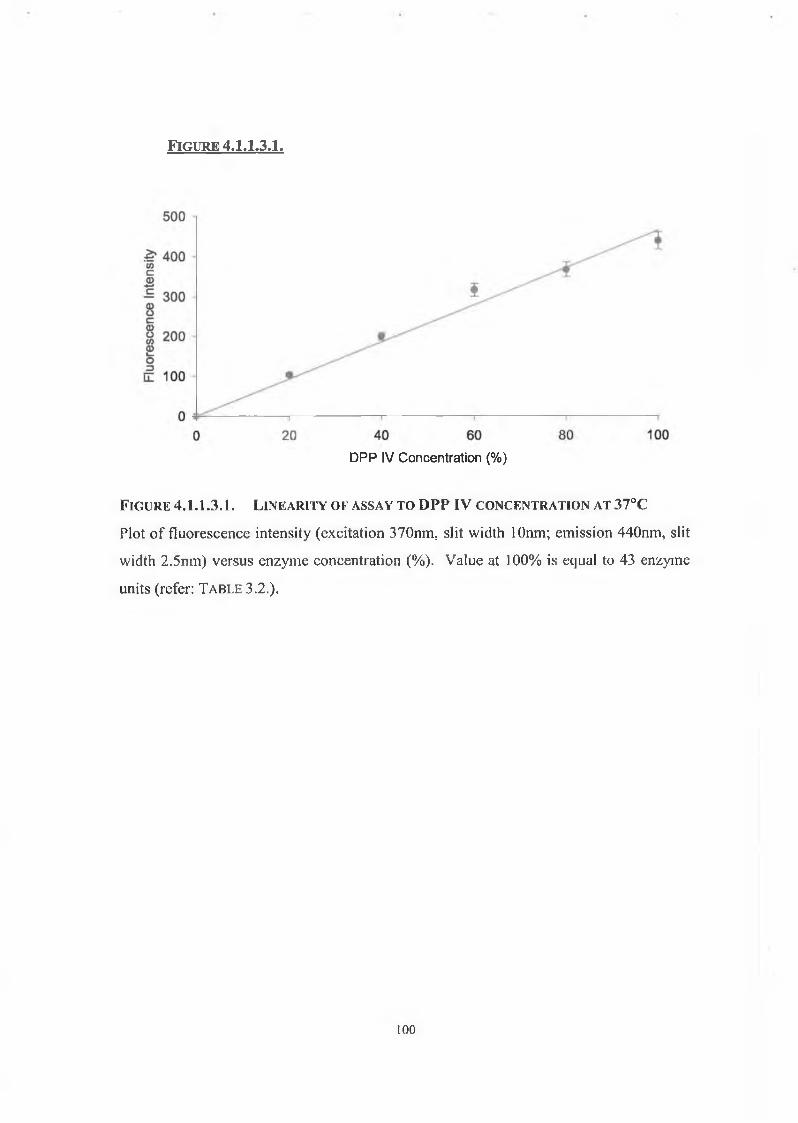
Figure 4.1.L3.1.
D P P IV C o n c e n tr a t io n (% )
F ig u r e 4.1.1.3.1. L in e a r it y o f a s s a y t o DPP IV c o n c e n t r a t io n a t 37°C
Plot of fluorescence intensity (excitation 370nm, slit width lOnm; emission 440nm, slit
width 2.5nm) versus enzyme concentration (%). Value at 100% is equal to 43 enzyme
units (refer: T a b l e 3.2.).
1 0 0
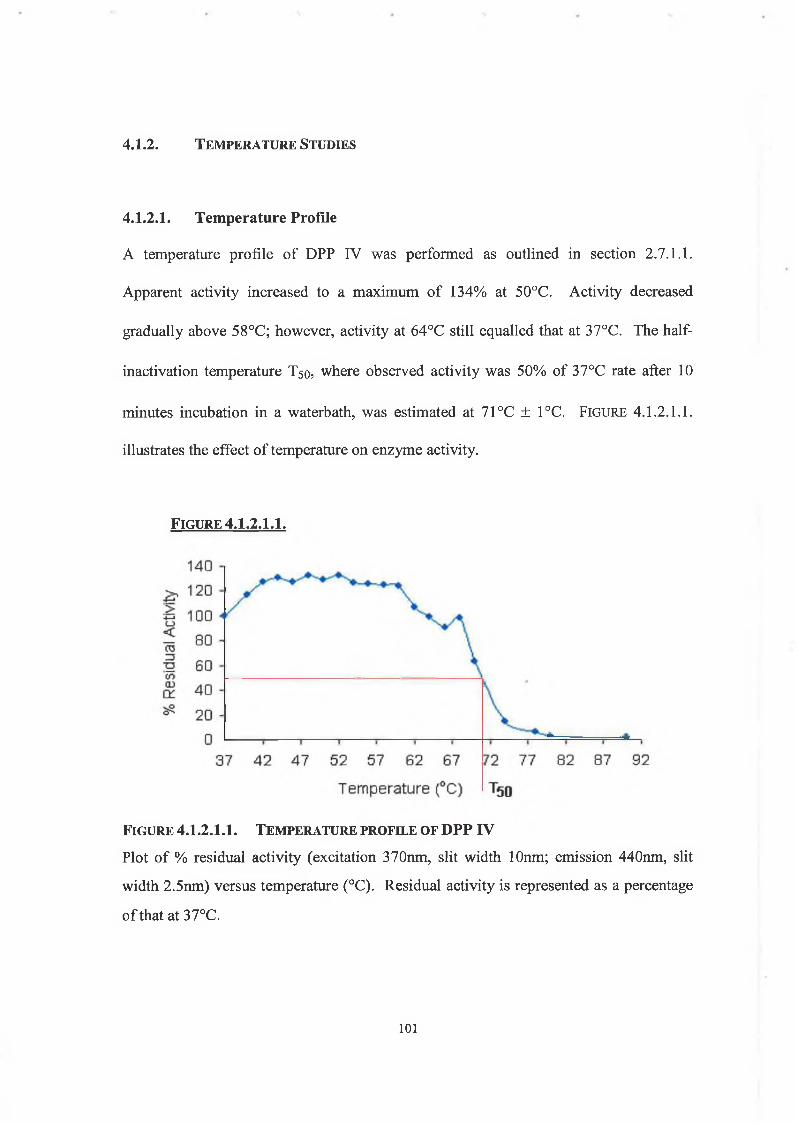
4 .1 .2 . T e m p e r a t u r e S t u d ie s
4.1.2.1. Temperature Profile
A temperature profile of DPP IV was performed as outlined in section 2.7.1.1.
Apparent activity increased to a maximum of 134% at 50°C. Activity decreased
gradually above 58°C; however, activity at 64°C still equalled that at 37°C. The half
inactivation temperature T50, where observed activity was 50% of 37°C rate after 10
minutes incubation in a waterbath, was estimated at 71°C ± 1°C. FIGURE 4.1.2.1.1.
illustrates the effect of temperature on enzyme activity.
F ig u r e 4.1.2.1.1,
F ig u r e 4.I.2.I.I. T e m p e r a t u r e p r o f il e o f DPP IV
Plot of % residual activity (excitation 370nm, slit width lOnm; emission 440nm, slit
width 2.5nm) versus temperature (°C). Residual activity is represented as a percentage
of that at 37°C.
1 0 1
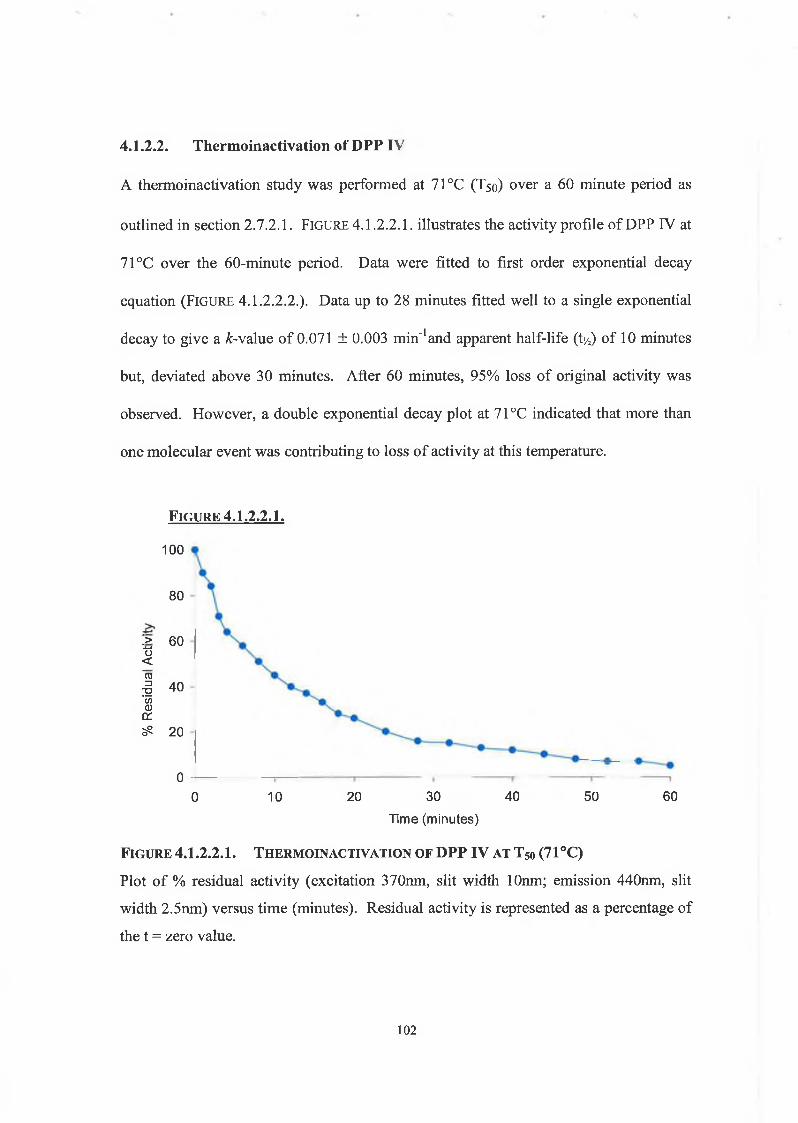
A thermoinactivation study was performed at 71 °C (T50) over a 60 minute period as
outlined in section 2.7.2.1. FIGURE 4.1.2.2.1. illustrates the activity profile of DPP IV at
71°C over the 60-minute period. Data were fitted to first order exponential decay
equation (F ig u r e 4.1.2.2.2.). Data up to 28 minutes fitted well to a single exponential
decay to give a ¿-value of 0.071 ± 0.003 min_1and apparent half-life (t*/2) of 10 minutes
but, deviated above 30 minutes. After 60 minutes, 95% loss of original activity was
observed. However, a double exponential decay plot at 71°C indicated that more than
one molecular event was contributing to loss of activity at this temperature.
F ig u r e 4.I.2.2.I.
100
80
:> 60-4—»o <to§ 40c/)<u 0£SS 20
00 10 20 30 40 50 60
Time (minutes)
F ig u r e 4.I.2.2.I. T h e r m o in a c t iv a t io n o f DPP IV a t T 50 (71°C)
Plot of % residual activity (excitation 370nm, slit width lOnm; emission 440nm, slit
width 2.5nm) versus time (minutes). Residual activity is represented as a percentage of
the t = zero value.
4.I.2.2. Thermoinactivation of DPP IV
102
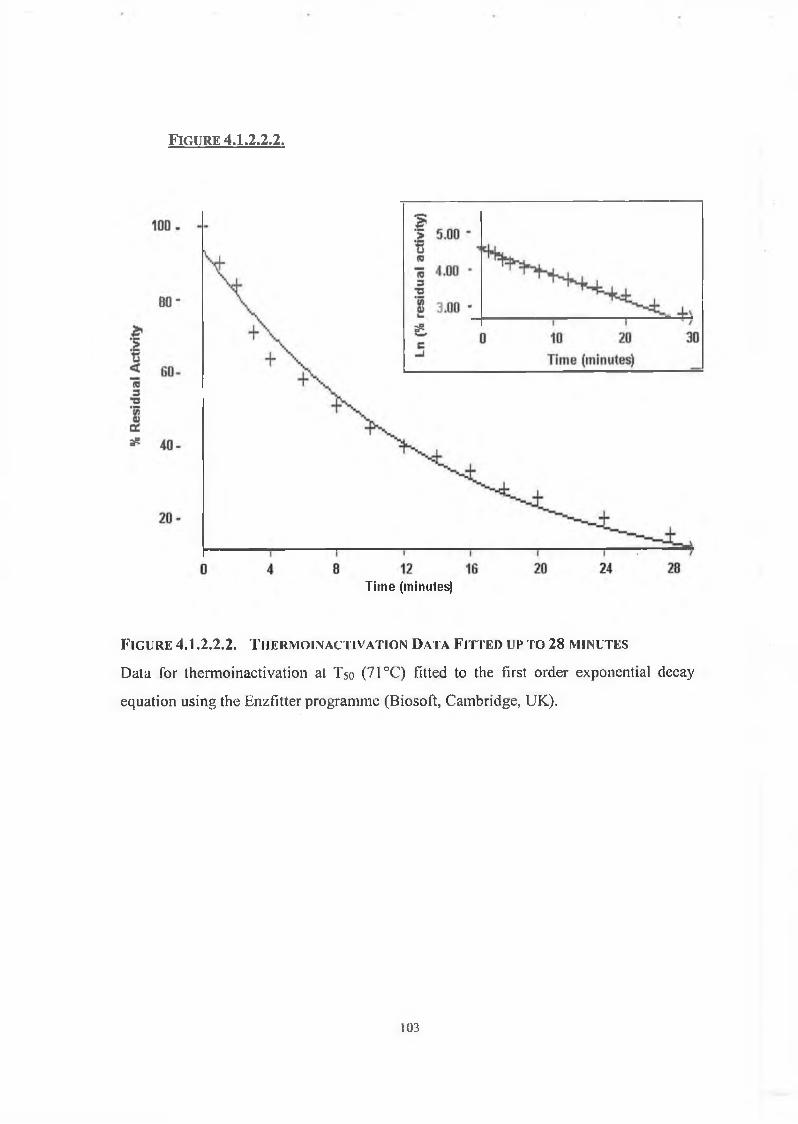
F i g u r e 4.I.2.2.2.
Time (minutes)
F ig u r e 4.1.2.2.2. T h e r m o i n a c t i v a t i o n D a t a F it t e d u p t o 28 m in u t e s
Data for thermo inactivation at T50 (71°C) fitted to the first order exponential decay
equation using the Enzfitter programme (Biosoft, Cambridge, UK).
103
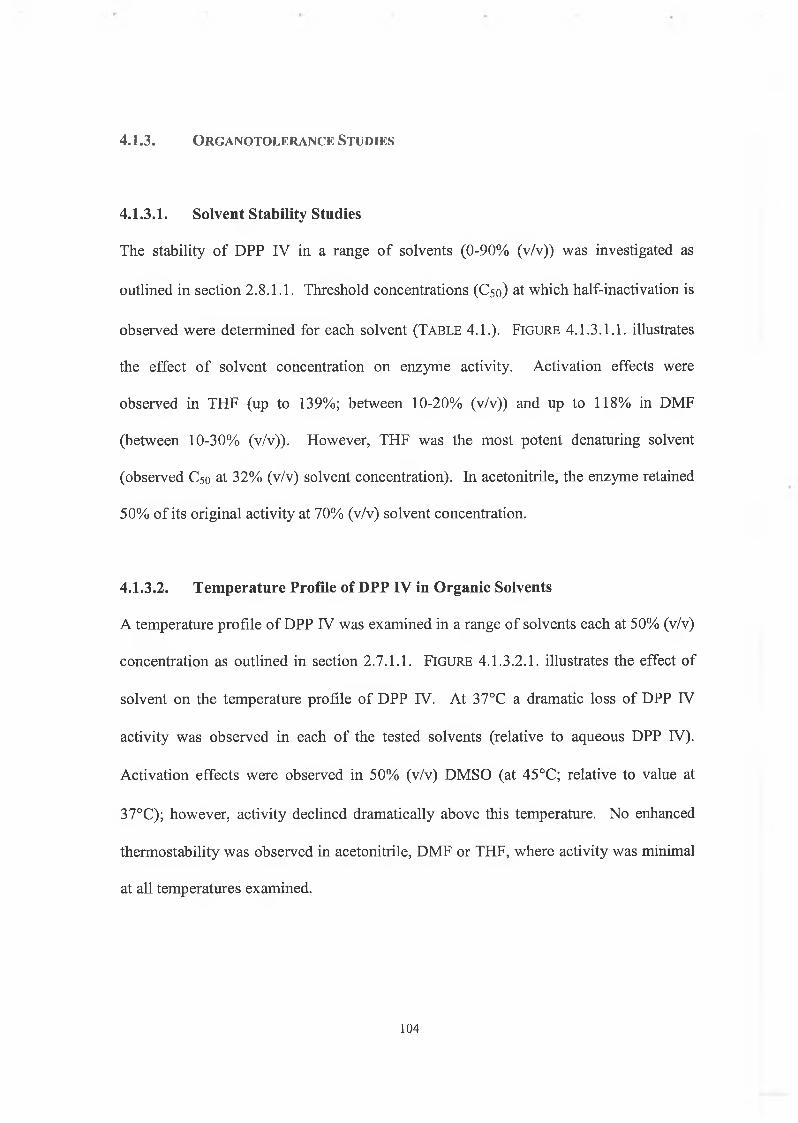
4 .1 .3 . O r g a n o t o l e r a n c e S t u d ie s
4.1.3.1. Solvent Stability Studies
The stability of DPP IV in a range of solvents (0-90% (v/v)) was investigated as
outlined in section 2.8.1.1. Threshold concentrations (C50) at which half-inactivation is
observed were determined for each solvent (T able 4.1.). F igure 4.1.3.1.1. illustrates
the effect of solvent concentration on enzyme activity. Activation effects were
observed in THF (up to 139%; between 10-20% (v/v)) and up to 118% in DMF
(between 10-30% (v/v)). However, THF was the most potent denaturing solvent
(observed C50 at 32% (v/v) solvent concentration). In acetonitrile, the enzyme retained
50% of its original activity at 70% (v/v) solvent concentration.
4.1.3.2. Temperature Profile of DPP IV in Organic Solvents
A temperature profile of DPP IV was examined in a range of solvents each at 50% (v/v)
concentration as outlined in section 2.7.1.1. F ig u r e 4.1.3.2.1. illustrates the effect of
solvent on the temperature profile of DPP TV. At 37°C a dramatic loss of DPP TV
activity was observed in each of the tested solvents (relative to aqueous DPP TV).
Activation effects were observed in 50% (v/v) DMSO (at 45°C; relative to value at
37°C); however, activity declined dramatically above this temperature. No enhanced
thermostability was observed in acetonitrile, DMF or THF, where activity was minimal
at all temperatures examined.
104
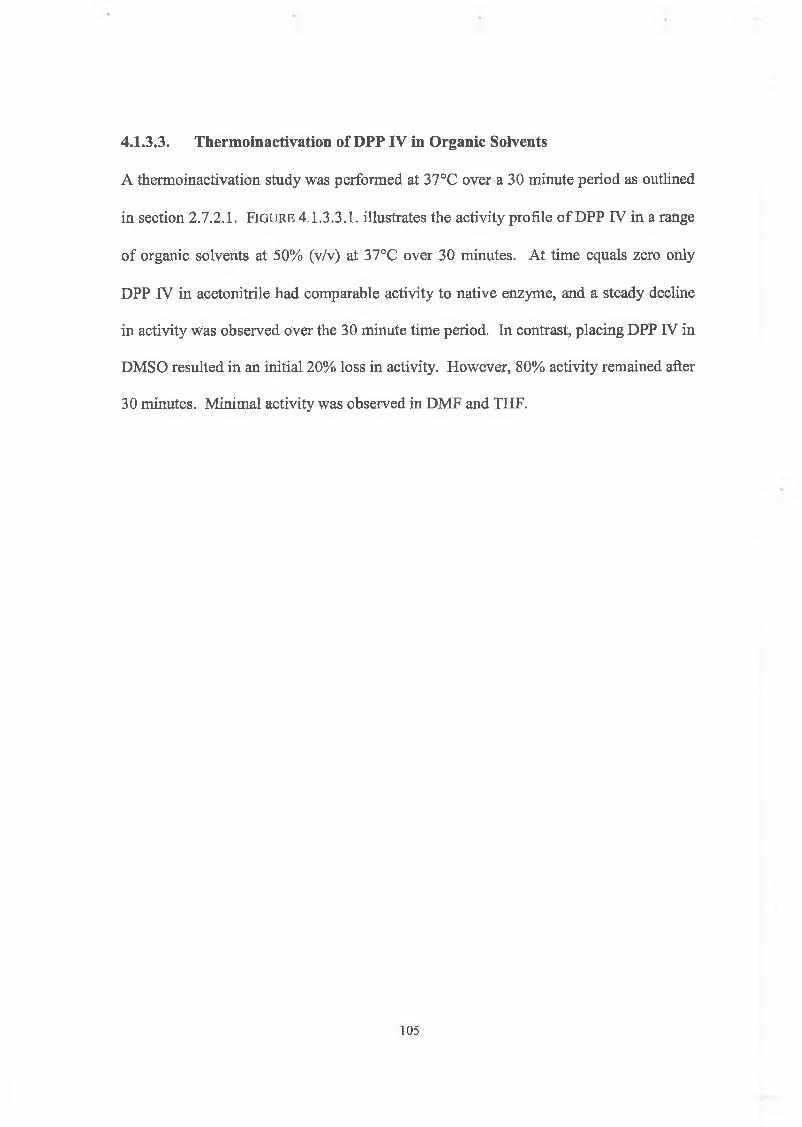
A thermoinactivation study was performed at 37°C over a 30 minute period as outlined
in section 2.7.2.1. F ig u r e 4.1.3.3.1. illustrates the activity profile o f DPP IV in a range
of organic solvents at 50% (v/v) at 37°C over 30 minutes. At time equals zero only
DPP IV in acetonitrile had comparable activity to native enzyme, and a steady decline
in activity Was observed over the 30 minute time period. In contrast, placing DPP IV in
DMSO resulted in an initial 20% loss in activity. However, 80% activity remained after
30 minutes. Minimal activity was observed in DMF and THF.
4.1.3.3. Thermoin activation of DPP IV in Organic Solvents
105
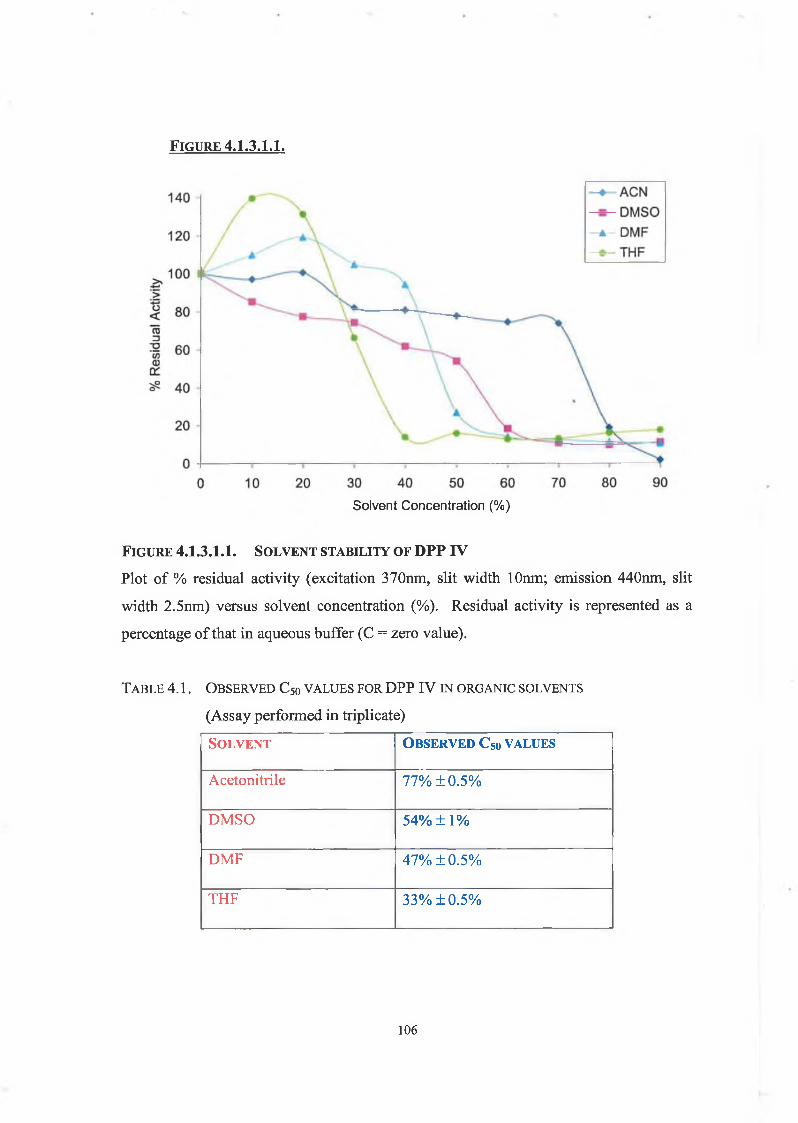
F i g u r e 4.I.3.I.I.
Solvent Concentration (%)
F ig u r e 4.13.1.1. So l v e n t s t a b il it y o f DPP IV
Plot of % residual activity (excitation 370nm, slit width lOnm; emission 440nm, slit
width 2.5nm) versus solvent concentration (%). Residual activity is represented as a
percentage of that in aqueous buffer (C = zero value).
T a b l e 4.1. O b s e r v e d C50 v a l u e s f o r DPP IV in o r g a n ic s o l v e n t s
(Assay performed in triplicate)
So l v e n t O b s e r v e d C50 v a l u e s
Acetonitrile 77% ±0.5%
DMSO 54% ±1%
DMF 47% ±0.5%
THF 33% ±0.5%
1 0 6
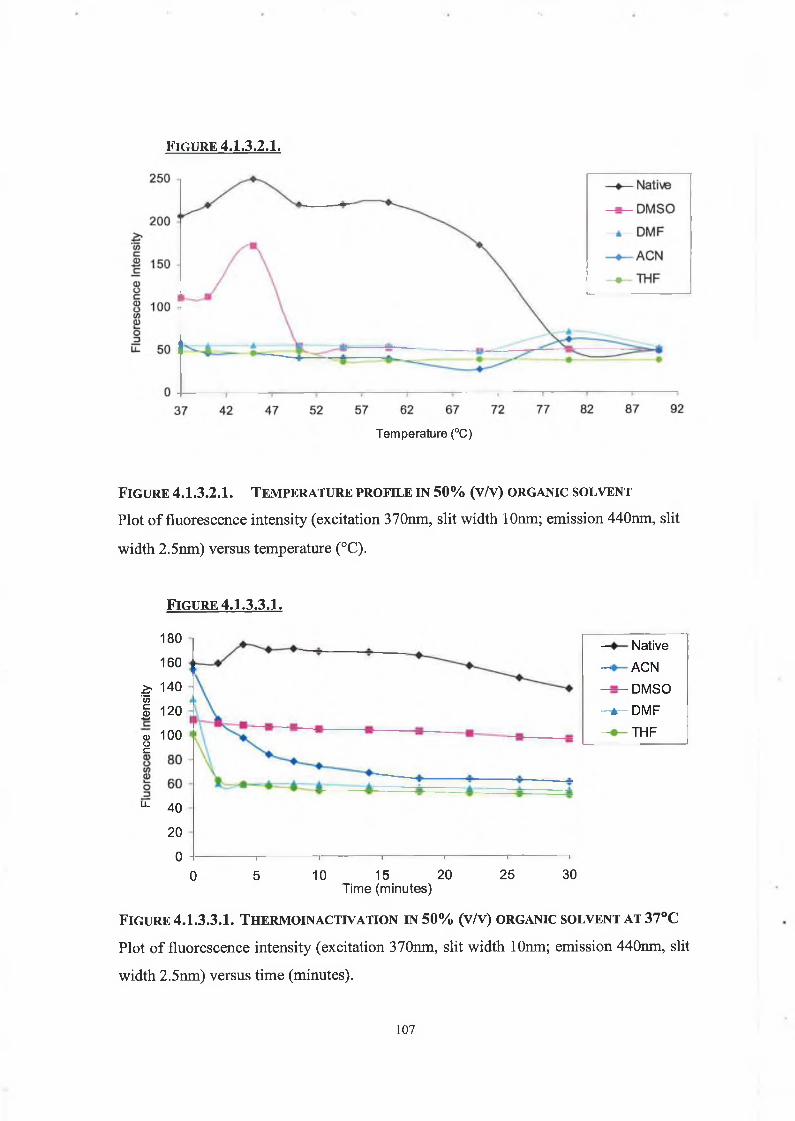
F i g u r e 4.I.3.2.I.
Temperature (°C)
F ig u r e 4.I.3.2.I. T e m p e r a t u r e p r o f il e in 50% (v/v) o r g a n ic s o l v e n t
Plot of fluorescence intensity (excitation 370nm, slit width lOnm; emission 440nm, slit
width 2.5nm) versus temperature (°C).
F ig u r e 4.1.3.3.1.
180
160
£ 140CO
I 120
u 100o c
“■ 40
20
0 i --------------------------- r ---------------------- t-------- --- ------------t----------------------------r -------------------- 1------------------------- 1
0 5 10 15 20 25 30T im e (m in u te s)
F ig u r e 4.I.3.3.I. T h e r m o in a c t iv a t io n i n 50% (v/v) o r g a n ic s o l v e n t a t 37°C
Plot of fluorescence intensity (excitation 370nm, slit width lOnm; emission 440nm, slit
width 2.5nm) versus time (minutes).
— Nat i ve
— A C N
— D M S O
— é — D M F
— T HF
107
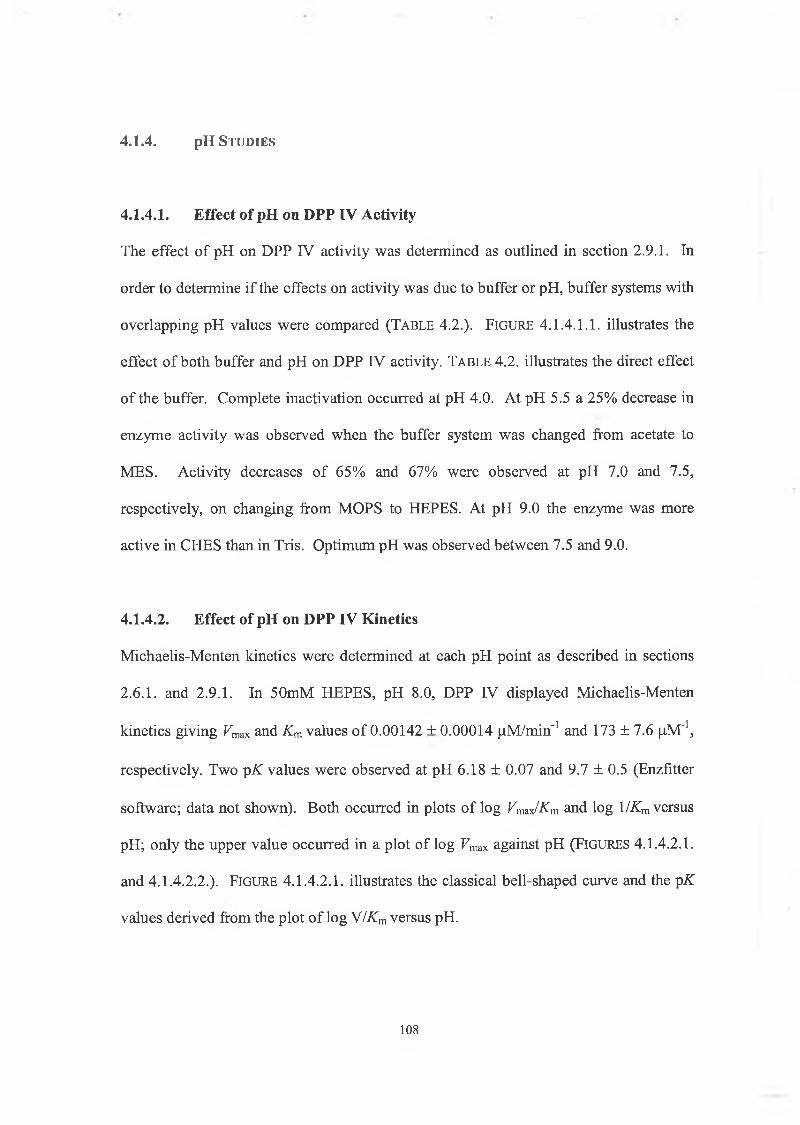
4 .1 .4 . p H S t u d ie s
4.1.4.1. Effect of pH on DPP IV Activity
The effect of pH on DPP IV activity was determined as outlined in section 2.9.1. In
order to determine if the effects on activity was due to buffer or pH, buffer systems with
overlapping pH values were compared (T a b l e 4.2.). F ig u r e 4.1.4.1.1. illustrates the
effect of both buffer and pH on DPP IV activity. T a b l e 4.2. illustrates the direct effect
of the buffer. Complete inactivation occurred at pH 4.0. At pH 5.5 a 25% decrease in
enzyme activity was observed when the buffer system was changed from acetate to
MES. Activity decreases of 65% and 67% were observed at pH 7.0 and 7.5,
respectively, on changing from MOPS to HEPES. At pH 9.0 the enzyme was more
active in CHES than in Tris. Optimum pH was observed between 7.5 and 9.0.
4.1.4.2. Effect of pH on DPP IV Kinetics
Michaelis-Menten kinetics were determined at each pH point as described in sections
2.6.1. and 2.9.1. In 50mM HEPES, pH 8.0, DPP IV displayed Michaelis-Menten
kinetics giving Vmax and Km values of 0.00142 + 0.00014 pM/min"1 and 173 ± 7.6 pM'1,
respectively. Two pK values were observed at pH 6.18 ± 0.07 and 9.7 ± 0.5 (Enzfitter
software; data not shown). Both occurred in plots of log VmdJK m and log l/Km versus
pH; only the upper value occurred in a plot of log Fmax against pH (F ig u r e s 4.1.4.2.1.
and 4.1.4.2.2.). F ig u r e 4.1.4.2.1. illustrates the classical bell-shaped curve and the pK
values derived from the plot of log V/Km versus pH.
108
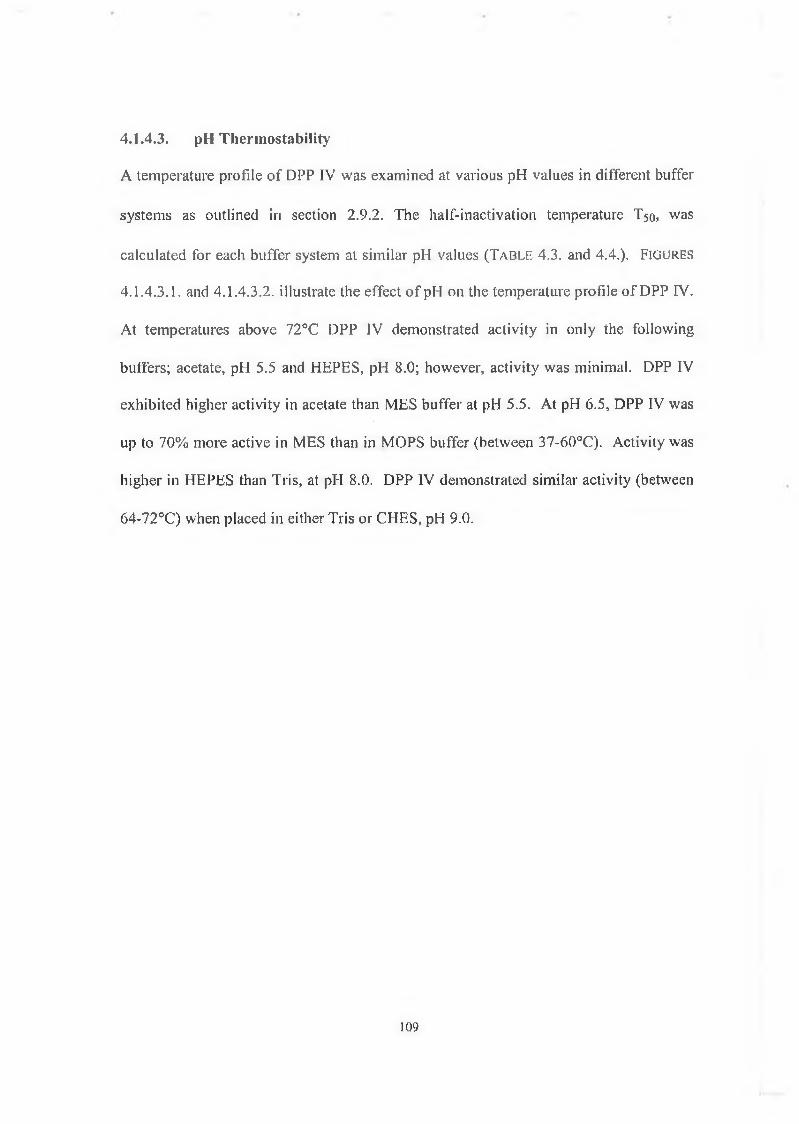
A temperature profile of DPP IV was examined at various pH values in different buffer
systems as outlined in section 2.9.2. The ha!f-inactivation temperature Tso, was
calculated for each buffer system at similar pH values (Ta b l e 4.3. and 4.4,). Figures
4.1.4.3.1. and 4.1.4.3.2. illustrate the effect o f pH on the temperature profile of DPP IV.
At temperatures above 72°C DPP IV demonstrated activity in only the following
buffers; acetate, pH 5.5 and I-IEPES, pH 8.0; however, activity was minimal. DPP IV
exhibited higher activity in acetate than MBS buffer at pH 5.5. At pH 6.5, DPP IV was
up to 70% more active in MES than in MOPS buffer (between 37-60°C). Activity was
higher in I-IEPES than Tris, at pH 8.0. DPP IV demonstrated similar activity (between
64-72°C) when placed in either Tris or CHES, pH 9.0.
4.1.4.3. pH Thermostability
109
F i g u r e 4.I.4.I.I.
350
300wc(1) 250
a>oc0)ow© &_o3
200
150
100
50
— Acetate — MES — á — MOPS
HEPES —a—Tris — CHES
F ig u r e 4.I.4.I.I. E f f e c t o f p H /b u f f e r o n DPP IV a c t iv it y
Plot of fluorescence intensity (excitation 370nm, slit width lOnm; emission 440nm, slit
width 2.5nm) versus pH.
T a b l e 4.2. C o m p a r is o n o f DPP I V a c t iv it y in v a r io u s b u f f e r s y s t e m s a t
s im il a r p H . (F I = F l u o r e s c e n c e In t e n s it y )
Buffer
*
pH -» 5.5
(FI)
6.5
(FI)
7.0
(FI)
7.5
(FI)
8.0
(FI)
9.0
(FI)
76.5
MES 58.1 207.7
MOPS 173.2 291.7 333.8
HEPES 99.9 108.2 197.5
Tris 159.5 163.4
CHES 300.1
n o
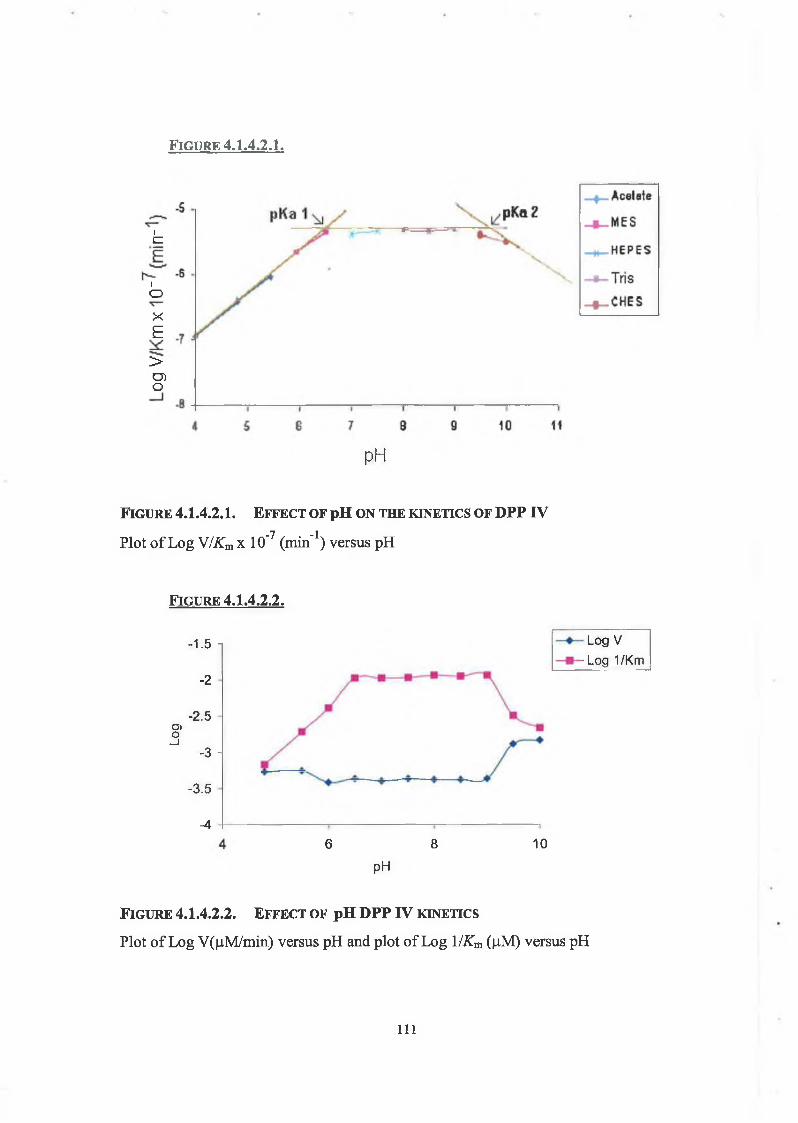
F i g u r e 4.I.4.2.I.
ic
IoxE
>CDo
pH
F ig u r e 4.1.4.2.1. E f f e c t o f pH o n t h e k in e t ic s o f DPP IV
Plot o f Log V/Km x 10’7 (min"1) versus pH
F ig u r e 4.I.4.2.2.
"1-5 1
-2
-2.5O)o_i-3 -
-3.5
-46 8
pH
Log V ■ Log 1/Km
10
F ig u r e 4.I.4.2.2. E f f e c t o f pH DPP IV k in e t ic s
Plot o f Log V(jj,M/min) versus pH and plot of Log l/Km (|iM) versus pH
i l l
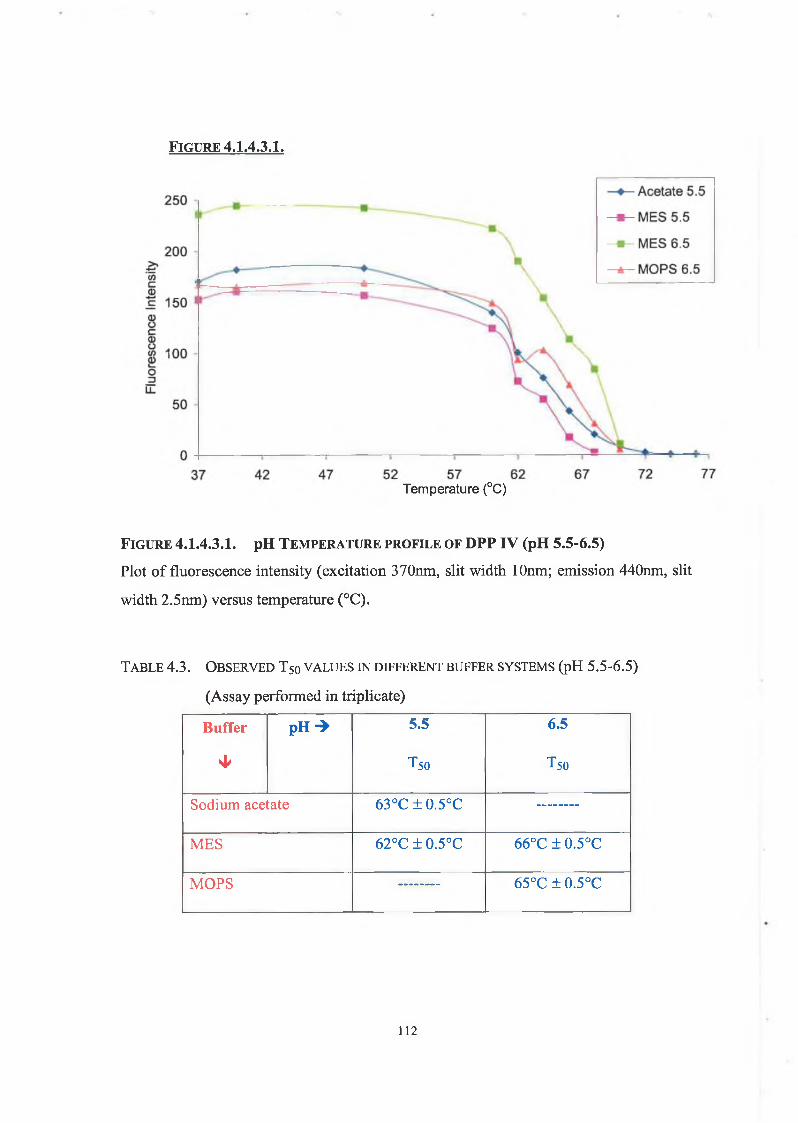
F i g u r e 4.I.4.3.I.
Temperature (°C)
F ig u r e 4.L4.3.1. pH T e m p e r a t u r e p r o f il e o f DPP IV (pH 5.5-6.S)
Plot of fluorescence intensity (excitation 370nm, slit width lOnm; emission 440nm, slit
width 2.5nm) versus temperature (°C).
T a b l e 4.3. O b s e r v e d T50 v a l u e s in d if f e r e n t b u f f e r s y s t e m s (pH 5.5-6.5)
(Assay performed in triplicate)
Buffer
*
p H -» 5.5
Tso
6.5
t 50
Sodium acetate 63°C ± 0.5°C
MES 62°C ± 0.5°C 66°C ± 0.5°C
MOPS 65°C±0.5°C
112
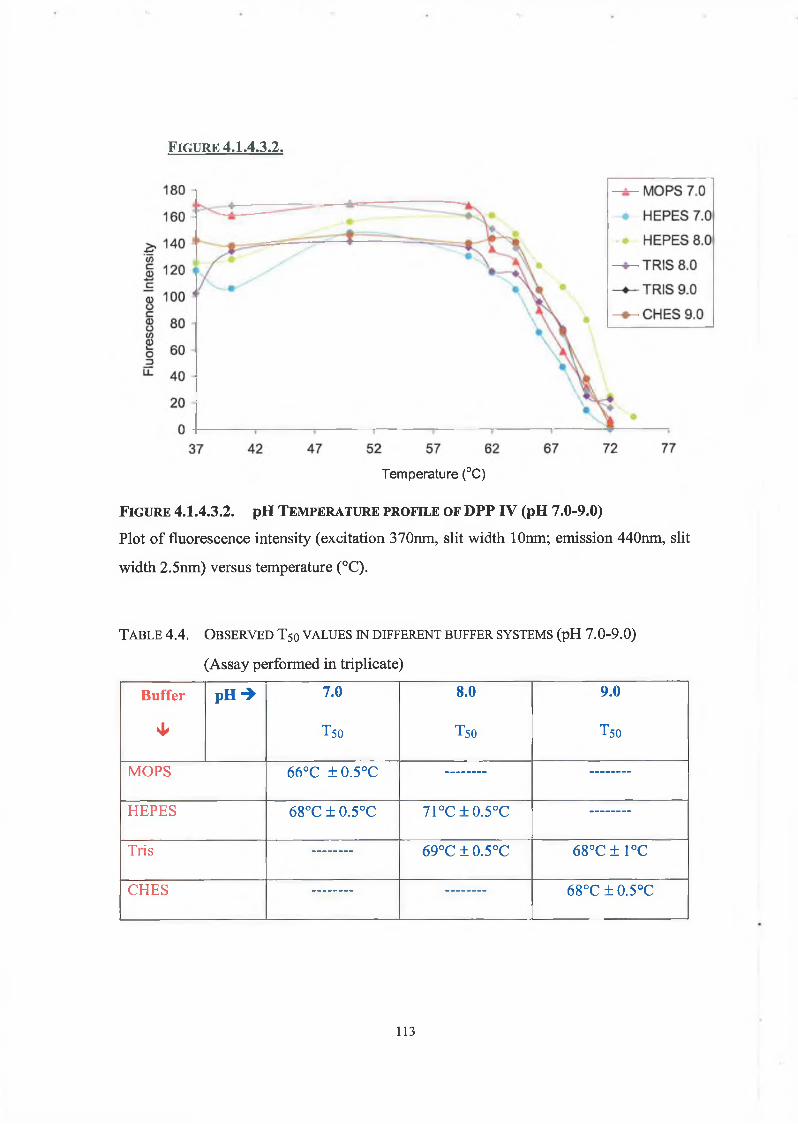
F i g u r e 4.I.4.3.2.
Temperature (°C)
F ig u r e 4.I.4.3.2. pH T e m p e r a t u r e p r o f il e o f DPP IV (pH 7.0-9.0)
Plot of fluorescence intensity (excitation 370nm, slit width lOnm; emission 440nm, slit
width 2.5nm) versus temperature (°C).
T a b l e 4.4. O b s e r v e d T50 v a l u e s in d if f e r e n t b u f f e r s y s t e m s (pH 7.0-9.0)
(Assay performed in triplicate)
Buffer
*
pH -» 7.0
T50
8.0
T50
9.0
T50
MOPS 66°C ±0.5°C
HEPES 68°C ± 0.5°C 71°C + 0.5°C
Tris 69°C ± 0.5°C 68°C± 1°C
CHES 68°C±0.5°C
113
Bickerstaff and Zhou (1993) developed a method to determine directly autolytic
processes of a protease. This method gives a direct indication of the loss of enzyme
protein with time and eliminates the need for gel electrophoresis (used to determine
autolytic products/protein reduction). It employs the Coomassie blue dye reagent and
enzyme alone, enabling the protein content to be monitored, while providing a direct
measurement of autolytic activity. No autolysis was observed over the assay period at
37°C (F ig u r e 4.1.1.1.1.). The resistance of DPP IV to proteolysis has been documented
(Lambeir et al., 1997).
F ig u r e 4.1.1.2.1. illustrates that bovine serum DPP IV catalysed the linear release of
AMC over the standard 60-minute assay period and up to 120 minutes, thus allowing
for longer analysis if required. This shows that DPP IV is not only stable but also, fully
active and saturated with sufficient substrate over this longer time.
Under given conditions, two enzyme molecules acting independently in solution will
transform twice as much substrate in a given time as one molecule, hence, the velocity
should be proportional to the enzyme concentration. This is found in a majority of cases
and is the basis of nearly all enzyme assay methods. However, deviations can occur,
and a linear relationship between velocity and enzyme concentration in the range used
should be established before any further attempt at kinetics, or before attempts to
calculate specific activities are made. Departures from linearity are due to an artefact of
the assay system, but there are cases where such behaviour is a property of the enzyme
itself (Dixon & Webb, 1979a).
4.2. Discussion
114
F ig u r e 4.1.1.3.1. illustrates that fluorescence intensity increases linearly and
proportionally with the increase in enzyme concentration at 37°C. Hence, the enzyme
hydrolyses at the same rate depending on the quantity o f enzyme present.
The rate of inactivation of an enzyme in solution increases rapidly with the temperature.
In most cases, inactivation becomes virtually instantaneous at temperatures well below
100°C and, in some cases, below 70°C (Dixon & Webb, 1979b). However, there are a
number o f enzymes that can withstand more extreme temperatures and remain
catalytically active. The growth optimum of citrate synthase from the thermophilic
Archaea Pyrococcus furiosus was found at 100°C (Danson & Hough, 1998). An
extremely thermoresistant serine protease from Staphylothermus marinus maintains
catalytic activity after 10 minutes at 135°C. A subtilisin-type serine protease detected in
Pyrococcus furiosus called pyrolysin was found to retain 50% of its activity after a 20-
minute 105°C challenge (Eichler, 2001).
An enzyme denatures at an elevated temperature due to unfolding of the protein
backbone. At high temperatures, the enzyme loses its “regular” non-covalent
interactions that support the native structure at moderate temperatures, and acquires
high temperature ‘non-native’ non-covalent bonds. As the temperature decreases, these
“irregular” non-covalent interactions, although thermodynamically unstable, remain and
the molecular mobility of the polypeptide chain decreases with decreasing temperature.
Hence, the protein remains denatured and cannot spontaneously reacquire the native
form at low temperature (Mozhaev & Martinek, 1982). However, it has been shown
that bonds and interactions at secondary and tertiary structural levels may indeed be
broken without loss of any activity. Moreover, enzymes may be “stabilized” or
“protected” against deactivation. Therefore, in these situations, it is important to know
115
not only the amount of denaturation required to abolish enzyme activity but also the
order of denaturation stages, which often plays a significant role. Hence, it is
reasonable to expect that more than one bond of a particular type or more than one
“sensitive structure” must be broken before significant changes in conformation leading
to loss of activity occur (Henley & Sadana, 1985). Bovine serum DPP IV demonstrated
an increase in catalytic activity up to 62°C (maximal activity observed at 50°C, T50 at
71°C), showing an apparent activation, as opposed to the expected thermal inactivation.
This is well above normal mammalian body temperature (37°C). Durinx et al. (2000)
investigated the thermostability of human serum DPP IV over the range 25-80°C. They
determined optimum temperature between 50-60°C. Similar results were obtained for
porcine seminal plasma DPP IV (Ohkubo et al., 1994). Yoshimoto et al. (1978) have
reported an optimum temperature of 60°C for lamb kidney DPP IV with 50% of activity
retained up to 72°C. Despite these reports, all routine and kinetic assays were
performed at physiological temperature, 37°C.
Activity loss with time was investigated at 71°C (T50). Double exponential decay at this
temperature indicated that more than one molecular event was contributing to loss of
activity at this temperature; however, data (up to 28 minutes) fitted well to single
exponential decay, allowing the estimation of an apparent half-life (10 minutes). The
first step in the inactivation of an oligomeric enzyme is the dissociation into nonactive
subunits (Trubetskoy & Torchilin, 1985). Kurganov et al. (2000) suggested that
denaturation proceeds by a dissociative mechanism, as determined by their investigation
of the thermal denaturation of rabbit skeletal muscle glycogen phosphorylase b. This
mechanism involves the reversible dissociation of the active dimer into the
corresponding inactive monomers, followed by the irreversible denaturation of the116
monomer. As demonstrated by the inactivation kinetics of DPP IV at 71°C, one
inactivation process seems to dominate over a short period of time, after which a second
process is apparent at longer times. This mechanism of dissociative unfolding could
therefore be applied to explain the inactivation kinetics of dimeric bovine serum DPP
IV. This unfolding could be monitored by gel electrophoresis, as the unfolded protein
migrates less rapidly than the compact folded forms (Creighton, 1993c). Structural
changes could be verified by LC-MS protein characterization analysis. This method
gives an accurate mass of the intact protein, observing the loss of one or more amino
acids. Denaturation can also be measured by fluorescence spectroscopy. This process
causes an abrupt increase in the fluorescence intensity and wavelength of maximal
emission (^max) as a result of contact between the aromatic chromophores (buried within
the hydrophobic core of the protein) with the polar (solvent) environment e.g.
fluorescence intensity increased and /-max shifts from 333nm to 340nm were observed
upon thermal denaturation of oc-chymotrypsin (Mozhaev et al., 1989).
For enzymes to exhibit their full catalytic properties they must have a strictly defined or
native conformation. A network of hydrogen bonds, electrostatic and hydrophobic
interactions, determines this conformation, which is maintained by an essential
hydration layer of tightly bound water. Replacement of this water shell with an organic
solvent may affect the nature of biocatalysis in a number of ways, solvents may; (1)
interact with the essential hydration layer o f the enzyme (2) disrupt the hydrogen bonds,
ionic or hydrophobic interactions, altering the native conformation by direct interaction
with the protein (Khmelnitsky et al., 1988; Dordick 1991). The concentration at which
half inactivation (C50) is observed was determined for each solvent (T a b l e 4.1). THF
was found to be the most deleterious solvent. This corresponds with it having the
117
highest denaturing capacity (DC = 100) correlating with the findings of Mozhaev et al.
(1989). However, an activation effect was observed up to 20% (v/v) concentration,
after which activity greatly decreased where little or no activity was exhibited above
40% (v/v) concentration. This activation effect may be explained in two ways (1)
changes in the conformation of the enzyme molecule caused by introducing the solvent
into the system or (2) the solvent participating in the enzymatic reaction by acting as an
additional nucleophile in the deacylation step (Khmelnitsky et al., 1988). The enzyme
was most stable in acetonitrile, where at 70% (v/v) the enzyme still retained up to 70%
initial activity. Enzyme activity in DMSO steady declined to a minimum observed
between 60-90 % (v/v). As F ig u r e 4 . 1.3.1.1. illustrates, increasing solvent
concentration (DPP IV in DMF) did not affect the catalytic activity; however, after a
critical concentration of solvent had been reached, further addition resulted in an abrupt
decrease in enzyme activity. The effect of solvent on protein conformation in organic
media can be determined by means of high-resolution x-ray crystallography. This is a
useful method to elucidate the three-dimensional structure of the enzyme in solvent and
compare it to that in aqueous solution. Fitzpatrick et al. (1993) used this method to
determine changes in the structure of subtilisin Carlsberg in anhydrous acetonitrile.
Their findings concluded that the three-dimensional structure in anhydrous acetonitrile
was essentially identical to that in water.
118
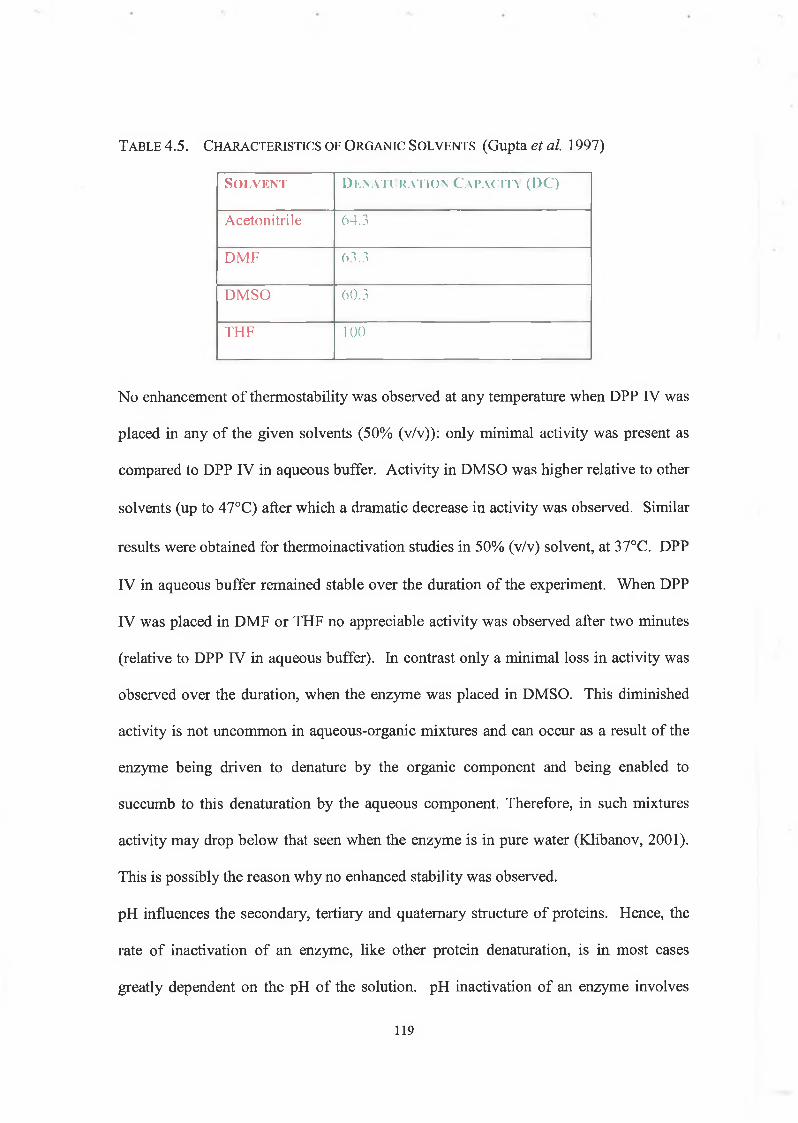
T a b l e 4.5. C h a r a c t e r i s t i c s o f O r g a n i c S o l v e n t s (Gupta et al. 1997)
S o l v e n t DK.NATI RATION C A P A C I T Y ( D C )
A ce t on i tr i l e 64.3
DMF 63.3
DMSO 60.3
THF 100
No enhancement of thermostability was observed at any temperature when DPP IV was
placed in any of the given solvents (50% (v/v)): only minimal activity was present as
compared to DPP IV in aqueous buffer. Activity in DMSO was higher relative to other
solvents (up to 47°C) after which a dramatic decrease in activity was observed. Similar
results were obtained for thermoinactivation studies in 50% (v/v) solvent, at 37°C. DPP
IV in aqueous buffer remained stable over the duration of the experiment. When DPP
IV was placed in DMF or THF no appreciable activity was observed after two minutes
(relative to DPP IV in aqueous buffer). In contrast only a minimal loss in activity was
observed over the duration, when the enzyme was placed in DMSO. This diminished
activity is not uncommon in aqueous-organic mixtures and can occur as a result of the
enzyme being driven to denature by the organic component and being enabled to
succumb to this denaturation by the aqueous component. Therefore, in such mixtures
activity may drop below that seen when the enzyme is in pure water (Klibanov, 2001).
This is possibly the reason why no enhanced stability was observed.
pH influences the secondary, tertiary and quaternary structure of proteins. Hence, the
rate of inactivation of an enzyme, like other protein denaturation, is in most cases
greatly dependent on the pH of the solution. pH inactivation of an enzyme involves
119
unfolding of the protein caused by changes in the balance of electrostatic and hydrogen
bonding. These changes occur due to pH-induced alterations in the ionisation states of
functional groups on the protein. The effect of pH may vary greatly from one enzyme
to another. However, in general there is a zone of maximum stability, and the
inactivation increases on the acid and alkaline side. In most cases a definite optimum
pH is observed. The effect of pH on enzyme-catalyzed reactions is separated into two
categories (1) pH influence on binding and catalysis (2) pH influence on enzyme
stability. (Dixon & Webb, 1979c; Sadana & Henley, 1988).
The effect of pH on the thermostability of DPP IV was investigated. To determine if
irreversible destruction occurred, enzyme activity was tested after readjustment to the
standard pH 8.0 in 50mM buffer (having been previously exposed to range of pH values
in 20mM buffer). The activity of DPP IV between 5.5-6.5 (acetate, MES) decreased
steadily after 60°C, indicating decreased thermostability at non-neutral pH values. The
highest activity was observed at pH 6.5 in MES (F ig u r e 4.1.4.3.1.) The T 5o value
obtained for DPP IV in 20mM Tris, pH 8.0 was only 2°C less than that in 20mM
HEPES, pH 8.0; therefore, changing the buffer did not greatly influence DPP IV
thermostability. However, comparison of observed T50 values at each pH indicates that
DPP IV is more thermostable in the neutral-alkaline pH region, with optimum stability
observed at pH 8.0 in HEPES buffer. Irreversible destruction was observed in most
cases at temperatures above 70°C. It should be mentioned that the pH of buffer
solutions are influenced by changes in temperature e.g. pH 7.0 Tris buffer prepared at
4°C would have a pH of 5.95 at 37°C, this occurs because of temperature-dependent
changes in the dissociation constant (pA'a) of ions in solution (Boyer, 2000). Therefore,
further investigation is required to determine if possible changes in the pH of buffer
120
occurred with increasing temperature. These changes maybe assessed and accounted
for by following theoretical procedures for calculating the practical pK values that apply
to buffers under chosen experimental conditions and for determining the ionic strength
of buffers at various pH values (Ellis & Morrison, 1982).
The effect of pH on DPP IV activity was investigated. Sodium acetate, MES, MOPS,
HEPES, Tris and CHES buffer systems were used. F ig u r e 4.1.4.1.1. illustrates a non-
classical bell-shaped curve, with neutral pH preferred. These results are comparable to
Sentandreu and Toldra (2001) and Buckley et al. (2004), who found similar results
when they studied DPP IV from porcine skeletal muscle and bovine serum,
respectively. Complete inactivation was noticed at pH 4.0. This is similar to the
findings of Duke-Cohan et al. (1995), who reported complete inhibition of human
serum DPP IV at acidic pH 4.5-5.0. F ig u r e 4.1.4.1.1 shows a broad, stable pH range
7.0-10 at 37°; however, this depends on the buffer system used. The objective of these
pH studies was to ascertain the direct effect of pH on DPP IV activity. This is achieved
by altering the pH of the buffer species within the limits of its buffering capacity, i.e.
1.0 pH unit either side of its designated piTa. Hence, the buffer species also changes as
pH is altered, creating two variables to study, i.e. pH effect and buffer effect. This
problem can be minimised if overlapping pH values are used between various buffer
systems. However, some buffers can themselves have a specific effect on enzymatic
activity regardless of pH, e.g. phosphate inhibits certain enzymes, including kinases,
phosphatases, and dehydrogenases (Bollag et al., 1996d). T a b l e 4.2. demonstrates the
direct effect of changing the buffer on DPP IV activity. Activity was higher at pH 8.0
in HEPES than in Tris and was greatest at pH 7.5 in MOPS buffer. These results are
similar to Yoshimoto and Walter (1977), who reported a pH optimum of 7.8 for lamb
121
kidney DPP IV. However, all routine assays were performed at pH 8.0, in HEPES
buffer.
The effect of pH on DPP IV kinetics with Gly-Pro-AMC as substrate was investigated.
Sodium acetate, MES, MOPS, HEPES, Tris and CHES buffer systems were used. To
determine pK values, a plot of Log V/Km versus pH was constructed, giving the pK
values for the free enzyme [E] and free substrate [S] (Fersht, 2002a). F ig u r e 4.1.4.2.1.
illustrates the classical bell-shaped curve, which indicates that at least two ionising
groups change their state of protonation as the pH is raised from pH 4 to more alkaline
values. In F ig u r e 4.1.4.2.1. it is clearly demonstrated that the pKB is far above the p
giving rise to a bell shaped curve with a flat top. Two pK values are observed at 6.18
and 9.7. These values occur in plots of Log VKm and log V/Km versus pH as downward
bends, indicating that they belong to the free enzyme [E] and free substrate [S] (Dixon
& Webb, 1979c; Fersht, 2002a). The 9.7 value alone occurs as an upward bend in the
plot Log V versus pH. This represents the value affecting the enzyme-substrate [ES]
complex. The upper pATa value of 9.7 possibly belongs to the a-amino group of the Gly
moiety on the substrate Gly-Pro-AMC, as this value is common to plots indicating pK
values in both the [ES] complex and also in the free [E] and free [S]. The unique
arrangement of the DPP IV catalytic triad renders this a non-classical serine protease.
Its catalytic residues are arranged in the unique order Ser-Asp-His (nucleophile-acid-
base) order, different from that found in classical serine proteases such as the trypsin
and subtilisin families. The 200 C-terminal residues of DPP IV containing the catalytic
triad have similarity with several other non-classical serine hydrolases including prolyl
oligopeptidase (Abbott et al., 1999). A general catalytic triad reported is Ser63o, Asp7o8,
His74o. However, the exact position of these residues may vary in different species, e.g.
122
murine DPP IV - Ser624, Asp702, and His734, bovine DPP IV - Ser63o, Asp702, and His734,
(Niedermeyer et al., 1998; DeMeester et al., 1999; Lee et al, 2002). It is tempting to
assign a measured pK value to a particular amino acid side chain, from tables of values
pertaining to the pK for free amino acids, but one should bear in mind that the side-
chain environment within an enzyme may differ from that of the free amino acid
causing a shift in pK (Price & Stevens, 1999). With this in mind, the lower pK value
(6.18) was attributed to that of His734 in the enzyme active site.
The results presented here reveal that DPP IV from bovine serum does not undergo
autolysis at 37°C and is catalytically active up 62°C, with T50 determined at 71°C ±
1°C. Solvent stability studies indicate that the enzyme is most stable in acetonitrile up
to 70% (v/v). In comparison, activity in DMF and DMSO declines above 40% (v/v)
and THF is the most deleterious solvent to the enzyme. pH studies show that DPP IV
displays maximum activity at pH 7.5, and is completely inactive at pH 4.0. The effect
of pH on the thermostability of DPP IV indicates that the enzyme is most thermostable
in the neutral-alkaline pH region, with optimum thermostability observed at pH 8.0.
Kinetic studies indicate that DPP IV activity depends on the ionization of a group with a
pK value of 6.18, which has been attributed to the active site histidine residue.
123
C h a pter 5
R ec o m b in a n t F a s c io la h ep atica Ca th e p s in L1 S tudies
Cathepsin L is an endopeptidase. It preferentially cleaves peptide bonds with
hydrophobic amino acid residues in P2 and P3 (Barrett et al., 1998). The amide
substrate, Z-Phe-Arg-AMC when hydrolyzed by cathepsin L releases AMC, which is
monitored fluorometrically, making this a sensitive and suitable substrate. The ester
substrate Z-Lys-ONp when hydrolyzed by cathepsin L releases ONp and is determined
colorimetrically.
Recombinant Fasciola hepatica cathepsin LI (rFheCLl) was investigated with regards
to temperature and solvent stability prior to chemical modification of the enzyme. A
temperature profile was determined and the apparent half-inactivation temperature (T50)
estimated. The effect of organic solvents on rFheCLl was investigated following
exposure to a range of solvents at various concentrations and the half-inactivation
concentration ( C 50) determined. The steady state kinetics of native and modified
(section 6.2.3.) rFheCLl were studied to compare the respective Km and kcat values and
to observe the effects of modification on rFheCLl -catalyzed aminolysis.
5.1. In t r o d u c t io n
124
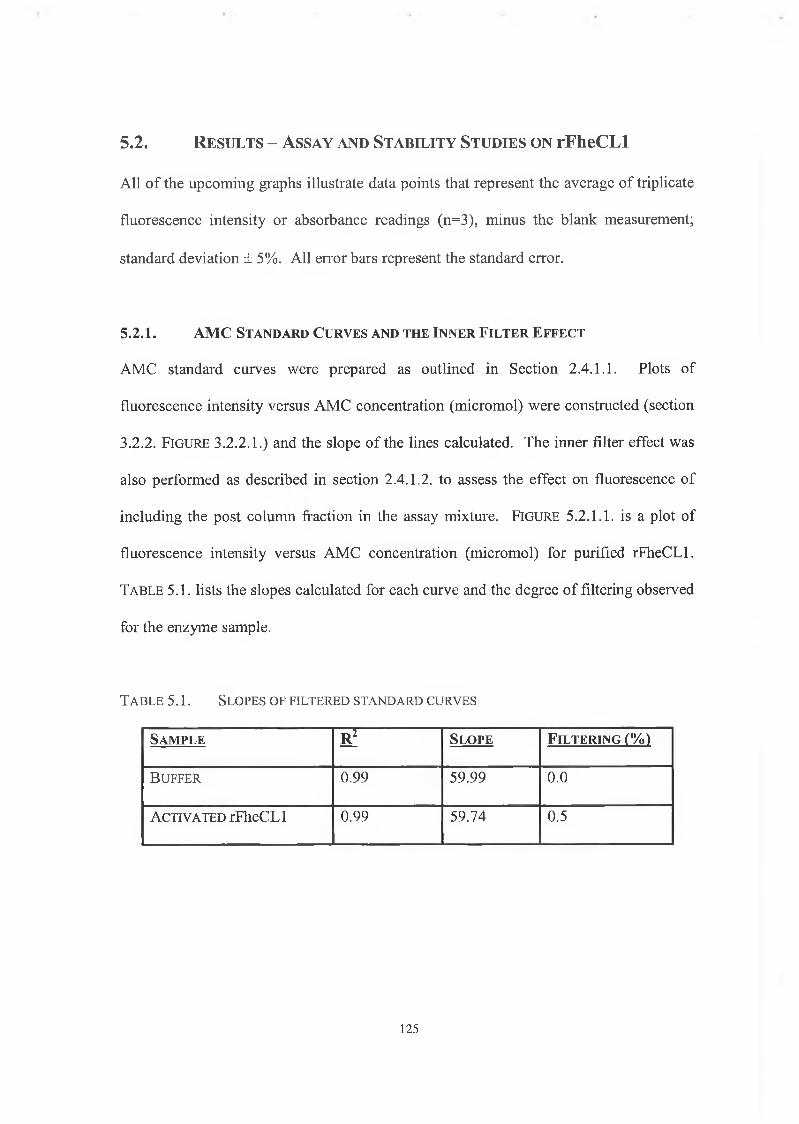
5.2. Re su l t s - A ssa y a n d St a b il it y St u d ie s o n rFheCLl
All of the upcoming graphs illustrate data points that represent the average of triplicate
fluorescence intensity or absorbance readings (n=3), minus the blank measurement;
standard deviation ± 5%. All error bars represent the standard error.
5 .2 .1 . A M C S t a n d a r d C u r v e s a n d t h e I n n e r F i l t e r E f f e c t
AMC standard curves were prepared as outlined in Section 2.4.1.1. Plots of
fluorescence intensity versus AMC concentration (micromol) were constructed (section
3.2.2. F ig u r e 3.2.2.1.) and the slope of the lines calculated. The inner filter effect was
also performed as described in section 2.4.1.2. to assess the effect on fluorescence of
including the post column fraction in the assay mixture. F ig u r e 5.2.1.1. is a plot of
fluorescence intensity versus AMC concentration (micromol) for purified rFheCLl.
T a b l e 5.1. lists the slopes calculated for each curve and the degree of filtering observed
for the enzyme sample.
T a b l e 5 .1 . S l o p e s o f f il t e r e d s t a n d a r d c u r v e s
S a m p l e s i S l o p e F il t e r in g (% )
B u f f e r 0.99 59.99 0.0
A c t iv a t e d rFheCLl 0.99 59.74 0.5
125
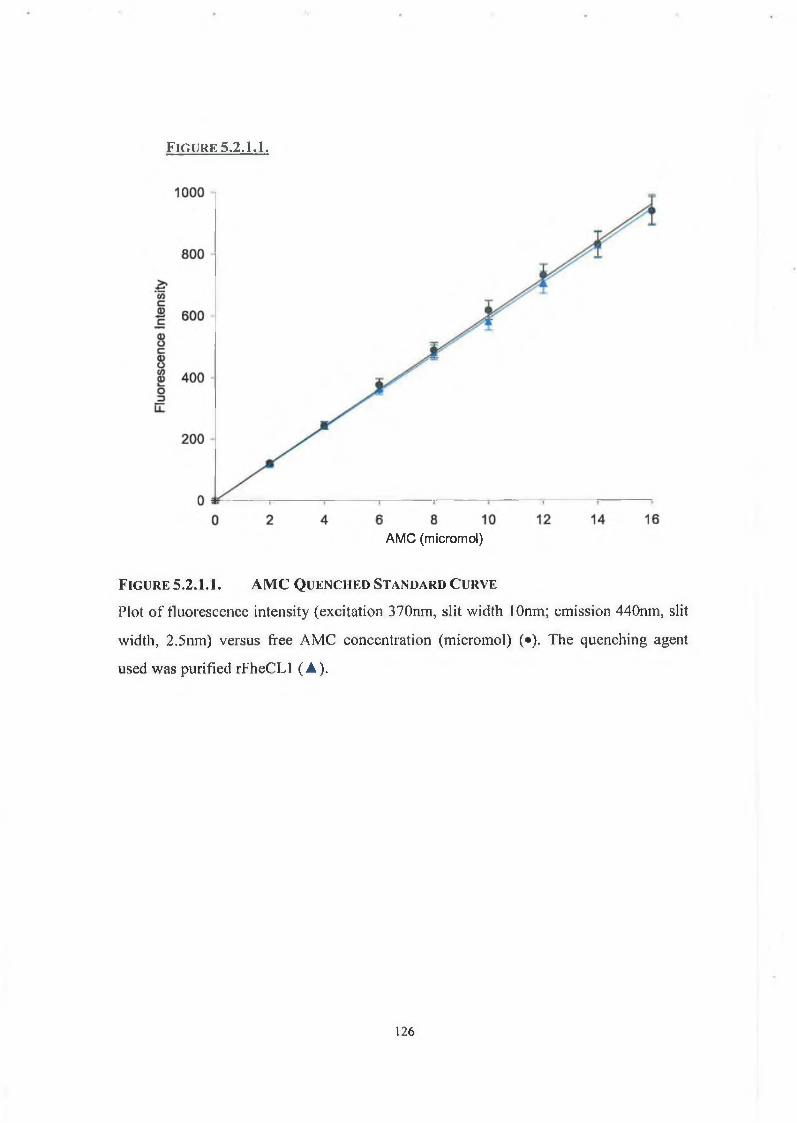
F i g u r e 5 .2 .1 .1 .
AMC (micromol)
F ig u r e 5.2.1.1. AMC Q u e n c h e d S t a n d a r d C u r v e
Plot o f fluorescence intensity (excitation 370nm, slit width lOnm; emission 440nm, slit
width, 2.5nm) versus free AMC concentration (micromol) (•). The quenching agent
used was purified rFheCLl (A).
1 2 6
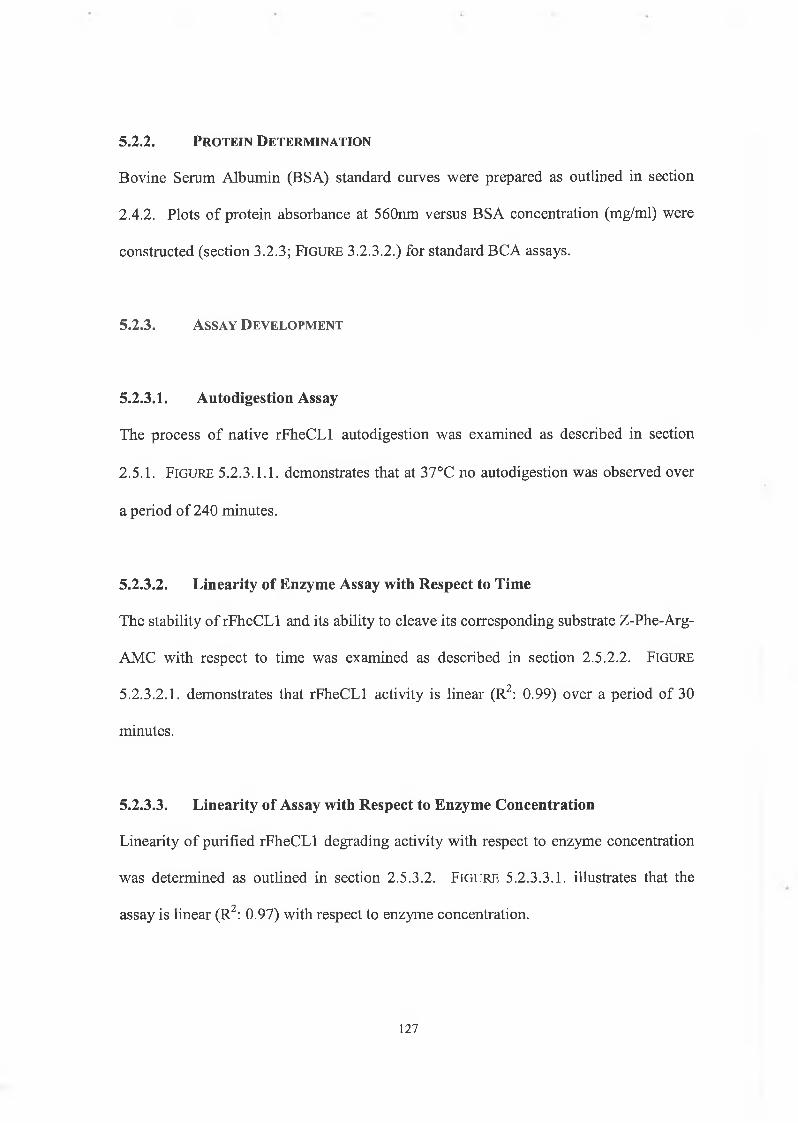
5 .2 .2 . P r o t e i n D e t e r m in a t io n
Bovine Serum Albumin (BSA) standard curves were prepared as outlined in section
2 .4 .2 . Plots of protein absorbance at 560nm versus BSA concentration (mg/ml) were
constructed (section 3 .2 .3 ; F ig u r e 3 .2 .3 .2 .) for standard BCA assays.
5 .2 .3 . A s s a y D e v e l o p m e n t
5 .2 .3 .1 . Autodigestion Assay
The process of native rFheCLl autodigestion was examined as described in section
2.5.1. F ig u r e 5.2.3.1.1. demonstrates that at 37°C no autodigestion was observed over
a period of 240 minutes.
5 .2 .3 .2 . Linearity of Enzyme Assay with Respect to Time
The stability of rFheCLl and its ability to cleave its corresponding substrate Z-Phe-Arg-
AMC with respect to time was examined as described in section 2 .5 .2 .2 . FIGURE
5.2.3.2.1. demonstrates that rFheCLl activity is linear (R2: 0.99) over a period of 30
minutes.
5 .2 .3 .3 . Linearity of Assay with Respect to Enzyme Concentration
Linearity of purified rFheCLl degrading activity with respect to enzyme concentration
was determined as outlined in section 2.5.3.2. F ig u r e 5.2.3.3.1. illustrates that the
assay is linear (R2: 0.97) with respect to enzyme concentration.
127
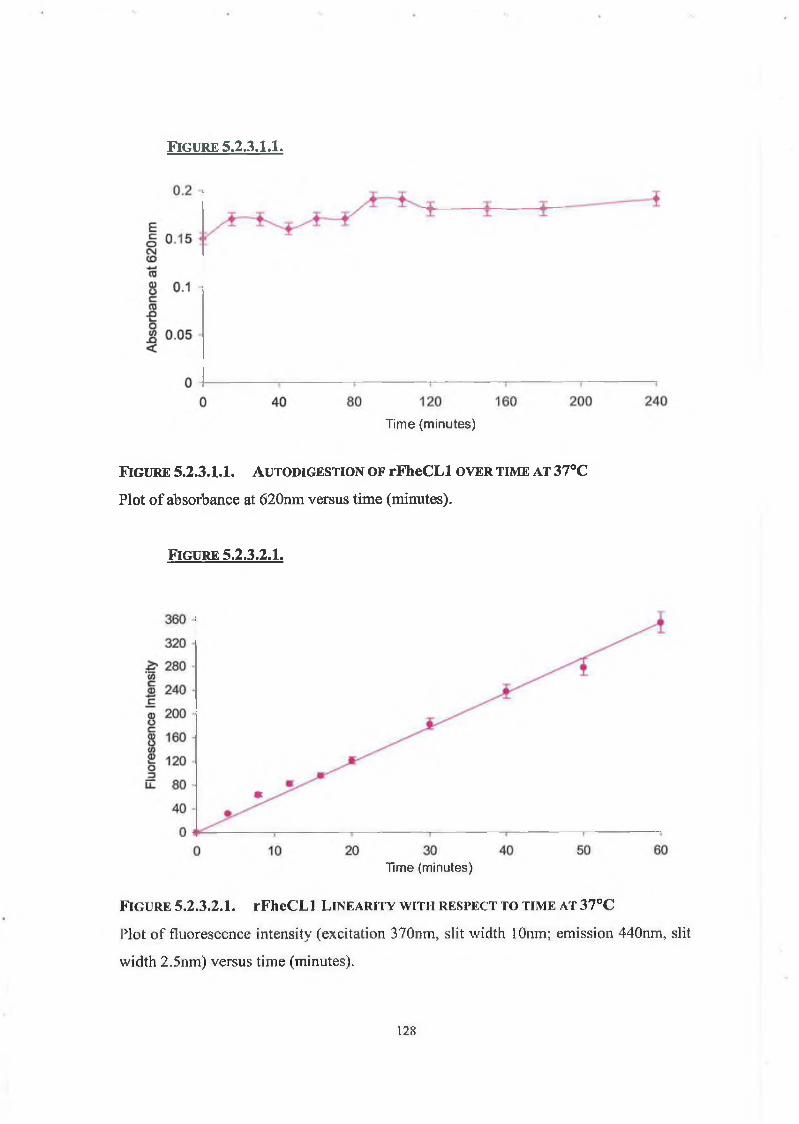
FIGURE 5.2.3.1.1.
T im e (m in u te s)
F ig u r e 5.2.3.I.I. A u t o d ig e s t io n o f rFheCLl o v e r t im e a t 37°C
Plot o f absorbance at 620nm versus time (minutes).
F ig u r e 5.2.3.2.I.
Time (minutes)
F i g u r e 5 .2 .3 .2 .L r F h e C L l L i n e a r i t y w i t h r e s p e c t t o t i m e a t 3 7 ° C
Plot o f fluorescence intensity (excitation 370nm, slit width lOnm; emission 440nm, slit
width 2.5nm) versus time (minutes).
128
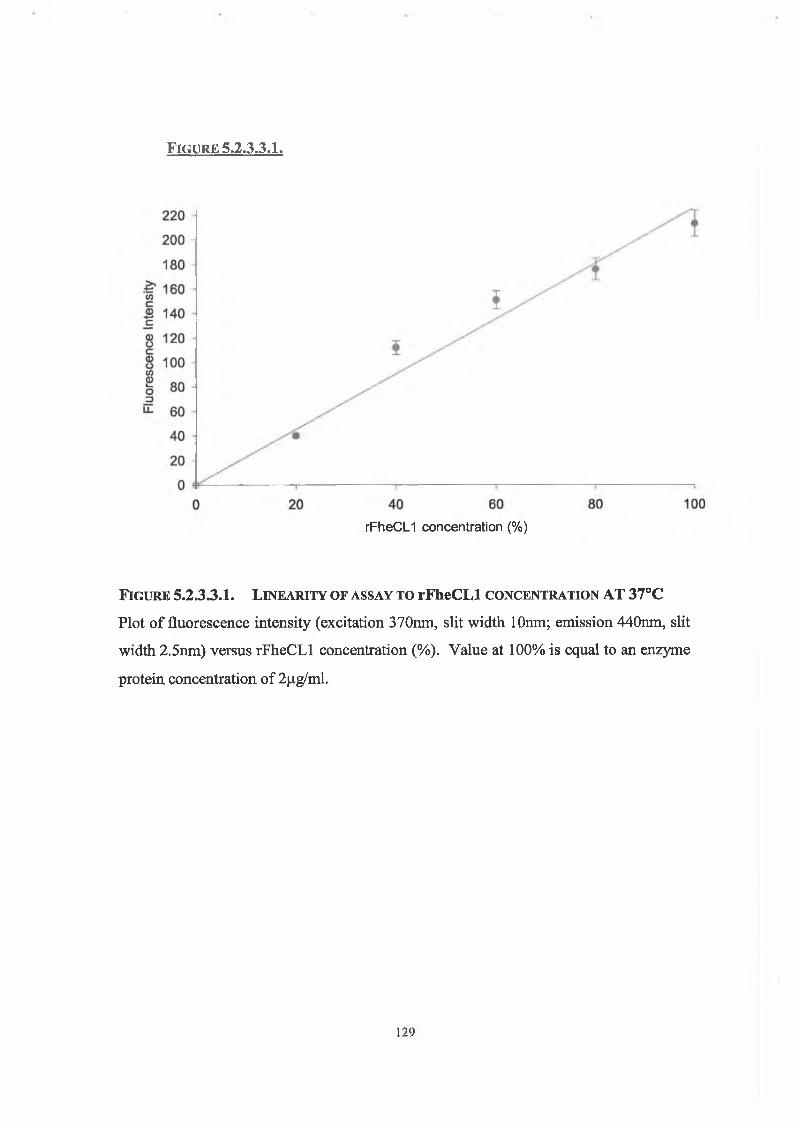
F i g u r e 5.2.3.3.I.
r F h e C H c o n c e n tr a tio n (% )
F ig u r e 5.2.3.3.1. L in e a r it y o f a s s a y t o r F h e C L l c o n c e n t r a t io n AT 37°C
Plot of fluorescence intensity (excitation 370nm, slit width lOnm; emission 440nm, slit
width 2.5nm) versus rFheCLl concentration (%). Value at 100% is equal to an enzyme
protein concentration of 2(ig/ml.
129
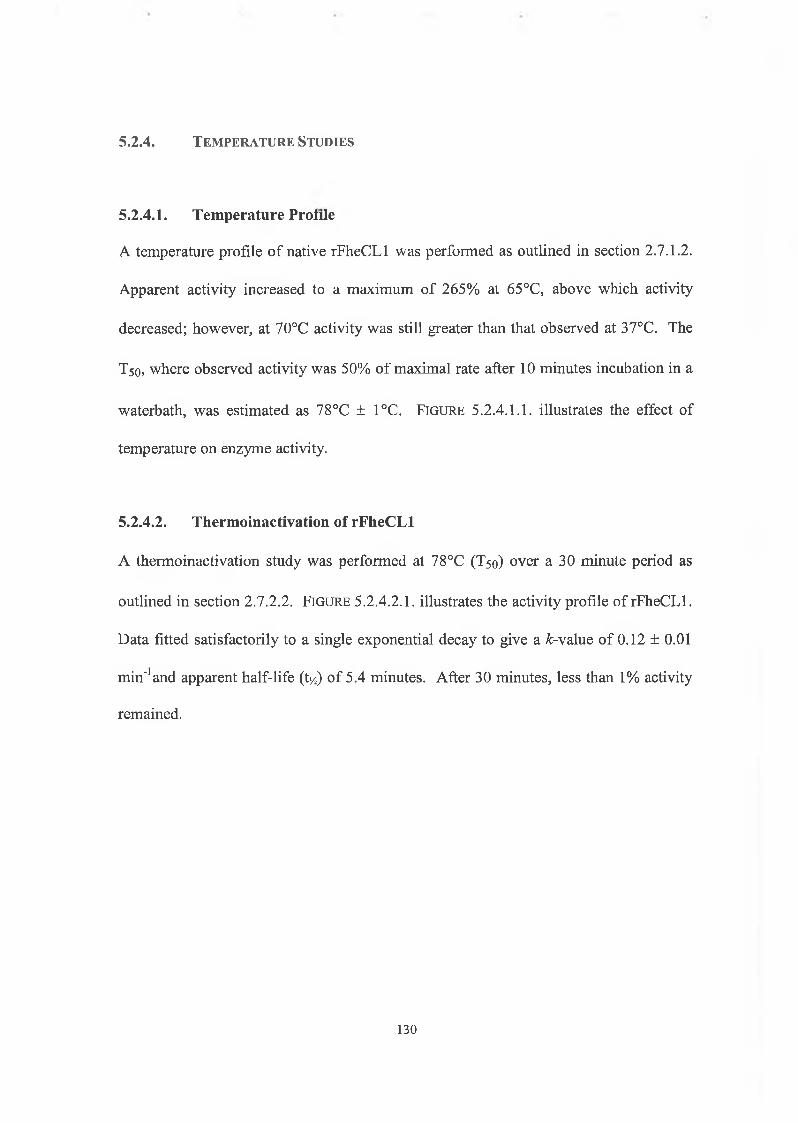
5.2.4. T e m p e r a t u r e S t u d ie s
5.2.4.1. Temperature Profile
A temperature profile of native rFheCLl was performed as outlined in section 2.7.1.2.
Apparent activity increased to a maximum of 265% at 65°C, above which activity
decreased; however, at 70°C activity was still greater than that observed at 37°C. The
T50, where observed activity was 50% of maximal rate after 10 minutes incubation in a
waterbath, was estimated as 78°C ± 1°C. F ig u r e 5.2.4.1.1. illustrates the effect of
temperature on enzyme activity.
5.2.4.2. Thermoinactivation of rFheCLl
A thermoinactivation study was performed at 78°C (T 50) over a 30 minute period as
outlined in section 2.7.2.2. F i g u r e 5.2.4.2.1, illustrates the activity profile of rFheCLl.
Data fitted satisfactorily to a single exponential decay to give a ¿-value of 0.12 ± 0.01
min"’and apparent half-life (t/2) of 5.4 minutes. After 30 minutes, less than 1% activity
remained.
130
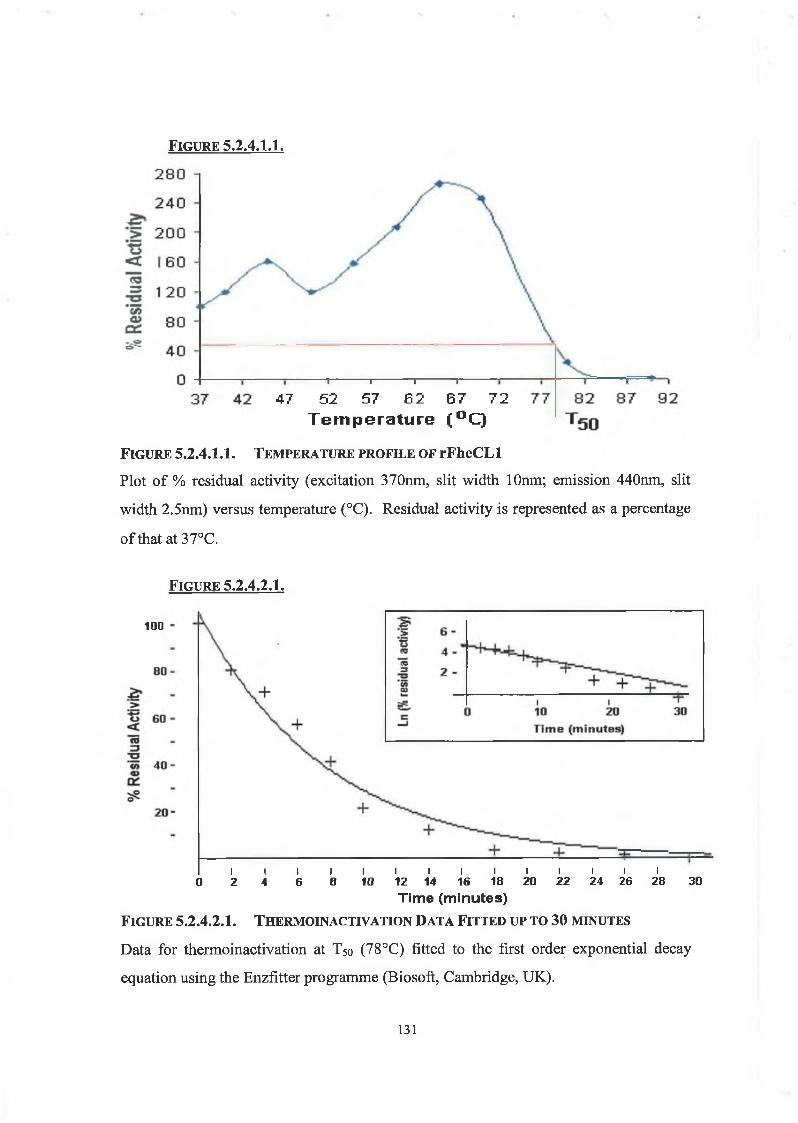
F ig u r e 5 .2 .4 .I .I .
- i --------------- 1----------------1-------------- r
47 52 57 6 2 6 7 72T e m p e r a t u r e ( ° Q
F ig u r e 5 .2 .4 .I . I . T e m p e r a t u r e p r o f il e o f r F h e C L l
Plot of % residual activity (excitation 370nm, slit width lOnm; emission 440nm, slit
width 2.5nm) versus temperature (°C). Residual activity is represented as a percentage
of that at 37°C.
F ig u r e 5 .2 .4 .2 .I .
100
i i i i i i i i i i i i i i0 2 4 6 8 10 12 14 16 18 20 22 24 26 28 30
Tim e (minutes)
F ig u r e 5 .2 .4 .2 .1 . T h e r m o i n a c t i v a t i o n D a t a F it t e d u p t o 3 0 m in u t e s
Data for thermoinactivation at T50 (78°C) fitted to the first order exponential decay
equation using the Enzfitter programme (Biosoft, Cambridge, UK).
131
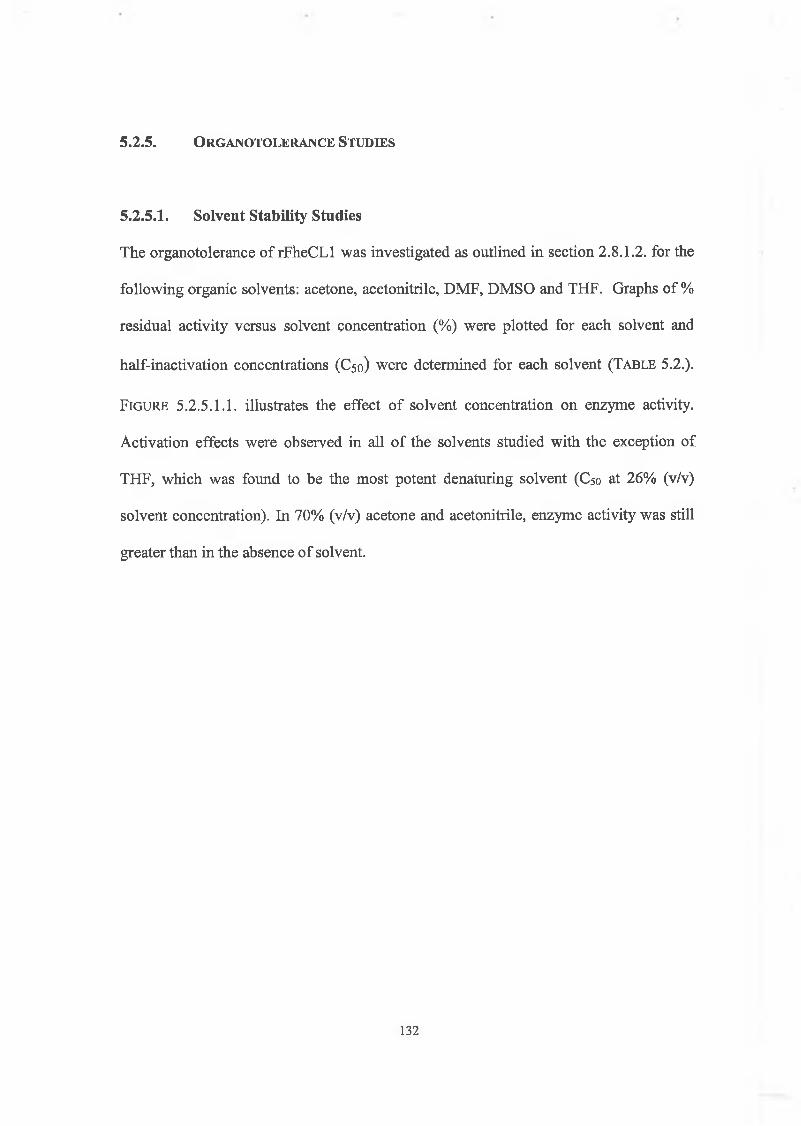
5 .2 .5 . O r g a n o t o l e r a n c e S t u d ie s
5.2.5.I. Solvent Stability Studies
The organotolerance of rFheCLl was investigated as outlined in section 2.8.1.2. for the
following organic solvents: acetone, acetonitrile, DMF, DMSO and THF. Graphs of %
residual activity versus solvent concentration (%) were plotted for each solvent and
half-inactivation concentrations (C 50) were determined for each solvent ( T a b l e 5.2.).
F i g u r e 5.2.5.1.1. illustrates the effect o f solvent concentration on enzyme activity.
Activation effects were observed in all of the solvents studied with the exception of
THF, which was found to be the most potent denaturing solvent ( C 50 at 26% (v/v)
solvent concentration). In 70% (v/v) acetone and acetonitrile, enzyme activity was still
greater than in the absence of solvent.
132
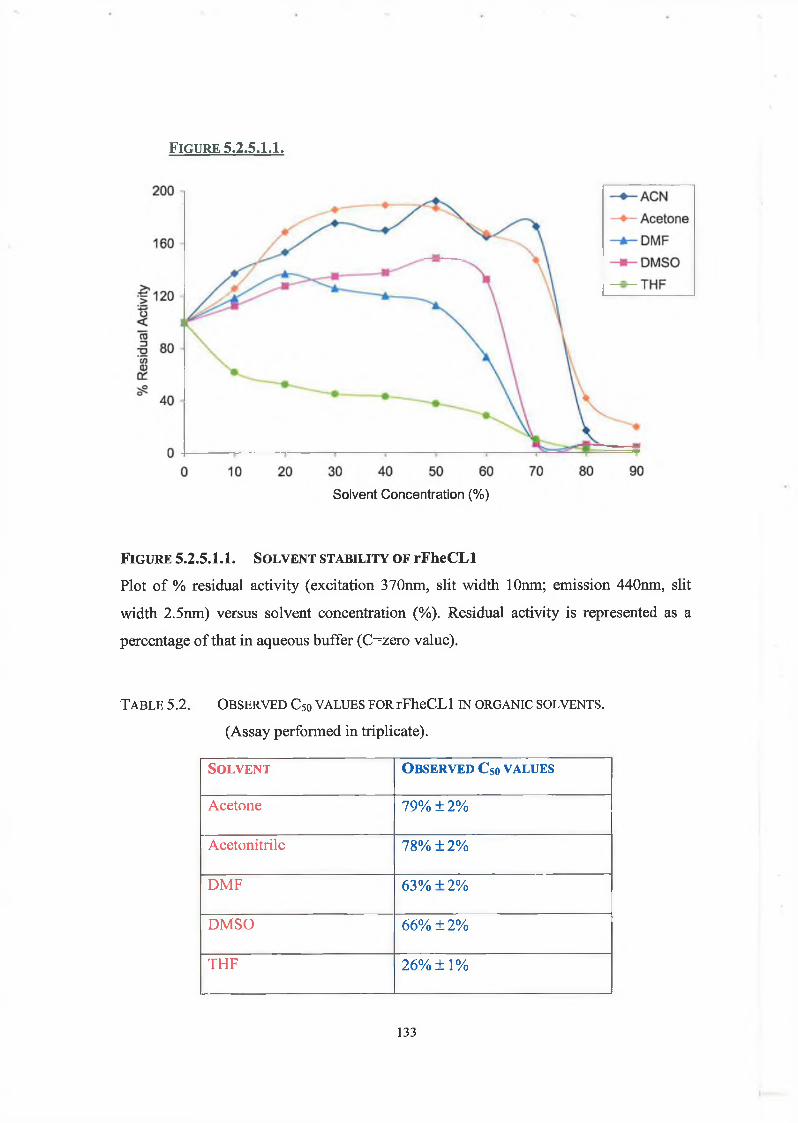
F ig u r e 5 .2 .5 .I .I .
Solvent Concentration (%)
F i g u r e 5.2.5.I.I. S o l v e n t s t a b i l i t y o f rFheCLl
Plot o f % residual activity (excitation 370nm, slit width lOnm; emission 440nm, slit
width 2.5nm) versus solvent concentration (%). Residual activity is represented as a
percentage of that in aqueous buffer (C=zero value).
T a b l e 5.2. O b s e r v e d C50 v a l u e s f o r rFheCLl in o r g a n ic s o l v e n t s .
(Assay performed in triplicate).
S o l v e n t O b s e r v e d C 5o v a l u e s
Acetone 79% ±2%
Acetonitrile 78% ±2%
DMF 63% +2%
DM SO 66% ±2%
THF 26% ± 1 %
133
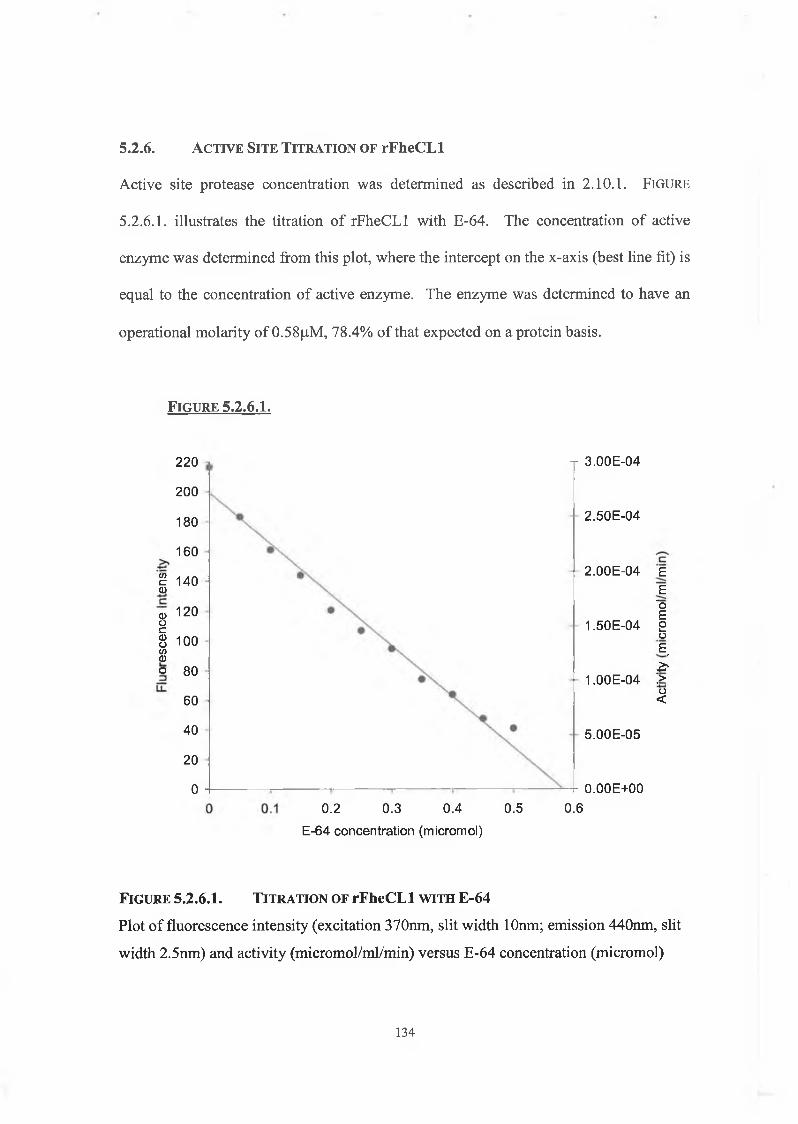
Active site protease concentration was determined as described in 2.10.1. F ig u r e
5.2.6.1. illustrates the titration of rFheCLl with E-64. The concentration of active
enzyme was determined from this plot, where the intercept on the x-axis (best line fit) is
equal to the concentration of active enzyme. The enzyme was determined to have an
operational molarity of 0.58p.M, 78.4% of that expected on a protein basis.
5.2.6. A c t i v e S i t e T i t r a t i o n o f rFheCLl
F ig u r e 5.2.6.I.
220
200
1 8 0
1 6 0
£ 1 4 0 0)® 120o§ 100(/>0o 80
60
4 0
20
0
t 3 .0 0 E -0 4
2 .5 0 E -0 4
2 .0 0 E -0 4 E
E"oE
1 .5 0 E -0 4 2oE,&
1.00E-04 :>o<
5 .0 0 E -0 5
0 .2 0 .3 0 .4 0 .5
E -6 4 c o n c e n tra tio n (m icro m o l)
0 .0 0 E + 0 0
0.6
F ig u r e 5.2.6.I. T it r a t io n o f r F h e C L l w it h E-64
Plot of fluorescence intensity (excitation 370nm, slit width lOnm; emission 440nm, slit
width 2.5nm) and activity (micromol/ml/min) versus E-64 concentration (micromol)
134
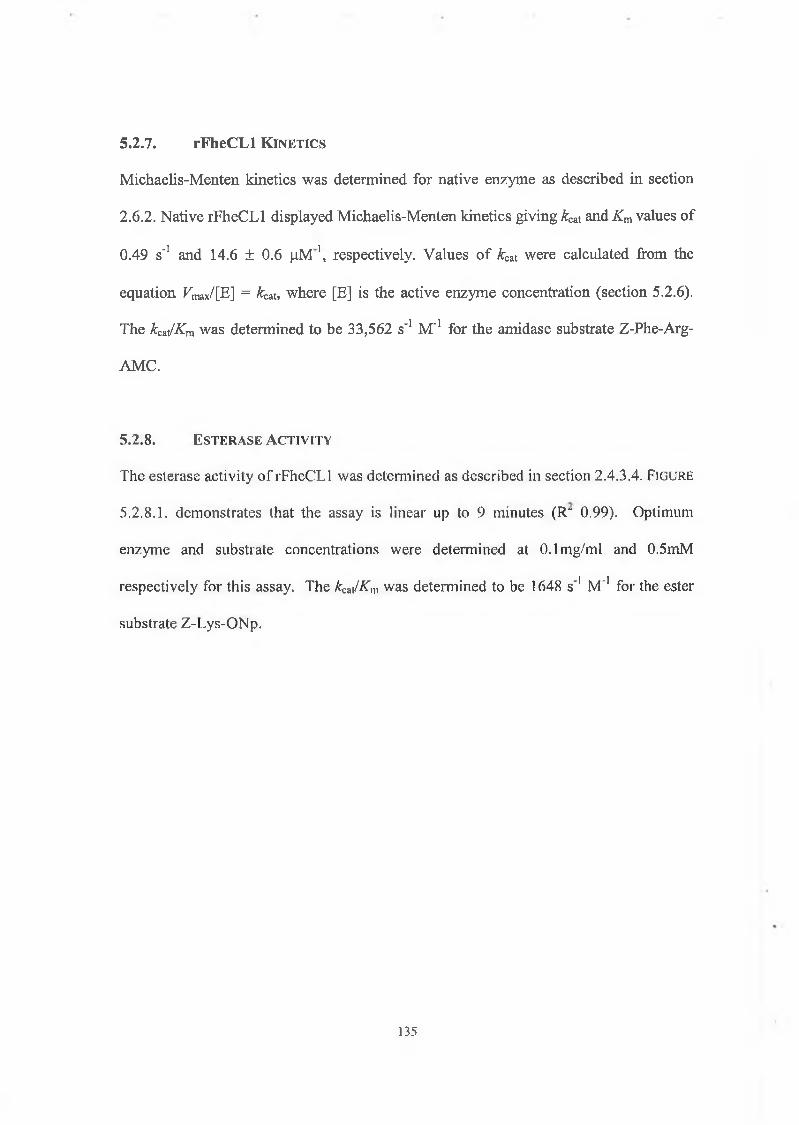
5.2.7. rFheCLl Kinetics
Michaelis-Menten kinetics was determined for native enzyme as described in section
2.6.2. Native rFheCLl displayed Michaelis-Menten kinetics giving ¿cat and Km values of
0.49 s'1 and 14.6 ± 0.6 (J.M1, respectively. Values of ¿cat were calculated from the
equation FmaX/[E] = ¿cat, where [E] is the active enzyme concentration (section 5.2.6).
The ¿cat/Km was determined to be 33,562 s'1 M '1 for the amidase substrate Z-Phe-Arg-
AMC.
5.2.8. E s t e r a s e A c t i v i t y
The eslerase activity of rFheCLl was determined as described in section 2.4.3.4. F ig u r e
5.2.8.1. demonstrates that the assay is linear up to 9 minutes (R~ 0.99). Optimum
enzyme and substrate concentrations were determined at 0.1 mg/ml and 0.5mM
respectively for this assay. The kcJ K m was determined to be 1648 s '1 M '1 for the ester
substrate Z-Lys-ONp.
135
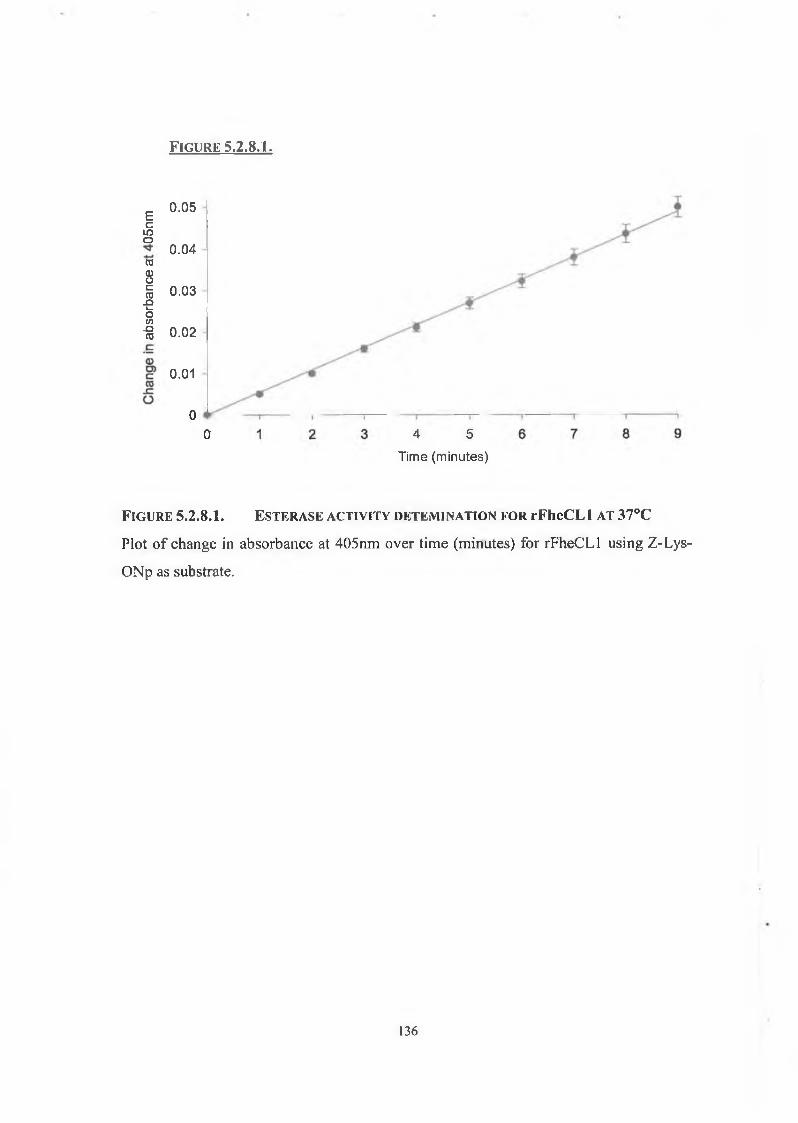
F i g u r e S.2.8.1.
EcLOO038cCO_oi—oCO
-QCD
0.05
0.04
0.03
0.02
0.01
0 0 4 5
Time (minutes)
F i g u r e 5.2.8.I. E s t e r a s e a c t i v i t y d e t e m i n a t i o n f o r rFheCL 1 a t 37°C
Plot of change in absorbance at 405nm over time (minutes) for rFheCLl using Z-Lys-
ONp as substrate.
136
No autolysis was observed over the assay period at 37°C, pH 5.0 (FIGURE 5.2.3.1.1.).
These results are comparable with Dowd et al. (2000), who demonstrated that fluke
(Fasciola hepático) cathepsin LI remained fully active after incubation at 37°C for 20
hours. However, they performed the assay at pH 7.0. Human liver cathepsin L retained
at least 70% of its initial activity when incubated for 24 hours at 37°C in the pH range
4.5-5.0. At pH 7.0, however, 85% of activity was lost after only 15 minutes incubation
(Mason et al., 1985). F ig u r e 5.2.3.2.1. illustrates that rFheCLl catalysed the linear
release of AMC over the standard 30-minute assay period and up to 60 minutes, thus
allowing for longer analysis if required. This demonstrates that rFheCLl is not only
stable but also is fully active and saturated with sufficient substrate over this longer
time.
F ig u r e 5.2.3.3.I. illustrates that fluorescence intensity increases linearly and
proportionally with the increase in enzyme concentration at 37°C. Therefore, the
enzyme hydrolyses at the same rate depending on the quantity of enzyme present.
Protein molecules are stable within a certain temperature range. However the subtle
balance between the folded and unfolded state can be disrupted by a number of factors
including temperature. The upper temperature for activity in enzymes appears to be
governed by the limits of protein stability, since, there is no theoretical upper limit for
conformational stability of proteins. It is possible, however, that irreversible reactions
occurring when the protein has unfolded will set this temperature limit. Enzymes exist
with optima above 100°C (previously discussed, section 4.2); indeed, some extremely
thermophilic enzymes are known to have significant half-lives above 120°C (Daniel,
1996; Eichler, 2001). Dowd et al. (2000) investigated the thermostability of Fasciola137
5 .3 . D is c u s s io n
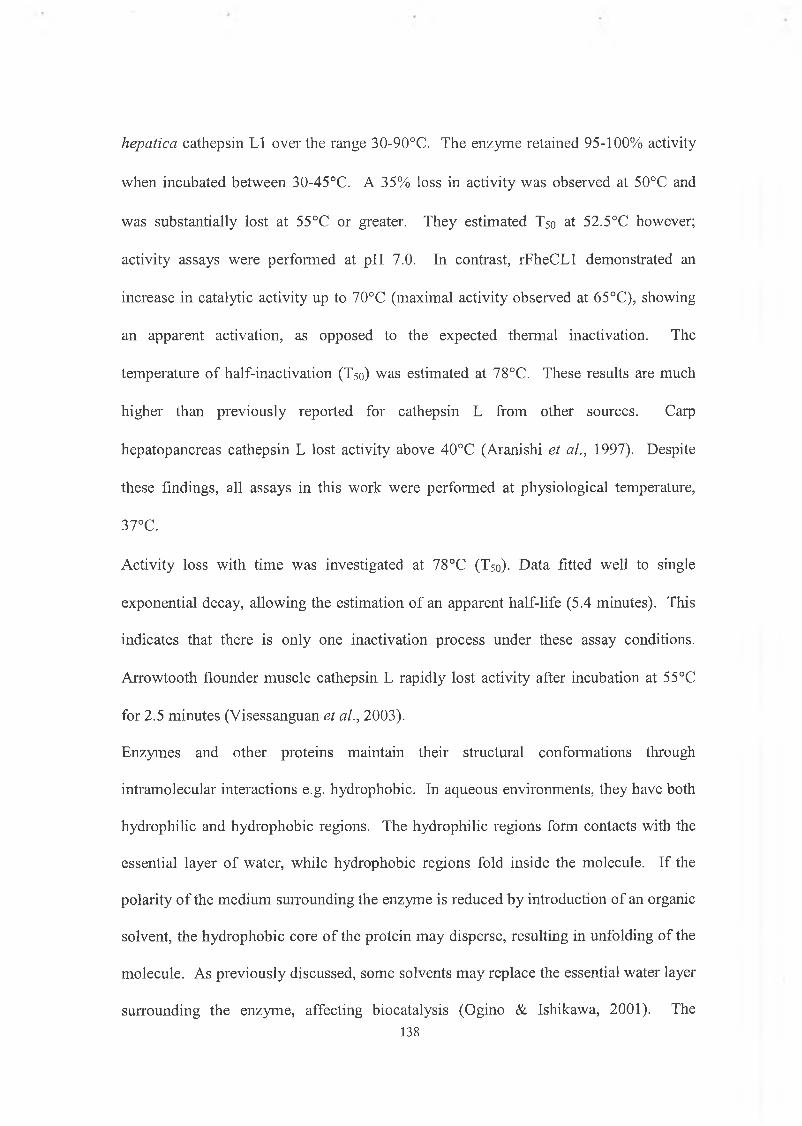
hepatica cathepsin LI over the range 30-90°C. The enzyme retained 95-100% activity
when incubated between 30-45°C. A 35% loss in activity was observed at 50°C and
was substantially lost at 55°C or greater. They estimated T5o at 52.5°C however;
activity assays were performed at pH 7.0. In contrast, rFheCLl demonstrated an
increase in catalytic activity up to 70°C (maximal activity observed at 65°C), showing
an apparent activation, as opposed to the expected thermal inactivation. The
temperature of half-inactivation (T50) was estimated at 78°C. These results are much
higher than previously reported for cathepsin L from other sources. Carp
hepatopancreas cathepsin L lost activity above 40°C (Aranishi et al., 1997). Despite
these findings, all assays in this work were performed at physiological temperature,
37°C.
Activity loss with time was investigated at 78°C (T50). Data fitted well to single
exponential decay, allowing the estimation of an apparent half-life (5.4 minutes). This
indicates that there is only one inactivation process under these assay conditions.
Arrowtooth flounder muscle cathepsin L rapidly lost activity after incubation at 55°C
for 2.5 minutes (Visessanguan et al., 2003).
Enzymes and other proteins maintain their structural conformations through
intramolecular interactions e.g. hydrophobic. In aqueous environments, they have both
hydrophilic and hydrophobic regions. The hydrophilic regions form contacts with the
essential layer of water, while hydrophobic regions fold inside the molecule. If the
polarity of the medium surrounding the enzyme is reduced by introduction of an organic
solvent, the hydrophobic core of the protein may disperse, resulting in unfolding of the
molecule. As previously discussed, some solvents may replace the essential water layer
surrounding the enzyme, affecting biocatalysis (Ogino & Ishikawa, 2001). The138
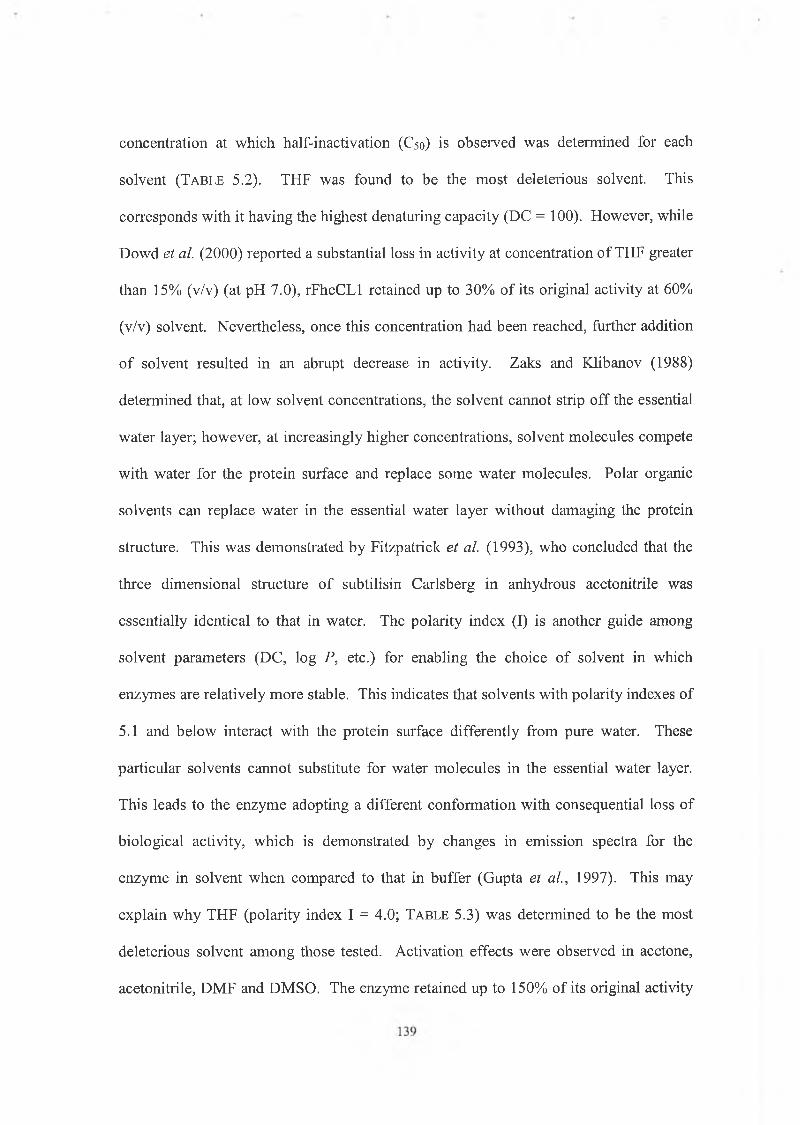
concentration at which half-inactivation (C50) is observed was determined for each
solvent (T a b l e 5.2). THF was found to be the most deleterious solvent. This
corresponds with it having the highest denaturing capacity (DC = 100). However, while
Dowd et al. (2000) reported a substantial loss in activity at concentration of THF greater
than 15% (v/v) (at pH 7.0), rFheCLl retained up to 30% of its original activity at 60%
(v/v) solvent. Nevertheless, once this concentration had been reached, further addition
of solvent resulted in an abrupt decrease in activity. Zaks and Klibanov (1988)
determined that, at low solvent concentrations, the solvent cannot strip off the essential
water layer; however, at increasingly higher concentrations, solvent molecules compete
with water for the protein surface and replace some water molecules. Polar organic
solvents can replace water in the essential water layer without damaging the protein
structure. This was demonstrated by Fitzpatrick et al. (1993), who concluded that the
three dimensional structure of subtilisin Carlsberg in anhydrous acetonitrile was
essentially identical to that in water. The polarity index (I) is another guide among
solvent parameters (DC, log P, etc.) for enabling the choice of solvent in which
enzymes are relatively more stable. This indicates that solvents with polarity indexes of
5.1 and below interact with the protein surface differently from pure water. These
particular solvents cannot substitute for water molecules in the essential water layer.
This leads to the enzyme adopting a different conformation with consequential loss of
biological activity, which is demonstrated by changes in emission spectra for the
enzyme in solvent when compared to that in buffer (Gupta et al., 1997). This may
explain why THF (polarity index I = 4.0; T a b l e 5.3) was determined to be the most
deleterious solvent among those tested. Activation effects were observed in acetone,
acetonitrile, DMF and DMSO. The enzyme retained up to 150% of its original activity
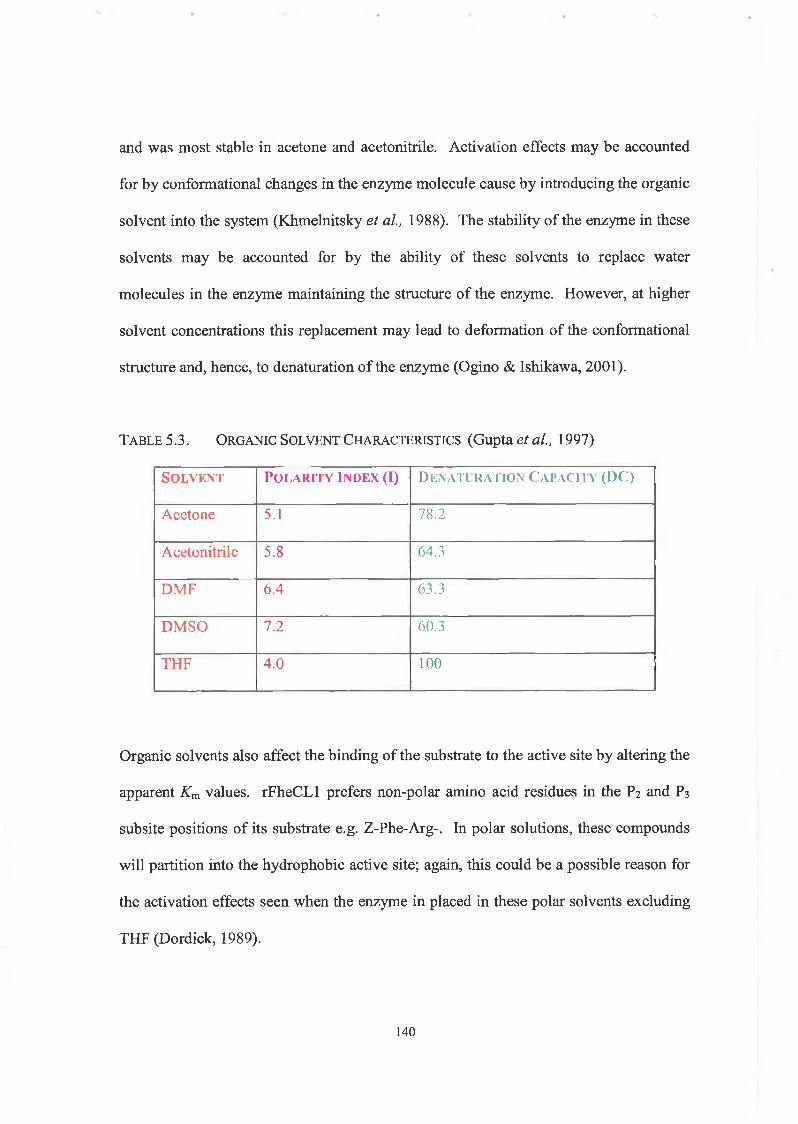
and was most stable in acetone and acetonitrile. Activation effects may be accounted
for by conformational changes in the enzyme molecule cause by introducing the organic
solvent into the system (Khmelnitsky et al., 1 9 8 8 ). The stability of the enzyme in these
solvents may be accounted for by the ability of these solvents to replace water
molecules in the enzyme maintaining the structure of the enzyme. However, at higher
solvent concentrations this replacement may lead to deformation of the conformational
structure and, hence, to denaturation of the enzyme (Ogino & Ishikawa, 2 0 0 1 ).
T a b l e 5 .3 . O r g a n ic S o l v e n t C h a r a c t e r is t ic s (G u p ta et al., 1 997)
S o l v e n t P o l a r i t y I n d e x (I) D e n a t u r a t io n C a p a c it y (DC)
Acetone 5.1 78.2
Acetonitrile 5.8 64.3
DMF 6.4 63.3
DMSO 7 .2 60.3
THF 4.0 100
Organic solvents also affect the binding of the substrate to the active site by altering the
apparent Km values. rFheCLl prefers non-polar amino acid residues in the P2 and P3
subsite positions of its substrate e.g. Z-Phe-Arg-. In polar solutions, these compounds
will partition into the hydrophobic active site; again, this could be a possible reason for
the activation effects seen when the enzyme in placed in these polar solvents excluding
THF (Dordick, 1989).
140
Many strategies have been pursued to enhance enzyme stability e.g. immobilisation,
chemical modification and genetic/protein engineering techniques. Site-specific
mutagenesis allows a protein to be stabilized by substituting amino acid residues at
specific sites in a protein, which may lead to enhanced stability by replacing chemical,
thermal or solvent labile residues, or by increasing interior interactions such as
hydrophobic ones, thereby increasing protein rigidity. A comparison was made
between the amino acid sequence of fluke and recombinant Fasciola hepatica cathepsin
LI. A number of differences were observed (F ig u r e 5.3.1.). The Q24940 entry notes a
lack of consensus at certain sites, some of which will be discussed thus giving a
plausible explanation as to why the recombinant form of cathepsin appears to have
enhanced stability when compared to fluke (Fasciola hepatica) cathepsin L I .
Hydrophobic interactions contribute greatly to the stability of the folded state of the
protein and may be considered the driving force in protein folding. Investigations of
structural differences obseived between mesophilic and thermophilic proteins have
suggested that the latter proteins are substantially more hydrophobic and have more
surface area buried upon folding. It has also been suggested that higher stability
observed in thermophilic proteins is due to better packing because of smaller and less
numerous cavities. All of the substitutions at positions 165 (Gly for Arg), 293 (Thr for
Leu) and 304 (Ala for Val) may enhance stability by increasing the compactness of the
molecule, as all of these substitutions involve changing one smaller residue for a larger
one, thereby decreasing the solvent accessible area. Substituting weakly polar threonine
(T) at position 293 with the bulky hydrophobic amino acid leucine (L) may also
strengthen the internal hydrophobicity of the protein. Glycine is a small amino acid,
which is more destabilising because it has more conformational freedom in the unfolded
141
state. Changing this for arginine (with a considerably larger side chain) could possibly
restrict its conformational freedom by reducing the entropy loss on unfolding and
increase the rigidity of the protein. The guanidine group of this residue can form salt
bridges; this formation has been implicated in the thermostability of proteins.
Exchanging alanine for the more hydrophobic valine may help stabilise the protein.
Substituting tyrosine for phenylalanine (position 118) with the loss of a hydroxyl group
may contribute to increasing the hydrophobicity at this site (Nosoh & Sekiguchi, 1990;
Fersht & Serrano, 1993; Kumar et al., 2000).
Matsuura et al. (1998) demonstrated that the addition of peptide tails with random
sequences to the C-terminal of the enzymes molecule enhanced thermostability. They
suggested that peptide addition increases the dimension of the protein sequence space,
thereby imposing constraints on the enzyme molecule. However, they concluded that a
peptide tail providing beneficial effects to one enzyme may not provide the same effect
to another. Eight amino acid residues are present at the C-terminal of rFheCLl these
include glycine, proline and a 6 histidine tag. The inclusion of this peptide “tail” is for
purposes of purification; however, it may also be responsible for conferring some
degree of stability upon the recombinant enzyme. Positively charged amino acid
residues (such as histidine) at a protein terminus fortify the adjacent peptide bonds
against acid hydrolysis, as they repel hydronium ions (Wong & Parasrampuria, 1997).
The substitution and addition of residues may be responsible for the enhanced
thermostability and organic solvent tolerance demonstrated by this recombinant enzyme
as compared to the fluke enzyme. However, the folding of an enzyme also dictates how
an amino acid residue contributes to its stability. A crystal structure for the fluke
enzyme is not yet available; hence the above reasoning involves assumptions. The
142
interesting results obtained for this recombinant enzyme would suggest that further
studies should be performed to elucidate this phenomenon.
143
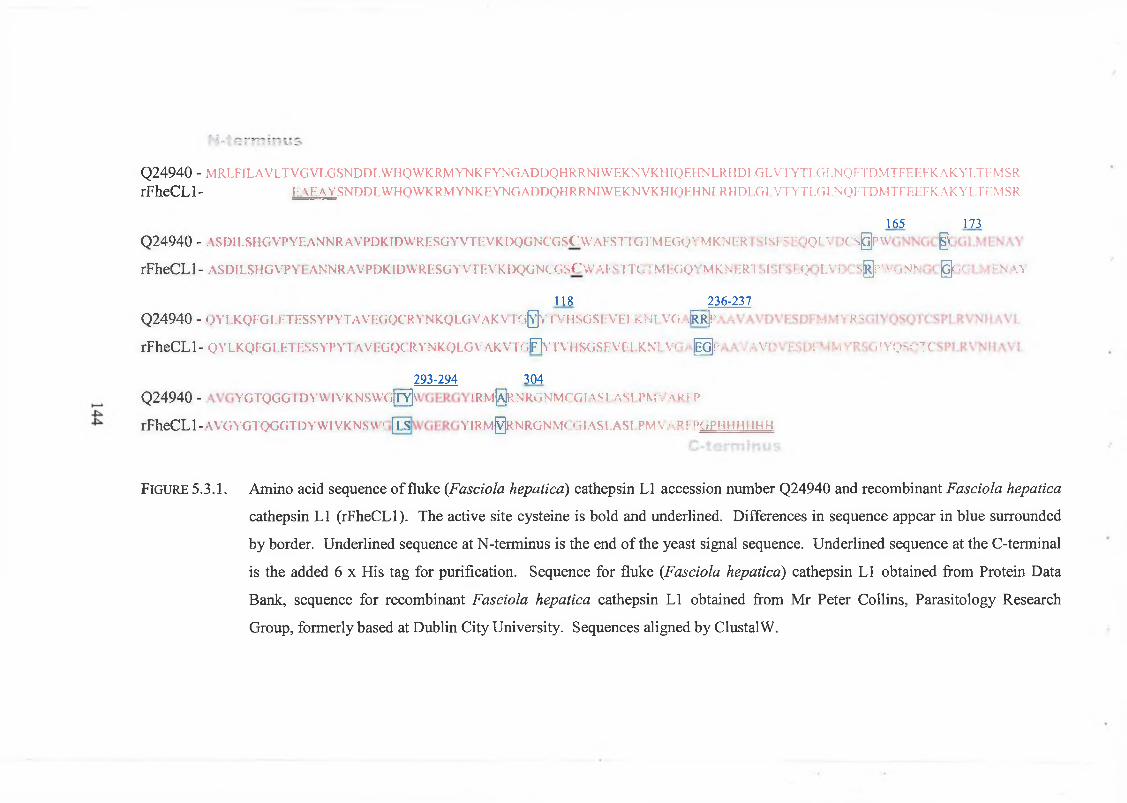
Q24940 - MRLFiLAVLTVGVLGSNDDLWHQWKRMYNKEYNGADDQHRRNTWEKNVKHIQEHNLRHDLGLVTYTLGLNQFTDMTFEEFKAKYLTHMSR
rFheCLl- EAFAYSNnDT-WHOWKRMYNKFYNGAODOHRRNTWEKNVKHiOF.HNr.RHDl.Gl VTYTLGLNQFTDMTFEEFK.AKYLTEMSR
165 173Q24940 - ASDlLSHGVPYEANNRAVPDKroWRESGYVTEVKDQGNCGSCWAFSTTGTMEGOYMKNERI SISISEQQI VDCS@P^ §
rFheCLl- ASDDLSHGVPVIANNRAVPDKIDWRESGYVrEVKDQGNCGSCWAFSTTGTMEGQYMKNERTSISFSEQQLVDCS@»WGNNGC@GGl MEN V>
118 236-237Q24940 - QYLKQFGLEIKSYPYTAVEGQCRYNKOLGVAKV fC^YI VHSGSEVELKNLVGARR^AA MMYRS
rFheCLl- QYLKQFGLEIESSYPY1 \vi:G(X RVNKQLGVAKV rdFTYTVHSGSEVELKNLVGAlEG^AAVAVPVESDFMMYRSGIYOSOl<
293-294 304Q24940 - YGTQGGi dyw iVKNS\VC,{n]v 1Km|a]r n r g n m c g IAS1 AS! I'Mv aRFP
rFheCLl-AVGYGTOGGTDVWIVKXSUi [ 1 S YIRM0RNRGNMCGlASi.ASl.PMVARFPGPHHHIIHH
Figure 5.3.1. Amino acid sequence of fluke (Fasciola hepatica) cathepsin LI accession number Q24940 and recombinant Fasciola hepatica
cathepsin LI (rFheCLl). The active site cysteine is bold and underlined. Differences in sequence appear in blue surrounded
by border. Underlined sequence at N-terminus is the end of the yeast signal sequence. Underlined sequence at the C-terminal
is the added 6 x His tag for purification. Sequence for fluke (Fasciola hepatica) cathepsin LI obtained from Protein Data
Bank, sequence for recombinant Fasciola hepatica cathepsin LI obtained from Mr Peter Collins, Parasitology Research
Group, formerly based at Dublin City University. Sequences aligned by ClustalW.
Kinetic constants for the hydrolysis of Z-Phe-Arg-AMC were determined for
recombinant Fasciola hepatica cathepsin LI (rFheCLl). The recombinant enzyme had
similar affinity toward Z-Phe-Arg-AMC (Km = 14.6 jaM) as fluke (Fasciola hepatica)
cathepsin LI, which reported a Km value of 14.7(iM (Dowd et al., 1994). However,
rFheCLl had lower affinity toward Z-Phe-Arg-AMC than cathepsin L from other
sources, which demonstrated Km values in the range 1.8-8.2p.M (Mason et al., 1985;
Visessanguan et al., 2003). The kcat value for rFheCLl (0.49 s"1) is lower than values
reported for cathepsin L from rat liver (26 s '1), human liver (17 s'1), and arrowroot
flounder (12.2 s’1) (Kirschke et al., 1982; Mason et al., 1985; Visessanguan et al.,
2003). A difference was observed between the kcat value obtained for the recombinant
as opposed to the fluke (Fasciola hepatica) cathepsin LI (1.08 s'1) (Dowd et al., 1994).
Thus, resulting in a lower catalytic efficiency value (kcJ K m) for the recombinant
enzyme (33,562 s '1 M '1) when compared to the fluke enzyme (73,469 s '1 M'1) (Dowd et
al., 1994). However, these observed differences in the kinetic constants may be
explained by differences in the pH and temperature of assay conditions e.g. cathepsin L
from other sources were routinely assayed at pH and temperature values ranging
between pH 5.5-7.0, and 30°C-37°C, respectively (Bromme et al., 1993; Dowd et al.,
2000; Visessanguan et al., 2003).
The esterase activity of rFheCLl was determined using the substrate Z-Lys-ONp.
Literature values for esterase activity of cathepsin L are few. However, Kirschke et al.
(1982) reported a kcJ K m value of 1980 x 103 s'1 M '1 for rat liver cathepsin L hydrolysis
of Z-Lys-ONp. The result obtained for rFheCLl demonstrated a 1000-fold lower value
(1648 s'1 M '1) for esterase activity, when compared to this value. A major disadvantage
associated with the use o f this substrate is its rapid spontaneous hydrolysis, especially in
145
the presence of thiol compounds e.g. DTT (Kirschke, 1981). While the amount present
in the overall esterase assay was minimal, it may have been enough to cause some
autolysis of the substrate, hence leading to erroneous results. Z-Lys-ONp has also been
used as an active site titrant, inactivating thiol proteases that maybe present in crude
samples and hence, maybe an unsuitable substrate to determine esterase activity (Shaw
& Green, 1981). These factors may account for obtaining such a low kcJ K m value. To
determine the overall esterase/amidase ratio for rFheCLl a more suitable fluorescent
ester substrate would be necessary i.e. Z-Phe-Arg-7HMC ester. In this case, both
amidase/esterase measurement parameters would perhaps be more accurate, as both
activities would be determined with similar Z-Phe-Arg peptides. A peptide synthesis
company was engaged to synthesise this ester fluorescent substrate; however, they
encountered numerous problems in this task and no further esterase studies could be
undertaken.
146
C h a pter 6
C hemical Modification S tu d ie s
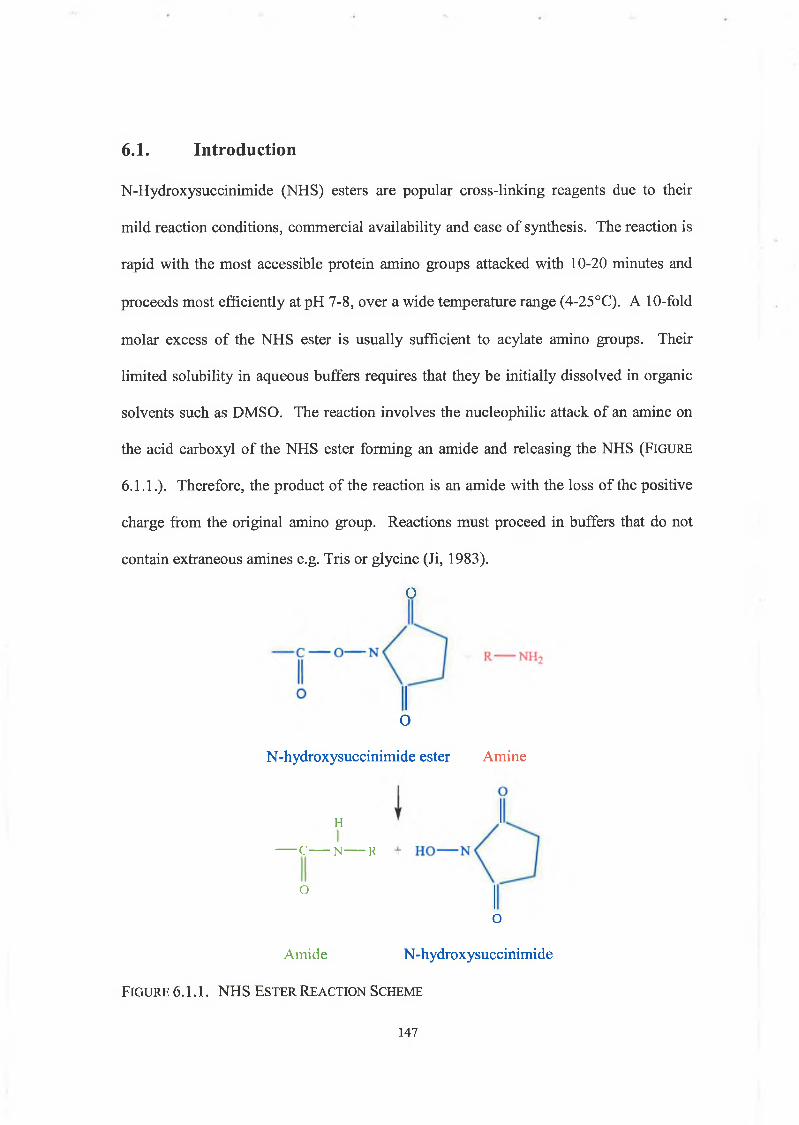
6.1. Introduction
N-Hydroxysuccinimide (NHS) esters are popular cross-linking reagents due to their
mild reaction conditions, commercial availability and ease of synthesis. The reaction is
rapid with the most accessible protein amino groups attacked with 10-20 minutes and
proceeds most efficiently at pH 7-8, over a wide temperature range (4-25°C). A 10-fold
molar excess of the NHS ester is usually sufficient to acylate amino groups. Their
limited solubility in aqueous buffers requires that they be initially dissolved in organic
solvents such as DMSO. The reaction involves the nucleophilic attack of an amine on
the acid carboxyl of the NHS ester forming an amide and releasing the NHS (F ig u r e
6.1.1.). Therefore, the product of the reaction is an amide with the loss of the positive
charge from the original amino group. Reactions must proceed in buffers that do not
contain extraneous amines e.g. Tris or glycine (Ji, 1983).
O
O
N-hydroxysuccinimide ester Amine
C N R
H
O
O
A m id e N-hydroxysuccinimide
F ig u r e 6.1.1. NHS E s t e r R e a c t io n S c h e m e
147
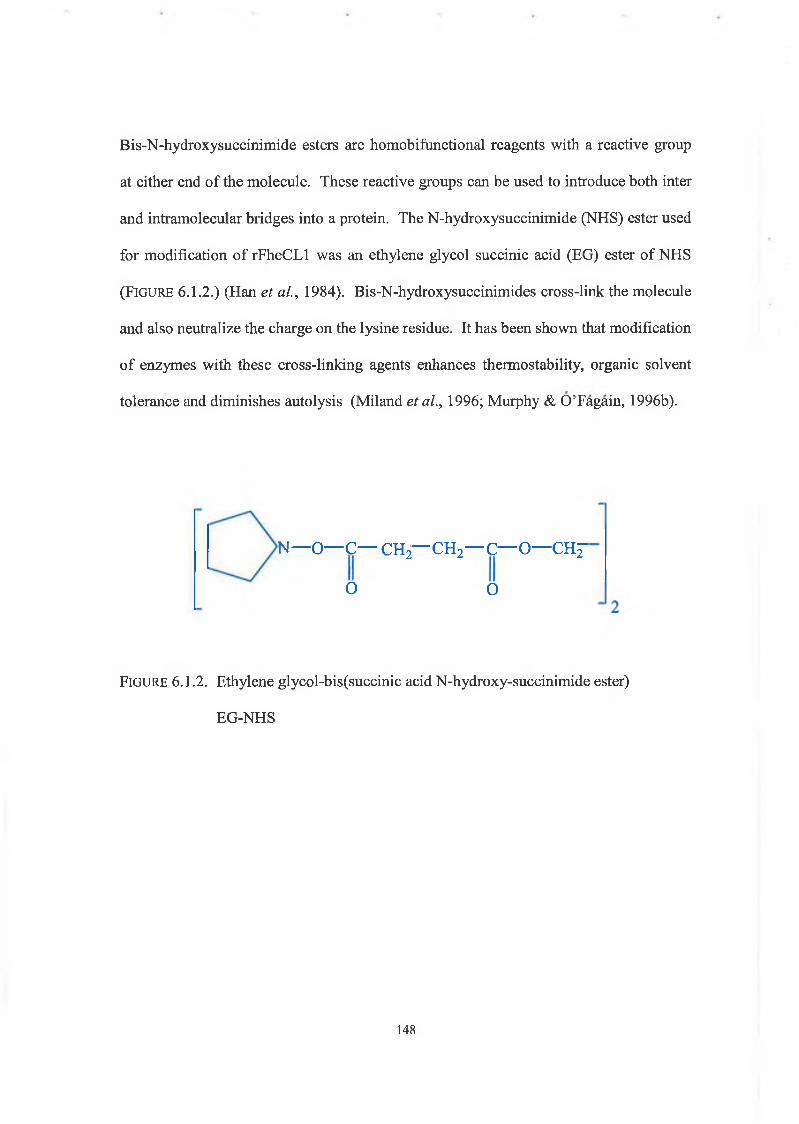
Bis-N-hydroxysuccinimide esters are homobifunctional reagents with a reactive group
at either end of the molecule. These reactive groups can be used to introduce both inter
and intramolecular bridges into a protein. The N-hydroxysuccinimide (NHS) ester used
for modification of rFheCLl was an ethylene glycol succinic acid (EG) ester of NHS
(FIGURE 6.1.2.) (Han et al., 1984). Bis-N-hydroxysuccinimides cross-link the molecule
and also neutralize the charge on the lysine residue. It has been shown that modification
o f enzymes with these cross-linking agents enhances thermostability, organic solvent
tolerance and diminishes autolysis (Miland et al., 1996; Murphy & O’Fagain, 1996b).
N — O— C— CH2— CH2— C— 0 — CHJ"
O O
FIGURE 6.1.2. Ethylene glycol-bis(succinic acid N-hydroxy-succinimide ester)
EG-NHS
148
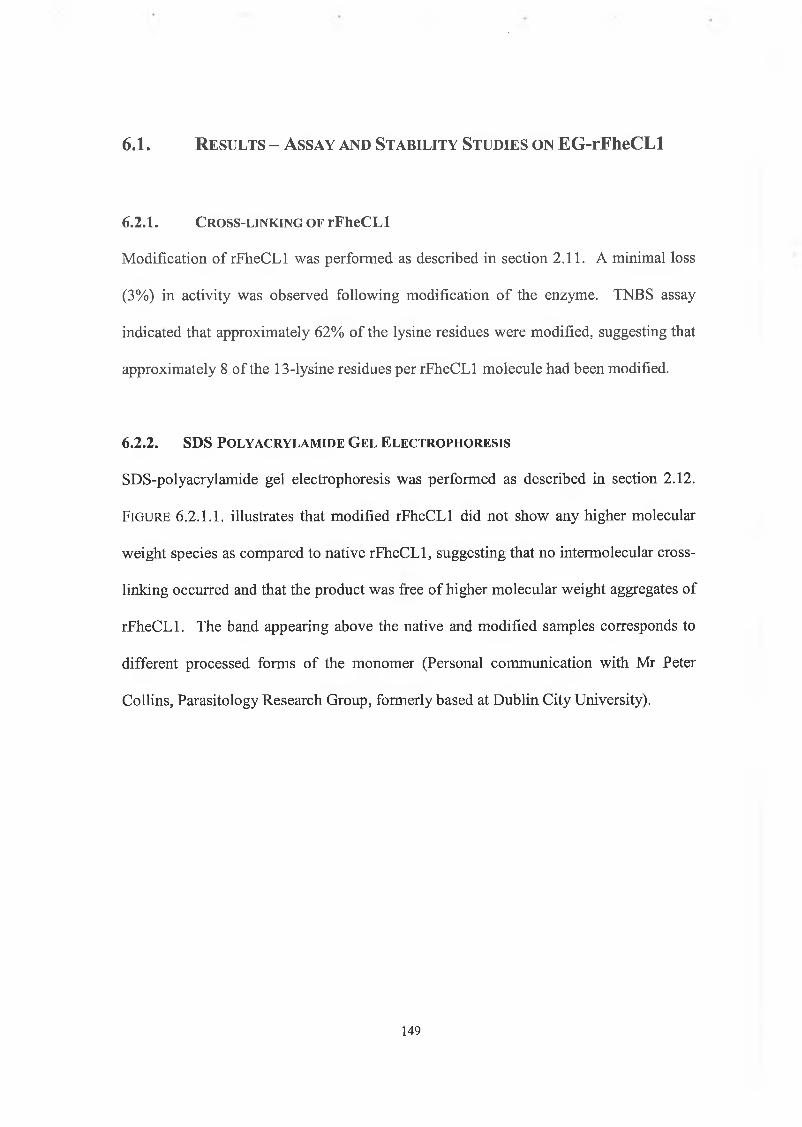
6.1. R e su l t s - A ssa y a n d S t a b il it y St u d ie s o n EG-rFheCLl
6.2.1. C r o s s - l i n k i n g o f rFheCLl
Modification of rFheCLl was performed as described in section 2.11. A minimal loss
(3%) in activity was observed following modification of the enzyme. TNBS assay
indicated that approximately 62% of the lysine residues were modified, suggesting that
approximately 8 of the 13-lysine residues per rFheCLl molecule had been modified.
6.2.2. SDS P o l y a c r y l a m i d e G e l E l e c t r o p h o r e s i s
SDS-polyacrylamide gel electrophoresis was performed as described in section 2.12.
F ig u r e 6.2.1.1. illustrates that modified rFheCLl did not show any higher molecular
weight species as compared to native rFheCLl, suggesting that no intermolecular cross-
linking occurred and that the product was free of higher molecular weight aggregates of
rFheCLl. The band appearing above the native and modified samples corresponds to
different processed forms of the monomer (Personal communication with Mr Peter
Collins, Parasitology Research Group, formerly based at Dublin City University).
149
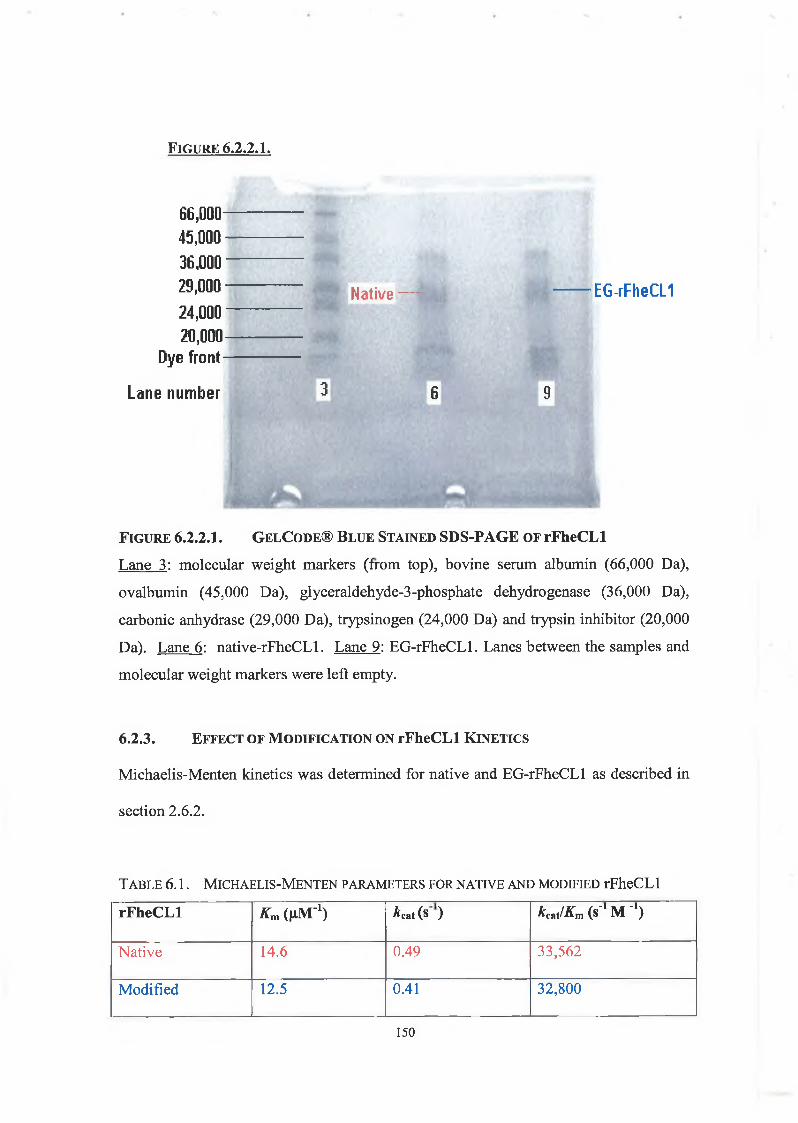
F ig u r e 6 .2 .2 .I .
Native— ietti EG-rFheCL1
3 6 9
F ig u r e 6.2.2.I. G e l C o d e ® B l u e S t a in e d S D S -P A G E o f r F h e C L l
Lane 3: molecular weight markers (from top), bovine serum albumin (66,000 Da),
ovalbumin (45,000 Da), glyceraldehyde-3-phosphate dehydrogenase (36,000 Da),
carbonic anhydrase (29,000 Da), trypsinogen (24,000 Da) and trypsin inhibitor (20,000
Da). Lane 6 : native-rFheCLl. Lane 9: EG-rFheCLl. Lanes between the samples and
molecular weight markers were left empty.
6.2.3. E f f e c t o f M o d if ic a t io n o n rFheCLl K in e t ic s
Michaelis-Menten kinetics was determined for native and EG-rFheCLl as described in
section 2 .6 .2 .
T a b l e 6 .1. M ic h a e l is -M e n t e n p a r a m e t e r s f o r n a t iv e a n d m o d if ie d rFheCLl
rFheCLl Km (nM’1) ^cat (S ) kcJ K m (s’1 M -1)
Native 14.6 0.49 33,562
Modified 12.5 0.41 32,800
66,00045.000
36.000
29.000
24.000
20.000 Dye front
Lane number
150
6.2.4. T e m p e r a t u r e S t u d ie s
6.2.4.1. Temperature Profile
A temperature profile of native and EG-rFheCLl was performed as outlined in section
2.7.1.2. T50, where 50% of initial activity remained after 10 minutes incubation in a
waterbath, was estimated at 87°C ± 1% for EG-rFheCLl, a 9°C increase above that
determined for native rFheCLl. Enhanced thermostability was demonstrated by EG-
rFheCLl at all of the investigated temperatures; however its greatest degree of
thermostability was seen at higher temperatures (between 60-90°C).
6.2.4.2. Thermoinactivation of Native and Modified rFheCLl
A thermoinactivation study was performed at 70°C over a 60 minute period as outlined
in section 2.7.2.2. F ig u r e 6.2.4.2.I. illustrates the activity profile of native and EG-
rFheCLl at 70°C over 60 minutes. A 70% decrease in activity was observed for native
rFheCLl after the 60-minute incubation period. In contrast, EG-rFheCLl retained
1 0 0 % of its original activity after the same incubation period.
151
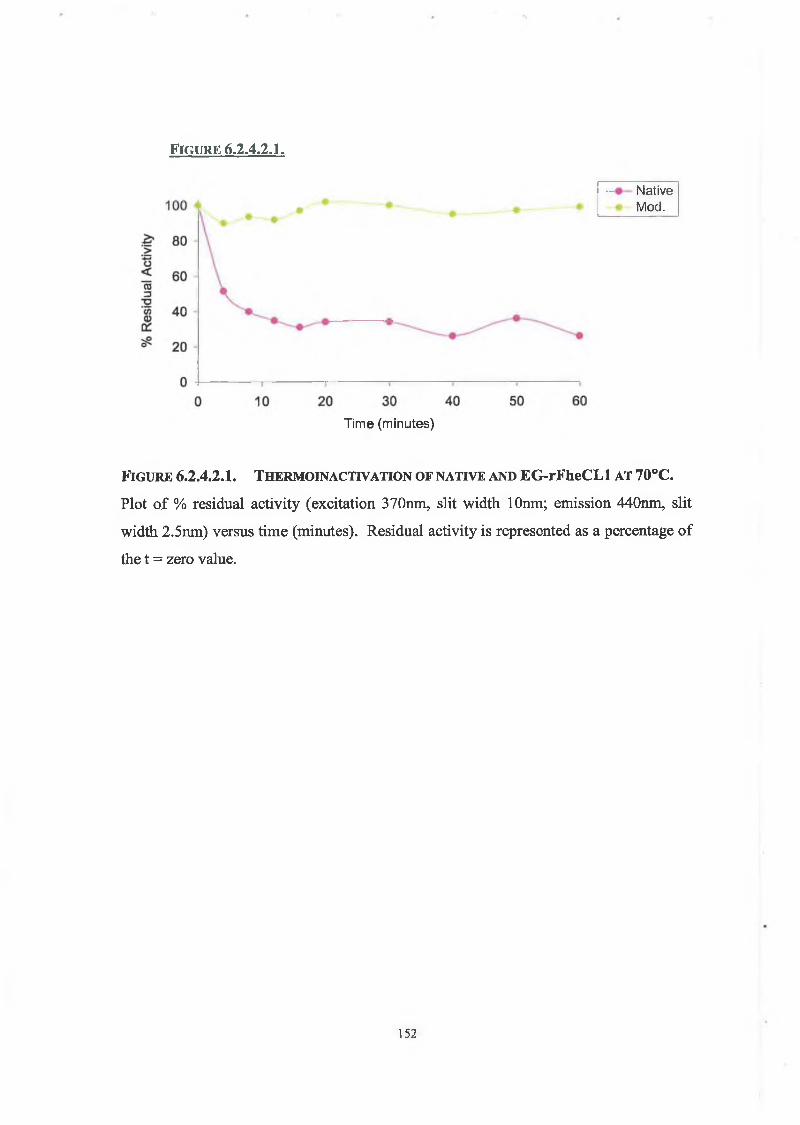
F i g u r e 6 .2 .4 .2 .I .
T i m e ( m in u t e s )
— Nat i ve
M o d .
F ig u r e 6.2.4.2.I. T h e r m o in a c t iv a t io n o f n a t iv e a n d EG-rFheCLl a t 70°C.
Plot o f % residual activity (excitation 370nm, slit width lOnm; emission 440nm, slit
width 2.5nm) versus time (minutes). Residual activity is represented as a percentage of
the t = zero value.
152
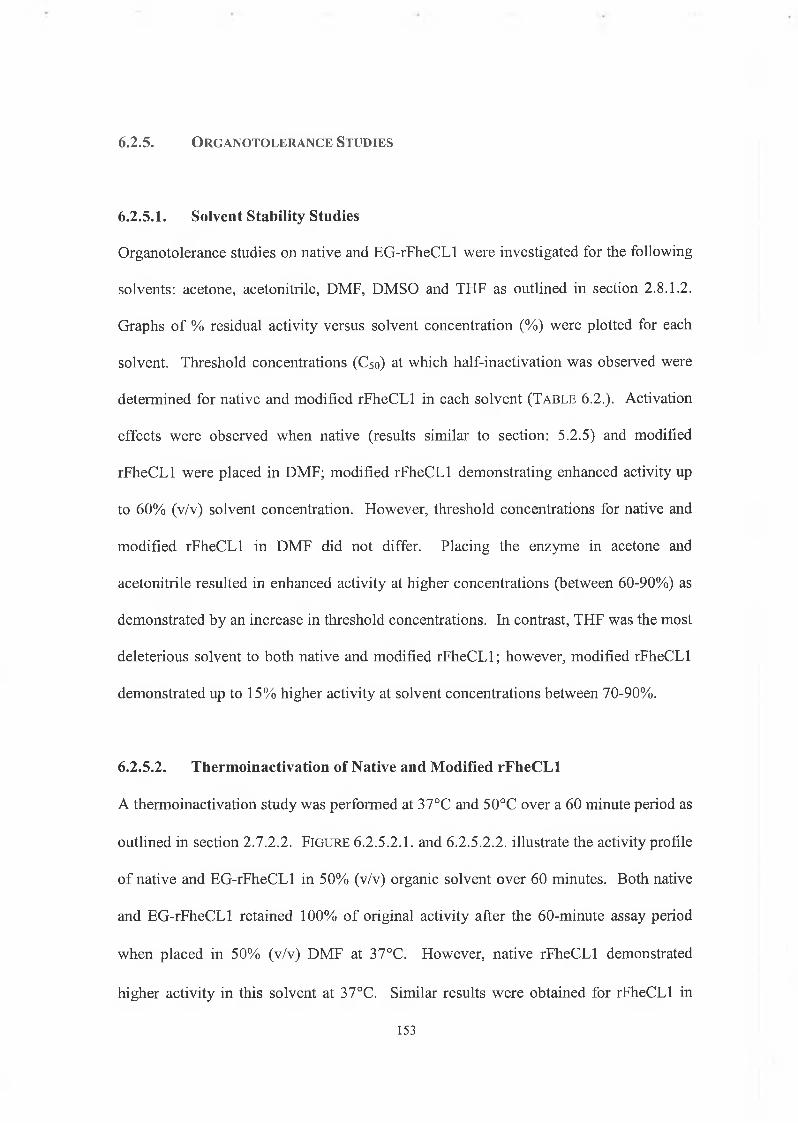
6 .2 .5 . O r g a n o t o l e r a n c e S t u d ie s
6.2.5.1. Solvent Stability Studies
Organotolerance studies on native and EG-rFheCLl were investigated for the following
solvents: acetone, acetonitrile, DMF, DMSO and THF as outlined in section 2.8.1.2.
Graphs of % residual activity versus solvent concentration (%) were plotted for each
solvent. Threshold concentrations (C50) at which half-inactivation was observed were
determined for native and modified rFheCLl in each solvent (T a b l e 6.2.). Activation
effects were observed when native (results similar to section: 5.2.5) and modified
rFheCLl were placed in DMF; modified rFheCLl demonstrating enhanced activity up
to 60% (v/v) solvent concentration. However, threshold concentrations for native and
modified rFheCLl in DMF did not differ. Placing the enzyme in acetone and
acetonitrile resulted in enhanced activity at higher concentrations (between 60-90%) as
demonstrated by an increase in threshold concentrations. In contrast, THF was the most
deleterious solvent to both native and modified rFheCLl; however, modified rFheCLl
demonstrated up to 15% higher activity at solvent concentrations between 70-90%.
6.2.5.2. Thermoinactivation of Native and Modified rFheCLl
A thermoinactivation study was performed at 37°C and 50°C over a 60 minute period as
outlined in section 2.7.2.2. F ig u r e 6.2.5.2.1. and 6.2.5.2.2. illustrate the activity profile
of native and EG-rFheCLl in 50% (v/v) organic solvent over 60 minutes. Both native
and EG-rFheCLl retained 100% of original activity after the 60-minute assay period
when placed in 50% (v/v) DMF at 37°C. However, native rFheCLl demonstrated
higher activity in this solvent at 37°C. Similar results were obtained for rFheCLl in
153
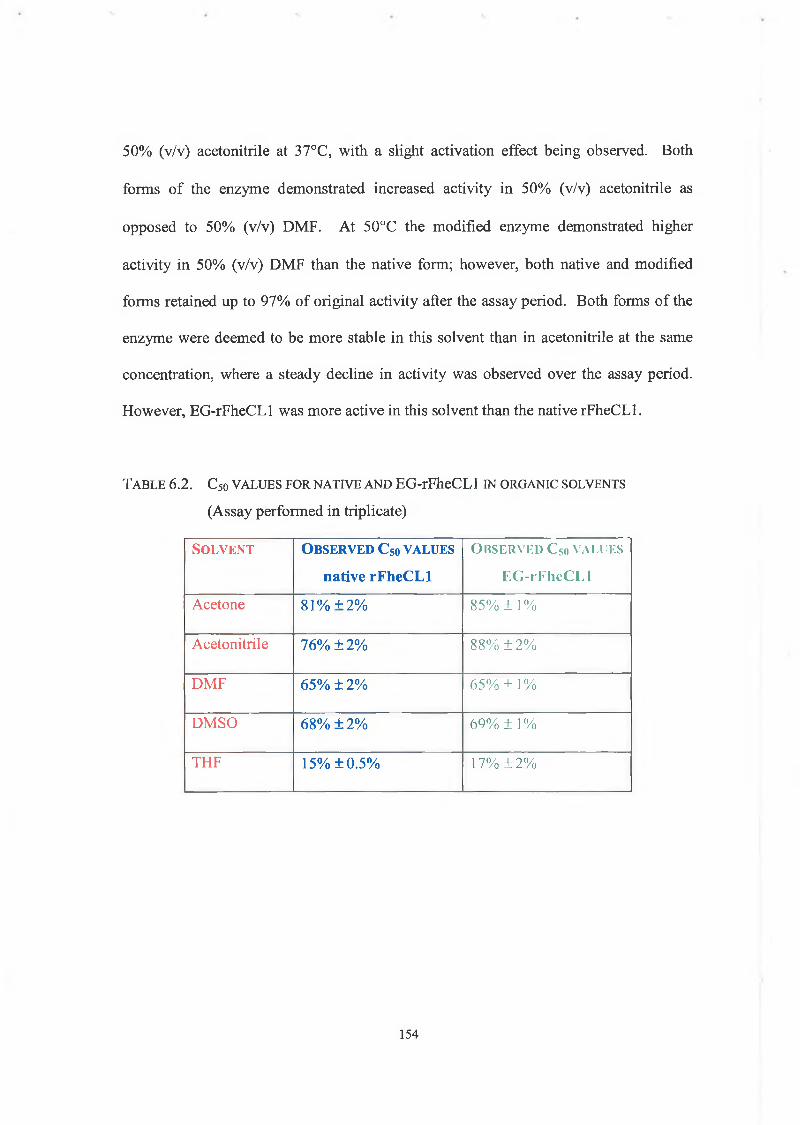
50% (v/v) acetonitrile at 37°C, with a slight activation effect being observed. Both
forms of the enzyme demonstrated increased activity in 50% (v/v) acetonitrile as
opposed to 50% (v/v) DMF. At 50°C the modified enzyme demonstrated higher
activity in 50% (v/v) DMF than the native form; however, both native and modified
forms retained up to 97% of original activity after the assay period. Both forms of the
enzyme were deemed to be more stable in this solvent than in acetonitrile at the same
concentration, where a steady decline in activity was observed over the assay period.
However, EG-rFheCLl was more active in this solvent than the native rFheCLl.
T a b l e 6 .2 . C50 v a l u e s f o r n a t iv e a n d EG-rFheCLl in o r g a n ic s o l v e n t s
(Assay performed in triplicate)
So l v e n t O b s e r v e d C 5o v a l u e s
native rFheCLl
O b s e r v e d C50 v a l u e s
EC-rFheCLl
Acetone 81% +2% 85% ± 1 %
Acetonitrile 76% ±2% 88% ± 2 %
DMF 65% ±2% 65% ± 1 %
DMSO 68% ±2% 69% ± 1 %
THF 15% ±0.5% 17% ± 2%
154
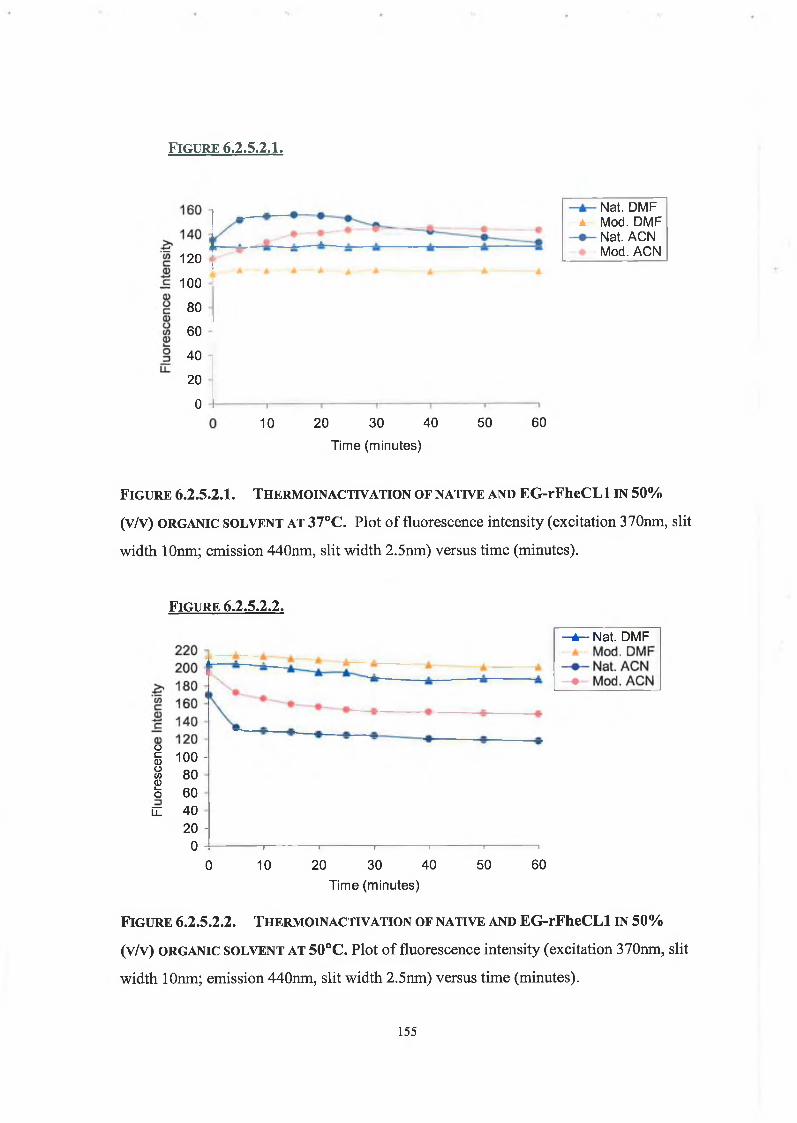
F i g u r e 6 .2 .5 .2 .I .
120
100 -I 80
60
40
20
010 20 30 40
T i m e (m in u t e s )
50 60
Nat. D M F a M od. D M F
Nat. A C N Mod. A C N
F ig u r e 6.2.5.2.I. T h e r m o in a c t iv a t io n o f n a t iv e a n d EG-rFheCLl in 50%
(v/v) ORGANIC s o l v e n t a t 37°C. Plot of fluorescence intensity (excitation 370nm, slit
width lOnm; emission 440nm, slit width 2.5nm) versus time (minutes).
F ig u r e 6.2.5.2.2.
— A — Nat. D M F
I 100- § 80Ö 60 QI 40
20 -
0 I----------------------------1--------------------------- 1--------------------------- 1---------------------------1---------------------------T---------------------------1
0 10 20 30 40 50 60
T i m e (m in u t e s )
F ig u r e 6.2.5.2.2. T h e r m o in a c t iv a t io n o f n a t iv e a n d EG-rFheCLl in 50%
(v/v) ORGANIC s o l v e n t a t 50°C. Plot of fluorescence intensity (excitation 370nm, slit
width lOnm; emission 440nm, slit width 2.5nm) versus time (minutes).
155
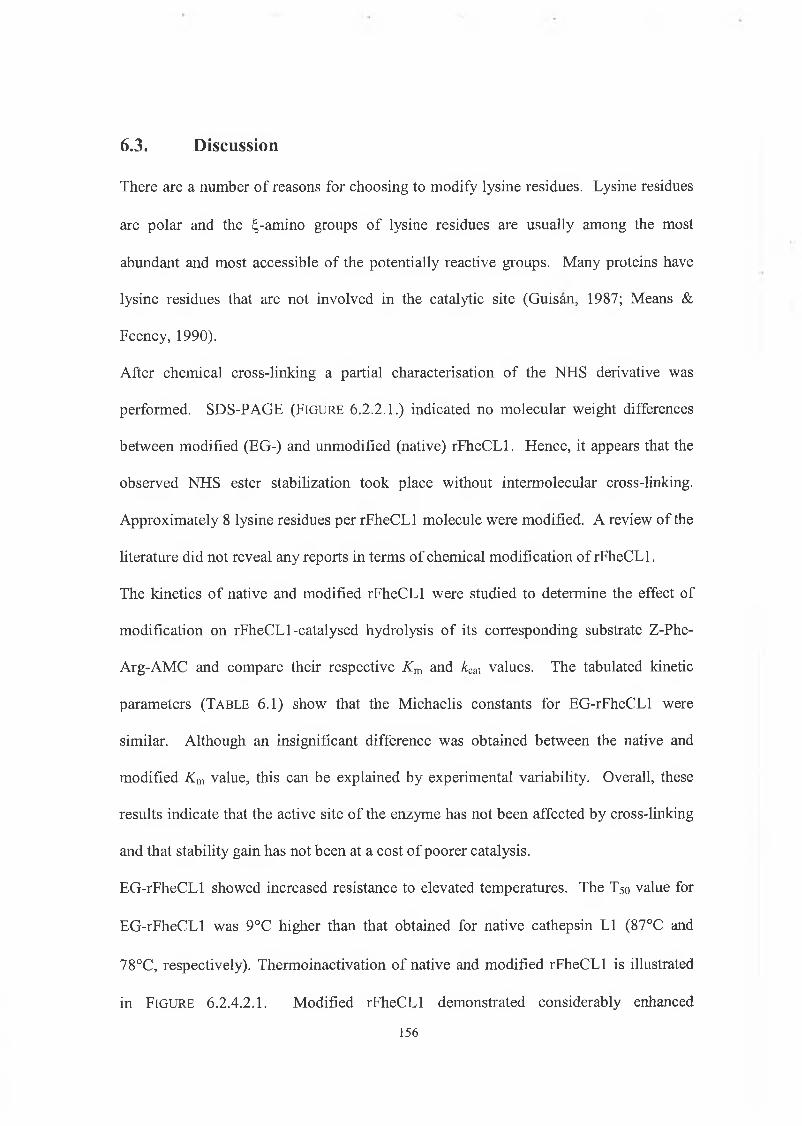
There are a number of reasons for choosing to modify lysine residues. Lysine residues
are polar and the ^-amino groups of lysine residues are usually among the most
abundant and most accessible of the potentially reactive groups. Many proteins have
lysine residues that are not involved in the catalytic site (Guisan, 1987; Means &
Feeney, 1990).
After chemical cross-linking a partial characterisation of the NHS derivative was
performed. SDS-PAGE (F ig u r e 6.2.2.1.) indicated no molecular weight differences
between modified (EG-) and unmodified (native) rFheCLl. Hence, it appears that the
observed NHS ester stabilization took place without intermolecular cross-linking.
Approximately 8 lysine residues per rFheCLl molecule were modified. A review of the
literature did not reveal any reports in terms of chemical modification of rFheCLl.
The kinetics of native and modified rFheCLl were studied to determine the effect of
modification on rFheCLl-catalysed hydrolysis of its corresponding substrate Z-Phe-
Arg-AMC and compare their respective Km and kcai values. The tabulated kinetic
parameters (T a b l e 6.1) show that the Michaelis constants for EG-rFheCLl were
similar. Although an insignificant difference was obtained between the native and
modified Km value, this can be explained by experimental variability. Overall, these
results indicate that the active site of the enzyme has not been affected by cross-linking
and that stability gain has not been at a cost of poorer catalysis.
EG-rFheCLl showed increased resistance to elevated temperatures. The T50 value for
EG-rFheCLl was 9°C higher than that obtained for native cathepsin LI (87°C and
78°C, respectively). Thermoinactivation of native and modified rFheCLl is illustrated
in F igure 6.2.4.2.I. Modified rFheCLl demonstrated considerably enhanced
156
6.3. Discussion
thermostability at 70°C over the duration when compared to native rFheCLl.
Intramolecular cross-linking stabilises a protein’s tertiary structure. The cross-linking
agent acts as external braces that prevent unfolding of the tertiary structure. Therefore,
the degree to which thermostability is observed may be dependant on the degree of
cross-linking (Han et al., 1984; Sheehan et al., 1990). The positioning of lysine
residues in the protein plays an important role in stability. The rate and extent of
deamidation of asparagines residues is influenced by the nature of the carboxyl-flanking
amino acid. Lysines positioned before asparagine residues in the protein have been
found to contribute to the lability of asparagines and, therefore, its deamidation.
Modification of these lysine residues could result in a lower extent of deamidation
(Daniel, 1996; Khajeh et al., 2001). Of the 13-lysine residues in rFheCLl, 4 are
positioned immediately before asparagine residues. If these are among the 8 lysine
residues which have been modified, this may hinder the deamidation reaction, giving a
possible reason why EG-rFheCLl demonstrated enhanced thermostability when
compared to the native enzyme. Modification may also stabilise the protein by masking
the hydrophobic methylene chain of the lysine from unfavourable contact with water,
enhancing stability (Khaparde & Singhal, 2001). Enhanced stability may also be due to
a simple cross-link stabilizing the tertiary structure (Han et al., 1984).
The tolerance of EG-rFheCLl in organic solvents (acetone, acetonitrile, DMF, DMSO)
was enhanced. The C50 values for EG-rFheCLl were higher than those for native
rFheCLl for all the tested solvents (exception DMF; T a b l e 6.2); however, THF was
still deemed the most deleterious solvent, with only a 2 % difference between the native
and modified C50 value. Transferring the enzyme to a solvent can be potentially
destabilizing by leading to loss of solvation. This arises because the native
157
conformation of proteins in water tends to maximise the solvation contribution to the
stability of charged residues. Therefore, removing the charge on these lysine residues
should enhance the stability of the folded enzyme in solvents that are less capable than
water of solvating charges. Removing the charge may also decrease the concentration
of water required for enzyme activation (Arnold, 1990). Stability of EG-rFheCLl may
result from this factor and from increased conformational rigidity caused by introducing
intramolecular cross-link into the enzyme, thereby preventing reversible unfolding of
the molecule.
Many enzymes inactivate at high temperatures in aqueous environments, due to partial
unfolding and covalent alterations in the primary structure (Dordick, 1991). Water is
required as a reactant for a number of deleterious processes such as deamidation and
peptide hydrolysis (Krishna, 2002). In reduced water environments, intra-molecular
forces such as hydrogen bonding and ion pair interactions are stronger in organic
solvents than in water. This leads to decreased flexibility, increased conformational
rigidity and the absence of nearly all covalent reactions that cause irreversible
thermoinactivation in water (Gupta, 1992; Klibanov, 2001; Colombo & Carrea, 2002).
Thermoinactivation of both native and EG-rFheCLl in both 50% (v/v) acetonitrile and
DMF was examined at 37° and 50°C. Both native and modified forms of the enzyme
were stable at 37°C in these solvents, although the native enzyme was more active.
Enhanced thermostability of the EG-rFheCLl was observed in these solvents at 50°C.
A combination of factors may contribute to this increase in thermostability namely: (1)
the direct effect of the solvent/reduced water environment, discussed above; (2)
modification of the lysine residues, reducing deleterious deamidation reactions or (3)
the direct effect of cross-linking decreasing the flexibility of the enzyme.
158
C h a pter 7
P e p tid e Sy n th e s is
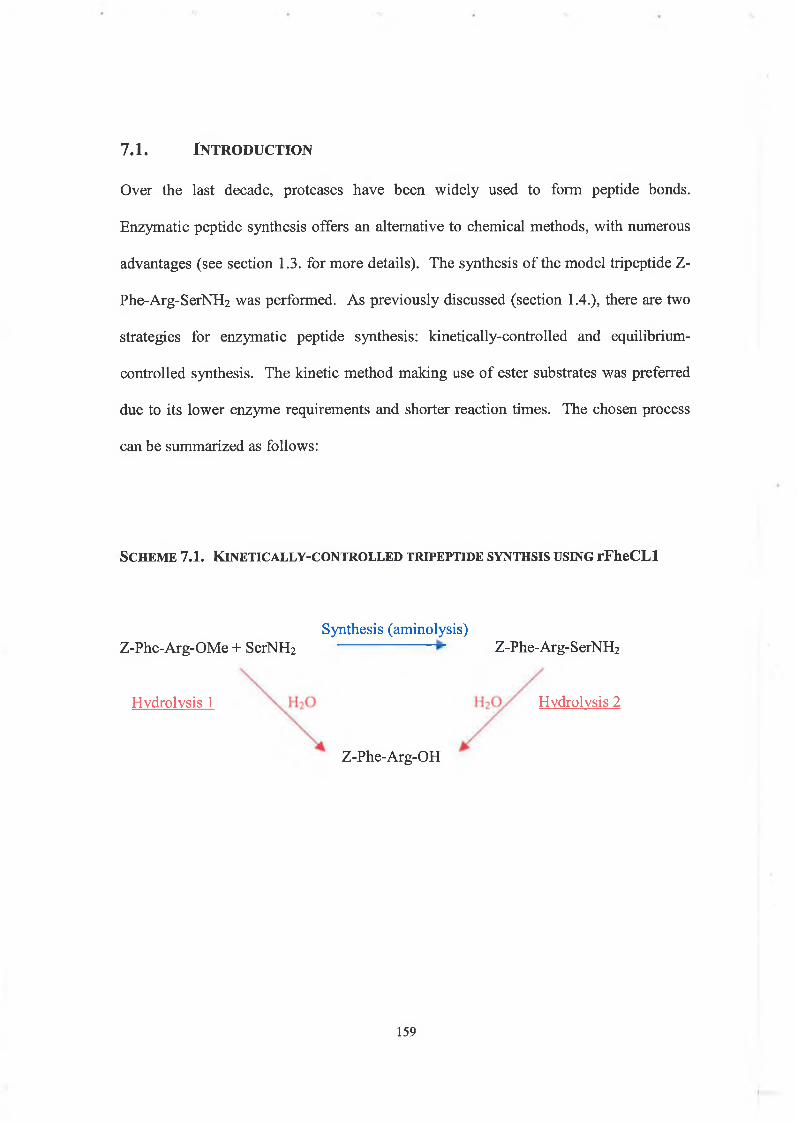
Over the last decade, proteases have been widely used to form peptide bonds.
Enzymatic peptide synthesis offers an alternative to chemical methods, with numerous
advantages (see section 1.3. for more details). The synthesis of the model tripeptide Z-
Phe-Arg-SerNH2 was performed. As previously discussed (section 1.4.), there are two
strategies for enzymatic peptide synthesis: kinetically-controlled and equilibrium-
controlled synthesis. The kinetic method making use of ester substrates was preferred
due to its lower enzyme requirements and shorter reaction times. The chosen process
can be summarized as follows:
S c h e m e 7 .1 . K i n e t i c a l l y - c o n t r o l l e d t r ip e p t id e s y n t h s is u s in g r F h e C L l
7 .1 . In t r o d u c t io n
Synthesis (aminolysis)Z-Phe-Arg-OMe + SerNlk Z-Phe-Arg-SerNH2
Hydrolysis 1
Z-Phe-Arg-OH
Hydrolysis 2
159
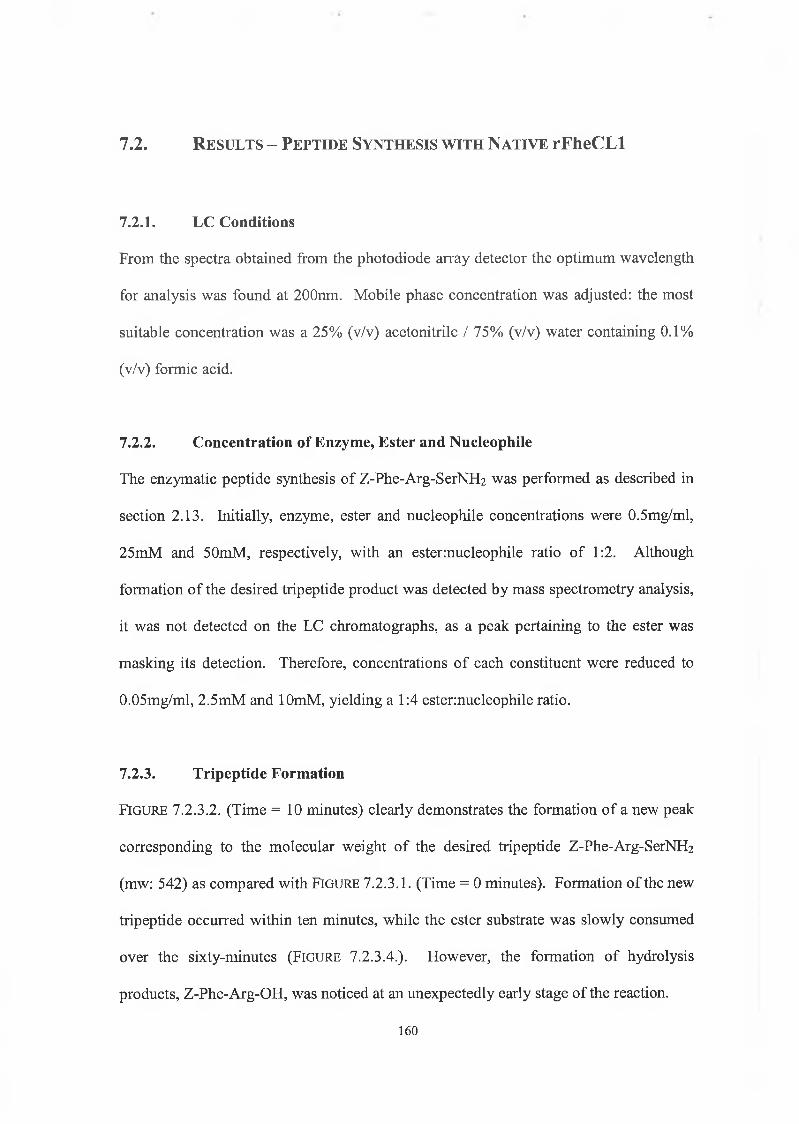
7.2. R e s u l t s - P e p t id e Sy n t h e s is w it h N a t iv e rFheCLl
7.2.1. LC Conditions
From the spectra obtained from the photodiode array detector the optimum wavelength
for analysis was found at 200nm. Mobile phase concentration was adjusted: the most
suitable concentration was a 25% (v/v) acetonitrile / 75% (v/v) water containing 0.1%
(v/v) formic acid.
7.2.2. Concentration of Enzyme, Ester and Nucleophile
The enzymatic peptide synthesis of Z-Phe-Arg-SerNH2 was performed as described in
section 2.13. Initially, enzyme, ester and nucleophile concentrations were 0.5mg/ml,
25mM and 50mM, respectively, with an ester:nucleophile ratio of 1:2. Although
formation of the desired tripeptide product was detected by mass spectrometry analysis,
it was not detected on the LC chromatographs, as a peak pertaining to the ester was
masking its detection. Therefore, concentrations of each constituent were reduced to
0.05mg/ml, 2.5mM and lOmM, yielding a 1:4 ester:nucleophile ratio.
7.2.3. Tripeptide Formation
FIGURE 7.2.3.2. (Time = 1 0 minutes) clearly demonstrates the formation of a new peak
corresponding to the molecular weight of the desired tripeptide Z-Phe-Arg-SerNH2
(mw: 542) as compared with F ig u r e 7.2.3.1. (Time = 0 minutes). Formation of the new
tripeptide occurred within ten minutes, while the ester substrate was slowly consumed
over the sixty-minutes (F ig u r e 7.2.3.4.). However, the formation of hydrolysis
products, Z-Phe-Arg-OH, was noticed at an unexpectedly early stage of the reaction.
160
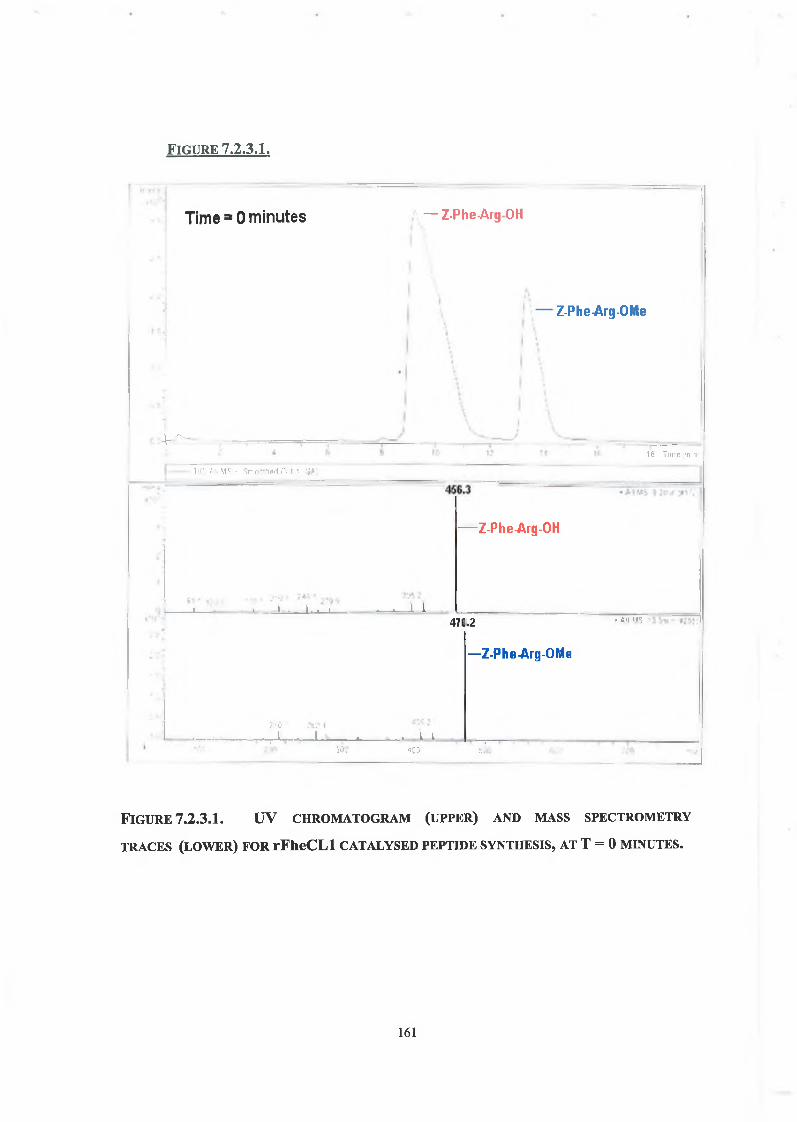
F ig u r e 7 .2 .3 .I .
Time * 0 minutes
V'"-
— 1 ir rV M': ■ S rr-;in p .j .;3 1 '< 'jp
— Z-PheArg OH
Z-Phe -Arg-OMe
16 Turn l m t
1 . 1 . i . * i _ --*--1 1 i
— Z-Phe-Arg-OH
47C
. . . . / I . Ï . » I. l
,2 » A'l MS
— Z-Phe-Arg-OMe
; 'f- 305 <5 sir ' * <5C> ' * .TO
F i g u r e 7 .2 .3 .I . U V c h r o m a t o g r a m ( u p p e r ) a n d m a s s s p e c t r o m e t r y
t r a c e s (l o w e r ) f o r rFheCLl c a t a l y s e d p e p t id e s y n t h e s i s , a t T = 0 m in u t e s .
161
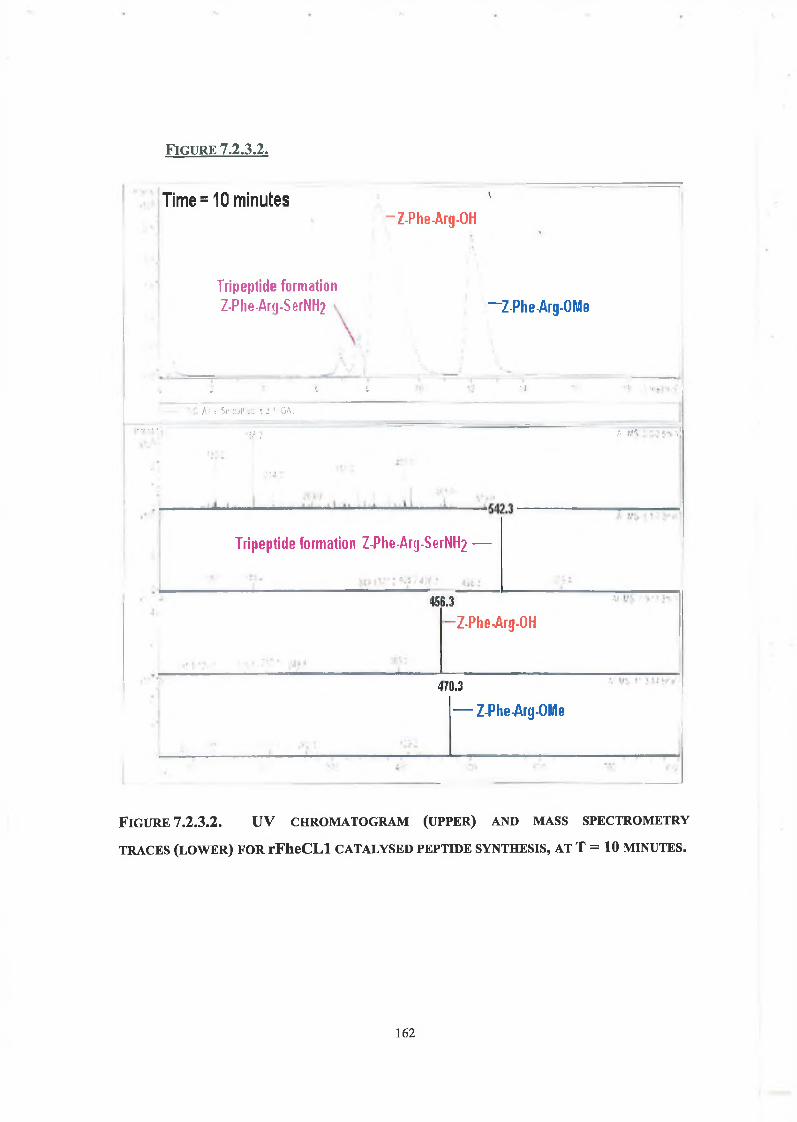
F ig u r e 1.2 3 .2.
Time = 10 minutes '
“ Z-PheJ\rg-0H
--------------- -------------------1
»
Tripeptide formationZ-Phe-Ar<j-SerNH2 —
* Y
Z-Phe-Arg-OMe
: - i il •4 • •? 1 •nel'" >
' ,>Vi : Sr :::<!! f t : - 1 CiAi
‘ iff ; f* MS '•I
* ... -
Tripeptide formation Z-Phe-Arg-SerNH2 —
456.3-Z -P h e A rg -O H
4ro.3— Z-PheJ\rg-0M e
-----------------------------------------------
F i g u r e 1.2.3.2. U V c h r o m a t o g r a m (u p p e r ) a n d m a s s s p e c t r o m e t r y
TRACES (LOWER) FOR rFheCLl CATALYSED PEPTIDE SYNTHESIS, AT T = 10 MINUTES.
1 6 2
F ig u r e 1.2.3 3 .
Time = 20 minutes —z-Phe Arg-OH
Formed tripeptideZ-Phe-Ar<j-SerNH2 ' i \
\ 3 1 I Z-Phe-Arg-OMe
M - t r r t , v i *i '
54Formed tripeptide Z -P lie-A rg-SerN H 2-----
* ̂ * 5 fii ’ .!■: ■' 2 * C* - '1 •' A lii*> ?
?.3
456
In.1 .. . _A_ - 1 - * «. - - 1 1
.3
-Z -P heJ\rg -0H
4"
. i * . ?•'! * k j :
----- 1----- ;----- > 11 " — 1 ̂ t I1 f ’1 I*— I* i ^ i * i-------
'0.3
— Z-Phe-Arg-OMe
. . - - - - - - - - - - - - - ~
F i g u r e 1.2.3.3. U V c h r o m a t o g r a m (u p p e r ) a n d m a s s s p e c t r o m e t r y
TRACES (LOWER) FOR rFheCLl CATALYSED PEPTIDE SYNTHESIS, AT T = 20 MINUTES.
163
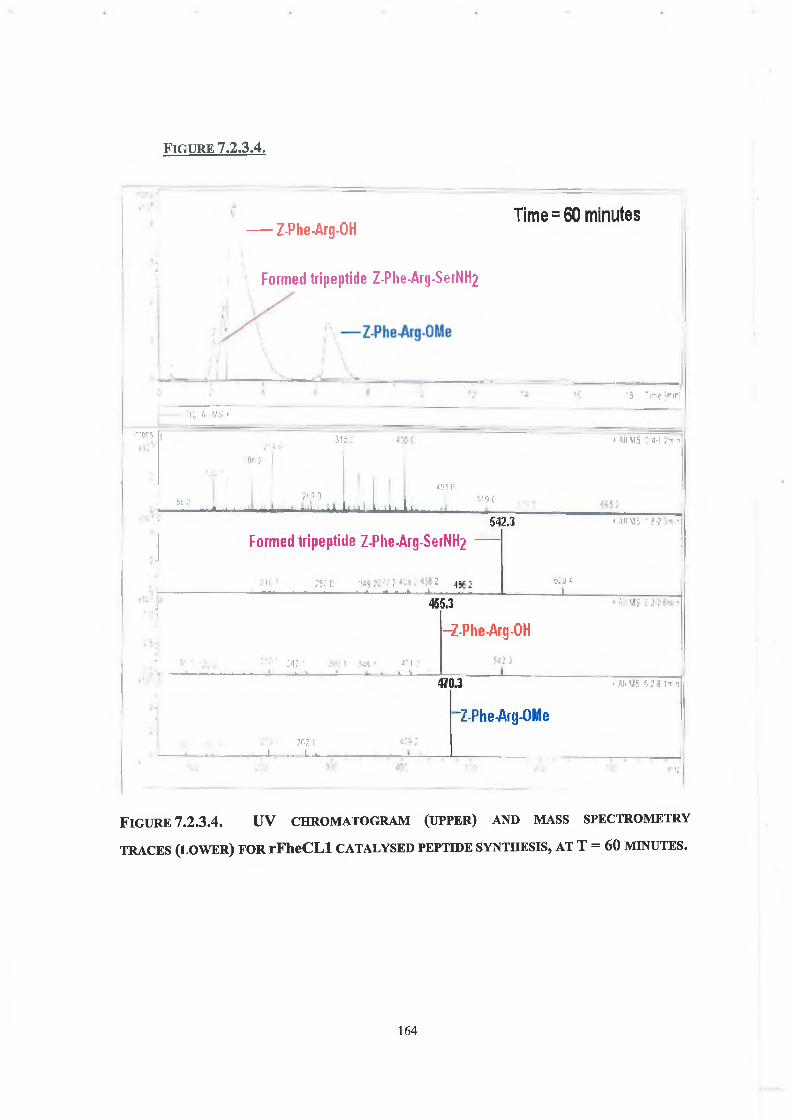
F ig u r e 7.2.3 .4.
Z-Phe J\rg-OHTime = 60 minutes
Formed tripeptide Z-Plie-Arg-SerNH2
i: /• r/s >"S "ir-iç |n-irj
lr-nrs i\ïi * Ml MS I' 4-1 ?m -
Ü6ï I
HI; ;f l i t 1
■ à .1 I « n i . 1 1
4!! I rI- ■1 ■- 11- 19 C1
542.3 * AH M 5 ’ 9 ‘? i
Formed tripeptide Z-Phe-Arg-8erNH2
;-9T I: :'!** Ï 2 .J3->■ ■ .— ï ■ - , « â a - k . - L .- « , ^ -
6-ii *- t
455.3
—Z-Phe-Arg-OH
A!1 MS I 3 • i
M? '-.h 1.
4* ! . l v470.3 * Al* M5 6 ? fi 1m i
“Z-Phe-Arg-OMe
?Q1 J Lj.
l; I
FIGURE 7.2.3.4. UV CHROMATOGRAM (UPPER) AND MASS SPECTROMETRY
TRACES (LOWER) FOR rFheCLl CATALYSED PEPTIDE SYNTHESIS, AT T = 60 MINUTES.
164
A review of the literature indicated that cathepsin L has a preference for small amino
acid side chains (Ala, Ser) or for long but non-branched (Asn, Gin, Lys) side chains at
the P i' position. It also indicated the order of preference among these residues at this
site i.e. Ser > Ala >Lys > Asn > Gin (Menard et al., 1993). Hence, serine was chosen
as a suitable nucleophile for this synthesis.
F ig u r e s 7.2.3.1.-7.2.3.4., clearly demonstrate that within ten minutes of reaction
commencement a tripeptide was formed, while the ester was steadily consumed over the
60-minute period (although some ester still remained up to this point). However,
formation of the ester hydrolysis product steadily increased over the reaction duration.
Minimal optimisation of this reaction has taken place to date. Given time, many
parameters could be investigated to ascertain the effects of varying enzyme, substrate
and nucleophile concentrations, pH, temperature and reaction medium on the
mechanistic features of the process.
Decreasing the water concentration in the reaction medium can minimize competing
hydrolytic reactions. The behaviour of enzymes in solvent is variable: each enzyme has
its own level of tolerance. Careful selection of the organic solvent for enzyme-catalysed
peptide bond synthesis is essential as it affects not only the enzyme stability, but also
solubility of the substrate and yield of peptide product (Zhou et al., 2003). Synthesis in
organic solvents prevents substrate ester hydrolysis as well as unwanted proteolysis
(Jakubke, 1994). rFheCLl demonstrated maximum activity in 50% (v/v) acetonitrile.
The ester substrate is also soluble in this solvent; hence, this would be a good starting
point for catalysing synthesis in a suitable organic cosolvent system.
7.3. Discussion
165
Kinetically-controlled peptide synthesis has been performed at many temperatures
ranging from frozen aqueous systems up to 40°C. Therefore, the optimisation of this
reaction temperature would be worthwhile. Haensler et al. (1999) demonstrated that a-
chymotrypsin and papain were capable of synthesising various peptides (kinetically-
controlled synthesis) using unprotected amino acids as acyl acceptors in a frozen
aqueous system, with yields ranging from 43-95% depending on the acyl acceptor used.
Freezing is thought to increase the concentration of reactants in the unfrozen liquid
phase that is in equilibrium with the ice crystals. Decreasing the temperature also
reduces the extent of hydrolytic side reactions that take place at higher temperatures.
Optimising the concentration of reactants is an important step to achieve the highest rate
of product formation. Decreasing the concentration of the reactants (as described in
section 7.2.2.) enhanced the resolution of the LC chromatographs. This could be further
optimised. It would be interesting to establish the highest esterinucleophile ratio that
would still allow product formation and to determine the saturation level where
maximum tripeptide formation is achieved. Here, peptide synthesis was obtained at a
1:4 ratio. Lozano et al. (1992) used papain to catalyse the synthesis of a tripeptide using
an esterinucleophile ratio of 1:6. Varying the nucleophile acceptor would be an
interesting experiment, to elucidate which nucleophile gives the highest rate of
tripeptide formation. A comparison of results could be made with Menard et al. (1993),
who concluded that cathepsin L favoured serine (amongst other amino acids) at the P i'
position. Neither the rate nor the total amount of product synthesised by rFheCLl was
established in this reaction.
pH can influence kinetically-controlled synthesis in two ways: the binding of the ester
substrate to the enzyme, leading to esterase activity and the deacylation of the acyl-
166
enzyme by the nucleophile, leading to synthesis. Therefore, investigating the optimum
pH at which maximum synthetic activity is observed would be instructive (Lozano et
al., 1992). If not for the constraints of time, full optimisation of this reaction would
have taken place. However, the results obtained have proved that rFheCLl is capable of
peptide synthesis.
The preference of DPP IV for proline residues at the Pi position in substrates makes the
investigation of using the enzyme for peptide synthesis an interesting concept. It is a
difficult task to perform peptide coupling near a proline residue. The bulky size of the
5-membered ring may interfere with the coupling process (Tai, 2003). However, as
previously discussed (section 1.9.), the side chains of residues at the P i' position of DPP
IV substrates point into the large active site cavity and no specific interactions with DPP
IV occur. This explains why this enzyme has no specific preference for amino acids in
substrates at this position. Therefore, peptide synthesis using a variety o f nucleophiles
should be possible. It had been hoped to investigate the potential of DPP IV in peptide
synthesis; however, a suitable commercial ester substrate was not available preventing
realisation of this ambition. A commercial peptide synthesis group was engaged to
prepare a suitable ester substrate (Gly-Pro-7HMC). However, this has been
unsuccessful to date, as many problems were encountered during its synthesis.
Heiduschka et al. (1989) did achieve peptide synthesis using DPP IV, synthesising
various peptides using unprotected amino acids (Ala, Gly) as acyl acceptors in 50%
(v/v) glycerol. To date this is the only recorded synthesis using this enzyme.
167

C h a pter 8
C o n c lu sio n
Initially, the stability properties of the serine protease dipeptidyl peptidase IV (DPP IV)
were explored, the enzyme having been successfully purified from bovine serum with a
final yield of 12% and an overall 32-fold increase in purity. DPP IV demonstrated no
autolysis activity and was catalytically active up to 62°C, with a T50 value determined at
71°C ± 1°C. The apparent half-life (t>/2) determined at 71 °C was ten minutes.
Organotolerance studies determined that DPP IV was most stable in acetonitrile up to
70% (v/v); activity declined in both DMF and DMSO above 40% (v/v). THF was
deemed to be the most deleterious solvent to the enzyme. No enhancement of
thermostability was observed when the enzyme was placed in acetonitrile, DMF or THF
(50%) (v/v)). pH investigations revealed complete inactivation of the enzyme at pH 4.0,
but a broad stable pH range between 7.0-10. These studies also concluded that buffer
species had an effect on the activity of the enzyme: activity in MOPS buffer at pH 7.0
was greater than in HEPES at the same pH. Two pK values were determined at 6.18
and 9.7, which were attributed to the ionisation of the active site histidine734 and a-
amino group of the glycine moiety on the substrate Gly-Pro-AMC, respectively. The
effect of pH on DPP IV thermostability was investigated and revealed that activity
sharply decreased above 60°C between pH 5.5-6.5. T50 values at each pH indicated that
the enzyme was most thermostable in the neutral-alkaline pH region, with optimum
stability observed at pH 8.0.
It had been hoped to use this enzyme for peptide synthesis; however, as discussed
(section 7.3.) the lack of a suitable ester substrate to act as acyl donor impeded any such
attempt.
8.0 Conclusion
168
The next part of this project involved investigating the stability properties of the
cysteine protease, recombinant Fasciola hepatica cathepsin LI (rFheCLl). The enzyme
demonstrated no autolysis activity. rFheCLl was catalytically active up to 70°C, with
T50 at 78°C ± 1°C. Data fitted well to a single exponential decay and the apparent half-
life (ty2) at 78°C was 5.4 minutes.
Solvent stability studies determined that little or no loss in activity occurred at lower
concentrations of the solvents tested. Activity in acetone, acetonitrile, DMF and DMSO
was actually enhanced. However, a dramatic decrease in activity occurred at a critical
solvent concentration, which varied with solvent. Again, THF was found to be the most
deleterious solvent to the enzyme.
Kinetic constants determined for native rFheCLl were quite similar to reported values
for fluke (Fasciola hepatica) cathepsin LI. Reported values for the esterase activity of
this enzyme using the substrate Z-Lys-ONp are few. However, the enzyme
demonstrated a kcJ K m 1000-fold lower value than that obtained by Kirschke et al.
(1982).
Whether the observed stability associated with this enzyme is due to differences in
amino acid sequence between the fluke and recombinant enzyme has yet to be
elucidated.
Modification of rFheCLl with the homobifunctional reagent EG-NHS yielded a
catalytically active stable derivative probably with intramolecular cross-linked amino
acid groups. A comparison of the kinetic constants for the native and modified enzyme
indicated that the active site of the enzyme had not been affected by cross-linking,
apparently no loss of catalytic performance upon modification. Modification yielded
notable benefits. The EG-rFheCLl demonstrated increased thermostability, with T50
169
determined at 87°C, 9 degrees higher than that obtained for native rFheCLl.
Thermoinactivation at 70°C showed that EG-rFheCLl retained 100% activity over a 60-
minute duration; in contrast, native rFheCLl demonstrated a loss of up to 70% over the
same period. Organotolerance studies revealed that the activity of EG-rFheCLl in
solvents (acetone, acetonitrile, DMF, DMSO) was enhanced: C50 values were higher
than those obtained for the native enzyme. However, cross-linking did not improve the
stability o f the enzyme in THF. Thermoinactivation of native and EG-rFheCLl in 50%
(v/v) acetonitrile or DMF at 37°C and 50°C revealed that both forms of the enzyme
were stable at 37°C, with the modified enzyme demonstrating enhanced thermostability
at 50°C.
Successful synthesis of the tripeptide Z-Phe-Arg-SerNH2 was achieved with native
rFheCLl, although this reaction could be further optimised. A review of the literature
did not reveal any reports in terms of peptide synthesis or chemically modi fying fluke
(Fasciola hepatica) cathepsin LI or recombinant Fasciola hepatica cathepsin LI, so the
present findings appear to be novel.
The original research aims of this project have been substantially achieved.
Investigating the stability properties of both enzymes has revealed some interesting and
potentially significant results. The thermostability of both mammalian DPP IV and
rFheCLl proved considerably higher than would be expected for these enzymes, as both
are normally found existing in environments at the physiological body temperature of
37°C. Both enzymes exhibited enhanced tolerance in the present of organic solvents,
proving their possible usefulness as biocatalytic reagents in industry, where most
reactions are carried out in an organic environment. Enzymes in organic solvents can
readily catalyze many transformations that are impossible in aqueous environments.
170
From a biotechnological aspect there are numerous potential advantages in employing
enzymes in organic as opposed too aqueous media (section 1.5; T a b l e 1.1.). Native
rFheCLl demonstrated that it could catalyse peptide synthesis, again proving a role for
the enzyme in the biotechnology industry, where enzymes have been used to catalyse
the synthesis of some well-known peptides e.g. aspartame. The successful modification
of rFheCLl and the enhanced thermostability demonstrated by the modified enzyme
may allow this modified enzyme to be considered for use in detergents, where another
cysteine protease papain, having also been successfully modified is currently being
considered for application in detergent formulations (Khaparde & Singhal, 2001).
It is hoped that these results will be of use and interest to other researchers working in
the field of modification, protein stability and enzymatic peptide synthesis and may in
future be applied to a variety of biocatalytic applications, as both enzymes would appear
to have considerable potential as biocatalysts.
171

B ib l io g r a p h y
Abbott, C.A., McCaughey, G.W. & Gorrell, M.D. (1999). Two highly conserved
glutamic acid residues in the predicted p-propeller domain of dipeptidyl peptidase
IV are required for its enzyme activity. FEBS Letters, 458, 278-284.
Andersen, A.J., Fomsgaard, J., Thorbek, P. & Aasmul-Olsen, S. (1991). Current
enzymatic possibilities in the technology of peptide synthesis I. Methods of
synthesis and practical examples. Chimicaoggi, 4, 17-23.
Aranishi, F., Ogata, H., Hara, K., Osatomi, K. & Ishihara, T. (1997). Purification and
characterization of cathepsin L from hep atop ancreas of Carp Cyprinus carpio.
Comparative Biochemistry and Physiology Part B, 118 (3), 531-537.
Arnold, F. (1990). Engineering enzymes for non-aqueous solvents. Trends in
Biotechnology, 8, 244-249.
Barbas, C.F., Matos, J.R., West, B. & Wong C-H. (1988). A search for peptide ligase:
cosolvent-mediated conversion of proteases to esterases for irreversible synthesis of
peptides. Journal o f the American Chemical Society, 110, 5162-5166.
Barrett, A.J., Kembhavi, A.A., Brown, M.A., Kirschke, H., Knight, C.G., Tamai, M. &
Hanada, K. (1982). L-ira«j-Epoxysuccinyl-leucylamido(4-guanidino)butane (E-64)
and its analogues as inhibitors of cysteine proteinases including cathepsins B, H and
L. Biochemical Journal, 201, 189-198.
172
Barrett, A.J. (2001). Proteolytic enzymes: nomenclature and classification, In: Beynon,
R.J. & Bond, J.S. (eds.), Proteolytic Enzymes: A Practical Approach. Oxford:
Oxford University Press, pp. 1-21.
Bell, G., Halling, P.J., Moore, B.D., Partridge, J. & Rees, D.G. (1995). Biocatalyst
behaviour in low-water systems. Trends in Biotechnology, 13, 468-473.
Bickerstaff, G.F. (1997). Immobilization of enzymes and cells: some practical
considerations, In: Bickerstaff, G.F. (ed.), Immobilization o f Enzymes and Cells.
New Jersey: Humana Press, pp. 1-12.
Bickerstaff, G.F. & Zhou, H. (1993). Protease activity and autodigestion (autolysis)
assays using Coomassie blue dye binding. Analytical Biochemistry, 210, 155-158.
Bollag, D.M., Rozycki, M.D. & Edelstein, S.J. (1996a). Hydrophobic interaction
chromatography, In: Protein Methods, 2nd edition. New York: Wiley-Liss. pp. 346-
351.
Bollag, D.M., Rozycki, M.D. & Edelstein, S.J. (1996b). Gel filtration chromatography,
In: Protein Methods, 2nd edition. New York: Wiley-Liss. pp. 271-299.
Bollag, D.M., Rozycki, M.D. & Edelstein, S.J. (1996c). Gel electrophoresis under
denaturing conditions, In: Protein Methods, 2nd edition. New York: Wiley-Liss. pp.
107-154.
173
Bollag, D.M., Rozycki, M.D. & Edelstein, SJ. (1996d). Buffers, In: Protein Methods
2nd edition. New York: Wiley-Liss. pp. 3-10.
Boyer, R. (2000). pH, buffers, electrodes, and biosensors, In: Modern Experimental
Biochemistry, 3ld edition. San Francisco: Benjamin/Cummings, pp. 29-41.
Briand, L., Chobert, J-M., Gantier, R., Declerck, N., Tran, V., Leonil, J., Molle, D. &
Haertle, T. (1999). Impact of the lysine-188 and aspartic acid-189 inversion on
activity of trypsin. FEBS Letters, 442, 43-47.
Brömme, D., Bonneau, P.R., Lachance, P., Wiederanders, B., Kirschke, H., Peters, C.,
Thomas, D.Y., Storer, A.C. & Vemet, T. (1993). Functional expression of human
cathepsin S in Saccharomyces cerevisiae. Journal o f Biological Chemistry, 268 (7),
4832-4838.
Broun, G.B. (1976). Chemically aggregated enzymes, In: Mosbach, K. (ed.) Methods in
Enzymology: Immobilised Enzymes, Vol. XLIV. New York: Academic Press Inc.
pp. 263-280.
Buckley, S.J., Collins, P.J. & O’Connor, B.F. (2004). The purification and
characterisation of novel dipeptidyl pepridase IV-like activity from bovine serum.
International Journal o f Biochemistry & Cell Biology, 36 (7), 1281-1296.
174
Burleigh, B.A. & Andrews, N.W. (1998). Dipeptidyl-peptidase IV, In: Barrett, A.J.,
Rawlings, N.D. & Woessner, J.F. (eds.), Handbook o f Proteolytic Enzymes. San
Diego: Academic Press Inc. pp. 378-382.
Caporale, C., Fontanella, A., Petrille, P., Pucci, P., Molinaro, M.F., Picone, D. &
Auricchio, S. (1985). Isolation and characterization of dipeptidyl peptidase IV from
human meconium: functional role of /7-casomorphins. FEBS Letters, 184 (2), 273-
277.
(^etinus, §.A. & Oztop, H.N. (2003). Immobilization of catalase into chemically
crosslinked chitosan beads. Enzyme and Microbial Technology, 32, 889-894.
Chen, J-P. & Lin, W-S. (2003). Sol-gel powders and supported sol-gel polymers for
immobilization of lipase in ester synthesis. Enzyme and Microbial Technology, 32,
801-811.
Cheon, Y-H., Klim, G-J. & Kim, H-S. (2000). Stabilization of D-hydantoinase by
intersubunit cross-linking. Journal o f Molecular Catalysis B: Enzymatic, 11, 29-35.
Cherry, J.R. & Fidantsef, A.L. (2003). Directed evolution of industrial enzymes: an
update. Current Opinion in Biotechnology, 14, 438-443.
175
Collins, P.R., Stack, C.M., O’Neill, S.M., Doyle, S., Ryan, T., Brennan, G.P., Moulsey,
A., Stewart, M., Maule, A.G., Dalton, J.P. & Donnelly, S. (2004). Cathepsin LI, the
major protease involved in liver fluke (Fasciola hepatica) virulence: propeptide
cleavage sites and autoactivation of the zymogen secreted from gastrodermal cells.
Journal o f Biological Chemistry, 279 (17), 17038-17046.
Colombo, G. & Carrea, G. (2002). Modeling enzyme reactivity in organic solvents and
water through computer simulations. Journal o f Biotechnology, 96, 23-33.
Creighton, T.E. (1993a). Assembly of the primary structure, In: Proteins: Structures
and Molecular Properties, 2nd edition. New York: W. H. Freeman and Company,
pp. 50-59.
Creighton, T.E. (1993b). Proteases, In: Proteins: Structures and Molecular Properties,
2nd edition. New York: W. H. Freeman and Company, pp. 417-441.
Creighton, T.E. (1993c). Stability of the folded conformation, In: Proteins: Structures
and Molecular Properties, 2nd edition. New York: W. H. Freeman and Company,
pp. 287-308.
176
Dalton, J.P., O’Neill, S., Stack, C., Collins, P., Walshe, A., Sekiya, M., Doyle, S.,
Mulcahy, G., Hoyle, D., Khaznadji, E., Moiré, N., Brennan, G., Mousley, A.,
Kreshchenko, N., Maule, A.G. & Donnelly, S.M. (2003). Fasciola hepatica
cathepsin L-like proteases: biology, function, and potential in the development of
first generation liver fluke vaccines. International Journal for Parasitology, 33
(11), 1173-1181.
Daniel, R.M. (1996). The upper limits of enzyme thermal stability. Enzyme and
Microbial Technology, 19, 74-79.
Danisman, T., Tan, S., Kacar. Y. & Ergene, A. (2003). Covalent immobilization of
invertase on microporous pHEMA-GMA membrane. Food Chemistry’, 85 (3), 461-
466.
Danson, M.J. & Hough, D.W. (1998). Structure, function and stability of enzymes from
the Archaea. Trends in Microbiology, 6 (8), 307-314.
De Meester, I., Vanhoof, G., Lambeir, A-M. & Scharpé, S. (1996). Use of immobilized
adenosine deaminase (EC 3.5.4.4.) for the rapid purification of native human CD26 /
dipeptidyl peptidase IV (EC 3.4.14.5.). Journal o f Immunological Methods, 189,
99-105.
De Meester, I., Korom, S., van Damme, J. & Scharpé, S. (1999). CD26 , let it cut or cut
it down. Immunology Today, 20 (8), 367-375.
177
Diaz, J.F. & Balkus, K.J. (1996). Enzyme immobilization in MCM-41 molecular sieve.
Journal o f Molecular Catalysis B: Enzymatic 2, 115-126.
Dixon, M. & Webb, E.C. (1979a). Effect of enzyme concentration, In: Enzymes, 3rd
edition. New York: Academic Press Inc. pp. 48-55.
Dixon, M. & Webb, E.C. (1979b). Effect of temperature, In: Enzymes, 3rd edition. New
York: Academic Press Inc. pp. 164-182.
Dixon, M. & Webb, E.C. (1979c). Effect of pH, In: Enzymes, 3rd edition. New York:
Academic Press Inc. pp. 138-164.
Dordick, J.S. (1989). Enzymatic catalysis in monophasic organic solvents. Enzyme and
Microbial Technology, 11, 194-210.
Dordick, J.S. (1991). Principles and application of nonaqueous enzymology, In: Blanch
H.W. & Clark, D.S. (eds.) Applied Biocatalysis, 1. New York: Marcel Dekker Inc.
pp.1-51.
Dowd, A.J., Smith, A.M., McGonigle, S. and Dalton, J.P. (1994). Purification and
characterisation of a second cathepsin L proteinase secreted by the parasitic
trematode Fasciola hepatica. European Journal o f Biochemistry, 223, 91-98.
178
Dowd, A.J., Dooley, M., O’Fagain, C. & Dalton, J.P. (2000). Stability studies on the
eathepsin L proteinase of the helminth parasite, Fasciola hepatica. Enzyme and
Microbial Technology, 27, 599-604.
Duke-Cohan, J.S., Morimoto, C., Rocker, J.A. & Schlossman, S.F. (1995). A novel
form of dipeptidyl peptidase IV found in human serum: isolation, characterization
and comparison with T-lymphocyte membrane dipeptidyl peptidase IV (CD26).
Journal o f Biological Chemistry, 270 (23), 14107-14114.
Dunn, B.M. (2001). Determination of protease mechanism, In: Beynon, R.J. & Bond,
J.S. (eds.) Proteolytic Enzymes: A Practical Approach, 2nd edition. Oxford: Oxford
University Press, pp. 77-104.
Durinx, C., Lambeir, A-M., Bosmans, E., Falmagne, J-B., Berghmans, R., Haemers, A.,
Scharpe, S. & De Meester, I. (2000). Molecular characterization of dipeptidyl
peptidase activity in serum: soluble CD26/dipeptidyl peptidase IV is responsible for
the release of X-Pro dipeptides. European Journal o f Biochemistry, 267, 5608-
5613.
Eichler, J. (2001). Biotechnological uses of archaeal extremozymes. Biotechnology
Advances, 19 (4), 261-278.
179
Ellis, K.J. & Morrison, J.F. (1982). Buffers of constant ionic strength for studying pH-
dependent processes. In: Purich, D.L. (ed.) Methods in Enzymology: Enzyme
Kinetics and Mechanism Part C, 87. New York: Academic Press Inc. pp. 405-426.
Eisner, C., Grahn, S., Bauer, S., Ullmann, D., Kurth, T. & Jakubke, H.D. (2000).
Effects of chemical modification of lysine residues in trypsin. Journal o f Molecular
Catalysis B: Enzymatic, 8, 193-200.
Engel, M., Hoffmann, T., Wagner, L., Wermann, M., Heiser, U., Kiefersauer, R.,
Huber, R., Bode, W., Demuth, H-U. & Brandstetter, H. (2003). The crystal
structure of dipeptidyl peptidase IV (CD26) reveals its functional regulation and
enzymatic mechanism. Biochemistry, 100 (9), 5063-5068.
Fernández, M., Fragoso, A., Cao, R., Baños, M. & Villalonga, R. (2002). Chemical
conjugation of trypsin with monoamine derivatives of cyclodextrins: catalytic and
stability properties. Enzyme and Microbial Technology, 31, 543-548.
Fersht, A.R. & Serrano, L. (1993). Principles of protein stability derived from protein
engineering experiments. Current Opinion in Structural Biology, 3, 75-83.
Fersht, A.R. (2002a). The pH dependence of enzyme catalysis, In: Structure and
Mechanism in Protein Science: A Guide to Enzyme Catalysis and Protein Folding.
New York: W. H. Freeman and Company, pp. 169-190.
180
Fersht, A.R. (2002b). The structure of enzyme-substrate complexes, In: Structure and
Mechanism in Protein Science: A Guide to Enzyme Catalysis and Protein Folding.
New York: W. H. Freeman and Company, pp. 38-44.
Fields, R. (1971). The measurement of amino groups in proteins and peptides.
Biochemical Journal, 124, 581-590.
Fitzpatrick, P.A., Steinmetz, A.C.U., Ringe, D. & Klibanov, A.M. (1993). Enzyme
crystal structure in neat organic solvent. Proceedings o f the National Academy o f
Science, 90, 8653-8657.
Fujishima, A., Imai, Y., Nomura, T., Fujisawa, Y., Yamamoto, Y. & Sugawara, T.
(1997). The crystal structure of human cathepsin L complexed with E-64. FEBS
Letters, 407, 47-50.
Getun, I.V., Yu, Filippova, I.Y., Lysogorskaya, E.N. & Oksenoit, E.S. (2001). SDS-
Subtilisin catalyzed synthesis of tetra-peptides containing multifunctional amino
acid residues in ethanol. Journal o f Molecular Catalysis B: Enzymatic, 15, 105-110.
Gianfreda, L. & Scarfi, M.R. (1991). Enzyme stabilization: state of the art. Molecular
and Cellular Biochemistry, 100, 97-128.
181
Gill, I., Lôpez-Fandino, R., Jorba, X. & Vulfson, E.N. (1996). Biologically active
peptides and enzymatic approaches to their production. Enzyme and Microbial
Technology, 18, 162-183.
Gleich, M. Talsky, G. & Spannagl, R. (1992). Stabilization of trypsin by modification
with bi functional reagents. DECHEMA Biotechnology Conferences,?), 121-124..
Gorman, L.S. & Dordick, J.S. (1992). Organic solvents strip water off enzymes.
Biotechnology and Bioengineering, 39, 392-397.
Govardhan, C. (1999). Crosslinking of enzymes for improved stability and
performance. Current Opinion in Biotechnology, 10, 331-335.
Guisân, J.M. (1988). Aldehyde-agarose gels as activated supports for immobilization-
stabilization of enzymes. Enzyme and Microbial Technology, 10, 375-382.
Guncar, G., Pungercic, G., Klemencic, I., Turk, V. & Turk, D. (1999). Crystal structure
of MHC class II-associated p41 Ii fragment bound to cathepsin L reveals the
structural basis for differentiation between cathepsins L and S. EMBO Journal, 18
(4), 793-803.
Gupta, M.N. (1992). Enzyme function in organic solvents. European Journal o f
Biochemistry, 203, 25-32.
182
Gupta, M.N., Batra, R., Tyagi, R. & Sharma, A. (1997). Polarity index: the guiding
solvent parameter for enzyme stability in aqueous-organic cosolvent mixtures.
Biotechnology Progress, 13, 284-288.
Haensler, M., Thust, S., Klossek, P. & Ullmann, G. (1999). Enzyme-catalysed
preparative peptide synthesis in frozen aqueous systems. Journal o f Molecular
Catalysis B: Enzymatic, 6, 96-98.
Han, K.K., Richard, C. & Delacourte, A. (1984). Chemical cross-links of proteins by
using bi functional reagents. International Journal o f Biochemistry, 16 (2), 129-145.
Heiduschka, P., Dittrich, J., Heins, J., Neubert, K. and Barth, A. (1989). Application of
the dipeptidyl peptidase IV in formation of the peptide bond. Pharmazie, 11, 778-
780.
Helmerhorst, E. & Stokes, G.B. (1980). Microcentrifuge desalting: a rapid, quantitative
method for desalting small amounts of protein. Analytical Biochemistry, 140, ISO-
135.
Henley, J.P. & Sadana, A. (1985). Categorization of enzyme deactivations using a
series-type mechanism. Enzyme and Microbial Technology, 7, 50-60.
183
Hermanson, G.T., Mallia, A.K. & Smith, P.K. (1992). Immobilized dyes, In:
Immobilized Affmigy Ligand Techniques. San Diego: Academic Press Inc. pp.
174-178.
Hilvert, D. (1991). Extending the chemistry of enzymes and abzymes. Trends in
Biotechnology, 9, 11-16.
Hiramatsu, H., Kyono, K., Higashiyama, Y., Fukushima, C., Shima, H., Sugiyama, S.,
Inaka, K., Yamamoto, A. & Shimizu, R. (2003). The structure and function of
human dipeptidyl peptidase IV, possessing a unique eight-bladed P-propeller fold.
Biochemical and Biophysical Research Communications, 302, 849-854.
Hopsu-Havu, C.K. & Glenner, G.G. (1966). A new dipeptide naphthylamidase
hydrolysing glycylprolyl-beta-naphthylamide. Histochemie, 7, 197-201.
Huckel, M., Wirth, H.J. & Hearn, M.T.W. (1996). Porous zirconia: a new support
material for enzyme immobilization. Journal o f Biochemistry and Biophysical
Methods, 31, 165-179.
Iwaki-Egawa, S. Watanabe, Y., Kikuya, Y., Fujimoto, Y. (1998). Dipeptidyl peptidase
IV from human serum: purification, characterization, and N-terminal. Journal o f
Biochemistry, 124 (2), 428-433.
184
Jakubke, ELD. (1987). Enzymatic peptide synthesis, In: Udenfriend, S. & Meienhofer,
J. (eds.) The Peptides'. Analysis, Synthesis, and Biology, 9. New York: Academic
Press Inc. pp. 103-165.
Jakubke, H.D. (1994). Protease-catalyzed peptide synthesis: basic principles, new
synthesis strategies and medium engineering. Journal o f the Chinese Chemical
Society, 41, 355-370.
Ji, T.H. (1983). Bifunctional Reagents, In: Hirs, C.H.W. & Timasheff, S.N. (eds.)
Methods in Enzymology: Enzyme Structure Part 1, 91. New York: Academic Press
Inc. pp. 580-609.
Kasche, V. (1989). Proteases in peptide synthesis, In: Benynon, R.J. & Bond, J.S.
(eds.) Proteolytic Enzymes: A Practical Approach. Oxford: University Press, pp.
125-143.
Katchalski-Katzir, E. (1993). Immobilized enzymes - learning from past successes and
failures. Trends in Biotechnology, 11, 471-478.
Kenny, A.J. (1999). Introduction: nomenclature and classes of peptidases, In: Sterchi,
E.E. & Stocker, W. (eds.) Proteolytic Enzymes: Tools and Targets. Berlin:
Springer-Verlag. pp. 1-8.
185
Kent, S.B.H. (1988). Chemical synthesis of peptides and proteins. Annual Review o f
Biochemistry, 57, 957-989.
Khajeh, K., Naderi-Manesh, H., Ranjbar, B., Moosavi-Movahedi, A. & Nemat-Gorgani,
M. (2001). Chemical modification of lysine residues in Bacillus a-amylases: effect
on activity and stability. Enzyme and Microbial Technology, 28, 543-549.
Khaparde, S.S. & Singhal, R.S. (2001). Chemically modified papain for applications in
detergent formulations. Bioresource Technology, 78, 1-4.
Khare, S.K., Vaidya, S. & Gupta, M.N. (1991). Entrapment of proteins by aggregation
within Sephadex beads. Applied Biochemistry and Biotechnology, 27, 205-216.
Khmelnitsky, Y.L., Levashov, A.V., Klyachko, N.L. & Martinek, K. (1988).
Engineering biocatalytic systems in organic media with low water content. Enzyme
and Microbial Technology, 10, 710-724.
Khmelnitsky, Y.L., Mozhaev, V.V., Belova, A.B., Sergeeva, M.V. & Martinek, K.
(1991a). Denaturation capacity: a new quantitative criterion for selection of organic
solvents as reaction media in biocatlysis. European Journal o f Biochemistry, 198,
31-41.
186
Khmelnitsky, Y.L., Belova, A.B., Levashov, A.V. & Mozhaev V.V. (1991b).
Relationship between surface hydrophilicity of a protein and its stability against
denaturation by organic solvents. FEBS Letters, 284 (2), 267-269.
Kim, W., Chae, I., Park, C. & Lee, K. (2003). Stability and activity of cross-linked
enzyme crystals o f cyclodextrin glucanotransferase isolated from Bacillus
macerans. Journal o f Molecular Catalysis B: Enzymatic, 26, 287-292.
Kirschke, H. (1981). On the substrate specificity of cathepsin L. Acta Biologica et
Medica, 40, 1427-1431.
Kirschke, H., Kembhavi, A.A., Bohley, P. & Barrett, A.J. (1982). Action of rat liver
cathepsin L on collagen and other substrates. Biochemical Journal, 201, 367-372.
Klibanov, A.M. (1997). Why are enzymes less active in organic solvents than in water
? Trends in Biotechnology, 15, 97-101.
Klibanov, A.M. (2001). Improving enzymes by using them in organic solvents.
Nature, 409 (11), 241-246.
Krishna, S.H. (2002). Developments and trends in enzyme catalysis in nonconventional
media. Biotechnology Advances, 20,239-267.
187
Kumar, S., Tsai, C-J. & Nussinov, R. (2000). Factors enhancing protein
thermostability. Protein Engineering, 13 (3), 179-191.
Kurganov, B.I., Komilaev, B.A., Chebotareva, N.A., Malikov, V.P., Orlov, V.N.,
Lyubarev, A.E. & Livanova, N.B. (2000). Dissociative mechanism of thermal
denaturation of rabbit skeletal muscle glycogen phophorylase b. Biochemistry, 39,
13144-13152.
Laemmli, U.K. (1970). Cleavage of structural proteins during the assembly of the head
of bacteriophage T4. Nature, 221, 680-685.
Lambeir, A-M., Pereira, J.F.D., Chacon, P., Vermeulen, G., Heremans, K., Devreese,
B., van Beeumen, J.V., De Meester, I. & Scharpe, S. (1997). A prediction of DPP
IV/CD26 domain structure from a physico-chemical investigation of dipeptidyl
peptidase IV (CD26) from human seminal plasma. Biochimica et Biophysica Acta,
1340, 215-226.
Lambeir, A-M., Durinx, C., Scharpe, S. & De Meester, I. (2003). Dipeptidyl-peptidase
IV from bench to bedside: an update on structural properties, functions, and clinical
aspects of the enzyme DPP IV. Critical Reviews in Clinical Laboratory Sciences,
40 (3), 209-294.
188
Lee, S.U., Park, Y.H., Davis, W.C., Hamilton, M.J., Naessens, J. & Bohach, G.C.
(2002). Molecular characterization of bovine CD26 upregulated by a
staphylococcal superantigen. Immunogenetics, 54 (3), 216-220.
Lloyd, J.B.F. (1981). Inner filter effects, sample cells and their geometry in
fluorescence spectrometry, In: Miller, J.N. (ed.) Standards in Fluorescence
Spectrometry: Techniques in Visable and Ultraviolet Spectrometry, 2. New York:
Chapman and Hall. pp. 21-43.
Lozano, P., Iborra, J.L., Manjön, A. & Combes, D. (1992). One-step synthesis of Gly-
Gly-Phe-NH2 from N-unprotected amino acid derivatives by papain in one-phase
liquid media. Biotechnology Letters, 14 (10), 933-936.
Lueking, A., Holz, C., Gotthold, C., Lehrach, H. & Cahill, D. (2000). A system for dual
protein expresion in Pichia pastoris and Escherichia coli. Protein Expression and
Purification, 20, 372-378.
Mason, R.W., Taylor, M.A.J. & Etherington, D.J. (1984). The purification and
properties of cathepsin L from rabbit liver. Biochemical Journal, 217, 209-217.
Mason, R.W., Green, G.D.J. & Barrett, A.J. (1985). Human liver cathepsin L.
Biochemical Journal, 226, 233-241.
189
Matsuura, T., Miyai, K., Trakulnaleamsai, S., Yomo, T., Shima, Y., Miki, S.,
Yamamoto, K. & Urabe, I. (1999). Evolutionary molecular engineering by random
elongation mutagenesis. Nature Biotechnology, 17, 58-61.
Mattos, C. & Ringe, D. (2001). Proteins in organic solvents. Current Opinion in
Structural Biology, 11, 761-764.
Means, G.E. & Feeney, R.E. (1990). Chemical modifications of proteins: history and
applications. Bioconjugate Chemistry, 1, 2-12.
Ménard, R., Carmona, E., Plouffe, C., Brömme, D., Konishi, Y., Lefebvre, J. & Storer,
A.C. (1993). The specificity of Si ' subsite of cysteine proteases. FEBS Letters, 328
(1-2), 107-110.
Mentlein, R. (1999). Dipeptidyl-peptidase IV (CD26)-role in the inactivation of
regulatory peptides. Regulatory Peptides, 85, 9-24.
Miland, E., Smyth, M.R. & Ô’Fâgâin, C. (1996). Modification of horseradish
peroxidase with bifunctional N-hydroxysuccinimide esters: effects on molecular
stability. Enzyme and Microbial Technology, 19, 242-249.
Morihara, K. (1987). Using proteases in peptide synthesis. Trends in Biotechnology, 5,
164-170.
190
Mort, J.S. (1998). Cathepsin L, In: Barrett, A.J., Rawlings, N.D. & Woessner, J.F.
(eds.), Handbook o f Proteolytic Enzymes. San Diego: Academic Press Inc. pp. 617-
621.
Mozhaev, V.V. & Martinek, K. (1982). Inactivation and reactivation of proteins
(enzymes). Enzyme and Microbial Technology, 4, 299-309.
Mozhaev, V.V., Siksnis, V.A., Melik-Nubarov, N.Z., Galkantaite, N.Z., Denis, G.J.,
Butkus, E.P., Zaslavsky, B.Y., Mestechkina, N.M. & Martinek, K. (1988). Protein
stabilization via hydrophilization - covalent modification of trypsin and a-
chymotrypsin. European Journal o f Biochemistry, 173, 147-154.
Mozhaev, V.V., Khmelnitsky, Y.L., Sergeeva, M.V., Belova, A.B., Klyachko, N.L.,
Levashov, A.V. & Martinek, K. (1989). Catalytic activity and denaturation of
enzymes in water/organic cosolvent mixtures: a-chymotrypsin and laccase in mixed
water/alcohol, water/glycol and water/formamide solvent. European Journal o f
Biochemistry, 184, 597-602.
Mozhaev, V.V. (1993). Mechanism-based strategies for protein thermostabilization.
Trends in Biotechnology, 11, 88-95.
Munjal, N. & Sawhney, S.K. (2002). Stability and properties of mushroom tyrosinase
entrapped in alginate, polyacrylamide and gelatin gels. Enzyme and Microbial
Technology, 30, 613-619.
Murphy, A. & Ö’Fägäin, C. (1996a). Bypassing the ribosome: peptide synthesis
without translation. Essays in Biochemistry, 31, 61-75.
Murphy, A. & Ö’Fägäin, C. (1996b). Stability characteristics of chemically-modified
soluble trypsin. Journal o f Biotechnology, 49, 163-171.
Niedermeyer, J., Enenkel, B., Park, J.E., Lenter, M., Rettig, W.J., Damm, K. &
Schnapp, A. (1998). Mouse fibroblast-activation protein: conserved Fap gene
organization and biochemical function as a serine protease. European Journal o f
Biochemistry, 254, 650-654.
Nosoh, Y. & Sekiguchi, T. (1990). Protein engineering for thermostability. Trends in
Biotechnology>, 8, 16-19.
Nureddin, A. & Inagami, T. (1975). Chemical modification of amino groups and
guanidino groups of trypsin: preparation of stable and soluble derivatives.
Biochemical Journal, 147, 71-81.
O’Driscoll, K.F. (1976). Techniques of enzyme entrapment in gels, hr. Mosbach (ed.)
Methods in Enzymology: Immobilized Enzymes, Vol. XLIV. New York: Academic
Press Inc. pp. 169-183.
Ö’Fägäin, C. (1997a). Protein stability and its measurement, In: Stabilizing Protein
Function. Berlin: Springer-Verlag, pp. 3-14.
192
Ö’Fägäin, C. (1997b). Enzymes in organic media, In: Stabilizing Protein Function.
Berlin: Springer-Verlag, pp. 39-46.
Ö’Fägäin, C. (1997c). Protein engineering, In: Stabilizing Protein Function. Berlin:
Springer-Verlag, pp. 129-162.
Ö’Fägäin, C. (2003). Enzyme-stabilization - recent experimental progress. Enzyme and
Microbial Technology, 33, 137-149.
Ogino, H. & Ishikawa, H. (2001). Enzymes which are stable in the presence of organic
solvents. Journal o f Bioscience and Bioengineering, 91 (2), 109-116.
Ohkubo, I., Huang, K., Ochiai, Y., Takagaki, M. & Kani, K. (1994). Dipeptidyl
peptidase IV from porcine seminal plasma: purification, characterization, and N-
terminal amino acid sequence. Journal o f Biochemistry, 116, 1182-1186.
Oyama, K., Nishimura, S., Nonaka, Y., Kihara, K-I. & Hashimoto, T. (1981). Synthesis
of an aspartame precusor by immobilized thermolysin in an organic solvent.
Journal o f Organic Chemistry, 46, 5241-5242.
Price, N.C. & Stevens, L. (1999). How do we analyse kinetic data? In: Fundamentals
o f Enzymology, The Cell and Molecular Biology o f Catalytic Proteins, 3rd edition.
Oxford: Oxford University Press, pp. 121-144.
193
Rasmussen, H.B., Branner, S., Wilberg, F.C. & Wagtmann, N. (2003). Crystal structure
of human dipeptidyl peptidase IV/CD26 in complex with a substrate analog. Nature
Structural Biology, 10 (1), 19-25.
Roe, S. (1989). Separation based on hydrophobicity, In: Harris, E.L.V. and Angal, S.
(eds.) Protein Purification Methods: A Practical Approach. Oxford: Oxford
University Press, pp. 221-232.
Reutter, W., Baum, O., Löster, K., Fan, H., Bork, J.P., Bemt, K., Hanski, C. & Tauber,
R. (1995). Functional aspects of the three extracellular domains of dipeptidyl
peptidase IV: characterization of glycosylation events, of the collagen-binding site
and endopeptidase activity, In: Fleischer, B. (ed.) Dipeptidyl Peptidase IV (CD26)
in Metabolism and the Immune Response. Heidelberg: Springer-Verlag, pp. 55-78
Ryan, O., Smyth, M.R. & Ö’Fägäin, C. (1994). Thermostabilized chemical derivatives
of horseradish peroxidase. Enzyme and Microbial Technology, 16, 501-505.
Sadana, A. & Henley, J.P. (1988). Influence of pH on enzyme stabilization: an analysis
using a series-type mechanism. Journal o f Biotechnology, 7, 95-112.
Sears, P. & Wong, C-H. (1996). Engineering enzymes for bioorganic synthesis: peptide
bond formation. Biotechnology Program, 12, 423-433.
194
Seidl, R. & Schaefer, W. (1991). Preparative purification of dipeptidyl peptidase IV.
Preparative Biochemistry, 21 (2&3), 141-150.
Sentandreu, M.A. & Toldrä, F. (2001). Dipeptidyl peptidase IV from porcine skeletal
muscle: purification and biochemical properties. Food Chemistry, 75, 159-168.
Sewald, N. & Jakubke, H-D. (2002a). Nonribosomal synthesis, In: Peptides: Chemistry
and Biology. GmbH: Wiley-VCH Verlag, pp. 88-90.
Sewald, N. & Jakubke, H-D. (2002b). Solid-phase peptide synthesis (SPPS), Peptides:
Chemistry and Biology. GmbH: Wiley-VCH Verlag, pp. 209-211.
Sewald, N. & Jakubke, H-D. (2002c). Recombinant DNA techniques, In: Peptides:
Chemistry and Biology. GmbH: Wiley-VCH Verlag, pp. 239-246.
Sewald, N. & Jakubke, H-D. (2002d). Enzymatic peptide synthesis, In: Peptides:
Chemistry and Biology. GmbH: Wiley-VCH Verlag, pp. 247-2267.
Shaw, E. & Green, G.D.J. (1981). Inactivation of thiol proteases with peptidyl
diazomethyl ketones, In: Lorand, L. (ed.) Methods in Enzymology: Proteolytic
Enzymes, Part C, 80. New York: Academic Press Inc. pp. 820-826.
195
Sheehan, H., O’Kennedy, R. & Kilty, C. (1990). Investigation of the properties of
bovine heart creatine kinase cross-linked with dimethyl suberimidate. Biochimica et
Biophysica Acta, 1041, 141-145.
Shibuya-Saruta, H., Kashara, Y. & Hashimoto, Y. (1996). Human serum dipeptidyl
peptidase IV (DPPIV) and its unique properties. Journal o f Clinical Laboratory
Analysis, 10, 435-440.
Smith, P.K., Krohn, R.I., Hermanson, G.T., Mallia, A.K., Gartner, F.H., Provenzano,
M.D., Fujimoto, E.K., Goeke, N.M., Olson, B.J. & Klenk, D.C. (1985).
Measurement of protein using bicinchoninic acid. Analytical Biochemistry, 150, 76-
85.
Sowdhamini, R. & Balaram, P. (1993). Protein structure and stability, In: Gupta, M.N.
(ed.) Thermostability o f Enzymes. New Delhi: Narosa Publishing House, pp. 2-21.
Stehle, P., Bahsitta, H-P., Monter, B. & Ftirst, P. (1990). Papain-catalysed synthesis of
dipeptides: a novel approach using free amino acids as nucleophiles. Enzyme and
Microbial Technology, 12, 56-60.
Tai, D-F. (2003). Enzymatic peptide synthesis: from the substrate point of view.
Current Organic Chemistry, 7, 515-554.
196
Thoma, R., Löffler, B., Stihle, M., Huber, W., Ruf, A. & Hennig, M. (2003). Structural
basis of proline-specific exopeptidase activity as observed in human dipeptidyl
peptidase-IV. Structure, 11, 947-959.
Torrez, M., Schultehenrich, M. & Livesay, D.R. (2003). Conferring thermostability to
mesophilic proteins through optimized electrostatic surfaces. Biophysical Journal,
85,2845-2853.
Trubetskoy, V.S. & Torchilin, V.P. (1985). Artificial and natural thermostabilization of
subunit enzymes. Do they have similar mechanism? International Journal o f
Biochemistry, 17 (5), 661-663.
Turk, V., Turk, B., Guncar, G., Turk, D. & Kos, J. (2002). Lysosomal cathepsins:
structure, role in antigen processing and presentation, and cancer. Advances in
Enzyme Regulation, 42, 285-303.
Tyagi, R. & Gupta, M.N. (1993). Chemical modification and chemical crosslinking for
enhancing thermostability of enzymes, In: Gupta, M.N. (ed.) Thermostability o f
Enzymes. New Delhi: Narosa Publishing House, pp. 146-160.
Tyagi, R., Batra, R. & Gupta, M.N. (1999). Amorphous enzyme aggregates: stability
toward heat and aqueous-organic cosolvent mixtures. Enzyme and Microbial
Technology, 24, 348-354.
197
Ung, A., Dupont, A., Guihot, A-L., Amouyel, P. & Pinet, F. (2004). Albumin and
immunoglobulin depletion of human serum. Origins, 15, 23-26.
Van Den Burg, B. & Eijsink, V.G.H. (2002). Selection of mutations for increased
protein stability. Current Opinion in Biotechnology, 13, 333-337.
Vellard, M. (2003). The enzyme as drug: application of enzymes as pharmaceuticals.
Current Opinion in Biotechnology, 14, 444-450.
Veronese, F.M. (2001). Peptide and protein PEGylation: a review of problems and
solutions. Biomaterials, 22, 405-417.
Visessanguan, W., Benjakul, S. & An, H. (2003). Purification and characterization of
cathepsin L in arrowtooth flounder (Atheresthes stomias) muscle. Comparative
Biochemistry and Physiology Part B, 134, 477-487.
Wong, D. & Parasrampuria, J. (1997). Pharmaceutical excipients for the stabilization of
proteins. BioPharm, 10 (11), 52-61.
Yang, Z., Domach, M., Auger, R., Yang, F.X. & Russell, A.J. (1996). Polyethylene
glycol-induced stabilization of subtilisin. Enzyme and Microbial Technology, 18,
82-89.
198
Yodoya, S., Takagi, T., Kurotani, M., Hayashi, T., Furuta, M., Oka, M. & Hayashi, T.
(2003). Immobilization of bromelain onto porous copoly (y-methyl-L-glutamate/L-
lucine) beads. European Polymer Journal, 39, 173-180.
Yoshimoto, T. & Walter, R. (1977). Post-proline dipeptidyl aminopeptidase (dipeptidyl
aminopeptidase IV) from lamb kidney. Biochimica et Biophysica Acta, 485, 391-
401.
Yoshimoto, T., Fischl, M., Orlowski, R.C. & Walter, R. (1978). Post-proline cleaving
enzyme and post-proline dipeptidyl aminopeptidase. Journal o f Biological
Chemistry, 253 (10), 3708-3716.
Yoshimoto, T. & Tsuru, D. (1982). Proline-specific dipeptidyl aminopeptidase from
Flavobacterium meningosepticum. Journal o f Biochemistry, 91, 1899-1906.
Yoshimoto, T., Kita. T., Ichinose, M. & Tsuru, D. (1982). Dipeptidyl aminopeptidase
IV from porcine pancreas. Journal o f Biochemistry, 92 (1), 275-282.
Zaks, A. & Klibanov, A.M. (1988). Enzymatic catalysis in nonaqueous solvents.
Journal o f Biological Chemistry, 263 (7), 3194-3201.
Zhang, Z., He, Z. & Guan, G. (1999). Thermal stability and thermodynamic analysis of
native and methoxypolyethylene glycol-modified trypsin. Biotechnology
Techniques, 13, 781-786.
Zhou, Y-Y., Yant, T., Wang, N., Xu, L., Huang, Y-B., Wu, X-X., Yang, Z-C. & Zhang,
Z-Z. (2003). Chemo-enzymatic synthesis of tripeptide RGD in organic solvents.
Enzyme and Microbial Technology, 33, 55-61.
200

A ppe n d ix
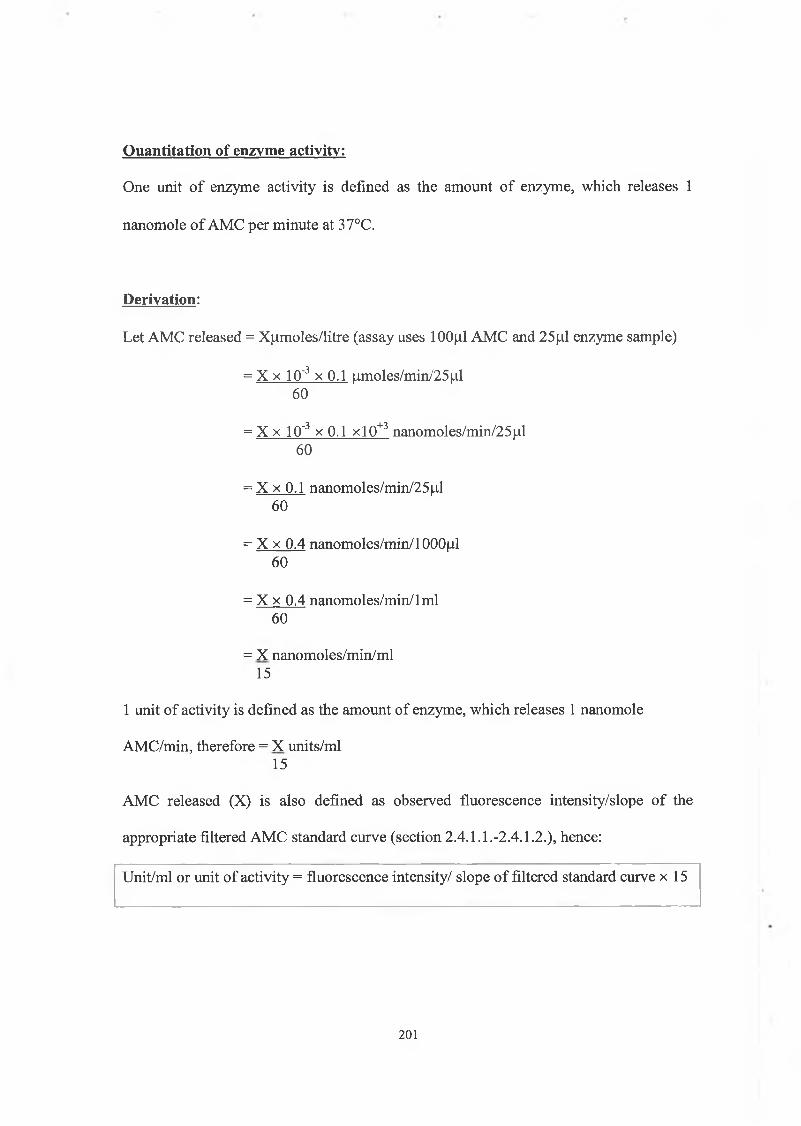
One unit of enzyme activity is defined as the amount of enzyme, which releases 1
nanomole of AMC per minute at 37°C.
Derivation:
Let AMC released = Xpmoles/litre (assay uses 100|il AMC and 25|il enzyme sample)
= X x 1 O'3 x 0.1 |imoles/min/25[xl 60
= X x 10~3 x 0.1 x!0+3 nanomoles/min/25^1 60
= X x 0.1 nanomoles/min/25|il 60
= X x 0.4 nanomoles/min/1000fj,l 60
= X x 0.4 nanomoles/min/1 ml 60
= X nanomoles/min/ml 15
1 unit of activity is defined as the amount of enzyme, which releases 1 nanomole
AMC/min, therefore = X units/ml15
AMC released (X) is also defined as observed fluorescence intensity/slope of the
appropriate filtered AMC standard curve (section 2.4.1.1.-2.4.1.2.), hence:
Unit/ml or unit of activity = fluorescence intensity/ slope of filtered standard curve x 15
Quantitation of enzyme activity:
201