Embed Size (px)
Citation preview
Contents lists available at ScienceDirect
Research Policy
journal homepage: www.elsevier.com/locate/respol
Exploration versus exploitation in technology firms: The role ofcompensation structure for R&D workforceVictor Cuia,1, Waverly W. Dingb,⁎,1, Yoshio Yanadoric,1a Asper School of Business, University of Manitoba, Canadab R.H. Smith School of Business, University of Maryland College Park, MD 20742, United Statesc School of Management, University of South Australia, Australia
A R T I C L E I N F O
JEL classification:J310O310O320
Keywords:R&D employeeMotivationCompensationPay dispersionTournament incentiveInnovationExploration and exploitation
A B S T R A C T
We investigate the relationship between a firm’s compensation structure and the extent to which its innovation ismore exploration versus exploitation oriented. Specifically, we assess two aspects of a firm’s compensationdesign—horizontal dispersion within job levels and vertical tournament incentives between job levels. A six-yearpanel of compensation records of 671,028 employees working at 81 U.S.-based high technology firms between1997 and 2002 are used to construct measures that characterize a firm's pay structure, which are linked to thesefirms’ patents filed in the U.S. We find that firms with higher-powered tournament incentives in vertical com-pensation structure report higher fraction of innovation directed towards exploration. Horizontal pay dispersion,on the other hand, shows a negative relationship with the exploration in firms where R&D employees’ agevariance is low. In firms where R&D employees’ age variance is high, the negative relationship between hor-izontal pay dispersion and exploration is muted.
1. Introduction
When do firms engage in more exploration- versus exploitation-or-iented innovation? This question has drawn the interest of a largecorpus of scholarly work and become one of the most intensively in-vestigated areas in innovation research (Gupta et al., 2006; Lavie et al.,2010). For examples, research in this area has been fruitful in estab-lishing how a firm's exploration and exploitation are related to thedistribution of resources such as absorptive capacity (e.g., Cohen andLevinthal, 1990; Hoang and Rothaermel, 2010; Rosenkopf and Nerkar,2001; Rothaermel and Alexandre, 2009), organizational slack (e.g.,Greve, 2007; Nohria and Gulati, 1996; Voss et al., 2008), alliancepartners (e.g., Beckman et al., 2004; Lavie and Rosenkopf, 2006;Phelps, 2010; Rothaermel and Deeds, 2004), and experiences of the topmanagement teams (e.g., Hambrick et al., 2005; Smith and Tushman,2005).
In most of these studies, it's a firm that reacts to the changes in theresource condition and adjusts its exploration and exploitation activ-ities. While this approach has been successful in revealing criticalstrategic factors that shape firms' exploration and exploitation, what'sbeen lost in most of the analysis is an understanding of what James
March called "implicit choices…buried in many features of organiza-tional forms and customs" (1991, p.71) and in particular the questionregarding how these organizational practices are related to a firm'sexploration or exploitation.
Over the past decade or so, answers to this question above havestarted to trickle in, particularly around the role of organizationalstructure and design (e.g., Csaszar, 2013; Fang et al., 2010; Jansenet al., 2006; Tushman et al., 2010) and innovation process management(Benner, 2002). However, there is still no empirical evidence of the linkbetween a firm's compensation design and its exploratory innovations.Sauermann (2017) suggested that individual motives matter for in-novation outcomes. Among various types of organizational practices,there is no doubt a firm’s compensation ranks among the top in terms ofits ability to shape the motives and activities of R&D employees and inturn the innovation outcome of the firm (Collins and Smith, 2006;Onishi, 2013). However, by far the limited amount of research oncompensation and innovation (e.g., Balkin et al., 2000; Lerner andWulf, 2007; Onishi, 2013; Yanadori and Cui, 2013) has largely treatedexploratory and exploitative innovations as a collective bundle, thusfailed to shed light on how compensation design may be differentiallyrelated to exploration and exploitation. As such, at this juncture, we
https://doi.org/10.1016/j.respol.2019.03.008Received 28 February 2017; Received in revised form 9 March 2019; Accepted 10 March 2019
⁎ Corresponding author.E-mail addresses: [email protected] (V. Cui), [email protected] (W.W. Ding), [email protected] (Y. Yanadori).
1 Authorship is alphabetical. Authors contribute equally.
Research Policy 48 (2019) 1534–1549
Available online 01 April 20190048-7333/ © 2019 Elsevier B.V. All rights reserved.
T
may know the relationship of a given compensation design to a firm’soverall innovation performance, but there is not yet empirical inquiryregarding which type of innovation is produced in the firm given itscompensation design. This, to us, is an important gap in the literaturethat needs to be addressed.
A second commonality across existing studies addressing compen-sation and innovation is that with the exception of Onishi (2013) andYanadori and Cui (2013), previous empirical works examining com-pensation in firms almost exclusively focus on the compensation ofsenior leadership. While senior leadership makes strategic decisionsregarding resource allocation, such singular emphasis on the top levelof the firm misses the role played by lower-to-mid-tier employees andmanagers of the research and development (R&D) department, whosemotives are intricately related to compensation design of the firm. Forexample, Onishi’s (2013) study based on a survey of Japanese firmsreports that firms that link inventor compensation to patent perfor-mance see the development of more high-impact patents by their R&Demployees though the number of patent applications is not impacted.This suggests that different compensation plan may be linked to em-ployees’ strategic choice of what type of inventions to which they willdevote more effort. We therefore seek to answer, in our paper, how afirm’s compensation design may be related to employees’ choice be-tween exploratory and exploitative innovation projects, and con-sequentially the firm’s balance between exploration and exploitation.
The objective of this paper is to fill the gaps described above byassessing the relationship between a firm’s compensation design for theR&D workforce below executive level and its exploratory versus ex-ploitative innovation performance. Given the space constraint, we focuson two specific aspects of compensation design, the horizontal paydispersion and vertical tournament incentives in the compensation ofthe R&D workforce. Pay dispersion, defined as the extent to whichcompensation is differentiated among employees, has been recognizedas one of the key decision areas in human resource management(Fredrickson et al., 2010; Kacperczyk and Balachnadran, 2018; Shaw,2014; Siegel and Hambrick, 2005). Tournament incentives have alsobeen widely theorized as shaping employee activities (Lazear, 1989).We draw from theories on social comparison and tournament to moti-vate our empirical assessment. Specifically, we propose an explanationthat builds on two defining characteristics of exploration: (i) they arehighly risky in terms of success rate and possible returns and (ii) theyoften require combination of knowledge spanning multiple domainsand as such collaboration of employees. Variations in a firm’s hor-izontal pay dispersion and vertical tournament design differently shapeemployees’ preferences with regard to risk-taking and collaboration.Consequentially, they are related distinctively to the level at which afirm’s innovation pivots toward exploration.
We empirically investigate these relationships in a novel dataset of81 blue-chip U.S. high-tech firms with 671,028 person-year compen-sation records in their R&D divisions from 1997 to 2002. We use theseanonymous HR data to construct measures that characterize firms’compensation design. We then combine the compensation-structuremeasures with firms’ patent data obtained from the United States Patentand Trademark Office (USPTO). While there are limitations in ourempirical approach, as we will note below, it is also worth highlightingthe value of this dataset. It is extremely difficult for researchers to haveaccess to HR data of a firm, let alone HR data of an entire division orentire firm. This partly explains the relative shortage of empirical evi-dence in innovation literature regarding properties of a firm’s com-pensation design. We are fortunate to have access to this dataset to takeat least a first step to address the absence of research on compensationdesign and exploratory innovations and on the overall shortage of re-search on how activities of firms’ non-executive-level R&D workforcemay be shaped by compensation design.
There are also some limitations of our research to be noted up front.First, though we have complete HR records of each company, we areunable to match them to individual patenting activity due to anonymity
of these records. This feature limits our ability to test hypotheses at theindividual employee level. Second, causality identification is hard toestablish in our empirical setting. The archival nature of our researchdesign also makes it prone for endogeneity problems such as thosearising from firms’ selective use of certain compensation designs. Moreimportantly, it is notoriously difficult to time innovation projects.Though we observe when a patent application was filed, we cannotaccurately determine whether the underlying project associated withthe patent was initiated before or after a change in the firm’s com-pensation structure. This renders any match-sample based method foraddressing selection problem ineffective for our empirical question.Indeed, this same problem was also encountered by other researchersusing similar datasets (e.g., Lerner and Wulf, 2007, using executivelevel compensation data), who cautioned against causal interpretationsof results based on similar archival data and research designs. Fol-lowing these researchers, we interpret our results as showing onlycorrelations between pay dispersion and patterns of innovation in afirm. Weakness notwithstanding, given the absence of empirical evi-dence on compensation and exploratory/exploitative innovation, par-ticularly at the non-executive level where our focus is, we see the valueof at least revealing the correlation to interested scholars to triggerfuture effort in better establishing the causality in any observed re-lationship.
The rest of the paper is organized as below: Section 2 motivates ourfocus on corporate R&D employees; in Section 3 we develop our hy-potheses regarding horizontal and vertical compensation design and afirm’s exploratory innovation; Section 4 describes our data and meth-odology; Section 5 reports our results and robustness checks; Section 6discusses and concludes.
2. Non-executive level R&D employees and firm innovation
Among the small number of existing investigations that empiricallydocument the relationship between corporate compensation design andgeneral innovation outcomes, most of the attention has been devoted tooccupants of high-level positions such as CEOs (e.g., Balkin et al.,2000), heads of central R&D organizations (Lerner and Wulf, 2007), ordivisional CEOs (Dechow and Sloan, 1991; Holthausen et al., 1995).The focus on the high-level corporate officers may be largely driven bythe consideration that these officers are responsible for allocating re-source across different research projects, hence potentially shape thedirections of research and innovation outcomes in a firm.
While we agree that senior executive officers play an important rolein a firm’s innovation, we choose to focus on the R&D employees at thenon-executive level, which are largely missing in previous research.This naturally leads to the question regarding the role played by thesenon-executive level employees in corporate innovations. In assessingthis question, we consider four recent trends of development in cor-porate R&D, which lead us to believe that activities of rank-and-file R&D employees play a non-negligible role in driving the innovation pat-terns of a firm.
First, beginning in the late 1980s, industrial research in the U.S. hasbecome more decentralized. Firms increasingly shunned centralized R&D in favor of a divisional research structure in which decisions on re-search are no longer limited to the corporate headquarter (Rosenbloomand Spencer, 1996). For example, Lerner and Wulf (2007) found thatfinancial incentives to heads of corporate R&D bear no relationshipwith innovation performance in firms that have divisional R&D de-partments. These findings suggest to us the need for more research ef-fort beyond the level of top executive team when trying to explain howincentives are related to innovation outcomes.
Second, the past three decades also saw firms becoming less hier-archical and more flexible in structure and management. For example,in an in-depth case study, Nonaka (1988) reported Honda’s use of a“middle-up-down” approach in its development of Honda “City”, a newcar model. In this approach, the new car development project was
V. Cui, et al. Research Policy 48 (2019) 1534–1549
1535
initiated from the mid-level of the firm as opposed to the executive levelin the conventional decision process of new model development. Morerecently, there has been both anecdotal documentations and academicstudies of firms’ use of lab-like, small project teams as the basic unit ofcorporate research (e.g., Bock, 2015; Liu and Stuart, 2015). Such astructure is much flatter and more flexible than in traditional organi-zational hierarchy, and decision rights are more dispersed amongmiddle to lower level employees. Research has also found that mana-ging the tension between exploration and exploitation in innovationprocess has become a shared responsibility across organizational levels,not that of top management (Andriopoulos and Lewis, 2009). Giventhese changes, it is no longer accurate to assume that rank-and-fileemployees are merely passive participants of the R&D process in a firm.
The third noticeable trend is the diffusion of the discretionary timepractice, particularly for R&D employees. In companies such as 3M andGoogle, engineers are allowed to devote a fraction of their time at workto projects of their own choosing, even if the projects are not directlyrelated to any immediate corporate goals (Battelle, 2006). This impliesthat setting research direction is no longer the sole responsibility of topexecutives and that the preferences of mid-to-lower level researchpersonnel to some extent drive the type of innovations being generatedby a firm. Together, these trends suggest an expanding role in knowl-edge creation played by R&D employees below the senior ranks, as theygain more autonomy in today’s organizations.
Furthermore, as we have summarized in the introduction section,two recent studies by Onishi (2013) and Yanadori and Cui (2013) re-port a relationship between how non-executive R&D personnel are paidand the performance of innovations in the organization. The combi-nation of such evidence from academic studies and trends reported inpractitioners’ accounts leads us to believe that at a minimum, whetheror not non-executive R&D personnel may play a role in a firm’s in-novation pattern should be treated as a question that deserves empiricalinvestigations.
3. Hypotheses
3.1. Risks, collaboration and exploratory innovation
The terms of exploration and exploitation have been invoked inprior literature to explain a host of firm activities and outcomes atvarious levels of analysis (Gupta et al., 2006; Lavie et al., 2010). In ourpaper, we use the terms to explain how firms manage and generate newknowledge. For this purpose, we are largely using the framework es-tablished in March (1991) and further by Levinthal and March (1993):within the knowledge management domain, exploration-oriented in-novation often involves experimentation, distal search, and variationfrom existing knowledge base. Exploitation-oriented innovation, on theother hand, is often associated with implementation and refinement ofexisting knowledge, local search, and variation reduction.
Existing literature highlights two defining characteristics of ex-ploratory innovations that further differentiate them from exploitativeinnovations. The first is what March termed the “vulnerability of ex-ploration” (1991, p.73). Exploratory innovation breaks into newknowledge domain in which the firm has not traveled before. It mightinvolve new methods or equipment, or new ways of combining ideas.As such, exploratory R&D process is known to be full of risks and un-certainty in terms of rate of success. The time horizon when the impactof an exploratory innovation is realized may also be quite long(Corredoira and Banerjee, 2015), making it challenging to accuratelyassess the yield cycle of an exploratory project. Furthermore, only afraction of employee’s R&D effort results in any type of measurableinnovations such as patents, not to mention exploratory innovationsthat involve higher uncertainties. In the process of achieving suchcorporate innovations, there are also many factors that are out of thecontrol of R&D employees (Ahuja et al., 2008). Sometimes, serendipityplays a role in the production of exploratory innovation, as in the
invention of drugs from penicillin to Viagra.2 As such, “vulnerability ofexploration” has two implications: (1) as exploratory innovation is in-herently uncertain with regard to its probability of success, yield time,and even what production inputs contribute to project success, it ischallenging for a firm to adequately measure employee contribution toexploratory innovation; (2) exploratory innovation requires a relativelyhigh level of risk tolerance from employees.
Second, previous literature has also noted the recombinant nature ofexploratory innovation. One key insight from existing work (March,1991; Rosenkopf and Nerker, 2001) is that heterogeneity in a firm’sknowledge stock influences the trajectory of exploratory innovation.Recall from March’s (1991) definition that exploratory innovation re-quires experimenting and differentiating from existing stock of knowl-edge and familiar ways of problem solving. Using simulation models,March (1991) showed that an increase in knowledge heterogeneityacross organizational members, whether through differences in the rateof learning or employee mobility, facilitates the development of ex-ploratory innovation in the organization. Rosenkopf and Nerker (2001)further showed that the quality of exploratory innovation is associatedwith the extent to which the innovation draws from multiple knowledgedomains, i.e., spanning knowledge boundaries. The more an ex-ploratory innovation draws from knowledge that spans heterogeneousdomains, the higher the value of the exploratory innovation. Similarpattern is found in a recent analysis of a large sample of patent in-novations (Corredoira and Banerjee, 2015). While recombination ofheterogeneous, cross-boundary knowledge is valuable for the produc-tion of exploratory innovation, most people have expertise of a rela-tively narrow domain of knowledge. This implies that work inter-dependence is high in exploratory innovation context. To generateexploratory innovations, employees who possess heterogeneousknowledge will likely need to collaborate to make the knowledge re-combination feasible. For this reason, whether or not employees caneffectively collaborate with each other can be considered a determinantfactor of a firm’s exploratory innovation performance (Siggelkow andRivkin, 2006).
To summarize, compared to exploitation, exploration-oriented in-novation projects will bear the following characteristics: (i) they areassociated with a higher level of risks and uncertainty of success, and(ii) they are more dependent on collaborations.
3.2. Horizontal pay dispersion, social comparison and exploration
We first turn to horizontal pay dispersion, which is defined as thedifference of compensation among employees at the same job level(Siegel and Hambrick, 2005; Gupta et al., 2012). When firms adopt acompensation design that emphasizes horizontal pay dispersion, it isbelieved that they are trying to mimic a more market-like incentivestructure that is effective at motivating social comparison across em-ployees (Nickerson and Zenger, 2008). To the extent that such socialcomparison intensifies a sense of competition among employees to winthe rewards, a high-dispersion structure may have a positive relation-ship with employee motivation (Gerhart and Rynes, 2003; Trevor et al.,2012). Prior theorization, however, is unclear about where the en-hanced employee effort will be directed. Assuming dispersion motivatesmore effort, will R&D employees be motivated to direct more effort toexploratory innovation projects or otherwise (to more exploitative in-novations)?
We argue that the (positive) motivational effect of horizontal pay
2 The chemical compounds for Viagra were originally investigated by Pfizerscientists to treat cardiovascular diseases. In the clinical trials, Pfizer scientistsfound that the compounds have no significant effect on the target cardiovas-cular disease. By accident, however, scientists found that the compounds canimprove erectile dysfunction, thus leading to the final success of Viagra (Ban,2006).
V. Cui, et al. Research Policy 48 (2019) 1534–1549
1536
dispersion is less likely to happen in the context of exploratory in-novations than in the context of exploitation-oriented innovations. Thisis because there is an important premise underlying the positive per-formance effect of pay dispersion–the dispersion-creation practiceneeds to be perceived as legitimate by the employees. In the eyes ofemployees, the pay differential needs to be well explained by perfor-mance and performance needs to be convincingly measured (e.g., in acontext such as professional hockey used in Trevor et al. [2012]). Thisis easier to achieve in the management of exploitation-type innovationsbut will be a challenge in the management of exploration-type in-novations. As discussed in the proceeding section, exploratory innova-tion research is characterized by a high degree of uncertainty in theprobability of success and the timing of success. Such features implytremendous challenge in measuring employee productivity in a con-vincing way. Challenges also abound in establishing a legitimate linkbetween productivity input measure and employee performance andfurther in justifying pay variation in exploratory innovation. As such,the proportion of pay variation that can be legitimately explained byobjective and convincing productivity measure will be relatively smallin the context of exploratory innovation. In contrast, in managing ex-ploitation-type innovation projects, firms are more likely to developconvincing evaluation metrics and reward schema given the morepredictable features of such innovations. As such, if horizontal paydispersion can motivate employee effort, it is more likely to be effectivein motivating exploitation than exploration-type of projects.
On the other hand, Nickerson and Zenger (2008) suggest that envymay be the cost of social comparison in a more market-like compensationdesign. The higher level of pay dispersion may encourage employees toview compensation at work as a zero-sum game and react negatively withdysfunctional behaviors such as withdrawal of cooperation (Pfeffer andLangton, 1993). For example, Shaw et al. (2002) report that horizontal paydispersion is positively associated with employee performance when thework is more independent. In contrast, when the relevant work is inter-dependent, which implies more dependency on collaboration across em-ployees, high level of pay dispersion may be an ineffective vehicle forimproving employee performance. Such findings have important im-plications for our interest in the link between compensation design and thetype of (exploratory or exploitative) innovations. As discussed in theproceeding section on features of exploratory innovation, collaboration isimportant due to the knowledge re-combinatory nature of exploratoryinnovation (Siggelkow and Rivkin, 2006). Existing empirical research sofar has been relatively consistent in the negative effect of large horizontalpay dispersion on employee collaboration in highly interdependent workcontext (e.g., Bloom, 1999; Fredrickson et al., 2010; Pfeffer and Langton,1993; Shaw et al., 2002; Siegel and Hambrick, 2005). Taken together,these studies suggest that the social comparison cost may lead to less co-operation across employees, which may negatively impact exploratoryinnovation projects. We expect that:
Hypothesis 1. The extent of a firm’s exploratory innovation isnegatively related to the level of its horizontal pay dispersion in theR&D department.
3.3. Vertical tournament structure and exploratory innovation
A firm’s pay dispersion can also be characterized along the verticaldimension, which captures the pattern of pay variation across job levelsof a firm. The mechanisms that drive the effect of vertical pay structureon performance are likely somewhat different from those underlyinghorizontal pay dispersion. Most notably, while social comparison mat-ters greatly in horizontal pay dispersion, this mechanism is expected toplay a lesser role in the consideration of vertical pay structure (Bloom,1999; Gupta et al., 2012). This is because in vertical pay structure, theconcerned employees are at different levels of a firm and their jobs arelikely to be different from each other, which renders cross-level com-parison less obvious.
In a typical firm, lower level employees compete for the opportunityof promotion into a higher-level job and correspondingly a higher levelof compensation post-promotion. By far, there has been a steady streamof empirical works supporting the characterization of a corporate payhierarchy as following a tournament structure (Cappelli and Cascio,1991; Conyon et al., 2001; Devaro, 2006; Eriksson, 1999; Kale et al.,2009; Lambert et al., 1993; Main et al., 1993). For this reason, researchon the vertical pay structure of a firm often invokes the tournamenttheory (Lazear and Rosen, 1981) in the explanation of the relationshipbetween vertical pay structure and organizational performance (Guptaet al., 2012).
The main insight from the classic tournament theory (Lazear andRosen, 1981) is that organizations use high-powered incentives tomotivate the effort of aspiring employees (tournament participants).Existing research points to two consequences of tournament incentivesthat we believe are relevant to the process of exploratory innovation.First, as we discussed earlier, exploratory innovation is characterized bya high degree of risk and uncertainty in outcomes. Consequentially,employees who engage in exploratory projects are effectively taking onmore risks in terms of reward to their effort. From the tournament re-search, there is empirical evidence that suggests individuals who aremotivated by high-powered tournament incentives are likely to take onmore risks. For example, Becker and Huselid (1992) study NASCARraces and find that as prize spread increases, contestants are taking onmore risks in their bid for the final win. In the context of management,Kini and Williams (2012) find a positive relationship between verticalpay difference within a firm and the strategic risks taken on by a firm(or implicitly, taken on by the firm’s CEO or executive officers). Wedraw from these studies and postulate that in firms with higher-pow-ered tournament incentives in its vertical pay structure, employees as-piring after the top jobs may be more willing to take on the riskierexploratory projects.
The way that tournament incentives may work in shaping individualchoice of the type of innovation is also consistent with the theoryproposed in research by Manso (2011) and Azoulay et al. (2011). Animportant part of the theory advanced in the two papers is that an in-centive design that (i) tolerates early-stage failure and (ii) allows ade-quate time horizon for innovation projects to bear fruits may effectivelypromote more radical, exploratory innovations. In a more high-pow-ered tournament scheme, rewards for moving up an organizationalladder often follow a more convex structure: i.e., the rate of pay in-crease is larger at the higher levels in the vertical compensationstructure than at the lower levels. This implies that for a lower and mid-tiered employee, the penalty for losing a promotion competition in thenear term is smaller. For these employees, because the big payoff is nearthe top of the organizational pay structure, which happens furtherdown the road rather than immediately, there are incentives for them totake more risks with innovation projects in order to achieve a biggerbang in the long run.3
There are, however, reasons for suspecting that a high-poweredtournament incentive structure may direct employee effort away fromexploratory innovation. Recall from the previous section, exploratoryinnovation benefits from collaboration of employees. For this reason,the way a tournament pay structure affects collaboration will havenegative implications for the exploratory innovation effort as well assuccess rate of exploratory innovation projects. In tournaments, win-ning is contingent on relative rather than absolute performance. Thismeans that a tournament contestant can win by either better perfor-mance on his/her own, or worse performance of his/her competitors(Lazear, 1989). As such, it is possible that the stronger the tournamentincentives, the more likely the contestants may resort to sabotaging
3We appreciate the help from one of the reviewers who brought to our at-tention this long- vs. short-term perspective in compensation design proposed inManso’s (2011) research.
V. Cui, et al. Research Policy 48 (2019) 1534–1549
1537
colleagues as a strategy to win. In particular, a large tournament prize isexpected to be negatively associated with the degree of collaborationamong contestants for the prize (Dye, 1984). For example, Siegel andHambrick (2005) find that the negative effect of tournament incentiveson firm performance is stronger in industries that require more colla-boration among executive team members. Cowherd and Levine (1992)find that a smaller pay gap between lower-echelon employees andupper-echelon managers contributes to higher product quality by in-creasing lower-echelon employees’ commitment and cooperation.
Taken together, there exist two opposing mechanisms that underliethe relationship between the extent of tournament incentives in verticalpay structure and the extent that a firm’s innovation is directed towardsexploration. On the one hand, a high degree of tournament incentives invertical pay structure may increase employee risk tolerance, whichcreates stronger incentives for employee effort into exploratory ratherthan exploitative innovation. On the other hand, anti-collaborativetendency increases among employees along with the degree of tour-nament incentives. Short of collaboration across employees, ex-ploratory innovations often face a higher likelihood of failure thanexploitation-oriented innovations. These considerations lead us to thefollowing competing hypotheses:
Hypothesis 2a. The extent of a firm's exploratory innovation ispositively related to the degree of tournament incentives in itsvertical pay structure of the R&D department.
Hypothesis 2b. The extent of a firm’s exploratory innovation isnegatively related to the degree of tournament incentives in itsvertical pay structure of the R&D department.
4. Method
4.1. Data and Sample
To assess the relationship between compensation structure and thebalance of exploratory innovation in firms, we use an annual com-pensation survey administered by a Boston-based major HR consultingfirm to the U.S. high-technology (mainly information technology) firms.Participating firms supply the consulting firm with information on eachof their employees’ compensation packages, and in return are providedwith market pay information for benchmarking. We were granted ac-cess to the data that span a six-year period from 1997 to 2002. Werestricted our sample to the R&D divisions of 81 publicly traded firms inthe dataset, which includes over 671,028 person-year compensationrecords during this period of time. The final dataset we analyze is anunbalanced panel structure of 381 firm-year observations. Industrialbreakdown and financial characteristics of the sampled firms aresummarized in Tables 1 and 2.
This dataset attracts us for several reasons. First, the majority ofexisting compensation studies use publically available compensationinformation on senior executives or players in sports. Corporate com-pensation data are very difficult to come by. That partly explains ageneral shortage of empirical tests of compensation theories withlongitudinal firm data. In particular, corporate technological
innovation as a highly interdependent context for testing some of theexisting compensation theories has rarely been used in previous works(Onishi (2013) and Yanadori and Cui (2013) are exceptions) and em-pirically-based assessment of compensation design’s link to the type ofinnovation being generated in firms is largely missing in the innovationliterature. This dataset provides us an opportunity to fill this gap.
Second, among existing studies on pay dispersion, only a few haveexplicitly examined vertical pay structure (Gupta et al., 2012;Kacperczyk and Balachandran, 2018). We suspect that one reason for alack of empirical examination of vertical structure is that to adequatelymeasure vertical structure, researchers need to have a scheme thatcategorizes employee pay by administrative levels in a relatively con-sistent way across sampled firms to ensure comparability of the verticalstructure measure across firms. This is extremely difficult at the below-executive level as firms vary greatly in their way of organizing ad-ministrative categories and titles. The advantage of this dataset is thatthe HR consulting firm has created a common categorization schemethat has been used relatively consistently across firms and years. Inadministering the employee compensation survey to the participatingfirms, the consulting firm provided detailed instructions (e.g., specificresponsibilities, required experience, etc.) for the participating firms’HR managers to categorize jobs in the R&D department into eight le-vels: three top levels for managers and five lower levels for non-man-agers. Though unfortunately we were not provided with the details ofthese categories, we have reasons for trusting the reliability of the data.The goal of these surveys is to pool compensation information fromfirms to construct useful benchmarks for their HR managers. The con-sulting firm that conducted these surveys specializes in HR and com-pensation issues and it has historically been working closely with theparticipating firms. In addition, there is strong incentive for the HRmanagers of the participating firms to ensure that the reporting andcategorization of their employee compensation information are accu-rate and consistent with the requirement of the consulting firm, asfailure to do so will distort the compensation benchmarks that they areseeking from the consulting firm. This feature of the data turns out to betruly instrumental for us to obtain reliable measures to characterizefirms' horizontal and vertical pay structure.
Admittedly, ours is not a randomly selected sample and for thisreason we should caution over-interpretation of our findings.Nevertheless, systematic, large-scale employee-level compensation in-formation is difficult to come by, particularly at the non-executive le-vels that we analyze. For this reason, previous researchers who studiedcompensation below the senior executive ranks often resort to similar,consulting-based proprietary datasets as in our case (e.g., Bloom andMichel, 2002; Lambert et al., 1993; Lerner and Wulf, 2007; Main et al.,1993; Siegel and Hambrick, 2005; Yanadori and Cui, 2013; Yanadoriand Marler, 2006).
4.2. Variables
Variable definition and descriptive statistics are provided in Tables3 and 4, and correlation matrix is provided in Table 5. We also testedfor multicollinearity with VIF scores for all of the models and none of
Table 1Characteristics of sampled firms.
Mean Std. dev. Min. Max.
Number of employees (in 1000) 59.58 67.72 0.175 337.9Research and development expenses (in $mm) 977.8 1,198 7.526 5,152Sales/turnover (net) (in $mm) 13,631 16,309 46.63 88,396Net income (loss) (in $mm) 384.0 3,737 −56,121 10,535Total assets (in $mm) 18,079 24,891 41.60 289,760Total current assets (in $mm) 7,307 8,978 29.99 55,790Total current liabilities (in $mm) 5,092 6,889 10.93 39,578
V. Cui, et al. Research Policy 48 (2019) 1534–1549
1538
the maximum VIFs exceeds the conventional cutoff value of 10 (Ryan,1997).
Dependent Variables. Following previous research (e.g., Balkinet al., 2000; Lerner and Wulf, 2007), we rely on patents as indicators ofinnovation. Firms in our data on average were granted 309 patents in ayear by USPTO. Such a high level of patent count per firm reassures usthat patenting is a primary vehicle for protecting innovations and isindicative of the innovation patterns in these firms.
We use four different measures of the extent that a firm’s innovationis directed towards exploration. First, we follow Phelps (2010) andcompute the proportion of exploratory citations reflected in the patentsfiled by a firm in a given year. Specifically, we took all successful patentapplications filed by a firm in the given year and examined all thebackward citations made in those patents to relevant prior art. Amongthese backward citations, we define new citations as those that areneither self-cites (i.e., citations made to the firm’s own patents filedprior to the given year) nor repeat cites (i.e., citations made to patentsthat the firm has previously cited in the past five years).4 We thencompute the ratio of new backward citations to the total number ofbackward citations in the firm’s patents of the year.
Our second measure, proportion of exploratory patents follows a si-milar construction as our first, citation-based measure. In this one, wetake all patents filed by the firm in a given year, and classify thosepatents as exploratory if they have neither self-cite nor repeat-citeprevious patents in the defined window. This measure is then computedas the proportion of exploratory patents among all patents filed by thefirm in the year. This measure is also widely used in previous works onexploratory innovations (e.g., Benner and Tushman, 2003; Sorensenand Stuart, 2000).
Our third exploration indicator is the average originality(Trajtenberg et al., 1997) of a firm’s patents filed in a given year. Patentoriginality measures the extent a firm’s patents cite prior patents in awide range of patent technology classes. The more concentrated a firm’spatent citations are in a small number of patent classes, the less originalits patents. More original patents are in general more likely to breaknew paths for future innovations. As such these patents are exploratoryin nature (Rosenkopf and Nerker, 2001)
Fourth, we have adapted Jaffe’s (1986) patent-class-based tech-nology proximity measure to gauge the extent of technology explorationof our sampled firms. For a given firm, we collect the distribution of itspatents filed in a given year. We compute technology proximity as thecosine similarity in the patent-class distribution of the firm’s patentsfiled in that year and the patent-class distribution of all patents filed bythe firm in the previous five years. Essentially, this measure capturesthe extent that a firm’s innovation shifts away from its previously oc-cupied patent classes. The larger the technology proximity value, the
Table 2Industrial breakdown of sampled firms.
SIC category name (code) breakdown of sampled firms Frequency Percent
Industrial and commercial machinery and computer equipment (35) 17 21.0Electronic and other electrical equipment and components, except computer equipment (36) 31 38.3Transportation equipment (37) 4 4.9Measuring, analyzing, and controlling instruments; photographic, medical and optical goods; watches and clocks (38) 14 17.3Communication (48) 2 2.5Business services (73) 13 16.0
Table 3Variable definitions.
Proportion of exploratory citations Proportion of new backward citations to total number of backward citations in the patent applications filed by the firm in a given year. Newcitations are defined as those that are neither self cites (i.e., citations to the firms’ own patents filed prior to the given year), nor repeat cites(i.e., citations to patents that the firm has previously cited in the past five years). [Reference: Phelps (2010)]
Proportion of exploratory patents Proportion of exploratory patents to total number of patent applications filed by the firm in a given year. Exploratory patents are defined asthose that neither self-cite nor repeat-cite. [Reference: Sorensen and Stuart (2000); Benner and Tushman (2003)]
Originality For each patent filed by a firm in a given year, originality of patenti = 1- sjni
ij2 where sij is percentage of backward citations made by patent
i to patent class j, out of nj patent classes (the reverse of Herfindahl concentration index). The originality measure for a firm in a given year isthe mean originality of all patents filed by the firm in the year. [Reference: Trajtenberg et al. (1997)]
Technology proximity Compares the distribution of all patents filed by a firm in a given year across patent classes to the distribution of its patents filed in theprevious five years across patent classes; the measure is computed as cosine similarity in the distributions of patents across technologyclasses (USPTO patent classes) between current and past five years; a larger technology proximity value indicates a firm’s innovations aremore similar to those generated from the previous period, thus less exploratory. [Reference: Jaffe (1986)]
Horizontal pay dispersion The average of the coefficients of variation for each of the job levels in the firm’s R&D divisions. The coefficient of variation for a job level inthe firm’s R&D divisions is the standard deviation of all employees’ pay packages at that level divided by the mean of all employees’ paypackages at the level.
Vertical pay differential The percentage difference of top-level (level 8) compensation and bottom-level (level 1) compensation.Vertical tournament incentives The ratio of upper-job-level percentage differential to the ratio of lower-job-level percentage differential. The upper-job-level percentage
differential is the percentage difference between the average of highest ranked managers (job level 8) and the average of highest rankednon-managerial employees (job level 5). The lower-job-level percentage differential is the percentage difference between the average of thehighest ranked non-managerial employees (job level 5) and the average of the entry-level non-managerial employees (job level 1), all withinthe R&D divisions of the firm.
Average employee age The average age of all employees in the firm’s R&D divisionsStd. dev. of employee age The standard deviation of age of all employees in the firm’s R&D divisionsFirm size Log number of employees in the entire firmR&D intensity The ratio of R&D expenditure to firm salesFinancial slack The current ratio of the firm (current assets divided by current activities)Past five-yr. exploratory patent ratio Ratio of exploratory patent applications filed by the firm in the past five yearsPay level Average pay of all R&D employees in the firm, divided by CPI of that yearIndustry 2-digit SIC industry categoriesYear Calendar year
4 We have also experimented with other windows (e.g., seven years) and ourempirical results are not sensitive to our choice of repeat-cite window. Thisholds for both proportion of exploratory citations and proportion of exploratorypatents.
V. Cui, et al. Research Policy 48 (2019) 1534–1549
1539
more similar the firm’s innovations to that of a previous period, and theless exploration reflected in the firm’s new patent filings. As such, thecoefficient estimates on technology proximity are expected to run in theopposite direction as the estimates for the other three exploration in-dicators.
To summarize, we use four different variables to measure explora-tion. While all these measures are constructed to capture the extent ofpath-breaking and boundary-spanning in patent innovations, they alsofocus on different aspects of exploration. The first three measures arebetter at capturing exploration based on the amount of novel knowl-edge elements upon which an innovation is built while the fourthmeasure, technology proximity, focuses more on shifts in the technologyportfolio of a firm across technological (patent-class) boundaries.
Independent Variables. For horizontal pay dispersion, we follow priorstudies (e.g., Fredrickson et al., 2010) and use the coefficient of var-iation, which is the standard deviation of the total pay packages ofemployees divided by the mean of employee total pay packages. Wecalculate the coefficient of variation for each of the job levels in a firm’sR&D division and then average them across all job levels to get hor-izontal pay dispersion for the firm.
We compute two indicators of a firm’s vertical pay structure. First,we follow Siegel and Hambrick’s (2005) measure to gauge the extent towhich a vertical tournament incentive scheme exists in the R&D division.We first compute the percentage differential in pay between the averageof the highest-ranked R&D managers (job level 8) and the average ofthe highest-ranked non-managerial R&D employees (job level 5). Then,we divided that term by the percentage differential between theaverage of the highest-ranked non-managerial R&D employees and theaverage of the entry-level non-managerial R&D employees (job level 1).For example, if the average level-8 manager receives $200,000, theaverage level-5 non-manager receives $100,000, and the average level-1 non-manager receives $60,000, the vertical tournament incentivescore is measured as:
=(200,000 100,000)/100,000(100,000 60,000)/60,000
1. 5(1.5)
Essentially, this measure captures the extent at which the rate ofsenior-rank compensation increase (levels 5–8, reflected in the
numerator of the equation) outpaces the rate of junior-rank compen-sation increase (levels 1–5, reflected in the denominator of the equa-tion). The larger the ratio, the more increase one gets as he/she movesup the ladder of the firm’s pay hierarchy, reflecting a higher degree oftournament incentives within the firm.5
The second indicator is vertical pay differential, which measures thepercentage difference between the highest level (level 8) of compen-sation to the lowest level of compensation (level 1). For example, if theaverage level-8 manager receives $200,000 and the average level-1non-manager receives $60,000, the vertical pay differential score is2.33 (=[200,000–60,000]/60,000).
These two indicators measure different aspects of the vertical paystructure in a firm. Vertical pay differential captures the gap between thehighest and the lowest level of compensation of a firm. It does not,however, capture the shape of compensation change as an employeemoves up a firm’s hierarchical ladder. Hypothetically, the shape ofcompensation change along organizational hierarchy can follow alinear function, in which the proportional increase in pay is uniform asan employee ascends the firm’s hierarchy. Alternatively, it can follow aconcave function if the initial rate of increase at the lower levels of ahierarchy is larger than the pace of increase at the higher levels. Theopposite case would be a convex shape if the rate of increase at therelatively lower levels is smaller than the rate of increase at the higherlevels. Such a difference in the rate of compensation increase in verticalascendancy of organizational hierarchy is a better indicator of thetournament nature in a firm’s vertical pay structure–whether or not thefirm is creating higher-powered incentives as promotions get closer tothe pinnacle of the organizational hierarchy. This aspect of vertical paystructure is captured by vertical tournament incentive.
Control Variables. Prior research has guided our choice of controlvariables. First, following Ahuja (2000) and Katila and Chen (2008), wecontrol for firm size with the log of the number of employees in theentire firm. Second, we include as a control R&D intensity of the firm,which is measured by the ratio of R&D expenditure to sales (Hall andZiedonis, 2001). Third, we control for firms’ financial slack because itmay affect the investment patterns in R&D (Nohria and Gulati, 1996).Financial slack is measured using a firm’s current ratio (i.e., currentassets divided by current liabilities) following Wang et al. (2009).Fourth, we control for firm innovation path with its past five-year ex-ploratory patent ratio, i.e., the percentage of exploratory patents amongall patents that were successfully granted to the firm in the past fiveyears. The five-year window is chosen because knowledge depreciatesquickly in high-technology firms (Argote, 1999). Fifth, we control for R&D employees’ average pay level, which is likely to be associated withtheir innovation productivity (Yanadori and Cui, 2013). We measurepay level by calculating the average pay of all R&D employees in thefirm, normalized by consumer price index of the year (Fredricksonet al., 2010). In an unreported robustness test, we have also used thealternative measure of average pay of the middle-level (level 4) of thefirm and obtained similar results. Sixth, we also generate two employeeage-related variables—the average employee age and the standard de-viation of employee age in the firm’s R&D division for assessing the in-fluence of employee age demographics. Finally, to account for un-observed factors associated with the conditions of a specific year orindustry, we include in all models year dummies as well as two-digit SICindustry dummies.
4.3. Estimator
Our dependent variable is a fraction and the descriptive statisticsdoes not indicate severe skewness, hence we use fractional logit model
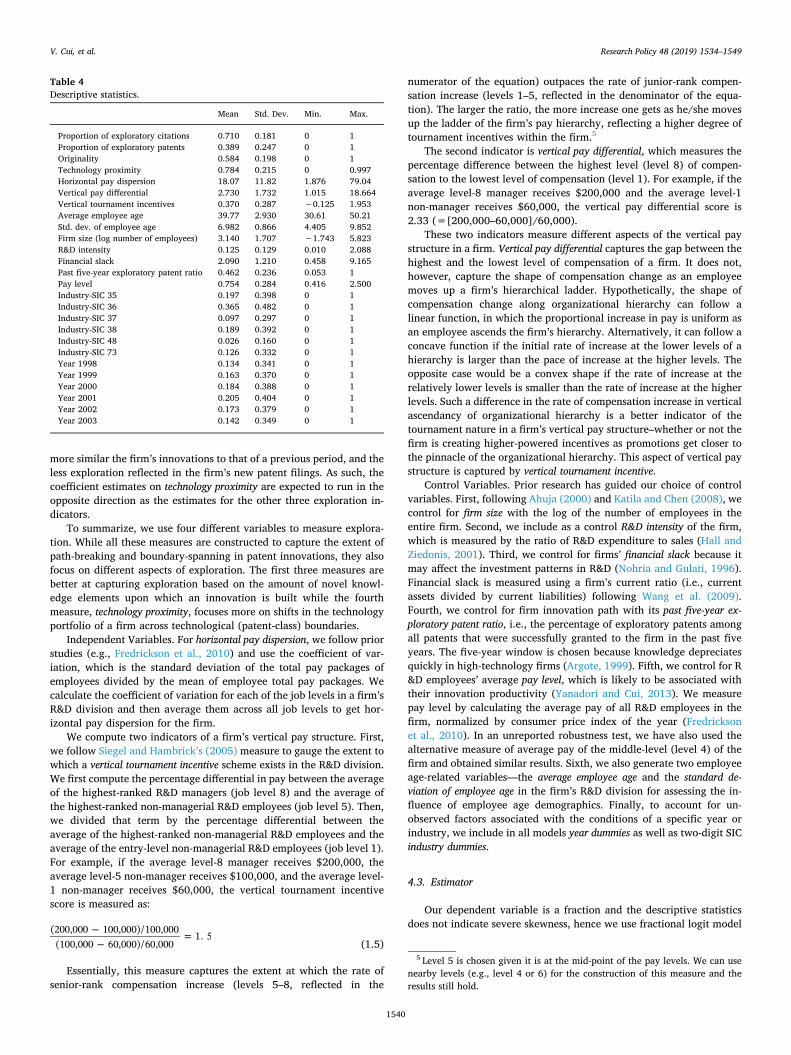
Table 4Descriptive statistics.
Mean Std. Dev. Min. Max.
Proportion of exploratory citations 0.710 0.181 0 1Proportion of exploratory patents 0.389 0.247 0 1Originality 0.584 0.198 0 1Technology proximity 0.784 0.215 0 0.997Horizontal pay dispersion 18.07 11.82 1.876 79.04Vertical pay differential 2.730 1.732 1.015 18.664Vertical tournament incentives 0.370 0.287 −0.125 1.953Average employee age 39.77 2.930 30.61 50.21Std. dev. of employee age 6.982 0.866 4.405 9.852Firm size (log number of employees) 3.140 1.707 −1.743 5.823R&D intensity 0.125 0.129 0.010 2.088Financial slack 2.090 1.210 0.458 9.165Past five-year exploratory patent ratio 0.462 0.236 0.053 1Pay level 0.754 0.284 0.416 2.500Industry-SIC 35 0.197 0.398 0 1Industry-SIC 36 0.365 0.482 0 1Industry-SIC 37 0.097 0.297 0 1Industry-SIC 38 0.189 0.392 0 1Industry-SIC 48 0.026 0.160 0 1Industry-SIC 73 0.126 0.332 0 1Year 1998 0.134 0.341 0 1Year 1999 0.163 0.370 0 1Year 2000 0.184 0.388 0 1Year 2001 0.205 0.404 0 1Year 2002 0.173 0.379 0 1Year 2003 0.142 0.349 0 1
5 Level 5 is chosen given it is at the mid-point of the pay levels. We can usenearby levels (e.g., level 4 or 6) for the construction of this measure and theresults still hold.
V. Cui, et al. Research Policy 48 (2019) 1534–1549
1540
as our estimator (Papke and Wooldridge, 1996). Compared to a log-odds-ratio model, this quasi-likelihood-based estimator has the ad-vantage of avoiding the need for ad hoc transformation of the boundaryvalues in the dependent variable. Our dataset consists of only six yearsof unbalanced panels. Since the panels are short and any change in afirm’s compensation structure is likely slow-moving, the fixed-effectmodel can be unstable and produce estimates that are sensitive to thestandard errors (Clark and Linzer, 2015). For this reason, we do notinclude firm fixed-effects in our estimations though we are using aseries of industry and year dummies to control for industry and ca-lendar year based heterogeneities. We allow a one-year lag betweendependent variables and the covariates.
5. Results
We report, in Tables 6a–6d, four sets of analyses that relate paystructure to the different measures of firms’ exploratory innovation.
Table 6a reports fractional logit regression of explanatory variableson firms’ proportion of exploratory citations. In model 1, we estimate thebaseline model with all control variables included. This model as wellas other models in the Table 6 series also control for industry and ca-lendar year fixed-effects. Among all control variables, a firm’s past 5-year exploratory patent ratio, which measures the firm’s exploratoryinnovation track record as reflected in patents, stands out as highlycorrelated with the firm’s current year exploratory citation proportion.
This is consistent with prior literature that suggests patterns of firms’innovations are highly path-dependent. Taken together the baselineestimates of the set of control variables on all four dependent variables(in model 1 of Tables 6a–6d), it appears that this measure of a firm’spast track record of exploration is the only one that is consistently re-lated to all four indicators of exploration. The other variables, firm size,financial slack, R&D intensity and firm employee demographic profiles,are related to some indicators of exploration but not others.
Model 2 adds horizontal pay dispersion. We do not observe a sta-tistically significant relationship between horizontal pay dispersion andthe firm’s proportion of exploratory citations. However, in the next sec-tion of “Scope Condition for Horizontal Pay Dispersion”, we furtherinvestigate this question and reveal that under certain scope conditions,this hypothesized relationship may still exist. More details are in thenext section.
In model 3, we introduce vertical pay differential. This measurecaptures the gap between the top and the bottom of a firm’s pay hier-archy. A larger vertical pay differential indicates the firm’s compensationspread is large between top and bottom levels. The estimate is positive,though with weak statistical significance at p < 0.1. A standard de-viation increase in vertical pay differential of a firm is associated with10.8 percent (=exp[1.732*0.059]) increase in the proportion in ex-ploratory citations in the firm’s patents.
In model 4, we introduce vertical tournament incentives, which cap-tures the shape of pay increase as an employee moves up a firm’s
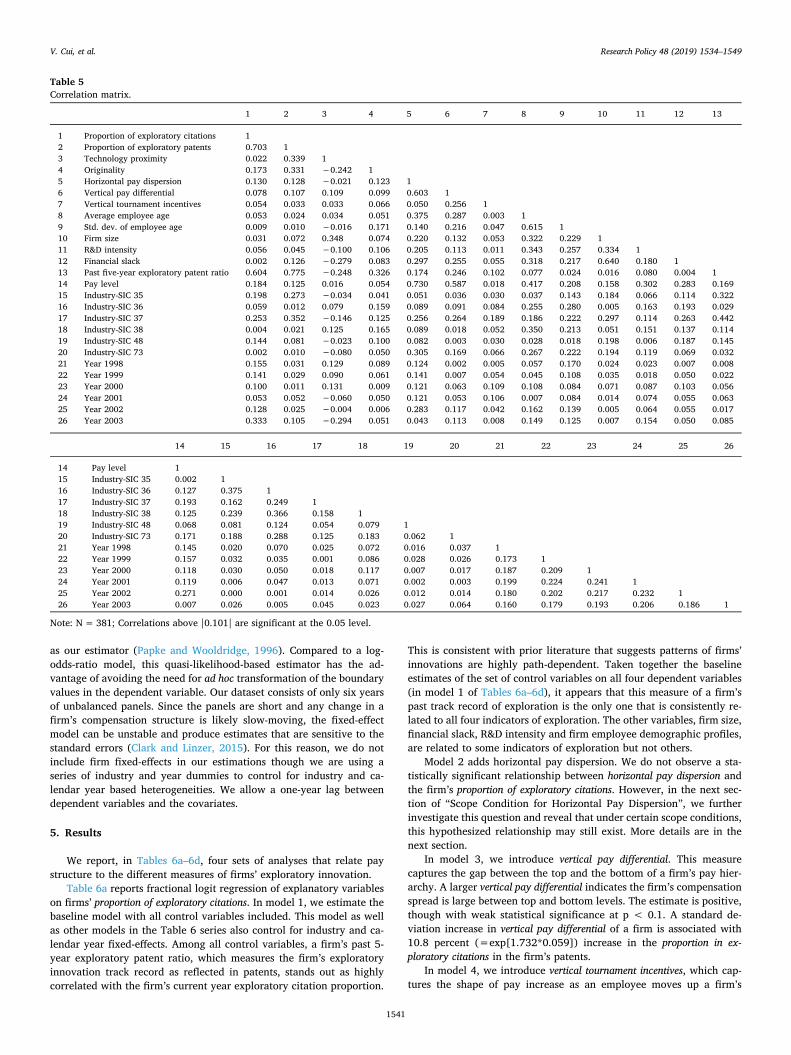
Table 5Correlation matrix.
1 2 3 4 5 6 7 8 9 10 11 12 13
1 Proportion of exploratory citations 12 Proportion of exploratory patents 0.703 13 Technology proximity 0.022 0.339 14 Originality 0.173 0.331 −0.242 15 Horizontal pay dispersion 0.130 0.128 −0.021 0.123 16 Vertical pay differential 0.078 0.107 0.109 0.099 0.603 17 Vertical tournament incentives 0.054 0.033 0.033 0.066 0.050 0.256 18 Average employee age 0.053 0.024 0.034 0.051 0.375 0.287 0.003 19 Std. dev. of employee age 0.009 0.010 −0.016 0.171 0.140 0.216 0.047 0.615 110 Firm size 0.031 0.072 0.348 0.074 0.220 0.132 0.053 0.322 0.229 111 R&D intensity 0.056 0.045 −0.100 0.106 0.205 0.113 0.011 0.343 0.257 0.334 112 Financial slack 0.002 0.126 −0.279 0.083 0.297 0.255 0.055 0.318 0.217 0.640 0.180 113 Past five-year exploratory patent ratio 0.604 0.775 −0.248 0.326 0.174 0.246 0.102 0.077 0.024 0.016 0.080 0.004 114 Pay level 0.184 0.125 0.016 0.054 0.730 0.587 0.018 0.417 0.208 0.158 0.302 0.283 0.16915 Industry-SIC 35 0.198 0.273 −0.034 0.041 0.051 0.036 0.030 0.037 0.143 0.184 0.066 0.114 0.32216 Industry-SIC 36 0.059 0.012 0.079 0.159 0.089 0.091 0.084 0.255 0.280 0.005 0.163 0.193 0.02917 Industry-SIC 37 0.253 0.352 −0.146 0.125 0.256 0.264 0.189 0.186 0.222 0.297 0.114 0.263 0.44218 Industry-SIC 38 0.004 0.021 0.125 0.165 0.089 0.018 0.052 0.350 0.213 0.051 0.151 0.137 0.11419 Industry-SIC 48 0.144 0.081 −0.023 0.100 0.082 0.003 0.030 0.028 0.018 0.198 0.006 0.187 0.14520 Industry-SIC 73 0.002 0.010 −0.080 0.050 0.305 0.169 0.066 0.267 0.222 0.194 0.119 0.069 0.03221 Year 1998 0.155 0.031 0.129 0.089 0.124 0.002 0.005 0.057 0.170 0.024 0.023 0.007 0.00822 Year 1999 0.141 0.029 0.090 0.061 0.141 0.007 0.054 0.045 0.108 0.035 0.018 0.050 0.02223 Year 2000 0.100 0.011 0.131 0.009 0.121 0.063 0.109 0.108 0.084 0.071 0.087 0.103 0.05624 Year 2001 0.053 0.052 −0.060 0.050 0.121 0.053 0.106 0.007 0.084 0.014 0.074 0.055 0.06325 Year 2002 0.128 0.025 −0.004 0.006 0.283 0.117 0.042 0.162 0.139 0.005 0.064 0.055 0.01726 Year 2003 0.333 0.105 −0.294 0.051 0.043 0.113 0.008 0.149 0.125 0.007 0.154 0.050 0.085
14 15 16 17 18 19 20 21 22 23 24 25 26
14 Pay level 115 Industry-SIC 35 0.002 116 Industry-SIC 36 0.127 0.375 117 Industry-SIC 37 0.193 0.162 0.249 118 Industry-SIC 38 0.125 0.239 0.366 0.158 119 Industry-SIC 48 0.068 0.081 0.124 0.054 0.079 120 Industry-SIC 73 0.171 0.188 0.288 0.125 0.183 0.062 121 Year 1998 0.145 0.020 0.070 0.025 0.072 0.016 0.037 122 Year 1999 0.157 0.032 0.035 0.001 0.086 0.028 0.026 0.173 123 Year 2000 0.118 0.030 0.050 0.018 0.117 0.007 0.017 0.187 0.209 124 Year 2001 0.119 0.006 0.047 0.013 0.071 0.002 0.003 0.199 0.224 0.241 125 Year 2002 0.271 0.000 0.001 0.014 0.026 0.012 0.014 0.180 0.202 0.217 0.232 126 Year 2003 0.007 0.026 0.005 0.045 0.023 0.027 0.064 0.160 0.179 0.193 0.206 0.186 1
Note: N= 381; Correlations above |0.101| are significant at the 0.05 level.
V. Cui, et al. Research Policy 48 (2019) 1534–1549
1541
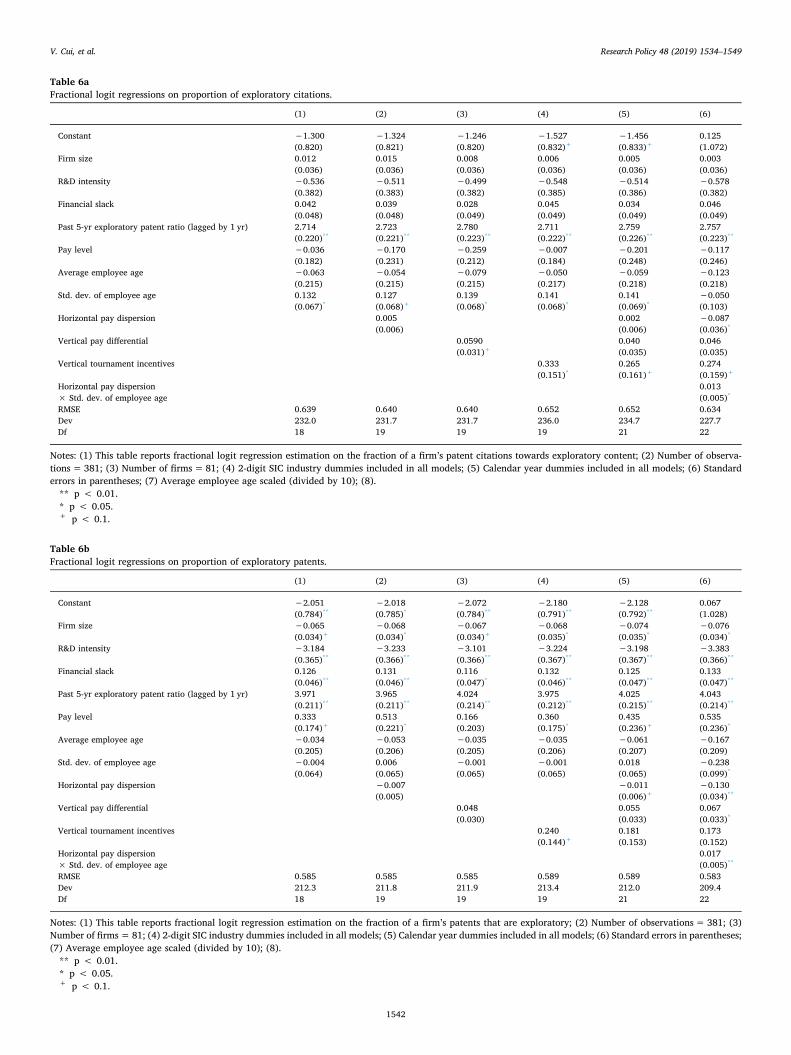
Table 6aFractional logit regressions on proportion of exploratory citations.
(1) (2) (3) (4) (5) (6)
Constant −1.300 −1.324 −1.246 −1.527 −1.456 0.125(0.820) (0.821) (0.820) (0.832)+ (0.833)+ (1.072)
Firm size 0.012 0.015 0.008 0.006 0.005 0.003(0.036) (0.036) (0.036) (0.036) (0.036) (0.036)
R&D intensity −0.536 −0.511 −0.499 −0.548 −0.514 −0.578(0.382) (0.383) (0.382) (0.385) (0.386) (0.382)
Financial slack 0.042 0.039 0.028 0.045 0.034 0.046(0.048) (0.048) (0.049) (0.049) (0.049) (0.049)
Past 5-yr exploratory patent ratio (lagged by 1 yr) 2.714 2.723 2.780 2.711 2.759 2.757(0.220)** (0.221)** (0.223)** (0.222)** (0.226)** (0.223)**
Pay level −0.036 −0.170 −0.259 −0.007 −0.201 −0.117(0.182) (0.231) (0.212) (0.184) (0.248) (0.246)
Average employee age −0.063 −0.054 −0.079 −0.050 −0.059 −0.123(0.215) (0.215) (0.215) (0.217) (0.218) (0.218)
Std. dev. of employee age 0.132 0.127 0.139 0.141 0.141 −0.050(0.067)* (0.068)+ (0.068)* (0.068)* (0.069)* (0.103)
Horizontal pay dispersion 0.005 0.002 −0.087(0.006) (0.006) (0.036)*
Vertical pay differential 0.0590 0.040 0.046(0.031)+ (0.035) (0.035)
Vertical tournament incentives 0.333 0.265 0.274(0.151)* (0.161)+ (0.159)+
Horizontal pay dispersion 0.013× Std. dev. of employee age (0.005)*
RMSE 0.639 0.640 0.640 0.652 0.652 0.634Dev 232.0 231.7 231.7 236.0 234.7 227.7Df 18 19 19 19 21 22
Notes: (1) This table reports fractional logit regression estimation on the fraction of a firm’s patent citations towards exploratory content; (2) Number of observa-tions= 381; (3) Number of firms=81; (4) 2-digit SIC industry dummies included in all models; (5) Calendar year dummies included in all models; (6) Standarderrors in parentheses; (7) Average employee age scaled (divided by 10); (8).** p < 0.01.* p < 0.05.+ p < 0.1.
Table 6bFractional logit regressions on proportion of exploratory patents.
(1) (2) (3) (4) (5) (6)
Constant −2.051 −2.018 −2.072 −2.180 −2.128 0.067(0.784)** (0.785)* (0.784)** (0.791)** (0.792)** (1.028)
Firm size −0.065 −0.068 −0.067 −0.068 −0.074 −0.076(0.034)+ (0.034)* (0.034)+ (0.035)* (0.035)* (0.034)*
R&D intensity −3.184 −3.233 −3.101 −3.224 −3.198 −3.383(0.365)** (0.366)** (0.366)** (0.367)** (0.367)** (0.366)**
Financial slack 0.126 0.131 0.116 0.132 0.125 0.133(0.046)** (0.046)** (0.047)* (0.046)** (0.047)** (0.047)**
Past 5-yr exploratory patent ratio (lagged by 1 yr) 3.971 3.965 4.024 3.975 4.025 4.043(0.211)** (0.211)** (0.214)** (0.212)** (0.215)** (0.214)**
Pay level 0.333 0.513 0.166 0.360 0.435 0.535(0.174)+ (0.221)* (0.203) (0.175)* (0.236)+ (0.236)*
Average employee age −0.034 −0.053 −0.035 −0.035 −0.061 −0.167(0.205) (0.206) (0.205) (0.206) (0.207) (0.209)
Std. dev. of employee age −0.004 0.006 −0.001 −0.001 0.018 −0.238(0.064) (0.065) (0.065) (0.065) (0.065) (0.099)*
Horizontal pay dispersion −0.007 −0.011 −0.130(0.005) (0.006)+ (0.034)**
Vertical pay differential 0.048 0.055 0.067(0.030) (0.033) (0.033)*
Vertical tournament incentives 0.240 0.181 0.173(0.144)+ (0.153) (0.152)
Horizontal pay dispersion 0.017× Std. dev. of employee age (0.005)**
RMSE 0.585 0.585 0.585 0.589 0.589 0.583Dev 212.3 211.8 211.9 213.4 212.0 209.4Df 18 19 19 19 21 22
Notes: (1) This table reports fractional logit regression estimation on the fraction of a firm’s patents that are exploratory; (2) Number of observations= 381; (3)Number of firms= 81; (4) 2-digit SIC industry dummies included in all models; (5) Calendar year dummies included in all models; (6) Standard errors in parentheses;(7) Average employee age scaled (divided by 10); (8).** p < 0.01.* p < 0.05.+ p < 0.1.
V. Cui, et al. Research Policy 48 (2019) 1534–1549
1542
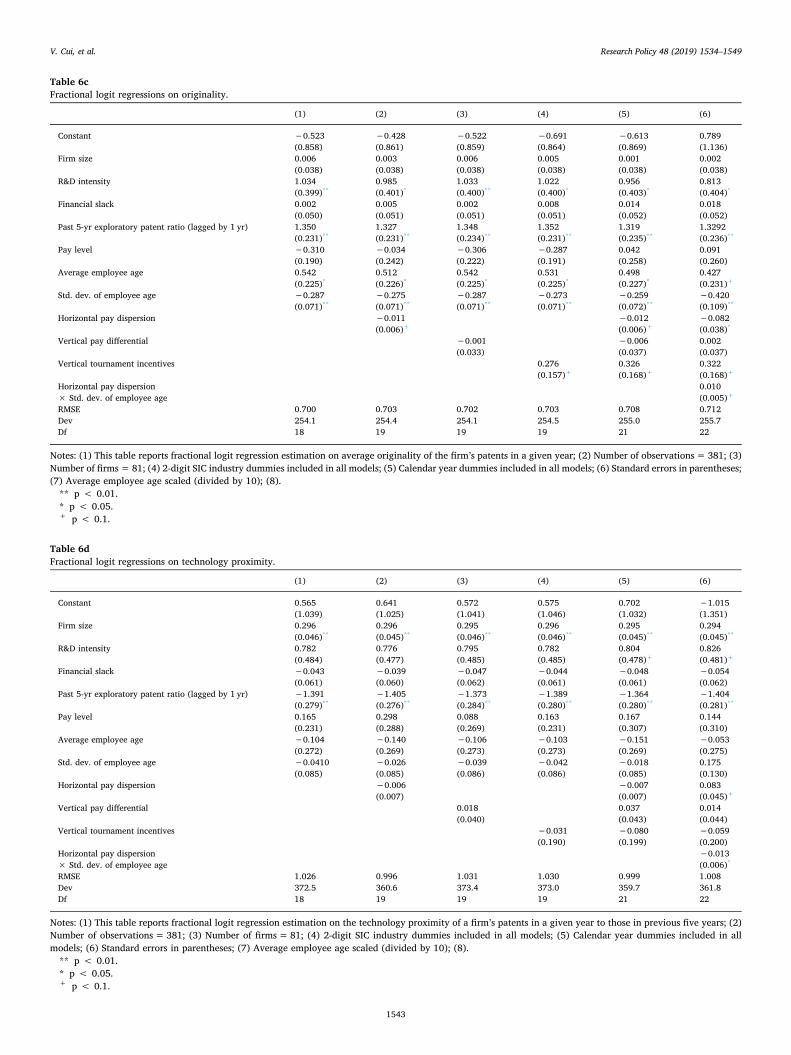
Table 6cFractional logit regressions on originality.
(1) (2) (3) (4) (5) (6)
Constant −0.523 −0.428 −0.522 −0.691 −0.613 0.789(0.858) (0.861) (0.859) (0.864) (0.869) (1.136)
Firm size 0.006 0.003 0.006 0.005 0.001 0.002(0.038) (0.038) (0.038) (0.038) (0.038) (0.038)
R&D intensity 1.034 0.985 1.033 1.022 0.956 0.813(0.399)** (0.401)* (0.400)** (0.400)* (0.403)* (0.404)*
Financial slack 0.002 0.005 0.002 0.008 0.014 0.018(0.050) (0.051) (0.051) (0.051) (0.052) (0.052)
Past 5-yr exploratory patent ratio (lagged by 1 yr) 1.350 1.327 1.348 1.352 1.319 1.3292(0.231)** (0.231)** (0.234)** (0.231)** (0.235)** (0.236)**
Pay level −0.310 −0.034 −0.306 −0.287 0.042 0.091(0.190) (0.242) (0.222) (0.191) (0.258) (0.260)
Average employee age 0.542 0.512 0.542 0.531 0.498 0.427(0.225)* (0.226)* (0.225)* (0.225)* (0.227)* (0.231)+
Std. dev. of employee age −0.287 −0.275 −0.287 −0.273 −0.259 −0.420(0.071)** (0.071)** (0.071)** (0.071)** (0.072)** (0.109)**
Horizontal pay dispersion −0.011 −0.012 −0.082(0.006)+ (0.006)+ (0.038)*
Vertical pay differential −0.001 −0.006 0.002(0.033) (0.037) (0.037)
Vertical tournament incentives 0.276 0.326 0.322(0.157)+ (0.168)+ (0.168)+
Horizontal pay dispersion 0.010× Std. dev. of employee age (0.005)+
RMSE 0.700 0.703 0.702 0.703 0.708 0.712Dev 254.1 254.4 254.1 254.5 255.0 255.7Df 18 19 19 19 21 22
Notes: (1) This table reports fractional logit regression estimation on average originality of the firm’s patents in a given year; (2) Number of observations= 381; (3)Number of firms= 81; (4) 2-digit SIC industry dummies included in all models; (5) Calendar year dummies included in all models; (6) Standard errors in parentheses;(7) Average employee age scaled (divided by 10); (8).** p < 0.01.* p < 0.05.+ p < 0.1.
Table 6dFractional logit regressions on technology proximity.
(1) (2) (3) (4) (5) (6)
Constant 0.565 0.641 0.572 0.575 0.702 −1.015(1.039) (1.025) (1.041) (1.046) (1.032) (1.351)
Firm size 0.296 0.296 0.295 0.296 0.295 0.294(0.046)** (0.045)** (0.046)** (0.046)** (0.045)** (0.045)**
R&D intensity 0.782 0.776 0.795 0.782 0.804 0.826(0.484) (0.477) (0.485) (0.485) (0.478)+ (0.481)+
Financial slack −0.043 −0.039 −0.047 −0.044 −0.048 −0.054(0.061) (0.060) (0.062) (0.061) (0.061) (0.062)
Past 5-yr exploratory patent ratio (lagged by 1 yr) −1.391 −1.405 −1.373 −1.389 −1.364 −1.404(0.279)** (0.276)** (0.284)** (0.280)** (0.280)** (0.281)**
Pay level 0.165 0.298 0.088 0.163 0.167 0.144(0.231) (0.288) (0.269) (0.231) (0.307) (0.310)
Average employee age −0.104 −0.140 −0.106 −0.103 −0.151 −0.053(0.272) (0.269) (0.273) (0.273) (0.269) (0.275)
Std. dev. of employee age −0.0410 −0.026 −0.039 −0.042 −0.018 0.175(0.085) (0.085) (0.086) (0.086) (0.085) (0.130)
Horizontal pay dispersion −0.006 −0.007 0.083(0.007) (0.007) (0.045)+
Vertical pay differential 0.018 0.037 0.014(0.040) (0.043) (0.044)
Vertical tournament incentives −0.031 −0.080 −0.059(0.190) (0.199) (0.200)
Horizontal pay dispersion −0.013× Std. dev. of employee age (0.006)*
RMSE 1.026 0.996 1.031 1.030 0.999 1.008Dev 372.5 360.6 373.4 373.0 359.7 361.8Df 18 19 19 19 21 22
Notes: (1) This table reports fractional logit regression estimation on the technology proximity of a firm’s patents in a given year to those in previous five years; (2)Number of observations= 381; (3) Number of firms= 81; (4) 2-digit SIC industry dummies included in all models; (5) Calendar year dummies included in allmodels; (6) Standard errors in parentheses; (7) Average employee age scaled (divided by 10); (8).** p < 0.01.* p < 0.05.+ p < 0.1.
V. Cui, et al. Research Policy 48 (2019) 1534–1549
1543
hierarchy. This variable is indicative of the degree of the promotiontournament in the firm. All else controlled for, tournament incentives ina firm’s vertical compensation design appears to be significantly andpositively related to the proportion of exploratory citations in the firm. Astandard deviation increase in the vertical tournament incentives of thefirm is associated with an increase in the proportion of exploratory ci-tations in the firm’s patents by 10 percent (=exp[0.287*0.333]).
The measures for horizontal and vertical pay structure are enteredinto model 5 together. When the vertical pay differential is accounted for,vertical tournament incentives remains statistically significant at p < 0.1level, while vertical pay differential becomes not significant. This sug-gests to us that in the design of vertical compensation structure, the rateat which compensations increase along promotions (the shape of thepromotion-pay-increase curve) matters more than the top-to-bottomgap in the compensation hierarchy.
In Table 6b, we replicate the estimations in Table 6a for our secondexploratory innovation indicator–proportion of exploratory patents. Theresults are largely consistent in pattern with those from Table 6a. Be-tween the two vertical structure measures, we don’t observe any re-lationship between vertical pay differential and proportion of exploratorypatents. However, there is still a marginally significant relationshipbetween a firm’s vertical tournament incentives and the proportion of ex-ploratory patents. A standard deviation increase in the vertical tourna-ment incentives of the firm is associated with an increase in the propor-tion of exploratory patents by 7.1 percent (=exp[0.287*0.24]).
In Table 6c, we run estimations on our third exploratory innovationindicator–average originality of the patents filed by a firm in a givenyear. The result regarding the relationship between vertical tournamentincentives and exploration is largely consistent with those observed inour estimations on proportion of exploratory citations (Table 6a) andproportion of exploration patents (Table 6b). Based on model 4, a stan-dard deviation increase in the vertical tournament incentives of the firm isassociated with an increase in the average originality in the firm’s patentsby 8.2 percent (=exp[0.287*0.276]). There also exists a marginallysignificant negative correlation between horizontal pay dispersion andaverage originality of a firm’s patents. This result alone is certainly notsufficient for us to come to the conclusion that our hypothesis 1 issupported. Nonetheless, it offers more reason for us to further explorewhether the relationship between horizontal dispersion and explorationexists under some of the conditions, which we describe in the nextsection.
Lastly, we run fractional logit estimations on our fourth explorationindicator–technology proximity in Table 6d. Models 2–5 in Table 6d re-port the core results regarding the relationships between horizontal andvertical structural measures and technology proximity. There is no sta-tistically significant relationship between any of the horizontal andvertical structural measures and technology proximity.
Recall that our first three dependent variables, estimated in Tables6a–6c, focus more on the novel knowledge recombination aspect ofexploration and our fourth dependent variable, estimated in Table 6d,focuses more on the shifts in technology portfolio across technological(patent-class) boundaries. Across our Tables 6a–6c, the regressionssuggest a relationship between vertical tournament incentives and ex-ploration, though the level of statistical significance of this relationshipis generally at p < 0.1 level, most likely due to the small sample size.Nonetheless, this relationship shows up consistently across regressionson all of the three exploration indicators in Tables 6a–6c. In Table 6d,however, we find no statistically significant evidence regarding therelationship between vertical tournament incentives and exploration asmeasured by technology proximity. Taking stock of all four sets of esti-mations, we find that the general pattern is consistent across measures:the link between vertical tournament structure and exploration isstronger with regard to how exploratory innovations are built uponnovel combination of knowledge than to shifts of innovation portfolioacross technology classes. This suggests that within the technologyclasses that a firm specializes in, tournament incentives in vertical pay
structure are significantly related to R&D employees’ path-breakinginnovations.
5.1. Scope condition for horizontal pay dispersion
In our main estimations, we find a negative relationship (withmarginally statistical significance) in Table 6c between horizontal paydispersion and average originality of the patents filed by a firm in a year.However, in our estimations on the proportion of exploratory citations,proportion of exploratory patents and technology proximity, we do notobserve any statistically significant relationship between horizontal paydispersion and exploration. To adjudicate across these findings, weexplore whether there is any scope condition underlying this relation-ship.
Recall that in proposing the negative relationship between hor-izontal pay dispersion and exploration, the mechanism we rely on indriving our argument is social comparison. A more varied pay structure(with a higher level of horizontal pay dispersion) seems to elicit astronger sense of social comparison, which in turn, may dampen thecollaboration needed for exploratory innovation.
If social comparison is really at work in linking horizontal paydispersion to exploration, then based on previous research (e.g., Tsuiet al., 1992; Zenger and Lawrence, 1989), we shall anticipate that theoccurrence of social comparison is not uniform across various types ofdemographic groups or situations. For example, Festinger’s (1954)much-cited finding show that social comparison happens more oftenbetween people who are similar to each other. This suggests to us thatthe extent of social comparison shall be greater in firms hiring em-ployee with similar profiles (less diversity) than in firms where em-ployee profiles are more diverse.
In our setting, we use a demographic variable, age, as a proxy forgauging similarity in employee profile. Individuals who are similar inage are likely to have similar level of skills and also pursuing similargoals as each other. As such, in R&D groups where employee age var-iation is small, we anticipate social comparison will be more intense.Prior research also suggests that comparison of compensation betweenpeople similar to each other would evoke a stronger feeling of in-equitable treatment (Baron and Pfeffer, 1994; Bloom, 1999; Lazear,1989; Shaw et al., 2002). This implies that if social comparison doestake place among the R&D workforce of a firm, the negative feelinginvoked from the comparison may be weaker in firms where employeeage variation is larger than in firms with employees of a smaller rangeof age distribution.
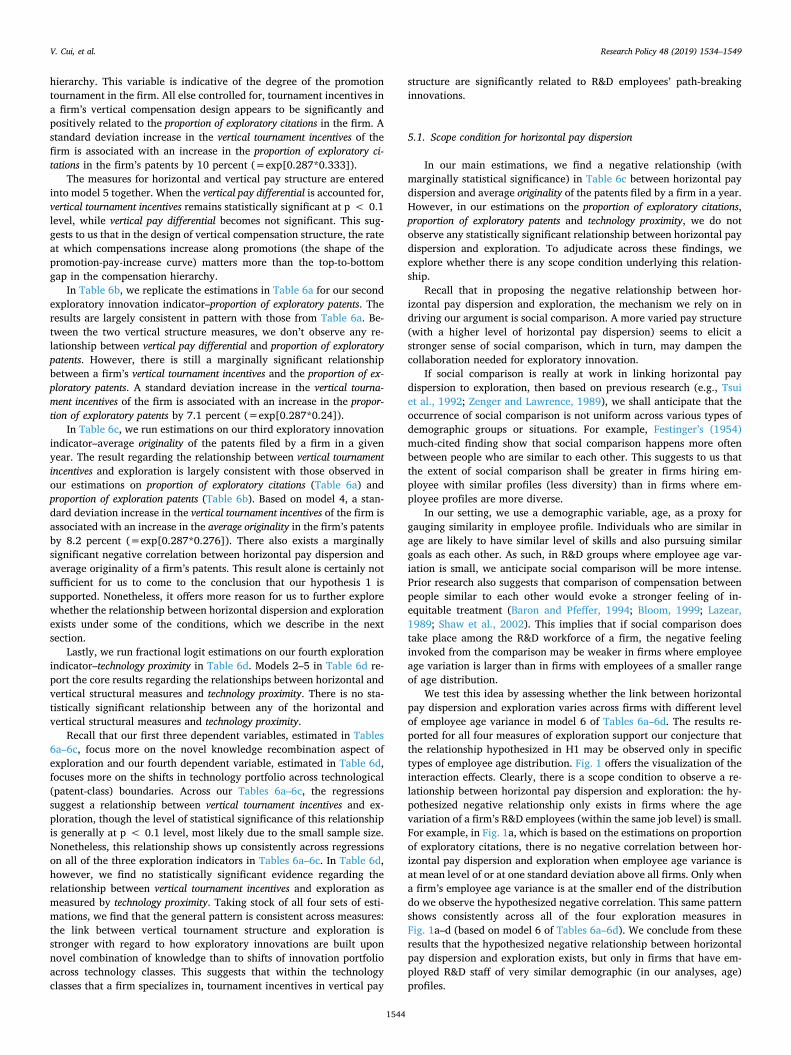
We test this idea by assessing whether the link between horizontalpay dispersion and exploration varies across firms with different levelof employee age variance in model 6 of Tables 6a–6d. The results re-ported for all four measures of exploration support our conjecture thatthe relationship hypothesized in H1 may be observed only in specifictypes of employee age distribution. Fig. 1 offers the visualization of theinteraction effects. Clearly, there is a scope condition to observe a re-lationship between horizontal pay dispersion and exploration: the hy-pothesized negative relationship only exists in firms where the agevariation of a firm’s R&D employees (within the same job level) is small.For example, in Fig. 1a, which is based on the estimations on proportionof exploratory citations, there is no negative correlation between hor-izontal pay dispersion and exploration when employee age variance isat mean level of or at one standard deviation above all firms. Only whena firm’s employee age variance is at the smaller end of the distributiondo we observe the hypothesized negative correlation. This same patternshows consistently across all of the four exploration measures inFig. 1a–d (based on model 6 of Tables 6a–6d). We conclude from theseresults that the hypothesized negative relationship between horizontalpay dispersion and exploration exists, but only in firms that have em-ployed R&D staff of very similar demographic (in our analyses, age)profiles.
V. Cui, et al. Research Policy 48 (2019) 1534–1549
1544
5.2. Robustness checks
Multiple R&D Locations. Since the firms included in our data aremostly large public firms, some might have multiple locations. Forexample, only 9.5 percent of our firms have only one R&D location, 7.4percent have two locations, and 83.1 percent have three or more lo-cations. This raises a legitimate concern whether the mechanisms un-derlying our hypothesized pay dispersion effects remain robust when afirm’s R&D staff spread across multiple locations. Ideally, if we canbreak down a firm’s patents reliably to their different R&D locations, wewould link a location’s compensation structure to that location’s pa-tenting activity. However, such a geographical assignment of firms’patents is unreliable due to variations in firms’ policies regardingwhether their patents are all filed from a central headquarter R&D lo-cation or from where the actual R&D activity is performed. Therefore,we decide to analyze our data at the level of a firm rather than a sub-division of a firm.
Clearly, to draw any inference this way about a firm with multiple R&D locations rests on the assumption that the firm’s compensationstructure is consistent across its multiple R&D locations. Fortunately,our compensation data contain information of the SMSA locations,states, and regions where a firm operates and we can use that in-formation to assess the validity of this assumption. We calculated theCronbach’s alpha, which measures the intra-firm correlation of paydispersions across different locations. The Cronbach’s alpha for hor-izontal pay dispersion is 0.91, and that for vertical pay dispersion is0.76, both exceeding the usual threshold of 0.70. Therefore, we believethat pay dispersion structures are consistent across multiple R&D lo-cations of a firm, rendering it reliable for us to draw inference from dataanalysis at an aggregate (firm) level.
Consistency of Compensation Design across Multiple Levels. Onemight also be concerned with the aggregated nature of our horizontalpay dispersion measure. As discussed above, our argument about hor-izontal pay dispersion is built on the assumption that employees within
a pay band compare with each other’s pay and allocate effort accord-ingly. However, our measure of horizontal pay dispersion used in theestimations of Table 6 is an average across all eight levels of pay band.As such, there is no guarantee that this measure consistently representsthe degree of pay dispersion at each individual level of the firm. Toaddress this concern, we performed a test of intra-firm correlation ofhorizontal pay dispersion across pay bands. The Cronbach’s alpha forthis test is 0.95, indicating that most of the firms in our data are usingsimilar structure of pay dispersion across multiple pay bands.
Managers vs. Non-managers. A related concern regards where in-novation decisions are made in a firm. As we have discussed in sectionII, we argue that contemporary firms are flatter in their organization ofinnovation effort and therefore allow a stronger role for non-executivemanagers and employees. In addition, even if C-level executives are themain-decision maker for direction of R&D and allocation of resources,the execution of any research project still falls on mid-to-lower tiermanagers and employees. As such, a firm’s compensation design mayshape micro-level incentives, and in turn, the type of innovations beingproduced.
Nonetheless, question still remains which levels in our observeddata–manager or non-manager–are more strongly related to a firm’spatterns of innovation. To address this question, we re-estimated ourmodels, but with all pay dispersion-related variables measured sepa-rately for managers, who are classified in the pay structure of sampledfirms as in pay levels 6–8, and for non-mangers whose pay falls in levels1–5. By separately assessing the compensation-related measures formanagers and non-mangers, we can to some extent reduce the level ofaggregation in the horizontal pay dispersion measure and see whetherour results are mainly driven by a specific level of individuals in thesampled firms.
We report the results (replication the last column of the Table 6series) in Tables 7a for managers and 7b for non-managers. Interest-ingly, the two dimensions of our pay dispersion measures (horizontaland vertical) appear to be differentially related to exploration outcomes
Fig. 1. Relationship between horizontal pay dispersion and exploration at different levels of employee age variance.
V. Cui, et al. Research Policy 48 (2019) 1534–1549
1545
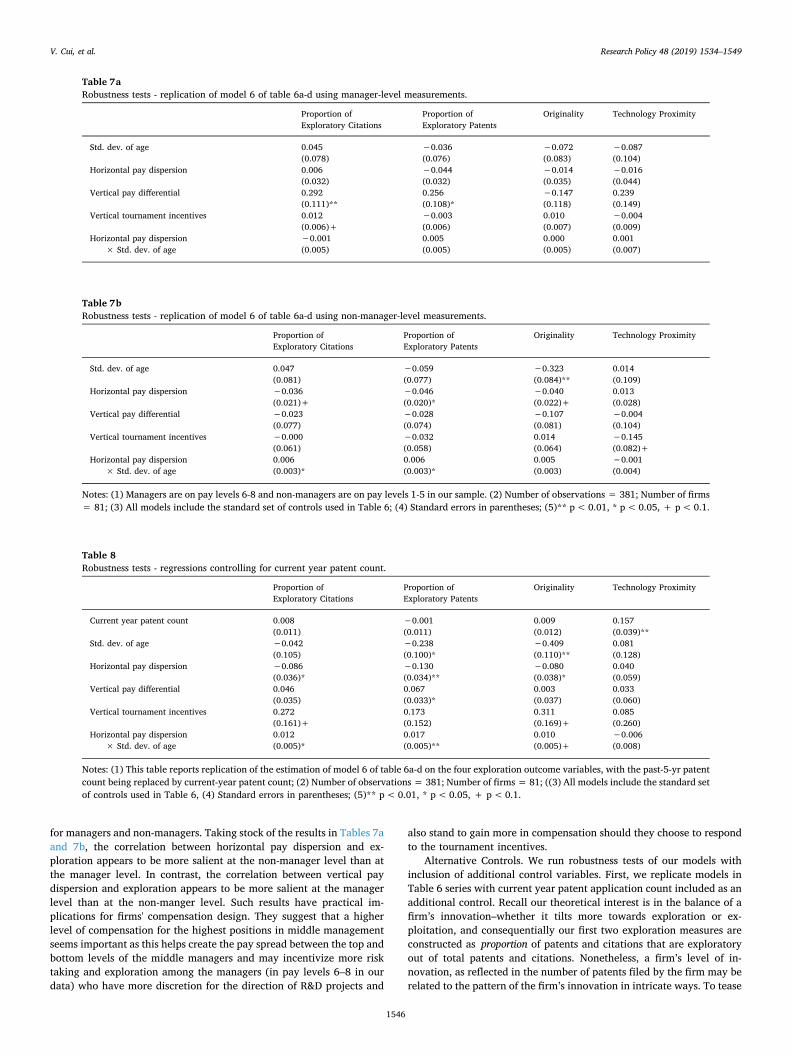
for managers and non-managers. Taking stock of the results in Tables 7aand 7b, the correlation between horizontal pay dispersion and ex-ploration appears to be more salient at the non-manager level than atthe manager level. In contrast, the correlation between vertical paydispersion and exploration appears to be more salient at the managerlevel than at the non-manger level. Such results have practical im-plications for firms' compensation design. They suggest that a higherlevel of compensation for the highest positions in middle managementseems important as this helps create the pay spread between the top andbottom levels of the middle managers and may incentivize more risktaking and exploration among the managers (in pay levels 6–8 in ourdata) who have more discretion for the direction of R&D projects and
also stand to gain more in compensation should they choose to respondto the tournament incentives.
Alternative Controls. We run robustness tests of our models withinclusion of additional control variables. First, we replicate models inTable 6 series with current year patent application count included as anadditional control. Recall our theoretical interest is in the balance of afirm’s innovation–whether it tilts more towards exploration or ex-ploitation, and consequentially our first two exploration measures areconstructed as proportion of patents and citations that are exploratoryout of total patents and citations. Nonetheless, a firm’s level of in-novation, as reflected in the number of patents filed by the firm may berelated to the pattern of the firm’s innovation in intricate ways. To tease
Table 7aRobustness tests - replication of model 6 of table 6a-d using manager-level measurements.
Proportion ofExploratory Citations
Proportion ofExploratory Patents
Originality Technology Proximity
Std. dev. of age 0.045 −0.036 −0.072 −0.087(0.078) (0.076) (0.083) (0.104)
Horizontal pay dispersion 0.006 −0.044 −0.014 −0.016(0.032) (0.032) (0.035) (0.044)
Vertical pay differential 0.292 0.256 −0.147 0.239(0.111)** (0.108)* (0.118) (0.149)
Vertical tournament incentives 0.012 −0.003 0.010 −0.004(0.006)+ (0.006) (0.007) (0.009)
Horizontal pay dispersion× Std. dev. of age
−0.001 0.005 0.000 0.001(0.005) (0.005) (0.005) (0.007)
Table 7bRobustness tests - replication of model 6 of table 6a-d using non-manager-level measurements.
Proportion ofExploratory Citations
Proportion ofExploratory Patents
Originality Technology Proximity
Std. dev. of age 0.047 −0.059 −0.323 0.014(0.081) (0.077) (0.084)** (0.109)
Horizontal pay dispersion −0.036 −0.046 −0.040 0.013(0.021)+ (0.020)* (0.022)+ (0.028)
Vertical pay differential −0.023 −0.028 −0.107 −0.004(0.077) (0.074) (0.081) (0.104)
Vertical tournament incentives −0.000 −0.032 0.014 −0.145(0.061) (0.058) (0.064) (0.082)+
Horizontal pay dispersion× Std. dev. of age
0.006 0.006 0.005 −0.001(0.003)* (0.003)* (0.003) (0.004)
Notes: (1) Managers are on pay levels 6-8 and non-managers are on pay levels 1-5 in our sample. (2) Number of observations = 381; Number of firms= 81; (3) All models include the standard set of controls used in Table 6; (4) Standard errors in parentheses; (5)** p< 0.01, * p<0.05, + p<0.1.
Table 8Robustness tests - regressions controlling for current year patent count.
Proportion ofExploratory Citations
Proportion ofExploratory Patents
Originality Technology Proximity
Current year patent count 0.008 −0.001 0.009 0.157(0.011) (0.011) (0.012) (0.039)**
Std. dev. of age −0.042 −0.238 −0.409 0.081(0.105) (0.100)* (0.110)** (0.128)
Horizontal pay dispersion −0.086 −0.130 −0.080 0.040(0.036)* (0.034)** (0.038)* (0.059)
Vertical pay differential 0.046 0.067 0.003 0.033(0.035) (0.033)* (0.037) (0.060)
Vertical tournament incentives 0.272 0.173 0.311 0.085(0.161)+ (0.152) (0.169)+ (0.260)
Horizontal pay dispersion× Std. dev. of age
0.012 0.017 0.010 −0.006(0.005)* (0.005)** (0.005)+ (0.008)
Notes: (1) This table reports replication of the estimation of model 6 of table 6a-d on the four exploration outcome variables, with the past-5-yr patentcount being replaced by current-year patent count; (2) Number of observations = 381; Number of firms = 81; ((3) All models include the standard setof controls used in Table 6, (4) Standard errors in parentheses; (5)** p<0.01, * p< 0.05, + p<0.1.
V. Cui, et al. Research Policy 48 (2019) 1534–1549
1546
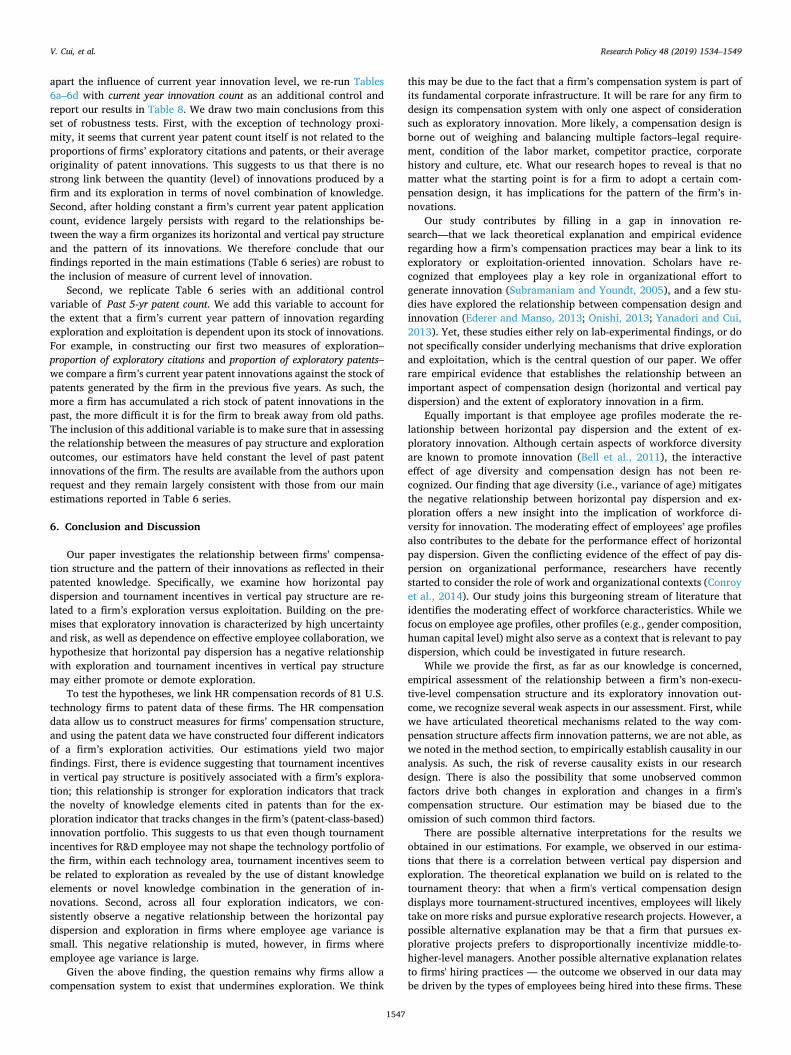
apart the influence of current year innovation level, we re-run Tables6a–6d with current year innovation count as an additional control andreport our results in Table 8. We draw two main conclusions from thisset of robustness tests. First, with the exception of technology proxi-mity, it seems that current year patent count itself is not related to theproportions of firms’ exploratory citations and patents, or their averageoriginality of patent innovations. This suggests to us that there is nostrong link between the quantity (level) of innovations produced by afirm and its exploration in terms of novel combination of knowledge.Second, after holding constant a firm’s current year patent applicationcount, evidence largely persists with regard to the relationships be-tween the way a firm organizes its horizontal and vertical pay structureand the pattern of its innovations. We therefore conclude that ourfindings reported in the main estimations (Table 6 series) are robust tothe inclusion of measure of current level of innovation.
Second, we replicate Table 6 series with an additional controlvariable of Past 5-yr patent count. We add this variable to account forthe extent that a firm’s current year pattern of innovation regardingexploration and exploitation is dependent upon its stock of innovations.For example, in constructing our first two measures of exploration–proportion of exploratory citations and proportion of exploratory patents–we compare a firm’s current year patent innovations against the stock ofpatents generated by the firm in the previous five years. As such, themore a firm has accumulated a rich stock of patent innovations in thepast, the more difficult it is for the firm to break away from old paths.The inclusion of this additional variable is to make sure that in assessingthe relationship between the measures of pay structure and explorationoutcomes, our estimators have held constant the level of past patentinnovations of the firm. The results are available from the authors uponrequest and they remain largely consistent with those from our mainestimations reported in Table 6 series.
6. Conclusion and Discussion
Our paper investigates the relationship between firms’ compensa-tion structure and the pattern of their innovations as reflected in theirpatented knowledge. Specifically, we examine how horizontal paydispersion and tournament incentives in vertical pay structure are re-lated to a firm’s exploration versus exploitation. Building on the pre-mises that exploratory innovation is characterized by high uncertaintyand risk, as well as dependence on effective employee collaboration, wehypothesize that horizontal pay dispersion has a negative relationshipwith exploration and tournament incentives in vertical pay structuremay either promote or demote exploration.
To test the hypotheses, we link HR compensation records of 81 U.S.technology firms to patent data of these firms. The HR compensationdata allow us to construct measures for firms’ compensation structure,and using the patent data we have constructed four different indicatorsof a firm’s exploration activities. Our estimations yield two majorfindings. First, there is evidence suggesting that tournament incentivesin vertical pay structure is positively associated with a firm’s explora-tion; this relationship is stronger for exploration indicators that trackthe novelty of knowledge elements cited in patents than for the ex-ploration indicator that tracks changes in the firm’s (patent-class-based)innovation portfolio. This suggests to us that even though tournamentincentives for R&D employee may not shape the technology portfolio ofthe firm, within each technology area, tournament incentives seem tobe related to exploration as revealed by the use of distant knowledgeelements or novel knowledge combination in the generation of in-novations. Second, across all four exploration indicators, we con-sistently observe a negative relationship between the horizontal paydispersion and exploration in firms where employee age variance issmall. This negative relationship is muted, however, in firms whereemployee age variance is large.
Given the above finding, the question remains why firms allow acompensation system to exist that undermines exploration. We think
this may be due to the fact that a firm’s compensation system is part ofits fundamental corporate infrastructure. It will be rare for any firm todesign its compensation system with only one aspect of considerationsuch as exploratory innovation. More likely, a compensation design isborne out of weighing and balancing multiple factors–legal require-ment, condition of the labor market, competitor practice, corporatehistory and culture, etc. What our research hopes to reveal is that nomatter what the starting point is for a firm to adopt a certain com-pensation design, it has implications for the pattern of the firm’s in-novations.
Our study contributes by filling in a gap in innovation re-search—that we lack theoretical explanation and empirical evidenceregarding how a firm’s compensation practices may bear a link to itsexploratory or exploitation-oriented innovation. Scholars have re-cognized that employees play a key role in organizational effort togenerate innovation (Subramaniam and Youndt, 2005), and a few stu-dies have explored the relationship between compensation design andinnovation (Ederer and Manso, 2013; Onishi, 2013; Yanadori and Cui,2013). Yet, these studies either rely on lab-experimental findings, or donot specifically consider underlying mechanisms that drive explorationand exploitation, which is the central question of our paper. We offerrare empirical evidence that establishes the relationship between animportant aspect of compensation design (horizontal and vertical paydispersion) and the extent of exploratory innovation in a firm.
Equally important is that employee age profiles moderate the re-lationship between horizontal pay dispersion and the extent of ex-ploratory innovation. Although certain aspects of workforce diversityare known to promote innovation (Bell et al., 2011), the interactiveeffect of age diversity and compensation design has not been re-cognized. Our finding that age diversity (i.e., variance of age) mitigatesthe negative relationship between horizontal pay dispersion and ex-ploration offers a new insight into the implication of workforce di-versity for innovation. The moderating effect of employees’ age profilesalso contributes to the debate for the performance effect of horizontalpay dispersion. Given the conflicting evidence of the effect of pay dis-persion on organizational performance, researchers have recentlystarted to consider the role of work and organizational contexts (Conroyet al., 2014). Our study joins this burgeoning stream of literature thatidentifies the moderating effect of workforce characteristics. While wefocus on employee age profiles, other profiles (e.g., gender composition,human capital level) might also serve as a context that is relevant to paydispersion, which could be investigated in future research.
While we provide the first, as far as our knowledge is concerned,empirical assessment of the relationship between a firm’s non-execu-tive-level compensation structure and its exploratory innovation out-come, we recognize several weak aspects in our assessment. First, whilewe have articulated theoretical mechanisms related to the way com-pensation structure affects firm innovation patterns, we are not able, aswe noted in the method section, to empirically establish causality in ouranalysis. As such, the risk of reverse causality exists in our researchdesign. There is also the possibility that some unobserved commonfactors drive both changes in exploration and changes in a firm'scompensation structure. Our estimation may be biased due to theomission of such common third factors.
There are possible alternative interpretations for the results weobtained in our estimations. For example, we observed in our estima-tions that there is a correlation between vertical pay dispersion andexploration. The theoretical explanation we build on is related to thetournament theory: that when a firm's vertical compensation designdisplays more tournament-structured incentives, employees will likelytake on more risks and pursue explorative research projects. However, apossible alternative explanation may be that a firm that pursues ex-plorative projects prefers to disproportionally incentivize middle-to-higher-level managers. Another possible alternative explanation relatesto firms' hiring practices — the outcome we observed in our data maybe driven by the types of employees being hired into these firms. These
V. Cui, et al. Research Policy 48 (2019) 1534–1549
1547
firms may offer higher compensation to hire high quality middle-to-higher level managers who can effectively manage exploratory projects;consequently, vertical pay dispersion widens. These are all possiblecontestant interpretations to the one we introduced in our main text.Our empirical setting cannot fully rule out these alternative inter-pretations.
Second, due to the limitation of the data available, we are limited inour ability to directly measure the social comparison and tournamentprocesses. There are several plausible mechanisms underlying the re-lationship between pay structure and exploration (e.g., employee net-works, trust, cooperation, firms' ability to evaluate innovation effort orperformance). These potential mechanisms are valuable along the ex-planatory pathway, as they would have greatly enriched our research ifwe were able to identify them. However, we are not able to empiricallytease out various possible nuanced mechanisms that may have con-tributed to the relationships in question. For these reasons, we interpretour finding as correlational with the hope that future research will findbetter ways to build on our finding and establish a clean causal pathwayempirically.
Third, our theoretical argument is built upon individual motivationfor risk-taking and collaborations. As such, the ideal dataset for testingour theory would be one that can allow us to correlate local compen-sation structure (e.g., of a small R&D unit in one geographical locationor at one pay band) with local employee innovation patterns.Unfortunately, we cannot achieve this in our dataset, even though ourrobustness checks help mitigate the data-aggregation-related concernsto some extent.
In summary, though we urge for caution in interpreting causality inour findings, we have strong confidence that the empirical relationshipswe have revealed from our investigation are of strong value and re-levance to both innovation and HR scholars and practitioners.
Funding
This work was supported by the Social Sciences and HumanitiesResearch Council (SSHRC) of Canada (Grant number: 435-2017-1301,2017-2022).
Declaration of interests
The authors declare that they have no known competing financialinterests or personal relationships that could have appeared to influ-ence the work reported in this paper.
Acknowledgement
We are indebted to Beth Florin and the late Joseph Rich for makingavailable the data for this study. We are grateful for the feedback fromparticipants of Wharton People and Organization Conference and of theDepartment of Innovation and Organizational Economics Seminar atthe Copenhagen Business School.
References
Ahuja, G., 2000. The duality of collaboration: inducements and opportunities in theformation of inter-firm linkages. Strateg. Manage. J. 21, 317–343.
Ahuja, G., Lampert, C.M., Tandon, V., 2008. Moving beyond Schumpeter: managementresearch on the determinants of technological innovation. Acad. Manag. Ann. 2,1–98.
Andriopoulos, C., Lewis, M.W., 2009. Exploitation-exploration tensions and organiza-tional ambidexterity: managing paradoxes of innovation. Organ. Sci. 20, 696–717.
Argote, L., 1999. Organizational Learning: Creating, Retaining and TransferringKnowledge. Kluwer Academic Publishers, Boston, MA.
Azoulay, P., Zivin, Graff, Manso, J.S., G, 2011. Incentives and creativity: evidence fromthe academic life sciences. Rand J. Econ. 42, 527–554.
Balkin, D.B., Markman, G.D., Gomez-Mejia, L.R., 2000. Is CEO pay in high-technologyfirms related to innovation? Acad. Manag. J. 43, 1118–1129.
Ban, T.A., 2006. The role of serendipity in drug discovery. Dialogues Clin. Neurosci. 8,335–344.
Baron, J.N., Pfeffer, J., 1994. The social psychology of organizations and inequality. Soc.Psychol. Q. 57, 190–209.
Battelle, J., 2006. The Search: How Google and Its Rivals Rewrote The Rules of Businessand Transformed Our Culture. Portfolio, New York.
Becker, B.E., Huselid, M.A., 1992. The incentive effects of tournament compensationsystems. Adm. Sci. Q. 37, 336–350.
Beckman, C.M., Haunschild, P.R., Phillips, D.J., 2004. Friends or strangers? Firm-specificuncertainty, market uncertainty, and network partner selection. Organ. Sci. 15,259–275.
Bell, S.T., Villado, A.J., Lukasik, M.A., Belau, L., Briggs, A.L., 2011. Getting specific aboutdemographic diversity variable and team performance relationships: a meta-analysis.J. Manage. 37, 709–743.
Benner, M.J., 2002. Process management and technological innovation: a longitudinalstudy of the photography and paint industries. Adm. Sci. Q. 47, 676–706.
Benner, M.J., Tushman, M.L., 2003. Exploitation, exploration, and process management:the productivity dilemma revisited. Acad. Manag. Rev. 28, 238–256.
Bloom, M., 1999. The performance effects of pay dispersion on individuals and organi-zations. Acad. Manag. J. 42, 25–40.
Bloom, M., Michel, J.G., 2002. The relationships among organizational context, paydispersion, and managerial turnover. Acad. Manag. J. 45, 33–42.
Bock, L., 2015. Work Rules! Insights From Inside Google That Will Transform How YouLive and Lead. Twelve, New York.
Cappelli, P., Cascio, W.F., 1991. Why some jobs command wage premiums: a test ofcareer tournament and internal labor-market hypotheses. Acad. Manag. J. 34,848–868.
Clark, T.S., Linzer, D.A., 2015. Should I use fixed or random effects? Political Sci. Res.Methods 3, 399–408.
Cohen, W.M., Levinthal, D.A., 1990. Absorptive capacity: a new perspective on learningand innovation. Adm. Sci. Q. 35, 128–152.
Collins, C.J., Smith, K.G., 2006. Knowledge exchange and combination: the role of humanresource practices in the performance of high-technology firms. Acad. Manag. J. 49,544–560.
Conroy, S., Gupta, N., Shaw, J.D., Park, T.Y., 2014. A multilevel approach to the effects ofpay variation. Res. Personnel Human Resource Manag. 32, 1–64.
Conyon, M.J., Peck, S.I., Sadler, G.V., 2001. Corporate tournaments and executive com-pensation: evidence from the UK. Strateg. Manage. J. 22, 805–815.
Corredoira, R.A., Banerjee, P.M., 2015. Measuring patent's influence on technologicalevolution: a study of knowledge spanning and subsequent inventive activity. Res.Policy 44, 508–521.
Cowherd, D.M., Levine, D.I., 1992. Product quality and pay equity between lower-levelemployees and top management: an investigation of distributive justice theory. Adm.Sci. Q. 37, 302–320.
Csaszar, F.A., 2013. An efficient frontier in organization design: organizational structureas a determinant of exploration and exploitation. Organ. Sci. 24, 1083–1101.
Dechow, P.M., Sloan, R.G., 1991. Executive incentives and the horizon problem: anempirical investigation. J. Account. Econ. 14, 51–89.
Devaro, J., 2006. Strategic promotion tournaments and worker performance. Strateg.Manage. J. 27, 721–740.
Dye, R.A., 1984. The trouble with tournaments. Econ. Inq. 22, 147–149.Ederer, F., Manso, G., 2013. Is pay for performance detrimental to innovation? Manage.
Sci. 59, 1496–1513.Eriksson, T., 1999. Executive compensation and tournament theory: empirical tests on
Danish data. J. Labor Econ. 17, 262–280.Fang, C., Lee, J., Schilling, M.A., 2010. Balancing exploration and exploitation through
structural design: the isolation of subgroups and organizational learning. Organ. Sci.21, 625–642.
Festinger, L., 1954. A theory of social comparison processes. Hum. Relat. 7, 117–140.Fredrickson, J.W., Davis-Blake, A., Sanders, W.M.G., 2010. Sharing the wealth: social
comparisons and pay dispersion in the CEO’s top team. Strateg. Manage. J. 31,1031–1053.
Gerhart, B., Rynes, S.L., 2003. Compensation: Theory, Evidence, and StrategicImplications. Sage, Thousand Oak, CA.
Greve, H.R., 2007. Exploration and exploitation in product innovation. Ind. Corp. Chang.16, 945–975.
Gupta, A.K., Smith, K.G., Shalley, C.E., 2006. The interplay between exploration andexploitation. Acad. Manag. J. 49, 693–706.
Gupta, N., Conroy, S.A., Delery, J.E., 2012. The many faces of pay variation. Hum.Resour. Manag. Rev. 22, 100–115.
Hall, B.H., Ziedonis, R.H., 2001. The patent paradox revisited: An empirical study ofpatenting in the US semiconductor industry, 1979-1995. Rand J. Econ. 32, 101–128.
Hambrick, D.C., Finkelstein, S., Mooney, A.C., 2005. Executive job demands: new insightsfor explaining strategic decisions and leader behaviors. Acad. Manag. Rev. 30,472–491.
Hoang, H., Rothaermel, F.T., 2010. Leveraging internal and external experience: ex-ploration, exploitation, and R&D project performance. Strateg. Manage. J. 31,734–758.
Holthausen, R.W., Larcker, D.F., Sloan, R.G., 1995. Business unit innovation and thestructure of executive compensation. J. Account. Econ. 19, 279–313.
Jaffe, A.B., 1986. Technological opportunity and spillovers of R & D: evidence from firms’patents, profits, and market value. Am. Econ. Rev. 76, 984–1001.
Jansen, J.J.P., Van den Bosch, F.A.J., Volberda, H.W., 2006. Exploratory innovation,exploitative innovation, and performance: effects of organizational antecedents andenvironmental moderators. Manage. Sci. 52, 1661–1674.
Kacperczyk, A., Balachnadran, C., 2018. Vertical and horizontal wage dispersion andmobility outcomes: evidence from the Swedish microdata. Organ. Sci. 29, 17–38.
Kale, J.R., Reis, E., Venkateswaran, A., 2009. Rank-order tournaments and incentive
V. Cui, et al. Research Policy 48 (2019) 1534–1549
1548
alignment: the effect on firm performance. J. Finance 64, 1479–1512.Katila, R., Chen, E.L., 2008. Effects of search timing on innovation: the value of not being
in sync with rivals. Adm. Sci. Q. 53, 593–625.Kini, O., Williams, R., 2012. Tournament incentives, firm risk, and corporate policies. J.
financ. econ. 103, 350–376.Lambert, R.A., Larcker, D.F., Weigelt, K., 1993. The structure of organizational incentives.
Adm. Sci. Q. 38, 438–461.Lavie, D., Rosenkopf, L., 2006. Balancing exploration and exploitation in alliance for-
mation. Acad. Manag. J. 49, 797–818.Lavie, D., Stettner, U., Tushman, M.L., 2010. Exploration and exploitation within and
across organizations. Acad. Manag. Ann. 4, 109–155.Lazear, E.P., 1989. Pay equality and industrial politics. J. Polit. Econ. 97, 561–580.Lazear, E.P., Rosen, S., 1981. Rank-order tournaments as optimum labor contracts. J.
Polit. Econ. 89, 841–864.Lerner, J., Wulf, J., 2007. Innovation and incentives: evidence from corporate R&D. Rev.
Econ. Stat. 89, 634–644.Levinthal, D.A., March, J.G., 1993. The myopia of learning. Strateg. Manage. J. 14,
95–112.Liu, C., Stuart, T.E., 2015. Boundaries Awry: Knowledge Production and Social Networks
in A Corporate R&D Lab. Working Paper.Main, B.G.M., O’Reilly, C.A., Wade, J., 1993. Top executive pay: tournament or team-
work. J. Labor Econ. 11, 606–628.Manso, G., 2011. Motivating innovation. J. Finance 66, 1823–1860.March, J.G., 1991. Exploration and exploitation in organizational learning. Organ. Sci. 2,
71–87.Nickerson, J.A., Zenger, T.R., 2008. Envy, comparison costs, and the economic theory of
the firm. Strateg. Manage. J. 29, 1429–1449.Nohria, N., Gulati, R., 1996. Is slack good or bad for innovation? Acad. Manag. J. 39,
1245–1264.Nonaka, I., 1988. Toward middle-up-down management: accelerating information crea-
tion. Sloan Manage. Rev. 29, 9–18.Onishi, K., 2013. The effects of compensation plans for employee inventions on R&D
productivity: new evidence from Japanese panel data. Res. Policy 42, 367–378.Papke, L.E., Wooldridge, J.M., 1996. Econometric methods for fractional response vari-
ables with an application to 401(k) plan participation rates. J. Appl. Econom. 11,619–632.
Pfeffer, J., Langton, N., 1993. The effect of wage dispersion on satisfaction, productivity,and working collaboratively: evidence from college and university faculty. Adm. Sci.Q. 38, 382–407.
Phelps, C.C., 2010. A longitudinal study of the influence of alliance network structure andcomposition on firm exploratory innovation. Acad. Manag. J. 53, 890–913.
Rosenbloom, R.S., Spencer, W.J., 1996. Engines of Innovation: U.S. Industrial Research atthe End of an Era. Harvard Business School, Boston, MA.
Rosenkopf, L., Nerkar, A., 2001. Beyond local search: boundary-spanning, exploration,and impact in the optical disk industry. Strateg. Manage. J. 22, 287–306.
Rothaermel, F.T., Alexandre, M.T., 2009. Ambidexterity in technology sourcing: themoderating role of absorptive capacity. Organ. Sci. 20, 759–780.
Rothaermel, F.T., Deeds, D.L., 2004. Exploration and exploitation alliances in bio-technology: a system of new product development. Strateg. Manage. J. 25, 201–221.
Ryan, T.Y., 1997. Modern Regression Analysis. Wiley, New York.Sauermann, H., 2017. Fire in the Belly? Employee Motives and Innovative Performance in
Startups Versus Established Firms. NBER Working paper No. 23099.Shaw, J.D., 2014. Pay dispersion. Annu. Rev. Organ. Psychol. Organ. Behav. 1, 521–545.Shaw, J.D., Gupta, N., Delery, J.E., 2002. Pay dispersion and workforce performance:
moderating effects of incentives and interdependence. Strateg. Manage. J. 23,491–512.
Siegel, P.A., Hambrick, D.C., 2005. Pay disparities within top management groups: evi-dence of harmful effects on performance of high-technology firms. Organ. Sci. 16,259–274.
Siggelkow, N., Rivkin, J.W., 2006. When exploration backfires: unintended consequencesof multilevel organizational search. Acad. Manag. J. 49, 779–795.
Smith, W.K., Tushman, M.L., 2005. Managing strategic contradictions: a top managementmodel for managing innovation streams. Organ. Sci. 16, 522–536.
Sorensen, J.B., Stuart, T.E., 2000. Aging, obsolescence, and organizational innovation.Adm. Sci. Q. 45, 81–112.
Subramaniam, M., Youndt, M.A., 2005. The influence of intellectual capital on the typesof innovative capabilities. Acad. Manag. J. 48, 450–463.
Trajtenberg, M., Jaffe, A., Henderson, R., 1997. University versus corporate patents: Awindow on the basicness of invention. Econ. Innov. New Technol. 5, 19–50.
Trevor, C.O., Reilly, G., Gerhart, B., 2012. Reconsidering pay dispersion’s effect on theperformance of interdependent work: reconciling sorting and pay inequality. Acad.Manag. J. 55, 585–610.
Tsui, A.S., Egan, T.D., O’Reilly, C.A., 1992. Being different: relational demography andorganizational attachment. Adm. Sci. Q. 37, 549–579.
Tushman, M., Smith, W.K., Wood, R.C., Westerman, G., O’Reilly, C., 2010. Organizationaldesigns and innovation streams. Ind. Corp. Chang. 19, 1331–1366.
Voss, G.B., Sirdeshmukh, D., Voss, Z.G., 2008. The effects of slack resources and en-vironmental threat on product exploration and exploitation. Acad. Manag. J. 51,147–164.
Wang, H.C., He, J., Mahoney, J.T., 2009. Firm-specific knowledge resources and com-petitive advantage: The roles of economic- and relationship-based employee gov-ernance mechanisms. Strateg. Manage. J. 30, 1265–1285.
Yanadori, Y., Cui, V., 2013. Creating incentives for innovation? The relationship betweenpay dispersion in R&D groups and firm innovation performance. Strateg. Manage. J.34, 1502–1511.
Yanadori, Y., Marler, J.H., 2006. Compensation strategy: Does business strategy influencecompensation in high-technology firms? Strateg. Manage. J. 27, 559–570.
Zenger, T.R., Lawrence, B.S., 1989. Organizational demography: the differential effects ofage and tenure distributions on technical communication. Acad. Manag. J. 32,353–376.
V. Cui, et al. Research Policy 48 (2019) 1534–1549
1549