Embed Size (px)
Citation preview
Exploratory Analysis of a Smartphone-Based Travel1
Survey in Singapore2
Fang Zhao, Francisco Câmara Pereira, Rudi Ball, Youngsung Kim3Singapore-MIT Alliance for Research and Technology, Future Urban Mobility4
1 CREATE Way, #09-02 CREATE Tower, Singapore 1386025Tel: 65-6601 1547, Fax: 65-6778 56546
Email address: {fang.zhao, camara, rudi, youngsung}@smart.mit.edu7
Yafei Han, Christopher Zegras, Moshe Ben-Akiva8Massachusetts Institute of Technology9
77 Massachusetts Avenue, Cambridge, MA, 0213910Telephone: 617.253.532411
Email address: {yafei, czegras, mba}@mit.edu12
Word count with figures and tables: 4467 + 12*250 = 746713

Abstract1
Future Mobility Survey (FMS) is an innovative smartphone-based travel survey system, that was2field tested in 2012/2013 together with the Household Interview Travel Survey (HITS) in Singa-3pore. In this paper, we present findings of exploratory analysis of the data collected in this test.4Clustering of day patterns from FMS data reveals large day-to-day variability of user behavior,5which cannot be captured by taking a snapshot with a one-day survey. We show that even if we6take advantage of cross-sectional variability of a larger sample size from a traditional survey, we7would not have achieved the comprehensive set of heterogeneous patterns as provided by FMS.8Some common problems in traditional surveys, such as under-reporting of trips, over-estimation9of travel times, in accuracy of location and time, can be significantly reduced by FMS. The FMS10data, as compared to HITS, has higher resolution and better accuracy. In addition, FMS is well-11suited to collect multi-day data as additional cost is marginal and user burden reduces over time.12Therefore, it is a promising technology for next generation travel data collection.13

1 INTRODUCTION1The unprecedented and increasing penetration rate of smartphones together with advances in mo-2bile sensing technology have greatly expanded the means of collecting various forms of personal3transportation data. While traditional self-reported travel surveys typically suffer from problems4such as limited sample size, the under-reporting of total completed trips, an imprecision of trip5start and end times (1), smartphone based surveys present the opportunity to collect more detailed6and precise data needed for emerging agent and activity-based behavioral models. Developments7in this field (2, 3) suggest that location-enabled technologies can reduce the number of erroneous8“no travel" days and missed trips; improve accuracy of reported trip times, locations and paths;9and reduce respondent burden.10
The usage of mobile technologies for automatic surveying is not new. GPS-based log-11ging surveys have been widely implemented worldwide and largely successful as a supplement to12household travel surveys (4, 5, 6, 7). However, pure GPS logging suffers from some limitations.13Financially, the agencies conducting travel surveys are required to purchase and distribute the GPS14collection devices, which can be a significant investment. Also, the participants may forget to carry15the GPS loggers with them for the duration of the travel survey, and they will face a recollection16problem when completing their travel diary. In contrast, smartphones provide some clear benefits.17For instance, users are accustomed to carrying their phones with them constantly and as such, there18is a decreased likelihood of missing trips. They are almost always charged, and smartphones con-19tain a combination of sensors not limited to positioning data. The sensors are capable of providing20spatial, temporal and proximity data, which can be used to infer activity and mode information.21These attributes make smartphones ideal “life-loggers".22
To capitalize on these "life-loggers", our team has developed the Future Mobility Sur-23vey (FMS) system, which is a smartphone and web prompted-recall based travel survey system24(8). The FMS is a next-generation travel behaviour survey system that leverages pervasive smart-25phones, advanced sensing and communication technologies and machine learning architecture. It26delivers previously unobtainable range of data reflecting what people do, not what they say they27do. We field tested FMS in Singapore in conjunction with Singapore Land Transport Authority’s28(LTA’s) Household Interview Travel Survey (HITS) 2012. The test recruited more than 1500 users29and produced a large set of rich and detailed travel/activity data that has been validated by the30respondents (9). In this paper, we present results on the exploratory analysis of this unique dataset,31and demonstrate the capabilities of this kind of survey platform to reveal interesting and diverse32user day patterns and overcome some of the known issues of traditional travel surveys.33
The remaining part of this paper is organised as follows. Section 2 gives an overview of34the FMS system. Section 3 describes the field test with the HITS survey in Singapore and data35collected. We then present an example to illustrate the difference between the data collected in36HITS and FMS in Section 4. Exploratory analysis results are presented in Section 5 followed by37conclusions and future work in Section 6.38
2 FMS SYSTEM39FMS consists of three seperate but inter-connected components - the smartphone app that collects40the sensing data; the server that includes the database as well as the data processing and learning41algorithms; and the web interface that users access to view and validate the processed data and42
1
FIGURE 1 FMS architecture
respond to additional questions to supplement the validated data. The three components and the1flows of data among them are shown in Figure 1.2
Smartphone app3The smartphone app, available for both Android and iOS platforms, collects data from a multitude4of sensors available on the phones including GPS, GSM, accelerometer and WiFi. One of the5main objectives of the FMS app design is non-intrusiveness, i.e., the app runs in the background6of the phone and silently collects the sensor data without user intervention. Participants would7therefore not be influenced in anyway by the application during their normal daily activities. In8addition, the application is designed to be light-weight and easy to use. A major concern for9location based applications is battery consumption, and we have made various efforts to minimize10battery consumption (10). The sensor data collected on the phone are transferred to the back-end11server through either the cellular network or WiFi, based on the user’s preference.12
Backend server13Raw data collected via the app are uploaded to a database where a series of algorithms are used14to process the data and make inferences about stops, travel modes and non-travel activities (11).15To minimize the user’s interaction burden, the backend algorithms translate raw data into trips and16activities. The first round of stop detection is made based on location and point-of-interest (POI)17data. GSM, WiFi and accelerometer information are used to merge stops that would otherwise be18interpreted as distinct stops. Travel modes are detected based on GPS and accelerometer features,19as well as public transit location information. Short duration stops that are insignificant from a data20validation standpoint (such as stops in traffic or at bus stops or subway stations during their ride)21are deleted for the purposes of presentation in the web interface. Non-travel activities (e.g. home,22work, shopping, dropoff) are also detected based on previous validations by the user, POI data and23other contextual information.24
Web-interface25The web interface provides a platform that enables users to review their processed data in the form26of a daily timeline or activity diary and “validate" their data for a limited number of days (Figure27
2

FIGURE 2 FMS web-interface – activity diary
2). Validation involves filling in missing information and amending incorrectly inferred data about1modes of travel used for particular trips, and specific activities engaged in at locations deemed2to be non-travel time segments or “stops". The validated data are uploaded and the algorithms3learn to make better inferences as the user interacts with the interface. The website also is flexibly4designed to enable supplementary data to be collected from users. Supplemental data pertaining5to a specific trip (e.g. how many people the user traveled with or what, if any, fee was paid for6parking) are collected within the activity diary validation stage. A helpdesk was available for7users to interact with through chat or phone call and users are encouraged to have a session with a8helpdesk representative for assistance during their first data validation.9
3 FMS FIELD TEST10Between October 2012 and September 2013, we field tested FMS together with Singapore LTA’s11HITS 2012 survey. HITS is a paper based survey conducted within Singapore every four or five12years. The survey collects activity and mobility data for a typical weekday (Monday to Friday)13for an individual. It also collects the socio-demographic characteristics of the households, and14the individuals. The data is collected through face to face interviews. A local subcontractor is15responsible for the recruitment and interviewing of participants. The format of the survey follows16the standard trip diary-based approach. Travel was defined as a one way journey completed for a17purpose. The survey includes walk segments taken as part of a trip (e.g. walking to a bus stop),18and walking trips before or after a trip with at least one motorized mode (e.g. walking to work,19
3

FIGURE 3 Age distribution of FMS users and Singapore population.
and leaving work using a taxi). Walk-only trips are recorded if they are longer than 10 minutes.1Furthermore, the sample size of this survey is targeted for roughly 10,500 households. This is2about 1% compared to the total household number Singapore, which is roughly 1 million. The3HITS 2012 follows a similar format, methodology, and objective to other metropolitan-wide travel4surveys found in the Metropolitan Travel Survey Archive (http://www.surveyarchive.org).5
The recruitment process for FMS piggybacked on that of HITS’. After a HITS interview,6the surveyor introduces and invites the participant to take part in FMS. Unlike in HITS, where7participants are required to register in complete households, FMS users can join as individuals.8This is to increase the participation rate in this first attempt of smartphone based travel survey.9An FMS participant is considered to have completed the FMS survey after collecting at least 1410days of data, and validating at least 5 days of them. In total, we have recruited 1,541 users, and11among them, 793 participants have completed the FMS survey. The total amount of data collected12is 22,170 user-days, and 7,856 of them are validated by the users.13
As the use of FMS requires ownership of a smartphone and familiarity with web-browsers,14it is expected that the FMS participants will have a bias towards younger population, which is15reflected in Figure 3. This issue can be rectified by distributing GPS loggers to users who do not16have smartphones, and also providing help (over the phone or in person) to validate for the users17who are less tech-savvy. These elements fits into the FMS methodology naturally, and do not18require additional development work. In addition, it has been noted in previous traditional travel19surveys that the response rates are generally lower in younger generations and it is relatively easier20to get good quality data from the elderly groups. Therefore, FMS would be a good complement to21traditional travel surveys to achieve a balanced overall sample.22
While smartphones are capable of collecting increasingly accurate data, it is still possible23that some geolocation points may be erroneous due to sensory errors and/or a limited sample24of points. For example, GPS location accuracy is reduced when participants travel indoors. In25addition, by closely examining the collected data, we find two main types of errors:26
1. Data gaps – Occurs when participants’ smartphones run low on battery power, user27
4
logs off from the app, or devices are turned off. Such scenarios have the possibility of1producing gaps in data (presenting non-continuous data). Although the users can recon-2struct their days fully despite these gaps by adding activities during their validations,3many users fail to do that properly, leading to incomplete days of data.4
2. Validation errors – Unlike in traditional surveys, where an interviewer is present to5perform some quality control while collecting the data, FMS’ web-based validation is6totally controlled by the user. Mistakes can happen especially when the user is unfamil-7iar with the interface.8
Throughout the test period, we continuously worked on adding real-time checks for the9collected and validated data, including maximum gaps in data to allow validation, ranges of travel10speed, activity duration, change of location as compared to collected raw data etc, in order to min-11imize the above errors. In addition, post-processing was performed to further clean the collected12data.13
4 AN ILLUSTRATIVE EXAMPLE14Before diving into the exploratory analysis, we first present a sample of HITS and FMS data15collected from the same user to highlight some of the properties of FMS data. The travel/activity16information of the user are presented in two formats. Firstly, on a map showing her stops, activities17at each stop, and her traces. And secondly, in a timeline below the map, which shows the times18associated with each activity.19
The HITS data (Figure 4 (a)) indicates that the user left home for work at around 7am and20returned home before 7pm. On both ways, she travelled by bus, and as HITS does not capture the21exact routes, we plot out all the likely bus routes between these two locations based on Google22Maps. One thing to note is that for both trips, the reported travel time are exactly the same, 3523minutes. In fact, we see many cases in HITS where users round the travel times to the nearest 524or 10 minute blocks, and there is a large spike in travel time of 60 minutes for bus trips. In this25example, the user reported a simple working day, and there is a lot of uncertainly in the data due26to lack of detailed information. In Figure 4(b), we see a much richer set of data for the same user27collected in FMS on four weekdays. In the first one, the user only worked half-day, and went out28for dinner in the evening. FMS captured the exact bus routes that the user took. On the second day,29although the activity sequence is the same as that in HITS (Home-Work-Home), we do see that the30work hour is very long, from around 7am in the morning all the way to past 9pm at night. Also, she31took two different buses to and from work, which took 18 minutes and 20 minutes, respectively.32In the third graph for FMS, the user did not go to work on this day. Instead, she went for some33sports activities in the morning, and social/meal activities in the afternoon. We observe yet another34day pattern in the fourth graph, where she goes shopping in the morning, and working in the35afternoon/evening. In fact, in these four days, none of her trips to or from work took more than 2036minutes. Of course, it might have been that, for the day she reported in HITS, the traffic condition37was exceptionally bad, but we believe it is reflective of the fact that people tend to over-estimate38travel times (5).39
From this example, we can observe some typical issues with traditional travel surveys, i.e.,40
• people tend to report a simple (typical) day;41
5

FIGURE 4 HITS and FMS data from one user on different days
• short activities are under-reported;1
• travel times are over-estimated for short trips; and2
6

• people have large day-to-day variabilities, which cannot be captured by a one-day survey.1
On the contrary, FMS is capable of collecting more detailed and accurate data, and capture the2variability in user’s travel/activity patterns. In the next section, we will examine the overall FMS3dataset in various ways to demonstrate these points in more details.4
5 DATA ANALYSIS5For the exploratory analysis, after post-processing and cleaning of the data, we selected a subset6of 319 users who have, on average, a larger number of validated days, which is useful for studying7the intra-user variability of travel/activity patterns. With a total number of 2350 days, we have on8average 10.5 validated days from each user.9
Clustering of user day patterns10To examine the day-to-day variability of user behaviour, we first perform clustering of FMS user11day patterns for the 233 employed participants (full-time or part-time). The day pattern is gener-12ated by dividing each day into 5-minute slots and assign to the slot the activity (including travel)13associated with it. This transforms each user day into a vector of 288 elements. Weighted cluster-14ing algorithm is used to group the day patterns into 5 clusters.15
Figure 5 shows the day patterns that belong to each cluster. Cluster 1 consists of working16days with lunch breaks in mid-day, and many non-work activities after work. Cluster 2 are days17that are mainly just working, with few other activities. Cluster 3 has shorter work hours and many18work-related activities. No work shows up in Cluster 4, but it has many non-work activities, likely19for weekends or off-days. Finally, Cluster 5 are days that are mainly spent at home or traveling.20As most errors in FMS data are related to data gaps, which can lead to excessive travel times (since21we mark all non-stop segments as traveling) or home activities (as we merge home stops before22and after a gap, assuming they are home all the time), many of the days with errors fall into Cluster235. The distribution of days of weeks in each of these clusters (Table 1) are consistent with our24expectation. Clusters 1, 2 and 3 are mostly on weekdays, where Cluster 4 is mainly on weekends.25Clusters 5 also has a higher concentration on weekends, but the day patterns with errors throughout26the week also contribute to the high number of days in this cluster.27
Clusters Monday Tuesday Wednesday Thursday Friday Saturday Sunday TotalCluster 1 113 110 112 121 94 26 11 587Cluster 2 86 89 85 85 66 14 9 434Cluster 3 17 28 28 33 20 7 6 139Cluster 4 39 38 48 28 52 145 132 482Cluster 5 95 88 83 90 94 106 137 693
TABLE 1 Breakdown of user days in each cluster and each day of week.
Next, we focus only on the weekdays, as HITS data are all for weekdays, and study the28variability in people’s day patterns. Figure 6 shows the number of users having different numbers29of distinct clusters of their day patterns during the week. Almost all users (97%) have at least two30clusters observed, and majority of them (73%) have at least three patterns. Traditional surveys,31
7

FIGURE 5 Results of clustering FMS user day patterns into 5 clusters (employed users).
like HITS, typically only take one or two days of samples, and are clearly insufficient to capture1the full patterns. We have also linked the day patterns generated by these 223 users’ HITS data2to the 5 clusters shown above, and 208 of them (93%) falls in Cluster 2 with simple work tours.3This agrees with our observation of the example in Section 4. In fact, none of the HITS days fall4in Cluster 1, highlighting the low reporting rates of out of work activities in HITS. This indicates5that, even if we took advantage of cross-sectional variability in HITS to overcome the single day6limitations, we would not achieve a comparable set of heterogeneous patterns as FMS provides.7
8
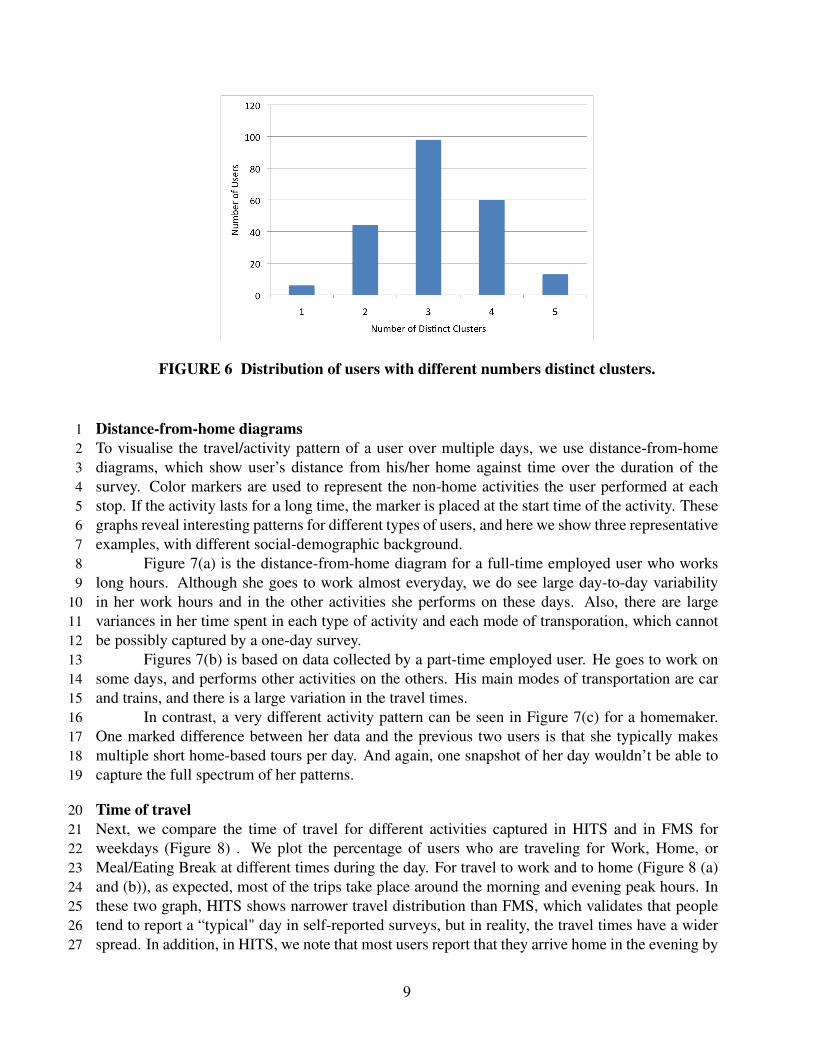
FIGURE 6 Distribution of users with different numbers distinct clusters.
Distance-from-home diagrams1To visualise the travel/activity pattern of a user over multiple days, we use distance-from-home2diagrams, which show user’s distance from his/her home against time over the duration of the3survey. Color markers are used to represent the non-home activities the user performed at each4stop. If the activity lasts for a long time, the marker is placed at the start time of the activity. These5graphs reveal interesting patterns for different types of users, and here we show three representative6examples, with different social-demographic background.7
Figure 7(a) is the distance-from-home diagram for a full-time employed user who works8long hours. Although she goes to work almost everyday, we do see large day-to-day variability9in her work hours and in the other activities she performs on these days. Also, there are large10variances in her time spent in each type of activity and each mode of transporation, which cannot11be possibly captured by a one-day survey.12
Figures 7(b) is based on data collected by a part-time employed user. He goes to work on13some days, and performs other activities on the others. His main modes of transportation are car14and trains, and there is a large variation in the travel times.15
In contrast, a very different activity pattern can be seen in Figure 7(c) for a homemaker.16One marked difference between her data and the previous two users is that she typically makes17multiple short home-based tours per day. And again, one snapshot of her day wouldn’t be able to18capture the full spectrum of her patterns.19
Time of travel20Next, we compare the time of travel for different activities captured in HITS and in FMS for21weekdays (Figure 8) . We plot the percentage of users who are traveling for Work, Home, or22Meal/Eating Break at different times during the day. For travel to work and to home (Figure 8 (a)23and (b)), as expected, most of the trips take place around the morning and evening peak hours. In24these two graph, HITS shows narrower travel distribution than FMS, which validates that people25tend to report a “typical" day in self-reported surveys, but in reality, the travel times have a wider26spread. In addition, in HITS, we note that most users report that they arrive home in the evening by27
9

8pm, but in fact, a significant portion of the users reach home after 9pm, indicating under-reporting1of activities towards the end of the day.2
Figure 8(c) shows the time of travel to Meal/Eating-Break activities. We see three clear3peaks in the FMS curve that corresponds to trips to breakfast, lunch and dinner. However, this4trend is not clear from HITS data. In fact, the lower values for the HITS curve indicate a much5smaller percentage of users reporting Meal/Eating Break activities in HITS. This is also reflected6in Table 2, which lists the top three purposes of home-based tours reported in HITS and FMS7for users of different employment status. For all categories of users, except those self-employed,8Meal/Eating Break activity is among their top three purposes in FMS. In contrast, this activity only9appears once in the list on the left for HITS. This agrees with the observation that short trips tend to10be under-reported in self-reported travel surveys. On the other hand, the rank of Pick-up/Drop-off11activities appears to be lower in FMS. This is the due to the fact that these activities may have12very short durations, and the modes of transportation before and after the stops are typically the13same. When this kind of stops are detected in FMS, they are normally deleted in order to reduce14the erroneous detection of “stops" related to traffic lights or traffic jam. The detection accuracy15will improve in this aspect when we incorporate more Points of Interest (POI) information of the16underlying map, and also learn from users’ past validations.17
HITS FMS
Employed Full-timeWork WorkPick-up/Drop-off Meal/Eating BreakWork-related Personal Errand
Employed Part-timeWork WorkPick-up/Drop-off Meal/Eating BreakShopping Personal Errand
Self-employedWork-related WorkWork Personal ErrandPick-up/Drop-off Shopping
HomemakerPick-up/Drop-off Meal/Eating BreakShopping ShoppingMeal/Eating Break Personal
Full-time studentEducation EducationShopping WorkWork Meal/Eating Break
RetiredOther’s Home Meal/Eating BreakPick-up/Drop-off Personal ErrandSocial Recreation
TABLE 2 Top three purposes of home-based tours.
Travel time by mode18As the analysis of travel time is more sensitive to errors in our collected data, we have selected a19subset of 1100 days from the 319 users, and manually checked them to ensure data quality. This20dataset is used in this and the next subsection.21
10

Figure 9 compares the histograms of travel times by car in HITS and FMS. While the1distribution of travel time in FMS is smooth and continuous, the HITS graph is more rugged, with2spikes at 20 minutes, 30 minutes, and 60 minutes. As we know, survey participants tend to round3their travel time estimations. The resulting data may not reflect the true shape of distribution of4the travel times, and can create difficulty when used in modelling. FMS avoids this problem by5deriving the real “continuous" travel times from sensory data. Another observation is that the6average travel times recorded in FMS is lower than that in HITS, which again shows that people’s7perception of travel travel times tends to be longer than reality, as we mentioned in Section 4.8For other modes of transportation such as bus or train, we observe similar issues in HITS data.9However, the definition of trip time in FMS and HITS are not entirely consistent for these modes,10and thus, we do not present the comparisons here. Specifically, for public transport, HITS trip time11is the door-to-door time from origin to destination, which includes access time, waiting time, egress12time etc. On the other hand, FMS’ data separates each leg of the trip and change mode/transfer13stops. Thus, direct comparison of travel times of these modes between the two surveys is not14straightforward.15
Figure 10 is the box plots of travel times for each mode in FMS. The box shows the range of16values between the first and third quantile, while the top and bottom whiskers represent 1.5× IQR17(Inter-Quantile Range) from the upper and lower quantiles, respectively. We see that, on average,18trips by train (MRT/LRT) are the longest, and those by foot or bicycle are the shortest. Also, a19significant number of walk trips are recorded in FMS, which are not registered in HITS.20
6 CONCLUSIONS AND FUTURE DIRECTIONS21Exploratory analysis of the data collected by FMS in Singapore demonstrates that FMS is capa-22ble of producing accurate, detailed, and rich data for travel surveys. It senses what people do,23rather than asking them to report what they do. This eliminates many problems that traditional24self-reported surveys face, such as under-reporting of short trips, inaccuracy in location and times,25and reporting of a typical day rather than the actual day. Also, large intra-user day-to-day variabil-26ities in the travel/activity patterns have been observed across different types of users, and taking27a snapshot by a one day survey is inadequate to reflect the true patterns. An advantage of FMS28is that the marginal cost of collecting additional days of data is minimal, and as a user provides29validations (which our backend can learn from) and familiarizes with the web-interface, the partic-30ipation burden reduces significantly over time. Therefore, smartphone based travel surveys, such31as FMS, are viable and superior alternatives to traditional travel surveys.32
As mentioned previously, what we have collected in this field test of FMS is a unique, large,33and rich dataset on individual travel behaviour. Besides the exploratory analysis presented in this34paper, we plan to further analyze the data, especially in discovering and classifying user patterns35over multiple days, associating travel behaviour with other context information, such as weather,36events, incidents, etc. The authors are also implementing an analytical framework for comparing37the HITS and FMS sample presented in this paper through econometric modelling. This framework38features include: controlling the temporal effect (i.e. participants provide data for different days39for HITS and FMS); modelling the attrition rate (i.e. participants choose the number of days to40validate); panel periods (multiple days of data for FMS); and others.41
At the same time, we seek to enhance the capabilities of FMS system with two main goals:42
11
reducing user burden and improving data quality. Two key aspects of reducing user burden are bat-1tery consumption and user-friendliness/intuitiveness of the interface. To improve data quality, we2focus on using machine learning techniques based on context information and user history. These3two goals can have competing needs, and require careful consideration in design and development.4
ACKNOWLEDGEMENTS5The authors gratefully acknowledge Land Transport Authority of Singapore for their support and6help throughout this field test. This research was supported by the National Research Foundation7Singapore through the Singapore MIT Alliance for Research and Technology’s FM IRG research8programme.9
REFERENCES10[1] Chen, C., H. Gong, C. Lawson, and E. Bialostozky, Evaluating the feasibility of a passive11
travel survey collection in a complex urban environment: Lessons learned from the New12York city case study. Transportation Research Part A: Policy and Practice, Vol. 44, No. 10,132010, pp. 830–840.14
[2] Auld, J. and A. Mohammadian, Framework for the development of the agent-based dynamic15activity planning and travel scheduling (ADAPTS) model. Journal of Transportation Letters:16The International Journal of Transporation Research, Vol. 1, No. 3, 2009, pp. 245–255.17
[3] Bricka, S. and C. R. Bhat, Comparative analysis of global positioning system-based and travel18survey-based data. Transportation Research Record: Journal of the Transporation Research19Record, Vol. 1972, No. 1, 2006, pp. 9–20.20
[4] Bohte, W. and K. Maat, Deriving and validating trip purposes and travel modes for multi-21day gps-based travel surveys: A large-scale application in the Netherlands. Transportation22Research Part C: Emerging Technologies, Vol. 17, No. 3, 2009, pp. 285–297.23
[5] Stopher, P., C. FitzGerald, and M. Xu, Assessing the accuracy of the Sydney household travel24survey with GPS. Transporation, Vol. 34, No. 6, 2007, pp. 723–741.25
[6] Oliveira, M. G. S., P. Vovsha, J. Wolf, Y. Birotker, D. Givon, and J. Paasche, Global Posi-26tioning System-Assisted Prompted Recall Household Travel Survey to Support Development27of Advanced Travel Model in Jerusalem, Israel. Transportation Research Record: Journal of28the Transportation Research Board, Vol. 2246, 2011, pp. 16–23.29
[7] Stopher, P. and L. Wargelin, Conducting a household travel survey with GPS: reports on a30pilot study. In 12th World Congress on Transport Research, Lisbon, Portugal, 2010.31
[8] Cottrill, C., F. C. Pereira, F. Zhao, D. Ines, H. B. Lim, M. Ben-Akiva, and C. C. Zegras, Future32Mobility Survey: Experience in developing a smartphone-based travel survey in Singapore.33Transportation Research Record: Journal of the Transporation Research Record, Vol. 2354,342013, pp. 59–67.35
12

[9] Carrion, C., F. C. Pereira, R. Ball, F. Zhao, Y. Kim, K. Nawaranthne, N. Zheng, M. Ben-1Akiva, and C. C. Zegras, Evaluating FMS: a preliminary comparison with a traditional travel2survey. In Transporation Research Board 93rd Annual Meeting, 2014.3
[10] Nawaranthne, K., F. Zhao, F. C. Pereira, C. C. Zegras, and M. Ben-Akiva, The impact of GPS4based outdoor activity detection on smartphone battery life. In 10th International Conference5on Transport Survey Methods, Australia, 2014.6
[11] Zhao, F., A. Ghorpade, F. C. Pereira, C. C. Zegras, and M. Ben-Akiva, Stop detection7in smartphone-based travel surveys. In 10th International Conference on Transport Survey8Methods, Australia, 2014.9
13

FIGURE 7 Distance-from-home diagram for (a) a full-time employed user who works longhours; (b) a part-time employed user; and (c) a homemaker
14

FIGURE 8 Percentage of participants traveling to (a) Work, (b) Home, (c) Meal/EatingBreak at different times of day.
FIGURE 9 Histogram of trip times by car for HITS and FMS.
15
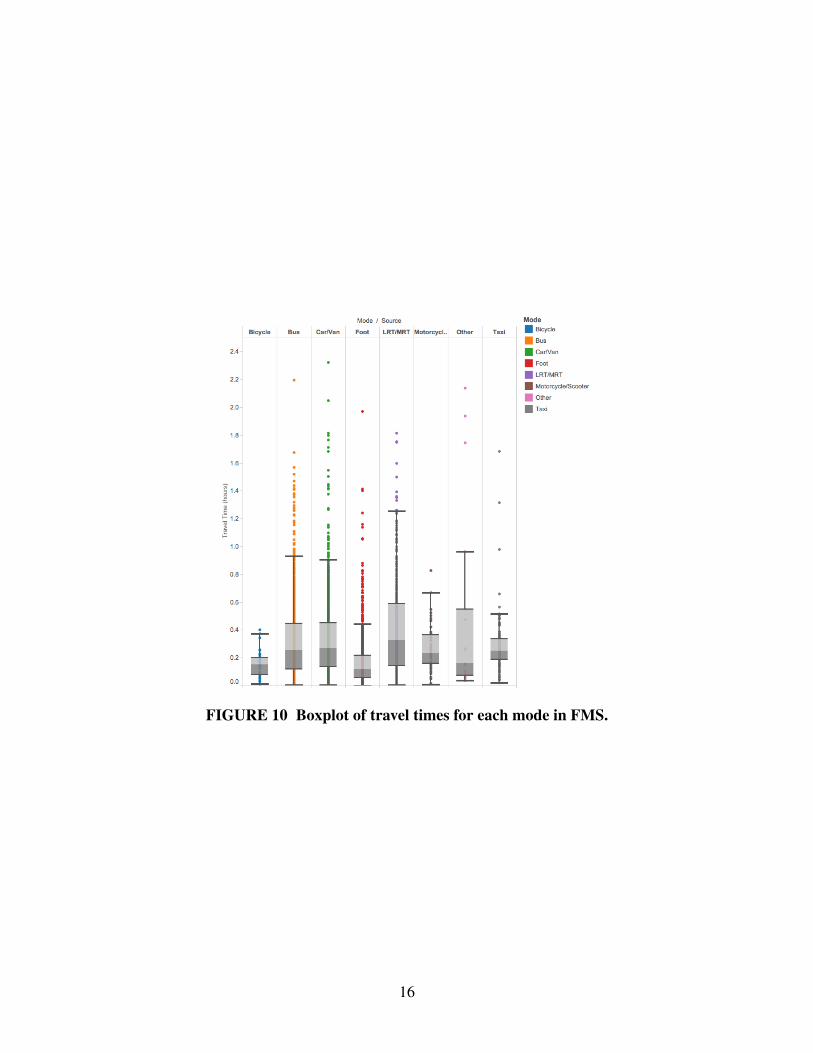
FIGURE 10 Boxplot of travel times for each mode in FMS.
16