Embed Size (px)
Citation preview

1
Exploratory Data Analysis
Maneesh Agrawala
CS 448B: Visualization Fall 2017
Assignment 2: Exploratory Data Analysis Use Tableau to formulate & answer questions First steps
■ Step 1: Pick a domain ■ Step 2: Pose questions ■ Step 3: Find data ■ Iterate
Create visualizations ■ Interact with data ■ Question will evolve ■ Tableau
Make notebook
■ Keep record of all steps you took to answer the questions
Due before class on Oct 16, 2017

2
Exploratory Data Analysis
The Future of Data Analysis, John W. Tukey 1962

3
The last few decades have seen the rise of formal theories of statistics, "legitimizing" variation by confining it by assumption to random sampling, often assumed to involve tightly specified distributions, and restoring the appearance of security by emphasizing narrowly optimized techniques and claiming to make statements with "known" probabilities of error.
The Future of Data Analysis, John W. Tukey 1962
While some of the influences of statistical theory on data analysis have been helpful, others have not.
The Future of Data Analysis, John W. Tukey 1962

4
Exposure, the effective laying open of the data to display the unanticipated, is to us a major portion of data analysis. Formal statistics has given almost no guidance to exposure; indeed, it is not clear how the informality and flexibility appropriate to the exploratory character of exposure can be fitted into any of the structures of formal statistics so far proposed.
The Future of Data Analysis, John W. Tukey 1962
Topics Data Diagnostics Effectiveness of antibiotics Confirmatory analysis Graphical Inference Intro to Tableau

5
Data Diagnostics

6
Data “Wrangling” One often needs to manipulate data prior to analysis. Tasks include reformatting, cleaning, quality assessment, and integration
Some approaches: Writing custom scripts Manual manipulation in spreadsheets Data Wrangler: http://vis.stanford.edu/wrangler Google Refine: http://code.google.com/p/google-refine
How to gauge the quality of a visualization?
“The first sign that a visualization is good is that it shows you a problem in your data… …every successful visualization that I've been involved with has had this stage where you realize, "Oh my God, this data is not what I thought it would be!" So already, you've discovered something.”
- Martin Wattenberg

7

8
Node-link
Matrix

9
Matrix
Visualize Friends by School? Berkeley ||||||||||||||||||||||||||||||| Cornell |||| Harvard ||||||||| Harvard University ||||||| Stanford |||||||||||||||||||| Stanford University |||||||||| UC Berkeley ||||||||||||||||||||| UC Davis |||||||||| University of California at Berkeley ||||||||||||||| University of California, Berkeley |||||||||||||||||| University of California, Davis |||

10
Data Quality & Usability Hurdles Missing Data no measurements, redacted, …? Erroneous Values misspelling, outliers, …? Type Conversion e.g., zip code to lat-lon Entity Resolution diff. values for the same thing? Data Integration effort/errors when combining data
LESSON: Anticipate problems with your data. Many research problems around these issues!
Exploratory Analysis: Effectiveness of Antibiotics

11
What questions might we ask?
The Data Set Genus of Bacteria String Species of Bacteria String Antibiotic Applied String Gram-Staining? Pos / Neg Min. Inhibitory Concent. (g) Number Collected prior to 1951

12
Will Burtin, 1951
How do the drugs compare?
How do the bacteria group with respect to antibiotic resistance?
Not a streptococcus! (realized ~30 yrs later)
Really a streptococcus! (realized ~20 yrs later)
Wainer & Lysen
American Scientist, 2009

13
How do the bacteria group w.r.t. resistance? Do different drugs correlate?
Wainer & Lysen
American Scientist, 2009
Lessons Exploratory Process
1 Construct graphics to address questions 2 Inspect “answer” and assess new questions 3 Repeat!
Transform the data appropriately (e.g., invert, log)
“Show data variation, not design variation”
-Tufte

14
Confirmatory Data Analysis
Some Uses of Formal Statistics What is the probability that the pattern I'm seeing
might have arisen by chance?
With what parameters does the data best fit a given function? What is the goodness of fit?
How well do one (or more) data variables predict another?
…and many others.
15
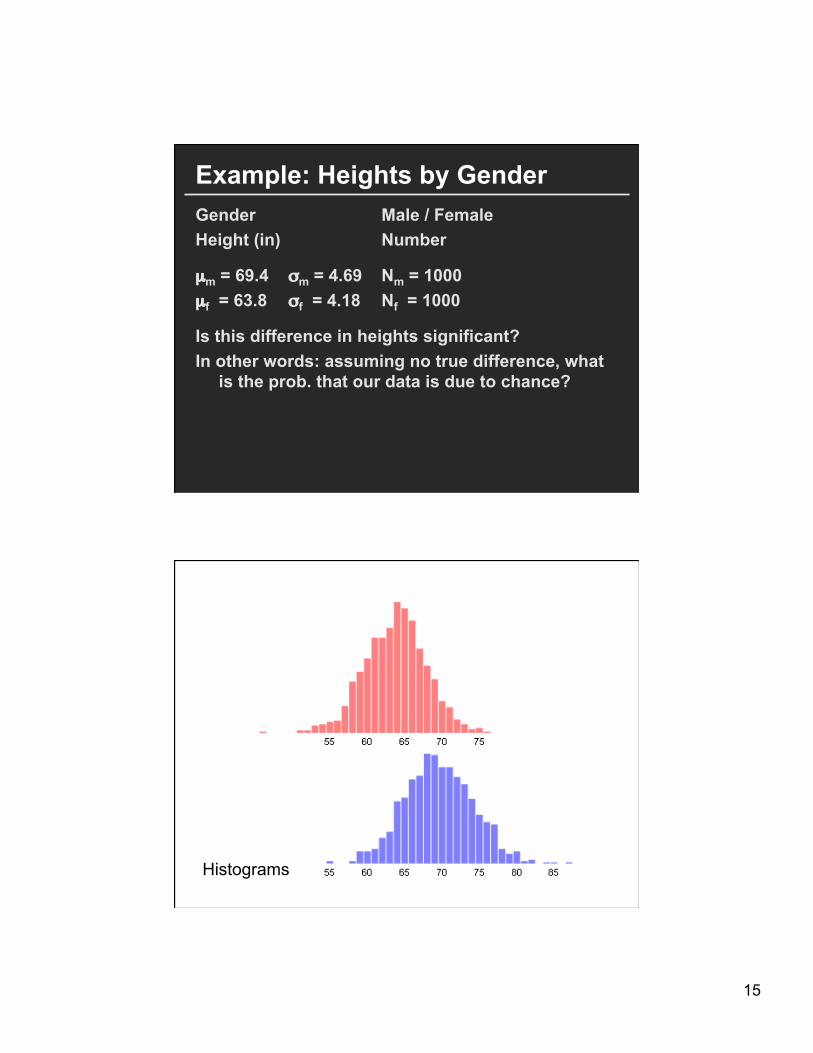
Example: Heights by Gender Gender Male / Female Height (in) Number
µm = 69.4 σm = 4.69 Nm = 1000 µf = 63.8 σf = 4.18 Nf = 1000
Is this difference in heights significant? In other words: assuming no true difference, what
is the prob. that our data is due to chance?
Histograms

16
Bihistogram
17
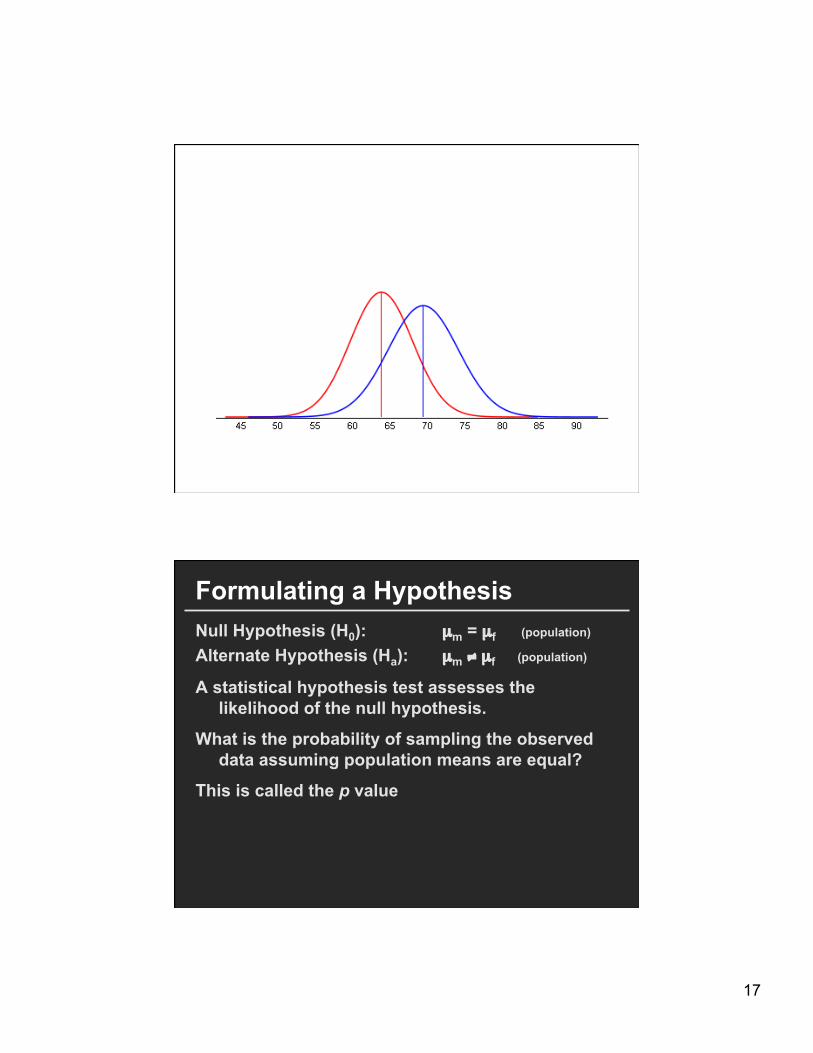
Formulating a Hypothesis Null Hypothesis (H0): µm = µf (population) Alternate Hypothesis (Ha): µm ≠ µf (population)
A statistical hypothesis test assesses the likelihood of the null hypothesis.
What is the probability of sampling the observed data assuming population means are equal?
This is called the p value

18
Testing Procedure Compute a test statistic. This is a number that in
essence summarizes the difference.
Compute test statistic
µm - µf = 5.6
µm - µf
√σ2m /Nm + σ2
f /Nf Z =

19
Testing Procedure Compute a test statistic. This is a number that in
essence summarizes the difference. The possible values of this statistic come from a
known probability distribution. According to this distribution, look up the
probability of seeing a value meeting or exceeding the test statistic. This is the p value.
Lookup probability of test statistic
95% of Probability Mass
-1.96 +1.96
Z > +1.96
Normal Distribution µ = 0, σ = 1 Z ~ N(0, 1)
p < 0.05
Z = .2
p > 0.05
20
Statistical Significance
The threshold at which we consider it safe (or reasonable?) to reject the null hypothesis.
If p < 0.05, we typically say that the observed effect or difference is statistically significant.
This means that there is a less than 5% chance that the observed data is due to chance.
Note that the choice of 0.05 is a somewhat arbitrary threshold (chosen by R. A. Fisher)
Graphical Inference Buja, Cook, Hoffman, Wickham et al.

21
Choropleth maps of cancer deaths in Texas.
One plot shows a real data sets. The others are simulated under the null hypothesis of spatial independence.
Can you spot the real data? If so, you have some evidence of spatial dependence in the data.
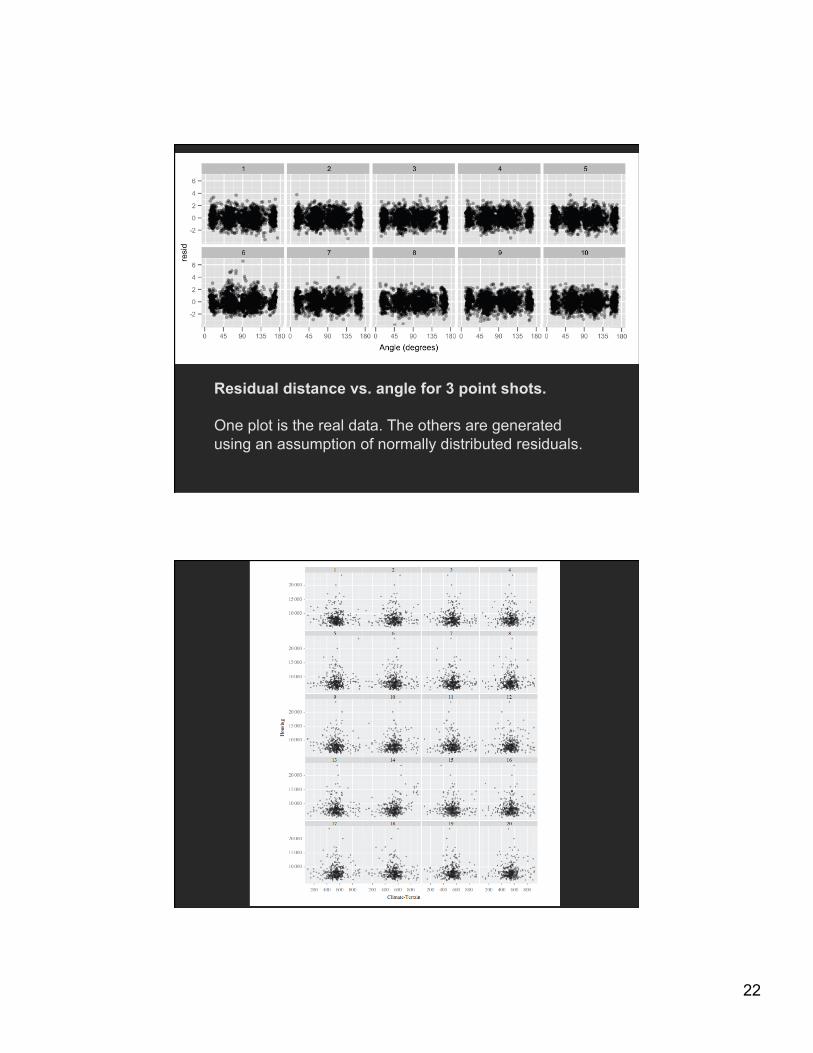
Distance vs. angle for 3 point shots by the LA Lakers.
One plot is the real data. The others are generated according to a null hypothesis of quadratic relationship.
22
Residual distance vs. angle for 3 point shots.
One plot is the real data. The others are generated using an assumption of normally distributed residuals.

23
Tableau / Polaris
Tableau Research at Stanford: “Polaris” by Stolte, Tang & Hanrahan.

24
Tableau
Data Display
Data Model
Encodings
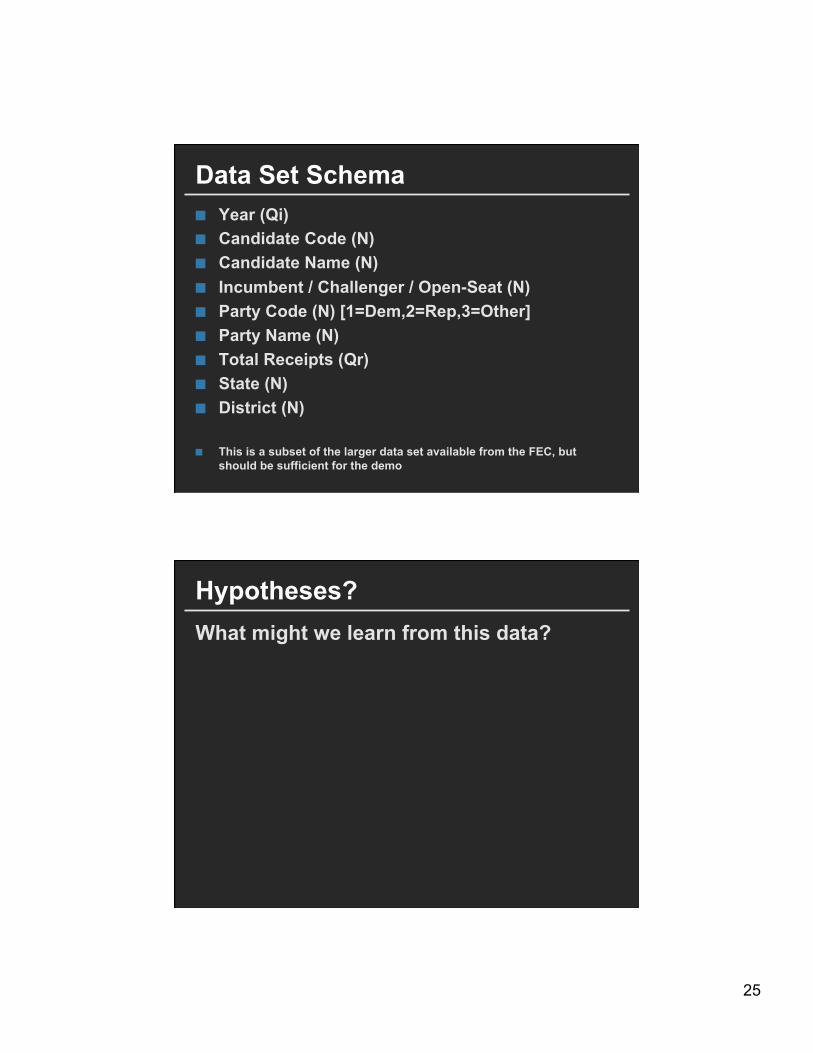
Tableau demo The dataset: ■ Federal Elections Commission Receipts ■ Every Congressional Candidate from 1996 to 2002 ■ 4 Election Cycles ■ 9216 Candidacies
25
Data Set Schema ■ Year (Qi) ■ Candidate Code (N) ■ Candidate Name (N) ■ Incumbent / Challenger / Open-Seat (N) ■ Party Code (N) [1=Dem,2=Rep,3=Other] ■ Party Name (N) ■ Total Receipts (Qr) ■ State (N) ■ District (N)
■ This is a subset of the larger data set available from the FEC, but should be sufficient for the demo
Hypotheses? What might we learn from this data?
26
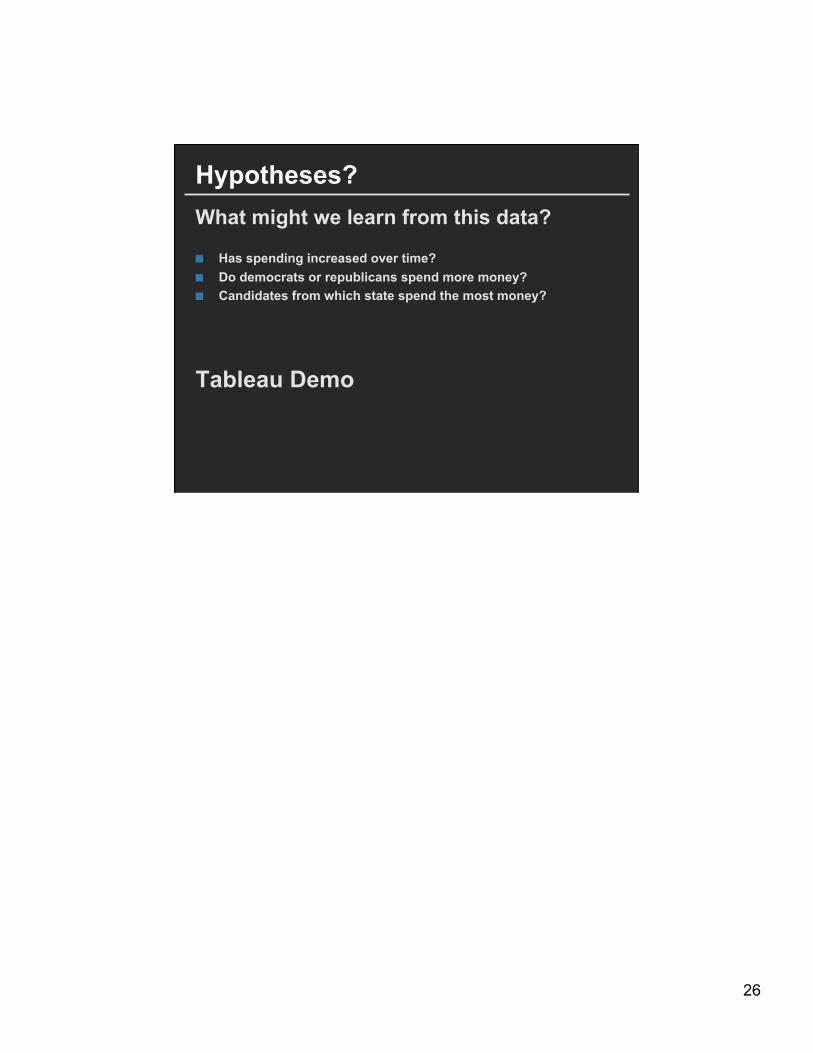
Hypotheses? What might we learn from this data?
■ Has spending increased over time? ■ Do democrats or republicans spend more money? ■ Candidates from which state spend the most money?
Tableau Demo

![COMP 333 Data Analytics [2ex] Exploratory Data Analysisusers.encs.concordia.ca/~gregb/home/PDF/comp333-eda.pdf · Exploratory Data Analysis Tukey 1977 book John Tukey (1977), Exploratory](https://img.pdfslide.net/doc/110x75/6014a0de4bad7c5bfa790925/comp-333-data-analytics-2ex-exploratory-data-gregbhomepdfcomp333-edapdf.jpg)