Embed Size (px)
Citation preview

University of South CarolinaScholar Commons
Theses and Dissertations
2017
Exploratory Modeling of Environmental andAnthropogenic Impacts on Mercury in Fish Tissuefor Select Watersheds in South CarolinaJulia McGuireUniversity of South Carolina
Follow this and additional works at: https://scholarcommons.sc.edu/etd
Part of the Environmental Studies Commons
This Open Access Dissertation is brought to you by Scholar Commons. It has been accepted for inclusion in Theses and Dissertations by an authorizedadministrator of Scholar Commons. For more information, please contact [email protected].
Recommended CitationMcGuire, J.(2017). Exploratory Modeling of Environmental and Anthropogenic Impacts on Mercury in Fish Tissue for Select Watersheds inSouth Carolina. (Doctoral dissertation). Retrieved from https://scholarcommons.sc.edu/etd/4432

EXPLORATORY MODELING OF ENVIRONMENTAL AND ANTHROPOGENIC
IMPACTS ON MERCURY IN FISH TISSUE FOR SELECT WATERSHEDS IN SOUTH
CAROLINA
by
Julia McGuire
Bachelor of Science
University of South Carolina, 2014
Submitted in Partial Fulfillment of the Requirements
For the Degree of Master of Earth and Environmental Resources Management in
Earth and Environmental Resources Management
College of Arts and Sciences
University of South Carolina
2017
Accepted by:
Gwen Geidel, Director of Thesis
Michael Bizimis, Reader
Dwayne Porter, Reader
Cheryl L. Addy, Vice Provost and Dean of the Graduate School

ii
© Copyright by Julia McGuire, 2017
All Rights Reserved.

iii
ABSTRACT
Fish tissue from various sampling locations in South Carolina rivers has shown
elevated levels of mercury (Hg). A number of variables may impact this Hg in fish tissue
and this study evaluated the impact of these variables using a predictive model. Over 341
variables were assembled from 6 different databases describing land use, water
chemistry, point source pollutants, watershed characteristics and more. One dataset
describes the location of historical gold mines throughout the sample site, which have
been shown to increase Hg in fish tissue in other locations. The variables were assembled
in ArcGIS to evaluate variable significance and to create a model inclusive of Hg in fish
data from 2005 to 2015.
The final version of the model (r2=0.84) showed predictable variation in mercury
in fish tissue based on longitude, precipitation, watershed area within a municipal storm
water sewage system, total kjeldahl nitrogen, and dam height, if any dams were present.
A better model could not be made with the addition of any variables describing historical
gold mines (r2=0.77) and therefore, this study does not find an interaction between
mercury in fish tissue and historical gold mines in select watersheds of South Carolina.

iv
TABLE OF CONTENTS
ABSTRACT: ......................................................................................................................... iii
LIST OF TABLES ....................................................................................................................v
LIST OF FIGURES ................................................................................................................. vi
CHAPTER 1: INTRODUCTION ..................................................................................................1
CHAPTER 2: METHODS ........................................................................................................11
CHAPTER 3: RESULTS ..........................................................................................................22
CHAPTER 4: DISCUSSION .....................................................................................................35
CHAPTER 5: SUMMARY AND CONCLUSION ..........................................................................43
REFERENCES .......................................................................................................................46
APPENDIX A – DATA SOURCE .............................................................................................51
APPENDIX B – VARIABLE EXPLANATION ............................................................................52
v
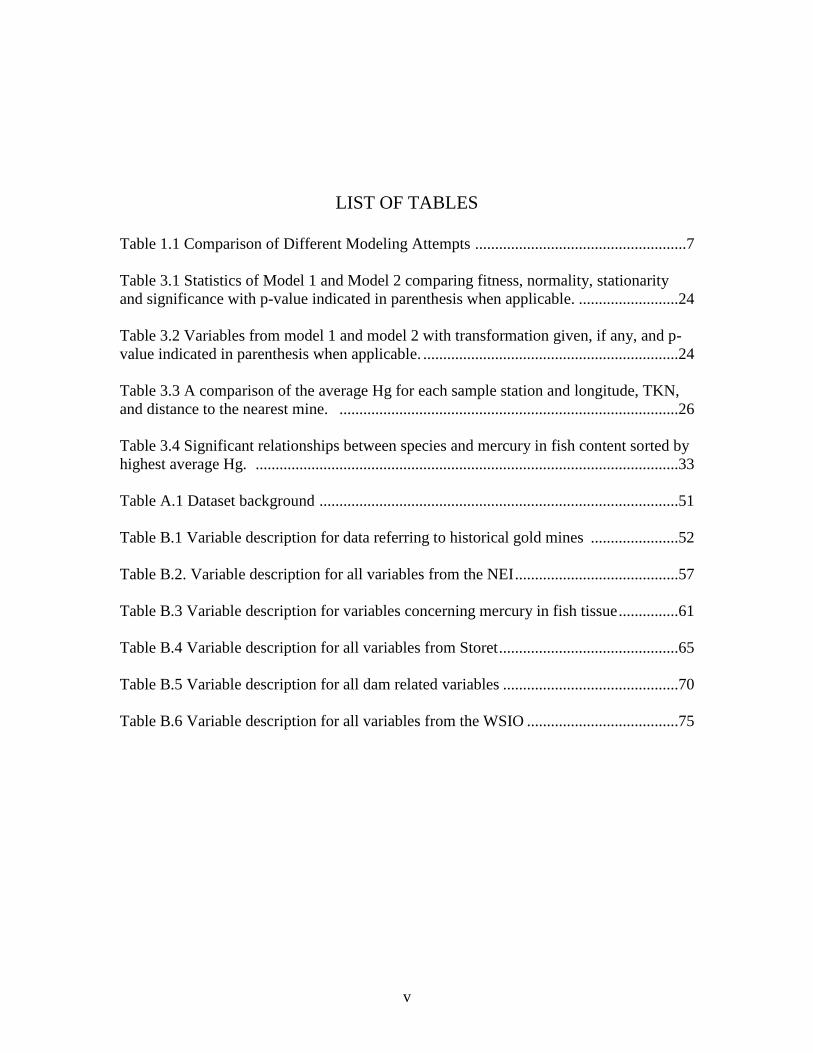
LIST OF TABLES
Table 1.1 Comparison of Different Modeling Attempts .....................................................7
Table 3.1 Statistics of Model 1 and Model 2 comparing fitness, normality, stationarity
and significance with p-value indicated in parenthesis when applicable. .........................24
Table 3.2 Variables from model 1 and model 2 with transformation given, if any, and p-
value indicated in parenthesis when applicable. ................................................................24
Table 3.3 A comparison of the average Hg for each sample station and longitude, TKN,
and distance to the nearest mine. .....................................................................................26
Table 3.4 Significant relationships between species and mercury in fish content sorted by
highest average Hg. ..........................................................................................................33
Table A.1 Dataset background ..........................................................................................51
Table B.1 Variable description for data referring to historical gold mines ......................52
Table B.2. Variable description for all variables from the NEI .........................................57
Table B.3 Variable description for variables concerning mercury in fish tissue ...............61
Table B.4 Variable description for all variables from Storet .............................................65
Table B.5 Variable description for all dam related variables ............................................70
Table B.6 Variable description for all variables from the WSIO ......................................75

vi
LIST OF FIGURES
Figure 2.1 River basins of South Carolina with HUC 12 boundaries ................................12
Figure 2.2 Location and station code of fish sampling stations in the sample site ............15
Figure 2.3 Location of both the fish sampling stations and historical gold mines ............17
Figure 2.4 Location of both the fish sampling stations and dams .....................................17
Figure 2.5 Location of both the fish sampling stations and pollution emission points .....18
Figure 3.1 Histograms of Before and After Box-Cox Transformations ............................22
Figure 3.2 Scatter plots of average Hg and select variables ..............................................25
Figure 3.3 The variation of percent area within an MS4 for HUC12 watersheds .............27
Figure 3.4 Variation across the sample area for average yearly precipitation ...................28
Figure 3.5 The variation of dam height across the sample area.........................................29
Figure 3.6 The number of individual fish samples for each fish sampling station ............30
Figure 3.7 The average mercury in fish tissue for each fish sampling station ...................30
Figure 3.8 The number of unique sampling dates per fish sampling station .....................31
Figure 3.9 The number and percentage of samples per each fish species .........................32
Figure 3.10 The percentage of caught for each fish sampling station ...............................34

1
CHAPTER 1
INTRODUCTION
Historic gold mining left behind a legacy of mercury (Hg) in the environment and
the dangers that this Hg presents to human health persists to this day (Nriagu 1994;
Strode, Jaeglé, and Selin 2009; Domagalski et al. 2016). Hg damages a number of
different organ systems but it is most toxic to the central nervous system (National
Research Council (U.S.) 2000). It is known to cause seizure disorders, increased risk of
heart attack, blindness, miscarriage, and death (National Research Council (U.S.) 2000).
Given this toxicity, there is significant research into its emission and subsequent
behavior in the environment. Locations with historical gold mining are associated with
increased Hg which can pose a threat to nearby human populations (Domagalski et al.
2016; Alpers et al. 2016; Lecce et al. 2011). Gold mining in the United States began in
the Carolinas and was only a seasonal activity for farmers (Botwick and Pope 2012). As
more gold was found, gold mining became a larger industry and it began to hire
specialized workers, machines and large sections of land. The gold could be extracted
from streambeds, called placer mining, or extracted from hard rock, called lode mining.
For placer mining, miners could use gravity to separate the gold from the lighter rock
(Botwick and Pope 2012). Lode mining could entail large open pits, a series of vertical
and horizontal tunnels, or both (Botwick and Pope 2012). Hydraulic mining was

2
introduced to South Carolina in the 1850s. It involved firing jets of water at the rock and
washing the gold particles into some collection apparatus.
Once the gold ore was extracted, it was processed to remove the waste rock. At
the beginning of the 19th century, South Carolina miners began to use Hg to aid in
separating the gold from the rock (Botwick and Pope 2012). Hg naturally combines with
small particles of gold to form an amalgam. To recover the gold, the amalgam would be
squeezed through a fine cloth or placed in a retort, where it would be heated until the
mercury evaporates, leaving behind gold ready for smelting (Botwick and Pope 2012;
Tuomey 1848).
The Hg for amalgamation came from mines in the US, mainly in California, with
a small amount imported from Spain. From 1850 to 1900, the average mercury
production in the US was 1290 tons per year while an average of 75 tons per year was
imported (Nriagu 1994). Overall, 1360 tons of mercury were used per year with 90% of
that Hg was dedicated to the recovery of gold and silver (Nriagu 1994). However, the
use of the Hg for gold and silver recovery resulted in enormous quantities of Hg escaping
into the environment. While previous research estimated that around 60% of Hg lost
became part of global Hg pollution (Nriagu 1994), new research estimates that closer to
30% ended up as global pollution and a large fraction remains in the local environment
(Strode, Jaeglé, and Selin 2009). After 1890, Hg use was significantly reduced due to the
introduction of the cyanidization process to refine gold and silver and by 1905
cyanidization had replaced Hg amalgamation as the primary method of gold processing.
When Hg amalgamation was used widely, there were several different devices
used to combine the Hg and gold. The common rocker, which strongly resembles a

3
child’s cradle, is one of the most rudimentary of these devices. The water, crushed rock,
and Hg are combined within and the rocker is shaken back and forth (Botwick and Pope
2012). This motion increases the gold to Hg contact and, as the dense gold and mercury
sinks, the waste rock is separated so that it can be thrown from the rocker (Tuomey
1848). During this process, Hg would be lost as it dissolves into the water, evaporates
away or is thrown off with the waste rock.
The Burke rocker looks like the common rocker but is more complex. It consists
of a rocker, an iron plate on top with small holes, a riffle box and a lever to make rocking
the apparatus easier. The additions of the iron plate and riffle box remove more waste
rock and result in double the amount of gold production (Tuomey 1848; Botwick and
Pope 2012). The Burke rocker releases Hg much like the common rocker, with Hg
flowing away in the water and evaporating.
Like the common rocker and the Burke rocker, the Chilian mill aims to bring as
much gold into contact with the Hg as possible but it is far more complex than either of
the rockers. The Chilian mill is similar to a mill stone but instead of crushing grain, it
crushes rock. Crushing the rock allowed the gold particles trapped inside of the host rock
to be released and, therefore, increase gold production (Botwick and Pope 2012).
Additionally, some mines added four millstones instead of one, a scraper to remove the
stone stuck to the sides of the trough, and a stream to carry off the fine particulate matter
(Tuomey 1848).
Like the common rocker and Burke rocker, the Chilian mill was not able to
completely retain the Hg. One report stated that “[s]ome care is requisite to regulate the
quantity admitted and the velocity of the wheels. [...] Notwithstanding this, I have rarely

4
examined the water, as it escapes from the riffle, without finding both mercury and gold”
(Tuomey 1848). Once again, Hg is lost as it washes away or evaporates. Any attempts to
contain it were financially motivated, not spurred by knowledge of Hg’s toxicity. In fact,
Hg was thought to be restorative and was often used in medicines during this time
(Hirschhorn, Feldman, and Greaves 2001; Clarkson and Magos 2006).
The Hg released by the gold processing either remained in the local environment
as a hotspot of pollution or becomes part of a complex biogeochemical cycle (Selin
2009). The cycle consists, in part, of evaporation and deposition back and forth from the
atmosphere, the sediment, and the water. The mechanisms controlling this cycle are still
being researched but they are known to have caused a baseline level of global mercury
pollution which has reached even remote sediments (Fitzgerald et al. 1998). One study
found that Hg in sediments increased threefold from 1760 to 1880 (Amos et al. 2015).
In addition to global mercury pollution, there are still increased Hg concentrations
in sediment and water near the historical mine sites. In North Carolina, Lecce et al.
(2011) found that low levels of Hg contamination were found downstream of all
historical gold mines sampled. Similarly, Domagalski et al. (2016) found that streams
with a history of gold or silver mining had more Hg within the sediment that flowed out
of the stream than would have entered through atmospheric deposition. Large watersheds
were a notable exception due to their sediment-trapping dams.
Once in the environment, Hg can be transformed into methylmercury (MeHg)
through a biotically mediated process. MeHg is known to cause damage to the central
nervous system and cardiovascular system (Clarkson and Magos 2006). Fetuses are
harmed at lower doses, with one South Carolina study finding low birth weight and

5
increased instances of pre-term birth at low levels of exposure (Burch et al. 2014).
Another study attempted to model Hg methylation and found positive associations with
increased microbial activity, nutrient availability, temperature and anaerobic conditions
are increased (Ullrich, Tanton, and Abdrashitova 2001). Organic matter, organic carbon,
sulfate, and iron all affect MeHg production but their impact varies which makes
predicting large-scale methylation trends difficult (Ullrich, Tanton, and Abdrashitova
2001; Hammerschmidt and Fitzgerald 2004). Additionally, MeHg can be demethylated
through biological activity and, after enough degradation, can be demethylated
photochemically (Hammerschmidt and Fitzgerald 2004, 2010).
MeHg is made more dangerous by its ability to bioaccumulate. In humans, 95%
of MeHg from a given sample is absorbed through the gastrointestinal tract while little is
expelled from the entire body (National Research Council (U.S.) 2000; Mergler et al.
2007). Without the ability to expel MeHg, organisms concentrate it in their bodies and
further concentrate it up the trophic levels. A good example of bioaccumulation can be
found in fish, which are the most common source of MeHg to humans (SCDHEC 2010,
2017; National Research Council (U.S.) 2000). Piscivorous fish have much higher levels
of MeHg because they concentrate the MeHg from each fish they consume. In general,
fish with higher trophic levels have greater concentrations of MeHg than those with
lower trophic levels. To reduce public exposure, the United States issues fish
consumption advisories which outline the number and type of fish which, when
consumed, may cause health risks (SCDHEC 2017, 2010).
Many studies have predicted Hg in fish tissue with the goal of supporting fish
consumption advisories, predicating trends, and generally reducing exposure. Table 1.1

6
shows a summary of several papers, including study location and variables found to
effect MeHg in fish tissue. Several trends become apparent. There are two main types of
variables: those which describe the fish and those which describe the surrounding
environment.
For example, Porvari (1998) examined the effects of land use by showing the
connection between reservoir age and mercury in select fish species including burbot,
perch, northern pike, roach, whitefish, and peled. The study modeled Hg in weight
standardized fish as a result of pH, organic matter in the water, reservoir age, and water
level regulation. Overall, Hg was higher in fish in the reservoirs than in natural lakes with
some samples exceeding the upper limit of mercury consumption by humans. Younger
reservoirs showed the highest Hg concentrations and did not return to baseline levels
until 15 to 20 years after initial impoundment.
In the Amazon River in South America, Da Silva, Lucotte and Davidson (2009)
examined how fish diet, fishing activities, land use, and different environmental
characteristics affect Hg contamination in fish. In this area, the original Hg could come
from atmospheric deposition, local historical or current mining operations, or other local
anthropogenic sources of Hg deposition (Nriagu 1994; Ribeiro et al. 2017). Habitats with
high aquatic vegetation cover and low forest cover had the highest Hg concentrations in
fish. The study showed that simple models can predict Hg in fish and draw conclusions
about the surrounding environment. In this study, the combination of suspended
particulate matter (SPM) load, Hg in SPM, and habitat type created an accurate predictor
of Hg in fish.

7
Table 1.1 Comparison of Different Modeling Attempts.
Citation Location Variables Used
Alpers et al.
2016
Sierra Nevada,
California, US
Elevation, land development, amount of forest,
amount of wetland, gold mine density, soil pH,
population density, composition of the sediment,
fish length and species.
Bosch et al.
2016
South Africa Muscle tissue type and fish weight
Da Silva,
Lucotte and
Davidson 2009
Tapajos River
basin, Amazon,
South America
Lotic or lentic habitats, fish diets, seasons,
sampling sites, suspended particulate matter
(SPM) load and SMP Hg concentrations, number
of inhabitants, habitat types, land use, vegetation
Depew,
Burgess and
Campbell
2013
Canada Fish size, species, trophic level, location and cut.
Guentzel 2008 South Carolina,
US
The percentage of land classified as a wetland in
a watershed
Glover et al.
2010
South Carolina,
US
Length, ecoregion, water body type, fish diet,
land use, water chemistry; water column iron,
total organic carbon, ammonia, total kjeldahl
nitrogen; alkalinity, dissolved oxygen, pH,
Porvari 1998 Finland Reservoir age, pH, organic matter in water,
extent of water level regulation, weight
standardized.
Connecting both gold mining and Hg modeling, Alpers et al. (2016) predicted Hg
in fish in the Sierra Nevada mountain streams of California using land use, the density of
historic gold mines, fish species, and fish length. Other important variables used include
MeHg concentration in sediment, organic content and grain size of the sediment. The

8
model provides predictions of fish Hg where sampling would not be feasible and, in this
area, historical gold mines have a significant impact on the amount of MeHg present in
contemporary fish tissue
Bosch et al. (2016) collected Yellowfin tuna off the coast of South Africa and
found that dark muscle contained more mercury than white muscle. This study also could
predict the amount of MeHg present in tissue based on the size of the fish and total
mercury present. This has an obvious connect to human risk and fish consumption
advisories since eating different cuts of the fish would result in the uptake of different
amounts of Hg.
Examining the state of South Carolina, Glover et al. (2010) analyzed mercury in
fish tissue collected by DHEC. They found differences based on species, fish length, land
use, water chemistry, water body type, and region. Within waterbody type, large
reservoirs had less mercury in fish tissue on average than small reservoirs.
Also in South Carolina, Guentzel (2009) examined Hg in sediments and found
that it increased from west to east and was significantly correlated to total organic carbon.
This suggests that Hg is associated with organic matter throughout the state. Additionally,
Hg in largemouth bass (Micropterus salmonides) was associated with the area of
wetlands within a watershed.
Depew, Burgess and Campbell (2013) studied Hg in fish in the water bodies of
Canada in order to find a common indicator of dietary MeHg. Using the National
Description Model for Mercury in Fish (NDMMF), they showed an increase from the
west to the east, which was attributed to anthropogenic sulfate deposition and watershed
characteristics known to increase MeHg uptake in the eastern portion of the country. The

9
NDMMF is available through the Environmental Mercury Mapping, Modeling and
Analysis (EMMMA) website designed by the USGS and the National Institute of
Environmental Health Services (Hearn et al. 2006). As of July 2017, EMMMA is not
available during its move to a new server. The NDMMF uses fish size, species, and cut to
predict fish mercury based on the National List of Fish and Wildlife Advisories
(NLFWA) data.
Overall, these studies show that Hg in fish follows patterns which may be
modeled. They rely on the underlying principles which effect mercury, MeHg, and
bioaccumulation. For example, fish size, which appeared in many studies, is related to the
age of the fish and how long it has been consuming MeHg within its food source. While
the connection between other variables and MeHg in fish many not be so clear, they
describe some aspect of the path from mercury to fish.
Given that Hg in fish can be modeled and that historical gold mines in South
Carolina may impact the current levels of Hg in fish, this study will create a model in
ArcGIS to evaluate variable significance through a model inclusive of Hg in fish data
from 2005 to 2015. In addition to historical gold mining, this model will include Hg point
source pollutants, land use information, Hg in sediment, and more with the goal of
accounting for other sources of variation in the model. Other works, including the studies
in Table 1.1, provided the basis for data collection and statistical analysis will choose the
relevant variables to create the most accurate model. Should the variables concerning
historical gold mining prove relevant to the overall model, this study will conclude that
historical gold mining does have an impact on mercury in fish tissue. Once relevance is

10
determined, this study shall discuss each variable in turn, the spatial trends, and possible
explanations for the behavior of Hg in fish tissue seen in the model.

11
CHAPTER 2
METHODS
2.1 Introduction
The methods shown here aim to model mercury (Hg) concentrations in fish as a
result of historical gold mines, Hg point source pollutants, land use information, Hg in
sediment, and more. The model shall examine the Broad, Catawba, and Saluda River
basins within the Piedmont of South Carolina, which have a history of gold mining.
ArcGIS will be used to gather the individual datasets and create the model. Appropriate
statistical analysis will determine the relative importance of each variables and create the
best possible model. See Appendix A for more data on the various data sources and see
Appendix B for a description of each variable included at any point during the modeling.
2.2 Sample Area Description
South Carolina has eight major river basins: the Savannah, Broad, Catawba, Pee
Dee, Santee, Edisto, Saluda, and Salkehatchie. Figure 2.1 shows the relative locations of
each river basin within the state (USEPA 2017; SCDHEC 2017a). Overall in South
Carolina, Hg in fish tissue increases from west to east and is significantly correlated with
fish diet, land use, size, water body type, and region (Glover et al. 2010; Guentzel 2009).
Only the Saluda, Broad, and Catawba will be covered due to their combination of mining

12
history and fish sampling locations.
The Broad River basin encompasses 3,800 square miles of land from the border
with North Carolina to the city of Columbia (SCDNR 2013). Though it begins in North
Carolina, only the South Carolina portion is included in this study. In addition to its
namesake river, the river basin contains its three main tributaries- the Pacolet, Tyger and
Enoree Rivers- as well as many small creeks, lakes, and reservoirs for hydroelectric
power, municipal water supply, and other uses (SCDNR 2013).
Figure 2.1 The river basins of South Carolina with HUC 12 boundaries
The Saluda River basin is the south of the Broad River basin and contains 3,210
square miles of land (SCDNR 2013). Its namesake river flows through the middle of the
basin then connects to the Broad River to form the Congaree River (SCDNR 2013). In
1978, a portion of the Saluda River was protected under the Scenic Rivers Program,

13
making it the first river protected thus in South Carolina (SCDNR 2017). This river basin
contains large man-made reservoirs including Lake Murray and Lake Greenwood.
The Catawba River basin is the smallest of the three basins at 2,315 squares miles
(SCDNR 2013). While this river basin begins in Lake Wylie in North Carolina and flows
into South Carolina, ending when the Wateree River meets the Congaree, only the South
Carolina portion of the watershed is included in this study. The Catawba River basin
contains the Catawba River at it flows into the Wateree Lake. As the Catawba River
flows out of the Wateree Lake, it is regarded as the Wateree River. The Catawba-Wateree
River is heavily regulated with several hydroelectric reservoirs. The Catawba-Wateree
River is fed by several creeks including Fishing Creek, Rocky Creek and Big Wateree
Creek.
When studying watersheds, land is divided up into hydrological units based on the
flow of water within the area. Each unit has a unique hydrological unit code (HUC)
(USGS 2017). Regions are the largest hydrological unit. They are denoted by a two-digit
HUC and divide the conterminous US into 18 different sections (USGS 2017). The next
smallest unit is subregions which are nested into the regions. They receive the two digits
of their larger region and then two unique digits of their own. In that way, similar
geological regions have similar codes. After subregions, there are basins, subbasins,
watersheds and subwatersheds. Every level receives their own two digits to add onto the
previous level finally reaching subwatersheds with twelve digits.
2.3 Data Assembly
Throughout the Broad and Saluda river basins, there are several different
interactions which affect the amount of Hg in fish tissue. For this thesis, data concerning

14
Hg in fish tissue, dams, mercury point-source pollutants, water chemistry, and watershed
characteristics were all collected from various sources. Appendix A shows a summary of
each dataset and their source. For all datasets, samples under detection level shall be
assumed to be half the detection level (US EPA 2000).
The fish data was collected by the South Carolina Department of Health and
Environmental Control (SCDHEC). This data was obtained through personal
communication (Altman, Chad. 2017. Email message to author, August 31). Figure 2.2
show the location of each fish sampling stations within the sample area. SCDHEC has
been analyzing Hg in fish tissue since 1976 but for this thesis only data from 2005
through 2015 will be included. All fish tissue samples consist of the entire skin-on filet
cut from the right side of the fish. Samples were collected according to SCHDEC
standards and analyzed using cold vapor adsorption spectrophometry by SCDHEC
Analytical Radiological Environmental Services Division (ARESD) (SCDHEC 2001,
2017b). The data were averaged for each fish sampling station and normalized using a
box-cox transformation, explained further in the modeling section.
Water chemistry data was collected from the STOrage and RETrieval (STORET)
data warehouse (US EPA 2015). Water chemistry was matched to fish samples based on
location then date. This data includes temperature, dissolved oxygen (DO), pH, turbidity,
total kjeldalh nitrogen (TKN), inorganic nitrogen, total iron, and alkalinity. Each sample
was analyzed using EPA methods and standards (US EPA 2015). STORET data was
paired with fish samples first by location, either exact station or nearest, then by date.

15
Figure 2.2 Location and station code of fish sampling stations in the sample area.
Information about the watershed boundaries was obtained from the National
Resources Conservation Service section of the United States Department of Agriculture
(USDA 2017). The Environmental Protection Agency (EPA) has collected descriptive
information on each watershed called the Watershed Index Online (WSIO). This database
includes characteristics such as the percent area of watersheds within the watershed, the
percent area developed within the watershed and the number of protect aquatic species.
Land use data describes subwatersheds, the smallest hydrological unit. This information
was last updated in 2011.
Information about the historical gold mines including location, geology and
production years was obtained from Mineral Resources On-Line Spatial Data. This
database is created and maintained by the United States Geological Survey (USGS). It

16
contains a collection of reports which describes mineral resources through the United
States. Each report included name, location, commodity, and geological characteristic.
Since several mines had more than one entry, the data was examined line by line to
combine all data for each mine. From this data, many variables were used to attempt to
explain mercury in fish including number of mines within the watershed, distance to the
closest mine, and other commodities extracted from that mine. Figure 2.3 shows the
location of historical mines throughout the sample area
The National Inventory of Dams, provided by the US Army Corps of Engineer
(USACE), provided all information about dams for the sample area (USACE n.d.). This
database only includes dams which meet certain requirements. The dam must be equal or
exceed 25 feet in height and 15 acre-feet in storage or 6 feet in height and 50 feet in acre-
storage. They could also be included in this database if, in the event of dam failure, they
are likely to cause loss of human life, significant economic damage or environmental
damage. Figure 2.4 shows the locations of dams throughout the sample area.
The National Emissions Inventory (NEI) collects point source, non-point source,
on road sources, nonroad sources, and event sources together to assemble a picture of
emissions in the United States, see Figure 3.5 for variation over the sample area (US EPA
2017). This dataset includes coal-fired power plants, which are currently the largest
sources of mercury emissions into the environment (SCDHEC 2010) While the NEI is
available for the current year, data from 2011 will be used. This year agrees with the data
from the WSIO and transects the fish tissue data from DHEC.

17
Figure 2.3 Location of the fish sampling stations and historical gold mines.
Figure 2.4 Location of both fish sampling stations and dams.

18
.
Figure 2.5 Location of both the fish sampling stations and pollution emission points.
2.4 Project Design and Relevant Statistics
All data was uploaded into ArcGIS Pro for analysis (ArcGIS Pro (version 10.5)
2016). The data was then transformed as appropriate and exploratory analysis found the
variables which best fit the data, show which variables are redundant, and run linear
regressions. Using the best variables, an ordinary least squares (OLS) regression was run
with the best possible variables. Another second regression evaluates those variables and
significant variables which describe gold mining. The results of the exploratory analysis
and the comparison of the two models demonstrates the effects of historical gold mining
on this model.
The basis for this model is regression analysis, which is a statistical method for
investigating relationships between variables where one or more independent variables
attempts to predict the dependent variable (Chatterjee and Hadi 2006; Harrell 2001). A
19
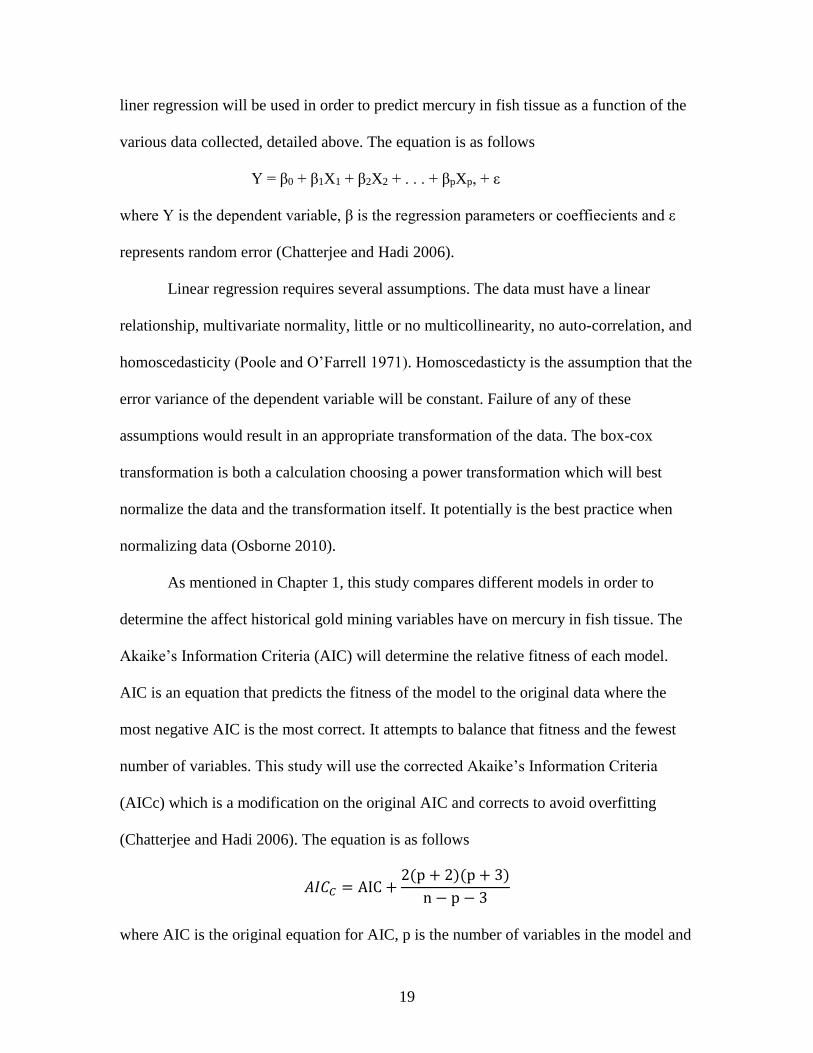
liner regression will be used in order to predict mercury in fish tissue as a function of the
various data collected, detailed above. The equation is as follows
Y = β0 + β1X1 + β2X2 + . . . + βpXp, + ε
where Y is the dependent variable, β is the regression parameters or coeffiecients and ε
represents random error (Chatterjee and Hadi 2006).
Linear regression requires several assumptions. The data must have a linear
relationship, multivariate normality, little or no multicollinearity, no auto-correlation, and
homoscedasticity (Poole and O’Farrell 1971). Homoscedasticty is the assumption that the
error variance of the dependent variable will be constant. Failure of any of these
assumptions would result in an appropriate transformation of the data. The box-cox
transformation is both a calculation choosing a power transformation which will best
normalize the data and the transformation itself. It potentially is the best practice when
normalizing data (Osborne 2010).
As mentioned in Chapter 1, this study compares different models in order to
determine the affect historical gold mining variables have on mercury in fish tissue. The
Akaike’s Information Criteria (AIC) will determine the relative fitness of each model.
AIC is an equation that predicts the fitness of the model to the original data where the
most negative AIC is the most correct. It attempts to balance that fitness and the fewest
number of variables. This study will use the corrected Akaike’s Information Criteria
(AICc) which is a modification on the original AIC and corrects to avoid overfitting
(Chatterjee and Hadi 2006). The equation is as follows
𝐴𝐼𝐶𝐶 = AIC +2(p + 2)(p + 3)
n − p − 3
where AIC is the original equation for AIC, p is the number of variables in the model and

20
n is the number of observations. This correction is particularly useful when there are few
observations and many variables.
The Variance Inflation Factor (VIF) measures the relationship between predictor
variables and is
𝑉𝐼𝐹 =1
1 − 𝑅2
where R2 is the square of the multiple correlation coefficient that results when a predictor
variable is expressed against the other variables (Chatterjee and Hadi 2006). If the
predictor variables have a strong linear relationship with each other than VIF would be
large. VIF higher than 10 often means there is a problem with collinearity within the
model while 1 means there is no linear relationship between any variables (Chatterjee and
Hadi 2006; “Interpreting Exploratory Regression” n.d.). Exploratory analysis will show
any collinearity and variables will be removed one at a time until only variables with low
VIF values remain.
2.5 Methods Summary
Using the previously mentioned statistics, the model predicts mercury in fish
tissue at fish sampling sites throughout the Broad, Saluda and Catawba river basins.
SCDHEC obtained the fish tissue samples which not only described the mercury
concentrations but also the species, length and weight of the fish. Data concerning the
historical gold mines was obtained from the Mineral Resources On-Line Spatial data,
maintained by the USGS. Additional data included water chemistry from STORET, dam
information from the NID, point source emissions from the National Emissions Inventory
(NEI), and various watershed characteristics from the WSIO. Another model predicts
mercury in fish tissue with the addition of significant historical gold mine variables.

21
Comparing these two models reveals the potential impact or lack thereof for historical
gold mining in South Carolina on modern mercury in fish tissue.

22
Comparative Histograms of Before and After Box-Cox Transformations
CHAPTER 3
RESULTS
The mercury (Hg) in fish tissue data was averaged for each sample station and
normalized using a box-cox transformation to meet the assumptions of the linear
regression model. Figure 3.1 compares the normality of the Hg in fish tissue data before
and after the transformation for both the station averaged data and the full dataset. For
other variables, a log transformed version was available in addition to the original.
Figure 3.1 Histograms for both Hg in fish tissue and average Hg in fish tissue per sample
station.
0
2
4
6
8
0.05 0.09 0.12 0.16 0.19 0.23 0.26
Fre
qu
ency
Average Hg in Fish Tissue (mg/kg)
Before
0
2
4
6
-3.00 -2.72 -2.44 -2.17 -1.89 -1.61 -1.34
Fre
qu
ency
Average Hg in Fish Tissue (mg/kg)
After
0
500
1000
1500
0.05 0.54 1.03 1.53 2.02 2.51 3.00
Fre
uen
cy
Hg in Fish Tissue (mg/kg)
Before
0
100
200
300
-4.555 -3.214 -1.874 -0.533 0.807
Fre
qu
ency
Hg in Fish Tissue (mg/kg)
After

23
An exploratory regression analyzed the data and found the best possible models
for between 1 and 12 variables. The best-fitted model had 5 variables longitude, total
kjeldahl nitrogen (T KN), percent of HUC12 within a Municipal Separate Storm Sewer
Systems (MS4), mean annual precipitation in the watershed from 1981 to 2010, and
National Inventory of Dams (NID) dam height. There is no redundancy between the
variables. This model, called Model 1, could explain 84% of the variance between each
sample site (adjusted r2=0.84). Applying Model 1 to all data from a single sample site
would predict mercury in fish tissue with slightly less fitness to the model. For example,
Model 1 when applied to station CW-033 could predict 72 percent of the variation (r2=
0.72).
Another exploratory regression found the significance of variables from the
dataset for historical gold mining. The most significant variable was distance from the
fish sampling site to the nearest gold mine in decimal degrees (DD). This variable was
added to Model 1 to make Model 2. Table 3.1 compares the various descriptive statistics
for each model and Table 3.2 shows the significance (p-value) of each variable for the
two models. In Table 3.1, each variable in Model 1 is significant (p < 0.05) but in Model
2 not only is the mine distance variable not significant but it altered the significance of
the variables for longitude and mean annual precipitation. Additionally, Table 3.2 shows
that Model 2 describes less of the variance (R2=0.77) and has a more positive AICc,
which indicates that it is not as good a fit for the data as Model 1. Both models are
significant as indicated by significant joint F-statistics while not significant Koenker (BP)
and Jarque-Bera statistics indicate that the data is stationary and normal respectively.

24
Table 3.1 Statistics of Model 1 and Model 2 comparing fitness, normality, stationarity
and significance with p-value indicated in parenthesis when applicable.
Adjusted r2 AIC Joint F-Statistic Koenker (BP) Jarque-Bera
Model 1 0.84 4.69 22.61 (0.00) 9.35 (0.10) 0.85 (0.65)
Model 2 0.77 15.98 12.70 (0.00) 2.00 (0.92) 1.65 (0.44)
Table 3.2 Variables from model 1 and model 2 with transformation given, if any, and p-
value indicated in parenthesis when applicable.
Variable Transformation Model 1 (p-value) Model 2 (p-value)
Longitude None 0.00 0.17
TKN Log 0.01 0.01
Percent MS4 in HUC 12 None 0.03 0.00
Mean Annual Precipitation Log 0.01 0.77
Dam Height None 0.00 0.01
Mine distance in HUC12 None ______ 0.12
Figure 3.2 displays the relationship between the variables used in both models and
average Hg in fish tissue per sample station. Longitude, dam height, and mine count all
had negative relationships while MS4, TKN, and average precipitation per year had
positive relationships. The variable describing distance to the nearest mine has the
weakest relationship to Hg, as evidenced by the R2 value. The equation below shows the
coefficients of each term, in the same order as represented in Table 3.2.
𝑦 = −0.564𝑥 + 0.679𝑥 + 0.003𝑥 + 6.387𝑥 + −0.016𝑥 + 6.601
Additionally, applying Model 1 to the full dataset resulted in a model which could
predict slightly more than half the variation (r2=0.51). Applying the model to each river
basin produced results which were not significant due to the low number of sampling
sites in each basin and, therefore, was not representative of the overall data.

25
Figure 3.2 Scatter plots of average Hg and select variables.
R² = 0.25
0
0.05
0.1
0.15
0.2
0.25
0.3
33.5 34 34.5 35
Aver
age
Hg (
mg/k
g)
Longtitude
R² = 0.3391
0
0.05
0.1
0.15
0.2
0.25
0.3
0 50 100
Aver
age
Hg (
mg/k
g)
MS4 (% land in HUC12)
R² = 0.2029
0
0.05
0.1
0.15
0.2
0.25
0.3
0 0.2 0.4
Aver
age
Hg (
mg/k
g)
Log TKN (mg/l)
R² = 0.3043
0
0.05
0.1
0.15
0.2
0.25
0.3
0 20 40 60
Aver
age
Hg (
mg/k
g)
NID Height (m)
R² = 0.1424
0
0.05
0.1
0.15
0.2
0.25
0.3
40 50 60
Aver
age
Hg (
mg/k
g)
Log Precipication (inches/year)
R² = 0.0505
0
0.05
0.1
0.15
0.2
0.25
0.3
0 0.2 0.4 0.6
Aver
age
Hg
Nearest Gold Mine (DD)

26
Table 3.3 compares the average Hg for each sample site to the values for
longitude, TKN, and distance to the nearest historical mine. See Figure 2.2 for the
locations of each sampling station. Throughout the sample area, longitude increased from
south to north, TKN varied sporadically with no overall pattern, and distance to the
closest historical gold mine varied with a general negative relationship between itself and
mercury in fish tissue.
Table 3.3 A comparison of the average Hg for each sample
station and longitude, TKN, and distance to the nearest
mine.
Location Average
Hg
(mg/kg)
Longitude TKN
(mg/l)
Distance
to Mine
(DD)
B-114F 0.11 35.11 0.30 0.23
B-222F 0.08 35.03 0.26 0.23
B-311F 0.23 34.05 0.52 0.22
B-327F 0.07 34.33 0.22 0.07
B-345F 0.10 34.26 0.29 0.03
C-007F 0.24 33.75 0.35 0.08
CL-100F 0.17 35.01 0.24 0.33
CW-016F 0.10 34.68 0.52 0.15
CW-033F 0.09 34.54 0.45 0.13
CW-034F 0.09 34.54 0.70 0.11
CW-057F 0.07 34.61 0.50 0.21
CW-197F 0.11 35.14 0.32 0.25
CW-201F 0.05 35.03 0.22 0.12
CW-206F 0.12 33.95 0.38 0.02
CW-207F 0.07 34.40 0.36 0.07
CW-209F 0.05 34.36 0.40 0.03
CW-214F 0.13 34.22 0.55 0.21
S-105F 0.26 34.14 1.07 0.15
S-131F 0.15 34.28 0.48 0.06
S-169F 0.16 34.65 0.49 0.50
S-223F 0.17 34.10 0.40 0.04
S-273F 0.16 34.07 0.35 0.25
The variable for percent of HUC12 land within an MS4 shows clear patterns of
variation in the sample area. The cities and surrounding suburbs of Columbia, Greenville

27
and Rock Hill all show high percentages of land within an MS4 while watersheds outside
of these areas have no area within an MS4. Figure 3.3 below shows the variation
throughout the sample area for MS4 within the watershed. Columbia is found in the
bottom-right, Rock Hill in the top-right and Greenville in the top-left. An additional
exploratory regression for the MS4 variable found that it was positively correlated with
dams built for flood control, with chain pickerel, and with total iron concentrations in the
water. There was a negative relationship between the MS4 variable and several variables
describing percent of forested land within the watershed including evergreen forest,
mixed forest and shrub land.
Figure 3.3 The variation of percent area within an MS4 for HUC12 watersheds.
Average annual precipitation from 1981 to 2010 varied from 42 to 56 inches per
year, see Figure 3.4 below. The highest annual precipitation is closest to the Blue Ridge

28
mountains in the Northwest portion of the sample area and the lowest was found in the
Catawba River basin.
Figure 3.4 Variation across the sample area for average yearly precipitation.
Dam height did not have a pattern across the sample area but instead had high
dam heights near the large reservoirs of the state. Figure 3.5 shows the variation. The
highest dam height was found near the largest lakes like Lake Monticello, Lake Murray
and Lake Wateree while the smallest values were found where there were no dams which
resulted in a zero value.

29
Figure 3.5 The variation of dam height across the sample area.
While there were other relationships between variables, no relationships were
stronger than those addressed above. No point source emissions from the National
Emissions Inventory (NEI) had any notable effect on Hg in fish tissue despite the variety
of pollutants, concentrations and locations. There were some interesting relationships
between fish species and mercury in fish tissue which suggest relationships between the
two but ultimately where not a strong enough correlation to be included in the final
model.
The data concerning fish included mercury concentration in fish tissue, species,
length, weight, sex and date of sampling. More than 2160 samples were collected over 22
sample sites. See Figure 2.2 for the locations of each fish sampling station. Sampling
stations varied in terms of numbers of samples collected, as all as number of fish sampled

30
per location or per sampling event. Figure 3.5, 3.6, and 3.7 show the variation between
the different station for number of fish, average Hg in fish tissue, and number of
sampling dates.
Figure 3.6 The number of individual fish samples for each fish sampling station.
Figure 3.7 The average annual mercury in fish tissue for each fish sampling station.
The mercury within these species ranged from below the detection limit to 3
mg/kg, averaging 0.13 mg/kg. Average mercury varied greatly from the different fish
0
20
40
60
80
100
120
140
160
180
B-1
14
F
B-2
22
F
B-3
11
F
B-3
27
F
B-3
45
F
C-0
07
F
CL
-10
0F
CW
-01
6F
CW
-03
3F
CW
-03
4F
CW
-05
7F
CW
-19
7F
CW
-20
1F
CW
-20
6F
CW
-20
7F
CW
-20
9F
CW
-21
4F
S-1
05F
S-1
69F
S-1
31F
S-2
23F
S-2
73F
Fis
h C
ount
Station Code
Count of Fish Samples per Station
0
0.05
0.1
0.15
0.2
0.25
0.3
0.35
0.4
B-1
14
F
B-2
22
F
B-3
11
F
B-3
27
F
B-3
45
F
C-0
07
F
CL
-10
0F
CW
-01
6F
CW
-03
3F
CW
-03
4F
CW
-05
7F
CW
-19
7F
CW
-20
1F
CW
-20
6F
CW
-20
7F
CW
-20
9F
CW
-21
4F
S-1
05F
S-1
69F
S-1
31F
S-2
23F
S-2
73F
Aver
age
Hg i
n F
ish (
mg/k
g)
Station Code
Average Hg in Fish Tissue per Station

31
sampling stations, see Figure 3.3. The highest values for average mercury in fish tissue
per stations were found at S-105F, C-007F, and B-311F.
Figure 3.8 The number of unique sampling dates per fish sampling station.
There were 21 species of fish within the dataset. Six species were left out of the
figure for clarity due to low sample numbers. Those species were spotted bass
(Micropterus punctulatus) and white crappie (Pomoxis annularis) with two samples each
and yellow perch (Perca flavescens), rock bass (Ambloplites rupestris), smallmouth bass
(Micropterus dolomieu), and longear sunfish (Lepomis megalotis) with one sample each.
Largemouth bass (Micropterus salmonides) has the highest number of samples: 863
samples were collected, totaling 40 percent of the overall samples collected. The species
with the next highest number of collected samples are redear sunfish (Lepomis
microlophus) with 15% overall, black crappie (Pomoxis nigromaculatus) with 11%
overall, and channel catfish (Ictalurus punctatus) with 11% overall. For a complete
explanation of species sampled, see figure 3.9, below.
0
2
4
6
8
10
12
14
16
18
B-1
14
F
B-2
22
F
B-3
11
F
B-3
27
F
B-3
45
F
C-0
07
F
CL
-10
0F
CW
-01
6F
CW
-03
3F
CW
-03
4F
CW
-05
7F
CW
-19
7F
CW
-20
1F
CW
-20
6F
CW
-20
7F
CW
-20
9F
CW
-21
4F
S-1
05F
S-1
69F
S-1
31F
S-2
23F
S-2
73F
Num
ber
of
Sam
pli
ng E
ven
ts
Station Code
Number of Sampling Dates per Station

32
Figure 3.9 The number and percentage of samples per each fish species. Other category clarified in text.
Largemouth bass, 863, 40%
Redear sunfish, 326, 15%
Black crappie, 245, 11%
Channel catfish, 245, 11%
Bluegill, 139, 6%
Bowfin, 92, 4%
Blue catfish, 82, 4%
Striped Bass, 34, 2%
White bass, 31, 1%
White catfish, 29, 1%
Chain pickeral, 28, 1%
White perch, 12, 1%
Warmouth, 10, 0%
Redbreast sunfish, 8, 0%
Flathead catfish, 8, 0%
Other, 8, 0%
Number of Fish Samples per Species

33
Table 3.4 Significant relationships between species and mercury in fish content sorted by
highest average Hg.
Species Relationship Average Hg
(mg/kg)
Average
Length (cm)
Average
Weight (g)
Bowfin Positive 0.43
64.36
2183.62
Chain pickerel Positive 0.23
43.69
583.50
Largemouth bass Positive 0.18
40.30
1048.28
Black crappie Negative 0.07
28.61
401.15
Channel catfish Negative 0.07 47.48
1183.55
Total 0.14
38.77
933.95
Within the species sampled, bowfin (Amia calva) correlates most strongly and
contains the highest amount of average mercury followed by chain pickerel (Esox niger),
largemouth bass, black crappie (Pomoxis nigromaculatus), and channel catfish (Ictalurus
punctatus). Table 3.4 shows the top five most significant relationships (p < 0.05) between
species and mercury concentration in fish. Additionally, Figure 3.10 below illustrates the
spatial variability of the species by comparing the percentage of total fish caught per
sample area for each species in Table 3.4.
To explore the dataset without the variation multiple species might impose, an
exploratory regression was run with the mercury in fish tissue samples from largemouth
bass. All five variables from Model 1 were significant, while distance to the nearest mine
was not found to be significant. In this analysis, length became an important variable
when it was not significant for the dataset with all species. This confirms that the multiple
species dataset is an appropriate representation of trends within species.

34
Figure 3.10 The percentage of species caught for each fish sampling station.
0 20 40 60 80 100
B-114F
B-222F
B-311F
B-327F
B-345F
C-007F
CL-100F
CW-016F
CW-033F
CW-034F
CW-057F
CW-197F
CW-201F
CW-206F
CW-207F
CW-209F
CW-214F
S-105F
S-131F
S-169F
S-223F
S-273F
Percent
Sta
tio
n C
od
e
Significant Species percentage per Sampling Station
Bowfin
Chain pickeral
Largemouth Bass
Black crappie
Channel Catfish
Other

35
CHAPTER 4
DISCUSSION
4.1 Introduction
This study in the piedmont area of the Broad, Saluda and Catawba watersheds in
South Carolina compared mercury (Hg) concentrations in fish tissue to 341 variables.
Based on the significance of these comparisons and measurements describing the
presence of excess variables, the variables that were considered to be significant were
limited to six, including land use, total nitrogen in the surface water, precipitation, height
of dams and historic gold mine locations.
Of the six variables, four of them were positively correlated with Hg in fish tissue
and two were inversely related. The resulting model predicted the average Hg in fish
tissue for each fish sampling station. Based on the various terms describing the model
fitness, the most accurate model, referred to as Model 1, included variables for longitude,
total kjeldahl nitrogen (TKN), percent of HUC12 within a municipal separate storm
sewer systems (MS4), mean annual precipitation in the watershed from 1981 to 2010, and
National Inventory of Dams (NID) dam height.
4.2. Relationship of Hg in Fish Tissue to Distance to Historic Gold Mines
A second model was created which included all of the parameters from Model 1,
but also added the most significant historical gold mining variable (as discussed in
Chapter 3), which is distance to the nearest mine in decimal degrees (DD). The addition
of the nearest mine variable resulted in a decrease in the correlation coefficient , r2 , and

36
to the Akaike’s Information Criteria (AIC) which both indicate that Model 2 did not
predict the mercury in fish tissue as well as Model 1. Neither the mine variable nor any
other mining variables had a statistically significant relationship with the Hg in fish tissue
dataset. For this reason, this study concludes that historical gold mines do not have an
impact on Hg in fish tissue today.
Comparing the results of this SC study to the Alpers et al. (2016) study, which
studied and found a connection between mercury in fish tissue and historic gold mines in
California, the current SC study found a different result based on the data reviewed.
This SC study does not show a significant connection between Hg in fish tissue and
historic gold mines. Some potential explanations for the different finding may be that
California was mined more extensively than South Carolina in terms of both mine
quantity and average mine size (Tuomey 1848; Edgar 1998). While it has been shown
that Appalachian gold mining has left behind mercury in the environment (Lecce et al.
2011; Lecce and Pavlowsky 2014), the amount of mercury may not be large enough to
alter the patterns seen here.
Additionally, there are many differences between the two sample sites which
could impact mercury uptake in fish. Using the five variables used in this model, the
Sierra Nevadas have a different climate which impacts the precipitation amount; they are
farther from the equator, altering longitude; and much of the mountains are within
national forests, reducing the area that would be expected to be within the an MS4.
Theoretically, there are differences in TKN and dam height due given the difference in
climate. So, while other studies have found mercury in sediments left behind by

37
Appalachian gold mining (Lecce et al. 2011), this study was not able to find an increase
in mercury in fish tissue as a result of gold mining.
4.2 The Relationship Between Hg in Fish Tissue and Positively Correlated
Variables.
The variables, including longitude, percent of land within each HUC 12 which has
a municipal storm water sewage system (MS4), and annual average precipitation, are all
positively correlated with Hg in fish tissue and are independent variables. Longitude is
significantly correlated to increased Hg in fish tissue from north to south in the study
area. This trend is similar to those seen by others studying mercury in the water of South
Carolina which have seen an increase in Hg from the mountainous region of South
Carolina toward the coast (Guentzel 2009). The shape of the sample area means that this
longitudinal increase also represents an increased mercury in fish tissue from west to east.
Additionally, Depew, Burgess, and Campbell (2013) found a large-scale locational trend
in their dataset of mercury in fish tissue within Canada. Mercury in fish tissue increased
from west to east, indicating that other sample sites have large-scale locational trends.
Within SC, the longitude data indicate that the Hg in fish tissue is highest in the upper
reaches of the Catawba watershed and lowest in the lower reaches of the Broad River.
Because the mining activity was concentrated along the geologic units of the inner
piedmont which trends east northeast– west southwest, the longitude data indicating the
north – south significance also indicates that that the locations of the historic gold mines
is not a significant factor in Hg in fish tissue.
Annual average precipitation from 1981 to 2010 varied over the state and was
positively correlated with increased Hg in fish tissue. While increases in precipitation

38
could impact Hg in fish tissue in a number of ways, including increased sediment runoff,
increased precipitation has been shown to result in an increase in wet deposition of Hg
resulting in increased concentrations of Hg in sediment and the potential for uptake into
the biological system (Eagles-Smith et al. 2016). With locations with no local pollutants,
atmospheric Hg is thought to be the main source of mercury found in aquatic organisms
(Downs, MacLeod, and Lester 1998).
The variable describing MS4 refers to the percent area in the HUC 12 watershed
that is within a municipal storm water sewage system (MS4), see figure 3.4 for trends
within the sampling site. An MS4 is a system which transports storm water but does not
treat storm water runoff (US EPA 2015). While many fish sampling sites did not have
any land within an MS4, sampling sites within the urban area had up to all of the
watershed within these MS4s. Both Alpers et al. (2016) and da Silva, Lucotte, and
Davidson (2009) used variables in their models which described either population or
urban land use. Since MS4s surround urban areas, this variable could describe the same
trends which effected their model.
Not only does the MS4 variable indicate increased urban land but, because of that
increase, it suggests decreasing natural land types such as forest, wetland and shrub.
These variables were not used in the final model due to their lack of the significance
when compared to the final variables used. Given this land use connection, the increase in
MS4 percentage of land subject municipal storm sewers correlation with increased Hg in
fish tissue could be described as similar to the results of da Silva, Lucotte, and Davidson
(2009) which found increased mercury in fish tissue with decreased forested land within
the watershed.

39
Since the purpose of the MS4 is to transport storm water away from urban centers
without treating it, one of the potential reasons for the positive correlation between fish
tissue Hg and MS4s could be that the storm sewers concentrate pollutants into certain
areas for uptake into the fish and their food web. Noted storm water pollutants include
increased sediment, TKN, and phosphates (Sartor, Boyd, and Agardy 1974). Sediment
loads were indicated as key determinates of mercury in fish tissue by Alpers et al. (2016)
and da Silva, Lucotte, and Davidson (2009).
TKN was significant both for this study and for others (Glover et al. 2010). As
previously mentioned, there was no redundancy within the variables. Thus, while the
MS4 and TKN variables might be connected, they did not describe the same patterns.
Excess TKN can indicate inputs from agriculture or urban wastewater and can cause
excessive algal growth. Growth like this has been shown to be positively correlated with
increased mercury methylation which in turn leads to increased mercury in fish tissue
(Wang et al. 2012).
4.3 Relationship of Hg in Fish Tissue to Dam Height
Dam height has an inverse relationship with Hg in fish tissue, see Figure 3.2.
While Porvari (1998) examined the relationship between year of dam impoundment and
mercury in fish tissue, they did not address any interaction between dam height. Year of
impoundment was a potential modeling variable and, therefore, it was evaluated, but it
was determined not to be significant for this study’s data set. Dams affect a large number
of ecological characteristics including water chemistry, flow of the river, flow of
sediment, and the types of organisms which make up the food web (Ligon, Dietrich, and
Trush 1995; Lessard and Hayes 2003). While large dams have been shown to retain

40
mercury in sediments, particularly mercury from historical gold mines in NC (Lecce and
Pavlowsky 2014), the data from this study, based on the inverse relationship between Hg
in fish and dam height, suggests that there is some effect correlated to dam height that
minimizes or prevents the mercury present from being taken up in the fish tissue.
Possible reasons for the inverse relationship may be differences in the water chemistry of
large dams which alters mercury methylation and uptake.
4.4 Relationship of Hg in Fish Tissue to Fish Species.
There are several relationships between mercury in fish tissue and the species
caught and analyzed. Bowfin, chain pickerel, largemouth bass, channel catfish and black
crappie will all be examined. Bowfin, chain pickerel, and largemouth bass are all
positively correlated with mercury in fish tissue and all three species are piscivorous.
Bowfin prefer slow-moving waters and are found throughout South Carolina (Rohde et
al. 2009). Bowfin have both the strongest relationship and the highest amount of mercury
in fish tissue of any species. Other studies have found connections between diet, fish size
and concentration of mercury in fish tissue (Glover et al. 2010). Consequentially, the
bowfin’s large size and piscivorous diet either explain or contribute to their high levels of
Hg within their tissues.
Chain pickerel also prefer quiet slow-moving waters and, while they are found
throughout South Carolina, they were not sampled in the Broad River system (Rohde et
al. 2009). However, they were found at four locations within this study area: in the
Saluda River at sites S-169, S-223 and S-273; in the Catawba River at site CW-206; and
in the Congaree River at C-007. At each sampling location, this species had high levels of
Hg.

41
As a species, the largemouth bass makes up the largest portion of the samples in
this study representing 40% of all fish samples, see Figure 3.6. Like the chain pickerel
and bowfin, this species prefers slow-moving water (Rohde et al. 2009) and they are
found throughout South Carolina.. Glover et al. (2010) noted similar relationships to the
findings of this study, and Glover found that bowfin had the highest maximum mercury
of any species analyzed. Glover also found similar positive relations between mercury in
fish tissue and chain pickerel and largemouth bass. Burger et al. (2001) studied the
Savannah River basin and found that the same three species had the strongest positive
relationship with mercury. In as much as this study focuses predominantly on the
Piedmont portions of the three watersheds, this study expands upon the findings of
Burger and extends this positive relationship to three additional watersheds, the Broad,
Saluda and Catawba.
Channel catfish and black crappie are negatively correlated with mercury
concentration in fish tissue. Channel catfish inhabit a range of habitats and are known to
eat fish, invertebrates and aquatic vegetation (Rohde et al. 2009). Black crappie live in
vegetated backwaters and eat invertebrates and fish (Rohde et al. 2009). The variety in
the diets of these two species could contribute to their comparatively low levels of
mercury. Both Glover et al. (2010) and Burger et al. (2001) found similarly low levels of
mercury in these two species.
4.5 Conclusion
Based on the positive and inverse relationships described above for six variables
of significance related to Hg in fish tissue, it is suggested that while only certain species
of fish appear to significantly have elevated levels of mercury in their tissue, a model to

42
estimate whether these fish will exhibit elevated levels must include average annual
precipitation, the percentage of land that is incorporated into an MS4 plan, the TKN
concentration in the river and the location expressed as longitude. In addition, if the fish
was sampled near a large dam, the model indicates lower levels of Hg in the tissue would
be expected and particularly if the dam is located in the southern portion of the study
area, had lower average precipitation and lower nitrogen levels.
These five variables used in Model 1 could also suggest new sampling locations
for evaluating Hg in fish statewide. These variables consist of characteristics that were
not obtained during the fish sampling process and are available in many locations. Using
the same model to predict increased mercury in fish tissue could reveal new patterns in
the environment and prevent extraneous sampling. Additional research could examine
the applicability of Model 1 to other sample areas with the same goal of predicting new
patterns in mercury in fish tissue.

43
CHAPTER 5
SUMMARY AND CONCLUSION
Historical gold mining left behind mercury in the environment which has led to
increased mercury concentrations in fish tissue for certain locations (Alpers et al. 2016).
The mercury in these fish can be consumed and cause damage to human health. While
this connection between mercury in fish and historical gold mining has not been
previously studied in South Carolina, there was historical gold mining in the state and
records contemporary to the mining note the escape of mercury into the environment
(Tuomey 1948). Additionally, a North Carolina study found increased mercury in
sediments for watersheds with a history of historical gold mining (Lecce et a. 2011). To
evaluate if such a relationship existed in SC, watersheds with known historical gold
mining were studied. The study area included sampling stations within the Catawba,
Saluda, and Broad river basins. The sampling sites had a variety of distinctive
characteristics, including different concentrations of historical gold mining activity.
To determine the impacts of historical gold mining on modern mercury in fish
tissue, this study first predicted mercury in fish tissue as a result of watershed
characteristics, water chemistry, point source pollutants and land use to account for other
sources of variation. Model assembly chose the most significant variables which were
longitude, dam height, total kjeldahl nitrogen (TKN), percent of watershed area with a
municipal storm water sewage system (MS4), and average yearly precipitation. The

44
variables TKN, MS4, and precipitations were all positively correlated with increased
mercury in fish tissue while dam height and longitude were negatively correlated. This
model violated no assumptions of linear regression and could explain 84% of variation
(r2=0.84). These variables describe a number of natural processes, land use, and
anthropogenic activities which have implications for mercury in fish tissue. For example,
the MS4 variable indicates the presence of concentrated untreated storm water with its
pollutants and decreased forested land, both of which can be linked to increased mercury
in fish.
Meanwhile, historical gold mining variables were examined for significance. The
most significant variable was added to the previous model which resulted in a statistically
significant decrease in model fitness (r2=0.77). In conclusion, this study could not reject
the null hypothesis and did not find a correlation between Hg in fish tissue and historical
gold mines. The reasons for this lack of significance from the historical gold mines could
vary from the differences in mine density, to the climate of the sample areas, or the
composition of the sediment.
There were also some significant correlations between the amount of mercury in
the fish and the species of fish. The species bowfin, chain pickerel and largemouth bass
were all positively correlated with mercury in fish tissue and were all large piscivorous
species. Black crappie and channel catfish were negatively correlated with mercury and
were smaller omnivores. This difference in diet and size is the probable source of
difference between these species.
In conclusion, this study modeled mercury in fish tissue for the Catawba, Saluda,
and Broad river basins with the goal of determining if it was impacted by historical gold

45
mining or other environmental and anthropogenic factors. Two models were made, one
with and one without the historical mining variables. The model without the historical
gold mining was a better fit to the data (r2=0.84) than the model with the mine
data(r2=0.77). Therefore, this study indicates that historical gold mining has no
measurable impact on modeling mercury in fish tissue for these sample sites. The model
did show significant relationships between mercury in fish tissue and longitude, TKN,
MS4, dam height, and precipitation. Separate from the main model, the fish species also
had an impact on mercury in fish tissue with piscivorous fish having more mercury than
omnivorous ones. Both the significant and nonsignificant correlations add to the
knowledge of mercury emission into the environment and subsequent uptake into fish,
resulting in an increased understanding of this concept.

46
REFERENCES
Alpers, Charles N., Julie L. Yee, Joshua T. Ackerman, James L. Orlando, Darrel G.
Slotton, and Mark C. Marvin-DiPasquale. 2016. “Prediction of Fish and Sediment
Mercury in Streams Using Landscape Variables and Historical Mining.” Science
of The Total Environment 571 (November): 364–79.
doi:10.1016/j.scitotenv.2016.05.088.
Amos, Helen M., Jeroen E. Sonke, Daniel Obrist, Nicholas Robins, Nicole Hagan,
Hannah M. Horowitz, Robert P. Mason, et al. 2015. “Observational and Modeling
Constraints on Global Anthropogenic Enrichment of Mercury.” Environmental
Science & Technology 49 (7): 4036–47. doi:10.1021/es5058665.
ArcGIS Pro (version 10.5). 2016. Redlands, CA: Environmental Systems Institute.
Bosch, Adina C., Bernadette O’Neill, Gunnar O. Sigge, Sven E. Kerwath, and Louwrens
C. Hoffman. 2016. “Mercury Accumulation in Yellowfin Tuna (Thunnus
Albacares) with Regards to Muscle Type, Muscle Position and Fish Size.” Food
Chemistry 190 (January): 351–56. doi:10.1016/j.foodchem.2015.05.109.
Botwick, Brad, and Natalie Pope. 2012. “Gold Mining In the Carolinas: A Context for
Archaeological Resources Management.” New South Associates Technical
Report submitted to Haile Gold Mine Inc.
Burch, James B, Sara Wagner Robb, Robin Puett, Bo Cai, Rebecca Wilkerson, Wilfried
Karmaus, John Vena, and Erik Svendsen. 2014. “Mercury in Fish and Adverse
Reproductive Outcomes: Results from South Carolina.” International Journal of
Health Geographics 13 (1): 30. doi:10.1186/1476-072X-13-30.
Burger, Joanna, Karen F. Gaines, C. Shane Boring, Warren L. Stephens, Joel Snodgrass,
and Michael Gochfeld. 2001. “Mercury and Selenium in Fish from the Savannah
River: Species, Trophic Level, and Locational Differences.” Environmental
Research 87 (2):108–18. https://doi.org/10.1006/enrs.2001.4294.
Chatterjee, Samprit, and Ali S. Hadi. 2006. Regression Analysis by Example. 4th ed.
Wiley Series in Probability and Statistics. Hoboken, N.J: Wiley-Interscience.
Clarkson, Thomas W., and Laszlo Magos. 2006. “The Toxicology of Mercury and Its
Chemical Compounds.” Critical Reviews in Toxicology 36 (8): 609–62.
doi:10.1080/10408440600845619.
Da Silva, Sampaio D., M. Lucotte, S. Paquet, and R. Davidson. 2009. “Influence of
Ecological Factors and of Land Use on Mercury Levels in Fish in the Tapajós
River Basin, Amazon.” Environmental Research 109 (4): 432–46.
doi:10.1016/j.envres.2009.02.011.

47
Depew, David C., Neil M. Burgess, and Linda M. Campbell. 2013. “Modelling Mercury
Concentrations in Prey Fish: Derivation of a National-Scale Common Indicator of
Dietary Mercury Exposure for Piscivorous Fish and Wildlife.” Environmental
Pollution 176 (May): 234–43. doi:10.1016/j.envpol.2013.01.024.
Domagalski, Joseph, Michael S. Majewski, Charles N. Alpers, Chris S. Eckley, Collin A.
Eagles-Smith, Liam Schenk, and Susan Wherry. 2016. “Comparison of Mercury
Mass Loading in Streams to Atmospheric Deposition in Watersheds of Western
North America: Evidence for Non-Atmospheric Mercury Sources.” The Science
of the Total Environment 568 (October): 638–50.
doi:10.1016/j.scitotenv.2016.02.112.
Downs, S. G., C. L. MacLeod, and J. N. Lester. 1998. “Mercury in Precipitation and Its
Relation to Bioaccumulation in Fish: A Literature Review.” Water, Air, and Soil
Pollution 108 (1):149–87.
Eagles-Smith, Collin A., James G. Wiener, Chris S. Eckley, James J. Willacker, David C.
Evers, Mark Marvin-DiPasquale, Daniel Obrist, et al. 2016. “Mercury in Western
North America: A Synthesis of Environmental Contamination, Fluxes,
Bioaccumulation, and Risk to Fish and Wildlife.” Science of The Total
Environment 568 (October):1213–26.
https://doi.org/10.1016/j.scitotenv.2016.05.094.Edgar, Walter B. 1998. South
Carolina: A History. Columbia, S.C: University of South Carolina Press.
Fitzgerald, William F., Daniel R. Engstrom, Robert P. Mason, and Edward A. Nater.
1998. “The Case for Atmospheric Mercury Contamination in Remote Areas.”
Environmental Science & Technology 32 (1): 1–7. doi:10.1021/es970284w.
Glover, James B., Marisa E. Domino, Kenneth C. Altman, James W. Dillman, William S.
Castleberry, Jeannie P. Eidson, and Micheal Mattocks. 2010. “Mercury in South
Carolina Fishes, USA.” Ecotoxicology 19 (4): 781–95. doi:10.1007/s10646-009-
0455-6.
Guentzel, Jane L. 2009. “Wetland Influences on Mercury Transport and Bioaccumulation
in South Carolina.” Science of The Total Environment 407 (4): 1344–53.
doi:10.1016/j.scitotenv.2008.09.030.
Harrell, Frank E. 2001. Regression Modeling Strategies: With Applications to Linear
Models, Logistic Regression, and Survival Analysis. Springer Series in Statistics.
New York: Springer.
Hearn, Paul P., Stephen P. Donato, David I. Donato, and John J. Aguinaldo. 2006.
“EMMMA: A Web-Based System for Environmental Mercury Mapping,
Modeling, and Analysis.” U.S. Geological Survey Open-File Report 2006–1086.
http://pubs.usgs.gov/of/2006/1086/.
Hirschhorn, Norbert, Robert G. Feldman, and Ian Greaves. 2001. “Abraham Lincoln’s
Blue Pills: Did Our 16th President Suffer from Mercury Poisoning?” Perspectives
in Biology and Medicine 44 (3): 315–32. doi:10.1353/pbm.2001.0048.
“Interpreting Exploratory Regression.” n.d. ArcGIS Pro. Accessed May 30, 2017.
http://desktop.arcgis.com/en/arcmap/10.3/tools/spatial-statistics-
toolbox/interpreting-exploratory-regression-results.htm.

48
Lecce, Scott A., Robert T. Pavlowsky, Gwenda S. Bassett, and Derek J. Martin. 2011.
“Metal Contamination from Gold Mining in the Cid District, North Carolina.”
Physical Geography 32 (5): 469–95. doi:10.2747/0272-3646.32.5.469.
Lecce, Scott A., and Robert T. Pavlowsky. 2014. “Floodplain Storage of Sediment
Contaminated by Mercury and Copper from Historic Gold Mining at Gold Hill,
North Carolina, USA.” Geomorphology 206 (February):122–32.
https://doi.org/10.1016/j.geomorph.2013.10.004.
Lessard, JoAnna L., and Daniel B. Hayes. 2003. “Effects of Elevated Water Temperature
on Fish and Macroinvertebrate Communities below Small Dams.” River Research
and Applications 19 (7):721–32. https://doi.org/10.1002/rra.713.
Ligon, Franklin K., William E. Dietrich, and William J. Trush. 1995. “Downstream
Ecological Effects of Dams.” BioScience 45 (3):183–92.
https://doi.org/10.2307/1312557.
National Research Council (U.S.), ed. 2000. Toxicological Effects of Methylmercury.
Washington, DC: National Academy Press.
Nriagu, Jerome O. 1994. “Mercury Pollution from the Past Mining of Gold and Silver in
the Americas.” Science of The Total Environment 149 (3): 167–81.
doi:10.1016/0048-9697(94)90177-5.
Osborne, Jason W. 2010. “Improving Your Data Transformations: Applying the Box-Cox
Transformation.” Practical Assessment, Research & Evaluation 15 (12):1–9.
Poole, Michael, and Patrick O’Farrell. 1971. “The Assumptions of the Linear Regression
Model.” Transactions of the Institute of British Geographers 52 (145).
Porvari, P. 1998. “Development of Fish Mercury Concentrations in Finnish Reservoirs
from 1979 to 1994.” Science of The Total Environment 213 (1–3): 279–90.
doi:10.1016/S0048-9697(98)00101-6.
Rohde, Fred C., William D. Anderson, Jeffery W. Foltz, and Joesepth M. Quattro. 2009.
Freshwater Fishes of South Carolina. no. 22. Columbia, S.C: University of South
Carolina Press.
Ribeiro, Danielle Regina Gomes, Henrique Faccin, Thaís Ramos Dal Molin, Leandro
Machado de Carvalho, and Lílian Lund Amado. 2017. “Metal and Metalloid
Distribution in Different Environmental Compartments of the Middle Xingu
River in the Amazon, Brazil.” The Science of the Total Environment 605–606
(December): 66–74. doi:10.1016/j.scitotenv.2017.06.143.
Sartor, J. D., G. B. Boyd, and F. J. Agardy. 1974. “Water Pollution Aspects of Street
Surface Contaminants.” Journal - Water Pollution Control Federation 46 (3):458–
67.
SCDHEC. 2001. “Environmental Investigations Standard Operating Procedures and
Quality Assurance Manual.” 2600 Bull Street, Columbia SC 29201: South
Caorlina Department of Health and Environmental Control.
———. 2010. “South Carolina Mercury Assessment and Reduction Initiative.” 2600 Bull
St. Columbia SC 29201.
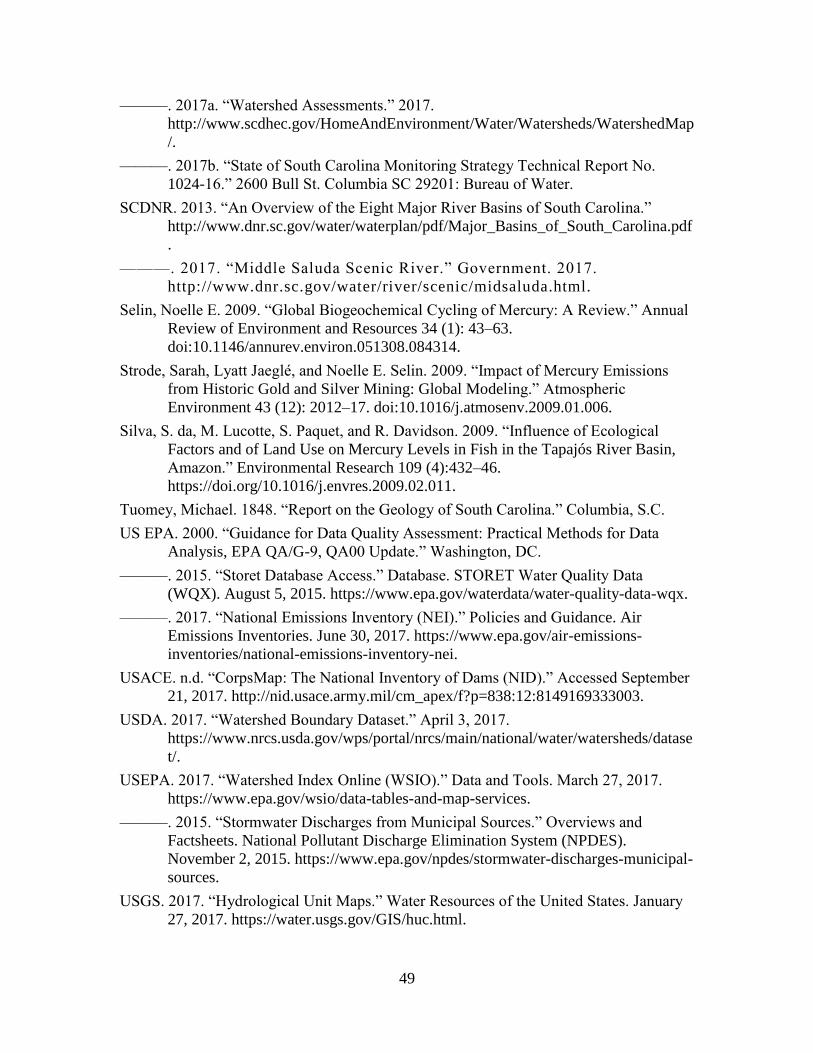
49
———. 2017a. “Watershed Assessments.” 2017.
http://www.scdhec.gov/HomeAndEnvironment/Water/Watersheds/WatershedMap
/.
———. 2017b. “State of South Carolina Monitoring Strategy Technical Report No.
1024-16.” 2600 Bull St. Columbia SC 29201: Bureau of Water.
SCDNR. 2013. “An Overview of the Eight Major River Basins of South Carolina.”
http://www.dnr.sc.gov/water/waterplan/pdf/Major_Basins_of_South_Carolina.pdf
.
———. 2017. “Middle Saluda Scenic River.” Government. 2017.
http://www.dnr.sc.gov/water/river/scenic/midsaluda.html.
Selin, Noelle E. 2009. “Global Biogeochemical Cycling of Mercury: A Review.” Annual
Review of Environment and Resources 34 (1): 43–63.
doi:10.1146/annurev.environ.051308.084314.
Strode, Sarah, Lyatt Jaeglé, and Noelle E. Selin. 2009. “Impact of Mercury Emissions
from Historic Gold and Silver Mining: Global Modeling.” Atmospheric
Environment 43 (12): 2012–17. doi:10.1016/j.atmosenv.2009.01.006.
Silva, S. da, M. Lucotte, S. Paquet, and R. Davidson. 2009. “Influence of Ecological
Factors and of Land Use on Mercury Levels in Fish in the Tapajós River Basin,
Amazon.” Environmental Research 109 (4):432–46.
https://doi.org/10.1016/j.envres.2009.02.011.
Tuomey, Michael. 1848. “Report on the Geology of South Carolina.” Columbia, S.C.
US EPA. 2000. “Guidance for Data Quality Assessment: Practical Methods for Data
Analysis, EPA QA/G-9, QA00 Update.” Washington, DC.
———. 2015. “Storet Database Access.” Database. STORET Water Quality Data
(WQX). August 5, 2015. https://www.epa.gov/waterdata/water-quality-data-wqx.
———. 2017. “National Emissions Inventory (NEI).” Policies and Guidance. Air
Emissions Inventories. June 30, 2017. https://www.epa.gov/air-emissions-
inventories/national-emissions-inventory-nei.
USACE. n.d. “CorpsMap: The National Inventory of Dams (NID).” Accessed September
21, 2017. http://nid.usace.army.mil/cm_apex/f?p=838:12:8149169333003.
USDA. 2017. “Watershed Boundary Dataset.” April 3, 2017.
https://www.nrcs.usda.gov/wps/portal/nrcs/main/national/water/watersheds/datase
t/.
USEPA. 2017. “Watershed Index Online (WSIO).” Data and Tools. March 27, 2017.
https://www.epa.gov/wsio/data-tables-and-map-services.
———. 2015. “Stormwater Discharges from Municipal Sources.” Overviews and
Factsheets. National Pollutant Discharge Elimination System (NPDES).
November 2, 2015. https://www.epa.gov/npdes/stormwater-discharges-municipal-
sources.
USGS. 2017. “Hydrological Unit Maps.” Water Resources of the United States. January
27, 2017. https://water.usgs.gov/GIS/huc.html.

50
Wang, Shaofeng, Mingmei Zhang, Biao Li, Denghua Xing, Xin Wang, Chaoyang Wei,
and Yonfeng Jia. 2012. “Comparison of Mercury Speciation and Distribution in
the Water Column and Sediments between the Algal Type Zone and the
Macrophytic Type Zone in a Hypereutrophic Lake (Dianchi Lake) in
Southwestern China.” Science of The Total Environment 417–418
(February):204–13. https://doi.org/10.1016/j.scitotenv.2011.12.036.

51
APPENDIX A – DATA SOURCE
Table A.1 Dataset background.
Dataset Source Description Date Retrieved
Mineral Resources On-Line
Spatial Data
USGS Mine location, geology, and years of production. 1/17/17
Watershed Boundaries USDA 12-Digit Watershed Boundary for South Carolina
Watersheds.
2/13/17
National Emissions
Inventory (NEI) Data
USEPA NEI point-source emission estimates. Includes location of
the facility and the amount of pollutant released.
8/7/17
Fish Monitoring Data SCDHEC Fish length, weight, species and mercury concentrations
within tissue
8/31/17
Watershed Index Online
(WSIO)
USEPA List of variables for each watershed including percent
wetlands, population density and more.
3/2/17
National Inventory of Dams USACE Dam location, type, purpose, and more. 5/17/17

52
APPENDIX B- VARIABLE EXPLANATION
Table B.1 Variable description for data referring to historical gold mines. If the variables
are marked as removed* is it is over 50% blank removed** denotes being over 80%
blank.
Variable Description Transformation
dep_id
A unique 12-digit system generated sequence number
which references records of information pertaining to a
mineral property.
Removed
url Online link to a report giving the complete record. Removed
mrds_id
Identification number used to refer to this entry in the
Mineral Resources Data System, if the record appeared
in that database.
Removed
mas_id
Identification number for this site as it appeared in the
Mineral Availability System/Mineral Industry Locator
System database.
Removed
site_name
Current (preferred) form of the name of the site,
deposit, or operation to which the record refers.
Removed
latitude Geographic latitude of the site, WGS84 None
longitude Geographic longitude of the site, WGS84 None
region Code indicating the geographic region Removed
country Name of the country in which the site is located Removed
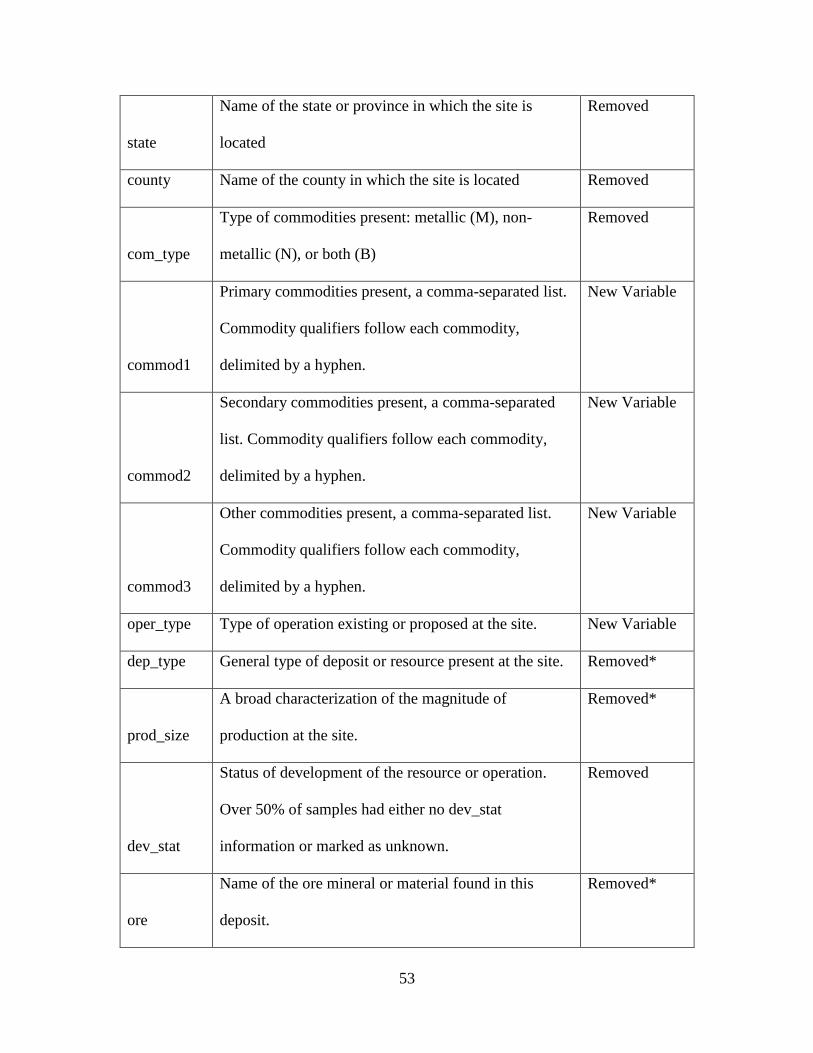
53
state
Name of the state or province in which the site is
located
Removed
county Name of the county in which the site is located Removed
com_type
Type of commodities present: metallic (M), non-
metallic (N), or both (B)
Removed
commod1
Primary commodities present, a comma-separated list.
Commodity qualifiers follow each commodity,
delimited by a hyphen.
New Variable
commod2
Secondary commodities present, a comma-separated
list. Commodity qualifiers follow each commodity,
delimited by a hyphen.
New Variable
commod3
Other commodities present, a comma-separated list.
Commodity qualifiers follow each commodity,
delimited by a hyphen.
New Variable
oper_type Type of operation existing or proposed at the site. New Variable
dep_type General type of deposit or resource present at the site. Removed*
prod_size
A broad characterization of the magnitude of
production at the site.
Removed*
dev_stat
Status of development of the resource or operation.
Over 50% of samples had either no dev_stat
information or marked as unknown.
Removed
ore
Name of the ore mineral or material found in this
deposit.
Removed*

54
gangue
Name of the gangue mineral or material found in this
deposit.
Removed**
other_matl
Name of other minerals or materials found in this
deposit.
Removed**
orebody_fm Form and shape of the ore body. Removed*
work_type General type of workings at the site. Removed*
model
Mineral deposit models that characterize the site.
Multiple models are delimited by braces, with a model
number for each.
Removed**
alteration
Geochemical alteration, if any, believed to have been
important in forming or modifying the ore materials of
a deposit.
Removed**
conc_proc
Geological processes that are believed to have
occurred to concentrate ore materials in the deposit.
Empty for all.
Removed**
names Names associated with the site Removed*
ore_ctrl
Geologic features, typically structural, that exert
control over the form, extent, or character of the
deposit.
Removed**
reporter
Geological processes that are believed to have
occurred to concentrate ore materials in the deposit
Removed
hrock_unit
Lithologic and stratigraphic information regarding the
host rocks for the ore deposit
Removed**

55
hrock_type
Controlled term(s) indicating the type of host rocks,
taken from Lithclass 6.2
Removed*
arock_unit
Lithologic and stratigraphic information regarding the
rocks for the ore deposit that are not specifically
identified as host ro
Removed**
arock_type
Controlled term(s) indicating the type of associated
rocks, taken from Lithclass 6.2
Removed**
structure
Description of geological structures at or near the
deposit.
Removed**
tectonic
Description of tectonic setting within which the
deposit is found, includes regional geologic structure.
Removed**
ref
Bibliographic references providing information
supporting the database record. Braces delimit multiple
references.
Removed
yfp_ba
Value < indicates production first began before the
year specified in YR_FST_PRD; > indicates
production began after that year.
New
Categorical
Variables
yr_fst_prd
Year of first production at the site. May be modified
by YFP_BA.
New
Categorical
Variable
ylp_ba
Value < indicates production ended before the year
specified in YR_LST_PRD; > indicates production
ended after that year.
New
Categorical
Variable

56
yr_lst_prd
Year of last production at the site. May be modified by
YLP_BA.
New
Categorical
Variable
dy_ba
If present, < in this field indicates that discovery
occurred prior to the value in DISC_YR; likewise >
indicates discovery occu[red afterwards.]
New
Categorical
Variable
disc_yr
Year the site was discovered. The value of DY_BA
may modify the meaning of this value.
New
Categorical
Variable
prod_yrs
Description of the production history, including breaks
or interruptions between first and last production
years.
New
Categorical
Variable
discr
Name and address (if known) of the company,
organization, or person most closely associated with
the discovery of the resource.
Removed

57
Table B.2 Variable description and transformation for all variables from the NEI
Variable Description Transformation
EIS_identifier
Emmisions Inventory System (EIS)
unique 8-digit identifier None
CO_(tons)
Carbon dioxide (CO) emission in
short tons per year Converted kg/year
VOC_(tons)
Volatile Organic Compounds (VOC)
emission in short tons/year Converted kg/year
NOX_(tons)
Oxides of Nitrogen (NOx) emission
in short tons/year Converted kg/year
NH3_(tons)
Ammonia (NH3) emission in short
tons/year Converted kg/year
SO2_(tons)
Sulfur Dioxide (SO2) emission in
short tons/year Converted kg/year
PM10_(tons)
Emissions of particulate matter less
than or equal to 10 microns in short
tons/year Converted kg/year
PM25_(tons)
Emissions of particulate matter less
than or equal to 2.5 microns in short
tons/year Converted kg/year
Lead_(tons) Lead emission in short tons/year Converted kg/year
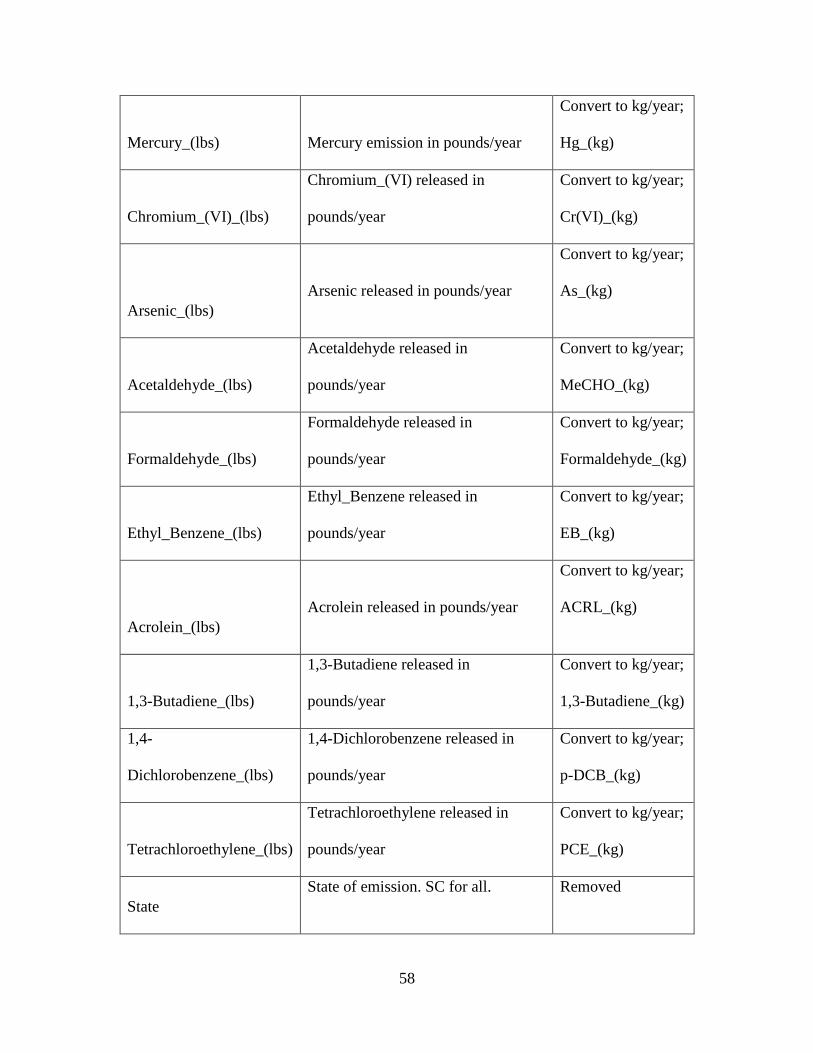
58
Mercury_(lbs) Mercury emission in pounds/year
Convert to kg/year;
Hg_(kg)
Chromium_(VI)_(lbs)
Chromium_(VI) released in
pounds/year
Convert to kg/year;
Cr(VI)_(kg)
Arsenic_(lbs)
Arsenic released in pounds/year
Convert to kg/year;
As_(kg)
Acetaldehyde_(lbs)
Acetaldehyde released in
pounds/year
Convert to kg/year;
MeCHO_(kg)
Formaldehyde_(lbs)
Formaldehyde released in
pounds/year
Convert to kg/year;
Formaldehyde_(kg)
Ethyl_Benzene_(lbs)
Ethyl_Benzene released in
pounds/year
Convert to kg/year;
EB_(kg)
Acrolein_(lbs)
Acrolein released in pounds/year
Convert to kg/year;
ACRL_(kg)
1,3-Butadiene_(lbs)
1,3-Butadiene released in
pounds/year
Convert to kg/year;
1,3-Butadiene_(kg)
1,4-
Dichlorobenzene_(lbs)
1,4-Dichlorobenzene released in
pounds/year
Convert to kg/year;
p-DCB_(kg)
Tetrachloroethylene_(lbs)
Tetrachloroethylene released in
pounds/year
Convert to kg/year;
PCE_(kg)
State
State of emission. SC for all. Removed

59
County County of the emission source Removed
Site_Name Site released Removed
Facility_Type Facility released Removed
Tribal_Name
The name of the tribe responsible for
the facility. Blank for all. Removed
City
City of the mailing address of the
facility Removed
Zip_Code Zip code of the facility Removed
NAICS_Code
North American Industry
Classification System (NAICS) code Removed
NAICS_Description
North American Industry
Classification System (NAICS)
description Removed
FIPS
Federal Information Processing
Standard (FIPS) code for the state
and county of the facility None
Street_Address Street address of the facility Removed
Latitude Latitude None
Longitude
Longitude None
EC_(tons)
Elemental carbon matter, computed
as a fraction of PM2.5 and often
Converted to
kg/year

60
used to estimate emissions of black
carbon, in short tons/year
OC_(tons)
Organic carbon matter, computed as
a fraction of PM2.5 in short
tons/year
Converted to
kg/year

61
Table B.3 Variable description for variables concerning mercury in fish tissue.
Variable Description Transformation
SAMPLE_ID
A unique identifier for each
sample. Consists of two letters
followed by five numbers. All
sample IDs for this dataset begin
with A.
None
LOCATION_CODE Code of the sample site. None
LOCATION_DESCRIPTION Describes the year and fish number Removed
COLLECTION_DATE
Day, month and year of collection. Separate
variables for
day, month, and
year.
COLLECTION_TIME
Collection time of variables. 0:00
for all samples.
Removed
SAMPLE_COLLECTOR Person who collected the sample. Removed
COUNTY County of sample collection None
PROGCHARGE
Program charged for sample. Water
pollution control (WPC) for all.
Removed
MATRIX Matric of sample, tissue for all. Removed
SAMPLE_TYPE GR3. Lab code. Removed
ANALYTE_NAME Mercury in Fish for all samples Removed

62
COMBINATION_RESULT
Amount of mercury measured.
Detection limit of <0.10
All samples
below detection
limit now equal
half the
detection limit.
ANALYSIS_UNIT
Refers to the unit of the mercury in
fish tissue analysis, mg/kg.
Removed
CAS_NUMBER
Refers to Storet Parameter code.
71930 for all. References mercury
total in specimen mg/kg wet
weight. Confirms mg/kg as units
for all.
Removed
SAMPLE_COMMENT_LINE_
1
Blank for all samples. Removed
SAMPLE_COMMENT_LINE_
2
Blank for all samples. Removed
SAMPLE_COMMENT_LINE_
3
Blank for all samples. Removed
SAMPLE_COMMENT_LINE_
4
Blank for all samples. Removed
SAMPLE_COMMENT_LINE_
5
Blank for all samples. Removed

63
SAMPLE_COMMENT_LINE_
6
Blank for all samples. Removed
SAMPLE_COMMENT_LINE_
7
Blank for all samples. Removed
SAMPLE_COMMENT_LINE_
8
Blank for all samples. Removed
SAMPLE_COMMENT_LINE_
9
Blank for all samples. Removed
SAMPLE_COMMENT_LINE_
10
Blank for all samples. Removed
SAMPLE_SPEC_INFO_1 Lab code. 126 for all. Removed
SAMPLE_SPEC_INFO_2 Varying. Lab code. Removed
SAMPLE_SPEC_INFO_3 86 for all. Lab code. Removed
SAMPLE_SPEC_INFO_4 Varying numbers. Lab code. Removed
SAMPLE_SPEC_INFO_5
Species codes. New categorical
variables denoted by species code
followed by ‘_species’.
New
Categorical
variables.
SAMPLE_SPEC_INFO_6 Filet for all samples. Removed
SAMPLE_SPEC_INFO_7
Sex. 1 denotes female. 0 denotes
male.
None
SAMPLE_SPEC_INFO_8 Number of individuals. None

64
SAMPLE_SPEC_INFO_9
Length in cm. Sample removed if it
lacked length data. 15 samples
removed out of 12423 samples for
the entirety of South Carolina.
None.
SAMPLE_SPEC_INFO_10 Weight in grams. None
VALIDATION_DATE Validation date. Removed

65
Table B.4 Variable description for all variables from Storet.
Variable Description Transformation
Org Name
The name of the organization
providing the sample
Removed
Station ID
Six character station identification.
It consists of three letters followed
by three numbers
None
State
State of sample. South Carolina for
all
Removed
County County of fish tissue sample. Removed
HUC
Hydrological Unit Cod (HUC) for
each sample. Empty for most
samples.
Removed
Generated HUC
Hydrological Unit Cod (HUC) for
each sample.
Removed
Station Latitude Latitude of the sample. None
Station Longitude Longitude of the sample. None
Station Horizontal Datum
Unknown. Two letters followed by
three numbers.
None
Visit Num Visit number Removed
Activity ID Identification ID for the activity Removed

66
Activity Start
Start date and time for the sampling
activity.
Separate
variable for day,
month and year.
Activity Start Zone Time zone for all samples. EDT. Removed
Activity Medium
Medium of the sample. Air,
sediment, or water
Categorical
variables.
Medium_Water,
Medium_Sedim
ent,
Medium_Air
Activity Type
Sample-composite without parents,
sample-routine, sample, field
msr/obs, sample-field subsample,
quality control field replicate
portable data logger, Field
Msr/Obs-Portable Data Logger
Quality Control Field Replicate
Msr/Obs
None
Activity Category-Rep Num
Sample-Composite Without Parents
Sample-Routine
Composite w/o Parents
Routine Sample
Field Replicate/Duplicate-1
Routine Msr/Obs
Replicate Msr/Obs-1
Integrated Vertical Profile
Sample-Field Subsample
Field Msr/Obs
None

67
Quality Control Field Replicate
Portable Data Logger
Field Msr/Obs-Portable Data
Logger
Quality Control Field Replicate
Msr/Obs
Activity Depth
Depth of sample, if any. Converted all
samples to
meters.
Activity Depth Unit Unit of depth of sample, if any. Removed
Sample Collection ID Sample collection ID None
Field Gear ID Field Gear ID None
Characteristic Name
228 distinctive characteristics of
samples.
None
Characteristic Description
Description of the characteristic
name
None
Sample Fraction
Sample fraction. Either total,
dissolved, non-filterable,
suspended or filterable. One
category used for each final
variable.
Removed
Value Type
Value type, either actual, calculated
or estimated.
None
Statistic Type
Statistic type, if any. Either blank
or mean.
None

68
Result Value as Text
Either not detected, not reported, or
a numerical value.
None
Result Value Status Either final or accepted. None
Result Value as Number
Results value as a number.
Converted to metric as necessary.
Metric
Units
Units of the results value as a
number. Converted to metric as
necessary.
Metric
Activity Comment Any extra comments. Blank for all. Removed
Result Comment
Usually comments on samples
which are below detection limit.
None
Result Measure Qualifier Blank for all (Hg) Removed
Weight Basis Blank for all (Hg) Removed
Temperature Basis Blank for all (Hg) Removed
Duration Basis Blank for all (Hg) Removed
Analytical Proc ID Analytical procedure id None
All Result
Detections/Thresholds
Gives the detection limit of the
method.
None
Analysis Date Date of analysis None
Analysis Date Zone Blank for all Removed
Conf Level Blank for all Removed
Confidence Interval Blank for all Removed

69
Result Depth Height Blank for all Removed
Result Depth Height Unit Blank for all Removed
Result Depth Altitude Ref Point Blank for all Removed
Result Sampling Point Blank for all Removed

70
Table B.5 Variable description for all dam related variables.
Variable Description Transformation
DAM_NAME Dam Name None
OTHER_DAM_NAME Other Dam Name Removed
DAM_FORMER_NAME Dam Former Name Removed
NIDID NID ID None
LONGITUDE Longitude None
LATITUDE Latitude None
SECTION
Section, Township, Range
Location
Removed
COUNTY County Removed
RIVER River Removed
OWNER_NAME Owner Name Removed
OWNER_TYPE Owner Type Removed
DAM_DESIGNER Dam Designer Removed
PRIVATE_DAM
Non-Federal Dam on Federal
Property
Removed
DAM_TYPE Dam Type. Earth, Removed
CORE Core Removed
FOUNDATION Foundation Removed

71
PRIMARY_PURPOSE Primary purpose of the dam.
New
Categorical
Variables.
YEAR_COMPLETED Year Completed
Categorical
variables, 50
year
increments.
YEAR_MODIFIED Year Modified Removed
DAM_LENGTH Dam Length (ft)
Converted to
meters.
DAM_HEIGHT Dam Height (ft)
Converted to
meters
STRUCTURAL_HEIGHT Structural Height (ft)
Converted to
meters
HYDRAULIC_HEIGHT Hydraulic Height (ft)
Converted to
meters
NID_HEIGHT NID Height (ft)
Converted to
meters
MAX_DISCHARGE
Maximum Discharge (Cubic
Feet/Second)
Converted to
cubic meters
per second

72
MAX_STORAGE Maximum Storage (acre-feet)
Converted to
cubic meters
NORMAL_STORAGE Normal Storage (acre-feet)
Converted to
cubic meters
NID_STORAGE NID Storage (acre-ft)
Converted to
cubic meters
SURFACE_AREA Surface Area (acres)
Converted to
square meters
DRAINAGE_AREA Drainage Area (square miles)
Converted to
square meters
EAP Emergency Action Plan Removed
INSPECTION_DATE Inspection Date Removed
INSPECTION_FREQUENCY Inspection Frequency Removed
STATE_REG_DAM State Regulated Dam Removed
STATE_REG_AGENCY State Regulatory Agency Removed
SPILLWAY_TYPE Spillway Type Removed
SPILLWAY_WIDTH Spillway Width Removed
OUTLET_GATES Outlet Gates Removed
VOLUME Volume (cubic yards)
Converted to
cubic meters
NUMBER_OF_LOCKS Number of Locks Removed
LENGTH_OF_LOCKS Length of Locks Removed

73
WIDTH_OF_LOCKS Width of Locks Removed
FED_FUNDING
Federal Agency Involvement in
Funding
Removed
FED_DESIGN
Federal Agency Involvement in
Design
Removed
FED_CONSTRUCTION
Federal Agency Involvement in
Construction
Removed
FED_REGULATORY
Federal Agency Involvement in
Regulatory
Removed
FED_INSPECTION
Federal Agency Involvement in
Inspection
Removed
FED_OPERATION
Federal Agency Involvement in
Operation
Removed
FED_OWNER Federal Agency Owner Removed
FED_OTHER Federal Agency Other Removed
SOURCE_AGENCY Source Agency Removed
STATE State Removed
URL_ADDRESS URL Address Removed
CONG_NAME Congressional Representative Removed
PARTY Congressional Representative Party Removed
CONG_DIST
Congressional Representative
District
Removed

74
OTHERSTRUCTUREID Other Structure ID Removed
NUMSEPARATESTRUCTUR
ES Number Separate Structures
Removed
PERMITTINGAUTHORITY Permitting Authority Removed
INSPECTIONAUTHORITY Inspection Authority Removed
ENFORCEMENTAUTHORIT
Y Enforcement Authority
Removed
JURISDICTIONALDAM State Jurisdictional Dam Removed
EAP_LAST_REV_DATE
Date of Last Revision of
Emergency Action Plan
Removed

75
Table B.6 Variable description for all variables from the WSIO.
Indicator Name Field_Name Watershed Indicator Description Source Transformation
Hydrologic
Unit Code 12-
Digit (HUC12)
HUC12_TEXT Twelve-digit Hydrologic Unit Code
(HUC12) from the NHDPlus2 WBD
Snapshot, EnviroAtlas Version (February
2015 version). The 12-digit Hydrologic
Unit is the smallest drainage area
delineation in the Watershed Boundary
Dataset (WBD) maintained by the US
Geological Survey and Natural
Resources Conservation Service. They
are identified by their 12-digit
Hydrologic Unit Code (HUC) and are
therefore referred to as HUC12s. (See
also WBD Snapshot, EnviroAtlas
Version glossary definitions).
NHDPlus2 WBD
Snapshot, EnviroAtlas
Version (February
2015 version)
None
Name HUC12
Watershed
NAME_HUC12 Name of the HUC12. Source data was
the NHDPlus2 WBD Snapshot (January
2015 version). (See also WBD Snapshot
glossary definition).
NHDPlus2 WBD
Snapshot (Version 01;
August 2012)
Removed
Hydrologic
Unit Code 8-
Digit (HUC8)
HUC08 Eight-digit Hydrologic Unit Code
(HUC8) that contains the HUC12.
Calculated as the first 8-digits of the
HUC12 code.
NHDPlus2 WBD
Snapshot, EnviroAtlas
Version (February
2015 version)
None
Name HUC8
Watershed
NAME_HUC08 Name of the 8-digit Hydrologic Unit
Code (HUC8) that contains the HUC12.
Source data was the WBDHU8
geospatial dataset, June 2013 version
(http://www.nrcs.usda.gov/wps/portal/nr
cs/main/national/water/watersheds/datase
t/; downloaded February 2014).
WBDHU8 (June 2013
version). Downloaded
from NRCS WBD
February 2014.
Removed
76
Hydrologic
Unit Code 6-
Digit (HUC6)
HUC06 Six-digit Hydrologic Unit Code (HUC6)
that contains the HUC12. Calculated as
the first 6-digits of the HUC12 code.
NHDPlus2 WBD
Snapshot (Version 01;
August 2012)
None
Name HUC6
Watershed
NAME_HUC06 Name of the 6-digit Hydrologic Unit
Code (HUC6) that contains the HUC12.
Source data was the WBDHU6
geospatial dataset, June 2013 version
(http://www.nrcs.usda.gov/wps/portal/nr
cs/main/national/water/watersheds/datase
t/; downloaded February 2014).
WBDHU6 (June 2013
version). Downloaded
from NRCS WBD
February 2014.
Removed
Downstream
HUC12
HUC12_NEXTH
UC_DS
The HUC12 located immediately
downstream from the outlet of the
HUC12. The downstream HUC12 was
identified as part of flow routing analysis
of HUC12s in the NHDPlus2 WBD
Snapshot, EnviroAtlas Version, using the
NHDPlus2 flow network. Created by
EPA EnviroAtlas in Fall 2015. (See also
NHDPlus2 and WBD Snapshot,
EnviroAtlas version glossary
definitions).
Based on analysis of
HUC12 flow routing
by EPA EnviroAtlas
in fall 2015 using
NHDPlus WBD
Snapshot, EnviroAtlas
Version (February
2015 version) and
NHDPlus2 flow
routing tables.
None
Upstream
HUC12 Count,
Not Including
This HUC12
UP_HUC_COUN
T_NOTINCL
Number of HUC12s upstream of, and
draining to, the HUC12. This count does
not include the HUC12 for which this
indicator is calculated. The number of
upstream HUC12s was determined as
part of flow routing analysis of HUC12s
in the NHDPlus2 WBD Snapshot,
EnviroAtlas Version, using the
NHDPlus2 flow network. Created by
EPA EnviroAtlas in Fall 2015. (See also
Based on analysis of
HUC12 flow routing
by EPA EnviroAtlas
in fall 2015 using
NHDPlus WBD
Snapshot, EnviroAtlas
Version (February
2015 version) and
NHDPlus2 flow
routing tables.
Removed
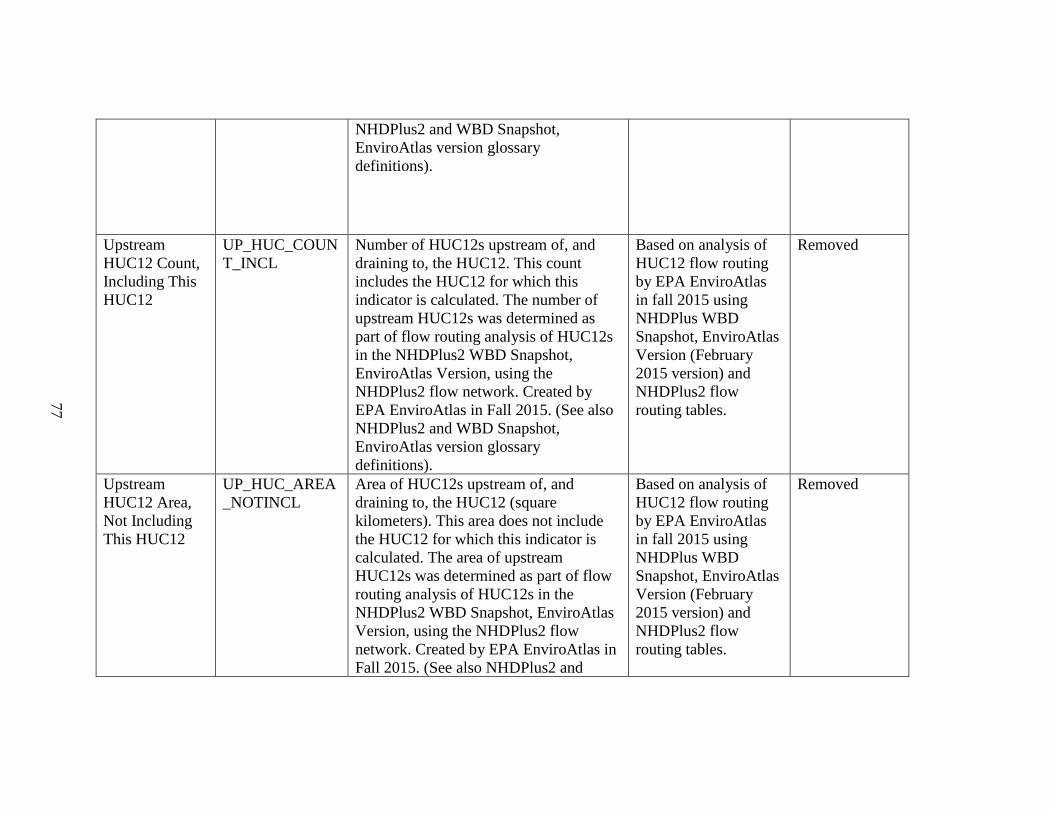
77
NHDPlus2 and WBD Snapshot,
EnviroAtlas version glossary
definitions).
Upstream
HUC12 Count,
Including This
HUC12
UP_HUC_COUN
T_INCL
Number of HUC12s upstream of, and
draining to, the HUC12. This count
includes the HUC12 for which this
indicator is calculated. The number of
upstream HUC12s was determined as
part of flow routing analysis of HUC12s
in the NHDPlus2 WBD Snapshot,
EnviroAtlas Version, using the
NHDPlus2 flow network. Created by
EPA EnviroAtlas in Fall 2015. (See also
NHDPlus2 and WBD Snapshot,
EnviroAtlas version glossary
definitions).
Based on analysis of
HUC12 flow routing
by EPA EnviroAtlas
in fall 2015 using
NHDPlus WBD
Snapshot, EnviroAtlas
Version (February
2015 version) and
NHDPlus2 flow
routing tables.
Removed
Upstream
HUC12 Area,
Not Including
This HUC12
UP_HUC_AREA
_NOTINCL
Area of HUC12s upstream of, and
draining to, the HUC12 (square
kilometers). This area does not include
the HUC12 for which this indicator is
calculated. The area of upstream
HUC12s was determined as part of flow
routing analysis of HUC12s in the
NHDPlus2 WBD Snapshot, EnviroAtlas
Version, using the NHDPlus2 flow
network. Created by EPA EnviroAtlas in
Fall 2015. (See also NHDPlus2 and
Based on analysis of
HUC12 flow routing
by EPA EnviroAtlas
in fall 2015 using
NHDPlus WBD
Snapshot, EnviroAtlas
Version (February
2015 version) and
NHDPlus2 flow
routing tables.
Removed

78
WBD Snapshot, EnviroAtlas version
glossary definitions).
Upstream
HUC12 Area,
Including This
HUC12
UP_HUC_AREA
_INCL
Area of HUC12s upstream of, and
draining to, the HUC12 (square
kilometers). This area includes the
HUC12 for which this indicator is
calculated. The area of upstream
HUC12s was determined as part of flow
routing analysis of HUC12s in the
NHDPlus2 WBD Snapshot, EnviroAtlas
Version, using the NHDPlus2 flow
network. Created by EPA EnviroAtlas in
Fall 2015. (See also NHDPlus2 and
WBD Snapshot, EnviroAtlas version
glossary definitions).
Based on analysis of
HUC12 flow routing
by EPA EnviroAtlas
in fall 2015 using
NHDPlus WBD
Snapshot, EnviroAtlas
Version (February
2015 version) and
NHDPlus2 flow
routing tables.
Removed
NHDPlus2
Catchment
COMID at
HUC12 Outlet
HUC12_OUTLE
T_COMID
The common identifier (COMID) for the
NHDPlus2 catchment located at the
downstream outlet of the HUC12.
Catchments are incremental drainage
areas for surface water features in the
NHDPlus2. The outlet COMID was
identified as part of flow routing analysis
of HUC12s in the NHDPlus2 WBD
Snapshot, EnviroAtlas Version, using the
NHDPlus2 flow network. Created by
EPA EnviroAtlas in Fall 2015. (See also
Based on analysis of
HUC12 flow routing
by EPA EnviroAtlas
in fall 2015 using
NHDPlus WBD
Snapshot, EnviroAtlas
Version (February
2015 version) and
NHDPlus2 flow
routing tables.
Removed

79
NHDPlus2 and WBD Snapshot,
EnviroAtlas version glossary
definitions).
Flow
Accumulation,
Mean in WS
FLOW_ACCUM
ULATION_MEA
N_WS
The mean value of flow accumulation in
the HUC12 (units are number of
upstream grid pixels). Flow
accumulation is a topographic measure
of the upstream drainage area of a
location. Source data used were
NHDPlus2 Flow Accumulation grids
(30-meter resolution; downloaded
October, 2012). (See also NHDPlus2
definition in glossary).
NHDPlus2 Flow
Accumulation grids
(downloaded October
2012)
None
Area of HUC12
Watershed
(Grid)
AREA__WS_GR
ID_SQMETER
The total area of the HUC12 in square
meters. Calculated from a 30-meter
resolution grid of HUC12 polygons in
the NHDPlus2 WBD Snapshot,
EnviroAtlas Version (February 2015
version). (See also WBD Snapshot,
EnviroAtlas Version glossary definition).
Grid of WBD
Snapshot, EnviroAtlas
Version (February
2015 version). Grid is
30-meter resolution
and aligned to
NLCD2011 Land
Cover grid.
None
% Land in
HUC12
Watershed
LAND_PCT_WS Percent of the HUC12 that is land (i.e.,
not classified as surface water by the
Water Mask). Source data was the Water
Mask grid (May 2015 version). Equation
used: (HUC12 Area - Water Mask Area)
Water Mask (May
2015 version). HUC12
Version: NHDPlus
WBD Snapshot,
EnviroAtlas Version
None

80
/ HUC12 Area * 100. (See also Water
Mask glossary definition).
(February 2015
version).
% Water in
HUC12
Watershed
WATER_PCT_W
S
Percent of the HUC12 that is surface
water, as identified by the Water Mask.
Source data was the Water Mask grid
(May 2015 version). Equation used:
Water Mask Area / HUC12 Area * 100.
(See also Water Mask glossary
definition).
Water Mask (May
2015 version). HUC12
Version: NHDPlus
WBD Snapshot,
EnviroAtlas Version
(February 2015
version).
None
%
Hydrologically
Connected
Zone (HCZ) in
Watershed
HCZ_PCT_WS Percent of the HUC12 that is in the
Hydrologically Connected Zone (HCZ).
Source data was the Hydrologically
Connected Zone grid (October 2015
version). Equation used: HCZ Area /
HUC12 Area * 100. (See also
Hydrologically Connected Zone glossary
definition).
HCZ Grid (October
2015 version). HUC12
Version: NHDPlus
WBD Snapshot,
EnviroAtlas Version
(February 2015
version).
Removed
% Riparian
Zone (RZ) in
Watershed
RIPARIAN_ZON
E_PCT_WS
Percent of the HUC12 that is in the
Riparian Zone (RZ). Source data was the
Riparian Zone grid (August 2015
version). Equation used: RZ Area /
HUC12 Area * 100. (See also Riparian
Zone glossary definition).
RZ Grid (August 2015
Version). HUC12
Version: NHDPlus
WBD Snapshot,
EnviroAtlas Version
(February 2015
version).
None
%
Hydrologically
Active Zone
HAZ_PCT_WS Percent of the HUC12 that is in the
Hydrologically Active Zone (HAZ).
Source data was the Hydrologically
Active Zone grid (October 2015 version).
HCZ Grid (October
2015 version) and RZ
Grid (August 2015
Version). HUC12
Removed

81
(HAZ) in
Watershed
Equation used: HAZ Area / HUC12 Area
* 100. (See also Hydrologically Active
Zone glossary definition).
Version: NHDPlus
WBD Snapshot,
EnviroAtlas Version
(February 2015
version).
Area
Hydrologically
Active Zone
(HAZ) in
Watershed
HAZ_WS Area of the Hydrologically Active Zone
(HAZ) in the HUC12 (square meters).
Source data was the Hydrologically
Active Zone grid (October 2015 version).
(See also Hydrologically Active Zone
glossary definition).
HCZ Grid (October
2015 version) and RZ
Grid (August 2015
Version). HUC12
Version: NHDPlus
WBD Snapshot,
EnviroAtlas Version
(February 2015
version).
Removed
NHDPlus2
Streamlength
STREAMLGTH_
NHD_MEDRES
Length of NHDPlus2 stream features in
the HUC12 (kilometers). Source data
was the NHDPlus2 NHD Snapshot. A
pre-processing step was applied to the
NHD Snapshot before calculating
streamlength to remove linear water
features that represented coastlines,
pipelines, and lake/reservoir centerlines.
Features in the NHD Snapshot used for
streamlength calculations only include
linear features with FTYPE (feature
type) equal to StreamRiver, CanalDitch,
or Connector. Linear features with
FTYPE equal to ArtificialPath are only
included if they pass through a NHDArea
feature with FTYPE equal to
NHDPlus2 NHD
Snapshot.
Downloaded March
2014. HUC12
Version: NHDPlus
WBD Snapshot,
EnviroAtlas Version
(February 2015
version).
Removed

82
StreamRiver. (See also NHD Snapshot
glossary definitions).
NHD High
Resolution
Streamlength
STREAMLGTH_
NHD_HIRES
Length of High Resolution National
Hydrography Database (NHD) stream
features in the HUC12 (kilometers).
Source data was the USGS High
Resolution NHD (downloaded April
2016;
ftp://rockyftp.cr.usgs.gov/vdelivery/Data
sets/Staged/Hydrography/NHD/State/Hig
hResolution). The High Resolution NHD
dataset was developed at the 1:24,000-
scale or higher, which adds detail to the
medium resolution 1:100,000-scale
NHD. A pre-processing step was applied
to the High Resolution NHD before
calculating streamlength to remove linear
water features that represented
coastlines, pipelines, and lake/reservoir
centerlines. Features in the High
Resolution NHD used for streamlength
calculations only include linear features
with FTYPE (feature type) equal to
StreamRiver, CanalDitch, or Connector.
USGS High
Resolution NHD.
Downloaded April
2016. HUC12
Version: NHDPlus
WBD Snapshot,
EnviroAtlas Version
(February 2015
version).
Removed

83
Linear features with FTYPE equal to
ArtificialPath are only included if they
pass through a NHDArea feature with
FTYPE equal to StreamRiver.
NHDPlus2
Waterbody
Area
WBAREA_NHD
_MEDRES
Area of NHDPlus2 waterbody features in
the HUC12 (square kilometers). Source
data was the NHDPlus2 NHD Snapshot.
(See also NHD Snapshot glossary
definitions).
NHDPlus2 NHD
Snapshot.
Downloaded March
2014. HUC12
Version: NHDPlus
WBD Snapshot,
EnviroAtlas Version
(February 2015
version).
Removed
NHD High
Resolution
Waterbody
Area
WBAREA_NHD
_HIRES
Area of High Resolution National
Hydrography Database (NHD)
waterbody features in the HUC12
(square kilometers). Source data was the
USGS High Resolution NHD
(downloaded April 2016;
ftp://rockyftp.cr.usgs.gov/vdelivery/Data
sets/Staged/Hydrography/NHD/State/Hig
USGS High
Resolution NHD.
Downloaded April
2016. HUC12
Version: NHDPlus
WBD Snapshot,
EnviroAtlas Version
REmoved

84
hResolution). The High Resolution NHD
dataset was developed at the 1:24,000-
scale or higher, which adds detail to the
medium resolution 1:100,000-scale
NHD.
(February 2015
version).
All States in
HUC12 (2013)
STATES2013 List of all states that the HUC12
intersects. Source data was the US
Census Bureau 2013 TIGER state
boundary dataset
(http://www2.census.gov/geo/tiger/TIGE
R2013/STATE/; downloaded July 2013).
Calculated by intersecting HUC12s with
the state boundaries dataset.
US Census Bureau
TIGER state boundary
polygons (2013
version). HUC12
Version: NHDPlus
WBD Snapshot,
EnviroAtlas Version
(February 2015
version).
Removed
State1 in
HUC12 (2013)
STATE1_2013 Two-letter abbreviation for the first state
that the HUC12 intersects (based on
alphabetical order). Source data was the
US Census Bureau 2013 TIGER state
boundary dataset
(http://www2.census.gov/geo/tiger/TIGE
R2013/STATE/; downloaded July 2013).
Calculated by intersecting HUC12s with
the state boundaries dataset.
US Census Bureau
TIGER state boundary
polygons (2013
version). HUC12
Version: NHDPlus
WBD Snapshot,
EnviroAtlas Version
(February 2015
version).
Removed
State2 in
HUC12 (2013)
STATE2_2013 Two-letter abbreviation for the second
state that the HUC12 intersects (based on
alphabetical order). Source data was the
US Census Bureau 2013 TIGER state
boundary dataset
(http://www2.census.gov/geo/tiger/TIGE
US Census Bureau
TIGER state boundary
polygons (2013
version). HUC12
Version: NHDPlus
WBD Snapshot,
Removed

85
R2013/STATE/; downloaded July 2013).
Calculated by intersecting HUC12s with
the state boundaries dataset.
EnviroAtlas Version
(February 2015
version).
State3 in
HUC12 (2013)
STATE3_2013 Two-letter abbreviation for the third state
that the HUC12 intersects (based on
alphabetical order). Source data was the
US Census Bureau 2013 TIGER state
boundary dataset
(http://www2.census.gov/geo/tiger/TIGE
R2013/STATE/; downloaded July 2013).
Calculated by intersecting HUC12s with
the state boundaries dataset.
US Census Bureau
TIGER state boundary
polygons (2013
version). HUC12
Version: NHDPlus
WBD Snapshot,
EnviroAtlas Version
(February 2015
version).
Removed
State4 in
HUC12 (2013)
STATE4_2013 Two-letter abbreviation for the fourth
state that the HUC12 intersects (based on
alphabetical order). Source data was the
US Census Bureau 2013 TIGER state
boundary dataset
(http://www2.census.gov/geo/tiger/TIGE
R2013/STATE/; downloaded July 2013).
Calculated by intersecting HUC12s with
the state boundaries dataset.
US Census Bureau
TIGER state boundary
polygons (2013
version). HUC12
Version: NHDPlus
WBD Snapshot,
EnviroAtlas Version
(February 2015
version).
Removed
Single State in
HUC12 Flag
INSTATE_2013 Flag indicating whether the HUC12 is
located entirely within a single state. A
value of 1 means that the HUC12 is
located in one state and a value of 0
means that the HUC12 crosses multiple
states. Source data was the US Census
Bureau 2013 TIGER state boundary
US Census Bureau
TIGER state boundary
polygons (2013
version). HUC12
Version: NHDPlus
WBD Snapshot,
EnviroAtlas Version
Removed

86
dataset
(http://www2.census.gov/geo/tiger/TIGE
R2013/STATE/; downloaded July 2013).
(February 2015
version).
Majority State
in HUC12
(2013)
STATE_MAJ_20
13
The majority state in the HUC12, defined
as the state with the greatest area in the
HUC12. Source data was the US Census
Bureau 2013 TIGER state boundary
dataset
(http://www2.census.gov/geo/tiger/TIGE
R2013/STATE/; downloaded July 2013).
US Census Bureau
TIGER state boundary
polygons (2013
version). HUC12
Version: NHDPlus
WBD Snapshot,
EnviroAtlas Version
(February 2015
version).
Removed
% Tribal Lands
in HUC12
Watershed
TRIBE_PCT Percent of the HUC12 constituting Tribal
lands. Source data was a Tribal land
geospatial dataset from
http://epamap5.epa.gov/ArcGIS/rest/serv
ices/EMEF/Tribal/MapServer/4,
including all lands associated with
Federally-recognized tribal entities
(Federally recognized Reservations, Off-
Reservation Trust Lands, and Census
Oklahoma Tribal Statistical Areas);
downloaded July 2014. Equation used:
Tribal Area / HUC12 Area * 100.
Tribal land geospatial
dataset from
http://epamap5.epa.go
v/ArcGIS/rest/services
/EMEF/Tribal/MapSer
ver/4, downloaded
July 2014.
Removed

87
Tribal Lands in
HUC12 Flag
TRIBE_FLAG Flag indicating whether Tribal lands are
located within the HUC12. A value of
"Y" means that the HUC12 contains
Tribal lands. Source data was a Tribal
land geospatial dataset from
http://epamap5.epa.gov/ArcGIS/rest/serv
ices/EMEF/Tribal/MapServer/4,
including all lands associated with
Federally-recognized tribal entities
(Federally recognized Reservations, Off-
Reservation Trust Lands, and Census
Oklahoma Tribal Statistical Areas);
downloaded July 2014.
Tribal land geospatial
dataset from
http://epamap5.epa.go
v/ArcGIS/rest/services
/EMEF/Tribal/MapSer
ver/4, downloaded
July 2014.
Removed
Adjacent to
Tribal HUC12s
TRIBE_BUFR Flag denoting HUC12s that have no
Tribal lands but that border HUC12s that
do contain Tribal lands. HUC12s that do
not contain Tribal lands but border
HUC12s with Tribal lands are assigned a
value of 1; all other HUC12s are
assigned a value of 0. Source data was a
Tribal land geospatial dataset from
http://epamap5.epa.gov/ArcGIS/rest/serv
ices/EMEF/Tribal/MapServer/4,
including all lands associated with
Federally-recognized tribal entities
(Federally recognized Reservations, Off-
Reservation Trust Lands, and Census
Oklahoma Tribal Statistical Areas);
downloaded July 2014.
Tribal land geospatial
dataset from
http://epamap5.epa.go
v/ArcGIS/rest/services
/EMEF/Tribal/MapSer
ver/4, downloaded
July 2014.
Removed

88
EPA Region EPA_REGION Identifies all EPA Regions that intersect
the HUC12. Source data was a list of
states in each EPA Region
(http://www.epa.gov/aboutepa/visiting-
regional-office) and the US Census
Bureau 2013 TIGER state boundaries
dataset
(http://www2.census.gov/geo/tiger/TIGE
R2013/STATE; downloaded July 2013).
Calculated by intersecting HUC12s with
the state boundaries dataset and
assigning EPA Regions based on states
in the HUC12.
US Census Bureau
TIGER state boundary
polygons (2013
version). HUC12
Version: NHDPlus
WBD Snapshot,
EnviroAtlas Version
(February 2015
version).
Removed
All Counties in
HUC12 (2016)
COUNTY_ALL List of all counties that the HUC12
intersects. County names are followed by
the two-letter state abbreviation that the
county is located in. Source data was the
US Census Bureau 2016 county
boundary dataset
http://www2.census.gov/geo/tiger/TIGE
R2016/COUNTY/; downloaded
September 2016). Calculated by
intersecting HUC12s with the county
boundaries dataset.
US Census Bureau
TIGER county
boundary polygons
(2016 version).
HUC12 Version:
NHDPlus WBD
Snapshot, EnviroAtlas
Version (February
2015 version).
Removed
Majority
County in
HUC12 (2016)
COUNTY_MAJ The majority county in the HUC12,
defined as the county with the greatest
area in the HUC12. The county name is
followed by the two-letter state
abbreviation that the county is located in.
Source data was the US Census Bureau
2016 county boundary dataset
US Census Bureau
TIGER county
boundary polygons
(2016 version).
HUC12 Version:
NHDPlus WBD
Snapshot, EnviroAtlas
Removed

89
http://www2.census.gov/geo/tiger/TIGE
R2016/COUNTY/; downloaded
September 2016).
Version (February
2015 version).
All Level 3
EcoRegions
(2013)
ECOREGION201
3_L3_CODES_A
LL
List of Level III Ecoregion codes for
ecoregions that intersect the HUC12.
Ecoregion codes are comma-separated in
order of largest to smallest area in the
HUC12. Source data was the Level III
Ecoregions of the Conterminous United
States geospatial dataset (April 2013
version;
http://archive.epa.gov/wed/ecoregions/w
eb/html/level_iii_iv-2.html). Calculated
by intersecting HUC12 polygons with
ecoregion polygons.
Level III Ecoregions
of the Conterminous
United States. April
16, 2013 version.
HUC12 Version:
NHDPlus WBD
Snapshot, EnviroAtlas
Version (February
2015 version).
Removed
Level 3
EcoRegion with
Largest Area
(2013)
ECOREGION201
3L3_1STCODE
The Level III Ecoregion code with the
largest area in the HUC12. Source data
was the Level III Ecoregions of the
Conterminous United States geospatial
dataset (April 2013 version;
http://archive.epa.gov/wed/ecoregions/w
eb/html/level_iii_iv-2.html). Calculated
by intersecting HUC12 polygons with
ecoregion polygons and selecting the
ecoregion with the largest area in the
HUC12.
Level III Ecoregions
of the Conterminous
United States. April
16, 2013 version.
HUC12 Version:
NHDPlus WBD
Snapshot, EnviroAtlas
Version (February
2015 version).
None

90
Slope, Mean
Value in
HUC12
Watershed
SLP_MEAN_WS Mean slope in the HUC12 (in degrees).
Source data was the NHDPlus2 National
Elevation Dataset (NED) Snapshot. (See
also NED Snapshot glossary definition).
NHDPlus2 NED
Snapshot, downloaded
October 2012.
None
Elevation,
Mean Value in
HUC12
Watershed
ELEVATION_C
M__MEAN_WS
Mean elevation in the HUC12 (in
centimeters). Source data was the
NHDPlus2 National Elevation Dataset
(NED) Snapshot. (See also NED
Snapshot glossary definition).
NHDPlus2 NED
Snapshot, downloaded
October 2012.
None
Elevation,
Minimum
Value in WS
ELEVATION_C
M__MIN_WS
Minimum elevation in the HUC12 (in
centimeters). Source data was the
NHDPlus2 National Elevation Dataset
(NED) Snapshot. (See also NED
Snapshot glossary definition).
NHDPlus2 NED
Snapshot, downloaded
October 2012.
Removed
Elevation,
Maximum
Value in WS
ELEVATION_C
M__MAX_WS
Maximum elevation in the HUC12 (in
centimeters). Source data was the
NHDPlus2 National Elevation Dataset
(NED) Snapshot. (See also NED
Snapshot glossary definition).
NHDPlus2 NED
Snapshot, downloaded
October 2012.
Removed
Mean Annual
Precipitation
(1981-2010) in
Watershed
AVGANUL_PRE
CIP81_10_IN_M
EAN_WS
Mean annual precipitation in the HUC12
(inches per year). Precipitation includes
both rain and snowfall. Source data was
an 800-meter resolution grid of 1981-
2010 mean annual precipitation in
millimeters from the PRISM Climate
Group at Oregon State University
(acquired October 2012). Calculated as
the average of precipitation grid values
per HUC12. This indicator was
calculated for EPA EnviroAtlas.
Additional information on source data
EPA EnviroAtlas
"Average Annual
Precipitation 1981-
2010 by HUC12 for
the Conterminous
United States" dataset.
May 7, 2015 version.
None

91
and calculation methods can be found at:
https://edg.epa.gov/metadata/catalog/sear
ch/resource/details.page?uuid=%7B2EE1
88C3-F66A-49CC-AD6D-
EE7C59F1C137%7D.
% MS4 in
HUC12
Watershed
MS4_PCT_WS Percent of the HUC12 that is in
Municipal Separate Storm Sewer
Systems (MS4s). An MS4 is a drainage
system that collects and conveys storm
water from developed lands. Includes
MS4s that are regulated under the EPA
National Pollutant Discharge Elimination
System (NPDES) storm water program;
non-regulated MS4s are not counted.
Source data was a geospatial dataset of
MS4 boundaries developed circa-2010
by EPA Office of Waste Management
(acquired via personal communication).
The MS4 boundary dataset was created
from a list of regulated MS4s,
jurisdictional boundaries for
municipalities and counties with
regulated MS4s, and urbanized area
boundaries from the US Census Bureau.
Equation used: MS4 Area / HUC12 Area
* 100.
Data from EPA Office
of Wastewater
Management, July
2014.
None

92
MS4 Area in
WS
MS4_AREA_SQ
KM_WS
Area of Municipal Separate Storm Sewer
Systems (MS4s) in the HUC12. An MS4
is a drainage system that collects and
conveys stormwater from developed
lands. Includes MS4s that are regulated
under the EPA National Pollutant
Discharge Elimination System (NPDES)
stormwater program; non-regulated
MS4s are not counted. Source data was a
geospatial dataset of MS4 boundaries
developed circa-2010 by EPA Office of
Waste Management (acquired via
personal communication). The MS4
boundary dataset was created from a list
of regulated MS4s, jurisdictional
boundaries for municipalities and
counties with regulated MS4s, and
urbanized area boundaries from the US
Census Bureau.
Data from EPA Office
of Wastewater
Management, July
2014.
Removed
% Forest in WS
(2011)
FOREST_CDLN
LCD11_PCT_WS
Percent of the HUC12 classified as forest
cover by the 2011 CDL-NLCD Hybrid
Land Cover dataset. Forest cover classes
include 'Deciduous Forest' (code 141),
'Evergreen Forest' (code 142), and
'Mixed Forest' (code 143) in the 2011
CDL-NLCD Hybrid Land Cover dataset.
Calculated as forest area divided by
HUC12 area, multiplied by 100. (See
also 2011 CDL-NLCD Hybrid Land
Cover glossary definition).
2011 CDL-NLCD,
EnviroAtlas Version
land cover (July 2015
version). HUC12
Version: NHDPlus
WBD Snapshot,
EnviroAtlas Version
(February 2015
version).
None

93
% Deciduous
Forest in WS
(2011)
LC141_CDLNLC
D11_PCT_WS
Percent of the HUC12 classified as
'Deciduous Forest' (code 141) by the
2011 CDL-NLCD Hybrid Land Cover
dataset. Calculated as 'Deciduous Forest'
area divided by HUC12 area, multiplied
by 100. (See also 2011 CDL-NLCD
Hybrid Land Cover glossary definition).
2011 CDL-NLCD,
EnviroAtlas Version
land cover (July 2015
version). HUC12
Version: NHDPlus
WBD Snapshot,
EnviroAtlas Version
(February 2015
version).
None
% Evergreen
Forest in WS
(2011)
LC142_CDLNLC
D11_PCT_WS
Percent of the HUC12 classified as
'Evergreen Forest' (code 142) by the
2011 CDL-NLCD Hybrid Land Cover
dataset. Calculated as 'Evergreen Forest'
area divided by HUC12 area, multiplied
by 100. (See also 2011 CDL-NLCD
Hybrid Land Cover glossary definition).
2011 CDL-NLCD,
EnviroAtlas Version
land cover (July 2015
version). HUC12
Version: NHDPlus
WBD Snapshot,
EnviroAtlas Version
(February 2015
version).
None
% Mixed Forest
in WS (2011)
LC143_CDLNLC
D11_PCT_WS
Percent of the HUC12 classified as
'Mixed Forest' (code 143) by the 2011
CDL-NLCD Hybrid Land Cover dataset.
Mixed forest includes a mixture of
deciduous and evergreen tree species.
Calculated as 'Mixed Forest' area divided
by HUC12 area, multiplied by 100. (See
also 2011 CDL-NLCD Hybrid Land
Cover glossary definition).
2011 CDL-NLCD,
EnviroAtlas Version
land cover (July 2015
version). HUC12
Version: NHDPlus
WBD Snapshot,
EnviroAtlas Version
(February 2015
version).
None

94
% Forest in
HCZ (2011)
FOREST_CDLN
LCD11_PCT_HZ
Percent of the HUC12 that is in the
Hydrologically Connected Zone and
classified as forest cover by the 2011
CDL-NLCD Hybrid Land Cover dataset.
Forest cover classes include 'Deciduous
Forest' (code 141), 'Evergreen Forest'
(code 142), and 'Mixed Forest' (code
143) in the 2011 CDL-NLCD Hybrid
Land Cover dataset. Calculated as forest
area in the Hydrologically Connected
Zone divided by HUC12 area, multiplied
by 100. (See also 2011 CDL-NLCD
Hybrid Land Cover and Hydrologically
Connected Zone glossary definitions).
2011 CDL-NLCD,
EnviroAtlas Version
land cover (July 2015
version) and HCZ
Grid (October 2015
version). HUC12
Version: NHDPlus
WBD Snapshot,
EnviroAtlas Version
(February 2015
version).
Removed
% Deciduous
Forest in HCZ
(2011)
LC141_CDLNLC
D11_PCT_HZ
Percent of the HUC12 that is in the
Hydrologically Connected Zone and
classified as 'Deciduous Forest' (code
141) by the 2011 CDL-NLCD Hybrid
Land Cover dataset. Calculated as
'Deciduous Forest' area in the
Hydrologically Connected Zone divided
by HUC12 area, multiplied by 100. (See
also 2011 CDL-NLCD Hybrid Land
Cover and Hydrologically Connected
Zone glossary definitions).
2011 CDL-NLCD,
EnviroAtlas Version
land cover (July 2015
version) and HCZ
Grid (October 2015
version). HUC12
Version: NHDPlus
WBD Snapshot,
EnviroAtlas Version
(February 2015
version).
Removed
% Evergreen
Forest in HCZ
(2011)
LC142_CDLNLC
D11_PCT_HZ
Percent of the HUC12 that is in the
Hydrologically Connected Zone and
classified as 'Evergreen Forest' (code
142) by the 2011 CDL-NLCD Hybrid
Land Cover dataset. Calculated as
'Evergreen Forest' area in the
2011 CDL-NLCD,
EnviroAtlas Version
land cover (July 2015
version) and HCZ
Grid (October 2015
version). HUC12
Removed

95
Hydrologically Connected Zone divided
by HUC12 area, multiplied by 100. (See
also 2011 CDL-NLCD Hybrid Land
Cover and Hydrologically Connected
Zone glossary definitions).
Version: NHDPlus
WBD Snapshot,
EnviroAtlas Version
(February 2015
version).
% Mixed Forest
in HCZ (2011)
LC143_CDLNLC
D11_PCT_HZ
Percent of the HUC12 that is in the
Hydrologically Connected Zone and
classified as 'Mixed Forest' (code 143) by
the 2011 CDL-NLCD Hybrid Land
Cover dataset. Mixed forest includes a
mixture of deciduous and evergreen tree
species. Calculated as 'Mixed Forest' area
in the Hydrologically Connected Zone
divided by HUC12 area, multiplied by
100. (See also 2011 CDL-NLCD Hybrid
Land Cover and Hydrologically
Connected Zone glossary definitions).
2011 CDL-NLCD,
EnviroAtlas Version
land cover (July 2015
version) and HCZ
Grid (October 2015
version). HUC12
Version: NHDPlus
WBD Snapshot,
EnviroAtlas Version
(February 2015
version).
Removed
% Forest in RZ
(2011)
FOREST_CDLN
LCD11_PCT_RZ
Percent of the HUC12 that is in the
Riparian Zone and classified as forest
cover by the 2011 CDL-NLCD Hybrid
Land Cover dataset. Forest cover classes
include 'Deciduous Forest' (code 141),
'Evergreen Forest' (code 142), and
'Mixed Forest' (code 143) in the 2011
CDL-NLCD Hybrid Land Cover dataset.
Calculated as forest area in the Riparian
Zone divided by HUC12 area, multiplied
by 100. (See also 2011 CDL-NLCD
Hybrid Land Cover and Riparian Zone
glossary definitions).
2011 CDL-NLCD,
EnviroAtlas Version
land cover (July 2015
version) and RZ Grid
(August 2015
Version). HUC12
Version: NHDPlus
WBD Snapshot,
EnviroAtlas Version
(February 2015
version).
None

96
% Deciduous
Forest in RZ
(2011)
LC141_CDLNLC
D11_PCT_RZ
Percent of the HUC12 that is in the
Riparian Zone and classified as
'Deciduous Forest' (code 141) by the
2011 CDL-NLCD Hybrid Land Cover
dataset. Calculated as 'Deciduous Forest'
area in the Riparian Zone divided by
HUC12 area, multiplied by 100. (See
also 2011 CDL-NLCD Hybrid Land
Cover and Riparian Zone glossary
definitions).
2011 CDL-NLCD,
EnviroAtlas Version
land cover (July 2015
version) and RZ Grid
(August 2015
Version). HUC12
Version: NHDPlus
WBD Snapshot,
EnviroAtlas Version
(February 2015
version).
None
% Evergreen
Forest in RZ
(2011)
LC142_CDLNLC
D11_PCT_RZ
Percent of the HUC12 that is in the
Riparian Zone and classified as
'Evergreen Forest' (code 142) by the
2011 CDL-NLCD Hybrid Land Cover
dataset. Calculated as 'Evergreen Forest'
area in the Riparian Zone divided by
HUC12 area, multiplied by 100. (See
also 2011 CDL-NLCD Hybrid Land
Cover and Riparian Zone glossary
definitions).
2011 CDL-NLCD,
EnviroAtlas Version
land cover (July 2015
version) and RZ Grid
(August 2015
Version). HUC12
Version: NHDPlus
WBD Snapshot,
EnviroAtlas Version
(February 2015
version).
None
% Mixed Forest
in RZ (2011)
LC143_CDLNLC
D11_PCT_RZ
Percent of the HUC12 that is in the
Riparian Zone and classified as 'Mixed
Forest' (code 143) by the 2011 CDL-
NLCD Hybrid Land Cover dataset.
Mixed forest includes a mixture of
deciduous and evergreen tree species.
Calculated as 'Mixed Forest' area in the
Riparian Zone divided by HUC12 area,
multiplied by 100. (See also 2011 CDL-
2011 CDL-NLCD,
EnviroAtlas Version
land cover (July 2015
version) and RZ Grid
(August 2015
Version). HUC12
Version: NHDPlus
WBD Snapshot,
EnviroAtlas Version
None

97
NLCD Hybrid Land Cover and Riparian
Zone glossary definitions).
(February 2015
version).
% Forest
Change in WS
(2001-11)
FOREST_CHG_2
001_11_PCT_WS
The change in the percentage of the
HUC12 with forest cover from 2001 to
2011. Source data was the National Land
Cover Database 2011 (NLCD 2011)
2001 to 2011 Land Cover From To
Change Index dataset, March 2014
version
(http://www.mrlc.gov/nlcd11_data.php;
downloaded April 2015). Forest cover
classes include 'Deciduous Forest',
'Evergreen Forest', and 'Mixed Forest';
codes 41, 42, and 43 in the 2001 to 2011
Land Cover From To Change Index
dataset. Positive values denote an
increase in forest; negative values denote
a decrease in forest. Does not count areas
that changed to/from the 'Open Water'
class (code 11) since these were assumed
to be errors. Equation used: (Area
Changing To Forest – Area Changing
From Forest)/(HUC12 Area) * 100.
NLCD 2001-2011
Land Cover From to
Change index (2011
Edition; March 2014
version). HUC12
Version: NHDPlus
WBD Snapshot,
EnviroAtlas Version
(February 2015
version).
Removed

98
% Forest
Change in HCZ
(2001-11)
FOREST_CHG_2
001_11_PCT_HZ
The change in the percentage of the
HUC12 with forest cover in the
Hydrologically Connected Zone (HCZ)
from 2001 to 2011. Source data was the
National Land Cover Database 2011
(NLCD 2011) 2001 to 2011 Land Cover
From To Change Index dataset, March
2014 version
(http://www.mrlc.gov/nlcd11_data.php;
downloaded April 2015). Forest cover
classes include 'Deciduous Forest',
'Evergreen Forest', and 'Mixed Forest'
cover classes; codes 41, 42, and 43 in the
2001 to 2011 Land Cover From To
Change Index dataset. Positive values
denote an increase in forest; negative
values denote a decrease in forest. Does
not count areas that changed to/from the
'Open Water' class (code 11) since these
were assumed to be errors. Equation
used: (Area Changing to Forest in the
HCZ – Area Changing From Forest in
the HCZ)/(HUC12 Area) * 100. (See
also Hydrologically Connected Zone
glossary definition).
NLCD 2001-2011
Land Cover From to
Change index (2011
Edition; March 2014
version) and HCZ
Grid (October 2015
version). HUC12
Version: NHDPlus
WBD Snapshot,
EnviroAtlas Version
(February 2015
version).
Removed
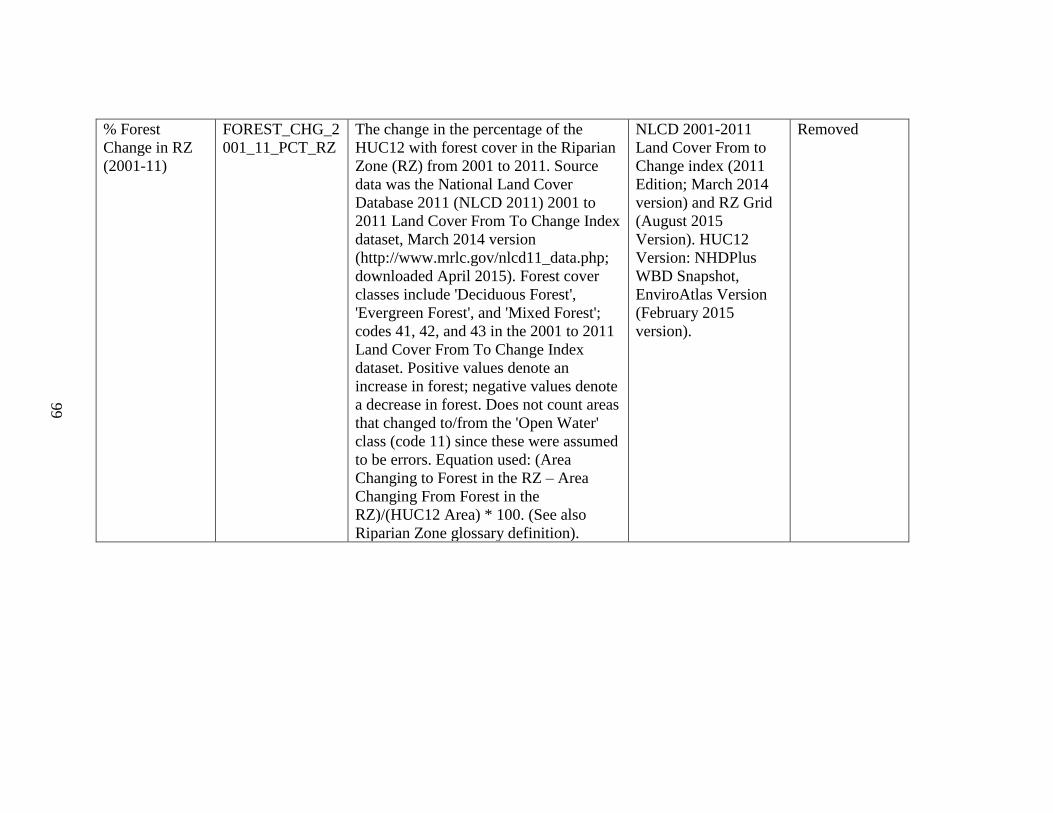
99
% Forest
Change in RZ
(2001-11)
FOREST_CHG_2
001_11_PCT_RZ
The change in the percentage of the
HUC12 with forest cover in the Riparian
Zone (RZ) from 2001 to 2011. Source
data was the National Land Cover
Database 2011 (NLCD 2011) 2001 to
2011 Land Cover From To Change Index
dataset, March 2014 version
(http://www.mrlc.gov/nlcd11_data.php;
downloaded April 2015). Forest cover
classes include 'Deciduous Forest',
'Evergreen Forest', and 'Mixed Forest';
codes 41, 42, and 43 in the 2001 to 2011
Land Cover From To Change Index
dataset. Positive values denote an
increase in forest; negative values denote
a decrease in forest. Does not count areas
that changed to/from the 'Open Water'
class (code 11) since these were assumed
to be errors. Equation used: (Area
Changing to Forest in the RZ – Area
Changing From Forest in the
RZ)/(HUC12 Area) * 100. (See also
Riparian Zone glossary definition).
NLCD 2001-2011
Land Cover From to
Change index (2011
Edition; March 2014
version) and RZ Grid
(August 2015
Version). HUC12
Version: NHDPlus
WBD Snapshot,
EnviroAtlas Version
(February 2015
version).
Removed
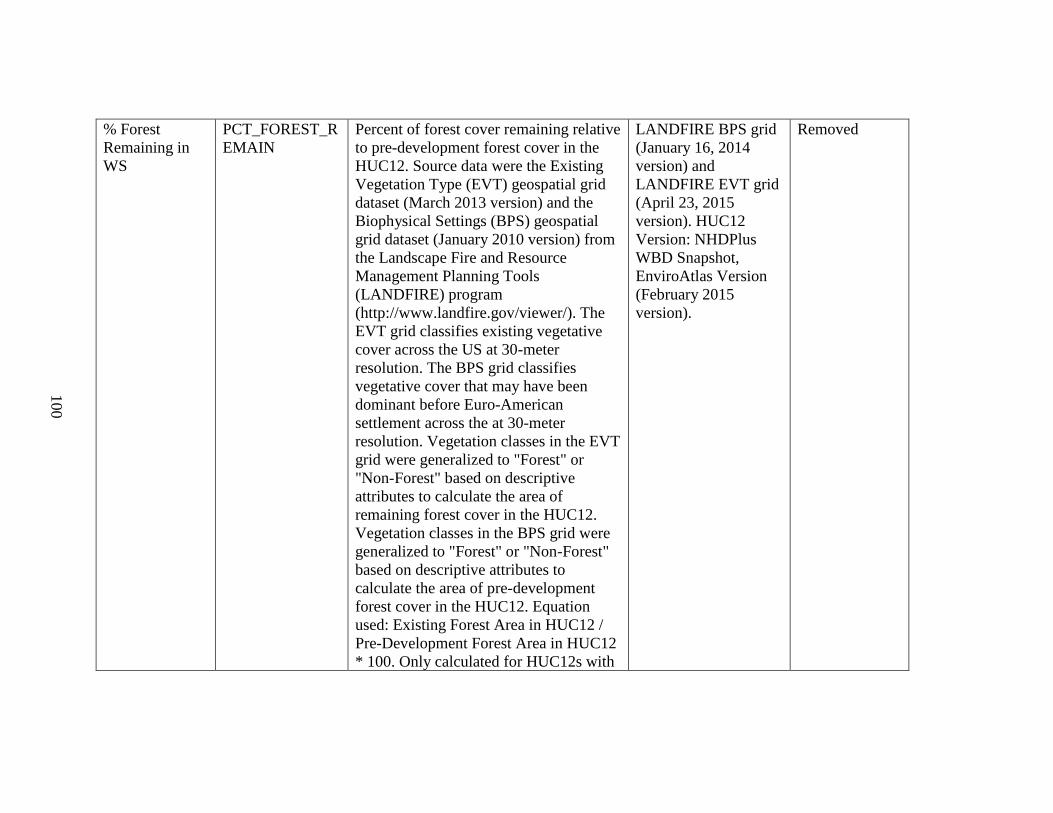
100
% Forest
Remaining in
WS
PCT_FOREST_R
EMAIN
Percent of forest cover remaining relative
to pre-development forest cover in the
HUC12. Source data were the Existing
Vegetation Type (EVT) geospatial grid
dataset (March 2013 version) and the
Biophysical Settings (BPS) geospatial
grid dataset (January 2010 version) from
the Landscape Fire and Resource
Management Planning Tools
(LANDFIRE) program
(http://www.landfire.gov/viewer/). The
EVT grid classifies existing vegetative
cover across the US at 30-meter
resolution. The BPS grid classifies
vegetative cover that may have been
dominant before Euro-American
settlement across the at 30-meter
resolution. Vegetation classes in the EVT
grid were generalized to "Forest" or
"Non-Forest" based on descriptive
attributes to calculate the area of
remaining forest cover in the HUC12.
Vegetation classes in the BPS grid were
generalized to "Forest" or "Non-Forest"
based on descriptive attributes to
calculate the area of pre-development
forest cover in the HUC12. Equation
used: Existing Forest Area in HUC12 /
Pre-Development Forest Area in HUC12
* 100. Only calculated for HUC12s with
LANDFIRE BPS grid
(January 16, 2014
version) and
LANDFIRE EVT grid
(April 23, 2015
version). HUC12
Version: NHDPlus
WBD Snapshot,
EnviroAtlas Version
(February 2015
version).
Removed

101
pre-development forest area greater than
or equal to 5% of HUC12 area.
% Shrub/Scrub
in WS (2011)
LC152_CDLNLC
D11_PCT_WS
Percent of the HUC12 classified as
'Shrub/Scrub' (code 152) by the 2011
CDL-NLCD Hybrid Land Cover dataset.
Calculated as 'Shrub/Scrub' area divided
by HUC12 area, multiplied by 100. (See
also 2011 CDL-NLCD Hybrid Land
Cover glossary definition).
2011 CDL-NLCD,
EnviroAtlas Version
land cover (July 2015
version). HUC12
Version: NHDPlus
WBD Snapshot,
EnviroAtlas Version
(February 2015
version).
None
% Shrub/Scrub
in HCZ (2011)
LC152_CDLNLC
D11_PCT_HZ
Percent of the HUC12 that is in the
Hydrologically Connected Zone and
classified as 'Shrub/Scrub' (code 152) by
the 2011 CDL-NLCD Hybrid Land
Cover dataset. Calculated as
'Shrub/Scrub' area in the Hydrologically
2011 CDL-NLCD,
EnviroAtlas Version
land cover (July 2015
version) and HCZ
Grid (October 2015
version). HUC12
Removed
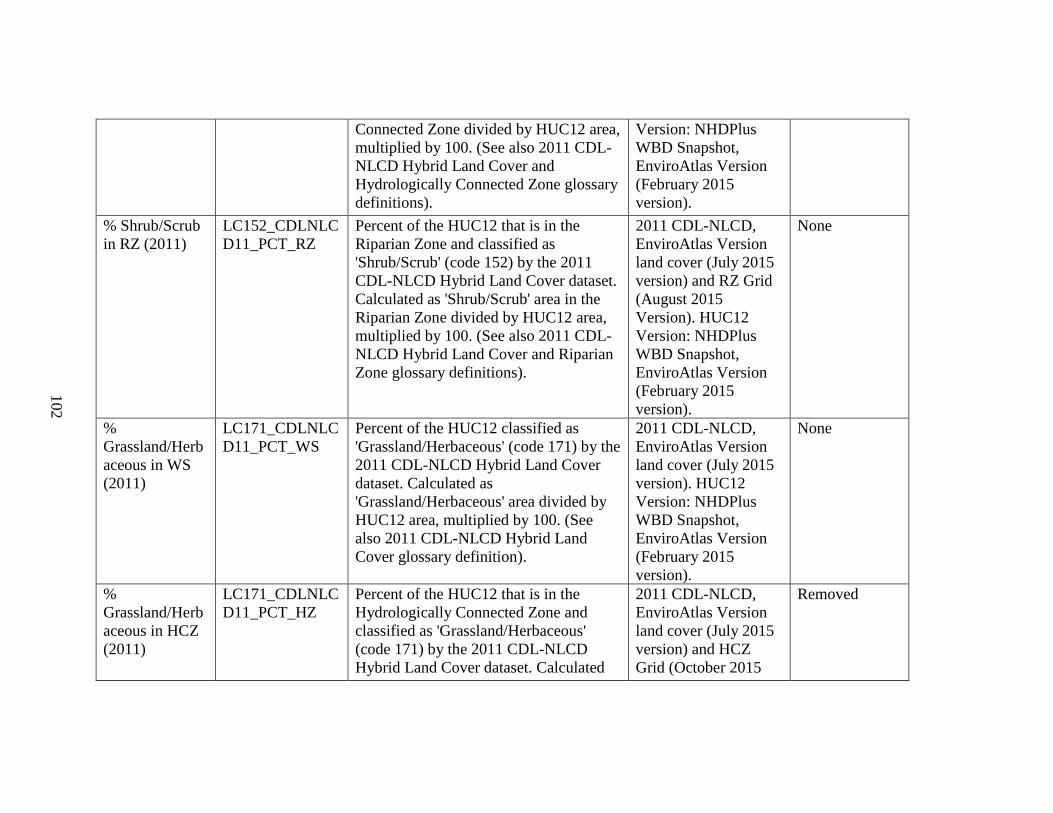
102
Connected Zone divided by HUC12 area,
multiplied by 100. (See also 2011 CDL-
NLCD Hybrid Land Cover and
Hydrologically Connected Zone glossary
definitions).
Version: NHDPlus
WBD Snapshot,
EnviroAtlas Version
(February 2015
version).
% Shrub/Scrub
in RZ (2011)
LC152_CDLNLC
D11_PCT_RZ
Percent of the HUC12 that is in the
Riparian Zone and classified as
'Shrub/Scrub' (code 152) by the 2011
CDL-NLCD Hybrid Land Cover dataset.
Calculated as 'Shrub/Scrub' area in the
Riparian Zone divided by HUC12 area,
multiplied by 100. (See also 2011 CDL-
NLCD Hybrid Land Cover and Riparian
Zone glossary definitions).
2011 CDL-NLCD,
EnviroAtlas Version
land cover (July 2015
version) and RZ Grid
(August 2015
Version). HUC12
Version: NHDPlus
WBD Snapshot,
EnviroAtlas Version
(February 2015
version).
None
%
Grassland/Herb
aceous in WS
(2011)
LC171_CDLNLC
D11_PCT_WS
Percent of the HUC12 classified as
'Grassland/Herbaceous' (code 171) by the
2011 CDL-NLCD Hybrid Land Cover
dataset. Calculated as
'Grassland/Herbaceous' area divided by
HUC12 area, multiplied by 100. (See
also 2011 CDL-NLCD Hybrid Land
Cover glossary definition).
2011 CDL-NLCD,
EnviroAtlas Version
land cover (July 2015
version). HUC12
Version: NHDPlus
WBD Snapshot,
EnviroAtlas Version
(February 2015
version).
None
%
Grassland/Herb
aceous in HCZ
(2011)
LC171_CDLNLC
D11_PCT_HZ
Percent of the HUC12 that is in the
Hydrologically Connected Zone and
classified as 'Grassland/Herbaceous'
(code 171) by the 2011 CDL-NLCD
Hybrid Land Cover dataset. Calculated
2011 CDL-NLCD,
EnviroAtlas Version
land cover (July 2015
version) and HCZ
Grid (October 2015
Removed

103
as 'Grassland/Herbaceous' area in the
Hydrologically Connected Zone divided
by HUC12 area, multiplied by 100. (See
also 2011 CDL-NLCD Hybrid Land
Cover and Hydrologically Connected
Zone glossary definitions).
version). HUC12
Version: NHDPlus
WBD Snapshot,
EnviroAtlas Version
(February 2015
version).
%
Grassland/Herb
aceous in RZ
(2011)
LC171_CDLNLC
D11_PCT_RZ
Percent of the HUC12 that is in the
Riparian Zone and classified as
'Grassland/Herbaceous' (code 171) by the
2011 CDL-NLCD Hybrid Land Cover
dataset. Calculated as
'Grassland/Herbaceous' area in the
Riparian Zone divided by HUC12 area,
multiplied by 100. (See also 2011 CDL-
NLCD Hybrid Land Cover and Riparian
Zone glossary definitions).
2011 CDL-NLCD,
EnviroAtlas Version
land cover (July 2015
version) and RZ Grid
(August 2015
Version). HUC12
Version: NHDPlus
WBD Snapshot,
EnviroAtlas Version
(February 2015
version).
% Wetlands in
WS (2011)
WETLANDS_CD
LNLCD11_PCT_
WS
Percent of the HUC12 classified as
wetland cover by the 2011 CDL-NLCD
Hybrid Land Cover dataset. Wetland
cover classes include 'Woody Wetlands'
(code 190), and 'Emergent Herbaceous
Wetlands' (code 195) in the 2011 CDL-
NLCD Hybrid Land Cover dataset.
Calculated as wetland area divided by
HUC12 area, multiplied by 100. (See
also 2011 CDL-NLCD Hybrid Land
Cover glossary definition).
2011 CDL-NLCD,
EnviroAtlas Version
land cover (July 2015
version). HUC12
Version: NHDPlus
WBD Snapshot,
EnviroAtlas Version
(February 2015
version).
None

104
% Wetlands in
HCZ (2011)
WETLANDS_CD
LNLCD11_PCT_
HZ
Percent of the HUC12 that is in the
Hydrologically Connected Zone and
classified as wetland cover by the 2011
CDL-NLCD Hybrid Land Cover dataset.
Wetland cover classes include 'Woody
Wetlands' (code 190), and 'Emergent
Herbaceous Wetlands' (code 195) in the
2011 CDL-NLCD Hybrid Land Cover
dataset. Calculated as wetland area in the
Hydrologically Connected Zone divided
by HUC12 area, multiplied by 100. (See
also 2011 CDL-NLCD Hybrid Land
Cover and Hydrologically Connected
Zone glossary definitions).
2011 CDL-NLCD,
EnviroAtlas Version
land cover (July 2015
version) and HCZ
Grid (October 2015
version). HUC12
Version: NHDPlus
WBD Snapshot,
EnviroAtlas Version
(February 2015
version).
Removed
% Wetlands in
RZ (2011)
WETLANDS_CD
LNLCD11_PCT_
RZ
Percent of the HUC12 that is in the
Riparian Zone and classified as wetland
cover by the 2011 CDL-NLCD Hybrid
Land Cover dataset. Wetland cover
classes include 'Woody Wetlands' (code
190), and 'Emergent Herbaceous
Wetlands' (code 195) in the 2011 CDL-
NLCD Hybrid Land Cover dataset.
Calculated as wetland area in the
Riparian Zone divided by HUC12 area,
multiplied by 100. (See also 2011 CDL-
NLCD Hybrid Land Cover and Riparian
Zone glossary definitions).
2011 CDL-NLCD,
EnviroAtlas Version
land cover (July 2015
version) and RZ Grid
(August 2015
Version). HUC12
Version: NHDPlus
WBD Snapshot,
EnviroAtlas Version
(February 2015
version).
None

105
% Wetlands
Change in WS
(2001-11)
WETLAND_CH
G_2001_11_PCT
_WS
The change in the percentage of the
HUC12 with wetland cover from 2001 to
2011. Source data was the National Land
Cover Database 2011 (NLCD 2011)
2001 to 2011 Land Cover From To
Change Index dataset, March 2014
version
(http://www.mrlc.gov/nlcd11_data.php;
downloaded April 2015). Wetlands cover
classes include 'Woody Wetlands' and
'Emergent Herbaceous Wetlands'; codes
90 and 95 in the 2001 to 2011 Land
Cover From To Change Index dataset.
Positive values denote an increase in
wetlands; negative values denote a
decrease in wetlands. Does not count
areas that changed to/from the 'Open
Water' class (code 11) since these were
assumed to be errors. Equation used:
(Area Changing To Wetlands – Area
Changing From Wetlands)/(HUC12
Area) * 100.
NLCD 2001-2011
Land Cover From to
Change index (2011
Edition; March 2014
version). HUC12
Version: NHDPlus
WBD Snapshot,
EnviroAtlas Version
(February 2015
version).
None

106
% Wetlands
Change in HCZ
(2001-11)
WETLAND_CH
G_2001_11_PCT
_HZ
The change in the percentage of the
HUC12 with wetland cover in the
Hydrologically Connected Zone (HCZ)
from 2001 to 2011. Source data was the
National Land Cover Database 2011
(NLCD 2011) 2001 to 2011 Land Cover
From To Change Index dataset, March
2014 version
(http://www.mrlc.gov/nlcd11_data.php;
downloaded April 2015). Wetland cover
classes include 'Woody Wetlands' and
'Emergent Herbaceous Wetlands'; codes
90 and 95 in the 2001 to 2011 Land
Cover From To Change Index dataset.
Positive values denote an increase in
wetlands; negative values denote a
decrease in wetlands. Does not count
areas that changed to/from the 'Open
Water' class (code 11) since these were
assumed to be errors. Equation used:
(Area Changing to Wetlands in the HCZ
– Area Changing From Wetlands in the
HCZ)/(HUC12 Area) * 100. (See also
Hydrologically Connected Zone glossary
definition).
NLCD 2001-2011
Land Cover From to
Change index (2011
Edition; March 2014
version) and HCZ
Grid (October 2015
version). HUC12
Version: NHDPlus
WBD Snapshot,
EnviroAtlas Version
(February 2015
version).
Removed

107
% Wetlands
Change in RZ
(2001-11)
WETLAND_CH
G_2001_11_PCT
_RZ
The change in the percentage of the
HUC12 with wetland cover in the
Riparian Zone (RZ) from 2001 to 2011.
Source data was the National Land Cover
Database 2011 (NLCD 2011) 2001 to
2011 Land Cover From To Change Index
dataset, March 2014 version
(http://www.mrlc.gov/nlcd11_data.php;
downloaded April 2015). Wetlands cover
classes include 'Woody Wetlands' and
'Emergent Herbaceous Wetlands'; codes
90 and 95 in the 2001 to 2011 Land
Cover From To Change Index dataset.
Positive values denote an increase in
wetlands; negative values denote a
decrease in wetlands. Does not count
areas that changed to/from the 'Open
Water' class (code 11) since these were
assumed to be errors. Equation used:
(Area Changing to Wetlands in the RZ –
Area Changing From Wetlands in the
RZ)/(HUC12 Area) * 100. (See also
Riparian Zone glossary definition).
NLCD 2001-2011
Land Cover From to
Change index (2011
Edition; March 2014
version) and RZ Grid
(August 2015
Version). HUC12
Version: NHDPlus
WBD Snapshot,
EnviroAtlas Version
(February 2015
version).
Removed
% Emergent
Herbaceous
Wetlands in WS
(2011)
LC195_CDLNLC
D11_PCT_WS
Percent of the HUC12 classified as
'Emergent Herbaceous Wetlands' (code
195) by the 2011 CDL-NLCD Hybrid
Land Cover dataset. Calculated as
'Emergent Herbaceous Wetlands' area
divided by HUC12 area, multiplied by
100. (See also 2011 CDL-NLCD Hybrid
Land Cover glossary definition).
2011 CDL-NLCD,
EnviroAtlas Version
land cover (July 2015
version). HUC12
Version: NHDPlus
WBD Snapshot,
EnviroAtlas Version
None

108
(February 2015
version).
% Emergent
Herbaceous
Wetlands in
HCZ (2011)
LC195_CDLNLC
D11_PCT_HZ
Percent of the HUC12 that is in the
Hydrologically Connected Zone and
classified as 'Emergent Herbaceous
Wetlands' (code 195) by the 2011 CDL-
NLCD Hybrid Land Cover dataset.
Calculated as 'Emergent Herbaceous
Wetlands' area in the Hydrologically
Connected Zone divided by HUC12 area,
multiplied by 100. (See also 2011 CDL-
NLCD Hybrid Land Cover and
Hydrologically Connected Zone glossary
definitions).
2011 CDL-NLCD,
EnviroAtlas Version
land cover (July 2015
version) and HCZ
Grid (October 2015
version). HUC12
Version: NHDPlus
WBD Snapshot,
EnviroAtlas Version
(February 2015
version).
Removed
% Emergent
Herbaceous
Wetlands in RZ
(2011)
LC195_CDLNLC
D11_PCT_RZ
Percent of the HUC12 that is in the
Riparian Zone and classified as
'Emergent Herbaceous Wetlands' (code
195) by the 2011 CDL-NLCD Hybrid
Land Cover dataset. Calculated as
'Emergent Herbaceous Wetlands' area in
the Riparian Zone divided by HUC12
area, multiplied by 100. (See also 2011
CDL-NLCD Hybrid Land Cover and
Riparian Zone glossary definitions).
2011 CDL-NLCD,
EnviroAtlas Version
land cover (July 2015
version) and RZ Grid
(August 2015
Version). HUC12
Version: NHDPlus
WBD Snapshot,
EnviroAtlas Version
(February 2015
version).
None
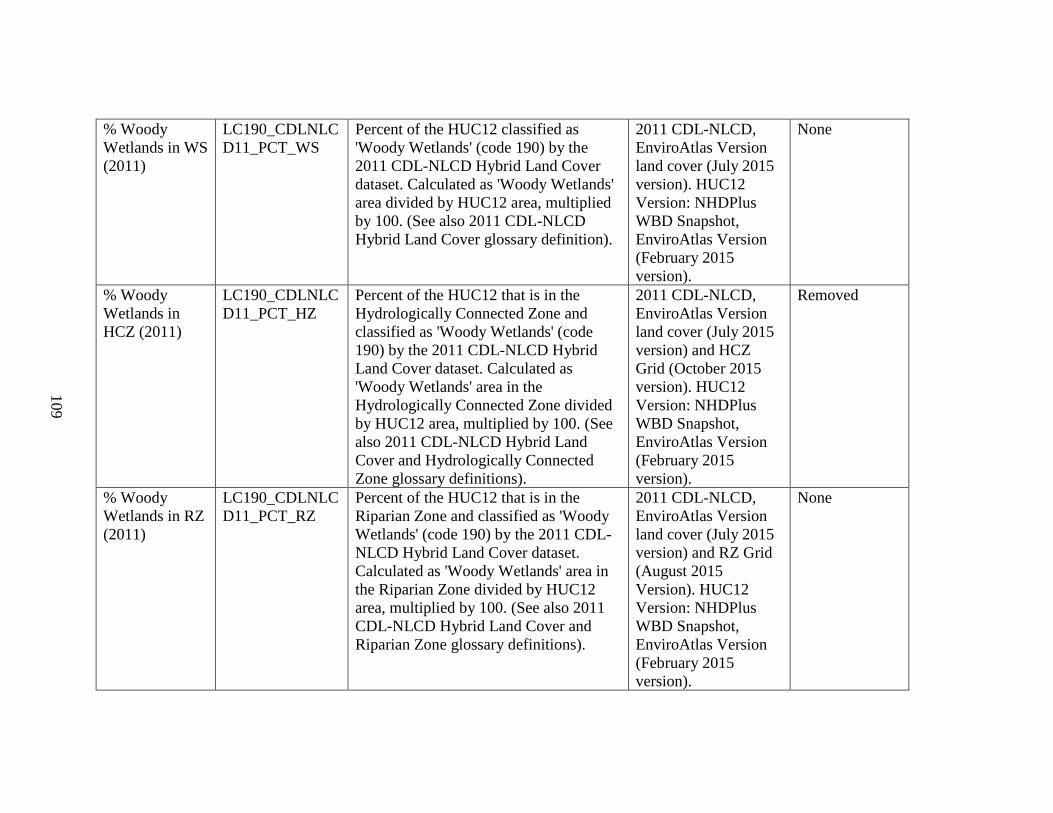
109
% Woody
Wetlands in WS
(2011)
LC190_CDLNLC
D11_PCT_WS
Percent of the HUC12 classified as
'Woody Wetlands' (code 190) by the
2011 CDL-NLCD Hybrid Land Cover
dataset. Calculated as 'Woody Wetlands'
area divided by HUC12 area, multiplied
by 100. (See also 2011 CDL-NLCD
Hybrid Land Cover glossary definition).
2011 CDL-NLCD,
EnviroAtlas Version
land cover (July 2015
version). HUC12
Version: NHDPlus
WBD Snapshot,
EnviroAtlas Version
(February 2015
version).
None
% Woody
Wetlands in
HCZ (2011)
LC190_CDLNLC
D11_PCT_HZ
Percent of the HUC12 that is in the
Hydrologically Connected Zone and
classified as 'Woody Wetlands' (code
190) by the 2011 CDL-NLCD Hybrid
Land Cover dataset. Calculated as
'Woody Wetlands' area in the
Hydrologically Connected Zone divided
by HUC12 area, multiplied by 100. (See
also 2011 CDL-NLCD Hybrid Land
Cover and Hydrologically Connected
Zone glossary definitions).
2011 CDL-NLCD,
EnviroAtlas Version
land cover (July 2015
version) and HCZ
Grid (October 2015
version). HUC12
Version: NHDPlus
WBD Snapshot,
EnviroAtlas Version
(February 2015
version).
Removed
% Woody
Wetlands in RZ
(2011)
LC190_CDLNLC
D11_PCT_RZ
Percent of the HUC12 that is in the
Riparian Zone and classified as 'Woody
Wetlands' (code 190) by the 2011 CDL-
NLCD Hybrid Land Cover dataset.
Calculated as 'Woody Wetlands' area in
the Riparian Zone divided by HUC12
area, multiplied by 100. (See also 2011
CDL-NLCD Hybrid Land Cover and
Riparian Zone glossary definitions).
2011 CDL-NLCD,
EnviroAtlas Version
land cover (July 2015
version) and RZ Grid
(August 2015
Version). HUC12
Version: NHDPlus
WBD Snapshot,
EnviroAtlas Version
(February 2015
version).
None

110
% Wetlands
Remaining in
WS
PCT_WETLAND
S_REMAINING
Percent of wetland cover remaining
relative to pre-development wetland
cover in the HUC12. Source data were
the Existing Vegetation Type (EVT)
geospatial grid dataset (March 2013
version) and the Environmental Site
Potential (ESP) geospatial grid dataset
(January 2010 version) from the
Landscape Fire and Resource
Management Planning Tools
(LANDFIRE) program
(http://www.landfire.gov/viewer/). The
EVT grid classifies existing vegetative
cover across the US at 30-meter
resolution. The ESP grid classifies the
climax vegetative cover that could be
supported at a given site in the absence
of human development at 30-meter
resolution. Vegetation classes in the EVT
grid were generalized to "Wetland" or
"Non-Wetland" based on descriptive
attributes to calculate the area of
remaining wetland cover in the HUC12.
Vegetation classes in the ESP grid were
generalized to "Wetland" or "Non-
Wetland" based on descriptive attributes
to calculate the area of pre-development
wetland cover in the HUC12. Equation
used: Existing Wetland Area in HUC12 /
Pre-Development Wetland Area in
HUC12 * 100. Only calculated for
LANDFIRE ESP grid
(December 19, 2013
version) and
LANDFIRE EVT grid
(April 23, 2015
version). HUC12
Version: NHDPlus
WBD Snapshot,
EnviroAtlas Version
(February 2015
version).
Removed

111
HUC12s with pre-development wetland
area greater than or equal to 1% of
HUC12 area.
% Open Water
in WS (2011)
LC111_CDLNLC
D11_PCT_WS
Percent of the HUC12 classified as 'Open
Water' (code 111) by the 2011 CDL-
NLCD Hybrid Land Cover dataset.
Calculated as 'Open Water' area divided
by HUC12 area, multiplied by 100. (See
also 2011 CDL-NLCD Hybrid Land
Cover glossary definition).
2011 CDL-NLCD,
EnviroAtlas Version
land cover (July 2015
version). HUC12
Version: NHDPlus
WBD Snapshot,
EnviroAtlas Version
(February 2015
version).
None
% Open Water
in HCZ (2011)
LC111_CDLNLC
D11_PCT_HZ
Percent of the HUC12 that is in the
Hydrologically Connected Zone and
classified as 'Open Water' (code 111) by
the 2011 CDL-NLCD Hybrid Land
Cover dataset. Calculated as 'Open
2011 CDL-NLCD,
EnviroAtlas Version
land cover (July 2015
version) and HCZ
Grid (October 2015
Removed
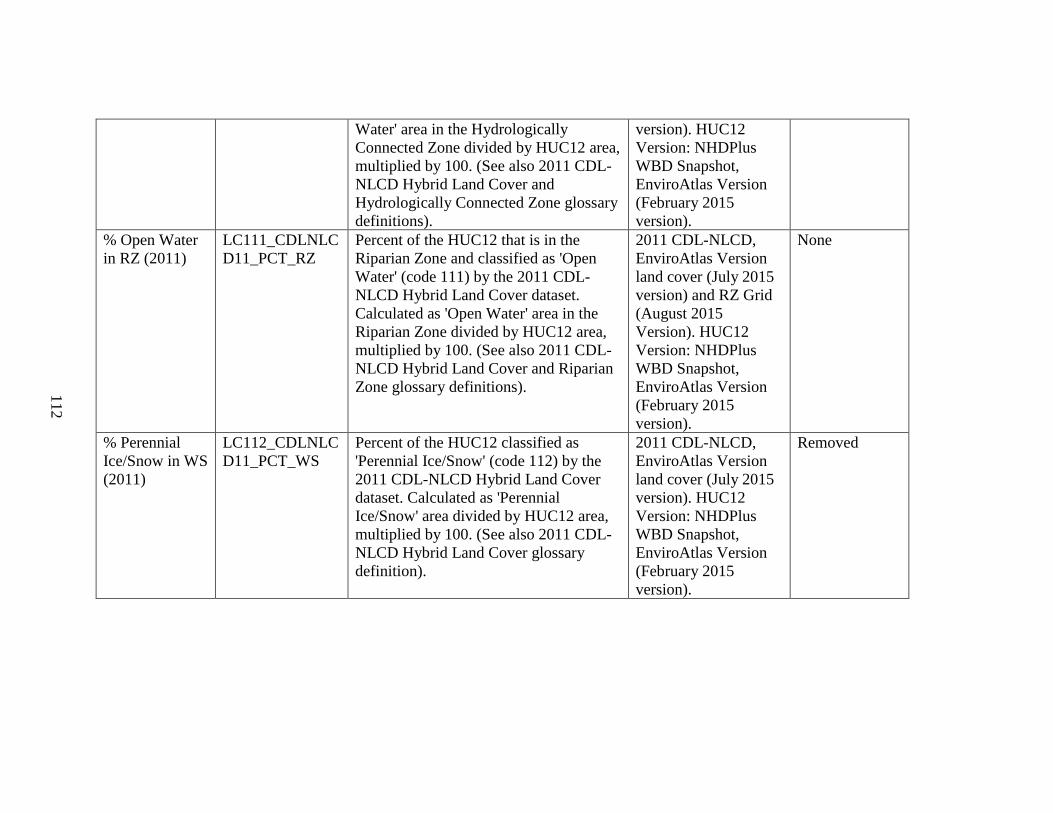
112
Water' area in the Hydrologically
Connected Zone divided by HUC12 area,
multiplied by 100. (See also 2011 CDL-
NLCD Hybrid Land Cover and
Hydrologically Connected Zone glossary
definitions).
version). HUC12
Version: NHDPlus
WBD Snapshot,
EnviroAtlas Version
(February 2015
version).
% Open Water
in RZ (2011)
LC111_CDLNLC
D11_PCT_RZ
Percent of the HUC12 that is in the
Riparian Zone and classified as 'Open
Water' (code 111) by the 2011 CDL-
NLCD Hybrid Land Cover dataset.
Calculated as 'Open Water' area in the
Riparian Zone divided by HUC12 area,
multiplied by 100. (See also 2011 CDL-
NLCD Hybrid Land Cover and Riparian
Zone glossary definitions).
2011 CDL-NLCD,
EnviroAtlas Version
land cover (July 2015
version) and RZ Grid
(August 2015
Version). HUC12
Version: NHDPlus
WBD Snapshot,
EnviroAtlas Version
(February 2015
version).
None
% Perennial
Ice/Snow in WS
(2011)
LC112_CDLNLC
D11_PCT_WS
Percent of the HUC12 classified as
'Perennial Ice/Snow' (code 112) by the
2011 CDL-NLCD Hybrid Land Cover
dataset. Calculated as 'Perennial
Ice/Snow' area divided by HUC12 area,
multiplied by 100. (See also 2011 CDL-
NLCD Hybrid Land Cover glossary
definition).
2011 CDL-NLCD,
EnviroAtlas Version
land cover (July 2015
version). HUC12
Version: NHDPlus
WBD Snapshot,
EnviroAtlas Version
(February 2015
version).
Removed

113
% Perennial
Ice/Snow in
HCZ (2011)
LC112_CDLNLC
D11_PCT_HZ
Percent of the HUC12 that is in the
Hydrologically Connected Zone and
classified as 'Perennial Ice/Snow' (code
112) by the 2011 CDL-NLCD Hybrid
Land Cover dataset. Calculated as
'Perennial Ice/Snow' area in the
Hydrologically Connected Zone divided
by HUC12 area, multiplied by 100. (See
also 2011 CDL-NLCD Hybrid Land
Cover and Hydrologically Connected
Zone glossary definitions).
2011 CDL-NLCD,
EnviroAtlas Version
land cover (July 2015
version) and HCZ
Grid (October 2015
version). HUC12
Version: NHDPlus
WBD Snapshot,
EnviroAtlas Version
(February 2015
version).
Removed
% Perennial
Ice/Snow in RZ
(2011)
LC112_CDLNLC
D11_PCT_RZ
Percent of the HUC12 that is in the
Riparian Zone and classified as
'Perennial Ice/Snow' (code 112) by the
2011 CDL-NLCD Hybrid Land Cover
dataset. Calculated as 'Perennial
Ice/Snow' area in the Riparian Zone
divided by HUC12 area, multiplied by
100. (See also 2011 CDL-NLCD Hybrid
Land Cover and Riparian Zone glossary
definitions).
2011 CDL-NLCD,
EnviroAtlas Version
land cover (July 2015
version) and RZ Grid
(August 2015
Version). HUC12
Version: NHDPlus
WBD Snapshot,
EnviroAtlas Version
(February 2015
version).
Removed
% Barren Land
in WS (2011)
LC131_CDLNLC
D11_PCT_WS
Percent of the HUC12 classified as
'Barren Land (Rock/Sand/Clay)' (code
131) by the 2011 CDL-NLCD Hybrid
Land Cover dataset. Calculated as
'Barren Land (Rock/Sand/Clay)' area
divided by HUC12 area, multiplied by
100. (See also 2011 CDL-NLCD Hybrid
Land Cover glossary definition).
2011 CDL-NLCD,
EnviroAtlas Version
land cover (July 2015
version). HUC12
Version: NHDPlus
WBD Snapshot,
EnviroAtlas Version
(February 2015
version).
None

114
% Barren Land
in HCZ (2011)
LC131_CDLNLC
D11_PCT_HZ
Percent of the HUC12 that is in the
Hydrologically Connected Zone and
classified as 'Barren Land
(Rock/Sand/Clay)' (code 131) by the
2011 CDL-NLCD Hybrid Land Cover
dataset. Calculated as 'Barren Land
(Rock/Sand/Clay)' area in the
Hydrologically Connected Zone divided
by HUC12 area, multiplied by 100. (See
also 2011 CDL-NLCD Hybrid Land
Cover and Hydrologically Connected
Zone glossary definitions).
2011 CDL-NLCD,
EnviroAtlas Version
land cover (July 2015
version) and HCZ
Grid (October 2015
version). HUC12
Version: NHDPlus
WBD Snapshot,
EnviroAtlas Version
(February 2015
version).
Removed
% Barren Land
in RZ (2011)
LC131_CDLNLC
D11_PCT_RZ
Percent of the HUC12 that is in the
Riparian Zone and classified as 'Barren
Land (Rock/Sand/Clay)' (code 131) by
the 2011 CDL-NLCD Hybrid Land
Cover dataset. Calculated as 'Barren
Land (Rock/Sand/Clay)' area in the
Riparian Zone divided by HUC12 area,
multiplied by 100. (See also 2011 CDL-
NLCD Hybrid Land Cover and Riparian
Zone glossary definitions).
2011 CDL-NLCD,
EnviroAtlas Version
land cover (July 2015
version) and RZ Grid
(August 2015
Version). HUC12
Version: NHDPlus
WBD Snapshot,
EnviroAtlas Version
(February 2015
version).
None
% Woody
Vegetation in
WS (2011)
WOODY_CDLN
LCD11_PCT_WS
Percent of the HUC12 classified as
woody vegetation cover by the 2011
CDL-NLCD Hybrid Land Cover dataset.
Woody vegetation cover classes include
'Deciduous Forest' (code 141),
'Evergreen Forest' (code 142), 'Mixed
Forest' (code 143), 'Shrub/Scrub' (code
152), and 'Woody Wetlands' (code 190)
2011 CDL-NLCD,
EnviroAtlas Version
land cover (July 2015
version). HUC12
Version: NHDPlus
WBD Snapshot,
EnviroAtlas Version
None

115
in the 2011 CDL-NLCD Hybrid Land
Cover dataset. Calculated as woody
vegetation area divided by HUC12 area,
multiplied by 100. (See also 2011 CDL-
NLCD Hybrid Land Cover glossary
definition).
(February 2015
version).
% Woody
Vegetation in
HCZ (2011)
WOODY_CDLN
LCD11_PCT_HZ
Percent of the HUC12 that is in the
Hydrologically Connected Zone and
classified as woody vegetation cover by
the 2011 CDL-NLCD Hybrid Land
Cover dataset. Woody vegetation cover
classes include 'Deciduous Forest' (code
141), 'Evergreen Forest' (code 142),
'Mixed Forest' (code 143), 'Shrub/Scrub'
(code 152), and 'Woody Wetlands' (code
190) in the 2011 CDL-NLCD Hybrid
Land Cover dataset. Calculated as woody
vegetation area in the Hydrologically
Connected Zone divided by HUC12 area,
multiplied by 100. (See also 2011 CDL-
NLCD Hybrid Land Cover and
Hydrologically Connected Zone glossary
definitions).
2011 CDL-NLCD,
EnviroAtlas Version
land cover (July 2015
version) and HCZ
Grid (October 2015
version). HUC12
Version: NHDPlus
WBD Snapshot,
EnviroAtlas Version
(February 2015
version).
Removed

116
% Woody
Vegetation in
RZ (2011)
WOODY_CDLN
LCD11_PCT_RZ
Percent of the HUC12 that is in the
Riparian Zone and classified as woody
vegetation cover by the 2011 CDL-
NLCD Hybrid Land Cover dataset.
Woody vegetation cover classes include
'Deciduous Forest' (code 141),
'Evergreen Forest' (code 142), 'Mixed
Forest' (code 143), 'Shrub/Scrub' (code
152), and 'Woody Wetlands' (code 190)
in the 2011 CDL-NLCD Hybrid Land
Cover dataset. Calculated as woody
vegetation area in the Riparian Zone
divided by HUC12 area, multiplied by
100. (See also 2011 CDL-NLCD Hybrid
Land Cover and Riparian Zone glossary
definitions).
2011 CDL-NLCD,
EnviroAtlas Version
land cover (July 2015
version) and RZ Grid
(August 2015
Version). HUC12
Version: NHDPlus
WBD Snapshot,
EnviroAtlas Version
(February 2015
version).
None
% Woody
Vegetation
Change in WS
(2001-11)
WOODY_CHG_
2001_11_PCT_W
S
The change in the percentage of the
HUC12 with woody vegetation cover
from 2001 to 2011. Source data was the
National Land Cover Database 2011
(NLCD 2011) 2001 to 2011 Land Cover
From Ro Change Index dataset, March
2014 version
(http://www.mrlc.gov/nlcd11_data.php;
downloaded April 2015). Woody
vegetation cover classes include
'Deciduous Forest', 'Evergreen Forest',
'Mixed Forest', 'Shrub/Scrub', and
'Woody Wetlands'; codes 41, 42, 43, 52,
and 90 in the 2001 to 2011 Land Cover
From To Change Index dataset. Positive
NLCD 2001-2011
Land Cover From to
Change index (2011
Edition; March 2014
version). HUC12
Version: NHDPlus
WBD Snapshot,
EnviroAtlas Version
(February 2015
version).
Removed

117
values denote an increase in woody
vegetation; negative values denote a
decrease in woody vegetation. Does not
count areas that changed to/from the
'Open Water' class (code 11) since these
were assumed to be errors. Equation
used: (Area Changing To Woody
Vegetation – Area Changing From
Woody Vegetation)/(HUC12 Area) *
100.
% Woody
Vegetation
Change in HCZ
(2001-11)
WOODY_CHG_
2001_11_PCT_H
Z
The change in the percentage of the
HUC12 with woody vegetation cover in
the Hydrologically Connected Zone
(HCZ) from 2001 to 2011. Source data
was the National Land Cover Database
2011 (NLCD 2011) 2001 to 2011 Land
Cover From To Change Index dataset,
March 2014 version
(http://www.mrlc.gov/nlcd11_data.php;
downloaded April 2015). Woody
vegetation cover classes include
'Deciduous Forest', 'Evergreen Forest',
'Mixed Forest', 'Shrub/Scrub', and
'Woody Wetlands'; codes 41, 42, 43, 52,
and 90 in the 2001 to 2011 Land Cover
From To Change Index dataset. Positive
values denote an increase in woody
vegetation; negative values denote a
decrease in woody vegetation. Does not
NLCD 2001-2011
Land Cover From to
Change index (2011
Edition; March 2014
version) and HCZ
Grid (October 2015
version). HUC12
Version: NHDPlus
WBD Snapshot,
EnviroAtlas Version
(February 2015
version).
Removed

118
count areas that changed to/from the
'Open Water' class (code 11) since these
were assumed to be errors. Equation
used: (Area Changing to Woody
Vegetation in the HCZ – Area Changing
From Woody Vegetation in the
HCZ)/(HUC12 Area) * 100. (See also
Hydrologically Connected Zone glossary
definition).
% Woody
Vegetation
Change in RZ
(2001-11)
WOODY_CHG_
2001_11_PCT_R
Z
The change in the percentage of the
HUC12 with woody vegetation cover in
the Riparian Zone (RZ) from 2001 to
2011. Source data was the National Land
Cover Database 2011 (NLCD 2011)
2001 to 2011 Land Cover From To
Change Index dataset, March 2014
version
(http://www.mrlc.gov/nlcd11_data.php;
downloaded April 2015). Woody
vegetation cover classes include
'Deciduous Forest', 'Evergreen Forest',
'Mixed Forest', 'Shrub/Scrub', and
'Woody Wetlands'; codes 41, 42, 43, 52,
and 90 in the 2001 to 2011 Land Cover
From To Change Index dataset. Positive
values denote an increase in woody
NLCD 2001-2011
Land Cover From to
Change index (2011
Edition; March 2014
version) and RZ Grid
(August 2015
Version). HUC12
Version: NHDPlus
WBD Snapshot,
EnviroAtlas Version
(February 2015
version).
Removed

119
vegetation; negative values denote a
decrease in woody vegetation. Does not
count areas that changed to/from the
'Open Water' class (code 11) since these
were assumed to be errors. Equation
used: (Area Changing to Woody
Vegetation in the RZ – Area Changing
From Woody Vegetation in the
RZ)/(HUC12 Area) * 100. (See also
Riparian Zone glossary definition).
% Streamlength
Near < 5%
Imperv Cover
(2011)
str0to5p_11 Percent of streamlength in the HUC12
that is within 30 meters of areas with less
than 5% impervious cover. Impervious
cover source data was the National Land
Cover Database 2011 (NLCD 2011)
Percent Developed Imperviousness
dataset; a national grid of percent
imperviousness at the 30 meter scale
(http://www.mrlc.gov/nlcd11_data.php;
October 2014 version). Stream location
source data was the NHDPlus2 NHD
Snapshot (downloaded June 2014).
Streams were defined as linear features
in the NHD Snapshot with FCODE
(feature code) equal to 33400, 46000,
46003, 46006, or 46007; and polygon
features with FCODE equal to 46003 or
46006. Calculated as the length of
Based on analysis of
the proximity of
impervious cover to
water features by EPA
using NLCD 2011
Percent Developed
Imperviousness
dataset (October 2014
version) and
NHDPlus2 NHD
Snapshot (downloaded
June 2014).
Removed

120
streams in the NHD Snapshot that are
within 30 meters of grid pixels with less
than 5% impervious cover, divided by
the total streamlength in the HUC12,
multiplied by 100. (See also NHD
Snapshot glossary definition).
% Lakeshore
Length Near <
5% Imperv
Cover (2011)
lak0to5p_11 Percent of lakeshore length in the
HUC12 that is within 30 meters of areas
with less than 5% impervious cover.
Impervious cover source data was the
National Land Cover Database 2011
(NLCD 2011) Percent Developed
Imperviousness dataset; a national grid
of percent imperviousness at the 30
meter scale
(http://www.mrlc.gov/nlcd11_data.php;
October 2014 version). Lakeshore
location source data was the NHDPlus2
NHD Snapshot (downloaded June 2014).
Lakeshores were defined as the perimeter
of polygon features in the NHD Snapshot
with FCODE (feature code) equal to
39001, 39004, 39009, 39010, 43600, or
43601. Calculated as the length of
Based on analysis of
the proximity of
impervious cover to
water features done by
EPA using NLCD
2011 Percent
Developed
Imperviousness
dataset (October 2014
version) and
NHDPlus2 NHD
Snapshot (downloaded
June 2014).
Removed
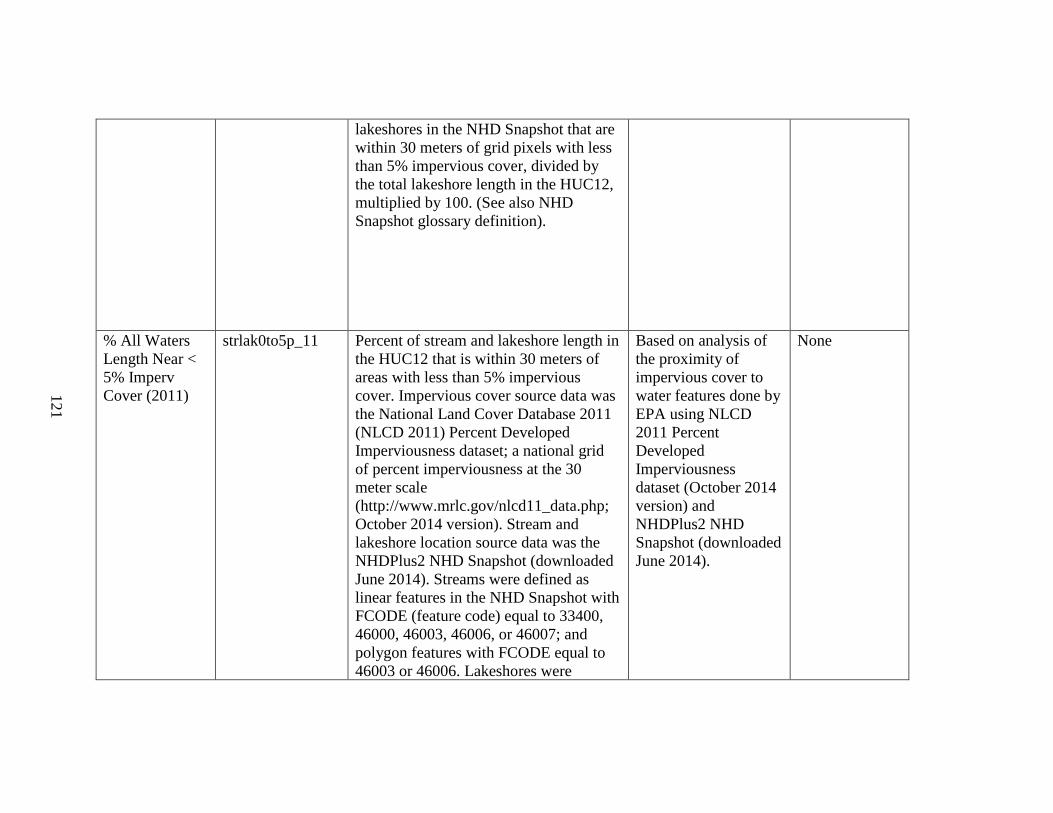
121
lakeshores in the NHD Snapshot that are
within 30 meters of grid pixels with less
than 5% impervious cover, divided by
the total lakeshore length in the HUC12,
multiplied by 100. (See also NHD
Snapshot glossary definition).
% All Waters
Length Near <
5% Imperv
Cover (2011)
strlak0to5p_11 Percent of stream and lakeshore length in
the HUC12 that is within 30 meters of
areas with less than 5% impervious
cover. Impervious cover source data was
the National Land Cover Database 2011
(NLCD 2011) Percent Developed
Imperviousness dataset; a national grid
of percent imperviousness at the 30
meter scale
(http://www.mrlc.gov/nlcd11_data.php;
October 2014 version). Stream and
lakeshore location source data was the
NHDPlus2 NHD Snapshot (downloaded
June 2014). Streams were defined as
linear features in the NHD Snapshot with
FCODE (feature code) equal to 33400,
46000, 46003, 46006, or 46007; and
polygon features with FCODE equal to
46003 or 46006. Lakeshores were
Based on analysis of
the proximity of
impervious cover to
water features done by
EPA using NLCD
2011 Percent
Developed
Imperviousness
dataset (October 2014
version) and
NHDPlus2 NHD
Snapshot (downloaded
June 2014).
None

122
defined as the perimeter of polygon
features in the NHD Snapshot with
FCODE (feature code) equal to 39001,
39004, 39009, 39010, 43600, or 43601.
Calculated as the length of streams and
lakeshores in the NHD Snapshot that are
within 30 meters of grid pixels with less
than 5% impervious cover, divided by
the total stream and lakeshore length in
the HUC12, multiplied by 100. (See also
NHD Snapshot glossary definition).
% N-Index1 in
WS (2011)
N_INDEX_CDL
NLCD11_PCT_
WS
Percent of the HUC12 classified as
natural land cover (including barren
land) by the 2011 CDL-NLCD Hybrid
Land Cover dataset. Natural land cover
classes in the N-Index1 include barren,
forest, wetlands, shrubland, and
grassland; codes 131, 141 through 143,
152, 171, 190, and 195 in the 2011 CDL-
NLCD Hybrid Land Cover dataset.
Equation used: N-Index1 Area / HUC12
Area * 100. (See also 2011 CDL-NLCD
Hybrid Land Cover glossary definition).
2011 CDL-NLCD,
EnviroAtlas Version
land cover (July 2015
version). HUC12
Version: NHDPlus
WBD Snapshot,
EnviroAtlas Version
(February 2015
version).
Removed

123
% N-Index1 in
HCZ (2011)
N_INDEX_CDL
NLCD11_PCT_H
Z
Percent of the HUC12 that is in the
Hydrologically Connected Zone (HCZ)
and classified as natural land cover
(including barren land) by the 2011
CDL-NLCD Hybrid Land Cover dataset.
Natural land cover classes in the N-
Index1 include barren, forest, wetlands,
shrubland, and grassland; codes 131, 141
through 143, 152, 171, 190, and 195 in
the 2011 CDL-NLCD Hybrid Land
Cover dataset. Equation used: Area of N-
Index1 in HCZ / HUC12 Area * 100.
(See also 2011 CDL-NLCD Hybrid Land
Cover and Hydrologically Connected
Zone glossary definitions).
2011 CDL-NLCD,
EnviroAtlas Version
land cover (July 2015
version) and HCZ
Grid (October 2015
version). HUC12
Version: NHDPlus
WBD Snapshot,
EnviroAtlas Version
(February 2015
version).
Removed
% N-Index1 in
RZ (2011)
N_INDEX_CDL
NLCD11_PCT_R
Z
Percent of the HUC12 that is in the
Riparian Zone (RZ) and classified as
natural land cover (including barren
land) by the 2011 CDL-NLCD Hybrid
Land Cover dataset. Natural land cover
classes in the N-Index1 include barren,
forest, wetlands, shrubland, and
grassland; codes 131, 141 through 143,
152, 171, 190, and 195 in the 2011 CDL-
NLCD Hybrid Land Cover dataset.
Equation used: Area of N-Index1 in RZ /
HUC12 Area * 100. (See also 2011
CDL-NLCD Hybrid Land Cover and
Riparian Zone glossary definitions).
2011 CDL-NLCD,
EnviroAtlas Version
land cover (July 2015
version) and RZ Grid
(August 2015
Version). HUC12
Version: NHDPlus
WBD Snapshot,
EnviroAtlas Version
(February 2015
version).
Removed

124
% N-Index1 in
HAZ (2011)
N_INDEX_CDL
NLCD11_PCT_H
AZ
Percent of the HUC12 that is in the
Hydrologically Active Zone (HAZ) and
classified as natural land cover
(including barren land) by the 2011
CDL-NLCD Hybrid Land Cover dataset.
Natural land cover classes in the N-
Index1 include barren, forest, wetlands,
shrubland, and grassland; codes 131, 141
through 143, 152, 171, 190, and 195 in
the 2011 CDL-NLCD Hybrid Land
Cover dataset. Equation used: N-Index1
Area in HAZ / HUC12 Area * 100. (See
also 2011 CDL-NLCD Hybrid Land
Cover and Hydrologically Active Zone
glossary definitions).
2011 CDL-NLCD,
EnviroAtlas Version
land cover (July 2015
version). HUC12
Version: NHDPlus
WBD Snapshot,
EnviroAtlas Version
(February 2015
version).
Removed
% N-Index1
Change in WS
(2001-11)
N_INDEX_CHG
_2001_11_PCT_
WS
The change in the percentage of the
HUC12 with natural cover (including
barren land) from 2001 to 2011. Source
data was the National Land Cover
Database 2011 (NLCD 2011) 2001 to
2011 Land Cover From To Change Index
dataset, March 2014 version
(http://www.mrlc.gov/nlcd11_data.php;
downloaded April 2015). Natural cover
classes included in the N-Index1 are
'Barren Land (Rock/Sand/Clay)',
'Deciduous Forest', 'Evergreen Forest',
'Mixed Forest', 'Shrub/Scrub',
'Grassland/Herbaceous', 'Woody
Wetlands', and 'Herbaceous Wetlands'
cover classes; codes 31, 41, 42, 43, 52,
NLCD 2001-2011
Land Cover From to
Change index (2011
Edition; March 2014
version). HUC12
Version: NHDPlus
WBD Snapshot,
EnviroAtlas Version
(February 2015
version).
Removed

125
71, 90, and 95 in the 2001 to 2011 Land
Cover From To Change Index dataset.
Positive values denote an increase in N-
Index1; negative values denote a
decrease in N-Index1. Does not count
areas that changed to/from the 'Open
Water' class (code 11) since these were
assumed to be errors. Equation used:
(Area Changing to N-Index1 – Area
Changing From N-Index1)/(HUC12
Area) * 100.
% N-Index1
Change in HCZ
(2001-11)
N_INDEX_CHG
_2001_11_PCT_
HZ
The change in the percentage of the
HUC12 with natural cover (including
barren land) in the Hydrologically
Connected Zone (HCZ) from 2001 to
2011. Source data was the National Land
Cover Database 2011 (NLCD 2011)
2001 to 2011 Land Cover From To
Change Index dataset, March 2014
version
(http://www.mrlc.gov/nlcd11_data.php;
downloaded April 2015). Natural cover
classes included in the N-Index1 are
'Barren Land (Rock/Sand/Clay)',
'Deciduous Forest', 'Evergreen Forest',
'Mixed Forest', 'Shrub/Scrub',
'Grassland/Herbaceous', 'Woody
Wetlands', and 'Herbaceous Wetlands'
cover classes; codes 31, 41, 42, 43, 52,
NLCD 2001-2011
Land Cover From to
Change index (2011
Edition; March 2014
version) and HCZ
Grid (October 2015
version). HUC12
Version: NHDPlus
WBD Snapshot,
EnviroAtlas Version
(February 2015
version).
Removed

126
71, 90, and 95 in the 2001 to 2011 Land
Cover From To Change Index dataset.
Positive values denote an increase in N-
Index1; negative values denote a
decrease in N-Index1. Does not count
areas that changed to/from the 'Open
Water' class (code 11) since these were
assumed to be errors. Equation used:
(Area Changing to N-Index1 in the HCZ
– Area Changing From N-Index1 in the
HCZ)/(HUC12 Area) * 100. (See also
Hydrologically Connected Zone glossary
definition).
% N-Index1
Change in RZ
(2001-11)
N_INDEX_CHG
_2001_11_PCT_
RZ
The change in the percentage of the
HUC12 with natural land cover
(including barren land) in the Riparian
Zone (RZ) from 2001 to 2011. Source
data was the National Land Cover
Database 2011 (NLCD 2011) 2001 to
2011 Land Cover From To Change Index
dataset, March 2014 version
(http://www.mrlc.gov/nlcd11_data.php;
downloaded April 2015). Natural cover
classes included in the N-Index1 are
'Barren Land (Rock/Sand/Clay)',
'Deciduous Forest', 'Evergreen Forest',
'Mixed Forest', 'Shrub/Scrub',
'Grassland/Herbaceous', 'Woody
Wetlands', and 'Herbaceous Wetlands'
NLCD 2001-2011
Land Cover From to
Change index (2011
Edition; March 2014
version) and RZ Grid
(August 2015
Version). HUC12
Version: NHDPlus
WBD Snapshot,
EnviroAtlas Version
(February 2015
version).
Removed

127
cover classes; codes 31, 41, 42, 43, 52,
71, 90, and 95 in the 2001 to 2011 Land
Cover From To Change Index dataset.
Positive values denote an increase in N-
Index1; negative values denote a
decrease in N-Index1. Does not count
areas that changed to/from the 'Open
Water' class (code 11) since these were
assumed to be errors. Equation used:
(Area Changing to N-Index1 in the RZ –
Area Changing From N-Index1 in the
RZ)/(HUC12 Area) * 100. (See also
Riparian Zone glossary definition).
% N-Index1
Change
To/From Water
in WS (2001-
11)
NIDX_H20_CHG
_2001_11_PCT_
WS
The percentage of the HUC12 that
changed from water to natural land cover
(including barren land) or to water from
natural land cover from 2001 to 2011.
Source data was the National Land Cover
Database 2011 (NLCD 2011) 2001 to
2011 Land Cover From To Change Index
dataset, March 2014 version
(http://www.mrlc.gov/nlcd11_data.php;
downloaded April 2015). Natural cover
classes included in the N-Index1 are
'Barren Land (Rock/Sand/Clay)',
'Deciduous Forest', 'Evergreen Forest',
'Mixed Forest', 'Shrub/Scrub',
'Grassland/Herbaceous', 'Woody
Wetlands', and 'Herbaceous Wetlands'
cover classes; codes 31, 41, 42, 43, 52,
NLCD 2001-2011
Land Cover From to
Change index (2011
Edition; March 2014
version). HUC12
Version: NHDPlus
WBD Snapshot,
EnviroAtlas Version
(February 2015
version).
Removed

128
71, 90, and 95 in the 2001 to 2011 Land
Cover From To Change Index dataset.
Positive values denote a net increase in
N-Index1 from water; negative values
denote a net increase in water from N-
Index1. Equation used: (Area Changing
from Water to N-Index1 – Area
Changing to Water from N-
Index1)/(HUC12 Area) * 100.
% N-Index1
Change
To/From Water
in HCZ (2001-
11)
NIDX_H20_CHG
_2001_11_PCT_
HZ
The percentage of the HUC12 that is in
the Hydrologically Connected Zone
(HCZ) and changed from water to natural
land cover (including barren land) or to
water from natural land cover from 2001
to 2011. Source data was the National
Land Cover Database 2011 (NLCD
2011) 2001 to 2011 Land Cover From To
Change Index dataset, March 2014
version
(http://www.mrlc.gov/nlcd11_data.php;
downloaded April 2015). Natural cover
classes included in the N-Index1 are
'Barren Land (Rock/Sand/Clay)',
'Deciduous Forest', 'Evergreen Forest',
'Mixed Forest', 'Shrub/Scrub',
'Grassland/Herbaceous', 'Woody
Wetlands', and 'Herbaceous Wetlands'
NLCD 2001-2011
Land Cover From to
Change index (2011
Edition; March 2014
version) and HCZ
Grid (October 2015
version). HUC12
Version: NHDPlus
WBD Snapshot,
EnviroAtlas Version
(February 2015
version).
Removed

129
cover classes; codes 31, 41, 42, 43, 52,
71, 90, and 95 in the 2001 to 2011 Land
Cover From To Change Index dataset.
Positive values denote a net increase in
N-Index1 from water; negative values
denote a net increase in water from N-
Index1. Equation used: (Area Changing
from Water to N-Index1 in the HCZ –
Area Changing from N-Index1 to Water
in the HCZ)/(HUC12 Area) * 100. (See
also Hydrologically Connected Zone
glossary definition).
% N-Index1
Change
To/From Water
in RZ (2001-11)
NIDX_H20_CHG
_2001_11_PCT_
RZ
The percentage of the HUC12 that is in
the Riparian Zone (RZ) and changed
from water to natural land cover
(including barren land) or to water from
natural land cover from 2001 to 2011.
Source data was the National Land Cover
Database 2011 (NLCD 2011) 2001 to
2011 Land Cover From To Change Index
dataset, March 2014 version
(http://www.mrlc.gov/nlcd11_data.php;
downloaded April 2015). Natural cover
classes included in the N-Index1 are
'Barren Land (Rock/Sand/Clay)',
'Deciduous Forest', 'Evergreen Forest',
'Mixed Forest', 'Shrub/Scrub',
'Grassland/Herbaceous', 'Woody
NLCD 2001-2011
Land Cover From to
Change index (2011
Edition; March 2014
version) and RZ Grid
(August 2015
Version). HUC12
Version: NHDPlus
WBD Snapshot,
EnviroAtlas Version
(February 2015
version).
Removed

130
Wetlands', and 'Herbaceous Wetlands'
cover classes; codes 31, 41, 42, 43, 52,
71, 90, and 95 in the 2001 to 2011 Land
Cover From To Change Index dataset.
Positive values denote a net increase in
N-Index1 from water; negative values
denote a net increase in water from N-
Index1. Equation used: (Area Changing
from Water to N-Index1 in the RZ –
Area Changing from N-Index1 to Water
in the RZ)/(HUC12 Area) * 100. (See
also Riparian Zone glossary definition).
% N-Index1
Contiguous to
Water in WS
(2011)
N_INDEX_11_C
ON_H2O_PCT_
WS
Percent of the HUC12 that is classified
as natural land cover (including barren
land) and contiguous to surface water.
This indicator does not count areas with
natural land cover in the HUC12 that are
buffered from surface water by other
land use types. Source data used were the
Water Mask (May 2015 version) and the
2011 CDL-NLCD Hybrid Land Cover
dataset. Natural land cover classes in the
N-Index include barren, forest, wetlands,
shrubland, and grassland; codes 131, 141
through 143, 152, 171, 190, and 195 in
the 2011 CDL-NLCD Hybrid Land
Cover dataset. Equation used: N-Index1
Contiguous to Water Area / HUC12 Area
* 100. (See also Water Mask and 2011
2011 CDL-NLCD,
EnviroAtlas Version
land cover (July 2015
version) and Water
Mask (May 2015
version). HUC12
Version: NHDPlus2
WBD Snapshot,
EnviroAtlas Version
(February 2015
version).
Removed

131
CDL-NLCD Hybrid Land Cover
glossary definitions).
% N-Index2 in
WS (2011)
N_INDEX2_CDL
NLCD11_PCT_
WS
Percent of the HUC12 classified as
natural land cover (excluding barren
land) by the 2011 CDL-NLCD Hybrid
Land Cover dataset. Natural land cover
classes in the N-Index2 include forest,
wetlands, shrubland, and grassland;
codes 141 through 143, 152, 171, 190,
and 195 in the 2011 CDL-NLCD Hybrid
Land Cover dataset. Equation used: N-
Index2 Area / HUC12 Area * 100. (See
also 2011 CDL-NLCD Hybrid Land
Cover glossary definition).
2011 CDL-NLCD,
EnviroAtlas Version
land cover (July 2015
version). HUC12
Version: NHDPlus
WBD Snapshot,
EnviroAtlas Version
(February 2015
version).
Removed
% N-Index2 in
HCZ (2011)
N_INDEX2_CDL
NLCD11_PCT_H
Z
Percent of the HUC12 that is in the
Hydrologically Connected Zone (HCZ)
and classified as natural land cover
(excluding barren land) by the 2011
CDL-NLCD Hybrid Land Cover dataset.
Natural land cover classes in the N-
Index2 include forest, wetlands,
shrubland, and grassland; codes 141
through 143, 152, 171, 190, and 195 in
2011 CDL-NLCD,
EnviroAtlas Version
land cover (July 2015
version) and HCZ
Grid (October 2015
version). HUC12
Version: NHDPlus
WBD Snapshot,
EnviroAtlas Version
Removed

132
the 2011 CDL-NLCD Hybrid Land
Cover dataset. Equation used: Area of N-
Index2 in HCZ / HUC12 Area * 100.
(See also 2011 CDL-NLCD Hybrid Land
Cover and Hydrologically Connected
Zone glossary definitions).
(February 2015
version).
% N-Index2 in
RZ (2011)
N_INDEX2_CDL
NLCD11_PCT_R
Z
Percent of the HUC12 that is in the
Riparian Zone (RZ) and classified as
natural land cover (excluding barren
land) by the 2011 CDL-NLCD Hybrid
Land Cover dataset. Natural land cover
classes in the N-Index2 include forest,
wetlands, shrubland, and grassland;
codes 141 through 143, 152, 171, 190,
and 195 in the 2011 CDL-NLCD Hybrid
Land Cover dataset. Equation used: Area
of N-Index2 in RZ / HUC12 Area * 100.
(See also 2011 CDL-NLCD Hybrid Land
Cover and Riparian Zone glossary
definitions).
2011 CDL-NLCD,
EnviroAtlas Version
land cover (July 2015
version) and RZ Grid
(August 2015
Version). HUC12
Version: NHDPlus
WBD Snapshot,
EnviroAtlas Version
(February 2015
version).
Removed
% N-Index2 in
HAZ (2011)
N_INDEX2_CDL
NLCD11_PCT_H
AZ
Percent of the HUC12 that is in the
Hydrologically Active Zone (HAZ) and
classified as natural land cover
(excluding barren land) by the 2011
CDL-NLCD Hybrid Land Cover dataset.
Natural land cover classes in the N-
Index2 include forest, wetlands,
shrubland, and grassland; codes 141
through 143, 152, 171, 190, and 195 in
2011 CDL-NLCD,
EnviroAtlas Version
land cover (July 2015
version). HUC12
Version: NHDPlus
WBD Snapshot,
EnviroAtlas Version
(February 2015
version).
Removed

133
the 2011 CDL-NLCD Hybrid Land
Cover dataset. Equation used: N-Index2
Area in HAZ / HUC12 Area * 100. (See
also 2011 CDL-NLCD Hybrid Land
Cover and Hydrologically Active Zone
glossary definitions).
% N-Index2
Change in WS
(2001-11)
N_INDEX2_CH
G_2001_11_PCT
_WS
The change in the percentage of the
HUC12 with natural cover (excluding
barren land) from 2001 to 2011. Source
data was the National Land Cover
Database 2011 (NLCD 2011) 2001 to
2011 Land Cover From To Change Index
dataset, March 2014 version
(http://www.mrlc.gov/nlcd11_data.php;
downloaded April 2015). Natural cover
classes included in the N-Index2 are
'Deciduous Forest', 'Evergreen Forest',
'Mixed Forest', 'Shrub/Scrub',
'Grassland/Herbaceous', 'Woody
Wetlands', and 'Herbaceous Wetlands'
cover classes; codes 41, 42, 43, 52, 71,
90, and 95 in the 2001 to 2011 Land
Cover From To Change Index dataset.
Positive values denote an increase in N-
Index2; negative values denote a
decrease in N-Index2. Does not count
areas that changed to/from the 'Open
Water' class (code 11) since these were
assumed to be errors. Equation used:
NLCD 2001-2011
Land Cover From to
Change index (2011
Edition; March 2014
version). HUC12
Version: NHDPlus
WBD Snapshot,
EnviroAtlas Version
(February 2015
version).
Removed

134
(Area Changing to N-Index2 – Area
Changing From N-Index2)/(HUC12
Area) * 100.
% N-Index2
Change in HCZ
(2001-11)
N_INDEX2_CH
G_2001_11_PCT
_HZ
The change in the percentage of the
HUC12 with natural cover (excluding
barren land) in the Hydrologically
Connected Zone (HCZ) from 2001 to
2011. Source data was the National Land
Cover Database 2011 (NLCD 2011)
2001 to 2011 Land Cover From To
Change Index dataset, March 2014
version
(http://www.mrlc.gov/nlcd11_data.php;
downloaded April 2015). Natural cover
classes included in the N-Index2 are
'Deciduous Forest', 'Evergreen Forest',
'Mixed Forest', 'Shrub/Scrub',
'Grassland/Herbaceous', 'Woody
Wetlands', and 'Herbaceous Wetlands'
cover classes; codes 41, 42, 43, 52, 71,
90, and 95 in the 2001 to 2011 Land
NLCD 2001-2011
Land Cover From to
Change index (2011
Edition; March 2014
version) and HCZ
Grid (October 2015
version). HUC12
Version: NHDPlus
WBD Snapshot,
EnviroAtlas Version
(February 2015
version).
Removed

135
Cover From To Change Index dataset.
Positive values denote an increase in N-
Index2; negative values denote a
decrease in N-Index2. Does not count
areas that changed to/from the 'Open
Water' class (code 11) since these were
assumed to be errors. Equation used:
(Area Changing to N-Index2 in the HCZ
– Area Changing From N-Index2 in the
HCZ)/(HUC12 Area) * 100. (See also
Hydrologically Connected Zone glossary
definition).
% N-Index2
Change in RZ
(2001-11)
N_INDEX2_CH
G_2001_11_PCT
_RZ
The change in the percentage of the
HUC12 with natural land cover
(excluding barren land) in the Riparian
Zone (RZ) from 2001 to 2011. Source
data was the National Land Cover
Database 2011 (NLCD 2011) 2001 to
2011 Land Cover From To Change Index
dataset, March 2014 version
(http://www.mrlc.gov/nlcd11_data.php;
downloaded April 2015). Natural cover
classes included in the N-Index2 are
'Deciduous Forest', 'Evergreen Forest',
'Mixed Forest', 'Shrub/Scrub',
'Grassland/Herbaceous', 'Woody
Wetlands', and 'Herbaceous Wetlands'
cover classes; codes 41, 42, 43, 52, 71,
NLCD 2001-2011
Land Cover From to
Change index (2011
Edition; March 2014
version) and RZ Grid
(August 2015
Version). HUC12
Version: NHDPlus
WBD Snapshot,
EnviroAtlas Version
(February 2015
version).
Removed
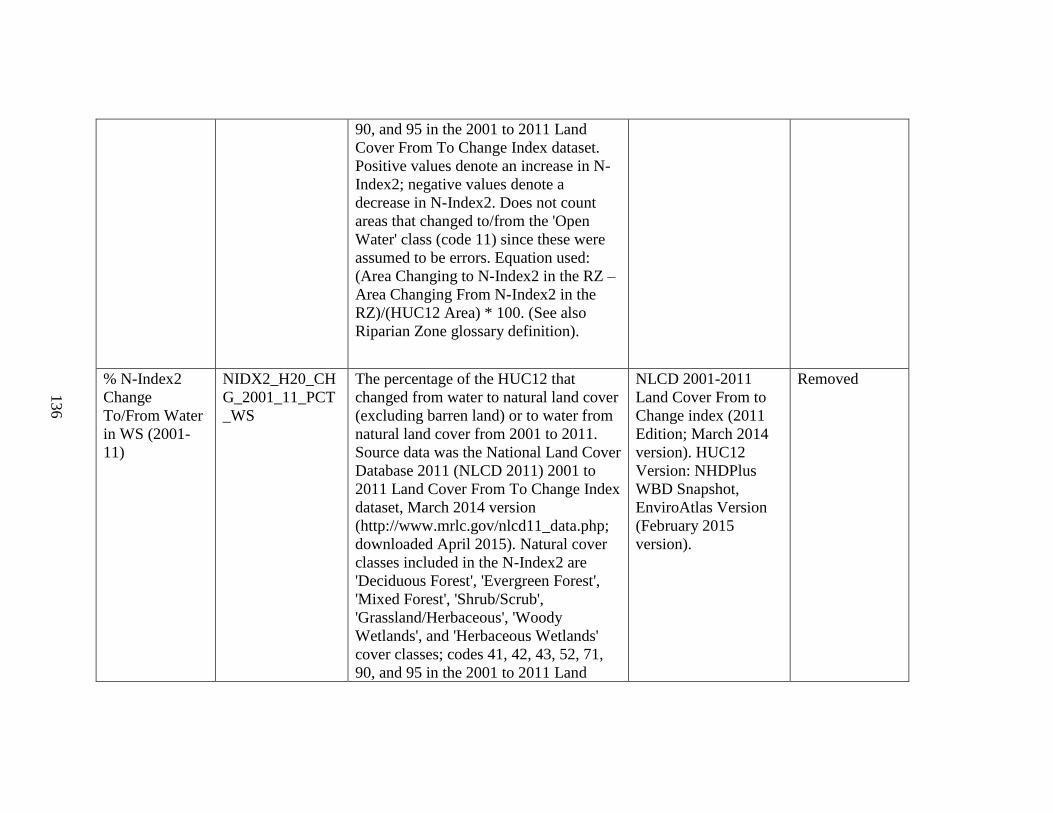
136
90, and 95 in the 2001 to 2011 Land
Cover From To Change Index dataset.
Positive values denote an increase in N-
Index2; negative values denote a
decrease in N-Index2. Does not count
areas that changed to/from the 'Open
Water' class (code 11) since these were
assumed to be errors. Equation used:
(Area Changing to N-Index2 in the RZ –
Area Changing From N-Index2 in the
RZ)/(HUC12 Area) * 100. (See also
Riparian Zone glossary definition).
% N-Index2
Change
To/From Water
in WS (2001-
11)
NIDX2_H20_CH
G_2001_11_PCT
_WS
The percentage of the HUC12 that
changed from water to natural land cover
(excluding barren land) or to water from
natural land cover from 2001 to 2011.
Source data was the National Land Cover
Database 2011 (NLCD 2011) 2001 to
2011 Land Cover From To Change Index
dataset, March 2014 version
(http://www.mrlc.gov/nlcd11_data.php;
downloaded April 2015). Natural cover
classes included in the N-Index2 are
'Deciduous Forest', 'Evergreen Forest',
'Mixed Forest', 'Shrub/Scrub',
'Grassland/Herbaceous', 'Woody
Wetlands', and 'Herbaceous Wetlands'
cover classes; codes 41, 42, 43, 52, 71,
90, and 95 in the 2001 to 2011 Land
NLCD 2001-2011
Land Cover From to
Change index (2011
Edition; March 2014
version). HUC12
Version: NHDPlus
WBD Snapshot,
EnviroAtlas Version
(February 2015
version).
Removed

137
Cover From To Change Index dataset.
Positive values denote a net increase in
N-Index2 from water; negative values
denote a net increase in water from N-
Index2. Equation used: (Area Changing
from Water to N-Index2 – Area
Changing to Water from N-
Index2)/(HUC12 Area) * 100.
% N-Index2
Change
To/From Water
in HCZ (2001-
11)
NIDX2_H20_CH
G_2001_11_PCT
_HZ
The percentage of the HUC12 that is in
the Hydrologically Connected Zone
(HCZ) and changed from water to natural
land cover (excluding barren land) or to
water from natural land cover from 2001
to 2011. Source data was the National
Land Cover Database 2011 (NLCD
2011) 2001 to 2011 Land Cover From To
Change Index dataset, March 2014
version
(http://www.mrlc.gov/nlcd11_data.php;
downloaded April 2015). Natural cover
classes included in the N-Index2 are
'Deciduous Forest', 'Evergreen Forest',
'Mixed Forest', 'Shrub/Scrub',
'Grassland/Herbaceous', 'Woody
Wetlands', and 'Herbaceous Wetlands'
cover classes; codes 41, 42, 43, 52, 71,
NLCD 2001-2011
Land Cover From to
Change index (2011
Edition; March 2014
version) and HCZ
Grid (October 2015
version). HUC12
Version: NHDPlus
WBD Snapshot,
EnviroAtlas Version
(February 2015
version).
Removed

138
90, and 95 in the 2001 to 2011 Land
Cover From To Change Index dataset.
Positive values denote a net increase in
N-Index2 from water; negative values
denote a net increase in water from N-
Index2. Equation used: (Area Changing
from Water to N-Index2 in the HCZ –
Area Changing from N-Index2 to Water
in the HCZ)/(HUC12 Area) * 100. (See
also Hydrologically Connected Zone
glossary definition).
% N-Index2
Change
To/From Water
in RZ (2001-11)
NIDX2_H20_CH
G_2001_11_PCT
_RZ
The percentage of the HUC12 that is in
the Riparian Zone (RZ) and changed
from water to natural land cover
(excluding barren land) or to water from
natural land cover from 2001 to 2011.
Source data was the National Land Cover
Database 2011 (NLCD 2011) 2001 to
2011 Land Cover From To Change Index
dataset, March 2014 version
(http://www.mrlc.gov/nlcd11_data.php;
downloaded April 2015). Natural cover
classes included in the N-Index2 are
'Deciduous Forest', 'Evergreen Forest',
'Mixed Forest', 'Shrub/Scrub',
'Grassland/Herbaceous', 'Woody
Wetlands', and 'Herbaceous Wetlands'
cover classes; codes 41, 42, 43, 52, 71,
NLCD 2001-2011
Land Cover From to
Change index (2011
Edition; March 2014
version) and RZ Grid
(August 2015
Version). HUC12
Version: NHDPlus
WBD Snapshot,
EnviroAtlas Version
(February 2015
version).
Removed

139
90, and 95 in the 2001 to 2011 Land
Cover From To Change Index dataset.
Positive values denote a net increase in
N-Index2 from water; negative values
denote a net increase in water from N-
Index2. Equation used: (Area Changing
from Water to N-Index2 in the RZ –
Area Changing from N-Index2 to Water
in the RZ)/(HUC12 Area) * 100. (See
also Riparian Zone glossary definition).
% N-Index2
Contiguous to
Water in WS
(2011)
N_INDEX2_11_
CON_H2O_PCT_
WS
Percent of the HUC12 that is classified
as natural land cover (excluding barren
land) and contiguous to surface water.
This indicator does not count areas with
natural land cover in the HUC12 that are
buffered from surface water by other
land use types. Source data used were the
Water Mask (May 2015 version) and the
2011 CDL-NLCD Hybrid Land Cover
dataset. Natural land cover classes in the
N-Index include forest, wetlands,
shrubland, and grassland; codes 141
through 143, 152, 171, 190, and 195 in
the 2011 CDL-NLCD Hybrid Land
Cover dataset. Equation used: N-Index2
Contiguous to Water Area / HUC12 Area
* 100. (See also Water Mask and 2011
2011 CDL-NLCD,
EnviroAtlas Version
land cover (July 2015
version) and Water
Mask (May 2015
version). HUC12
Version: NHDPlus2
WBD Snapshot,
EnviroAtlas Version
(February 2015
version).
Removed

140
CDL-NLCD Hybrid Land Cover
glossary definitions).
% National
Ecological
Framework
(NEF) in WS
(2001)
NEF2001_PCT_
WS
Percent of the HUC12 that is part of the
2001 National Ecological Framework
(NEF). The NEF is a GIS based model of
the connectivity of natural landscapes in
the lower 48 United States. The NEF is
comprised of Hubs and Corridors, with
Hubs defined as Priority Ecological
Areas that are greater than 5,000 acres in
size. Source data was the 2001 NEF
geospatial dataset produced by EPA
Region 4,
http://cfpub.epa.gov/roe/documents/NEF
_brochure.pdf. Equation used: NEF Area
/ HUC12 Area * 100.
EPA Region 4 2001
National Ecological
Framework dataset
Removed
% NEF Hubs in
WS (2001)
HUBS_NEF2001
_PCT_WS
Percent of the HUC12 that is classified
as a Hub by the 2001 National
Ecological Framework (NEF). The NEF
is a GIS-based model of the connectivity
of natural landscapes in the lower 48
United States. The NEF is comprised of
Hubs and Corridors, with Hubs defined
EPA Region 4 2001
National Ecological
Framework dataset
Removed

141
as Priority Ecological Areas that are
greater than 5,000 acres in size. Source
data used was the 2001 NEF produced by
EPA Region 4,
http://cfpub.epa.gov/roe/documents/NEF
_brochure.pdf. Equation used: Hub Area
/ HUC12 Area * 100.
% NEF
Corridors in
WS (2001)
CORRIDORS_N
EF2001_PCT_W
S
Percent of the HUC12 that is classified
as a Corridor by the 2001 National
Ecological Framework (NEF). The NEF
is a GIS based model of the connectivity
of natural landscapes in the lower 48
United States. The NEF is comprised of
Hubs and Corridors, with Hubs defined
as Priority Ecological Areas that are
greater than 5,000 acres in size.
Corridors are defined as linkages
between Hubs and were determined
using a cost surface analysis to determine
the least human disturbance pathway
between individual Hubs. Source data
used was the 2001 NEF produced by
EPA Region 4,
http://cfpub.epa.gov/roe/documents/NEF
_brochure.pdf. Equation used: Corridor
Area / HUC12 Area * 100.
EPA Region 4 2001
National Ecological
Framework dataset
Removed
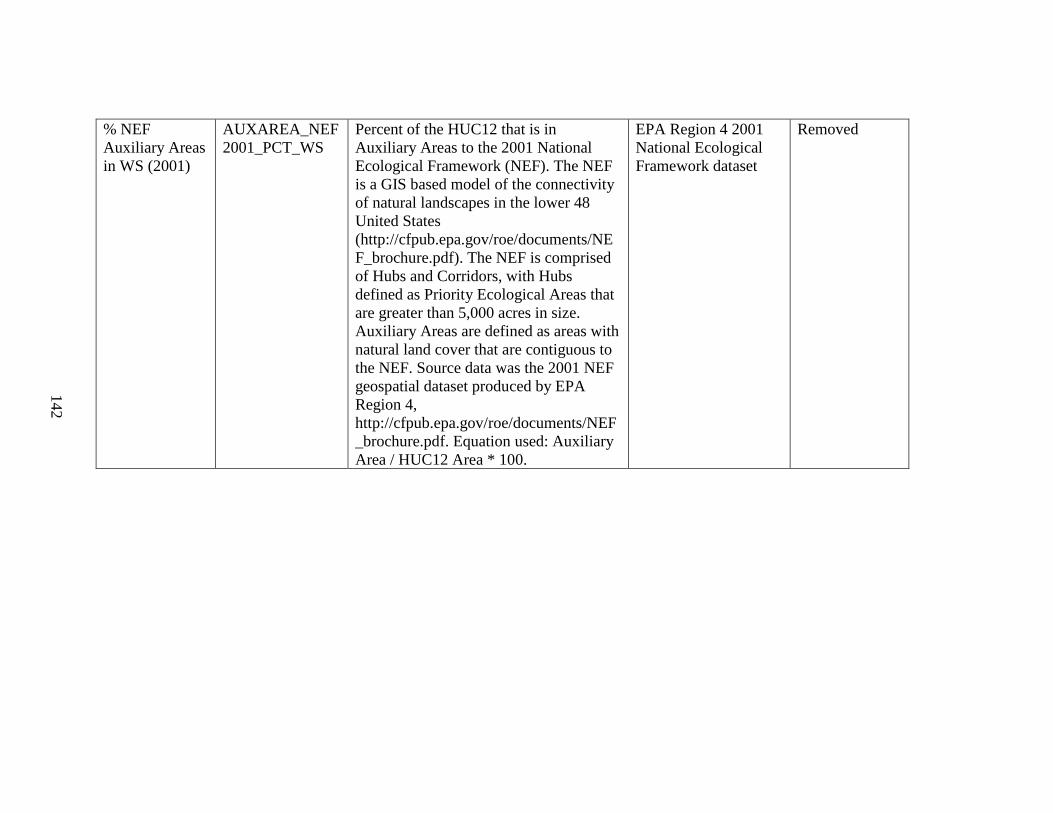
142
% NEF
Auxiliary Areas
in WS (2001)
AUXAREA_NEF
2001_PCT_WS
Percent of the HUC12 that is in
Auxiliary Areas to the 2001 National
Ecological Framework (NEF). The NEF
is a GIS based model of the connectivity
of natural landscapes in the lower 48
United States
(http://cfpub.epa.gov/roe/documents/NE
F_brochure.pdf). The NEF is comprised
of Hubs and Corridors, with Hubs
defined as Priority Ecological Areas that
are greater than 5,000 acres in size.
Auxiliary Areas are defined as areas with
natural land cover that are contiguous to
the NEF. Source data was the 2001 NEF
geospatial dataset produced by EPA
Region 4,
http://cfpub.epa.gov/roe/documents/NEF
_brochure.pdf. Equation used: Auxiliary
Area / HUC12 Area * 100.
EPA Region 4 2001
National Ecological
Framework dataset
Removed

143
Habitat
Condition Index
WS (2015)
NFHP15_HCI_L
OCAL_WS
Mean Habitat Condition Index (HCI)
score for the HUC12 from the National
Fish Habitat Partnership (NFHP) 2015
National Assessment. Scores range from
1 (high likelihood of aquatic habitat
degradation) to 5 (low likelihood of
aquatic habitat degradation) based on
land use, population density, roads,
dams, mines, and point-source pollution
sites. Source data were NFHP 2015
National Assessment Local Catchment
HCI scores for NHDPlus Version 1
catchments (acquired via personal
communication with NFHP in March
2016). NHDPlus Version 1 catchments
are local drainage area delineations for
surface water features in the NHDPlus
Version 1 database. Catchment HCI
scores were aggregated to HUC12 scores
by calculating the area-weighted mean of
HCI scores for catchments that intersect
the HUC12. See
http://ecosystems.usgs.gov/fishhabitat/nf
hap_download.jsp for more information
on the NFHP National Assessment.
NFHP 2015 National
Assessment Local
Catchment HCI scores
for NHDPlus Version
1 catchments
(acquired via personal
communication with
NFHP in March
2016).
None

144
Habitat
Condition
Index, Local
Buffer WS
(2015)
NFHP15_HCI_B
UF_WS
Mean Buffer Habitat Condition Index
(HCI) score for the HUC12 from the
National Fish Habitat Partnership
(NFHP) 2015 National Assessment.
Scores range from 1 (high likelihood of
aquatic habitat degradation) to 5 (low
likelihood of aquatic habitat degradation)
based on land use, population density,
roads, dams, mines, and point-source
pollution sites in the 90-meter riparian
buffer surrounding surface waters.
Source data were NFHP 2015 National
Assessment Local Buffer HCI scores for
NHDPlus Version 1 catchments
(acquired via personal communication
with NFHP in March 2016). NHDPlus
Version 1 catchments are local drainage
area delineations for surface water
features in the NHDPlus Version 1
database. Buffer HCI scores were
aggregated to HUC12 scores by
calculating the area-weighted mean of
Buffer HCI scores for catchments that
intersect the HUC12. See
http://ecosystems.usgs.gov/fishhabitat/nf
hap_download.jsp for more information
on the NFHP National Assessment.
NFHP 2015 National
Assessment Local
Buffer HCI scores for
NHDPlus Version 1
catchments (acquired
via personal
communication with
NFHP in March
2016).
Removed

145
PHWA
Watershed
Health Index,
State (2016)
PHWA_HEALT
H_NDX_ST_201
6
The statewide Watershed Health Index
score for the HUC12 from the 2016 EPA
Preliminary Healthy Watersheds
Assessment (PHWA). The Watershed
Health Index is an integrated measure of
watershed condition that combines
Landscape Condition, Hydrologic,
Geomorphology, Habitat, Water Quality,
and Biological Condition Sub-Index
scores. Higher scores correspond to
greater potential for a watershed to have
the structure and function in place to
support healthy aquatic ecosystems.
Source data were statewide Watershed
Health Index scores for HUC12s
developed as part of the 2016 EPA
Preliminary Healthy Watersheds
Assessment (February 8, 2017 version).
(See also PHWA glossary definition).
2016 EPA Preliminary
Healthy Watersheds
Assessment (February
8, 2017 version)
Removed
PHWA
Watershed
Health Index,
ER (2016)
PHWA_HEALT
H_NDX_ER_201
6
The ecoregional Watershed Health Index
score for the HUC12 from the 2016 EPA
Preliminary Healthy Watersheds
Assessment (PHWA). The Watershed
Health Index is an integrated measure of
watershed condition that combines
Landscape Condition, Hydrologic,
Geomorphology, Habitat, Water Quality,
and Biological Condition Sub-Index
scores. Higher scores correspond to
greater potential for a watershed to have
the structure and function in place to
2016 EPA Preliminary
Healthy Watersheds
Assessment (February
8, 2017 version)
Removed

146
support healthy aquatic ecosystems.
Source data were ecoregional Watershed
Health Index scores for HUC12s
developed as part of the 2016 EPA
Preliminary Healthy Watersheds
Assessment (February 8, 2017 version).
(See also PHWA glossary definition).
PHWA
Landscape Sub-
Index, State
(2016)
PHWA_LANDS
C_SUBNDX_ST
_2016
The statewide Landscape Condition Sub-
Index score for the HUC12 from the
2016 EPA Preliminary Healthy
Watersheds Assessment (PHWA). The
Landscape Condition Sub-Index
combines multiple measures of the extent
and connectivity of natural land cover in
a watershed. Higher scores correspond to
greater extent and connectivity of natural
land cover. Source data were statewide
Landscape Condition Sub-Index scores
for HUC12s from the 2016 EPA
Preliminary Healthy Watersheds
Assessment (February 8, 2017 version).
(See also PHWA glossary definition).
2016 EPA Preliminary
Healthy Watersheds
Assessment (February
8, 2017 version)
Removed

147
PHWA
Landscape Sub-
Index, ER
(2016)
PHWA_LANDS
C_SUBNDX_ER
_2016
The ecoregional Landscape Condition
Sub-Index score for the HUC12 from the
2016 EPA Preliminary Healthy
Watersheds Assessment (PHWA). The
Landscape Condition Sub-Index
combines multiple measures of the extent
and connectivity of natural land cover in
a watershed. Higher scores correspond to
greater extent and connectivity of natural
land cover. Source data were ecoregional
Landscape Condition Sub-Index scores
for HUC12s from the 2016 EPA
Preliminary Healthy Watersheds
Assessment (February 8, 2017 version).
(See also PHWA glossary definition).
2016 EPA Preliminary
Healthy Watersheds
Assessment (February
8, 2017 version)
Removed
PHWA
Hydrology Sub-
Index, State
(2016)
PHWA_HYDRO
_SUBNDX_ST_2
016
The statewide Hydrology Sub-Index
score for the HUC12 from the 2016 EPA
Preliminary Healthy Watersheds
Assessment (PHWA). The Hydrology
Sub-Index combines multiple measures
of the potential for streams in the HUC12
to support natural flow regimes,
including the relative magnitude of
impoundments, the prevalence of forest,
wetland, and impervious cover, the
number of road-stream crossings, and the
amount of farmland on hydric soils.
Source data were statewide Hydrology
Sub-Index scores for HUC12s from the
2016 EPA Preliminary Healthy
Watersheds Assessment (February 8,
2016 EPA Preliminary
Healthy Watersheds
Assessment (February
8, 2017 version)
Removed

148
2017 version). (See also PHWA glossary
definition).
PHWA
Hydrology Sub-
Index, ER
(2016)
PHWA_HYDRO
_SUBNDX_ER_2
016
The ecoregional Hydrology Sub-Index
score for the HUC12 from the 2016 EPA
Preliminary Healthy Watersheds
Assessment (PHWA). The Hydrology
Sub-Index combines multiple measures
of the potential for streams in the HUC12
to support natural flow regimes,
including the relative magnitude of
impoundments, the prevalence of forest,
wetland, and impervious cover, the
number of road-stream crossings, and the
amount of farmland on hydric soils.
Source data were ecoregional Hydrology
Sub-Index scores for HUC12s from the
2016 EPA Preliminary Healthy
Watersheds Assessment (February 8,
2017 version). (See also PHWA glossary
definition).
2016 EPA Preliminary
Healthy Watersheds
Assessment (February
8, 2017 version)
Removed

149
PHWA
Geomorphology
Sub-Index,
State (2016)
PHWA_GEO_SU
BNDX_ST_2016
The statewide Geomorphology Sub-
Index score for the HUC12 from the
2016 EPA Preliminary Healthy
Watersheds Assessment (PHWA). The
Geomorphology Sub-Index combines
multiple measures of the potential for the
HUC12 to maintain fluvial geomorphic
processes within their natural range,
including the density of dams and roads,
the area drained by surface ditches, and
the prevalence of urban and cropped
lands in the riparian zone. Source data
were statewide Geomorphology Sub-
Index scores for HUC12s from the 2016
EPA Preliminary Healthy Watersheds
Assessment (February 8, 2017 version).
(See also PHWA glossary definition).
2016 EPA Preliminary
Healthy Watersheds
Assessment (February
8, 2017 version)
Removed
PHWA
Geomorphology
Sub-Index, ER
(2016)
PHWA_GEO_SU
BNDX_ER_2016
The ecoregional Geomorphology Sub-
Index score for the HUC12 from the
2016 EPA Preliminary Healthy
Watersheds Assessment (PHWA). The
Geomorphology Sub-Index combines
multiple measures of the potential for the
HUC12 to maintain fluvial geomorphic
processes within their natural range,
including the density of dams and roads,
the area drained by surface ditches, and
the prevalence of urban and cropped
lands in the riparian zone. Source data
were ecoregional Geomorphology Sub-
Index scores for HUC12s from the 2016
2016 EPA Preliminary
Healthy Watersheds
Assessment (February
8, 2017 version)
Removed

150
EPA Preliminary Healthy Watersheds
Assessment (February 8, 2017 version).
(See also PHWA glossary definition).
PHWA Habitat
Sub-Index,
State (2016)
PHWA_HAB_SU
BNDX_ST_2016
The statewide Habitat Sub-Index score
for the HUC12 from the 2016 EPA
Preliminary Healthy Watersheds
Assessment (PHWA). The Habitat Sub-
Index characterizes the potential for a
HUC12 to support high quality stream
habitat based on multiple measures of
watershed attributes that were
determined to be relevant to fish habitat
quality, including the extent of urban and
agricultural land cover types, human
population density, road length, number
of road-stream crossings, number of
dams, number of mine operations,
number of facilities with National
Pollutant Discharge Elimination System
(NPDES) wastewater discharge permits,
number of sites in the EPA Toxic
Release Inventory program, and number
of sites on the Superfund National
Priorities List. Source data were
statewide Habitat Sub-Index scores for
2016 EPA Preliminary
Healthy Watersheds
Assessment (February
8, 2017 version)
Removed

151
HUC12s from the 2016 EPA Preliminary
Healthy Watersheds Assessment
(February 8, 2017 version). (See also
PHWA glossary definition).
PHWA Habitat
Sub-Index, ER
(2016)
PHWA_HAB_SU
BNDX_ER_2016
The ecoregional Habitat Sub-Index score
for the HUC12 from the 2016 EPA
Preliminary Healthy Watersheds
Assessment (PHWA). The Habitat Sub-
Index characterizes the potential for a
HUC12 to support high quality stream
habitat based on multiple measures of
watershed attributes that were
determined to be relevant to fish habitat
quality, including the extent of urban and
agricultural land cover types, human
population density, road length, number
of road-stream crossings, number of
dams, number of mine operations,
number of facilities with National
Pollutant Discharge Elimination System
(NPDES) wastewater discharge permits,
number of sites in the EPA Toxic
2016 EPA Preliminary
Healthy Watersheds
Assessment (February
8, 2017 version)
Removed

152
Release Inventory program, and number
of sites on the Superfund National
Priorities List. Source data were
ecoregional Habitat Sub-Index scores for
HUC12s from the 2016 EPA Preliminary
Healthy Watersheds Assessment
(February 8, 2017 version). (See also
PHWA glossary definition).
PHWA
Biological Sub-
Index, State
(2016)
PHWA_BIO_SU
BNDX_ST_2016
The statewide Biological Condition Sub-
Index score for the HUC12 from the
2016 EPA Preliminary Healthy
Watersheds Assessment (PHWA). The
Biological Condition Sub-Index
measures the likelihood for high-quality
stream biological communities in the
HUC12, based on a predictive model of
stream biological condition that uses
watershed attributes as inputs. Source
data were statewide Biological Condition
Sub-Index scores for HUC12s from the
2016 EPA Preliminary Healthy
Watersheds Assessment (February 8,
2017 version). (See also PHWA glossary
definition).
2016 EPA Preliminary
Healthy Watersheds
Assessment (February
8, 2017 version)
Removed

153
PHWA
Biological Sub-
Index, ER
(2016)
PHWA_BIO_SU
BNDX_ER_2016
The ecoregional Biological Condition
Sub-Index score for the HUC12 from the
2016 EPA Preliminary Healthy
Watersheds Assessment (PHWA). The
Biological Condition Sub-Index
measures the likelihood for high-quality
stream biological communities in the
HUC12, based on a predictive model of
stream biological condition that uses
watershed attributes as inputs. Source
data were ecoregional Biological
Condition Sub-Index scores for HUC12s
from the 2016 EPA Preliminary Healthy
Watersheds Assessment (February 8,
2017 version). (See also PHWA glossary
definition).
2016 EPA Preliminary
Healthy Watersheds
Assessment (February
8, 2017 version)
Removed
PHWA Water
Quality Sub-
Index, State
(2016)
PHWA_WQ_SU
BNDX_ST_2016
The statewide Water Quality Sub-Index
score for the HUC12 from the 2016 EPA
Preliminary Healthy Watersheds
Assessment (PHWA). The Water Quality
Sub-Index measures the proportion of
streams and lakes in the HUC12 that are
reported to be attaining surface water
quality standards versus those reported as
having water quality impairments (303d-
listed waters) or having Total Maximum
Daily Loads (TMDLs) to address water
quality impairments. Higher scores
correspond to a greater proportion of
waters attaining surface water quality
standards. Source data were statewide
2016 EPA Preliminary
Healthy Watersheds
Assessment (February
8, 2017 version)
Removed

154
Water Quality Sub-Index scores for
HUC12s from the 2016 EPA Preliminary
Healthy Watersheds Assessment
(February 8, 2017 version). (See also
PHWA glossary definition).
PHWA Water
Quality Sub-
Index, ER
(2016)
PHWA_WQ_SU
BNDX_ER_2016
The ecoregional Water Quality Sub-
Index score for the HUC12 from the
2016 EPA Preliminary Healthy
Watersheds Assessment (PHWA). The
Water Quality Sub-Index measures the
proportion of streams and lakes in the
HUC12 that are reported to be attaining
surface water quality standards versus
those reported as having water quality
impairments (303d-listed waters) or
having Total Maximum Daily Loads
(TMDLs) to address water quality
impairments. Higher scores correspond
to a greater proportion of waters attaining
surface water quality standards. Source
data were ecoregional Water Quality
Sub-Index scores for HUC12s from the
2016 EPA Preliminary Healthy
Watersheds Assessment (February 8,
2016 EPA Preliminary
Healthy Watersheds
Assessment (February
8, 2017 version)
Removed
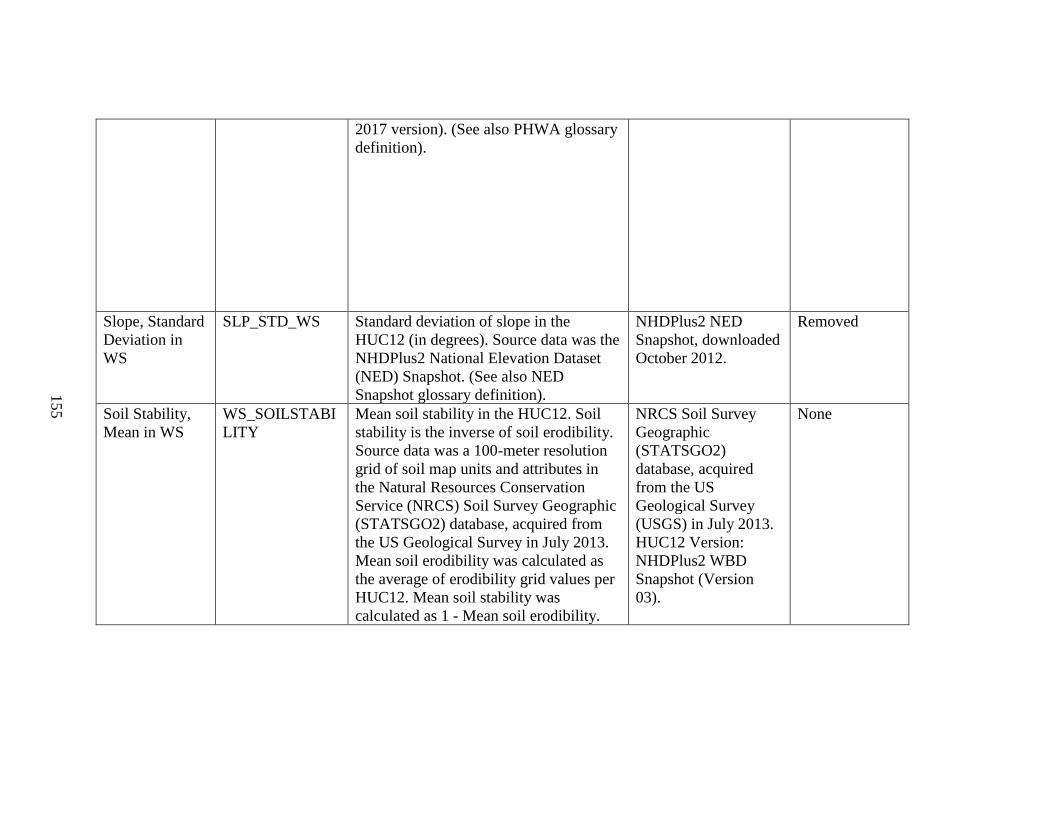
155
2017 version). (See also PHWA glossary
definition).
Slope, Standard
Deviation in
WS
SLP_STD_WS Standard deviation of slope in the
HUC12 (in degrees). Source data was the
NHDPlus2 National Elevation Dataset
(NED) Snapshot. (See also NED
Snapshot glossary definition).
NHDPlus2 NED
Snapshot, downloaded
October 2012.
Removed
Soil Stability,
Mean in WS
WS_SOILSTABI
LITY
Mean soil stability in the HUC12. Soil
stability is the inverse of soil erodibility.
Source data was a 100-meter resolution
grid of soil map units and attributes in
the Natural Resources Conservation
Service (NRCS) Soil Survey Geographic
(STATSGO2) database, acquired from
the US Geological Survey in July 2013.
Mean soil erodibility was calculated as
the average of erodibility grid values per
HUC12. Mean soil stability was
calculated as 1 - Mean soil erodibility.
NRCS Soil Survey
Geographic
(STATSGO2)
database, acquired
from the US
Geological Survey
(USGS) in July 2013.
HUC12 Version:
NHDPlus2 WBD
Snapshot (Version
03).
None

156
Soil Stability,
Mean in HCZ
HCZ_SOILSTAB
ILITY
Mean soil stability in the Hydrologically
Connected Zone (HCZ) of the HUC12.
Soil stability is the inverse of soil
erodibility. Source data was a 100-meter
resolution grid of soil map units and
attributes in the Natural Resources
Conservation Service (NRCS) Soil
Survey Geographic (STATSGO2)
database, acquired from the US
Geological Survey in July 2013. Mean
soil erodibility in the HCZ was
calculated as the average of erodibility
grid values in the HCZ per HUC12.
Mean soil stability was calculated as 1 -
Mean soil erodibility. (See also
Hydrologically Connected Zone glossary
definition).
NRCS Soil Survey
Geographic
(STATSGO2)
database, acquired
from the US
Geological Survey
(USGS) in July 2013.
HUC12 Version:
NHDPlus2 WBD
Snapshot (Version
03).
Removed
Natural
Biological
Nitrogen
Fixation
N_NAT_BIO_FI
X_MEAN_WS
Mean biological nitrogen fixation in
natural and semi-natural lands in the
HUC12 in 2006 (klograms nitrogen per
hectare per year). Biological nitrogen
fixation is the process in which nitrogen
gas from the atmosphere is incorporated
into plants. Calculated from an equation
describing the relationship between
actual evapotranspiration (AET), land
cover, and annual biological nitrogen
fixation. Source data for estimating
actual evapotranspiration were annual
climate datasets for 2006 from the
PRISM climate group
EPA EnviroAtlas
"Biological nitrogen
fixation in
natural/semi-natural
ecosystems by 12-digit
HUC for the
Conterminous United
States, 2006" dataset.
May 7, 2015 version.
None

157
(http://prism.oregonstate.edu). This
indicator was calculated for EPA
EnviroAtlas. Additional information on
source data and calculation methods can
be found at:
https://edg.epa.gov/metadata/catalog/sear
ch/resource/details.page?uuid=%7B1B0
B5221-C726-4E7D-93FD-
23F7A4FF8930%7D
Cultivated
Biological
Nitrogen
Fixation
N_CULT_BIO_F
IX_MEAN_WS
Mean biological nitrogen fixation in
cultivated crop and hay/pasture lands in
the HUC12 in 2006 (kilograms nitrogen
per hectare per year). Biological nitrogen
fixation is the process in which nitrogen
gas from the atmosphere is incorporated
into plants. Calculated from an equation
describing the relationship between
yields of soybeans, alfalfa, peanuts, dry
beans, and dry peas with annual
biological nitrogen fixation. Source data
for estimating leguminous crop yields
were county-level yields reported by the
2006 USDA Census of Agriculture. This
indicator was calculated for EPA
EnviroAtlas. Additional information on
source data and calculation methods can
be found at:
https://edg.epa.gov/metadata/rest/docume
EPA EnviroAtlas
"Cultivated biological
nitrogen fixation in
agricultural lands by
12-digit HUC in the
Conterminous United
States, 2006" dataset.
May 7, 2015 version.
None

158
nt?id=%7B18DA5C01-F53D-4CC3-
B557-046C3FF5A584%7D
% Canopy
Cover, Median
Value in WS
(2011)
PCT_CANOPY_
COVER2011_ME
DIAN_WS
Median value of percent tree canopy
cover in the HUC12 from the NLCD
2011 USFS Tree Canopy cartographic
dataset (downloaded February 2015).
The NLCD 2011 USFS Tree Canopy
cartographic dataset provides an estimate
of the percent tree canopy cover (0 to
100%) for each 30 meter grid pixel in the
US. Calculated as the median of percent
tree canopy cover values in the HUC12.
NLCD 2011 "USFS
Tree Canopy
cartographic" dataset.
Downloaded February
2015.
Removed
% Canopy
Cover, Mean
Value in WS
(2011)
PCT_CANOPY_
COVER2011_ME
AN_WS
Percent of the HUC12 with tree canopy
cover. Source data was the NLCD 2011
USFS Tree Canopy dataset (October
2014 version;
http://www.mrlc.gov/nlcd11_data.php).
Calculated as the mean of percent tree
canopy cover values in the HUC12.
NLCD 2011 "USFS
Tree Canopy
cartographic" dataset.
Downloaded February
2015.
Removed

159
Carbon Storage
by Tree
Biomass
CARBON_STOR
E_TREE_BIO_M
ASS_WS
The amount of carbon stored in above
ground live forest biomass in the HUC12
(kilograms carbon per meter). Source
data was the National Biomass and
Carbon Dataset (NBCD) for the year
2000 developed by the Woods Hole
Research Center. The NBCD is a 30-
meter resolution gridded dataset of above
ground live dry biomass. This indicator
was calculated for EPA EnviroAtlas.
Detailed information on source data and
calculation methods can be found at:
https://edg.epa.gov/metadata/rest/docume
nt?id=%7B60BE4324-84B3-4C0F-
A9A3-22E198F814E6%7D
EPA EnviroAtlas
"Above Ground Live
Biomass Carbon
Storage for the
Conterminous United
States- Forested"
dataset. May 7, 2015
version.
Removed
Carbon Storage
by Tree Root
Biomass
CARBON_STOR
E_ROOT_BIO_
MASS_WS
The amount of carbon stored in below
ground live forest biomass in the HUC12
(kilograms carbon per meter). Calculated
from above ground live forest biomass
estimates and an equation relating above
and below ground forest biomass
published in USDA Forest Service
General Technical Report NRS-18.
Source data for above ground biomass
was the National Biomass and Carbon
Dataset (NBCD) for the year 2000
developed by the Woods Hole Research
Center. The NBCD is a 30-meter
resolution gridded dataset of above
ground live dry biomass. This indicator
was calculated for EPA EnviroAtlas.
EPA EnviroAtlas
"Below Ground Live
Tree Biomass Carbon
Storage for the
Conterminous United
States- Forested"
dataset. May 7, 2015
version.
Removed

160
Detailed information on source data and
calculation methods can be found at:
https://edg.epa.gov/metadata/rest/docume
nt?id=%7B0587242D-9CFC-460C-
91B1-FC89B65AC66F%7D
Headwater
HUC12 Flag
HW_FLAG Flag for HUC12s classified as headwater
watersheds. Headwater HUC12s have no
upstream HUC12s draining to them and
are assigned a value of 1. Non-headwater
HUC12s have upstream HUC12s
draining to them and are assigned a 0.
The presence/absence of upstream
HUC12s was determined as part of flow
routing analysis of HUC12s in the
NHDPlus2 WBD Snapshot, EnviroAtlas
Version, using the NHDPlus2 flow
network. Created by EPA EnviroAtlas in
Fall 2015. (See also NHDPlus2 and
WBD Snapshot, EnviroAtlas version
glossary definitions).
Based on analysis of
HUC12 flow routing
by EPA EnviroAtlas
in fall 2015 using
NHDPlus WBD
Snapshot, EnviroAtlas
Version (February
2015 version) and
NHDPlus2 flow
routing tables.
Removed

161
% Draining to
1st, 2nd, or 3rd
Order Streams
in WS
STREAM_ORDE
R_1_2_3_PCT_
WS
Percent of the HUC12 that drains to
headwater streams (1st, 2nd, or 3rd order
streams). Source data was the NHDPlus2
catchment dataset and the NHDPlus2
Value Added Attributes (VAA) table.
NHDPlus2 catchments were assigned a
stream order based on the Modified
Strahler Stream Order reported for the
catchment in the VAA table. Equation
used: Area of 1st, 2nd, or 3rd Order
Catchments in HUC12 / HUC12 Area *
100. (See also NHDPlus2 glossary
definition).
NHDPlus2
Catchments;
NHDPlus2
PlusFlowlineVAA
tables
Removed
Count of At-
Risk Aquatic
Species
AQ_ALL_SP_CN
T_WS
The total number of at-risk species
associated with aquatic habitat that may
reside in the HUC12. At-risk species are
defined as species that are listed under
the U.S. Endangered Species Act and
species that have a NatureServe
conservation status rank of critically
imperiled (rank G1) or imperiled (rank
G2). Source data were species occurence
and location records in the NatureServe
Biotics database (accessed circa-2011).
This indicator was calculated for EPA
EnviroAtlas. Additional information on
source data and calculation methods can
be found at:
https://edg.epa.gov/metadata/catalog/sear
ch/resource/details.page?uuid=%7B9E49
EPA EnviroAtlas
"NatureServe Analysis
of Imperiled or
Federally Listed
Species by HUC-12
for the Conterminous
United States" dataset.
May 7, 2015 version.
Removed

162
350E-728C-4B75-90B5-
A2A2A62C019E%7D.
Count of At-
Risk Aquatic
Animal Species
AQ_ANML_SP_
CNT_WS
The number of at-risk animal species
associated with aquatic habitat that may
reside in the HUC12. At-risk species are
defined as species that are listed under
the U.S. Endangered Species Act and
species that have a NatureServe
conservation status rank of critically
imperiled (rank G1) or imperiled (rank
G2). Source data were species occurence
and location records in the NatureServe
Biotics database (accessed circa-2011).
This indicator was calculated for EPA
EnviroAtlas. Additional information on
source data and calculation methods can
be found at:
https://edg.epa.gov/metadata/catalog/sear
ch/resource/details.page?uuid=%7B9E49
350E-728C-4B75-90B5-
A2A2A62C019E%7D.
EPA EnviroAtlas
"NatureServe Analysis
of Imperiled or
Federally Listed
Species by HUC-12
for the Conterminous
United States" dataset.
May 7, 2015 version.
Removed

163
Count of At-
Risk Aquatic
Plant Species
AQ_PLANT_SP_
CNT_WS
The number of at-risk plant species
associated with aquatic habitat that may
reside in the HUC12. At-risk species are
defined as species that are listed under
the U.S. Endangered Species Act and
species that have a NatureServe
conservation status rank of critically
imperiled (rank G1) or imperiled (rank
G2). Source data were species occurence
and location records in the NatureServe
Biotics database (accessed circa-2011).
This indicator was calculated for EPA
EnviroAtlas. Additional information on
source data and calculation methods can
be found at:
https://edg.epa.gov/metadata/catalog/sear
ch/resource/details.page?uuid=%7B9E49
350E-728C-4B75-90B5-
A2A2A62C019E%7D.
EPA EnviroAtlas
"NatureServe Analysis
of Imperiled or
Federally Listed
Species by HUC-12
for the Conterminous
United States" dataset.
May 7, 2015 version.
Removed
Count of At-
Risk Wetland
Species
WTL_ALL_SP_C
NT_WS
The total number of at-risk species
associated with wetland habitat that may
reside in the HUC12. At-risk species are
defined as species that are listed under
the U.S. Endangered Species Act and
species that have a NatureServe
conservation status rank of critically
imperiled (rank G1) or imperiled (rank
G2). Source data were species occurence
and location records in the NatureServe
Biotics database (accessed circa-2011).
This indicator was calculated for EPA
EPA EnviroAtlas
"NatureServe Analysis
of Imperiled or
Federally Listed
Species by HUC-12
for the Conterminous
United States" dataset.
May 7, 2015 version.
Removed
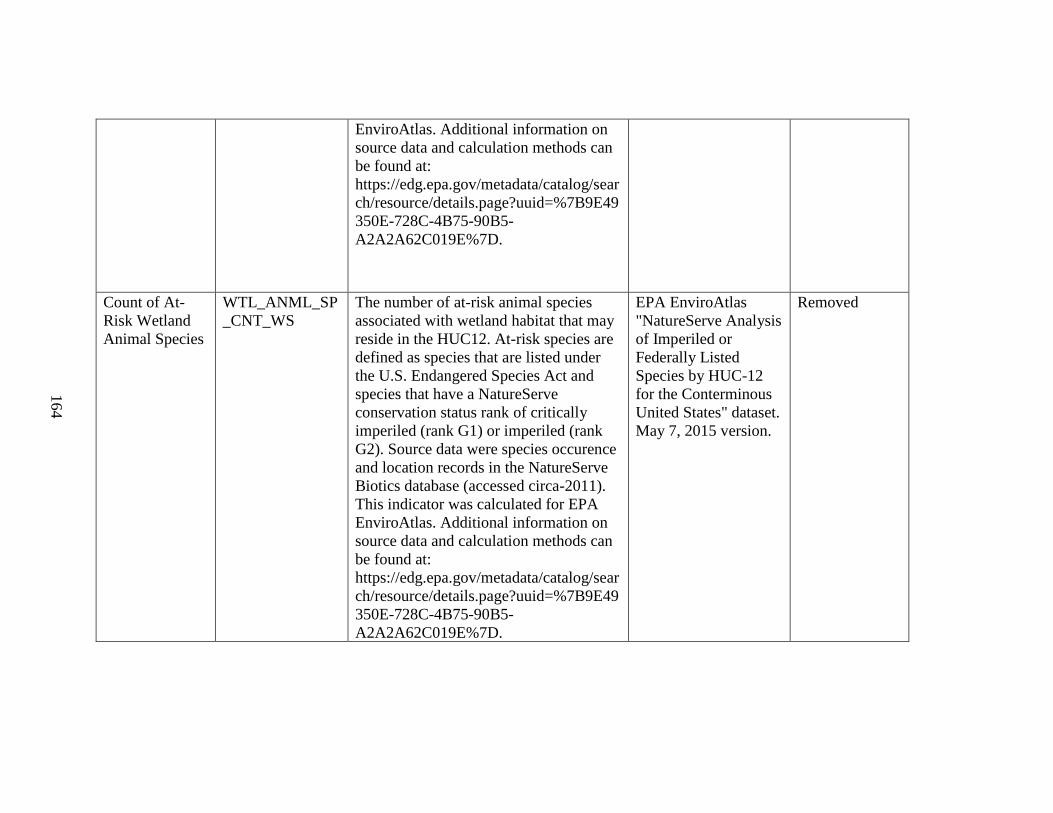
164
EnviroAtlas. Additional information on
source data and calculation methods can
be found at:
https://edg.epa.gov/metadata/catalog/sear
ch/resource/details.page?uuid=%7B9E49
350E-728C-4B75-90B5-
A2A2A62C019E%7D.
Count of At-
Risk Wetland
Animal Species
WTL_ANML_SP
_CNT_WS
The number of at-risk animal species
associated with wetland habitat that may
reside in the HUC12. At-risk species are
defined as species that are listed under
the U.S. Endangered Species Act and
species that have a NatureServe
conservation status rank of critically
imperiled (rank G1) or imperiled (rank
G2). Source data were species occurence
and location records in the NatureServe
Biotics database (accessed circa-2011).
This indicator was calculated for EPA
EnviroAtlas. Additional information on
source data and calculation methods can
be found at:
https://edg.epa.gov/metadata/catalog/sear
ch/resource/details.page?uuid=%7B9E49
350E-728C-4B75-90B5-
A2A2A62C019E%7D.
EPA EnviroAtlas
"NatureServe Analysis
of Imperiled or
Federally Listed
Species by HUC-12
for the Conterminous
United States" dataset.
May 7, 2015 version.
Removed

165
Count of At-
Risk Wetland
Plant Species
WTL_PLANT_S
P_CNT_WS
The number of at-risk plant species
associated with wetland habitat that may
reside in the HUC12. At-risk species are
defined as species that are listed under
the U.S. Endangered Species Act and
species that have a NatureServe
conservation status rank of critically
imperiled (rank G1) or imperiled (rank
G2). Source data were species occurence
and location records in the NatureServe
Biotics database (accessed circa-2011).
This indicator was calculated for EPA
EnviroAtlas. Additional information on
source data and calculation methods can
be found at:
https://edg.epa.gov/metadata/catalog/sear
ch/resource/details.page?uuid=%7B9E49
350E-728C-4B75-90B5-
A2A2A62C019E%7D.
EPA EnviroAtlas
"NatureServe Analysis
of Imperiled or
Federally Listed
Species by HUC-12
for the Conterminous
United States" dataset.
May 7, 2015 version.
Removed
Count of At-
Risk Terrestrial
Species
TR_ALL_SP_CN
T_WS
The total number of at-risk species
associated with terrestrial habitat that
may reside in the HUC12. At-risk
species are defined as species that are
listed under the U.S. Endangered Species
Act and species that have a NatureServe
conservation status rank of critically
imperiled (rank G1) or imperiled (rank
G2). Source data were species occurence
and location records in the NatureServe
Biotics database (accessed circa-2011).
This indicator was calculated for EPA
EPA EnviroAtlas
"NatureServe Analysis
of Imperiled or
Federally Listed
Species by HUC-12
for the Conterminous
United States" dataset.
May 7, 2015 version.
Removed

166
EnviroAtlas. Additional information on
source data and calculation methods can
be found at:
https://edg.epa.gov/metadata/catalog/sear
ch/resource/details.page?uuid=%7B9E49
350E-728C-4B75-90B5-
A2A2A62C019E%7D.
Count of At-
Risk Terrestrial
Animal Species
TR_ANML_SP_
CNT_WS
The number of at-risk animal species
associated with terrestrial habitat that
may reside in the HUC12. At-risk
species are defined as species that are
listed under the U.S. Endangered Species
Act and species that have a NatureServe
conservation status rank of critically
imperiled (rank G1) or imperiled (rank
G2). Source data were species occurence
and location records in the NatureServe
Biotics database (accessed circa-2011).
This indicator was calculated for EPA
EnviroAtlas. Additional information on
source data and calculation methods can
be found at:
https://edg.epa.gov/metadata/catalog/sear
ch/resource/details.page?uuid=%7B9E49
350E-728C-4B75-90B5-
A2A2A62C019E%7D.
EPA EnviroAtlas
"NatureServe Analysis
of Imperiled or
Federally Listed
Species by HUC-12
for the Conterminous
United States" dataset.
May 7, 2015 version.
Removed

167
Count of At-
Risk Terrestrial
Plant Species
TR_PLANT_SP_
CNT_WS
The number of at-risk plant species
associated with terrestrial habitat that
may reside in the HUC12. At-risk
species are defined as species that are
listed under the U.S. Endangered Species
Act and species that have a NatureServe
conservation status rank of critically
imperiled (rank G1) or imperiled (rank
G2). Source data were species occurence
and location records in the NatureServe
Biotics database (accessed circa-2011).
This indicator was calculated for EPA
EnviroAtlas. Additional information on
source data and calculation methods can
be found at:
https://edg.epa.gov/metadata/catalog/sear
ch/resource/details.page?uuid=%7B9E49
350E-728C-4B75-90B5-
A2A2A62C019E%7D.
EPA EnviroAtlas
"NatureServe Analysis
of Imperiled or
Federally Listed
Species by HUC-12
for the Conterminous
United States" dataset.
May 7, 2015 version.
Removed
Count of
Reptile Species
REPTILE_SP_C
NT_WS
The number of reptile species associated
with habitat that may occur in the
HUC12. Source data were reptile species
range maps developed by the US
Geological Survey Gap Analysis
Program (accessed circa-2013). This
indicator was calculated for EPA
EnviroAtlas. Additional information on
source data and calculation methods can
be found at:
https://edg.epa.gov/metadata/catalog/sear
ch/resource/details.page?uuid=%7B54A8
EPA EnviroAtlas
"Reptile Biodiversity
Ecosystem Services
Metrics by 12-digit
HUC for the
Conterminous United
States" dataset. May
18, 2016 version.
Removed

168
FEC4-97C2-40D1-90FE-
DA932E6B5EFE%7D.
% Protected
Rare
Ecosystems
RARE_ECO_PR
OT_PCT_WS
Percent of the rare ecosystem area in the
HUC12 that is protected. Rare
ecosystems were defined based on
ecosystem size, shape, and type. Source
data was the U.S. Geological Survey
(USGS) National Gap Analysis Program
(GAP) land cover dataset (version 2,
2011). Ecological systems in the GAP
land cover dataset were scored according
to relative rarity based on area, spatial
pattern, and uniqueness. Rarity scores
ranged from 0 (not rare) to 100 (very
rare); any ecological system with a score
of 75 or greater was classified as rare.
Protected lands were defined as areas
with Status 1 or Status 2 protection by
the USGS Gap Analysis Program. Status
1 and Status 2 lands have protections in
place to prevent the conversion of natural
land cover. Equation used: Area of
Protected Rare Ecosystems / Area of
Rare Ecosystems * 100. This indicator
was calculated for EPA EnviroAtlas.
EPA EnviroAtlas
"Ecosystem Rarity
Metrics by 12-digit
HUC for the
Conterminous United
States" dataset. May 7,
2015 version.
Removed
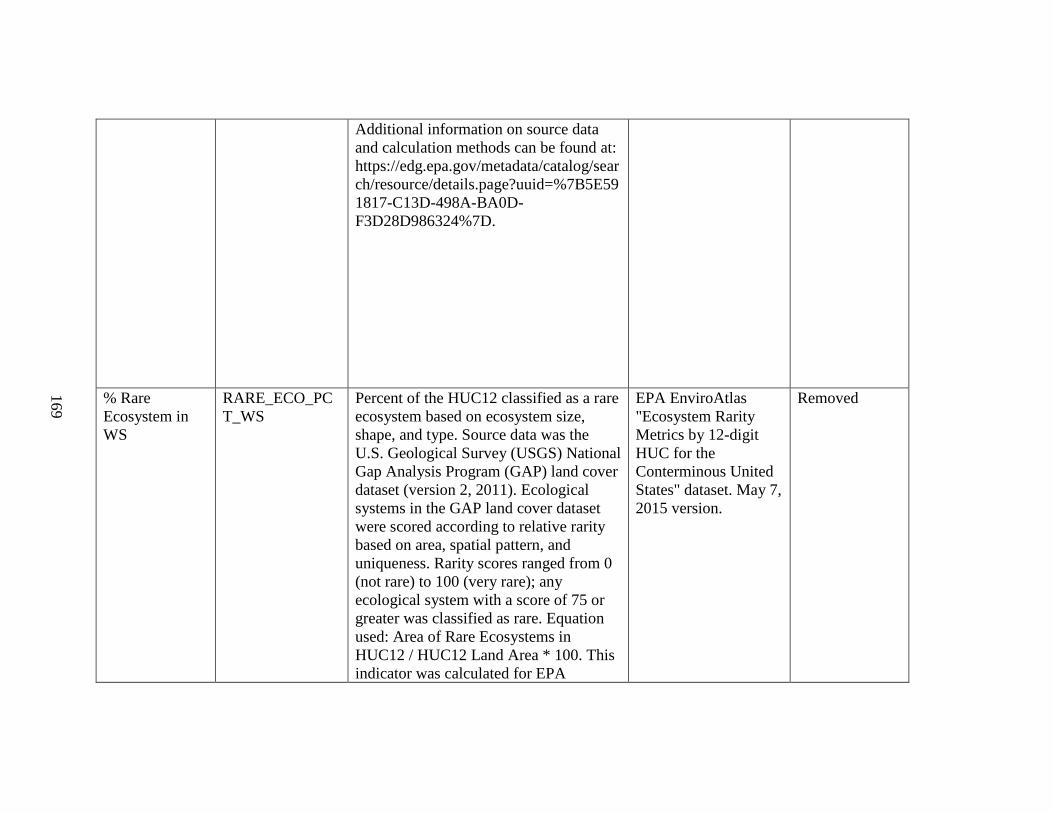
169
Additional information on source data
and calculation methods can be found at:
https://edg.epa.gov/metadata/catalog/sear
ch/resource/details.page?uuid=%7B5E59
1817-C13D-498A-BA0D-
F3D28D986324%7D.
% Rare
Ecosystem in
WS
RARE_ECO_PC
T_WS
Percent of the HUC12 classified as a rare
ecosystem based on ecosystem size,
shape, and type. Source data was the
U.S. Geological Survey (USGS) National
Gap Analysis Program (GAP) land cover
dataset (version 2, 2011). Ecological
systems in the GAP land cover dataset
were scored according to relative rarity
based on area, spatial pattern, and
uniqueness. Rarity scores ranged from 0
(not rare) to 100 (very rare); any
ecological system with a score of 75 or
greater was classified as rare. Equation
used: Area of Rare Ecosystems in
HUC12 / HUC12 Land Area * 100. This
indicator was calculated for EPA
EPA EnviroAtlas
"Ecosystem Rarity
Metrics by 12-digit
HUC for the
Conterminous United
States" dataset. May 7,
2015 version.
Removed

170
EnviroAtlas. Additional information on
source data and calculation methods can
be found at:
https://edg.epa.gov/metadata/catalog/sear
ch/resource/details.page?uuid=%7B5E59
1817-C13D-498A-BA0D-
F3D28D986324%7D.
Neutral
Variable,
Ecological
Category
NEUTRAL_ECO Equal to 0.5 for all HUC12s. Can be used
for an analysis that focuses on just the
Stressor and Social indicator categories,
with the Ecological category left out. If
using this indicator do not select any
other Ecological Indicators.
Not applicable. Removed
% Urban in WS
(2011)
URBAN_CDLNL
CD11_PCT_WS
Percent of the HUC12 classified as urban
cover by the 2011 CDL-NLCD Hybrid
Land Cover dataset. Urban cover classes
include 'Developed, Open Space' (code
121), 'Developed, Low Intensity' (code
122), 'Developed, Medium Intensity'
(code 123), 'Developed, High Intensity'
(code 124) in the 2011 CDL-NLCD
Hybrid Land Cover dataset. Calculated
as urban area divided by HUC12 area,
multiplied by 100. (See also 2011 CDL-
NLCD Hybrid Land Cover glossary
definition).
2011 CDL-NLCD,
EnviroAtlas Version
land cover (July 2015
version). HUC12
Version: NHDPlus
WBD Snapshot,
EnviroAtlas Version
(February 2015
version).
None
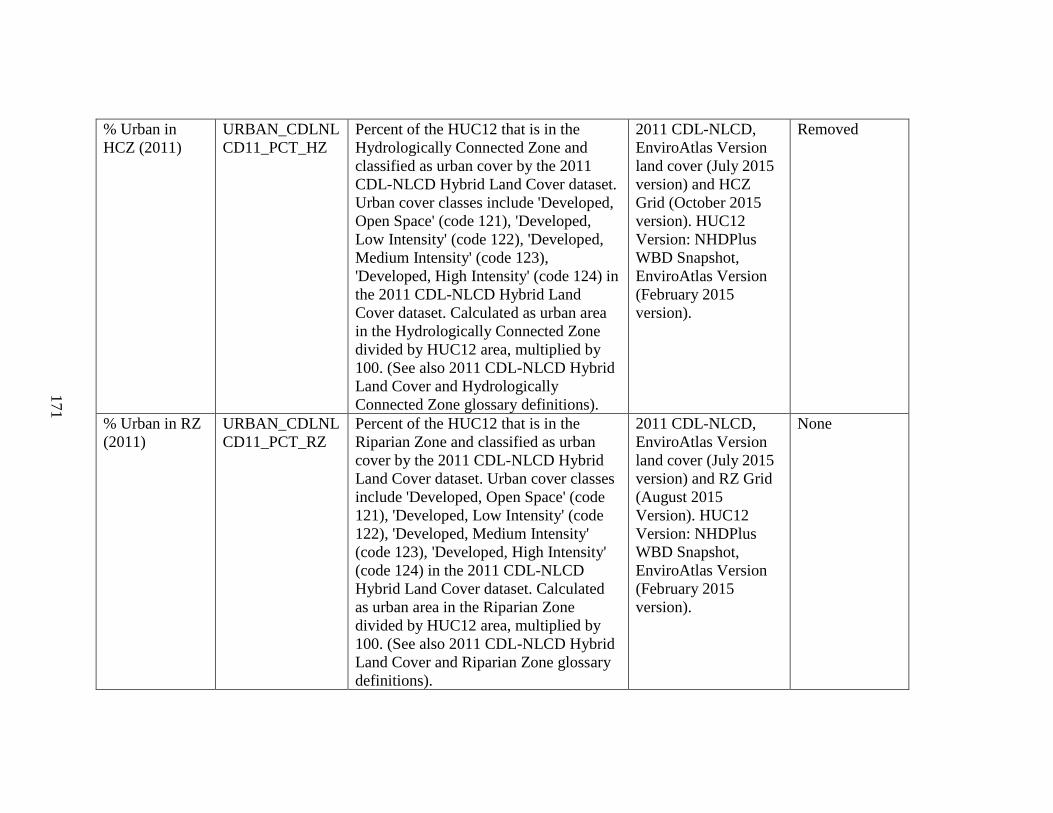
171
% Urban in
HCZ (2011)
URBAN_CDLNL
CD11_PCT_HZ
Percent of the HUC12 that is in the
Hydrologically Connected Zone and
classified as urban cover by the 2011
CDL-NLCD Hybrid Land Cover dataset.
Urban cover classes include 'Developed,
Open Space' (code 121), 'Developed,
Low Intensity' (code 122), 'Developed,
Medium Intensity' (code 123),
'Developed, High Intensity' (code 124) in
the 2011 CDL-NLCD Hybrid Land
Cover dataset. Calculated as urban area
in the Hydrologically Connected Zone
divided by HUC12 area, multiplied by
100. (See also 2011 CDL-NLCD Hybrid
Land Cover and Hydrologically
Connected Zone glossary definitions).
2011 CDL-NLCD,
EnviroAtlas Version
land cover (July 2015
version) and HCZ
Grid (October 2015
version). HUC12
Version: NHDPlus
WBD Snapshot,
EnviroAtlas Version
(February 2015
version).
Removed
% Urban in RZ
(2011)
URBAN_CDLNL
CD11_PCT_RZ
Percent of the HUC12 that is in the
Riparian Zone and classified as urban
cover by the 2011 CDL-NLCD Hybrid
Land Cover dataset. Urban cover classes
include 'Developed, Open Space' (code
121), 'Developed, Low Intensity' (code
122), 'Developed, Medium Intensity'
(code 123), 'Developed, High Intensity'
(code 124) in the 2011 CDL-NLCD
Hybrid Land Cover dataset. Calculated
as urban area in the Riparian Zone
divided by HUC12 area, multiplied by
100. (See also 2011 CDL-NLCD Hybrid
Land Cover and Riparian Zone glossary
definitions).
2011 CDL-NLCD,
EnviroAtlas Version
land cover (July 2015
version) and RZ Grid
(August 2015
Version). HUC12
Version: NHDPlus
WBD Snapshot,
EnviroAtlas Version
(February 2015
version).
None
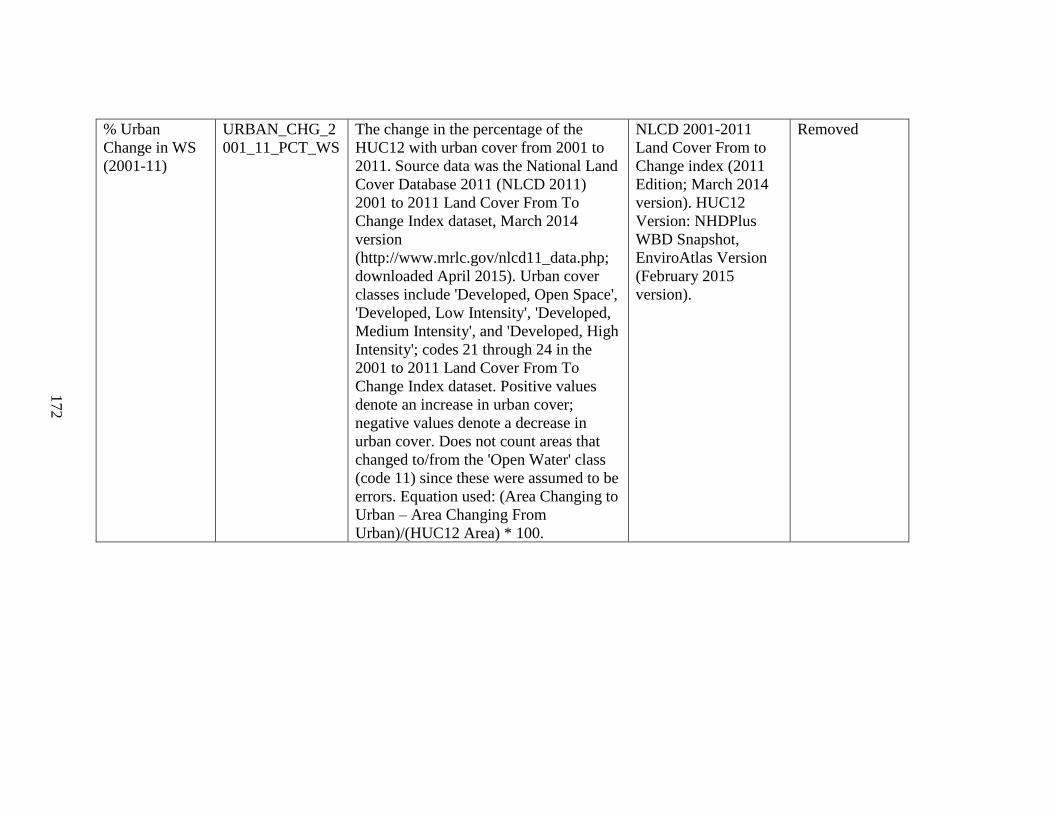
172
% Urban
Change in WS
(2001-11)
URBAN_CHG_2
001_11_PCT_WS
The change in the percentage of the
HUC12 with urban cover from 2001 to
2011. Source data was the National Land
Cover Database 2011 (NLCD 2011)
2001 to 2011 Land Cover From To
Change Index dataset, March 2014
version
(http://www.mrlc.gov/nlcd11_data.php;
downloaded April 2015). Urban cover
classes include 'Developed, Open Space',
'Developed, Low Intensity', 'Developed,
Medium Intensity', and 'Developed, High
Intensity'; codes 21 through 24 in the
2001 to 2011 Land Cover From To
Change Index dataset. Positive values
denote an increase in urban cover;
negative values denote a decrease in
urban cover. Does not count areas that
changed to/from the 'Open Water' class
(code 11) since these were assumed to be
errors. Equation used: (Area Changing to
Urban – Area Changing From
Urban)/(HUC12 Area) * 100.
NLCD 2001-2011
Land Cover From to
Change index (2011
Edition; March 2014
version). HUC12
Version: NHDPlus
WBD Snapshot,
EnviroAtlas Version
(February 2015
version).
Removed

173
% Urban
Change in HCZ
(2001-11)
URBAN_CHG_2
001_11_PCT_HZ
The change in the percentage of the
HUC12 with urban cover in the
Hydrologically Connected Zone (HCZ)
from 2001 to 2011. Source data was the
National Land Cover Database 2011
(NLCD 2011) 2001 to 2011 Land Cover
From To Change Index dataset, March
2014 version
(http://www.mrlc.gov/nlcd11_data.php;
downloaded April 2015). Urban cover
classes include 'Developed, Open Space',
'Developed, Low Intensity', 'Developed,
Medium Intensity', and 'Developed, High
Intensity'; codes 21 through 24 in the
2001 to 2011 Land Cover From To
Change Index dataset. Positive values
denote an increase in urban; negative
values denote a decrease in urban. Does
not count areas that changed to/from the
'Open Water' class (code 11) since these
were assumed to be errors. Equation
used: (Area Changing to Urban in the
HCZ – Area Changing From Urban in
the HCZ)/(HUC12 Area) * 100. (See
also Hydrologically Connected Zone
glossary definition).
NLCD 2001-2011
Land Cover From to
Change index (2011
Edition; March 2014
version) and HCZ
Grid (October 2015
version). HUC12
Version: NHDPlus
WBD Snapshot,
EnviroAtlas Version
(February 2015
version).
Removed

174
% Urban
Change RZ
(2001-11)
URBAN_CHG_2
001_11_PCT_RZ
The change in the percentage of the
HUC12 with urban cover in the Riparian
Zone (RZ) from 2001 to 2011. Source
data was the National Land Cover
Database 2011 (NLCD 2011) 2001 to
2011 Land Cover From To Change Index
dataset, March 2014 version
(http://www.mrlc.gov/nlcd11_data.php;
downloaded April 2015). Urban cover
classes include 'Developed, Open Space',
'Developed, Low Intensity', 'Developed,
Medium Intensity', and 'Developed, High
Intensity'; codes 21 through 24 in the
2001 to 2011 Land Cover From To
Change Index dataset. Positive values
denote an increase in urban cover;
negative values denote a decrease in
urban cover. Does not count areas that
changed to/from the 'Open Water' class
(code 11) since these were assumed to be
errors. Equation used: (Area Changing to
Urban in the RZ – Area Changing From
Urban in the RZ)/(HUC12 Area) * 100.
(See also Riparian Zone glossary
definition).
NLCD 2001-2011
Land Cover From to
Change index (2011
Edition; March 2014
version) and RZ Grid
(August 2015
Version). HUC12
Version: NHDPlus
WBD Snapshot,
EnviroAtlas Version
(February 2015
version).
Removed
% Developed,
High Intensity
in WS (2011)
LC124_CDLNLC
D11_PCT_WS
Percent of the HUC12 classified as
'Developed, High Intensity' (code 124)
by the 2011 CDL-NLCD Hybrid Land
Cover dataset. Calculated as 'Developed,
High Intensity' area divided by HUC12
area, multiplied by 100. (See also 2011
2011 CDL-NLCD,
EnviroAtlas Version
land cover (July 2015
version). HUC12
Version: NHDPlus
WBD Snapshot,
Removed

175
CDL-NLCD Hybrid Land Cover
glossary definition).
EnviroAtlas Version
(February 2015
version).
% Developed,
Medium
Intensity in WS
(2011)
LC123_CDLNLC
D11_PCT_WS
Percent of the HUC12 classified as
'Developed, Medium Intensity' (code
123) by the 2011 CDL-NLCD Hybrid
Land Cover dataset. Calculated as
'Developed, Medium Intensity' area
divided by HUC12 area, multiplied by
100. (See also 2011 CDL-NLCD Hybrid
Land Cover glossary definition).
2011 CDL-NLCD,
EnviroAtlas Version
land cover (July 2015
version). HUC12
Version: NHDPlus
WBD Snapshot,
EnviroAtlas Version
(February 2015
version).
Removed
% Developed,
Low Intensity
in WS (2011)
LC122_CDLNLC
D11_PCT_WS
Percent of the HUC12 classified as
'Developed, Low Intensity' (code 122) by
the 2011 CDL-NLCD Hybrid Land
Cover dataset. Calculated as 'Developed,
Low Intensity' area divided by HUC12
area, multiplied by 100. (See also 2011
CDL-NLCD Hybrid Land Cover
glossary definition).
2011 CDL-NLCD,
EnviroAtlas Version
land cover (July 2015
version). HUC12
Version: NHDPlus
WBD Snapshot,
EnviroAtlas Version
(February 2015
version).
Removed
% Developed,
Open Space in
WS (2011)
LC121_CDLNLC
D11_PCT_WS
Percent of the HUC12 classified as
'Developed, Open Space' (code 121) by
the 2011 CDL-NLCD Hybrid Land
Cover dataset. Calculated as 'Developed,
Open Space' area divided by HUC12
area, multiplied by 100. (See also 2011
CDL-NLCD Hybrid Land Cover
glossary definition).
2011 CDL-NLCD,
EnviroAtlas Version
land cover (July 2015
version). HUC12
Version: NHDPlus
WBD Snapshot,
EnviroAtlas Version
Removed

176
(February 2015
version).
% Developed,
High Intensity
in HCZ (2011)
LC124_CDLNLC
D11_PCT_HZ
Percent of the HUC12 that is in the
Hydrologically Connected Zone and
classified as 'Developed, High Intensity'
(code 124) by the 2011 CDL-NLCD
Hybrid Land Cover dataset. Calculated
as 'Developed, High Intensity' area in the
Hydrologically Connected Zone divided
by HUC12 area, multiplied by 100. (See
also 2011 CDL-NLCD Hybrid Land
Cover and Hydrologically Connected
Zone glossary definitions).
2011 CDL-NLCD,
EnviroAtlas Version
land cover (July 2015
version) and HCZ
Grid (October 2015
version). HUC12
Version: NHDPlus
WBD Snapshot,
EnviroAtlas Version
(February 2015
version).
Removed
% Developed,
Medium
Intensity in
HCZ (2011)
LC123_CDLNLC
D11_PCT_HZ
Percent of the HUC12 that is in the
Hydrologically Connected Zone and
classified as 'Developed, Medium
Intensity' (code 123) by the 2011 CDL-
NLCD Hybrid Land Cover dataset.
Calculated as 'Developed, Medium
Intensity' area in the Hydrologically
Connected Zone divided by HUC12 area,
multiplied by 100. (See also 2011 CDL-
NLCD Hybrid Land Cover and
Hydrologically Connected Zone glossary
definitions).
2011 CDL-NLCD,
EnviroAtlas Version
land cover (July 2015
version) and HCZ
Grid (October 2015
version). HUC12
Version: NHDPlus
WBD Snapshot,
EnviroAtlas Version
(February 2015
version).
Removed

177
% Developed,
Low Intensity
in HCZ (2011)
LC122_CDLNLC
D11_PCT_HZ
Percent of the HUC12 that is in the
Hydrologically Connected Zone and
classified as 'Developed, Low Intensity'
(code 122) by the 2011 CDL-NLCD
Hybrid Land Cover dataset. Calculated
as 'Developed, Low Intensity' area in the
Hydrologically Connected Zone divided
by HUC12 area, multiplied by 100. (See
also 2011 CDL-NLCD Hybrid Land
Cover and Hydrologically Connected
Zone glossary definitions).
2011 CDL-NLCD,
EnviroAtlas Version
land cover (July 2015
version) and HCZ
Grid (October 2015
version). HUC12
Version: NHDPlus
WBD Snapshot,
EnviroAtlas Version
(February 2015
version).
Removed
% Developed,
Open Space in
HCZ (2011)
LC121_CDLNLC
D11_PCT_HZ
Percent of the HUC12 that is in the
Hydrologically Connected Zone and
classified as 'Developed, Open Space'
(code 121) by the 2011 CDL-NLCD
Hybrid Land Cover dataset. Calculated
as 'Developed, Open Space' area in the
Hydrologically Connected Zone divided
by HUC12 area, multiplied by 100. (See
also 2011 CDL-NLCD Hybrid Land
Cover and Hydrologically Connected
Zone glossary definitions).
2011 CDL-NLCD,
EnviroAtlas Version
land cover (July 2015
version) and HCZ
Grid (October 2015
version). HUC12
Version: NHDPlus
WBD Snapshot,
EnviroAtlas Version
(February 2015
version).
Removed
% Developed,
High Intensity
in RZ (2011)
LC124_CDLNLC
D11_PCT_RZ
Percent of the HUC12 that is in the
Riparian Zone and classified as
'Developed, High Intensity' (code 124)
by the 2011 CDL-NLCD Hybrid Land
Cover dataset. Calculated as 'Developed,
High Intensity' area in the Riparian Zone
divided by HUC12 area, multiplied by
100. (See also 2011 CDL-NLCD Hybrid
2011 CDL-NLCD,
EnviroAtlas Version
land cover (July 2015
version) and RZ Grid
(August 2015
Version). HUC12
Version: NHDPlus
WBD Snapshot,
EnviroAtlas Version
Removed

178
Land Cover and Riparian Zone glossary
definitions).
(February 2015
version).
% Developed,
Medium
Intensity in RZ
(2011)
LC123_CDLNLC
D11_PCT_RZ
Percent of the HUC12 that is in the
Riparian Zone and classified as
'Developed, Medium Intensity' (code
123) by the 2011 CDL-NLCD Hybrid
Land Cover dataset. Calculated as
'Developed, Medium Intensity' area in
the Riparian Zone divided by HUC12
area, multiplied by 100. (See also 2011
CDL-NLCD Hybrid Land Cover and
Riparian Zone glossary definitions).
2011 CDL-NLCD,
EnviroAtlas Version
land cover (July 2015
version) and RZ Grid
(August 2015
Version). HUC12
Version: NHDPlus
WBD Snapshot,
EnviroAtlas Version
(February 2015
version).
Removed
% Developed,
Low Intensity
in RZ (2011)
LC122_CDLNLC
D11_PCT_RZ
Percent of the HUC12 that is in the
Riparian Zone and classified as
'Developed, Low Intensity' (code 122) by
the 2011 CDL-NLCD Hybrid Land
Cover dataset. Calculated as 'Developed,
Low Intensity' area in the Riparian Zone
divided by HUC12 area, multiplied by
100. (See also 2011 CDL-NLCD Hybrid
Land Cover and Riparian Zone glossary
definitions).
2011 CDL-NLCD,
EnviroAtlas Version
land cover (July 2015
version) and RZ Grid
(August 2015
Version). HUC12
Version: NHDPlus
WBD Snapshot,
EnviroAtlas Version
(February 2015
version).
Removed

179
% Developed,
Open Space in
RZ (2011)
LC121_CDLNLC
D11_PCT_RZ
Percent of the HUC12 that is in the
Riparian Zone and classified as
'Developed, Open Space' (code 121) by
the 2011 CDL-NLCD Hybrid Land
Cover dataset. Calculated as 'Developed,
Open Space' area in the Riparian Zone
divided by HUC12 area, multiplied by
100. (See also 2011 CDL-NLCD Hybrid
Land Cover and Riparian Zone glossary
definitions).
2011 CDL-NLCD,
EnviroAtlas Version
land cover (July 2015
version) and RZ Grid
(August 2015
Version). HUC12
Version: NHDPlus
WBD Snapshot,
EnviroAtlas Version
(February 2015
version).
Removed
% Agriculture
in WS (2011)
AG_CDLNLCD1
1_PCT_WS
Percent of the HUC12 classified as
agriculture cover by the 2011 CDL-
NLCD Hybrid Land Cover dataset.
Agriculture cover classes includes
cropland and pasture; codes 1 through
92, 181, 182, and 204 through 254 in the
2011 CDL-NLCD Hybrid Land Cover
dataset. Calculated as agriculture area in
the HUC12 divided by HUC12 area,
multiplied by 100. (See also 2011 CDL-
NLCD Hybrid Land Cover glossary
definition).
2011 CDL-NLCD,
EnviroAtlas Version
land cover (July 2015
version). HUC12
Version: NHDPlus
WBD Snapshot,
EnviroAtlas Version
(February 2015
version).
None
% Agriculture
in HCZ (2011)
AG_CDLNLCD1
1_PCT_HZ
Percent of the HUC12 that is in the
Hydrologically Connected Zone and
classified as agriculture cover by the
2011 CDL-NLCD Hybrid Land Cover
dataset. Agriculture cover classes include
cropland and pasture; codes 1 through
92, 181, 182, and 204 through 254 in the
2011 CDL-NLCD Hybrid Land Cover
2011 CDL-NLCD,
EnviroAtlas Version
land cover (July 2015
version) and HCZ
Grid (October 2015
version). HUC12
Version: NHDPlus
WBD Snapshot,
Removed

180
dataset. Calculated as agriculture area in
the Hydrologically Connected Zone
divided by HUC12 area, multiplied by
100. (See also 2011 CDL-NLCD Hybrid
Land Cover and Hydrologically
Connected Zone glossary definitions).
EnviroAtlas Version
(February 2015
version).
% Agriculture
in RZ (2011)
AG_CDLNLCD1
1_PCT_RZ
Percent of the HUC12 that is in the
Riparian Zone and classified as
agriculture cover by the 2011 CDL-
NLCD Hybrid Land Cover dataset.
Agriculture cover classes include
cropland and pasture; codes 1 through
92, 181, 182, and 204 through 254 in the
2011 CDL-NLCD Hybrid Land Cover
dataset. Calculated as agriculture area in
the Riparian Zone divided by HUC12
area, multiplied by 100. (See also 2011
CDL-NLCD Hybrid Land Cover and
Riparian Zone glossary definitions).
2011 CDL-NLCD,
EnviroAtlas Version
land cover (July 2015
version) and RZ Grid
(August 2015
Version). HUC12
Version: NHDPlus
WBD Snapshot,
EnviroAtlas Version
(February 2015
version).
None
% Agriculture
Change in WS
(2001-11)
AG_CHG_2001_
11_PCT_WS
The change in the percentage of the
HUC12 with agriculture cover from 2001
to 2011. Source data was the National
Land Cover Database 2011 (NLCD
2011) 2001 to 2011 Land Cover From To
Change Index dataset, March 2014
version
(http://www.mrlc.gov/nlcd11_data.php;
downloaded April 2015). Agriculture
cover classes include 'Pasture/Hay' and
NLCD 2001-2011
Land Cover From to
Change index (2011
Edition; March 2014
version). HUC12
Version: NHDPlus
WBD Snapshot,
EnviroAtlas Version
(February 2015
version).
Removed

181
'Cultivated Crops'; codes 81 and 82 in the
2001 to 2011 Land Cover From To
Change Index dataset. Positive values
denote an increase in agriculture;
negative values denote a decrease in
agriculture. Does not count areas that
changed to/from the 'Open Water' class
(code 11) since these were assumed to be
errors. Equation used: (Area Changing to
Agriculture – Area Changing From
Agriculture)/(HUC12 Area) * 100.
% Agriculture
Change in HCZ
(2001-11)
AG_CHG_2001_
11_PCT_HZ
The change in the percentage of the
HUC12 with agriculture cover in the
Hydrologically Connected Zone (HCZ)
from 2001 to 2011. Source data was the
National Land Cover Database 2011
(NLCD 2011) 2001 to 2011 Land Cover
From To Change Index dataset, March
2014 version
(http://www.mrlc.gov/nlcd11_data.php;
downloaded April 2015). Agriculture
cover classes include 'Pasture/Hay' and
'Cultivated Crops'; codes 81 and 82 in the
2001 to 2011 Land Cover From To
Change Index dataset. Positive values
denote an increase in agriculture;
negative values denote a decrease in
agriculture. Does not count areas that
changed to/from the 'Open Water' class
(code 11) since these were assumed to be
errors. Equation used: (Area Changing to
NLCD 2001-2011
Land Cover From to
Change index (2011
Edition; March 2014
version) and HCZ
Grid (October 2015
version). HUC12
Version: NHDPlus
WBD Snapshot,
EnviroAtlas Version
(February 2015
version).
Removed

182
Agriculture in the HCZ – Area Changing
From Agriculture HCZ)/(HUC12 Area) *
100. (See also Hydrologically Connected
Zone glossary definition).
% Agriculture
Change in RZ
(2001-11)
AG_CHG_2001_
11_PCT_RZ
The change in the percentage of the
HUC12 with agriculture cover in the
Riparian Zone (RZ) from 2001 to 2011.
Source data was the National Land Cover
Database 2011 (NLCD 2011) 2001 to
2011 Land Cover From To Change Index
dataset, March 2014 version
(http://www.mrlc.gov/nlcd11_data.php;
downloaded April 2015). Agriculture
cover classes include 'Pasture/Hay' and
'Cultivated Crops'; codes 81 and 82 in the
2001 to 2011 Land Cover From To
Change Index dataset. Positive values
denote an increase in agriculture;
negative values denote a decrease in
agriculture. Does not count areas that
changed to/from the 'Open Water' class
(code 11) since these were assumed to be
NLCD 2001-2011
Land Cover From to
Change index (2011
Edition; March 2014
version) and RZ Grid
(August 2015
Version). HUC12
Version: NHDPlus
WBD Snapshot,
EnviroAtlas Version
(February 2015
version).
Removed

183
errors. Equation used: (Area Changing to
Agriculture in the RZ – Area Changing
From Agriculture RZ)/(HUC12 Area) *
100. (See also Riparian Zone glossary
definition).
% Cultivated
Crops in WS
(2011)
CROP_CDLNLC
D11_PCT_WS
Percent of the HUC12 classified as
cultivated crop cover by the 2011 CDL-
NLCD Hybrid Land Cover dataset.
Cultivated crop cover classes include
non-pasture agriculture; codes 1 through
35, 38 through 57, 66 through 92, 182,
and 204 through 254 in the 2011 CDL-
NLCD Hybrid Land Cover dataset.
Calculated as cultivated crop area
divided by HUC12 area, multiplied by
100. (See also 2011 CDL-NLCD Hybrid
Land Cover glossary definition).
2011 CDL-NLCD,
EnviroAtlas Version
land cover (July 2015
version). HUC12
Version: NHDPlus
WBD Snapshot,
EnviroAtlas Version
(February 2015
version).
Removed
% Cultivated
Crops in HCZ
(2011)
CROP_CDLNLC
D11_PCT_HZ
Percent of the HUC12 that is in the
Hydrologically Connected Zone and
classified as cultivated crop cover by the
2011 CDL-NLCD Hybrid Land Cover
dataset. Cultivated crop cover classes
include non-pasture agriculture; codes 1
through 35, 38 through 57, 66 through
2011 CDL-NLCD,
EnviroAtlas Version
land cover (July 2015
version) and HCZ
Grid (October 2015
version). HUC12
Version: NHDPlus
Removed

184
92, 182, and 204 through 254; in the
2011 CDL-NLCD Hybrid Land Cover
dataset. Calculated as cultivated crop
area in the Hydrologically Connected
Zone divided by HUC12 area, multiplied
by 100. (See also 2011 CDL-NLCD
Hybrid Land Cover and Hydrologically
Connected Zone glossary definitions).
WBD Snapshot,
EnviroAtlas Version
(February 2015
version).
% Cultivated
Crops in RZ
(2011)
CROP_CDLNLC
D11_PCT_RZ
Percent of the HUC12 that is in the
Riparian Zone and classified as
cultivated crop cover by the 2011 CDL-
NLCD Hybrid Land Cover dataset.
Cultivated crop cover classes include
non-pasture agriculture; codes 1 through
35, 38 through 57, 66 through 92, 182,
and 204 through 254 in the 2011 CDL-
NLCD Hybrid Land Cover dataset.
Calculated as cultivated crop area in the
Riparian Zone divided by HUC12 area,
multiplied by 100. (See also 2011 CDL-
NLCD Hybrid Land Cover and Riparian
Zone glossary definitions).
2011 CDL-NLCD,
EnviroAtlas Version
land cover (July 2015
version) and RZ Grid
(August 2015
Version). HUC12
Version: NHDPlus
WBD Snapshot,
EnviroAtlas Version
(February 2015
version).
Removed
% Pasture/Hay
in WS (2011)
PASTURE_CDL
NLCD11_PCT_
WS
Percent of the HUC12 classified as
pasture cover by the 2011 CDL-NLCD
Hybrid Land Cover dataset. Pasture
cover classes includes any uncropped
agriculture cover; codes 36, 37, 58
through 61, and 181 in the 2011 CDL-
NLCD Hybrid Land Cover dataset.
Calculated as pasture area divided by
HUC12 area, multiplied by 100. (See
2011 CDL-NLCD,
EnviroAtlas Version
land cover (July 2015
version). HUC12
Version: NHDPlus
WBD Snapshot,
EnviroAtlas Version
(February 2015
version).
Removed

185
also 2011 CDL-NLCD Hybrid Land
Cover glossary definition).
% Pasture/Hay
in HCZ (2011)
PASTURE_CDL
NLCD11_PCT_H
Z
Percent of the HUC12 in the
Hydrologically Connected Zone
classified as pasture cover by the 2011
CDL-NLCD Hybrid Land Cover dataset.
Pasture cover classes include any
uncropped agriculture cover; codes 36,
37, 58 through 61, and 181 in the 2011
CDL-NLCD Hybrid Land Cover dataset.
Calculated as pasture area in the
Hydrologically Connected Zone divided
by HUC12 area, multiplied by 100. (See
also 2011 CDL-NLCD Hybrid Land
Cover and Hydrologically Connected
Zone glossary definitions).
2011 CDL-NLCD,
EnviroAtlas Version
land cover (July 2015
version) and HCZ
Grid (October 2015
version). HUC12
Version: NHDPlus
WBD Snapshot,
EnviroAtlas Version
(February 2015
version).
Removed
% Pasture/Hay
in RZ (2011)
PASTURE_CDL
NLCD11_PCT_R
Z
Percent of the HUC12 in the Riparian
Zone classified as pasture cover by the
2011 CDL-NLCD Hybrid Land Cover
dataset. Pasture cover classes include any
uncropped agriculture cover; codes 36,
37, 58 through 61, and 181 in the 2011
CDL-NLCD Hybrid Land Cover dataset.
Calculated as pasture area in the Riparian
Zone divided by HUC12 area, multiplied
by 100. (See also 2011 CDL-NLCD
2011 CDL-NLCD,
EnviroAtlas Version
land cover (July 2015
version) and RZ Grid
(August 2015
Version). HUC12
Version: NHDPlus
WBD Snapshot,
EnviroAtlas Version
(February 2015
version).
Removed

186
Hybrid Land Cover and Riparian Zone
glossary definitions).
Density All
Mining in WS
MINET_DEN Density of all coal mines, coal mining
support activity sites, mineral mines, and
mineral processing plants in the HUC12
(count per square kilometer). Source data
used was the mine location database
described in Daniel et al. 2015
("Characterizing Coal and Mineral Mines
as a Regional Source of Stress to Stream
Fish Assemblages", Ecological
Indicators), acquired via personal
communication with Michigan State
University in January 2015. Calculated
as the number of points in the mine
location database in the HUC12 divided
by HUC12 area.
Mineral and coal mine
locations (points
shapefile) acquired
from Michigan State
University, January
2015. Source data is
described in Daniel et
al. 2015
("Characterizing Coal
and Mineral Mines as
a Regional Source of
Stress to Stream Fish
Assemblages",
Ecological Indicators).
HUC12 Version:
NHDPlus2 WBD
Snapshot, EnviroAtlas
Version (February
2015 version).
None

187
Count All
Mining in WS
MINET_CNT Count of all coal mines, coal mining
support activity sites, mineral mines, and
mineral processing plants in the HUC12.
Source data used was the mine location
database described in Daniel et al. 2015
("Characterizing Coal and Mineral Mines
as a Regional Source of Stress to Stream
Fish Assemblages", Ecological
Indicators), acquired via personal
communication with Michigan State
University in January 2015. Calculated
as the number of points in the mine
location database in the HUC12.
Mineral and coal mine
locations (points
shapefile) acquired
from Michigan State
University, January
2015. Source data is
described in Daniel et
al. 2015
("Characterizing Coal
and Mineral Mines as
a Regional Source of
Stress to Stream Fish
Assemblages",
Ecological Indicators).
HUC12 Version:
NHDPlus2 WBD
Snapshot, EnviroAtlas
Version (February
2015 version).
None
Density All
Coal Mining in
WS
COALT_DEN Density of major and minor coal mines
and associated support activity sites in
the HUC12 (count per square kilometer).
Source data used was the mine location
database described in Daniel et al. 2015
("Characterizing Coal and Mineral Mines
as a Regional Source of Stress to Stream
Fish Assemblages", Ecological
Indicators), acquired via personal
communication with Michigan State
University in January 2015. Calculated
as the number of points classified as
Coal mine locations
(points shapefile)
acquired from
Michigan State
University, January
2015. Source data is
described in Daniel et
al. 2015
("Characterizing Coal
and Mineral Mines as
a Regional Source of
Stress to Stream Fish
None
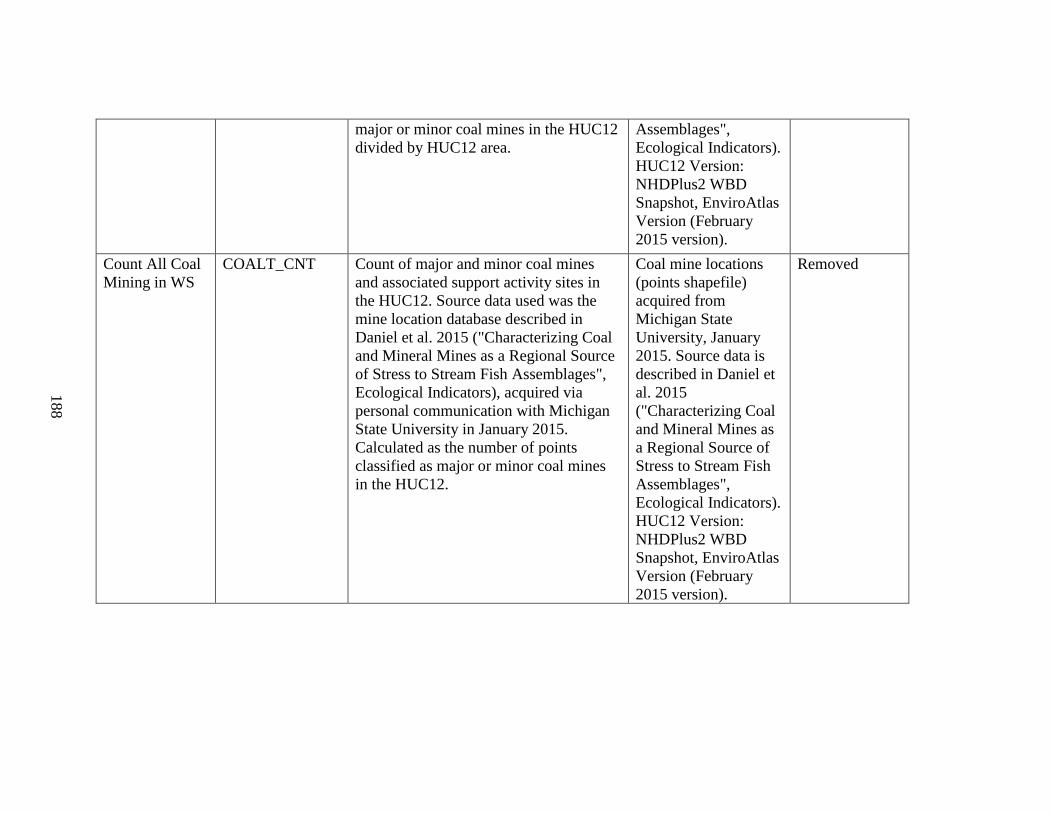
188
major or minor coal mines in the HUC12
divided by HUC12 area.
Assemblages",
Ecological Indicators).
HUC12 Version:
NHDPlus2 WBD
Snapshot, EnviroAtlas
Version (February
2015 version).
Count All Coal
Mining in WS
COALT_CNT Count of major and minor coal mines
and associated support activity sites in
the HUC12. Source data used was the
mine location database described in
Daniel et al. 2015 ("Characterizing Coal
and Mineral Mines as a Regional Source
of Stress to Stream Fish Assemblages",
Ecological Indicators), acquired via
personal communication with Michigan
State University in January 2015.
Calculated as the number of points
classified as major or minor coal mines
in the HUC12.
Coal mine locations
(points shapefile)
acquired from
Michigan State
University, January
2015. Source data is
described in Daniel et
al. 2015
("Characterizing Coal
and Mineral Mines as
a Regional Source of
Stress to Stream Fish
Assemblages",
Ecological Indicators).
HUC12 Version:
NHDPlus2 WBD
Snapshot, EnviroAtlas
Version (February
2015 version).
Removed

189
Density Major
Coal Mining in
WS
COALMJ_DEN Density of major coal mines and
associated support activity sites in the
HUC12 (count per square kilometer).
Source data used was the mine location
database described in Daniel et al. 2015
("Characterizing Coal and Mineral Mines
as a Regional Source of Stress to Stream
Fish Assemblages", Ecological
Indicators), acquired via personal
communication with Michigan State
University in January 2015. Calculated
as the number of points classified as
major coal mines in the HUC12 divided
by HUC12 area.
Coal mine locations
(points shapefile)
acquired from
Michigan State
University, January
2015. Source data is
described in Daniel et
al. 2015
("Characterizing Coal
and Mineral Mines as
a Regional Source of
Stress to Stream Fish
Assemblages",
Ecological Indicators).
HUC12 Version:
NHDPlus2 WBD
Snapshot, EnviroAtlas
Version (February
2015 version).
None
Count Major
Coal Mining in
WS
COALMJ_CNT Count of major coal mines and
associated support activity sites in the
HUC12. Source data used was the mine
location database described in Daniel et
al. 2015 ("Characterizing Coal and
Mineral Mines as a Regional Source of
Stress to Stream Fish Assemblages",
Ecological Indicators), acquired via
personal communication with Michigan
State University in January 2015.
Calculated as the number of points
Coal mine locations
(points shapefile)
acquired from
Michigan State
University, January
2015. Source data is
described in Daniel et
al. 2015
("Characterizing Coal
and Mineral Mines as
a Regional Source of
Stress to Stream Fish
Removed

190
classified as major coal mines in the
HUC12.
Assemblages",
Ecological Indicators).
HUC12 Version:
NHDPlus2 WBD
Snapshot, EnviroAtlas
Version (February
2015 version).
Density Minor
Coal Mining in
WS
COALMN_DEN Density of minor coal mines and
associated support activity sites in the
HUC12 (count per square kilometer).
Source data used was the mine location
database described in Daniel et al. 2015
("Characterizing Coal and Mineral Mines
as a Regional Source of Stress to Stream
Fish Assemblages", Ecological
Indicators), acquired via personal
communication with Michigan State
University in January 2015. Calculated
as the number of points classified as
minor coal mines in the HUC12 divided
by HUC12 area.
Coal mine locations
(points shapefile)
acquired from
Michigan State
University, January
2015. Source data is
described in Daniel et
al. 2015
("Characterizing Coal
and Mineral Mines as
a Regional Source of
Stress to Stream Fish
Assemblages",
Ecological Indicators).
HUC12 Version:
NHDPlus2 WBD
Snapshot, EnviroAtlas
Version (February
2015 version).
None

191
Count Minor
Coal Mining in
WS
COALMN_CNT Count of minor coal mines and
associated support activity sites in the
HUC12. Source data used was the mine
location database described in Daniel et
al. 2015 ("Characterizing Coal and
Mineral Mines as a Regional Source of
Stress to Stream Fish Assemblages",
Ecological Indicators), acquired via
personal communication with Michigan
State University in January 2015.
Calculated as the number of points
classified as minor coal mines in the
HUC12.
Coal mine locations
(points shapefile)
acquired from
Michigan State
University, January
2015. Source data is
described in Daniel et
al. 2015
("Characterizing Coal
and Mineral Mines as
a Regional Source of
Stress to Stream Fish
Assemblages",
Ecological Indicators).
HUC12 Version:
NHDPlus2 WBD
Snapshot, EnviroAtlas
Version (February
2015 version).
Removed
Density Mineral
Mining in WS
MNERAL_DEN Density of mineral mine sites and
mineral processing plants in the HUC12
(count per square kilometer). Source data
used was the mine location database
described in Daniel et al. 2015
("Characterizing Coal and Mineral Mines
as a Regional Source of Stress to Stream
Fish Assemblages", Ecological
Indicators), acquired via personal
communication with Michigan State
University in January 2015. Calculated
as the number of points classified as
Mineral mine
locations (points
shapefile) acquired
from Michigan State
University, January
2015. Source data is
described in Daniel et
al. 2015
("Characterizing Coal
and Mineral Mines as
a Regional Source of
Stress to Stream Fish
None

192
mineral mines and mineral processing
plants in the HUC12 divided by HUC12
area.
Assemblages",
Ecological Indicators).
HUC12 Version:
NHDPlus2 WBD
Snapshot, EnviroAtlas
Version (February
2015 version).
Count Mineral
Mining in WS
MNERAL_CNT Count of mineral mine sites and mineral
processing plants in the HUC12. Source
data used was the mine location database
described in Daniel et al. 2015
("Characterizing Coal and Mineral Mines
as a Regional Source of Stress to Stream
Fish Assemblages", Ecological
Indicators), acquired via personal
communication with Michigan State
University in January 2015. Calculated
as the number of points classified as
mineral mines in the HUC12.
Mineral mine
locations (points
shapefile) acquired
from Michigan State
University, January
2015. Source data is
described in Daniel et
al. 2015
("Characterizing Coal
and Mineral Mines as
a Regional Source of
Stress to Stream Fish
Assemblages",
Ecological Indicators).
HUC12 Version:
NHDPlus2 WBD
Snapshot, EnviroAtlas
Version (February
2015 version).
Removed

193
Density All
Roads in WS
(2015)
ROADS_ALL_D
ENSITY_2014_
WS
Density of all roads in the HUC12
(kilometer per square kilometer). Source
data used was the 2015 TIGER Roads
National Geodatabase from the US
Census Bureau
(https://www.census.gov/geo/maps-
data/data/tiger-geodatabases.html;
downloaded March 2016). Linear road
features in the geodatabase were
converted to a 10 meter resolution grid
and road length was calculated as the
area of road grid pixels in the HUC12
divided by pixel length. Road density
was calculated as: Road Length / HUC12
Area. Includes roads with MTFCC code
equal to S1100 (primary road), S1200
(secondary road), S1400 (local road),
S1500 (vehicular trail), S1630 (ramp),
S1640 (service drive), S1730 (alley),
S1740 (private road), or S1780 (parking
lot road) in the 2015 TIGER Roads
National Geodatabase. Features with
MTFCC code equal to S1710 (walkway),
S1720 (stairway), S1820 (bike path),
S1830 (bridle path), and S2000 (unpaved
median) were classified as non-road
features and not counted.
US Census Bureau
TIGER Roads
National Geodatabase
(2015 version).
HUC12 Version:
NHDPlus2 WBD
Snapshot, EnviroAtlas
Version (February
2015 version).
Removed

194
Density Roads
& Rails in WS
(2015)
ROADS_RAILS_
DENSITY_2014_
WS
Density of all roads and railroads in the
HUC12 (kilometer per square kilometer).
Source data used was the 2015 TIGER
Roads National Geodatabase and the
2015 TIGER Rails National Geodatabase
from the US Census Bureau
(https://www.census.gov/geo/maps-
data/data/tiger-geodatabases.html;
downloaded March 2016). Linear
road/rail features in each geodatabase
were converted to a 10 meter resolution
grid and road/rail length was calculated
as the area of road/rail grid pixels in the
HUC12 divided by pixel length. Road
and railroad density was calculated as:
(Road Length + Railroad Length) /
HUC12 Area. Includes roads with
MTFCC code equal to S1100 (primary
road), S1200 (secondary road), S1400
(local road), S1500 (vehicular trail),
S1630 (ramp), S1640 (service drive),
S1730 (alley), S1740 (private road), or
S1780 (parking lot road) in the 2015
TIGER Roads National Geodatabase.
Features with MTFCC code equal to
S1710 (walkway), S1720 (stairway),
S1820 (bike path), S1830 (bridle path),
and S2000 (unpaved median) were
classified as non-road features and not
counted. All features in the 2015 TIGER
US Census Bureau
TIGER Roads
National Geodatabase
(2015 version);
TIGER Rails National
Geodatabase (2015
version). HUC12
Version: NHDPlus2
WBD Snapshot,
EnviroAtlas Version
(February 2015
version).
Removed

195
Rails National Geodatabase are counted
in railroad length.
Density All
Roads in RZ
(2015)
ROADS_ALL_D
ENSITY_2014_R
Z
Density of all roads in the Riparian Zone
(RZ) of the HUC12 (kilometer per square
kilometer). Source data used was the
2015 TIGER Roads National
Geodatabase from the US Census Bureau
(https://www.census.gov/geo/maps-
data/data/tiger-geodatabases.html;
downloaded March 2016). Linear road
features in the geodatabase were
converted to a 10 meter resolution grid
and road length was calculated as the
area of road grid pixels in the RZ divided
by pixel length. Road density in the RZ
was calculated as: Road Length in RZ /
RZ Area. Includes roads with MTFCC
US Census Bureau
TIGER Roads
National Geodatabase
(2015 version).
HUC12 Version:
NHDPlus2 WBD
Snapshot, EnviroAtlas
Version (February
2015 version).
Removed

196
code equal to S1100 (primary road),
S1200 (secondary road), S1400 (local
road), S1500 (vehicular trail), S1630
(ramp), S1640 (service drive), S1730
(alley), S1740 (private road), or S1780
(parking lot road) in the 2015 TIGER
Roads National Geodatabase. Features
with MTFCC code equal to S1710
(walkway), S1720 (stairway), S1820
(bike path), S1830 (bridle path), and
S2000 (unpaved median) were classified
as non-road features and not counted.
(See also Riparian Zone glossary
definition).

197
Density Roads
& Rails in RZ
(2015)
ROADS_RAILS_
DENSITY_2014_
RZ
Density of all roads and railroads in the
Riparian Zone of the HUC12 (kilometer
per square kilometer). Source data used
was the 2015 TIGER Roads National
Geodatabase and the 2015 TIGER Rails
National Geodatabase from the US
Census Bureau
(https://www.census.gov/geo/maps-
data/data/tiger-geodatabases.html;
downloaded March 2016). Linear
road/rail features in each geodatabase
were converted to a 10 meter resolution
grid and road/rail length was calculated
as the area of road/rail grid pixels in the
RZ divided by pixel length. Road and
railroad density in the RZ was calculated
as: (Road Length in RZ + Railroad
Length in RZ) / RZ Area. Includes roads
with MTFCC code equal to S1100
(primary road), S1200 (secondary road),
S1400 (local road), S1500 (vehicular
trail), S1630 (ramp), S1640 (service
drive), S1730 (alley), S1740 (private
road), or S1780 (parking lot road) in the
2015 TIGER Roads National
Geodatabase. Features with MTFCC
code equal to S1710 (walkway), S1720
(stairway), S1820 (bike path), S1830
(bridle path), and S2000 (unpaved
median) were classified as non-road
features and not counted. All features in
US Census Bureau
TIGER Roads
National Geodatabase
(2015 version);
TIGER Rails National
Geodatabase (2015
version). HUC12
Version: NHDPlus2
WBD Snapshot,
EnviroAtlas Version
(February 2015
version).
Removed

198
the 2015 TIGER Rails National
Geodatabase are counted in railroad
length. (See also Riparian Zone glossary
definition).
Length Primary
Roads in WS
(2015)
ROADS_PRIMA
RY_LENGTH_20
14_WS
Length of primary roads in the HUC12
(kilometers). Primary roads are divided
highways within the interstate highway
system or under state management, and
are distinguished by the presence of
interchanges and ramps for entrance/exit.
Source data used was the 2015 TIGER
Roads National Geodatabase from the
US Census Bureau
(https://www.census.gov/geo/maps-
data/data/tiger-geodatabases.html;
downloaded March 2016). Linear road
features in the geodatabase were
converted to a 10 meter resolution grid
US Census Bureau
TIGER Roads
National Geodatabase
(2015 version).
HUC12 Version:
NHDPlus2 WBD
Snapshot, EnviroAtlas
Version (February
2015 version).
Removed

199
and road length was calculated as the
area of primary road grid pixels in the
HUC12 divided by pixel length. Primary
roads have MTFCC code equal to S1100
in the 2015 TIGER Roads National
Geodatabase.
Density
Primary Roads
in WS (2015)
ROADS_PRIMA
RY_DENSITY_2
014_WS
Density of primary roads in the HUC12
(kilometer per square kilometer).
Primary roads are divided highways
within the interstate highway system or
under state management, and are
distinguished by the presence of
interchanges and ramps for entrance/exit.
Source data used was the 2015 TIGER
Roads National Geodatabase from the
US Census Bureau
(https://www.census.gov/geo/maps-
data/data/tiger-geodatabases.html;
downloaded March 2016). Linear road
features in the geodatabase were
converted to a 10 meter resolution grid
and road length was calculated as the
area of primary road grid pixels in the
HUC12 divided by pixel length. Primary
road density was calculated as: Primary
Road Length / HUC12 Area. Primary
roads have MTFCC code equal to S1100
US Census Bureau
TIGER Roads
National Geodatabase
(2015 version).
HUC12 Version:
NHDPlus2 WBD
Snapshot, EnviroAtlas
Version (February
2015 version).
Removed

200
in the 2015 TIGER Roads National
Geodatabase.
Length
Secondary
Roads in WS
(2015)
ROADS_2NDAR
Y_LENGTH_201
4_WS
Length of secondary roads in the HUC12
(kilometers). Secondary roads are main
arteries with one or more lanes of traffic
in each direction that may be divided,
usually have intersections with many
other roads and driveways, and are
usually in the U.S. Highway, State
Highway or County Highway system.
Source data used was the 2015 TIGER
Roads National Geodatabase from the
US Census Bureau
(https://www.census.gov/geo/maps-
data/data/tiger-geodatabases.html;
downloaded March 2016). Linear road
features in the geodatabase were
converted to a 10 meter resolution grid
and road length was calculated as the
area of secondary road grid pixels in the
HUC12 divided by pixel length.
US Census Bureau
TIGER Roads
National Geodatabase
(2015 version).
HUC12 Version:
NHDPlus2 WBD
Snapshot, EnviroAtlas
Version (February
2015 version).
Removed

201
Secondary roads have MTFCC code
equal to S1200 in the 2015 TIGER
Roads National Geodatabase.
Density
Secondary
Roads in WS
(2015)
ROADS_2NDAR
Y_DENSITY_20
14_WS
Density of secondary roads in the
HUC12 (kilometer per square kilometer).
Secondary roads are main arteries with
one or more lanes of traffic in each
direction that may be divided, usually
have intersections with many other roads
and driveways, and are usually in the
U.S. Highway, State Highway or County
Highway system. Source data used was
the 2015 TIGER Roads National
Geodatabase from the US Census Bureau
(https://www.census.gov/geo/maps-
data/data/tiger-geodatabases.html;
downloaded March 2016). Linear road
features in the geodatabase were
converted to a 10 meter resolution grid
and road length was calculated as the
area of secondary road grid pixels in the
HUC12 divided by pixel length.
Secondary road density was calculated
US Census Bureau
TIGER Roads
National Geodatabase
(2015 version).
HUC12 Version:
NHDPlus2 WBD
Snapshot, EnviroAtlas
Version (February
2015 version).
Removed

202
as: Secondary Road Length / HUC12
Area. Secondary roads have MTFCC
code equal to S1200 in the 2015 TIGER
Roads National Geodatabase.
Length Local
Roads in WS
(2015)
ROADS_LOCAL
_LENGTH_2014
_WS
Length of local roads in the HUC12
(kilometers). Local roads are a paved
non-arterial street, road, or byway that
usually has a single lane of traffic in each
direction and may be privately or
publicly maintained. Source data used
was the 2015 TIGER Roads National
Geodatabase from the US Census Bureau
(https://www.census.gov/geo/maps-
data/data/tiger-geodatabases.html;
downloaded March 2016). Linear road
features in the geodatabase were
converted to a 10 meter resolution grid
and road length was calculated as the
area of local road grid pixels in the
HUC12 divided by pixel length. Local
roads have MTFCC code equal to S1400
US Census Bureau
TIGER Roads
National Geodatabase
(2015 version).
HUC12 Version:
NHDPlus2 WBD
Snapshot, EnviroAtlas
Version (February
2015 version).
Removed

203
in the 2015 TIGER Roads National
Geodatabase.
Density Local
Roads in WS
(2015)
ROADS_LOCAL
_DENSITY_2014
_WS
Density of local roads in the HUC12
(kilometer per square kilometer). Local
roads are a paved non-arterial street,
road, or byway that usually has a single
lane of traffic in each direction and may
be privately or publicly maintained.
Source data used was the 2015 TIGER
Roads National Geodatabase from the
US Census Bureau
(https://www.census.gov/geo/maps-
data/data/tiger-geodatabases.html;
downloaded March 2016). Linear road
features in the geodatabase were
converted to a 10 meter resolution grid
and road length was calculated as the
area of local road grid pixels in the
HUC12 divided by pixel length. Local
road density was calculated as: Local
Road Length / HUC12 Area. Local roads
have MTFCC code equal to S1400 in the
US Census Bureau
TIGER Roads
National Geodatabase
(2015 version).
HUC12 Version:
NHDPlus2 WBD
Snapshot, EnviroAtlas
Version (February
2015 version).
Removed

204
2015 TIGER Roads National
Geodatabase.
Length Minor
Roads/Trails in
WS (2015)
ROADS_MINOR
_LENGTH_2014
_WS
Length of minor roads in the HUC12
(kilometers). Minor roads include
unpaved dirt trails for four-wheel drive
vehicles, access ramps to highways,
service roads along highways, alleys,
private roads, and parking lot roads.
Source data used was the 2015 TIGER
Roads National Geodatabase from the
US Census Bureau
(https://www.census.gov/geo/maps-
data/data/tiger-geodatabases.html;
downloaded March 2016). Linear road
features in the geodatabase were
converted to a 10 meter resolution grid
and road length was calculated as the
area of minor road grid pixels in the
HUC12 divided by pixel length. Minor
roads have MTFCC code equal to S1500,
S1630, S1640, S1730, S1740, or S1780
US Census Bureau
TIGER Roads
National Geodatabase
(2015 version).
HUC12 Version:
NHDPlus2 WBD
Snapshot, EnviroAtlas
Version (February
2015 version).
Removed
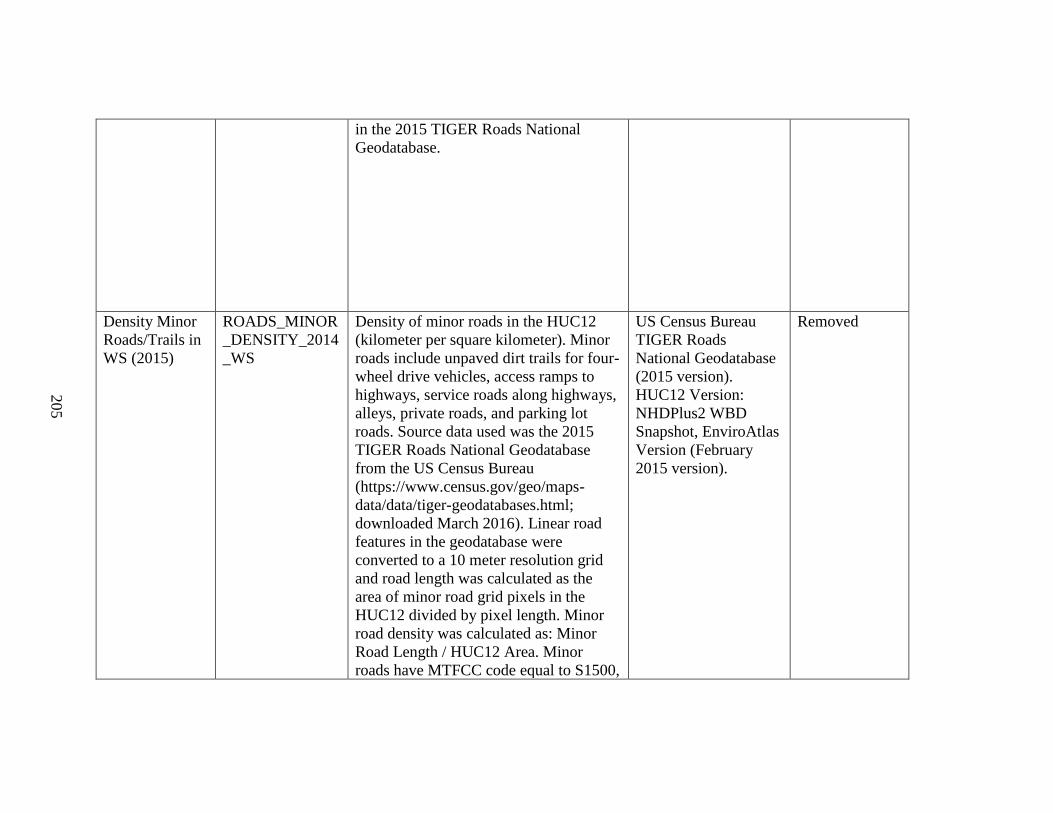
205
in the 2015 TIGER Roads National
Geodatabase.
Density Minor
Roads/Trails in
WS (2015)
ROADS_MINOR
_DENSITY_2014
_WS
Density of minor roads in the HUC12
(kilometer per square kilometer). Minor
roads include unpaved dirt trails for four-
wheel drive vehicles, access ramps to
highways, service roads along highways,
alleys, private roads, and parking lot
roads. Source data used was the 2015
TIGER Roads National Geodatabase
from the US Census Bureau
(https://www.census.gov/geo/maps-
data/data/tiger-geodatabases.html;
downloaded March 2016). Linear road
features in the geodatabase were
converted to a 10 meter resolution grid
and road length was calculated as the
area of minor road grid pixels in the
HUC12 divided by pixel length. Minor
road density was calculated as: Minor
Road Length / HUC12 Area. Minor
roads have MTFCC code equal to S1500,
US Census Bureau
TIGER Roads
National Geodatabase
(2015 version).
HUC12 Version:
NHDPlus2 WBD
Snapshot, EnviroAtlas
Version (February
2015 version).
Removed

206
S1630, S1640, S1730, S1740, or S1780
in the 2015 TIGER Roads National
Geodatabase.
Length All
Roads in WS
(2015)
ROADS_ALL_L
ENGTH_2014_W
S
Length of all roads in the HUC12
(kilometers). Source data used was the
2015 TIGER Roads National
Geodatabase from the US Census Bureau
(https://www.census.gov/geo/maps-
data/data/tiger-geodatabases.html;
downloaded March 2016). Linear road
features in the geodatabase were
converted to a 10 meter resolution grid
and road length was calculated as the
area of road grid pixels in the HUC12
divided by pixel length. Includes roads
with MTFCC code equal to S1100
(primary road), S1200 (secondary road),
S1400 (local road), S1500 (vehicular
trail), S1630 (ramp), S1640 (service
drive), S1730 (alley), S1740 (private
road), or S1780 (parking lot road) in the
2015 TIGER Roads National
US Census Bureau
TIGER Roads
National Geodatabase
(2015 version).
HUC12 Version:
NHDPlus2 WBD
Snapshot, EnviroAtlas
Version (February
2015 version).
Removed

207
Geodatabase. Features with MTFCC
code equal to S1710 (walkway), S1720
(stairway), S1820 (bike path), S1830
(bridle path), and S2000 (unpaved
median) were classified as non-road
features and not counted.
Length
Railroads in
WS (2014)
RAILS_LENGTH
_2014_WS
Length of railroads in the HUC12
(kilometers). Source data used was the
2015 TIGER Rails National Geodatabase
from the US Census Bureau
(https://www.census.gov/geo/maps-
data/data/tiger-geodatabases.html;
downloaded March 2016). Linear rail
features in the geodatabase were
converted to a 10 meter resolution grid
and rail length was calculated as the area
of rail grid pixels in the HUC12 divided
by pixel length. All features in the 2015
TIGER Rails National Geodatabase are
counted in railroad length.
US Census Bureau
TIGER Rails National
Geodatabase (2015
version). HUC12
Version: NHDPlus2
WBD Snapshot,
EnviroAtlas Version
(February 2015
version).
Removed

208
Density
Railroads in
WS (2014)
RAILS_DENSIT
Y_2014_WS
Density of railroads in the HUC12
(kilometer per square kilometer). Source
data used was the 2015 TIGER Rails
National Geodatabase from the US
Census Bureau
(https://www.census.gov/geo/maps-
data/data/tiger-geodatabases.html;
downloaded March 2016). Linear rail
features in the geodatabase were
converted to a 10 meter resolution grid
and rail length was calculated as the area
of rail grid pixels in the HUC12 divided
by pixel length. Railroad density was
calculated as: Railroad Length / HUC12
Area. All features in the 2015 TIGER
Rails National Geodatabase are counted
in railroad length.
US Census Bureau
TIGER Rails National
Geodatabase (2015
version). HUC12
Version: NHDPlus2
WBD Snapshot,
EnviroAtlas Version
(February 2015
version).
Removed

209
Length Roads
& Rails in WS
(2015)
ROADS_RAILS_
LENGTH_2014_
WS
Length of all roads and railroads in the
HUC12 (kilometers). Source data used
was the 2015 TIGER Roads National
Geodatabase and the 2015 TIGER Rails
National Geodatabase from the US
Census Bureau
(https://www.census.gov/geo/maps-
data/data/tiger-geodatabases.html;
downloaded March 2016). Linear
road/rail features in each geodatabase
were converted to a 10 meter resolution
grid and road/rail length was calculated
as the area of road/rail grid pixels in the
HUC12 divided by pixel length. Includes
roads with MTFCC code equal to S1100
(primary road), S1200 (secondary road),
S1400 (local road), S1500 (vehicular
trail), S1630 (ramp), S1640 (service
drive), S1730 (alley), S1740 (private
road), or S1780 (parking lot road) in the
2015 TIGER Roads National
Geodatabase. Features with MTFCC
code equal to S1710 (walkway), S1720
(stairway), S1820 (bike path), S1830
(bridle path), and S2000 (unpaved
median) were classified as non-road
features and not counted. All features in
the 2015 TIGER Rails National
Geodatabase are counted in railroad
length.
US Census Bureau
TIGER Roads
National Geodatabase
(2015 version);
TIGER Rails National
Geodatabase (2015
version). HUC12
Version: NHDPlus2
WBD Snapshot,
EnviroAtlas Version
(February 2015
version).
Removed

210
Length Primary
Roads in RZ
(2015)
ROADS_PRIMA
RY_LENGTH_20
14_RZ
Length of primary roads in the Riparian
Zone (RZ) of the HUC12 (kilometers).
Primary roads are divided highways
within the interstate highway system or
under state management, and are
distinguished by the presence of
interchanges and ramps for entrance/exit.
Source data used was the 2015 TIGER
Roads National Geodatabase from the
US Census Bureau
(https://www.census.gov/geo/maps-
data/data/tiger-geodatabases.html;
downloaded March 2016). Linear road
features in the geodatabase were
converted to a 10 meter resolution grid
and road length was calculated as the
area of primary road grid pixels in the
RZ divided by pixel length. Primary
roads have MTFCC code equal to S1100
in the 2015 TIGER Roads National
Geodatabase. (See also Riparian Zone
glossary definition).
US Census Bureau
TIGER Roads
National Geodatabase
(2015 version).
HUC12 Version:
NHDPlus2 WBD
Snapshot, EnviroAtlas
Version (February
2015 version).
Removed
211
Density
Primary Roads
in RZ (2015)
ROADS_PRIMA
RY_DENSITY_2
014_RZ
Density of primary roads in the Riparian
Zone (RZ) of the HUC12 (kilometer per
square kilometer). Primary roads are
divided highways within the interstate
highway system or under state
management, and are distinguished by
the presence of interchanges and ramps
for entrance/exit. Source data used was
the 2015 TIGER Roads National
Geodatabase from the US Census Bureau
(https://www.census.gov/geo/maps-
data/data/tiger-geodatabases.html;
downloaded March 2016). Linear road
features in the geodatabase were
converted to a 10 meter resolution grid
and road length was calculated as the
area of primary road grid pixels in the
RZ divided by pixel length. Primary road
density in the RZ was calculated as:
Primary Road Length in RZ / RZ Area.
Primary roads have MTFCC code equal
to S1100 in the 2015 TIGER Roads
National Geodatabase. (See also Riparian
Zone glossary definition).
US Census Bureau
TIGER Roads
National Geodatabase
(2015 version).
HUC12 Version:
NHDPlus2 WBD
Snapshot, EnviroAtlas
Version (February
2015 version).
Removed

212
Length
Secondary
Roads in RZ
(2015)
ROADS_2NDAR
Y_LENGTH_201
4_RZ
Length of secondary roads in the
Riparian Zone (RZ) of the HUC12
(kilometers). Secondary roads are main
arteries with one or more lanes of traffic
in each direction that may be divided,
usually have intersections with many
other roads and driveways, and are
usually in the U.S. Highway, State
Highway or County Highway system.
Source data used was the 2015 TIGER
Roads National Geodatabase from the
US Census Bureau
(https://www.census.gov/geo/maps-
data/data/tiger-geodatabases.html;
downloaded March 2016). Linear road
features in the geodatabase were
converted to a 10 meter resolution grid
and road length was calculated as the
area of secondary road grid pixels in the
RZ divided by pixel length. Secondary
roads have MTFCC code equal to S1200
in the 2015 TIGER Roads National
Geodatabase. (See also Riparian Zone
glossary definition).
US Census Bureau
TIGER Roads
National Geodatabase
(2015 version).
HUC12 Version:
NHDPlus2 WBD
Snapshot, EnviroAtlas
Version (February
2015 version).
Removed

213
Density
Secondary
Roads in RZ
(2015)
ROADS_2NDAR
Y_DENSITY_20
14_RZ
Density of secondary roads in the
Riparian Zone (RZ) of the HUC12
(kilometer per square kilometer).
Secondary roads are main arteries with
one or more lanes of traffic in each
direction that may be divided, usually
have intersections with many other roads
and driveways, and are usually in the
U.S. Highway, State Highway or County
Highway system. Source data used was
the 2015 TIGER Roads National
Geodatabase from the US Census Bureau
(https://www.census.gov/geo/maps-
data/data/tiger-geodatabases.html;
downloaded March 2016). Linear road
features in the geodatabase were
converted to a 10 meter resolution grid
and road length was calculated as the
area of secondary road grid pixels in the
RZ divided by pixel length. Secondary
road density in the RZ was calculated as:
Secondary Road Length in RZ / RZ
Area. Secondary roads have MTFCC
code equal to S1200 in the 2015 TIGER
Roads National Geodatabase. (See also
Riparian Zone glossary definition).
US Census Bureau
TIGER Roads
National Geodatabase
(2015 version).
HUC12 Version:
NHDPlus2 WBD
Snapshot, EnviroAtlas
Version (February
2015 version).
Removed

214
Length Local
Roads in RZ
(2015)
ROADS_LOCAL
_LENGTH_2014
_RZ
Length of local roads in Riparian Zone
(RZ) of the HUC12 (kilometers). Local
roads are a paved non-arterial street,
road, or byway that usually has a single
lane of traffic in each direction and may
be privately or publicly maintained.
Source data used was the 2015 TIGER
Roads National Geodatabase from the
US Census Bureau
(https://www.census.gov/geo/maps-
data/data/tiger-geodatabases.html;
downloaded March 2016). Linear road
features in the geodatabase were
converted to a 10 meter resolution grid
and road length was calculated as the
area of local road grid pixels in the RZ
divided by pixel length. Local roads have
MTFCC code equal to S1400 in the 2015
TIGER Roads National Geodatabase.
(See also Riparian Zone glossary
definition).
US Census Bureau
TIGER Roads
National Geodatabase
(2015 version).
HUC12 Version:
NHDPlus2 WBD
Snapshot, EnviroAtlas
Version (February
2015 version).
Removed

215
Density Local
Roads in RZ
(2015)
ROADS_LOCAL
_DENSITY_2014
_RZ
Density of local roads in the Riparian
Zone (RZ) of the HUC12 (kilometer per
square kilometer). Local roads are a
paved non-arterial street, road, or byway
that usually has a single lane of traffic in
each direction and may be privately or
publicly maintained. Source data used
was the 2015 TIGER Roads National
Geodatabase from the US Census Bureau
(https://www.census.gov/geo/maps-
data/data/tiger-geodatabases.html;
downloaded March 2016). Linear road
features in the geodatabase were
converted to a 10 meter resolution grid
and road length was calculated as the
area of local road grid pixels in the RZ
divided by pixel length. Local road
density in the RZ was calculated as:
Local Road Length in RZ / RZ Area.
Local roads have MTFCC code equal to
S1400 in the 2015 TIGER Roads
National Geodatabase. (See also Riparian
Zone glossary definition).
US Census Bureau
TIGER Roads
National Geodatabase
(2015 version).
HUC12 Version:
NHDPlus2 WBD
Snapshot, EnviroAtlas
Version (February
2015 version).
Removed

216
Length Minor
Roads/Trails in
RZ (2015)
ROADS_MINOR
_LENGTH_2014
_RZ
Length of minor roads in the Riparian
Zone (RZ) of the HUC12 (kilometers).
Minor roads include unpaved dirt trails
for four-wheel drive vehicles, access
ramps to highways, service roads along
highways, alleys, private roads, and
parking lot roads. Source data used was
the 2015 TIGER Roads National
Geodatabase from the US Census Bureau
(https://www.census.gov/geo/maps-
data/data/tiger-geodatabases.html;
downloaded March 2016). Linear road
features in the geodatabase were
converted to a 10 meter resolution grid
and road length was calculated as the
area of minor road grid pixels in the RZ
divided by pixel length. Minor roads
have MTFCC code equal to S1500,
S1630, S1640, S1730, S1740, or S1780
in the 2015 TIGER Roads National
Geodatabase. (See also Riparian Zone
glossary definition).
US Census Bureau
TIGER Roads
National Geodatabase
(2015 version).
HUC12 Version:
NHDPlus2 WBD
Snapshot, EnviroAtlas
Version (February
2015 version).
Removed

217
Density Minor
Roads/Trails in
RZ (2015)
ROADS_MINOR
_DENSITY_2014
_RZ
Density of minor roads in the Riparian
Zone (RZ) of the HUC12 (kilometer per
square kilometer). Minor roads include
unpaved dirt trails for four-wheel drive
vehicles, access ramps to highways,
service roads along highways, alleys,
private roads, and parking lot roads.
Source data used was the 2015 TIGER
Roads National Geodatabase from the
US Census Bureau
(https://www.census.gov/geo/maps-
data/data/tiger-geodatabases.html;
downloaded March 2016). Linear road
features in the geodatabase were
converted to a 10 meter resolution grid
and road length was calculated as the
area of minor road grid pixels in the RZ
divided by pixel length. Minor road
density in the RZ was calculated as:
Minor Road Length in RZ / RZ Area.
Minor roads have MTFCC code equal to
S1500, S1630, S1640, S1730, S1740, or
S1780 in the 2015 TIGER Roads
National Geodatabase. (See also Riparian
Zone glossary definition).
US Census Bureau
TIGER Roads
National Geodatabase
(2015 version).
HUC12 Version:
NHDPlus2 WBD
Snapshot, EnviroAtlas
Version (February
2015 version).
Removed

218
Length All
Roads in RZ
(2015)
ROADS_ALL_L
ENGTH_2014_R
Z
Length of all roads in the Riparian Zone
(RZ) of the HUC12 (kilometers). Source
data used was the 2015 TIGER Roads
National Geodatabase from the US
Census Bureau
(https://www.census.gov/geo/maps-
data/data/tiger-geodatabases.html;
downloaded March 2016). Linear road
features in the geodatabase were
converted to a 10 meter resolution grid
and road length was calculated as the
area of road grid pixels in the RZ divided
by pixel length. Includes roads with
MTFCC code equal to S1100 (primary
road), S1200 (secondary road), S1400
(local road), S1500 (vehicular trail),
S1630 (ramp), S1640 (service drive),
S1730 (alley), S1740 (private road), or
S1780 (parking lot road) in the 2015
TIGER Roads National Geodatabase.
Features with MTFCC code equal to
S1710 (walkway), S1720 (stairway),
S1820 (bike path), S1830 (bridle path),
and S2000 (unpaved median) were
classified as non-road features and not
counted. (See also Riparian Zone
glossary definition).
US Census Bureau
TIGER Roads
National Geodatabase
(2015 version).
HUC12 Version:
NHDPlus2 WBD
Snapshot, EnviroAtlas
Version (February
2015 version).
Removed

219
Length
Railroads in RZ
(2014)
RAILS_LENGTH
_2014_RZ
Length of railroads in the Riparian Zone
(RZ) of the HUC12 (kilometers). Source
data used was the 2015 TIGER Rails
National Geodatabase from the US
Census Bureau
(https://www.census.gov/geo/maps-
data/data/tiger-geodatabases.html;
downloaded March 2016). Linear rail
features in the geodatabase were
converted to a 10 meter resolution grid
and rail length was calculated as the area
of rail grid pixels in the RZ divided by
pixel length. All features in the 2015
TIGER Rails National Geodatabase are
counted in railroad length. (See also
Riparian Zone glossary definition).
US Census Bureau
TIGER Rails National
Geodatabase (2015
version). HUC12
Version: NHDPlus2
WBD Snapshot,
EnviroAtlas Version
(February 2015
version).
Removed
Density
Railroads in RZ
(2014)
RAILS_DENSIT
Y_2014_RZ
Density of railroads in the Riparian Zone
(RZ) of the HUC12 (kilometer per square
kilometer). Source data used was the
2015 TIGER Rails National Geodatabase
from the US Census Bureau
(https://www.census.gov/geo/maps-
data/data/tiger-geodatabases.html;
downloaded March 2016). Linear rail
features in the geodatabase were
converted to a 10 meter resolution grid
and rail length was calculated as the area
of rail grid pixels in the HUC12 divided
by pixel length. Railroad density in the
RZ was calculated as: Railroad Length in
RZ / HUC12 Area. All features in the
US Census Bureau
TIGER Rails National
Geodatabase (2015
version). HUC12
Version: NHDPlus2
WBD Snapshot,
EnviroAtlas Version
(February 2015
version).
Removed
220
2015 TIGER Rails National Geodatabase
are counted in railroad length. (See also
Riparian Zone glossary definition).
Length Roads
& Rails in RZ
(2015)
ROADS_RAILS_
LENGTH_2014_
RZ
Length of all roads and railroads in the
Riparian Zone (RZ) of the HUC12
(kilometers). Source data used was the
2015 TIGER Roads National
Geodatabase and the 2015 TIGER Rails
National Geodatabase from the US
Census Bureau
(https://www.census.gov/geo/maps-
data/data/tiger-geodatabases.html;
downloaded March 2016). Linear
road/rail features in each geodatabase
were converted to a 10 meter resolution
grid and road/rail length was calculated
as the area of road/rail grid pixels in the
RZ divided by pixel length. Includes
roads with MTFCC code equal to S1100
(primary road), S1200 (secondary road),
S1400 (local road), S1500 (vehicular
trail), S1630 (ramp), S1640 (service
drive), S1730 (alley), S1740 (private
road), or S1780 (parking lot road) in the
US Census Bureau
TIGER Roads
National Geodatabase
(2015 version);
TIGER Rails National
Geodatabase (2015
version). HUC12
Version: NHDPlus2
WBD Snapshot,
EnviroAtlas Version
(February 2015
version).
Removed

221
2015 TIGER Roads National
Geodatabase. Features with MTFCC
code equal to S1710 (walkway), S1720
(stairway), S1820 (bike path), S1830
(bridle path), and S2000 (unpaved
median) were classified as non-road
features and not counted. All features in
the 2015 TIGER Rails National
Geodatabase are counted in railroad
length. (See also Riparian Zone glossary
definition).
Count Road-
Stream
Crossings
(2015)
ROAD_2015_ST
RM_X_SO_ALL
_CNT_WS
Number of road-stream crossings in the
HUC12. Source data were the US Census
Bureau TIGER Roads National
Geodatabase (2015 version) and the
NHDPlus2 CatSeed grid (downloaded
October 2012; http://www.horizon-
systems.com/NHDPlus/NHDPlusV2_dat
a.php).
US Census Bureau
TIGER Roads
National Geodatabase
(2015 version);
NHDPlus2 Catseed
Grid
Removed
Density Road-
Stream
Crossing in WS
(2015)
ROAD_2015_ST
RM_X_DENS_W
S
Density of road-stream crossings in the
HUC12 (number of crossings per square
kilometer). Source data were the US
Census Bureau TIGER Roads National
Geodatabase (2015 version) and the
NHDPlus2 CatSeed grid (downloaded
October 2012; http://www.horizon-
US Census Bureau
TIGER Roads
National Geodatabase
(2015 version);
NHDPlus2 Catseed
Grid
Removed

222
systems.com/NHDPlus/NHDPlusV2_dat
a.php). Equation used: Number of Road-
Stream Crossings / HUC12 Area.
Count Road-
Stream
Crossings, 1st
Order (2015)
ROAD_2015_ST
REAM_X_SO_1_
CNT_WS
Number of road-stream crossings over
1st order streams in the HUC12. Stream
order describes the position of a stream
reach in the stream network, with reaches
sequentially numbered from 1st order
headwaters to 9th order large rivers.
Source data were the US Census Bureau
TIGER Roads National Geodatabase
(2015 version) and the NHDPlus2
CatSeed grid and Value Added
Attributes (VAA) tables (downloaded
October 2012; http://www.horizon-
systems.com/NHDPlus/NHDPlusV2_dat
a.php).
US Census Bureau
TIGER Roads
National Geodatabase
(2015 version);
NHDPlus2 Catseed
Grid; NHDPlus2
PlusFlowlineVAA
tables
Removed
Count Road-
Stream
Crossings, 2nd
Order (2015)
ROAD_2015_ST
REAM_X_SO_2_
CNT_WS
Number of road-stream crossings over
2nd order streams in the HUC12. Stream
order describes the position of a stream
reach in the stream network, with reaches
sequentially numbered from 1st order
headwaters to 9th order large rivers.
Source data were the US Census Bureau
TIGER Roads National Geodatabase
(2015 version) and the NHDPlus2
CatSeed grid and Value Added
Attributes (VAA) tables (downloaded
US Census Bureau
TIGER Roads
National Geodatabase
(2015 version);
NHDPlus2 Catseed
Grid; NHDPlus2
PlusFlowlineVAA
tables
Removed

223
October 2012; http://www.horizon-
systems.com/NHDPlus/NHDPlusV2_dat
a.php).
Count Road-
Stream
Crossings, 3rd
Order (2015)
ROAD_2015_ST
REAM_X_SO_3_
CNT_WS
Number of road-stream crossings over
3rd order streams in the HUC12. Stream
order describes the position of a stream
reach in the stream network, with reaches
sequentially numbered from 1st order
headwaters to 9th order large rivers.
Source data were the US Census Bureau
TIGER Roads National Geodatabase
(2015 version) and the NHDPlus2
CatSeed grid and Value Added
Attributes (VAA) tables (downloaded
October 2012; http://www.horizon-
systems.com/NHDPlus/NHDPlusV2_dat
a.php).
US Census Bureau
TIGER Roads
National Geodatabase
(2015 version);
NHDPlus2 Catseed
Grid; NHDPlus2
PlusFlowlineVAA
tables
Removed
Count Road-
Stream
Crossings, 4th
Order (2015)
ROAD_2015_ST
REAM_X_SO_4_
CNT_WS
Number of road-stream crossings over
4th order streams in the HUC12. Stream
order describes the position of a stream
reach in the stream network, with reaches
sequentially numbered from 1st order
headwaters to 9th order large rivers.
Source data were the US Census Bureau
TIGER Roads National Geodatabase
(2015 version) and the NHDPlus2
US Census Bureau
TIGER Roads
National Geodatabase
(2015 version);
NHDPlus2 Catseed
Grid; NHDPlus2
PlusFlowlineVAA
tables
Removed

224
CatSeed grid and Value Added
Attributes (VAA) tables (downloaded
October 2012; http://www.horizon-
systems.com/NHDPlus/NHDPlusV2_dat
a.php).
Count Road-
Stream
Crossings, 5th
Order (2015)
ROAD_2015_ST
REAM_X_SO_5_
CNT_WS
Number of road-stream crossings over
5th order streams in the HUC12. Stream
order describes the position of a stream
reach in the stream network, with reaches
sequentially numbered from 1st order
headwaters to 9th order large rivers.
Source data were the US Census Bureau
TIGER Roads National Geodatabase
(2015 version) and the NHDPlus2
CatSeed grid and Value Added
Attributes (VAA) tables (downloaded
October 2012; http://www.horizon-
systems.com/NHDPlus/NHDPlusV2_dat
a.php).
US Census Bureau
TIGER Roads
National Geodatabase
(2015 version);
NHDPlus2 Catseed
Grid; NHDPlus2
PlusFlowlineVAA
tables
Removed
Count Road-
Stream
Crossings, 6th
Order (2015)
ROAD_2015_ST
REAM_X_SO_6_
CNT_WS
Number of road-stream crossings over
6th order streams in the HUC12. Stream
order describes the position of a stream
reach in the stream network, with reaches
sequentially numbered from 1st order
headwaters to 9th order large rivers.
Source data were the US Census Bureau
TIGER Roads National Geodatabase
(2015 version) and the NHDPlus2
US Census Bureau
TIGER Roads
National Geodatabase
(2015 version);
NHDPlus2 Catseed
Grid; NHDPlus2
PlusFlowlineVAA
tables
Removed

225
CatSeed grid and Value Added
Attributes (VAA) tables (downloaded
October 2012; http://www.horizon-
systems.com/NHDPlus/NHDPlusV2_dat
a.php).
Count Road-
Stream
Crossings, 7th
Order (2015)
ROAD_2015_ST
REAM_X_SO_7_
CNT_WS
Number of road-stream crossings over
7th order streams in the HUC12. Stream
order describes the position of a stream
reach in the stream network, with reaches
sequentially numbered from 1st order
headwaters to 9th order large rivers.
Source data were the US Census Bureau
TIGER Roads National Geodatabase
(2015 version) and the NHDPlus2
CatSeed grid and Value Added
Attributes (VAA) tables (downloaded
October 2012; http://www.horizon-
systems.com/NHDPlus/NHDPlusV2_dat
a.php).
US Census Bureau
TIGER Roads
National Geodatabase
(2015 version);
NHDPlus2 Catseed
Grid; NHDPlus2
PlusFlowlineVAA
tables
Removed
Count Road-
Stream
Crossings, 8th
Order (2015)
ROAD_2015_ST
REAM_X_SO_8_
CNT_WS
Number of road-stream crossings over
8th order streams in the HUC12. Stream
order describes the position of a stream
reach in the stream network, with reaches
sequentially numbered from 1st order
headwaters to 9th order large rivers.
Source data were the US Census Bureau
TIGER Roads National Geodatabase
(2015 version) and the NHDPlus2
US Census Bureau
TIGER Roads
National Geodatabase
(2015 version);
NHDPlus2 Catseed
Grid; NHDPlus2
PlusFlowlineVAA
tables
Removed

226
CatSeed grid and Value Added
Attributes (VAA) tables (downloaded
October 2012; http://www.horizon-
systems.com/NHDPlus/NHDPlusV2_dat
a.php).
Count Road-
Stream
Crossings, 9th
Order (2015)
ROAD_2015_ST
REAM_X_SO_9_
CNT_WS
Number of road-stream crossings over
9th order streams in the HUC12. Stream
order describes the position of a stream
reach in the stream network, with reaches
sequentially numbered from 1st order
headwaters to 9th order large rivers.
Source data were the US Census Bureau
TIGER Roads National Geodatabase
(2015 version) and the NHDPlus2
CatSeed grid and Value Added
Attributes (VAA) tables (downloaded
October 2012; http://www.horizon-
systems.com/NHDPlus/NHDPlusV2_dat
a.php).
US Census Bureau
TIGER Roads
National Geodatabase
(2015 version);
NHDPlus2 Catseed
Grid; NHDPlus2
PlusFlowlineVAA
tables
Removed
Count Road-
Stream
Crossings, 1st-
3rd Order
(2015)
ROAD_2015_ST
RM_X_SO_1_3_
CNT_WS
Number of road-stream crossings over
1st through 3rd order streams in the
HUC12. Stream order describes the
position of a stream reach in the stream
network, with reaches sequentially
numbered from 1st order headwaters to
9th order large rivers. Source data were
the US Census Bureau TIGER Roads
National Geodatabase (2015 version) and
US Census Bureau
TIGER Roads
National Geodatabase
(2015 version);
NHDPlus2 Catseed
Grid; NHDPlus2
PlusFlowlineVAA
tables
Removed

227
the NHDPlus2 CatSeed grid and Value
Added Attributes (VAA) tables
(downloaded October 2012;
http://www.horizon-
systems.com/NHDPlus/NHDPlusV2_dat
a.php).
Count Road-
Stream
Crossings, 4th-
9th Order
(2015)
ROAD_2015_ST
RM_X_SO_4_9_
CNT_WS
Number of road-stream crossings over
4th through 9th order streams in the
HUC12. Stream order describes the
position of a stream reach in the stream
network, with reaches sequentially
numbered from 1st order headwaters to
9th order large rivers. Source data were
the US Census Bureau TIGER Roads
National Geodatabase (2015 version) and
the NHDPlus2 CatSeed grid and Value
Added Attributes (VAA) tables
(downloaded October 2012;
http://www.horizon-
systems.com/NHDPlus/NHDPlusV2_dat
a.php).
US Census Bureau
TIGER Roads
National Geodatabase
(2015 version);
NHDPlus2 Catseed
Grid; NHDPlus2
PlusFlowlineVAA
tables
Removed

228
% Urban
Contiguous to
Water in WS
(2011)
URB_CONTIG_
NLCD11_PC_W
S
Percent of the HUC12 that is classified
as urban land cover and contiguous to
surface water. This indicator does not
count areas with urban land cover in the
HUC12 that are buffered from surface
water by other land use types. Source
data used were the Water Mask (May
2015 version) and the 2011 CDL-NLCD
Hybrid Land Cover dataset. Urban cover
classes include 'Developed, Open Space'
(code 121), 'Developed, Low Intensity'
(code 122), 'Developed, Medium
Intensity' (code 123), 'Developed, High
Intensity' (code 124) in the 2011 CDL-
NLCD Hybrid Land Cover dataset.
Equation used: Urban Contiguous to
Water Area / HUC12 Area * 100. (See
also Water Mask and 2011 CDL-NLCD
Hybrid Land Cover glossary definitions).
2011 CDL-NLCD,
EnviroAtlas Version
land cover (July 2015
version) and Water
Mask (May 2015
version). HUC12
Version: NHDPlus2
WBD Snapshot,
EnviroAtlas Version
(February 2015
version).
Removed
% Agriculture
Contiguous to
Water in WS
(2011)
AG_CONTIG_N
LCD11_PC_WS
Percent of the HUC12 that is classified
as agricultural land cover and contiguous
to surface water. This indicator does not
count areas with agricultural land cover
in the HUC12 that are buffered from
surface water by other land use types.
Source data used were the Water Mask
(May 2015 version) and the 2011 CDL-
NLCD Hybrid Land Cover dataset.
Agriculture cover classes includes
cropland and pasture; codes 1 through
92, 181, 182, and 204 through 254 in the
2011 CDL-NLCD,
EnviroAtlas Version
land cover (July 2015
version) and Water
Mask (May 2015
version). HUC12
Version: NHDPlus2
WBD Snapshot,
EnviroAtlas Version
(February 2015
version).
Removed

229
2011 CDL-NLCD Hybrid Land Cover
dataset. Equation used: Agriculture
Contiguous to Water Area / HUC12 Area
* 100. (See also Water Mask and 2011
CDL-NLCD Hybrid Land Cover
glossary definitions).
% Agriculture
on Hydric Soil
in WS
AG_HYDRIC_P
CT_WS
Percent of the HUC12 with agriculture
on hydric soils. Calculated by overlaying
soils units with ≥ 80% hydric soils from
the Natural Resources Conservation
Service Soil Survey Geographic
Database (SSURGO) with agricultural
land cover classes from a custom land
cover dataset that combined the 2006
National Land Cover Database (NLCD
2006) and the 2010 USDA Cropland
Data Layer (CDL). Because SSURGO
classifies map units as "percent hydric"
rather than hydric or non-hydric, a
minimum threshold of 80% hydric soils
per map unit was used to distinguish
hydric soils from non-hydric soils.
Equation used: Area of Agriculture on
Hydric Soils / HUC12 Area * 100. This
indicator was calculated for EPA
EnviroAtlas. Additional information on
source data and calculation methods can
be found at:
EnviroAtlas "Percent
Agriculture on Hydric
Soil for the
Conterminous United
States", May 7, 2015
version.
Removed

230
https://edg.epa.gov/metadata/catalog/sear
ch/resource/details.page?uuid=%7B1671
13DA-E941-4CB3-8E93-
8FE2600C08DA%7D
% Agriculture
on > 10% Slope
in WS (2011)
AG_CDLNLCD1
1_PCT_SLP10_
WS
Percent of the HUC12 with agriculture
cover on slopes greater than or equal to
10 percent. Source data were the 2011
CDL-NLCD Hybrid Land Cover dataset
and NED Snapshot dataset. Agriculture
cover classes include cropland and
pasture; codes 1 through 92, 181, 182,
and 204 through 254 in the 2011 CDL-
NLCD Hybrid Land Cover dataset.
Calculated as the area of agriculture
cover on slopes greater than or equal to
10 percent, divided by HUC12 area,
multiplied by 100. (See also 2011 CDL-
NLCD Hybrid Land Cover and NED
Snapshot glossary definitions).
2011 CDL-NLCD,
EnviroAtlas Version
land cover (July 2015
version); NHDPlus2
NED Snapshot
(downloaded October
2012). HUC12
Version: NHDPlus
WBD Snapshot,
EnviroAtlas Version
(February 2015
version).
Removed

231
% Agriculture
on > 20% Slope
in WS (2011)
AG_CDLNLCD1
1_PCT_SLP20_
WS
Percent of the HUC12 with agriculture
cover on slopes greater than or equal to
20 percent. Source data were the 2011
CDL-NLCD Hybrid Land Cover dataset
and NED Snapshot dataset. Agriculture
cover classes include cropland and
pasture; codes 1 through 92, 181, 182,
and 204 through 254 in the 2011 CDL-
NLCD Hybrid Land Cover dataset.
Calculated as the area of agriculture
cover on slopes greater than or equal to
20 percent, divided by HUC12 area,
multiplied by 100. (See also 2011 CDL-
NLCD Hybrid Land Cover and NED
Snapshot glossary definitions).
2011 CDL-NLCD,
EnviroAtlas Version
land cover (July 2015
version); NHDPlus2
NED Snapshot
(downloaded October
2012). HUC12
Version: NHDPlus
WBD Snapshot,
EnviroAtlas Version
(February 2015
version).
Removed
% Slope of
Cropland, Mean
in WS (2011)
CROP_CDLNLC
D11_SLPMEAN_
WS
Mean slope of cultivated crop cover in
the HUC12 (percent). Source data were
the 2011 CDL-NLCD Hybrid Land
Cover dataset and NED Snapshot dataset.
Cultivated crop cover classes include
non-pasture agriculture; codes 1 through
35, 38 through 57, 66 through 92, 182,
and 204 through 254 in the 2011 CDL-
NLCD Hybrid Land Cover dataset.
Calculated as the mean slope for grid
pixels classified as cultivated crop cover
in the HUC12. (See also 2011 CDL-
NLCD Hybrid Land Cover and NED
Snapshot glossary definitions).
2011 CDL-NLCD,
EnviroAtlas Version
land cover (July 2015
version); NHDPlus2
NED Snapshot
(downloaded October
2012). HUC12
Version: NHDPlus
WBD Snapshot,
EnviroAtlas Version
(February 2015
version).
Removed

232
% Cropland on
> 3% Slope in
WS (2011)
CROP_CDLNLC
D11_PCT_SLP3_
WS
Percent of the HUC12 with cultivated
crop cover on slopes greater than or
equal to 3 percent. Source data were the
2011 CDL-NLCD Hybrid Land Cover
dataset and NED Snapshot dataset.
Cultivated crop cover classes include
non-pasture agriculture; codes 1 through
35, 38 through 57, 66 through 92, 182,
and 204 through 254 in the 2011 CDL-
NLCD Hybrid Land Cover dataset.
Calculated as the area of cultivated crop
cover on slopes greater than or equal to 3
percent, divided by HUC12 area,
multiplied by 100. (See also 2011 CDL-
NLCD Hybrid Land Cover and NED
Snapshot glossary definitions).
2011 CDL-NLCD,
EnviroAtlas Version
land cover (July 2015
version); NHDPlus2
NED Snapshot
(downloaded October
2012). HUC12
Version: NHDPlus
WBD Snapshot,
EnviroAtlas Version
(February 2015
version).
Removed
% Cropland on
> 10% Slope in
WS (2011)
CROP_CDLNLC
D11_PCT_SLP10
_WS
Percent of the HUC12 with cultivated
crop cover on slopes greater than or
equal to 10 percent. Source data were the
2011 CDL-NLCD Hybrid Land Cover
dataset and NED Snapshot dataset.
Cultivated crop cover classes include
non-pasture agriculture; codes 1 through
35, 38 through 57, 66 through 92, 182,
and 204 through 254 in the 2011 CDL-
NLCD Hybrid Land Cover dataset.
Calculated as the area of cultivated crop
cover on slopes greater than or equal to
10 percent, divided by HUC12 area,
multiplied by 100. (See also 2011 CDL-
2011 CDL-NLCD,
EnviroAtlas Version
land cover (July 2015
version); NHDPlus2
NED Snapshot
(downloaded October
2012). HUC12
Version: NHDPlus
WBD Snapshot,
EnviroAtlas Version
(February 2015
version).
Removed

233
NLCD Hybrid Land Cover and NED
Snapshot glossary definitions).
% Slope of
Cropland, Mean
in RZ (2011)
CROP_CDLNLC
D11_SLPMEAN_
RZ
Mean slope of cultivated crop cover in
the Riparian Zone of the HUC12
(percent). Source data were the 2011
CDL-NLCD Hybrid Land Cover dataset
and NED Snapshot dataset. Cultivated
crop cover classes include non-pasture
agriculture; codes 1 through 35, 38
through 57, 66 through 92, 182, and 204
through 254 in the 2011 CDL-NLCD
Hybrid Land Cover dataset. Calculated
as the mean slope for grid pixels
classified as cultivated crop cover in the
Riparian Zone of the HUC12. (See also
2011 CDL-NLCD Hybrid Land Cover,
Riparian Zone, and NED Snapshot
glossary definitions).
2011 CDL-NLCD,
EnviroAtlas Version
land cover (July 2015
version); NHDPlus2
NED Snapshot
(downloaded October
2012); RZ Grid
(August 2015
Version). HUC12
Version: NHDPlus
WBD Snapshot,
EnviroAtlas Version
(February 2015
version).
Removed
% Slope of
Pasture, Mean
in WS (2011)
PAST_CDLNLC
D11_SLPMEAN_
WS
Mean slope of pasture cover in the
HUC12 (percent). Source data were the
2011 CDL-NLCD Hybrid Land Cover
dataset and NED Snapshot dataset.
Pasture cover classes include any
uncropped agriculture cover; codes 36,
2011 CDL-NLCD,
EnviroAtlas Version
land cover (July 2015
version); NHDPlus2
NED Snapshot
(downloaded October
Removed

234
37, 58 through 61, and 181 in the 2011
CDL-NLCD Hybrid Land Cover dataset.
Calculated as the mean slope for grid
pixels classified as pasture cover in the
HUC12. (See also 2011 CDL-NLCD
Hybrid Land Cover and NED Snapshot
glossary definitions).
2012). HUC12
Version: NHDPlus
WBD Snapshot,
EnviroAtlas Version
(February 2015
version).
% Pasture on >
10% Slope in
WS (2011)
PAST_CDLNLC
D11_PCT_SLP10
_WS
Percent of the HUC12 with pasture cover
on slopes greater than or equal to 10
percent. Source data were the 2011 CDL-
NLCD Hybrid Land Cover dataset and
NED Snapshot dataset. Pasture cover
classes include any uncropped
agriculture cover; codes 36, 37, 58
through 61, and 181 in the 2011 CDL-
NLCD Hybrid Land Cover dataset.
Calculated as the area of pasture cover
on slopes greater than or equal to 10
percent, divided by HUC12 area,
multiplied by 100. (See also 2011 CDL-
NLCD Hybrid Land Cover and NED
Snapshot glossary definitions).
2011 CDL-NLCD,
EnviroAtlas Version
land cover (July 2015
version); NHDPlus2
NED Snapshot
(downloaded October
2012). HUC12
Version: NHDPlus
WBD Snapshot,
EnviroAtlas Version
(February 2015
version).
Removed
% Slope of
Pasture, Mean
in RZ (2011)
PAST_CDLNLC
D11_SLPMEAN_
RZ
Mean slope of pasture cover in the
Riparian Zone of the HUC12 (percent).
Source data were the 2011 CDL-NLCD
Hybrid Land Cover dataset and NED
Snapshot dataset. Pasture cover classes
include any uncropped agriculture cover;
codes 36, 37, 58 through 61, and 181 in
the 2011 CDL-NLCD Hybrid Land
Cover dataset. Calculated as the mean
2011 CDL-NLCD,
EnviroAtlas Version
land cover (July 2015
version); NHDPlus2
NED Snapshot
(downloaded October
2012); RZ Grid
(August 2015
Version). HUC12
Removed

235
slope value for grid pixels classified as
pasture cover in the Riparian Zone of the
HUC12. (See also 2011 CDL-NLCD
Hybrid Land Cover, Riparian Zone, and
NED Snapshot glossary definitions).
Version: NHDPlus
WBD Snapshot,
EnviroAtlas Version
(February 2015
version).
% High
Intensity Land
Cover in RZ
(2011)
CROP_MH_URB
_CDLNLCD11_P
CT_RZ
Percent of the HUC12 that is in the
Riparian Zone and classified as high-
intensity land cover by the 2011 CDL-
NLCD Hybrid Land Cover dataset. High-
intensity land cover classes are defined
as cultivated crops (non-pasture
agriculture), medium-density urban, and
high-density urban; codes 1 through 35,
38 through 57, 66 through 92, 123
through 124, 182, and 204 through 254
in the 2011 CDL-NLCD Hybrid Land
Cover dataset. Calculated as the sum
cultivated crop, medium-density urban,
and high-density urban area in the
Riparian Zone, divided by HUC12 area,
multiplied by 100. (See also 2011 CDL-
NLCD Hybrid Land Cover and Riparian
Zone glossary definitions).
2011 CDL-NLCD,
EnviroAtlas Version
land cover (July 2015
version) and RZ Grid
(August 2015
Version). HUC12
Version: NHDPlus
WBD Snapshot,
EnviroAtlas Version
(February 2015
version).
Removed

236
% Human Use,
U-Index1 in
WS (2011)
U_INDEX_CDL
NLCD11_PCT_
WS
Percent of the HUC12 classified as a
human land use (excluding barren land)
by the 2011 CDL-NLCD Hybrid Land
Cover dataset. Human use land cover
classes in the U-Index1 include cropland,
pasture, and urban; codes 1 through 92,
121 through 124, 181, 182, and 204
through 254 in the 2011 CDL-NLCD
Hybrid Land Cover dataset. Equation
used: U-Index1 Area / HUC12 Area *
100. (See also 2011 CDL-NLCD Hybrid
Land Cover glossary definition).
2011 CDL-NLCD,
EnviroAtlas Version
land cover (July 2015
version). HUC12
Version: NHDPlus
WBD Snapshot,
EnviroAtlas Version
(February 2015
version).
Removed
% Human Use,
U-Index1 in
HCZ (2011)
U_INDEX_CDL
NLCD11_PCT_H
Z
Percent of the HUC12 that is in the
Hydrologically Connected Zone (HCZ)
and classified as a human land use
(excluding barren land) by the 2011
CDL-NLCD Hybrid Land Cover dataset.
Human use land cover classes in the U-
Index1 include cropland, pasture, and
urban; codes 1 through 92, 121 through
124, 181, 182, and 204 through 254 in
the 2011 CDL-NLCD Hybrid Land
Cover dataset. Equation used: Area of U-
Index1 in HCZ / HUC12 Area * 100.
(See also 2011 CDL-NLCD Hybrid Land
Cover and Hydrologically Connected
Zone glossary definitions).
2011 CDL-NLCD,
EnviroAtlas Version
land cover (July 2015
version) and HCZ
Grid (October 2015
version). HUC12
Version: NHDPlus
WBD Snapshot,
EnviroAtlas Version
(February 2015
version).
Removed

237
% Human Use,
U-Index1 in RZ
(2011)
U_INDEX_CDL
NLCD11_PCT_R
Z
Percent of the HUC12 that is in the
Riparian Zone (RZ) and classified as a
human land use (excluding barren land)
by the 2011 CDL-NLCD Hybrid Land
Cover dataset. Human use land cover
classes in the U-Index1 include cropland,
pasture, and urban; codes 1 through 92,
121 through 124, 181, 182, and 204
through 254 in the 2011 CDL-NLCD
Hybrid Land Cover dataset. Equation
used: Area of U-Index1 in RZ / HUC12
Area * 100. (See also 2011 CDL-NLCD
Hybrid Land Cover and Riparian Zone
glossary definitions).
2011 CDL-NLCD,
EnviroAtlas Version
land cover (July 2015
version) and RZ Grid
(August 2015
Version). HUC12
Version: NHDPlus
WBD Snapshot,
EnviroAtlas Version
(February 2015
version).
Removed
% Human Use
Change, U-
Index1 Chng in
WS (2001-11)
U_INDEX_CHG
_2001_11_PCT_
WS
The change in the percentage of the
HUC12 with human use land cover
(excluding barren land) from 2001 to
2011. Source data was the National Land
Cover Database 2011 (NLCD 2011)
2001 to 2011 Land Cover From To
Change Index dataset, March 2014
version
(http://www.mrlc.gov/nlcd11_data.php;
downloaded April 2015). Human use
cover classes included in the U-Index1
are 'Developed, Open Space',
'Developed, Low Intensity', 'Developed,
Medium Intensity', 'Developed, High
Intensity', 'Pasture/Hay', and 'Cultivated
Crops' cover classes; codes 21 through
24, 81, and 82 in the 2001 to 2011 Land
NLCD 2001-2011
Land Cover From to
Change index (2011
Edition; March 2014
version). HUC12
Version: NHDPlus
WBD Snapshot,
EnviroAtlas Version
(February 2015
version).
Removed
238
Cover From To Change Index dataset.
Positive values denote an increase in U-
Index1; negative values denote a
decrease in U-Index1. Does not count
areas that changed to/from the 'Open
Water' class (code 11) since these were
assumed to be errors. Equation used:
(Area Changing to U-Index1 – Area
Changing From U-Index1)/(HUC12
Area) * 100.
% Human Use
Change, U-
Index1 Chng in
HCZ (2001-11)
U_INDEX_CHG
_2001_11_PCT_
HZ
The change in the percentage of the
HUC12 with human use land cover
(excluding barren land) in the
Hydrologically Connected Zone (HCZ)
from 2001 to 2011. Source data was the
National Land Cover Database 2011
(NLCD 2011) 2001 to 2011 Land Cover
From To Change Index dataset, March
2014 version
(http://www.mrlc.gov/nlcd11_data.php;
downloaded April 2015). Human use
cover classes included in the U-Index1
are 'Developed, Open Space',
'Developed, Low Intensity', 'Developed,
Medium Intensity', 'Developed, High
Intensity', 'Pasture/Hay', and 'Cultivated
Crops' cover classes; codes 21 through
24, 81, and 82 in the 2001 to 2011 Land
NLCD 2001-2011
Land Cover From to
Change index (2011
Edition; March 2014
version) and HCZ
Grid (October 2015
version). HUC12
Version: NHDPlus
WBD Snapshot,
EnviroAtlas Version
(February 2015
version).
Removed

239
Cover From To Change Index dataset.
Positive values denote an increase in U-
Index1; negative values denote a
decrease in U-Index1. Does not count
areas that changed to/from the 'Open
Water' class (code 11) since these were
assumed to be errors. Equation used:
(Area Changing to U-Index1 in the HCZ
– Area Changing From U-Index1 in the
HCZ)/(HUC12 Area) * 100. (See also
Hydrologically Connected Zone glossary
definition).
% Human Use
Change, U-
Index1 Chng in
RZ (2001-11)
U_INDEX_CHG
_2001_11_PCT_
RZ
The change in the percentage of the
HUC12 with human use land cover
(excluding barren land) in the Riparian
Zone (RZ) from 2001 to 2011. Source
data was the National Land Cover
Database 2011 (NLCD 2011) 2001 to
2011 Land Cover From To Change Index
dataset, March 2014 version
(http://www.mrlc.gov/nlcd11_data.php;
downloaded April 2015). Human use
cover classes included in the U-Index1
are 'Developed, Open Space',
'Developed, Low Intensity', 'Developed,
Medium Intensity', 'Developed, High
Intensity', 'Pasture/Hay', and 'Cultivated
Crops' cover classes; codes 21 through
NLCD 2001-2011
Land Cover From to
Change index (2011
Edition; March 2014
version) and RZ Grid
(August 2015
Version). HUC12
Version: NHDPlus
WBD Snapshot,
EnviroAtlas Version
(February 2015
version).
Removed

240
24, 81, and 82 in the 2001 to 2011 Land
Cover From To Change Index dataset.
Positive values denote an increase in U-
Index1; negative values denote a
decrease in U-Index1. Does not count
areas that changed to/from the 'Open
Water' class (code 11) since these were
assumed to be errors. Equation used:
(Area Changing to U-Index1 in the RZ –
Area Changing From U-Index1 in the
RZ)/(HUC12 Area) * 100. (See also
Riparian Zone glossary definition).
% U-Index1
Change
To/From Water
in WS (2001-
11)
UIDX_H20_CHG
_2001_11_PCT_
WS
The percentage of the HUC12 that
changed from water to human use land
cover (excluding barren land) or to water
from human use land cover from 2001 to
2011. Source data was the National Land
Cover Database 2011 (NLCD 2011)
2001 to 2011 Land Cover From To
Change Index dataset, March 2014
version
(http://www.mrlc.gov/nlcd11_data.php;
downloaded April 2015). Human use
cover classes included in the U-Index1
are 'Developed, Open Space',
'Developed, Low Intensity', 'Developed,
Medium Intensity', 'Developed, High
Intensity', 'Pasture/Hay', and 'Cultivated
Crops' cover classes; codes 21 through
NLCD 2001-2011
Land Cover From to
Change index (2011
Edition; March 2014
version). HUC12
Version: NHDPlus
WBD Snapshot,
EnviroAtlas Version
(February 2015
version).
Removed

241
24, 81, and 82 in the 2001 to 2011 Land
Cover From To Change Index dataset.
Positive values denote a net increase in
U-Index1 from water; negative values
denote a net increase in water from U-
Index1. Equation used: (Area Changing
from Water to U-Index1 – Area
Changing from U-Index1 to
Water)/(HUC12 Area) * 100.
% U-Index1
Change
To/From Water
in HCZ (2001-
11)
UIDX_H20_CHG
_2001_11_PCT_
HZ
The change in the percentage of the
HUC12 that is in the Hydrologically
Connected Zone (HCZ) and changed
from water to human use land cover
(excluding barren land) or to water from
human use land cover from 2001 to
2011. Source data was the National Land
Cover Database 2011 (NLCD 2011)
2001 to 2011 Land Cover From To
Change Index dataset, March 2014
version
(http://www.mrlc.gov/nlcd11_data.php;
downloaded April 2015). Human use
cover classes included in the U-Index1
are 'Developed, Open Space',
'Developed, Low Intensity', 'Developed,
Medium Intensity', 'Developed, High
Intensity', 'Pasture/Hay', and 'Cultivated
NLCD 2001-2011
Land Cover From to
Change index (2011
Edition; March 2014
version) and HCZ
Grid (October 2015
version). HUC12
Version: NHDPlus
WBD Snapshot,
EnviroAtlas Version
(February 2015
version).
Removed

242
Crops' cover classes; codes 21 through
24, 81, and 82 in the 2001 to 2011 Land
Cover From To Change Index dataset.
Positive values denote an increase in U-
Index1; negative values denote a
decrease in U-Index1. Equation used:
(Area Changing to U-Index1 in the HCZ
– Area Changing From U-Index1 in the
HCZ)/(HUC12 Area) * 100. (See also
Hydrologically Connected Zone glossary
definition).
% U-Index1
Change
To/From Water
in RZ (2001-11)
UIDX_H20_CHG
_2001_11_PCT_
RZ
The change in the percentage of the
HUC12 that is in the Riparian Zone (RZ)
and changed from water to human use
land cover (excluding barren land) or to
water from human use land cover from
2001 to 2011. Source data was the
National Land Cover Database 2011
(NLCD 2011) 2001 to 2011 Land Cover
From To Change Index dataset, March
2014 version
(http://www.mrlc.gov/nlcd11_data.php;
downloaded April 2015). Human use
cover classes included in the U-Index1
are 'Developed, Open Space',
'Developed, Low Intensity', 'Developed,
Medium Intensity', 'Developed, High
Intensity', 'Pasture/Hay', and 'Cultivated
NLCD 2001-2011
Land Cover From to
Change index (2011
Edition; March 2014
version) and RZ Grid
(August 2015
Version). HUC12
Version: NHDPlus
WBD Snapshot,
EnviroAtlas Version
(February 2015
version).
Removed

243
Crops' cover classes; codes 21 through
24, 81, and 82 in the 2001 to 2011 Land
Cover From To Change Index dataset.
Positive values denote an increase in U-
Index1; negative values denote a
decrease in U-Index1. Equation used:
(Area Changing to U-Index1 in the RZ –
Area Changing From U-Index1 in the
RZ)/(HUC12 Area) * 100. (See also
Riparian Zone glossary definition).
% U-Index1
Contiguous to
Water in WS
(2011)
U_INDEX_11_C
ON_H2O_PCT_
WS
Percent of the HUC12 that is classified
as a human land use (excluding barren
land) and contiguous to surface water.
This indicator does not count areas with
human use land cover in the HUC12 that
are buffered from surface water by other
land use types. Source data used were the
Water Mask (May 2015 version) and the
2011 CDL-NLCD Hybrid Land Cover
dataset. Human use land cover classes in
the U-Index1 include cropland, pasture,
and urban; codes 1 through 92, 121
through 124, 181, 182, and 204 through
254 in the 2011 CDL-NLCD Hybrid
Land Cover dataset. Equation used: U-
Index1 Contiguous to Water Area /
HUC12 Area * 100. (See also Water
2011 CDL-NLCD,
EnviroAtlas Version
land cover (July 2015
version) and Water
Mask (May 2015
version). HUC12
Version: NHDPlus2
WBD Snapshot,
EnviroAtlas Version
(February 2015
version).
Removed

244
Mask and 2011 CDL-NLCD Hybrid
Land Cover glossary definitions).
% Human Use,
U-index2 in WS
(2011)
U_INDEX2_CDL
NLCD11_PCT_
WS
Percent of the HUC12 classified as a
human land use (including barren land)
by the 2011 CDL-NLCD Hybrid Land
Cover dataset. Human use land cover
classes in the U-Index2 include barren,
cropland, pasture, and urban; codes 1
through 92, 121 through 124, 131, 181,
182, and 204 through 254 in the 2011
CDL-NLCD Hybrid Land Cover dataset.
Equation used: U-Index2 2 Area /
HUC12 Area * 100. (See also 2011
CDL-NLCD Hybrid Land Cover
glossary definition).
2011 CDL-NLCD,
EnviroAtlas Version
land cover (July 2015
version). HUC12
Version: NHDPlus
WBD Snapshot,
EnviroAtlas Version
(February 2015
version).
Removed
% Human Use,
U-index2 in
HCZ (2011)
U_INDEX2_CDL
NLCD11_PCT_H
Z
Percent of the HUC12 that is in the
Hydrologically Connected Zone (HCZ)
and classified as a human land use
(including barren land) by the 2011
CDL-NLCD Hybrid Land Cover dataset.
Human use land cover classes in the U-
Index2 include barren, cropland, pasture,
and urban; codes 1 through 92, 121
2011 CDL-NLCD,
EnviroAtlas Version
land cover (July 2015
version) and HCZ
Grid (October 2015
version). HUC12
Version: NHDPlus
WBD Snapshot,
Removed

245
through 124, 131, 181, 182, and 204
through 254 in the 2011 CDL-NLCD
Hybrid Land Cover dataset. Equation
used: Area of U-Index2 in HCZ / HUC12
Area * 100. (See also 2011 CDL-NLCD
Hybrid Land Cover and Hydrologically
Connected Zone glossary definitions).
EnviroAtlas Version
(February 2015
version).
% Human Use,
U-index2 in RZ
(2011)
U_INDEX2_CDL
NLCD11_PCT_R
Z
Percent of the HUC12 that is in the
Riparian Zone (RZ) and classified as a
human land use (including barren land)
by the 2011 CDL-NLCD Hybrid Land
Cover dataset. Human use land cover
classes in the U-Index2 include barren,
cropland, pasture, and urban; codes 1
through 92, 121 through 124, 131, 181,
182, and 204 through 254 in the 2011
CDL-NLCD Hybrid Land Cover dataset.
Equation used: Area of U-Index2 2 in RZ
/ HUC12 Area * 100. (See also 2011
CDL-NLCD Hybrid Land Cover and
Riparian Zone glossary definitions).
2011 CDL-NLCD,
EnviroAtlas Version
land cover (July 2015
version) and RZ Grid
(August 2015
Version). HUC12
Version: NHDPlus
WBD Snapshot,
EnviroAtlas Version
(February 2015
version).
Removed

246
% Human Use
Change, U-
Index2 Chng in
WS (2001-11)
U_INDEX2_CH
G_2001_11_PCT
_WS
The change in the percentage of the
HUC12 with human use land cover
(including barren land) from 2001 to
2011. Source data was the National Land
Cover Database 2011 (NLCD 2011)
2001 to 2011 Land Cover From To
Change Index dataset, March 2014
version
(http://www.mrlc.gov/nlcd11_data.php;
downloaded April 2015). Human use
cover classes included in the U-Index2
are 'Developed, Open Space',
'Developed, Low Intensity', 'Developed,
Medium Intensity', 'Developed, High
Intensity', 'Barren Land
(Rock/Sand/Clay)', 'Pasture/Hay', and
'Cultivated Crops' cover classes; codes
21 through 24, 31, 81, and 82 in the 2001
to 2011 Land Cover From To Change
Index dataset. Positive values denote an
increase in U-Index2; negative values
denote a decrease in U-Index2. Does not
count areas that changed to/from the
'Open Water' class (code 11) since these
were assumed to be errors. Equation
used: (Area Changing to U-Index2 –
Area Changing From U-Index2)/(HUC12
Area) * 100.
NLCD 2001-2011
Land Cover From to
Change index (2011
Edition; March 2014
version). HUC12
Version: NHDPlus
WBD Snapshot,
EnviroAtlas Version
(February 2015
version).
Removed

247
% Human Use
Change, U-
Index2 Chng in
HCZ (2001-11)
U_INDEX2_CH
G_2001_11_PCT
_HZ
The change in the percentage of the
HUC12 with human use land cover
(including barren land) in the
Hydrologically Connected Zone (HCZ)
from 2001 to 2011. Source data was the
National Land Cover Database 2011
(NLCD 2011) 2001 to 2011 Land Cover
From To Change Index dataset, March
2014 version
(http://www.mrlc.gov/nlcd11_data.php;
downloaded April 2015). Human use
cover classes included in the U-Index2
are Developed, Open Space', 'Developed,
Low Intensity', 'Developed, Medium
Intensity', 'Developed, High Intensity',
'Barren Land (Rock/Sand/Clay)',
'Pasture/Hay', and 'Cultivated Crops'
cover classes; codes 21 through 24, 31,
81, and 82 in the 2001 to 2011 Land
Cover From To Change Index dataset.
Positive values denote an increase in U-
Index2; negative values denote a
decrease in U-Index2. Does not count
areas that changed to/from the 'Open
Water' class (code 11) since these were
assumed to be errors. Equation used:
(Area Changing to U-Index2 in the HCZ
– Area Changing From U-Index2 in the
HCZ)/(HUC12 Area) * 100. (See also
Hydrologically Connected Zone glossary
definition).
NLCD 2001-2011
Land Cover From to
Change index (2011
Edition; March 2014
version) and HCZ
Grid (October 2015
version). HUC12
Version: NHDPlus
WBD Snapshot,
EnviroAtlas Version
(February 2015
version).
Removed

248
% Human Use
Change, U-
Index2 Chng in
RZ (2001-11)
U_INDEX2_CH
G_2001_11_PCT
_RZ
The change in the percentage of the
HUC12 with human use land cover
(including barren land) from 2001 to
2011. Source data was the National Land
Cover Database 2011 (NLCD 2011)
2001 to 2011 Land Cover From To
Change Index dataset, March 2014
version
(http://www.mrlc.gov/nlcd11_data.php;
downloaded April 2015). Human use
cover classes included in the U-Index2
are 'Developed, Open Space',
'Developed, Low Intensity', 'Developed,
Medium Intensity', 'Developed, High
Intensity', 'Barren Land
(Rock/Sand/Clay)', 'Pasture/Hay', and
'Cultivated Crops' cover classes; codes
21 through 24, 31, 81, and 82 in the 2001
to 2011 Land Cover From To Change
Index dataset. Positive values denote an
increase in U-Index2; negative values
denote a decrease in U-Index2. Does not
count areas that changed to/from the
'Open Water' class (code 11) since these
were assumed to be errors. Equation
used: (Area Changing to U-Index2 in the
RZ – Area Changing From U-Index2 in
the RZ)/(HUC12 Area) * 100. (See also
Riparian Zone glossary definition).
NLCD 2001-2011
Land Cover From to
Change index (2011
Edition; March 2014
version) and RZ Grid
(August 2015
Version). HUC12
Version: NHDPlus
WBD Snapshot,
EnviroAtlas Version
(February 2015
version).
Removed

249
% U-Index2
Change
To/From Water
in WS (2001-
11)
UIDX2_H20_CH
G_2001_11_PCT
_WS
The percentage of the HUC12 that
changed from water to human use land
cover (including barren land) or to water
from human use land cover from 2001 to
2011. Source data was the National Land
Cover Database 2011 (NLCD 2011)
2001 to 2011 Land Cover From To
Change Index dataset, March 2014
version
(http://www.mrlc.gov/nlcd11_data.php;
downloaded April 2015). Human use
cover classes included in the U-Index2
are '', 'Developed, Open Space',
'Developed, Low Intensity', 'Developed,
Medium Intensity', 'Developed, High
Intensity', 'Barren Land
(Rock/Sand/Clay)', 'Pasture/Hay', and
'Cultivated Crops' cover classes; codes
21 through 24, 31, 81, and 82 in the 2001
to 2011 Land Cover From To Change
Index dataset. Positive values denote a
net increase in U-Index2 from water;
negative values denote a net increase in
water from U-Index2. Equation used:
(Area Changing from Water to U-Index2
– Area Changing from U-Index2 to
Water)/(HUC12 Area) * 100.
NLCD 2001-2011
Land Cover From to
Change index (2011
Edition; March 2014
version). HUC12
Version: NHDPlus
WBD Snapshot,
EnviroAtlas Version
(February 2015
version).
Removed

250
% U-Index2
Change
To/From Water
in HCZ (2001-
11)
UIDX2_H20_CH
G_2001_11_PCT
_HZ
The change in the percentage of the
HUC12 that is in the Hydrologically
Connected Zone (HCZ) and changed
from water to human use land cover
(including barren land) or to water from
human use land cover from 2001 to
2011. Source data was the National Land
Cover Database 2011 (NLCD 2011)
2001 to 2011 Land Cover From To
Change Index dataset, March 2014
version
(http://www.mrlc.gov/nlcd11_data.php;
downloaded April 2015). Human use
cover classes included in the U-Index2
are '', 'Developed, Open Space',
'Developed, Low Intensity', 'Developed,
Medium Intensity', 'Developed, High
Intensity', 'Barren Land
(Rock/Sand/Clay)', 'Pasture/Hay', and
'Cultivated Crops' cover classes; codes
21 through 24, 31, 81, and 82 in the 2001
to 2011 Land Cover From To Change
Index dataset. Positive values denote an
increase in U-Index2; negative values
denote a decrease in U-Index2. Equation
used: (Area Changing to U-Index2 in the
HCZ – Area Changing From U-Index2 in
the HCZ)/(HUC12 Area) * 100. (See
also Hydrologically Connected Zone
glossary definition).
NLCD 2001-2011
Land Cover From to
Change index (2011
Edition; March 2014
version) and HCZ
Grid (October 2015
version). HUC12
Version: NHDPlus
WBD Snapshot,
EnviroAtlas Version
(February 2015
version).
Removed

251
% U-Index2
Change
To/From Water
in RZ (2001-11)
UIDX2_H20_CH
G_2001_11_PCT
_RZ
The change in the percentage of the
HUC12 that is in the Riparian Zone (RZ)
and changed from water to human use
land cover (including barren land) or to
water from human use land cover from
2001 to 2011. Source data was the
National Land Cover Database 2011
(NLCD 2011) 2001 to 2011 Land Cover
From To Change Index dataset, March
2014 version
(http://www.mrlc.gov/nlcd11_data.php;
downloaded April 2015). Human use
cover classes included in the U-Index2
are '', 'Developed, Open Space',
'Developed, Low Intensity', 'Developed,
Medium Intensity', 'Developed, High
Intensity', 'Barren Land
(Rock/Sand/Clay)', 'Pasture/Hay', and
'Cultivated Crops' cover classes; codes
21 through 24, 31, 81, and 82 in the 2001
to 2011 Land Cover From To Change
Index dataset. Positive values denote an
increase in U-Index2; negative values
denote a decrease in U-Index2. Equation
used: (Area Changing to U-Index2 in the
RZ – Area Changing From U-Index2 in
the RZ)/(HUC12 Area) * 100. (See also
Riparian Zone glossary definition).
NLCD 2001-2011
Land Cover From to
Change index (2011
Edition; March 2014
version) and RZ Grid
(August 2015
Version). HUC12
Version: NHDPlus
WBD Snapshot,
EnviroAtlas Version
(February 2015
version).
Removed

252
% U-Index2
Contiguous to
Water in WS
(2011)
U_INDEX2_11_
CON_H2O_PCT_
WS
Percent of the HUC12 that is classified
as a human land use (including barren
land) and contiguous to surface water.
This indicator does not count areas with
human use land cover in the HUC12 that
are buffered from surface water by other
land use types. Source data used were the
Water Mask (May 2015 version) and the
2011 CDL-NLCD Hybrid Land Cover
dataset. Human use land cover classes in
the U-Index1 include barren, cropland,
pasture, and urban; codes 1 through 92,
121 through 124, 131, 181, 182, and 204
through 254 in the 2011 CDL-NLCD
Hybrid Land Cover dataset. Equation
used: U-Index2 Contiguous to Water
Area / HUC12 Area * 100. (See also
Water Mask and 2011 CDL-NLCD
Hybrid Land Cover glossary definitions).
2011 CDL-NLCD,
EnviroAtlas Version
land cover (July 2015
version) and Water
Mask (May 2015
version). HUC12
Version: NHDPlus2
WBD Snapshot,
EnviroAtlas Version
(February 2015
version).
Removed
Empower
Density, Mean
in WS (2001)
EMPOWER_DE
NSITY_2001_M
EAN_WS
Mean value of empower density in the
HUC12 (in units of solar equivalent
Joules per square meter per year).
Empower density is a measure of energy
and material flow within a given area
over time and provides a standarized
measure for quantifying the intensity of
human activity. Only includes
nonrenewable energy and material use
including electricity, fuels, fertilizers,
pesticides, and water. Souce data was a
gridded dataset of empower density
NLCD 2006 Land
Cover Dataset
(Version 1)
Removed

253
developed by EPA Region 4 using the
NLCD 2006 Land Cover Dataset
(Version 1) and empower density
conversions for various land cover types
reported in Brown and Vivas (2005,
Landscape Development Intensity Index,
Environmental Monitoring and
Assessment, Volume 101).
Empower
Density, Mean
in HCZ (2001)
EMPOWER_DE
NSITY_2001_M
EAN_HZ
Mean value of empower density in the
Hydrologically Connected Zone (HCZ)
of the HUC12 (in units of solar
equivalent Joules per square meter per
year). Empower density is a measure of
energy and material flow within a given
area over time and provides a standarized
measure for quantifying the intensity of
human activity. Only includes
nonrenewable energy and material use
including electricity, fuels, fertilizers,
pesticides, and water. Souce data was a
gridded dataset of empower density
developed by EPA Region 4 using the
NLCD 2006 Land Cover Dataset
(Version 1) and empower density
conversions for various land cover types
reported in Brown and Vivas (2005,
Landscape Development Intensity Index,
Environmental Monitoring and
Assessment, Volume 101). (See also
NLCD 2006 Land
Cover Dataset
(Version 1)
Removed

254
Hydrologically Connected Zone glossary
definition).
Empower
Density, Mean
in RZ (2001)
EMPOWER_DE
NSITY_2001_M
EAN_RZ
Mean value of empower density in the
Riparian Zone (RZ) of the HUC12 (in
units of solar equivalent Joules per
square meter per year). Empower density
is a measure of energy and material flow
within a given area over time and
provides a standarized measure for
quantifying the intensity of human
activity. Only includes nonrenewable
energy and material use including
electricity, fuels, fertilizers, pesticides,
and water. Souce data was a gridded
dataset of empower density developed by
EPA Region 4 using the NLCD 2006
Land Cover Dataset (Version 1) and
empower density conversions for various
land cover types reported in Brown and
Vivas (2005, Landscape Development
Intensity Index, Environmental
NLCD 2006 Land
Cover Dataset
(Version 1)
Removed

255
Monitoring and Assessment, Volume
101). (See also Riparian Zone glossary
definition).
PHWA
Watershed
Vulnerability
Index, State
(2016)
PHWA_VULN_
NDX_ST_2016
The statewide Watershed Vulnerability
Index score for the HUC12 from the
2016 EPA Preliminary Healthy
Watersheds Assessment (PHWA). The
Watershed Vulnerability Index
characterizes the vulnerability of aquatic
ecosystems in a watershed to future
alteration based on Land Use Change,
Water Use Change, and Wildfire
Vulnerability Sub-Index scores. Higher
scores correspond to greater potential
vulnerability of aquatic ecosystems to
future degradation. Source data were
statewide Watershed Vulnerability Index
scores for HUC12s developed as part of
the 2016 EPA Preliminary Healthy
Watersheds Assessment (February 8,
2017 version). (See also PHWA glossary
definition).
2016 EPA Preliminary
Healthy Watersheds
Assessment (February
8, 2017 version)
Removed

256
PHWA
Watershed
Vulnerability
Index, ER
(2016)
PHWA_VULN_
NDX_ER_2016
The ecoregional Watershed Vulnerability
Index score for the HUC12 from the
2016 EPA Preliminary Healthy
Watersheds Assessment (PHWA). The
Watershed Vulnerability Index
characterizes the vulnerability of aquatic
ecosystems in a watershed to future
alteration based on Land Use Change,
Water Use Change, and Wildfire
Vulnerability Sub-Index scores. Higher
scores correspond to greater potential
vulnerability of aquatic ecosystems to
future degradation. Source data were
ecoregional Watershed Vulnerability
Index scores for HUC12s developed as
part of the 2016 EPA Preliminary
Healthy Watersheds Assessment
(February 8, 2017 version). (See also
PHWA glossary definition).
2016 EPA Preliminary
Healthy Watersheds
Assessment (February
8, 2017 version)
Removed
PHWA Land
Use Vuln. Sub-
Index, State
(2016)
PHWA_LUVLN_
SUBNDX_ST_20
16
The statewide Land Use Vulnerability
Sub-Index score for the HUC12 from the
2016 EPA Preliminary Healthy
Watersheds Assessment (PHWA). The
Land Use Vulnerability Sub-Index
characterizes the vulnerability of aquatic
ecosystems in a HUC12 to land use
change based on recent (2001-2011) land
use change, projected changes in
impervious cover, and the extent of
protected lands in the watershed. Source
data were statewide Land Use
2016 EPA Preliminary
Healthy Watersheds
Assessment (February
8, 2017 version)
Removed

257
Vulnerability Sub-Index scores for
HUC12s developed as part of the 2016
EPA Preliminary Healthy Watersheds
Assessment (February 8, 2017 version).
(See also PHWA glossary definition).
PHWA Land
Use Vuln. Sub-
Index, ER
(2016)
PHWA_LUVLN_
SUBNDX_ER_20
16
The ecoregional Land Use Vulnerability
Sub-Index score for the HUC12 from the
2016 EPA Preliminary Healthy
Watersheds Assessment (PHWA). The
Land Use Vulnerability Sub-Index
characterizes the vulnerability of aquatic
ecosystems in a HUC12 to land use
change based on recent (2001-2011) land
use change, projected changes in
impervious cover, and the extent of
protected lands in the watershed. Source
data were ecoregional Land Use
Vulnerability Sub-Index scores for
HUC12s developed as part of the 2016
EPA Preliminary Healthy Watersheds
Assessment (February 8, 2017 version).
(See also PHWA glossary definition).
2016 EPA Preliminary
Healthy Watersheds
Assessment (February
8, 2017 version)
Removed
258
PHWA Water
Use Vuln. Sub-
Index, State
(2016)
PHWA_WUVLN
_SUBNDX_ST_2
016
The statewide Water Use Vulnerability
Sub-Index score for the HUC12 from the
2016 EPA Preliminary Healthy
Watersheds Assessment (PHWA). The
Water Use Vulnerability Sub-Index
characterizes the vulnerability of aquatic
ecosystems in a HUC12 to future
increases in water use based on recent
(2005) estimates of agricultural,
domestic, and industrial water use in the
HUC12. Source data were statewide
Water Use Vulnerability Sub-Index
scores for HUC12s developed as part of
the 2016 EPA Preliminary Healthy
Watersheds Assessment (February 8,
2017 version). (See also PHWA glossary
definition).
2016 EPA Preliminary
Healthy Watersheds
Assessment (February
8, 2017 version)
Removed
PHWA Water
Use Vuln. Sub-
Index, ER
(2016)
PHWA_WUVLN
_SUBNDX_ER_2
016
The ecoregional Water Use Vulnerability
Sub-Index score for the HUC12 from the
2016 EPA Preliminary Healthy
Watersheds Assessment (PHWA). The
Water Use Vulnerability Sub-Index
characterizes the vulnerability of aquatic
ecosystems in a HUC12 to future
increases in water use based on recent
(2005) estimates of agricultural,
domestic, and industrial water use in the
HUC12. Source data were ecoregional
Water Use Vulnerability Sub-Index
scores for HUC12s developed as part of
the 2016 EPA Preliminary Healthy
2016 EPA Preliminary
Healthy Watersheds
Assessment (February
8, 2017 version)
Removed

259
Watersheds Assessment (February 8,
2017 version). (See also PHWA glossary
definition).
PHWA
Wildfire Vuln.
Sub-Index,
State (2016)
PHWA_WFVLN
_SUBNDX_ST_2
016
The statewide Wildfire Vulnerability
Sub-Index score for the HUC12 from the
2016 EPA Preliminary Healthy
Watersheds Assessment (PHWA). The
Wildfire Vulnerability Sub-Index
characterizes the vulnerability of aquatic
ecosystems in a HUC12 to the effects of
intense wildfires based on a predictive
model of wildfire risk in the HUC12.
Source data were statewide Wildfire
Vulnerability Sub-Index scores for
HUC12s developed as part of the 2016
EPA Preliminary Healthy Watersheds
Assessment (February 8, 2017 version).
(See also PHWA glossary definition).
2016 EPA Preliminary
Healthy Watersheds
Assessment (February
8, 2017 version)
Removed
PHWA
Wildfire Vuln.
Sub-Index, ER
(2016)
PHWA_WFVLN
_SUBNDX_ER_2
016
The ecoregional Wildfire Vulnerability
Sub-Index score for the HUC12 from the
2016 EPA Preliminary Healthy
Watersheds Assessment (PHWA). The
Wildfire Vulnerability Sub-Index
characterizes the vulnerability of aquatic
ecosystems in a HUC12 to the effects of
2016 EPA Preliminary
Healthy Watersheds
Assessment (February
8, 2017 version)
Removed

260
intense wildfires based on a predictive
model of wildfire risk in the HUC12.
Source data were ecoregional Wildfire
Vulnerability Sub-Index scores for
HUC12s developed as part of the 2016
EPA Preliminary Healthy Watersheds
Assessment (February 8, 2017 version).
(See also PHWA glossary definition).
%
Imperviousness,
Mean in WS
(2011)
PCT_IMPERVIO
USNESS2011_M
EAN_WS
Percent of the HUC12 with developed
impervious cover. Source data was the
2011 National Land Cover Database
(NLCD) Percent Developed
Imperviousness dataset (October 2014
version;
http://www.mrlc.gov/nlcd11_data.php).
Calculated as the mean value of percent
developed imperviousness in the
HUC12.
2011 NLCD Percent
Developed
Imperviousness
(October 2014
version). HUC12
Version: NHDPlus
WBD Snapshot,
EnviroAtlas Version
(February 2015
version).
None
Impervious
Cover Projected
Change (2010-
2050)
ICLUS_IC_DIFF
_PCT
The projected change in the percentage
of impervious surface cover in the
HUC12 from 2010 to 2050. Source data
was the Integrated Climate and Land-Use
Scenarios (ICLUS) Percent Impervious
Surface Projection geospatial dataset for
the baseline scenario
(http://www.epa.gov/iclus/iclus-
downloads#tab-1; Version 1.3;
downloaded October 2015 ). The ICLUS
Percent Impervious Surface Projection
dataset is comprised of national grids of
percent impervious cover at 1 kilometer
EPA Integrated
Climate and Land Use
Scenarios (ICLUS)
"Percent Impervious
Surface Projection"
grids for 2010 and
2050 baseline
population growth
scenario. Published
September 21, 2010.
HUC12 Version:
NHDPlus2 WBD
Snapshot, EnviroAtlas
Removed

261
resolution for each decade from 2010 to
2100. Mean percent impervious cover in
2010 and 2050 was calculated for each
HUC12 from ICLUS grids. The
projected change in impervious surface
was then calculated by subtracting 2010
mean percent impervious cover from
2050 mean percent impervious cover.
For more information on ICLUS data
see:
https://edg.epa.gov/metadata/rest/docume
nt?id=%7B4D34EB4D-FDD9-4612-
98DE-
3C723B6B0095%7D&xsl=metadata_to_
html_full.
Version (February
2015 version).
Proximity
Waters to ≥ 5%
Impervious
Cover (2011)
Dif5p_11 Relative proximity of areas with at least
5% impervious cover to streams and
lakeshores in the HUC12. Calculated as
the percent of stream and lakeshore
length in the HUC12 that is near (within
30 meters of) ≥5% impervious cover
minus the percent of the HUC12 with
≥15% impervious cover. Higher values
imply that impervious cover in the
HUC12 is more concentrated near
surface waters. Impervious cover source
data was the National Land Cover
Database 2011 (NLCD 2011) Percent
Developed Imperviousness dataset; a
national grid of percent imperviousness
at the 30 meter scale
Based on analysis of
the proximity of
impervious cover to
water features done by
EPA using NLCD
2011 Percent
Developed
Imperviousness
dataset (October 2014
version) and
NHDPlus2 NHD
Snapshot (downloaded
June 2014).
Removed

262
(http://www.mrlc.gov/nlcd11_data.php;
October 2014 version). Stream and
lakeshore location source data was the
NHDPlus2 NHD Snapshot (downloaded
June 2014). Streams were defined as
linear features in the NHD Snapshot with
FCODE (feature code) equal to 33400,
46000, 46003, 46006, or 46007; and
polygon features with FCODE equal to
46003 or 46006. Lakeshores were
defined as the perimeter of polygon
features in the NHD Snapshot with
FCODE (feature code) equal to 39001,
39004, 39009, 39010, 43600, or 43601.
(See also NHD Snapshot glossary
definition).
% Waters Near
≥ 5%
Impervious
Cover (2011)
strlak5p_11 Percent of stream and lakeshore length in
the HUC12 that is within 30 meters of
areas with greater than or equal to 5%
impervious cover. Impervious cover
source data was the National Land Cover
Database 2011 (NLCD 2011) Percent
Developed Imperviousness dataset; a
national grid of percent imperviousness
at the 30 meter scale
(http://www.mrlc.gov/nlcd11_data.php;
October 2014 version). Stream and
lakeshore location source data was the
NHDPlus2 NHD Snapshot (downloaded
June 2014). Streams were defined as
linear features in the NHD Snapshot with
Based on analysis of
the proximity of
impervious cover to
water features done by
EPA using NLCD
2011 Percent
Developed
Imperviousness
dataset (October 2014
version) and
NHDPlus2 NHD
Snapshot (downloaded
June 2014).
Removed

263
FCODE (feature code) equal to 33400,
46000, 46003, 46006, or 46007; and
polygon features with FCODE equal to
46003 or 46006. Lakeshores were
defined as the perimeter of polygon
features in the NHD Snapshot with
FCODE (feature code) equal to 39001,
39004, 39009, 39010, 43600, or 43601.
Calculated as the length of streams and
lakeshores in the NHD Snapshot that are
within 30 meters of grid pixels with
greater than or equal to 5% impervious
cover, divided by the total stream and
lakeshore length in the HUC12,
multiplied by 100. (See also NHD
Snapshot glossary definition).

264
Proximity
Waters to ≥
15%
Impervious
Cover (2011)
Dif15p_11 Relative proximity of areas with at least
15% impervious cover to streams and
lakeshores in the HUC12. Calculated as
the percent of stream and lakeshore
length in the HUC12 that is near (within
30 meters) of ≥15% impervious cover
minus the percent of the HUC12 with
≥15% impervious cover. Higher values
imply that impervious cover in the
HUC12 is more concentrated near
surface waters. Impervious cover source
data was the National Land Cover
Database 2011 (NLCD 2011) Percent
Developed Imperviousness dataset; a
national grid of percent imperviousness
at the 30 meter scale
(http://www.mrlc.gov/nlcd11_data.php;
October 2014 version). Stream and
lakeshore location source data was the
NHDPlus2 NHD Snapshot (downloaded
June 2014). Streams were defined as
linear features in the NHD Snapshot with
FCODE (feature code) equal to 33400,
46000, 46003, 46006, or 46007; and
polygon features with FCODE equal to
46003 or 46006. Lakeshores were
defined as the perimeter of polygon
features in the NHD Snapshot with
FCODE (feature code) equal to 39001,
39004, 39009, 39010, 43600, or 43601.
Based on analysis of
the proximity of
impervious cover to
water features done by
EPA using NLCD
2011 Percent
Developed
Imperviousness
dataset (October 2014
version) and
NHDPlus2 NHD
Snapshot (downloaded
June 2014).
Removed

265
(See also NHD Snapshot glossary
definition).
Length Waters
Near ≥ 5%
Impervious
Cover (2011)
strlak5L_11 Stream and lakeshore length in the
HUC12 that is within 30 meters of areas
with greater than or equal to 5%
impervious cover. Impervious cover
source data was the National Land Cover
Database 2011 (NLCD 2011) Percent
Developed Imperviousness dataset; a
national grid of percent imperviousness
at the 30 meter scale
(http://www.mrlc.gov/nlcd11_data.php;
October 2014 version). Stream and
lakeshore location source data was the
NHDPlus2 NHD Snapshot (downloaded
June 2014). Streams were defined as
linear features in the NHD Snapshot with
Based on analysis of
the proximity of
impervious cover to
water features done by
EPA using NLCD
2011 Percent
Developed
Imperviousness
dataset (October 2014
version) and
NHDPlus2 NHD
Snapshot (downloaded
June 2014).
Removed

266
FCODE (feature code) equal to 33400,
46000, 46003, 46006, or 46007; and
polygon features with FCODE equal to
46003 or 46006. Lakeshores were
defined as the perimeter of polygon
features in the NHD Snapshot with
FCODE (feature code) equal to 39001,
39004, 39009, 39010, 43600, or 43601.
Calculated as the length of streams and
lakeshores in the NHD Snapshot that are
within 30 meters of grid pixels with
greater than or equal to 5% impervious
cover. (See also NHD Snapshot glossary
definition).
% Waters Near
≥ 15%
Impervious
Cover (2011)
strlak15p_11 Percent of stream and lakeshore length in
the HUC12 that is within 30 meters of
areas with greater than or equal to 15%
impervious cover. Impervious cover
source data was the National Land Cover
Database 2011 (NLCD 2011) Percent
Developed Imperviousness dataset; a
national grid of percent imperviousness
at the 30 meter scale
(http://www.mrlc.gov/nlcd11_data.php;
October 2014 version). Stream and
lakeshore location source data was the
NHDPlus2 NHD Snapshot (downloaded
June 2014). Streams were defined as
linear features in the NHD Snapshot with
FCODE (feature code) equal to 33400,
46000, 46003, 46006, or 46007; and
Based on analysis of
the proximity of
impervious cover to
water features done by
EPA using NLCD
2011 Percent
Developed
Imperviousness
dataset (October 2014
version) and
NHDPlus2 NHD
Snapshot (downloaded
June 2014).
Removed

267
polygon features with FCODE equal to
46003 or 46006. Lakeshores were
defined as the perimeter of polygon
features in the NHD Snapshot with
FCODE (feature code) equal to 39001,
39004, 39009, 39010, 43600, or 43601.
Calculated as the length of streams and
lakeshores in the NHD Snapshot that are
within 30 meters of grid pixels with
greater than or equal to 15% impervious
cover, divided by the total stream and
lakeshore length in the HUC12,
multiplied by 100. (See also NHD
Snapshot glossary definition).
Length Waters
Near ≥15%
Impervious
Cover (2011)
strlak15L_11 Stream and lakeshore length in the
HUC12 that is within 30 meters of areas
with greater than or equal to 15%
impervious cover (kilometers).
Impervious cover source data was the
National Land Cover Database 2011
(NLCD 2011) Percent Developed
Imperviousness dataset; a national grid
of percent imperviousness at the 30
meter scale
(http://www.mrlc.gov/nlcd11_data.php;
October 2014 version). Stream and
lakeshore location source data was the
NHDPlus2 NHD Snapshot (downloaded
June 2014). Streams were defined as
linear features in the NHD Snapshot with
Based on analysis of
the proximity of
impervious cover to
water features done by
EPA using NLCD
2011 Percent
Developed
Imperviousness
dataset (October 2014
version) and
NHDPlus2 NHD
Snapshot (downloaded
June 2014).
Removed

268
FCODE (feature code) equal to 33400,
46000, 46003, 46006, or 46007; and
polygon features with FCODE equal to
46003 or 46006. Lakeshores were
defined as the perimeter of polygon
features in the NHD Snapshot with
FCODE (feature code) equal to 39001,
39004, 39009, 39010, 43600, or 43601.
Calculated as the length of streams and
lakeshores in the NHD Snapshot that are
within 30 meters of grid pixels with
greater than or equal to 15% impervious
cover. (See also NHD Snapshot glossary
definition).
Streamlength
Near ≥ 5%
Impervious
Cover (2011)
str5L_11 Streamlength in the HUC12 that is within
30 meters of areas with greater than or
equal to 5% impervious cover.
Impervious cover source data was the
National Land Cover Database 2011
(NLCD 2011) Percent Developed
Imperviousness dataset; a national grid
of percent imperviousness at the 30
meter scale
(http://www.mrlc.gov/nlcd11_data.php;
October 2014 version). Stream location
source data was the NHDPlus2 NHD
Snapshot (downloaded June 2014).
Streams were defined as linear features
in the NHD Snapshot with FCODE
(feature code) equal to 33400, 46000,
46003, 46006, or 46007; and polygon
Based on analysis of
the proximity of
impervious cover to
water features done by
EPA using NLCD
2011 Percent
Developed
Imperviousness
dataset (October 2014
version) and
NHDPlus2 NHD
Snapshot (downloaded
June 2014).
Removed

269
features with FCODE equal to 46003 or
46006. Calculated as the length of
streams in the NHD Snapshot that are
within 30 meters of grid pixels with
greater than or equal to 5% impervious
cover. (See also NHD Snapshot glossary
definition).
% Streamlength
Near ≥ 5%
Impervious
Cover (2011)
str5p_11 Percent of streamlength in the HUC12
that is within 30 meters of areas with
greater than or equal to 5% impervious
cover. Impervious cover source data was
the National Land Cover Database 2011
(NLCD 2011) Percent Developed
Imperviousness dataset; a national grid
of percent imperviousness at 30-meter
resolution
(http://www.mrlc.gov/nlcd11_data.php;
October 2014 version). Stream location
source data was the NHDPlus2 NHD
Snapshot (downloaded June 2014).
Streams were defined as linear features
in the NHD Snapshot with FCODE
(feature code) equal to 33400, 46000,
46003, 46006, or 46007; and polygon
features with FCODE equal to 46003 or
46006. Calculated as the length of
Based on analysis of
the proximity of
impervious cover to
water features done by
EPA using NLCD
2011 Percent
Developed
Imperviousness
dataset (October 2014
version) and
NHDPlus2 NHD
Snapshot (downloaded
June 2014).
Removed
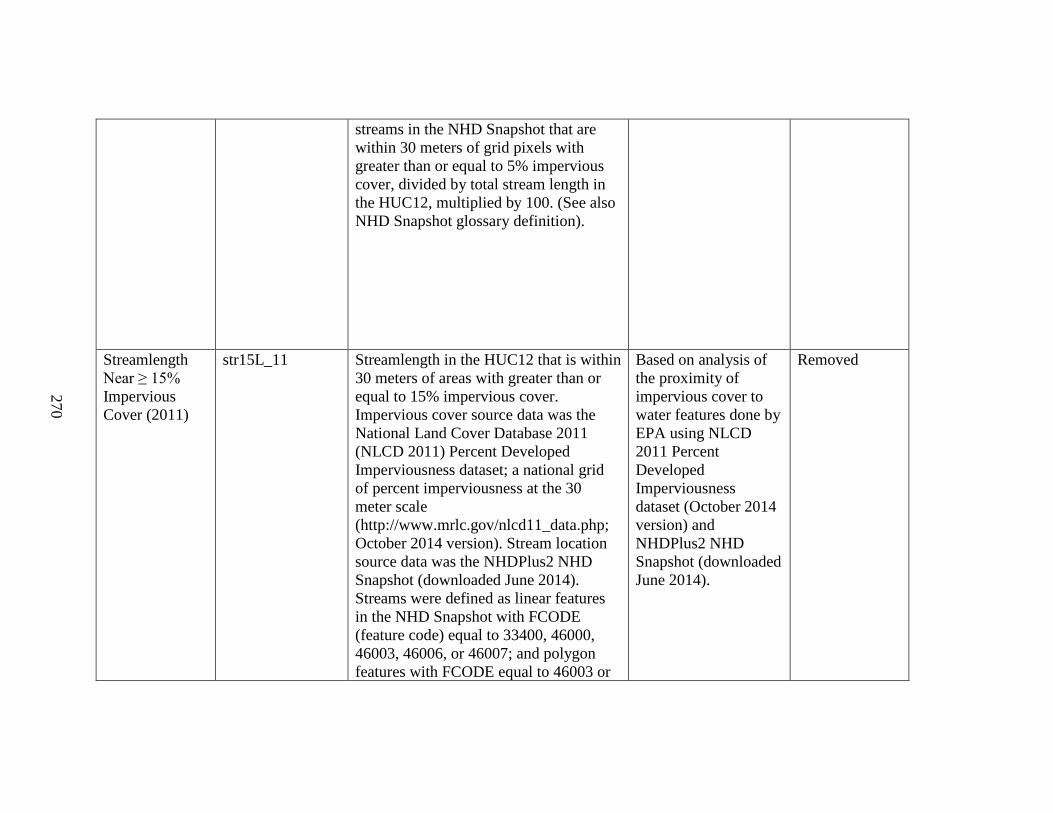
270
streams in the NHD Snapshot that are
within 30 meters of grid pixels with
greater than or equal to 5% impervious
cover, divided by total stream length in
the HUC12, multiplied by 100. (See also
NHD Snapshot glossary definition).
Streamlength
Near ≥ 15%
Impervious
Cover (2011)
str15L_11 Streamlength in the HUC12 that is within
30 meters of areas with greater than or
equal to 15% impervious cover.
Impervious cover source data was the
National Land Cover Database 2011
(NLCD 2011) Percent Developed
Imperviousness dataset; a national grid
of percent imperviousness at the 30
meter scale
(http://www.mrlc.gov/nlcd11_data.php;
October 2014 version). Stream location
source data was the NHDPlus2 NHD
Snapshot (downloaded June 2014).
Streams were defined as linear features
in the NHD Snapshot with FCODE
(feature code) equal to 33400, 46000,
46003, 46006, or 46007; and polygon
features with FCODE equal to 46003 or
Based on analysis of
the proximity of
impervious cover to
water features done by
EPA using NLCD
2011 Percent
Developed
Imperviousness
dataset (October 2014
version) and
NHDPlus2 NHD
Snapshot (downloaded
June 2014).
Removed

271
46006. Calculated as the length of
streams in the NHD Snapshot that are
within 30 meters of grid pixels with
greater than or equal to 15% impervious
cover. (See also NHD Snapshot glossary
definition).
% Streamlength
Near ≥ 15%
Impervious
Cover (2011)
str15p_11 Percent of streamlength in the HUC12
that is within 30 meters of areas with
greater than or equal to 15% impervious
cover. Impervious cover source data was
the National Land Cover Database 2011
(NLCD 2011) Percent Developed
Imperviousness dataset; a national grid
of percent imperviousness at 30-meter
resolution
(http://www.mrlc.gov/nlcd11_data.php;
October 2014 version). Stream location
source data was the NHDPlus2 NHD
Snapshot (downloaded June 2014).
Streams were defined as linear features
in the NHD Snapshot with FCODE
(feature code) equal to 33400, 46000,
46003, 46006, or 46007; and polygon
features with FCODE equal to 46003 or
46006. Calculated as the length of
Based on analysis of
the proximity of
impervious cover to
water features done by
EPA using NLCD
2011 Percent
Developed
Imperviousness
dataset (October 2014
version) and
NHDPlus2 NHD
Snapshot (downloaded
June 2014).
Removed

272
streams in the NHD Snapshot that are
within 30 meters of grid pixels with
greater than or equal to 15% impervious
cover, divided by total stream length in
the HUC12, multiplied by 100. (See also
NHD Snapshot glossary definition).
Lakeshore Near
≥ 5%
Impervious
Cover (2011)
lak5L_11 Lakeshore length in the HUC12 that is
within 30 meters of areas with greater
than or equal to 5% impervious cover
(kilometers). Impervious cover source
data was the National Land Cover
Database 2011 (NLCD 2011) Percent
Developed Imperviousness dataset; a
national grid of percent imperviousness
at the 30 meter scale
(http://www.mrlc.gov/nlcd11_data.php;
October 2014 version). Lakeshore
location source data was the NHDPlus2
NHD Snapshot (downloaded June 2014).
Lakeshores were defined as the perimeter
of polygon features in the NHD Snapshot
with FCODE (feature code) equal to
39001, 39004, 39009, 39010, 43600, or
43601. Calculated as the length of
Based on analysis of
the proximity of
impervious cover to
water features done by
EPA using NLCD
2011 Percent
Developed
Imperviousness
dataset (October 2014
version) and
NHDPlus2 NHD
Snapshot (downloaded
June 2014).
Removed
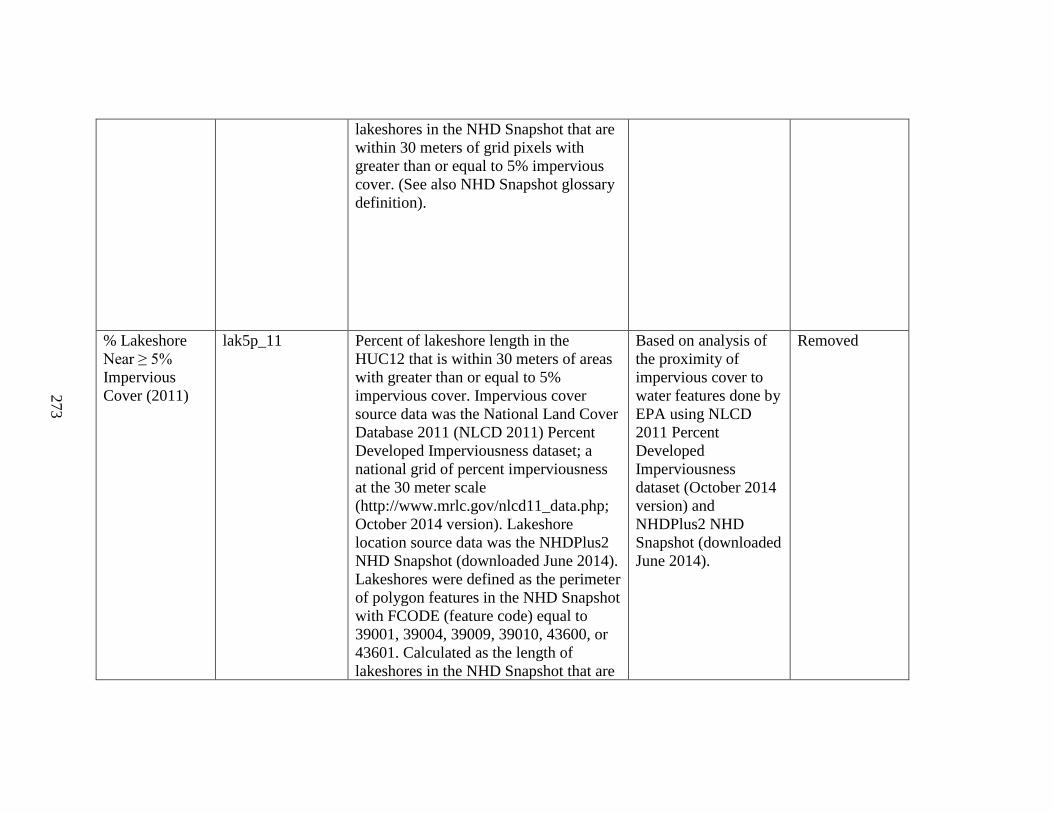
273
lakeshores in the NHD Snapshot that are
within 30 meters of grid pixels with
greater than or equal to 5% impervious
cover. (See also NHD Snapshot glossary
definition).
% Lakeshore
Near ≥ 5%
Impervious
Cover (2011)
lak5p_11 Percent of lakeshore length in the
HUC12 that is within 30 meters of areas
with greater than or equal to 5%
impervious cover. Impervious cover
source data was the National Land Cover
Database 2011 (NLCD 2011) Percent
Developed Imperviousness dataset; a
national grid of percent imperviousness
at the 30 meter scale
(http://www.mrlc.gov/nlcd11_data.php;
October 2014 version). Lakeshore
location source data was the NHDPlus2
NHD Snapshot (downloaded June 2014).
Lakeshores were defined as the perimeter
of polygon features in the NHD Snapshot
with FCODE (feature code) equal to
39001, 39004, 39009, 39010, 43600, or
43601. Calculated as the length of
lakeshores in the NHD Snapshot that are
Based on analysis of
the proximity of
impervious cover to
water features done by
EPA using NLCD
2011 Percent
Developed
Imperviousness
dataset (October 2014
version) and
NHDPlus2 NHD
Snapshot (downloaded
June 2014).
Removed

274
within 30 meters of grid pixels with
greater than or equal to 5% impervious
cover, divided by the total lakeshore
length in the HUC12, multiplied by 100.
(See also NHD Snapshot glossary
definition).
Lakeshore Near
≥ 15%
Impervious
Cover (2011)
lak15L_11 Lakeshore length in the HUC12 that is
within 30 meters of areas with greater
than or equal to 15% impervious cover
(kilometers). Impervious cover source
data was the National Land Cover
Database 2011 (NLCD 2011) Percent
Developed Imperviousness dataset; a
national grid of percent imperviousness
at the 30 meter scale
(http://www.mrlc.gov/nlcd11_data.php;
October 2014 version). Lakeshore
location source data was the NHDPlus2
NHD Snapshot (downloaded June 2014).
Lakeshores were defined as the perimeter
of polygon features in the NHD Snapshot
with FCODE (feature code) equal to
39001, 39004, 39009, 39010, 43600, or
43601. Calculated as the length of
lakeshores in the NHD Snapshot that are
Based on analysis of
the proximity of
impervious cover to
water features done by
EPA using NLCD
2011 Percent
Developed
Imperviousness
dataset (October 2014
version) and
NHDPlus2 NHD
Snapshot (downloaded
June 2014).
Removed

275
within 30 meters of grid pixels with
greater than or equal to 15% impervious
cover. (See also NHD Snapshot glossary
definition).
% Lakeshore
Near ≥ 15%
Impervious
Cover (2011)
lak15p_11 Percent of lakeshore length in the
HUC12 that is within 30 meters of areas
with greater than or equal to 15%
impervious cover. Impervious cover
source data was the National Land Cover
Database 2011 (NLCD 2011) Percent
Developed Imperviousness dataset; a
national grid of percent imperviousness
at the 30 meter scale
(http://www.mrlc.gov/nlcd11_data.php;
October 2014 version). Lakeshore
location source data was the NHDPlus2
NHD Snapshot (downloaded June 2014).
Lakeshores were defined as the perimeter
of polygon features in the NHD Snapshot
with FCODE (feature code) equal to
39001, 39004, 39009, 39010, 43600, or
43601. Calculated as the length of
lakeshores in the NHD Snapshot that are
Based on analysis of
the proximity of
impervious cover to
water features done by
EPA using NLCD
2011 Percent
Developed
Imperviousness
dataset (October 2014
version) and
NHDPlus2 NHD
Snapshot (downloaded
June 2014).
Removed
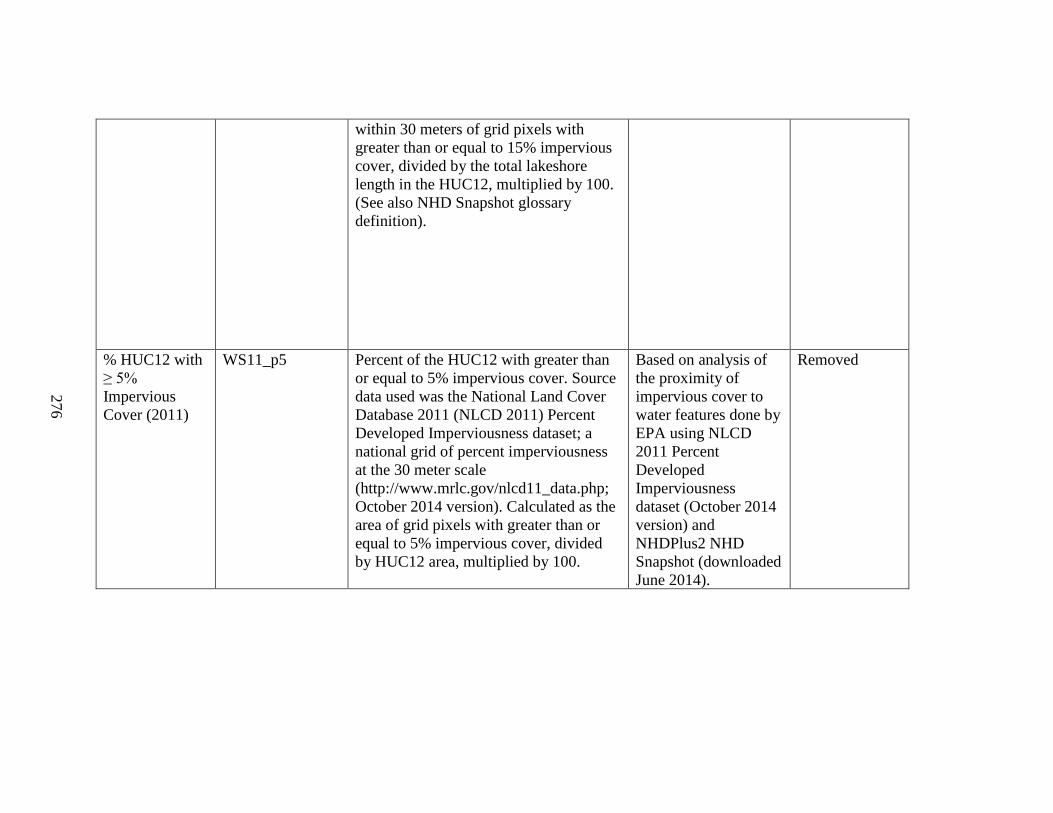
276
within 30 meters of grid pixels with
greater than or equal to 15% impervious
cover, divided by the total lakeshore
length in the HUC12, multiplied by 100.
(See also NHD Snapshot glossary
definition).
% HUC12 with
≥ 5%
Impervious
Cover (2011)
WS11_p5 Percent of the HUC12 with greater than
or equal to 5% impervious cover. Source
data used was the National Land Cover
Database 2011 (NLCD 2011) Percent
Developed Imperviousness dataset; a
national grid of percent imperviousness
at the 30 meter scale
(http://www.mrlc.gov/nlcd11_data.php;
October 2014 version). Calculated as the
area of grid pixels with greater than or
equal to 5% impervious cover, divided
by HUC12 area, multiplied by 100.
Based on analysis of
the proximity of
impervious cover to
water features done by
EPA using NLCD
2011 Percent
Developed
Imperviousness
dataset (October 2014
version) and
NHDPlus2 NHD
Snapshot (downloaded
June 2014).
Removed

277
% HUC12 with
≥ 15%
Impervious
Cover (2011)
WS11_p15 Percent of the HUC12 with greater than
or equal to 15% impervious cover.
Source data used was the National Land
Cover Database 2011 (NLCD 2011)
Percent Developed Imperviousness
dataset; a national grid of percent
imperviousness at the 30 meter scale
(http://www.mrlc.gov/nlcd11_data.php;
October 2014 version). Calculated as the
area of grid pixels with greater than or
equal to 15% impervious cover, divided
by HUC12 area, multiplied by 100.
Based on analysis of
the proximity of
impervious cover to
water features done by
EPA using NLCD
2011 Percent
Developed
Imperviousness
dataset (October 2014
version) and
NHDPlus2 NHD
Snapshot (downloaded
June 2014).
Removed
%
Imperviousness,
Median in WS
(2011)
PCT_IMPERVIO
USNESS2011_M
ED_WS
The median value of percent developed
impervious cover in the HUC12. Source
data was the 2011 National Land Cover
Database (NLCD) Percent Developed
Imperviousness dataset (October 2014
version;
http://www.mrlc.gov/nlcd11_data.php).
Calculated as the median of percent
developed imperviousness for grid cells
in the HUC12.
2011 NLCD Percent
Developed
Imperviousness
(October 2014
version). HUC12
Version: NHDPlus
WBD Snapshot,
EnviroAtlas Version
(February 2015
version).
Removed
%
Imperviousness,
Standard
Deviation in
WS (2011)
PCT_IMPERVIO
USNESS2011_ST
D_WS
The standard deviation of percent
developed impervious cover in the
HUC12. Source data was the 2011
National Land Cover Database (NLCD)
Percent Developed Imperviousness
dataset (October 2014 version;
http://www.mrlc.gov/nlcd11_data.php).
Calculated as the standard deviation of
2011 NLCD Percent
Developed
Imperviousness
(October 2014
version). HUC12
Version: NHDPlus
WBD Snapshot,
EnviroAtlas Version
Removed

278
percent developed imperviousness for
grid cells in the HUC12.
(February 2015
version).
%
Imperviousness,
Sum in WS
(2011)
PCT_IMPERVIO
USNESS2011_S
UM_WS
The sum of percent developed
impervious cover in the HUC12. Source
data was the 2011 National Land Cover
Database (NLCD) Percent Developed
Imperviousness dataset (October 2014
version;
http://www.mrlc.gov/nlcd11_data.php).
Calculated as the sum of percent
developed imperviousness for grid cells
in the HUC12.
2011 NLCD Percent
Developed
Imperviousness
(October 2014
version). HUC12
Version: NHDPlus
WBD Snapshot,
EnviroAtlas Version
(February 2015
version).
Removed
%
Imperviousness,
Minimum in
WS (2011)
PCT_IMPERVIO
USNESS2011_M
IN_WS
The minimum value of percent
developed impervious cover in the
HUC12. Source data was the 2011
National Land Cover Database (NLCD)
Percent Developed Imperviousness
dataset (October 2014 version;
http://www.mrlc.gov/nlcd11_data.php).
Calculated as the minimum of percent
developed imperviousness for grid cells
in the HUC12.
2011 NLCD Percent
Developed
Imperviousness
(October 2014
version). HUC12
Version: NHDPlus
WBD Snapshot,
EnviroAtlas Version
(February 2015
version).
Removed
%
Imperviousness,
Maximum in
WS (2011)
PCT_IMPERVIO
USNESS2011_M
AX_WS
The maximum value of percent
developed impervious cover in the
HUC12. Source data was the 2011
National Land Cover Database (NLCD)
Percent Developed Imperviousness
2011 NLCD Percent
Developed
Imperviousness
(October 2014
version). HUC12
Removed
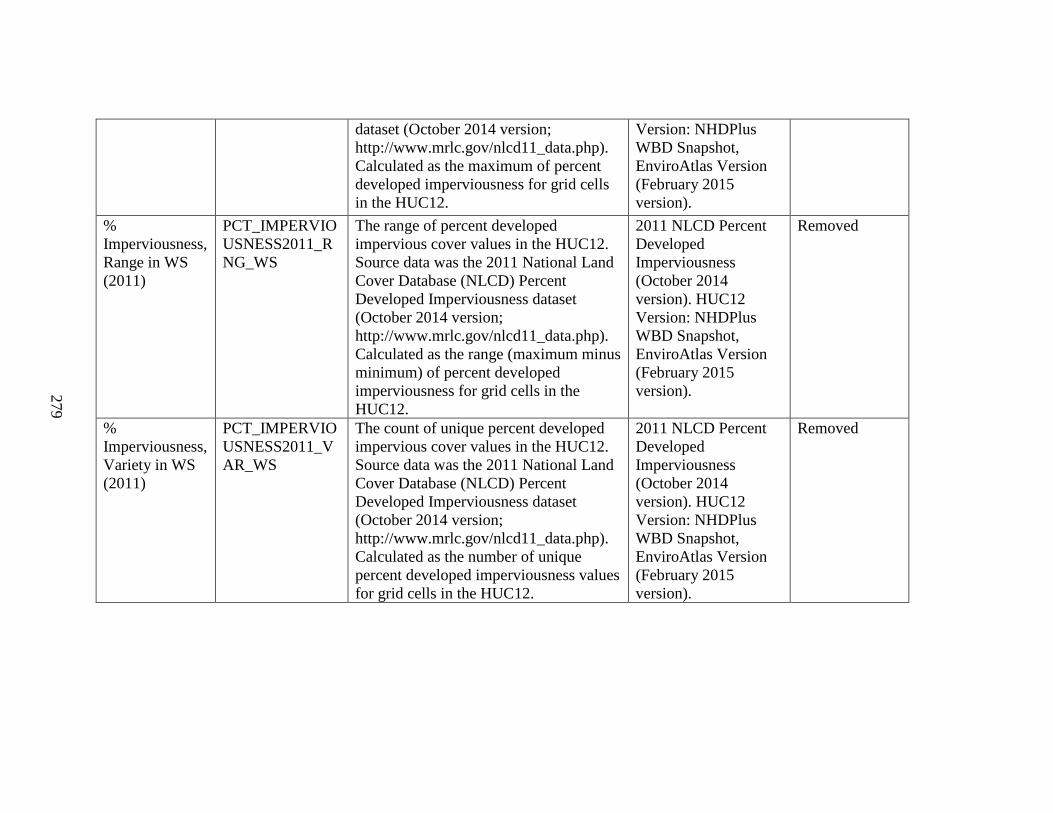
279
dataset (October 2014 version;
http://www.mrlc.gov/nlcd11_data.php).
Calculated as the maximum of percent
developed imperviousness for grid cells
in the HUC12.
Version: NHDPlus
WBD Snapshot,
EnviroAtlas Version
(February 2015
version).
%
Imperviousness,
Range in WS
(2011)
PCT_IMPERVIO
USNESS2011_R
NG_WS
The range of percent developed
impervious cover values in the HUC12.
Source data was the 2011 National Land
Cover Database (NLCD) Percent
Developed Imperviousness dataset
(October 2014 version;
http://www.mrlc.gov/nlcd11_data.php).
Calculated as the range (maximum minus
minimum) of percent developed
imperviousness for grid cells in the
HUC12.
2011 NLCD Percent
Developed
Imperviousness
(October 2014
version). HUC12
Version: NHDPlus
WBD Snapshot,
EnviroAtlas Version
(February 2015
version).
Removed
%
Imperviousness,
Variety in WS
(2011)
PCT_IMPERVIO
USNESS2011_V
AR_WS
The count of unique percent developed
impervious cover values in the HUC12.
Source data was the 2011 National Land
Cover Database (NLCD) Percent
Developed Imperviousness dataset
(October 2014 version;
http://www.mrlc.gov/nlcd11_data.php).
Calculated as the number of unique
percent developed imperviousness values
for grid cells in the HUC12.
2011 NLCD Percent
Developed
Imperviousness
(October 2014
version). HUC12
Version: NHDPlus
WBD Snapshot,
EnviroAtlas Version
(February 2015
version).
Removed

280
%
Imperviousness,
Majority in WS
(2011)
PCT_IMPERVIO
USNESS2011_M
AJR_WS
The most common value of percent
developed impervious cover in the
HUC12. Source data was the 2011
National Land Cover Database (NLCD)
Percent Developed Imperviousness
dataset (October 2014 version;
http://www.mrlc.gov/nlcd11_data.php).
Calculated as the most frequent value of
percent developed imperviousness for
grid cells in the HUC12.
2011 NLCD Percent
Developed
Imperviousness
(October 2014
version). HUC12
Version: NHDPlus
WBD Snapshot,
EnviroAtlas Version
(February 2015
version).
Removed
%
Imperviousness,
Minority in WS
(2011)
PCT_IMPERVIO
USNESS2011_M
INR_WS
The least common value of percent
developed impervious cover in the
HUC12. Source data was the 2011
National Land Cover Database (NLCD)
Percent Developed Imperviousness
dataset (October 2014 version;
http://www.mrlc.gov/nlcd11_data.php).
Calculated as the least frequent value of
percent developed imperviousness for
grid cells in the HUC12.
2011 NLCD Percent
Developed
Imperviousness
(October 2014
version). HUC12
Version: NHDPlus
WBD Snapshot,
EnviroAtlas Version
(February 2015
version).
Removed
Soil Erodibility,
Mean in WS
WS_KFACTOR Average soil erodibility (K) factor in the
HUC12. Source data was a 100-meter
resolution grid of soil map units and
attributes in the Natural Resources
Conservation Service (NRCS) Soil
Survey Geographic (STATSGO2)
database, acquired from the US
Geological Survey in July 2013.
Calculated as the mean of soil erodibility
values in the HUC12.
NRCS Soil Survey
Geographic
(STATSGO2)
database, acquired
from the US
Geological Survey
(USGS) in July 2013.
HUC12 Version:
NHDPlus2 WBD
Snapshot (Version
03).
None

281
Soil Erodibility,
Mean in HCZ
HCZ_KFACTOR Average soil erodibility (K) factor in the
Hydrologically Connected Zone (HCZ)
of the HUC12. Source data was a 100-
meter resolution grid of soil map units
and attributes in the Natural Resources
Conservation Service (NRCS) Soil
Survey Geographic (STATSGO2)
database, acquired from the US
Geological Survey in July 2013.
Calculated as the mean of soil erodibility
values in the Hydrologically Connected
Zone of the HUC12. (See also
Hydrologically Connected Zone glossary
definition).
NRCS Soil Survey
Geographic
(STATSGO2)
database, acquired
from the US
Geological Survey
(USGS) in July 2013.
HUC12 Version:
NHDPlus2 WBD
Snapshot (Version
03).
Removed
Population in
WS
DASYMETRIC_
POPULATION_
WS
Human population in the HUC12
(number of persons). Source data used
was the EPA EnviroAtlas "Dasymetric
Population for the Conterminous United
States" raster (February 2015 version;
https://enviroatlas.epa.gov/enviroatlas/Da
taFactSheets/pdf/Supplemental/Dasymetr
icAllocationofPopulation.pdf). The
dasymetric population raster is derived
from 2010 US Census Bureau census
block populations using a geospatial
technique called dasymetric mapping.
Dasymetric mapping uses information on
land cover and slope to distribute
populations to grid pixels within each
census block.
EPA EnviroAtlas
"Dasymetric
Population for the
Conterminous United
States" grid, February
2015 version. HUC12
Version: NHDPlus2
WBD Snapshot,
EnviroAtlas Version
(February 2015
version).
Removed

282
Population
Density in WS
DASYMETRIC_
POPULATION_
DEN_WS
Human population density in the land
area of the HUC12 (persons per square
kilometer). Source data used was the
EPA EnviroAtlas "Dasymetric
Population for the Conterminous United
States" raster (February 2015 version;
https://enviroatlas.epa.gov/enviroatlas/Da
taFactSheets/pdf/Supplemental/Dasymetr
icAllocationofPopulation.pdf). The
dasymetric population raster is derived
from 2010 US Census Bureau census
block populations using a geospatial
technique called dasymetric mapping.
Dasymetric mapping uses information on
land cover and slope to distribute
populations to grid pixels within each
census block. Equation used: Human
Population in HUC12 / (HUC12 Area -
Water Mask Area). (See also Water
Mask glossary definition).
EPA EnviroAtlas
"Dasymetric
Population for the
Conterminous United
States" grid, February
2015 version. HUC12
Version: NHDPlus2
WBD Snapshot,
EnviroAtlas Version
(February 2015
version).
None
Population in
RZ
DASYMETRIC_
POPULATION_
RZ
Human population in the Riparian Zone
(RZ) of the HUC12 (number of persons).
Source data used was the EPA
EnviroAtlas "Dasymetric Population for
the Conterminous United States" raster
(February 2015 version;
https://enviroatlas.epa.gov/enviroatlas/Da
taFactSheets/pdf/Supplemental/Dasymetr
icAllocationofPopulation.pdf). The
dasymetric population raster is derived
from 2010 US Census Bureau census
EPA EnviroAtlas
"Dasymetric
Population for the
Conterminous United
States" grid (February
2015 version) and RZ
Grid (August 2015
Version). HUC12
Version: NHDPlus2
WBD Snapshot,
EnviroAtlas Version
Removed

283
block populations using a geospatial
technique called dasymetric mapping.
Dasymetric mapping uses information on
land cover and slope to distribute
populations to grid pixels within each
census block.
(February 2015
version).
Population
Density in RZ
DASYMETRIC_
POPULATION_
DEN_RZ
Human population density in the land
area of the Riparian Zone (RZ) of the
HUC12 (persons per square kilometer).
Source data used was the EPA
EnviroAtlas "Dasymetric Population for
the Conterminous United States" raster
(February 2015 version;
https://enviroatlas.epa.gov/enviroatlas/Da
taFactSheets/pdf/Supplemental/Dasymetr
icAllocationofPopulation.pdf). The
dasymetric population raster is derived
from 2010 US Census Bureau census
block populations using a geospatial
technique called dasymetric mapping.
Dasymetric mapping uses information on
land cover and slope to distribute
populations to grid pixels within each
census block. Equation used: Human
Population in RZ / (RZ Area - RZ Water
Mask Area). (See also Riparian Zone and
Water Mask glossary definitions).
EPA EnviroAtlas
"Dasymetric
Population for the
Conterminous United
States" grid (February
2015 version) and RZ
Grid (August 2015
Version). HUC12
Version: NHDPlus2
WBD Snapshot,
EnviroAtlas Version
(February 2015
version).
Removed

284
% Population in
RZ
DASYMETRIC_
POPULATION_P
CT_RZ
Percent of human population residing in
the Riparian Zone (RZ) of the HUC12.
Source data used was the EPA
EnviroAtlas "Dasymetric Population for
the Conterminous United States" raster
(February 2015 version;
https://enviroatlas.epa.gov/enviroatlas/Da
taFactSheets/pdf/Supplemental/Dasymetr
icAllocationofPopulation.pdf). The
dasymetric population raster is derived
from 2010 US Census Bureau census
block populations using a geospatial
technique called dasymetric mapping.
Dasymetric mapping uses information on
land cover and slope to distribute
populations to grid pixels within each
census block. Equation used: Human
Population in RZ / Human Population in
HUC12 * 100. (See also Riparian Zone
glossary definition).
EPA EnviroAtlas
"Dasymetric
Population for the
Conterminous United
States" grid (February
2015 version) and RZ
Grid (August 2015
Version). HUC12
Version: NHDPlus2
WBD Snapshot,
EnviroAtlas Version
(February 2015
version).
Removed

285
Housing Unit
Density in WS
HU_DENS_2010
_WS
Density of housing units in the HUC12
(housing units per square kilometer). A
housing unit is defined as a house,
apartment, mobile home or trailer, group
of rooms, or single room that is intended
for occupancy as separate living quarters.
Source data was the EPA StreamCat
"Accumulated Attributes for
NHDPlusV2 Catchments (Version 2.1)
for the Conterminous United States:
2010 US Census Housing Unit and
Population Density" dataset
(ftp://newftp.epa.gov/EPADataCommons
/ORD/NHDPlusLandscapeAttributes/Str
eamCat/HydroRegions/; downloaded
March 2016). The StreamCat dataset
reports housing unit density for
NHDPlus2 catchments based on 2010
US Census housing unit densities for
census block groups. Housing unity
densities for NHDPlus2 catchments were
aggregated to HUC12 values by
calculating the area-weighted mean for
catchments that intersect the HUC12.
Additional information on the StreamCat
housing density dataset can be found at:
ftp://newftp.epa.gov/EPADataCommons/
ORD/NHDPlusLandscapeAttributes/Stre
amCat/Documentation/Metadata/USCens
us2010.html.
EPA StreamCat
"Accumulated
Attributes for
NHDPlusV2
Catchments (Version
2.1) for the
Conterminous United
States: 2010 US
Census Housing Unit
and Population
Density" dataset, 2015
version. HUC12
Version: NHDPlus2
WBD Snapshot,
EnviroAtlas Version
(February 2015
version).
Removed

286
Dam Density in
WS
DAM_DENSITY
_PER_KM_STR
M
Dam density in the HUC12 (dam count
per stream kilometer). Source data for
dam count was the 2012 National
Anthropogenic Barrier Dataset (NABD;
https://www.sciencebase.gov/catalog/ite
m/537f6a7de4b021317a86e594;
downloaded August 2013), a national
geospatial dataset of dam locations and
attributes. The 2012 NABD was created
by editing the US Army Corps of
Engineer's 2009 National Inventory of
Dams (NID) to delete dams removed
after the release of the 2009 NID and
duplicate dams along state boundaries.
Source data for stream length was the
NHDPlus2 NHD Snapshot. Stream
length includes the length of all linear
NHD Snapshot features in the HUC12
with FTYPE (feature type) equal to
StreamRiver, CanalDitch, or Connector;
linear features with FTYPE equal to
ArtificialPath are only included if they
pass through a NHDArea feature with
FTYPE equal to StreamRiver. Calculated
by dividing the count of dams in the
HUC12 by streamlength in the HUC12.
(See also NHD Snapshot glossary
definition).
2012 National
Anthropognenic
Barrier Dataset
(downloaded August
2013). HUC12
Version: NHDPlus
WBD Snapshot,
EnviroAtlas Version
(February 2015
version).
Removed

287
Count of Dams
in WS
DAM_CNT_WS Count of dams in the HUC12. Source
data was the 2012 National
Anthropogenic Barrier Dataset (NABD;
https://www.sciencebase.gov/catalog/ite
m/537f6a7de4b021317a86e594;
downloaded August 2013), a national
geospatial dataset of dam locations and
attributes. The 2012 NABD was created
by editing the US Army Corps of
Engineer's 2009 National Inventory of
Dams (NID) to delete dams removed
after the release of the 2009 NID and
duplicate dams along state boundaries.
2012 National
Anthropognenic
Barrier Dataset
(downloaded August
2013). HUC12
Version: NHDPlus
WBD Snapshot,
EnviroAtlas Version
(February 2015
version).
Removed
Dam Storage
Volume in WS
DAM_STORAG
E_ACFT
The storage volume of dams in the
HUC12 (acre-feet). Source data was the
2012 National Anthropogenic Barrier
Dataset (NABD;
https://www.sciencebase.gov/catalog/ite
m/537f6a7de4b021317a86e594;
downloaded August 2013), a national
geospatial dataset of dam locations and
attributes. The NABD was created by
editing the US Army Corps of Engineer's
2009 National Inventory of Dams (NID)
to delete dams removed after the release
of the 2009 NID and duplicate dams
along state boundaries. Dam storage
volume was calculated by summing the
normal storage volume reported in the
2012 NABD for dams located in the
HUC12. For dams with normal storage
2012 National
Anthropognenic
Barrier Dataset
(downloaded August
2013). HUC12
Version: NHDPlus
WBD Snapshot,
EnviroAtlas Version
(February 2015
version).
None

288
volume reported as zero acre-feet, the
maximum storage volume was used
instead. Blank values indicate that the
HUC12 contains a dam but does not have
dam storage volume reported in the
NABD.

289
Dam Storage
Ratio in WS
DAM_STORAG
E_RATIO
The ratio of dam storage volume in the
HUC12 to pre-development annual
streamflow at the HUC12 outlet (acre-
feet/acre-feet per year). Source data for
dam storage was the 2012 National
Anthropogenic Barrier Dataset (NABD;
https://www.sciencebase.gov/catalog/ite
m/537f6a7de4b021317a86e594;
downloaded August 2013), a national
geospatial dataset of dam locations and
attributes. The NABD was created by
editing the US Army Corps of Engineer's
2009 National Inventory of Dams (NID)
to delete dams removed after the release
of the 2009 NID and duplicate dams
along state boundaries. Dam storage
volume was calculated by summing the
normal storage volume reported in the
2012 NABD for dams located in the
HUC12. For dams with normal storage
volume reported as zero acre-feet, the
maximum storage volume was used
instead. Source data for streamflow was
the NHDPlus2 Extended Unit Runoff
Method (EROM) attribute table
(http://www.horizon-
systems.com/NHDPlus/NHDPlusV2_dat
a.php; downloaded February 2016). The
NHDPlus2 EROM table contains pre-
development mean annual flow estimates
for the period 1971-2000 for stream
2012 National
Anthropognenic
Barrier Dataset
(downloaded August
2013). NHDPlus2
Enhanced Runoff
Method (EROM)
tables (downloaded
March 2016).
HUC12-NHDPlus2
catchment outlet
COMID crosswalk
table (Created fall
2015). HUC12
Version: NHDPlus
WBD Snapshot,
EnviroAtlas Version
(February 2015
version).
None

290
features in the NHDPlus2. Pre-
development mean annual streamflow at
the HUC12 outlet was set to the value
reported for the NHDPlus2 stream reach
located at the HUC12 outlet in the
NHDPlus2 EROM table (field Q0001C).
Blank values indicate that the HUC12
contains a dam but does not have dam
storage reported in the NABD and/or
does not have reference streamflow
reported in NHDPlus2.

291
Domestic Water
Demand in WS
DOM_H2O_USE
_MGD_2005_WS
Daily domestic water use in the HUC12
(million gallons per day). Domestic
water use includes indoor and outdoor
household uses, such as drinking,
bathing, cleaning, landscaping, and
pools. Domestic water can include
surface or groundwater that is self-
supplied by households or publicly-
supplied. Water used in a HUC12 may
originate from within or outside the
HUC12. Calculated by downscaling
county water use estimates for 2005
reported by US Geological Survey
("Estimated Use of Water in the United
States County-Level Data for 2005")
using the 2006 National Land Cover
Database (2006 NLCD) Land Cover
dataset and 2010 US Census population
estimates from the US Census Bureau.
This indicator was calculated for EPA
EnviroAtlas. Additional information on
source data and calculation methods can
be found at:
https://edg.epa.gov/metadata/catalog/sear
ch/resource/details.page?uuid=%7BC6D
BEBAB-03EF-43C8-8DCA-
8D2845E06A96%7D
EPA EnviroAtlas
"Domestic Water
Demand by 12-Digit
HUC for the
Conterminous United
States" dataset.
December 15, 2015
version.
Removed

292
Agricultural
Water Demand
in WS
AG_H2O_USE_0
5_WS
Daily agricultural water use in the
HUC12 (million gallons per day).
Agricultural water use includes surface
and groundwater that is self-supplied by
agricultural producers or supplied by
water providers (governments, private
companies, or other organizations).
Water used in a HUC12 may originate
from within or outside the HUC12.
Calculated by downscaling county water
use estimates for 2005 reported by US
Geological Survey ("Estimated Use of
Water in the United States County-Level
Data for 2005") using the 2006 National
Land Cover Database (2006 NLCD)
Land Cover dataset, the 2010 Cropland
Data Layer, and a custom geospatial
dataset of irrigated area locations.
Counties with zero reported water use
were assigned a state-level average value
to address issues with water use
reporting. This indicator was calculated
for EPA EnviroAtlas. Detailed
information on source data and
calculation methods can be found at:
https://edg.epa.gov/metadata/catalog/sear
ch/resource/details.page?uuid=%7BD511
3083-CFCD-48EC-BC24-
0ADA5B9BDDB7%7D
EPA EnviroAtlas
"Agricultural Water
Demand by 12-Digit
HUC for the
Conterminous United
States" dataset. May 7,
2015 version.
Removed

293
Industrial Water
Demand in WS
IND_H2O_USE_
MGD_WS
Daily industrial water use in the HUC12
(million gallons per day). Industrial
water use includes water used for
chemical, food, paper, wood, and metal
production. Only includes self-supplied
surface water or groundwater by private
wells or reservoirs. Industrial water
supplied by public water utilities is not
counted. Water used in a HUC12 may
originate from within or outside the
HUC12. Calculated by downscaling
county water use estimates for 2005
reported by US Geological Survey
("Estimated Use of Water in the United
States County-Level Data for 2005")
using a geospatial dataset on the location
of industrial facilities as of 2009/10.
Water use by industrial facilities in
counties that were reported to have zero
industrial water use in the USGS dataset
was estimated from values for nearby
facilities. This indicator was calculated
for EPA EnviroAtlas. Additional
information on source data and
calculation methods can be found at:
https://edg.epa.gov/metadata/catalog/sear
ch/resource/details.page?uuid=%7B4E58
C04B-8A17-4B07-9EE4-
1D9365D5B0D9%7D
EPA EnviroAtlas
"Industrial Water Use
by 12-Digit HUC for
the Conterminous
United States" dataset.
May 7, 2015 version.
Removed

294
Thermoelectric
Water Demand
in WS
H2O_USE_THE
RMO_MGD
Daily water use for thermoelectric power
generation in the HUC12 (million
gallons per day). Source data was the
EPA 2009 Emission and Generation
Resource Integrated Database (eGRID),
a geospatial dataset of power plant
locations and attributes. Water
consumption was calculated for fossil
fuel and nuclear power plants by
multiplying the plant's annual net energy
generation by a coefficient of water
consumption, and water use estimates
were summed for plants located in each
HUC12. Thermoelectric water use
estimates assume complete consumptive
use of water and do not consider water
reuse. This indicator was calculated for
EPA EnviroAtlas. Additional
information on source data and
calculation methods can be found at:
https://edg.epa.gov/metadata/catalog/sear
ch/resource/details.page?uuid=%7BA15
BD49A-0C75-4E64-902B-
581D89F7B8AC%7D.
EPA EnviroAtlas
"Thermoelectric Water
Use for the
Conterminous United
States" dataset. May 7,
2015 version.
Removed

295
Manure
Application in
WS
MANURE_APP_
WS
Average annual rate of nitrogen
application to agricultural lands as
animal manure in the HUC12 in 2006
(kilograms Nitrogen/hectare/year).
Calculated by downscaling county-level
estimates of recoverable manure
application reported by the International
Plant Nutrition Institute (IPNI) Nutrient
Geographic Information System (NuGIS;
http://www.ipni.net/nugis) using the
2006 National Land Cover Database
(NLCD) Land Cover dataset.
Recoverable manure is defined as
manure that is collected, stored, and
available for land application from
livestock in confinement. County totals
were evenly distributed to agricultural
lands throughout the county, crop-
specific differences were not considered.
This indicator was calculated for EPA
EnviroAtlas. Additional information on
source data and calculation methods can
be found at:
https://edg.epa.gov/metadata/catalog/sear
ch/resource/details.page?uuid=%7B0A4
E7DDE-5F54-4DB5-8688-
6AB2B1C8AFE5%7D
EPA EnviroAtlas
"Manure Application
to Agricultural Lands
from Confined Animal
Feeding Operations by
12-digit HUC for the
Conterminous United
States, 2006" dataset.
May 7, 2015 version.
None

296
Synthetic N
Fertilizer
Application in
WS
N_SYNTH_FER
T_APL_MEAN_
WS
Average annual nitrogen application to
agricultural lands as synthetic fertilizer in
the HUC12 in 2006 (kilograms
Nitrogen/hectare/year). Calculated by
downscaling county-level fertilizer
application estimates reported by US
Geological Survey ("County-level
Estimates of Nitrogen and Phosphorus
from Commercial Fertilizer for the
Conterminous United States, 1987-
2006") using the 2006 National Land
Cover Database (NLCD) Land Cover
dataset. County totals were evenly
distributed to agricultural lands
throughout the county, crop-specific
differences were not considered. This
indicator was calculated for EPA
EnviroAtlas. Additional information on
source data and calculation methods can
be found at:
https://edg.epa.gov/metadata/catalog/sear
ch/resource/details.page?uuid=%7B09D
F9B39-6CC8-4DFF-A14D-
1BA14C06321F%7D
EPA EnviroAtlas
"Synthetic N Fertilizer
Application to
Agricultural Lands by
12-digit HUC in the
Conterminous United
States, 2006". May 7,
2015 version.
None

297
Total Nitrogen
Deposition in
WS (2011)
N_DEP_TOTAL_
11_WS
Annual deposition of total nitrogen in the
HUC12 in 2011 (kilograms per hectare).
Includes both dry and wet deposition of
total nitrogen. Source data was a 12-
kilometer resolution grid of predicted
2011 nitrogen deposition from the
Community Multiscale Air Quality
modeling system (CMAQ) Version 5.0.2.
This indicator was calculated for EPA
EnviroAtlas. Additional information on
source data and calculation methods can
be found at:
https://edg.epa.gov/metadata/catalog/sear
ch/resource/details.page?uuid=%7B284d
232c-1067-453f-9e4a-
3f16de42b1b4%7D
EPA EnviroAtlas
"Atmospheric
Nitrogen and Sulfur
Deposition by 12-digit
HUC for the
Conterminous United
States (2011)". April
29, 2016 version.
None
Oxidized
Nitrogen Wet
Deposition in
WS (2011)
N_OX_WETDEP
_11_WS
Annual wet deposition of oxidized
nitrogen in the HUC12 in 2011
(kilograms per hectare). Source data was
a 12-kilometer resolution grid of
predicted 2011 nitrogen deposition from
the Community Multiscale Air Quality
modeling system (CMAQ) Version 5.0.2.
This indicator was calculated for EPA
EnviroAtlas. Additional information on
source data and calculation methods can
be found at:
https://edg.epa.gov/metadata/catalog/sear
ch/resource/details.page?uuid=%7B284d
232c-1067-453f-9e4a-
3f16de42b1b4%7D
EPA EnviroAtlas
"Atmospheric
Nitrogen and Sulfur
Deposition by 12-digit
HUC for the
Conterminous United
States (2011)". April
29, 2016 version.
Removed

298
Oxidized
Nitrogen Dry
Deposition in
WS (2011)
N_OX_DRYDEP
_11_WS
Annual dry deposition of oxidized
nitrogen in the HUC12 in 2011
(kilograms per hectare). Source data was
a 12-kilometer resolution grid of
predicted 2011 nitrogen deposition from
the Community Multiscale Air Quality
modeling system (CMAQ) Version 5.0.2.
This indicator was calculated for EPA
EnviroAtlas. Additional information on
source data and calculation methods can
be found at:
https://edg.epa.gov/metadata/catalog/sear
ch/resource/details.page?uuid=%7B284d
232c-1067-453f-9e4a-
3f16de42b1b4%7D
EPA EnviroAtlas
"Atmospheric
Nitrogen and Sulfur
Deposition by 12-digit
HUC for the
Conterminous United
States (2011)". April
29, 2016 version.
Removed
Oxidized
Nitrogen Total
Deposition in
WS (2011)
N_OX_DEP_TO
TAL_11_WS
Annual deposition of oxidized nitrogen
in the HUC12 in 2011 (kilograms per
hectare). Includes both dry and wet
deposition of oxidized nitrogen. Source
data was a 12-kilometer resolution grid
of predicted 2011 nitrogen deposition
from the Community Multiscale Air
Quality modeling system (CMAQ)
Version 5.0.2. This indicator was
calculated for EPA EnviroAtlas.
Additional information on source data
and calculation methods can be found at:
https://edg.epa.gov/metadata/catalog/sear
ch/resource/details.page?uuid=%7B284d
232c-1067-453f-9e4a-
3f16de42b1b4%7D
EPA EnviroAtlas
"Atmospheric
Nitrogen and Sulfur
Deposition by 12-digit
HUC for the
Conterminous United
States (2011)". April
29, 2016 version.
Removed

299
Reduced
Nitrogen Wet
Deposition in
WS (2011)
N_RED_WETDE
P_11_WS
Annual wet deposition of reduced
nitrogen in the HUC12 in 2011
(kilograms per hectare). Source data was
a 12-kilometer resolution grid of
predicted 2011 nitrogen deposition from
the Community Multiscale Air Quality
modeling system (CMAQ) Version 5.0.2.
This indicator was calculated for EPA
EnviroAtlas. Additional information on
source data and calculation methods can
be found at:
https://edg.epa.gov/metadata/catalog/sear
ch/resource/details.page?uuid=%7B284d
232c-1067-453f-9e4a-
3f16de42b1b4%7D
EPA EnviroAtlas
"Atmospheric
Nitrogen and Sulfur
Deposition by 12-digit
HUC for the
Conterminous United
States (2011)". April
29, 2016 version.
Removed
Reduced
Nitrogen Dry
Deposition in
WS (2011)
N_RED_DRYDE
P_11_WS
Annual dry deposition of reduced
nitrogen in the HUC12 in 2011
(kilograms per hectare). Source data was
a 12-kilometer resolution grid of
predicted 2011 nitrogen deposition from
the Community Multiscale Air Quality
modeling system (CMAQ) Version 5.0.2.
This indicator was calculated for EPA
EnviroAtlas. Additional information on
source data and calculation methods can
be found at:
https://edg.epa.gov/metadata/catalog/sear
ch/resource/details.page?uuid=%7B284d
232c-1067-453f-9e4a-
3f16de42b1b4%7D
EPA EnviroAtlas
"Atmospheric
Nitrogen and Sulfur
Deposition by 12-digit
HUC for the
Conterminous United
States (2011)". April
29, 2016 version.
Removed
300
Reduced
Nitrogen Total
Deposition in
WS (2011)
N_RED_DEP_T
OTAL_11_WS
Annual deposition of reduced nitrogen in
the HUC12 in 2011 (kilograms per
hectare). Includes both dry and wet
deposition of reduced nitrogen. Source
data was a 12-kilometer resolution grid
of predicted 2011 nitrogen deposition
from the Community Multiscale Air
Quality modeling system (CMAQ)
Version 5.0.2. This indicator was
calculated for EPA EnviroAtlas.
Additional information on source data
and calculation methods can be found at:
https://edg.epa.gov/metadata/catalog/sear
ch/resource/details.page?uuid=%7B284d
232c-1067-453f-9e4a-
3f16de42b1b4%7D
EPA EnviroAtlas
"Atmospheric
Nitrogen and Sulfur
Deposition by 12-digit
HUC for the
Conterminous United
States (2011)". April
29, 2016 version.
Removed

301
Density Toxic
Release
Inventory Sites
in WS
TRI_DENS_2010
_WS
Density of EPA Toxics Release
Inventory (TRI) sites in the HUC12 (sites
per square kilometer). The TRI stores
information on facilities that handle toxic
chemicals; including on-site or off-site
land, air, or water disposal, recycling,
energy recovery, or treatment. Source
data was the EPA StreamCat
"Accumulated Attributes for
NHDPlusV2 Catchments (Version 2.1)
for the Conterminous United States:
Facility Registry Services (FRS) : Toxic
Release Inventory (TRI) , National
Pollutant Discharge Elimination System
(NPDES) , and Superfund Sites" dataset
(ftp://newftp.epa.gov/EPADataCommons
/ORD/NHDPlusLandscapeAttributes/Str
eamCat/HydroRegions/; downloaded
March 2016). The StreamCat dataset
reports TRI site density for NHDPlus2
catchments based on TRI site locations
stored in the EPA Facility Registration
System as of 2014. TRI site densities for
NHDPlus2 catchments were aggregated
to HUC12 values by calculating the area-
weighted mean for catchments that
intersect the HUC12. Additional
information on the StreamCat TRI
density dataset can be found at:
ftp://newftp.epa.gov/EPADataCommons/
ORD/NHDPlusLandscapeAttributes/Stre
EPA StreamCat
"Accumulated
Attributes for
NHDPlusV2
Catchments (Version
2.1) for the
Conterminous United
States: Facility
Registry Services
(FRS) : Toxic Release
Inventory (TRI) ,
National Pollutant
Discharge Elimination
System (NPDES) , and
Superfund Sites"
dataset, 2015 version.
HUC12 Version:
NHDPlus2 WBD
Snapshot, EnviroAtlas
Version (February
2015 version).
None

302
amCat/Documentation/Metadata/EPA_F
RS.html.

303
Density
Superfund Sites
in WS
SUPER_DENS_2
010_WS
Density of EPA Superfund program sites
in the HUC12 (sites per square
kilometer). The Superfund program is
responsible for cleaning up the nation’s
most contaminated land and responding
to environmental emergencies, oil spills
and natural disasters. Source data was the
EPA StreamCat "Accumulated Attributes
for NHDPlusV2 Catchments (Version
2.1) for the Conterminous United States:
Facility Registry Services (FRS) : Toxic
Release Inventory (TRI) , National
Pollutant Discharge Elimination System
(NPDES) , and Superfund Sites" dataset
(ftp://newftp.epa.gov/EPADataCommons
/ORD/NHDPlusLandscapeAttributes/Str
eamCat/HydroRegions/; downloaded
March 2016). The StreamCat dataset
reports Superfund site density for
NHDPlus2 catchments based on
Superfund site locations stored in the
EPA Facility Registration System as of
2014. Superfund site densities for
NHDPlus2 catchments were aggregated
to HUC12 values by calculating the area-
weighted mean for catchments that
intersect the HUC12. Additional
information on the StreamCat Superfund
density dataset can be found at:
ftp://newftp.epa.gov/EPADataCommons/
ORD/NHDPlusLandscapeAttributes/Stre
EPA StreamCat
"Accumulated
Attributes for
NHDPlusV2
Catchments (Version
2.1) for the
Conterminous United
States: Facility
Registry Services
(FRS) : Toxic Release
Inventory (TRI) ,
National Pollutant
Discharge Elimination
System (NPDES) , and
Superfund Sites"
dataset, 2015 version.
HUC12 Version:
NHDPlus2 WBD
Snapshot, EnviroAtlas
Version (February
2015 version).
None

304
amCat/Documentation/Metadata/EPA_F
RS.html.
Sulfur Wet
Deposition in
WS (2011)
SLF_WETDEP_1
1_WS
Annual wet deposition of sulfur in the
HUC12 in 2011 (kilograms per hectare).
Source data was a 12-kilometer
resolution grid of predicted 2011
nitrogen deposition from the Community
Multiscale Air Quality modeling system
(CMAQ) Version 5.0.2. This indicator
was calculated for EPA EnviroAtlas.
Additional information on source data
and calculation methods can be found at:
https://edg.epa.gov/metadata/catalog/sear
ch/resource/details.page?uuid=%7B284d
232c-1067-453f-9e4a-
3f16de42b1b4%7D
EPA EnviroAtlas
"Atmospheric
Nitrogen and Sulfur
Deposition by 12-digit
HUC for the
Conterminous United
States (2011)". April
29, 2016 version.
Removed

305
Sulfur Dry
Deposition in
WS (2011)
SLF_DRYDEP_1
1_WS
Annual dry deposition of sulfur in the
HUC12 in 2011 (kilograms per hectare).
Source data was a 12-kilometer
resolution grid of predicted 2011
nitrogen deposition from the Community
Multiscale Air Quality modeling system
(CMAQ) Version 5.0.2. This indicator
was calculated for EPA EnviroAtlas.
Additional information on source data
and calculation methods can be found at:
https://edg.epa.gov/metadata/catalog/sear
ch/resource/details.page?uuid=%7B284d
232c-1067-453f-9e4a-
3f16de42b1b4%7D
EPA EnviroAtlas
"Atmospheric
Nitrogen and Sulfur
Deposition by 12-digit
HUC for the
Conterminous United
States (2011)". April
29, 2016 version.
Removed
Sulfur Total
Deposition in
WS (2011)
SLF_DEP_TOTA
L_11_WS
Annual deposition of sulfur in the
HUC12 in 2011 (kilograms per hectare).
Includes both dry and wet deposition of
reduced sulfur. Source data was a 12-
kilometer resolution grid of predicted
2011 nitrogen deposition from the
Community Multiscale Air Quality
modeling system (CMAQ) Version 5.0.2.
This indicator was calculated for EPA
EnviroAtlas. Additional information on
source data and calculation methods can
be found at:
https://edg.epa.gov/metadata/catalog/sear
ch/resource/details.page?uuid=%7B284d
232c-1067-453f-9e4a-
3f16de42b1b4%7D
EPA EnviroAtlas
"Atmospheric
Nitrogen and Sulfur
Deposition by 12-digit
HUC for the
Conterminous United
States (2011)". April
29, 2016 version.
None

306
Canal Density
in WS
CANAL_DENS_
2010_WS
Density of canals, ditches, and pipelines
in the HUC12 (kilometer per square
kilometer). Source data was the EPA
StreamCat "Accumulated Attributes for
NHDPlusV2 Catchments (Version 2.1)
for the Conterminous United States:
Canal Density" dataset
(ftp://newftp.epa.gov/EPADataCommons
/ORD/NHDPlusLandscapeAttributes/Str
eamCat/HydroRegions/; downloaded
March 2016). The StreamCat dataset
reports canal, pipeline, and ditch density
for NHDPlus2 catchments based on the
location of surface water features in the
NHDPlus2 NHD Snapshot classified as
canals, ditches, or pipelines. Canal,
pipeline, and ditch densities for
NHDPlus2 catchments were aggregated
to HUC12 values by calculating the area-
weighted mean for catchments that
intersect the HUC12. Additional
information on the StreamCat canal,
ditch, and pipeline density dataset can be
found at:
ftp://newftp.epa.gov/EPADataCommons/
ORD/NHDPlusLandscapeAttributes/Stre
amCat/Documentation/Metadata/CanalD
ensity.html. (See also NHD Snapshot
glossary definition).
EPA StreamCat
"Accumulated
Attributes for
NHDPlusV2
Catchments (Version
2.1) for the
Conterminous United
States: Canal Density"
dataset, 2015 version.
HUC12 Version:
NHDPlus2 WBD
Snapshot, EnviroAtlas
Version (February
2015 version).
Removed

307
% Tile Drained
Area in WS
TILE_DRAINAG
E_WS_PCT
Percent of the HUC12 that is drained by
subsurface tile drainage. Tile drainage is
a method of removing water from the
subsurface of agricultural fields. Source
data was the USGS "Attributes for
NHDPlus Catchments (Version 1.1) in
the Conterminous United States:
Artificial Drainage (1992) and Irrigation
Types (1997)" dataset (2010 version;
http://water.usgs.gov/GIS/metadata/usgs
wrd/XML/nhd_adrain.xml#stdorder).
The USGS dataset reports the tile drained
area for each catchment in the NHDPlus
Version 1.1 dataset based on artificial
drainage information in the US
Department of Agriculture 1992 National
Resources Inventory. Tile drained areas
for catchments were aggregated to
HUC12 values by calculating the area-
weighted sum for catchments that
intersect each HUC12. Equation used:
Tile Drained Area in HUC12 / HUC12
Area * 100.
USGS "Attributes for
NHDPlus Catchments
(Version 1.1) in the
Conterminous United
States: Artificial
Drainage (1992) and
Irrigation Types
(1997)" dataset, 2010
version. HUC12
Version: NHDPlus2
WBD Snapshot,
EnviroAtlas Version
(February 2015
version).
Removed

308
% Ditch
Drained Area in
WS
DITCH_DRAIN
AGE_WS_PCT
Percent of the HUC12 that is drained by
artificial surface ditches. Surface ditches
collect and convey water from the
surface of agricultural fields. Source
data was the USGS "Attributes for
NHDPlus Catchments (Version 1.1) in
the Conterminous United States:
Artificial Drainage (1992) and Irrigation
Types (1997)" dataset (2010 version;
http://water.usgs.gov/GIS/metadata/usgs
wrd/XML/nhd_adrain.xml#stdorder).
The USGS dataset reports the ditch
drained area for each catchment in the
NHDPlus Version 1.1 dataset based on
artificial drainage information in the US
Department of Agriculture 1992 National
Resources Inventory. Ditch drained areas
for catchments were aggregated to
HUC12 values by calculating the area-
weighted sum for catchments that
intersect each HUC12. Equation used:
Ditch Drained Area in HUC12 / HUC12
Area * 100.
USGS "Attributes for
NHDPlus Catchments
(Version 1.1) in the
Conterminous United
States: Artificial
Drainage (1992) and
Irrigation Types
(1997)" dataset, 2010
version. HUC12
Version: NHDPlus2
WBD Snapshot,
EnviroAtlas Version
(February 2015
version).
Removed

309
% Tile or Ditch
Drained in WS
TOT_DRAINAG
E_WS_PCT
Percent of the HUC12 that is drained by
artificial surface ditches or subsurface
tile drainage. Tile drainage is a method
of removing water from the subsurface of
agricultural fields; surface ditches collect
and convey water from the surface of
agricultural fields. Source data was the
USGS "Attributes for NHDPlus
Catchments (Version 1.1) in the
Conterminous United States: Artificial
Drainage (1992) and Irrigation Types
(1997)" dataset (2010 version;
http://water.usgs.gov/GIS/metadata/usgs
wrd/XML/nhd_adrain.xml#stdorder).
The USGS dataset reports the tile and
ditch drained area for each catchment in
the NHDPlus Version 1.1 dataset based
on artificial drainage information in the
US Department of Agriculture 1992
National Resources Inventory.
Artificially drained areas for catchments
were aggregated to HUC12 values by
calculating the area-weighted sum for
catchments that intersect each HUC12.
Equation used: Artificially Drained Area
in HUC12 / HUC12 Area * 100.
USGS "Attributes for
NHDPlus Catchments
(Version 1.1) in the
Conterminous United
States: Artificial
Drainage (1992) and
Irrigation Types
(1997)" dataset, 2010
version. HUC12
Version: NHDPlus2
WBD Snapshot,
EnviroAtlas Version
(February 2015
version).
Removed

310
Wildfire Hazard
Potential, Mean
in WS
MEAN_WILDFI
RE_RISK
The mean wildfire hazard potential in the
HUC12. Wildfire hazard potential ranges
from 1 (very low risk of wildfire) to 5
(very high risk of wildfire) and depict the
relative potential for the occurrence of
wildfire that would be difficult for
suppression resources to contain. Source
data was the 2014 USDA Forest Service
Wildfire Hazard Potential geospatial grid
dataset
(http://www.firelab.org/document/classifi
ed-2014-whp-gis-data-and-maps;
downloaded January 2016). The Wildfire
Hazard Potential grid is a 30-meter
resolution grid of wildfire potential
derived from spatial estimates of wildfire
likelihood and intensity generated in
2014 with the Large Fire Simulator
(FSim), spatial fuels and vegetation data
from LANDFIRE 2010, and point
locations of fire occurrence. Calculated
as the average of wildfire hazard
potential for grid pixels in the HUC12.
Areas not assigned a Wildfire Hazard
Potential value (non-burnable lands and
water) were excluded from the mean
calculation.
USDA "Wildfire
Hazard Potential
(WHP) for the
conterminous United
States" grid, 2014
version. HUC12
Version: NHDPlus2
WBD Snapshot,
EnviroAtlas Version
(February 2015
version).
Removed
311
% High or Very
High Wildfire
Hazard
Potential WS
HVH_WILDFIR
E_RISK_PCT
Percent of the HUC12 with high or very
high wildfire hazard potential. Wildfire
hazard potential ranges from 1 (very low
risk of wildfire) to 5 (very high risk of
wildfire) and depict the relative potential
for the occurrence of wildfire that would
be difficult for suppression resources to
contain. Source data was the 2014 USDA
Forest Service Wildfire Hazard Potential
geospatial grid dataset
(http://www.firelab.org/document/classifi
ed-2014-whp-gis-data-and-maps;
downloaded January 2016). The Wildfire
Hazard Potential grid is a 30-meter
resolution grid of wildfire potential
derived from spatial estimates of wildfire
likelihood and intensity generated in
2014 with the Large Fire Simulator
(FSim), spatial fuels and vegetation data
from LANDFIRE 2010, and point
locations of fire occurrence. Equation
Used: Area of High or Very High
Wildfire Hazard Potential / HUC12 Area
* 100.
USDA "Wildfire
Hazard Potential
(WHP) for the
conterminous United
States" grid, 2014
version. HUC12
Version: NHDPlus2
WBD Snapshot,
EnviroAtlas Version
(February 2015
version).
Removed

312
Unpollinated
Area in WS
UNPOLLINATE
D_AREA_WS
Crop acres in the HUC12 without nearby
pollinator habitat. Pollinator habitat is
defined as trees (fruit, nut, deciduous,
and evergreen); crops are only those that
benefit from or require pollinators in
order to produce or improve crop
production. Crops located more than 2.8
kilometers away from pollinator habitat
were classified as not having nearby
pollinator habitat. Source data was a
custom land cover dataset that combined
the 2006 National Land Cover Database
(NLCD 2006) and the 2010 USDA
Cropland Data Layer (CDL). This
indicator was calculated for EPA
EnviroAtlas. Detailed information on
source data and calculation methods can
be found at:
https://edg.epa.gov/metadata/rest/docume
nt?id=%7BF8858B62-0EA9-4F07-83C3-
AAA0517D0925%7D
EPA EnviroAtlas
"Acres of crops that
have no nearby
pollinator habitat for
the Conterminous
United States" dataset.
May 7, 2015 version.
Removed
Impairment
303d and
TMDL
Segments
Count (2015)
CNT_303DTMD
L_WATERS
Count of surface water segments with
TMDLs or listed as impaired and
requiring a TMDL under Section 303(d)
of the Clean Water Act in the HUC12.
Calculated as the number of unique state-
assigned surface water segment IDs in
the EPA Office of Water TMDL Waters
and 303(d) Listed Waters geospatial
datasets. (See also TMDL Waters and
EPA "303(d) Listed
Impaired Waters
NHDPlus Indexed
Dataset with Program
Attributes" shapefiles,
May 2015 version;
EPA "Impaired
Waters with TMDLs
NHDPlus Indexed
Dataset with Program
None

313
303(d) Listed Waters glossary
definitions).
Attributes" shapefiles,
May 2015 version.
HUC12 Version:
NHDPlus2 WBD
Snapshot, EnviroAtlas
Version (February
2015 version).
Cause-Segment
Count 303d-
Listed +
TMDLs (2015)
CNT_303DTMD
L_IMPAIRMEN
TS
Count of surface water impairments with
TMDLs or listed as requiring a TMDL
under Section 303(d) of the Clean Water
Act in the HUC12. Calculated as number
of unique surface water segment ID-
parent cause of impairment combinations
in the EPA Office of Water TMDL
Waters and 303(d) Listed Waters
geospatial datasets. (See also TMDL
Waters and 303(d) Listed Waters
glossary definitions).
EPA "303(d) Listed
Impaired Waters
NHDPlus Indexed
Dataset with Program
Attributes" shapefiles,
May 2015 version;
EPA "Impaired
Waters with TMDLs
NHDPlus Indexed
Dataset with Program
Attributes" shapefiles,
May 2015 version.
HUC12 Version:
NHDPlus2 WBD
Snapshot, EnviroAtlas
Version (February
2015 version).
Removed
Watershed
Unique 303d-
Listed Causes
Count (2015)
CNT_303D_CAU
SES
Count of causes of impairment for
surface waters listed as impaired and
requiring a TMDL under Section 303(d)
of the Clean Water Act in HUC12.
Calculated as the number of unique
parent (grouped) causes of impairment in
the HUC12 from the EPA Office of
EPA "303(d) Listed
Impaired Waters
NHDPlus Indexed
Dataset with Program
Attributes" shapefiles,
May 2015 version.
HUC12 Version:
Removed

314
Water 303(d) Listed Waters geospatial
dataset. (See also 303(d) Listed Waters
glossary definition).
NHDPlus2 WBD
Snapshot, EnviroAtlas
Version (February
2015 version).
Unique
Impairment
Causes Count
(2015)
CNT_303DTMD
L_CAUSES
Count of causes of impairment for
surface waters with TMDLs or surface
waters listed as impaired and requiring a
TMDL under Section 303(d) of the Clean
Water Act in HUC12. Calculated as the
number of unique parent (grouped)
causes of impairment in the EPA Office
of Water TMDL Waters and 303(d)
Listed Waters geospatial datasets. (See
also TMDL Waters and 303(d) Listed
Waters glossary definitions).
EPA "303(d) Listed
Impaired Waters
NHDPlus Indexed
Dataset with Program
Attributes" shapefiles,
May 2015 version;
EPA "Impaired
Waters with TMDLs
NHDPlus Indexed
Dataset with Program
Attributes" shapefiles,
May 2015 version.
HUC12 Version:
NHDPlus2 WBD
Snapshot, EnviroAtlas
Version (February
2015 version).
Removed
303d-Listed
Segments
Count (2015)
CNT_303D_WA
TERS
Count of surface water segments listed as
impaired and requiring a TMDL under
Section 303(d) of the Clean Water Act in
the HUC12. Calculated as the number of
unique state-assigned surface water
segment IDs in the HUC12 from the
EPA Office of Water 303(d) Listed
Waters geospatial dataset. (See also
EPA "303(d) Listed
Impaired Waters
NHDPlus Indexed
Dataset with Program
Attributes" shapefiles,
May 2015 version.
HUC12 Version:
NHDPlus2 WBD
Removed

315
303(d) Listed Waters glossary
definition).
Snapshot, EnviroAtlas
Version (February
2015 version).
Segment-Cause
Impairment
Combinations
Count (2015)
CNT_303D_IMP
AIRMENTS
Count of surface water impairments
requiring a TMDL under Section 303(d)
of the Clean Water Act in the HUC12.
Calculated as the number of unique
surface water segment ID-parent cause of
impairment combinations in the HUC12
from the EPA Office of Water 303(d)
Listed Waters geospatial dataset. (See
also 303(d) Listed Waters glossary
definition).
EPA "303(d) Listed
Impaired Waters
NHDPlus Indexed
Dataset with Program
Attributes" shapefiles,
May 2015 version.
HUC12 Version:
NHDPlus2 WBD
Snapshot, EnviroAtlas
Version (February
2015 version).
Removed
Streamlength
Impaired 303d-
Listed +
TMDLs (2015)
STREAMLGTH_
303DTMDL
Length of stream features with a TMDL
or listed as impaired and requiring a
TMDL under Section 303(d) of the Clean
Water Act in the HUC12 (kilometers).
Source data for calculating the length of
stream features with a TMDL was the
EPA Office of Water TMDL Waters
geospatial dataset. Source data for
calculating the length of 303(d) listed
stream features was the EPA Office of
Water 303(d) Listed Waters geospatial
dataset. Methods were applied to ensure
that streams present in both the TMDL
Waters and 303(d) Listed Waters
EPA "303(d) Listed
Impaired Waters
NHDPlus Indexed
Dataset with Program
Attributes" shapefiles,
May 2015 version;
EPA "Impaired
Waters with TMDLs
NHDPlus Indexed
Dataset with Program
Attributes" shapefiles,
May 2015 version;
NHDPlus2 NHD
Snapshot, downloaded
Removed
316
datasets were not double-counted. (See
also TMDL Waters and 303(d) Listed
Waters glossary definitions).
March 2014. HUC12
Version: NHDPlus2
WBD Snapshot,
EnviroAtlas Version
(February 2015
version).
% Streamlength
Impaired 303d-
Listed +
TMDLs (2015)
STREAMLGTH_
303DTMDL_PCT
Percent of streamlength in the HUC12
with a TMDL or listed as impaired and
requiring a TMDL under Section 303(d)
of the Clean Water Act. Source data for
calculating the length of stream features
with a TMDL was the EPA Office of
Water TMDL Waters geospatial dataset.
Source data for calculating the length of
303(d) listed stream features was the
EPA Office of Water 303(d) Listed
Waters geospatial dataset. The
denominator used for percentage
calculations (total streamlength) is the
length of NHDPlus NHD Snapshot
stream features in the HUC12 plus any
additional custom-added stream features
in the TMDL Waters and 303(d) Listed
Waters datasets. Methods were applied to
ensure that streams present in both the
TMDL Waters and 303(d) Listed Waters
datasets were not double-counted. (See
also TMDL Waters, 303(d) Listed
EPA "303(d) Listed
Impaired Waters
NHDPlus Indexed
Dataset with Program
Attributes" shapefiles,
May 2015 version;
EPA "Impaired
Waters with TMDLs
NHDPlus Indexed
Dataset with Program
Attributes" shapefiles,
May 2015 version;
NHDPlus2 NHD
Snapshot, downloaded
March 2014. HUC12
Version: NHDPlus2
WBD Snapshot,
EnviroAtlas Version
(February 2015
version).
Removed

317
Waters, and NHD Snapshot glossary
definitions).
Streamlength
303d-Listed
(2015)
STREAMLGTH_
303D
Length of stream features in the HUC12
listed as impaired and requiring a TMDL
under Section 303(d) of the Clean Water
Act. Source data for calculating the
length of stream features that are 303(d)
listed was the EPA Office of Water
303(d) Listed Waters geospatial dataset.
(See also 303(d) Listed Waters and NHD
Snapshot glossary definitions).
EPA "303(d) Listed
Impaired Waters
NHDPlus Indexed
Dataset with Program
Attributes" shapefiles,
May 2015 version;
NHDPlus2 NHD
Snapshot, downloaded
March 2014. HUC12
Version: NHDPlus2
WBD Snapshot,
EnviroAtlas Version
(February 2015
version).
Removed

318
% Streamlength
303d-Listed
(2015)
STREAMLGTH_
303D_PCT
Percent of streamlength in the HUC12
listed as impaired and requiring a TMDL
under Section 303(d) of the Clean Water
Act. Source data for calculating the
length of stream features that are 303(d)
listed was the EPA Office of Water
303(d) Listed Waters geospatial dataset.
The denominator used for percentage
calculations (total streamlength) is the
length of NHDPlus2 NHD Snapshot
stream features plus any additional
custom-added streams in the 303(d)
Listed Waters dataset. (See also 303(d)
Listed Waters and NHD Snapshot
glossary definitions).
EPA "303(d) Listed
Impaired Waters
NHDPlus Indexed
Dataset with Program
Attributes" shapefiles,
May 2015 version;
NHDPlus2 NHD
Snapshot, downloaded
March 2014. HUC12
Version: NHDPlus2
WBD Snapshot,
EnviroAtlas Version
(February 2015
version).
Removed
Streamlength
303d-Listed
Custom Adds
(2015)
STREAMLGTH_
303D_CUSTOM
Length of custom-added stream features
in the EPA Office of Water 303(d) Listed
Waters dataset in the HUC12
(kilometers). Custom-added stream
features are those that are present in the
303(d) Listed Waters dataset only and do
not have a match in the NHDPlus2 NHD
Snapshot. The length of custom-added
stream features is used to calculate
indicators of the percentage of
streamlength in a HUC12 that is 303(d)
listed. The denominator of percentage
calculations is total streamlength in the
HUC12, calculated as NHD streamlength
plus custom-added streamlength. (See
also 303(d) Listed Waters and
EPA "303(d) Listed
Impaired Waters
NHDPlus Indexed
Dataset with Program
Attributes" shapefiles,
May 2015 version;
NHDPlus2 NHD
Snapshot, downloaded
March 2014. HUC12
Version: NHDPlus2
WBD Snapshot,
EnviroAtlas Version
(February 2015
version).
Removed

319
NHDPlus2 NHD Snapshot glossary
definitions).
Waterbody
Area 303d-
Listed +
TMDLs (2015)
WBAREA_303D
TMDL
Area of lakes, estuaries, and other areal
water features with a TMDL or listed as
impaired and requiring a TMDL under
Section 303(d) of the Clean Water Act in
the HUC12 (square kilometers). Source
data used for calculating the area of
waterbody features with a TMDL was
the EPA Office of Water TMDL Waters
geospatial dataset. Source data used for
calculating the area of 303(d) listed
waterbody features was the EPA Office
of Water 303(d) Listed Waters geospatial
dataset. Methods were applied to ensure
that waterbodies present in both the
TMDL Waters and 303(d) Listed Waters
datasets were not double-counted. (See
also TMDL Waters and 303(d) Listed
Waters glossary definitions).
EPA "303(d) Listed
Impaired Waters
NHDPlus Indexed
Dataset with Program
Attributes" shapefiles,
May 2015 version;
EPA "Impaired
Waters with TMDLs
NHDPlus Indexed
Dataset with Program
Attributes" shapefiles,
May 2015 version.
HUC12 Version:
NHDPlus2 WBD
Snapshot, EnviroAtlas
Version (February
2015 version).
Removed

320
% Waterbody
Area 303d-
Listed +
TMDLs (2015)
WBAREA_303D
TMDL_PCT
Percent of the area of lakes, estuaries,
and other areal water features in the
HUC12 with a TMDL or listed as
impaired and requiring a TMDL under
Section 303(d) of the Clean Water Act.
Source data for calculating the area of
waterbody features with a TMDL was
the EPA Office of Water TMDL Waters
geospatial dataset. Source data for
calculating the area of 303(d) listed
waterbody features was the EPA Office
of Water 303(d) Listed Waters geospatial
dataset. The denominator used for
percentage calculations is the area of
NHDPlus2 NHD Snapshot waterbodies
in the HUC12 plus any additional
custom-mapped waterbodies in the
TMDL Waters and 303(d) Listed Waters
datasets. Methods were applied to ensure
that waterbodies present in both the
TMDL Waters and 303(d) Listed Waters
datasets were not double-counted. (See
also TMDL Waters, 303(d) Listed
Waters, and NHD Snapshot glossary
definitions).
EPA "303(d) Listed
Impaired Waters
NHDPlus Indexed
Dataset with Program
Attributes" shapefiles,
May 2015 version;
EPA "Impaired
Waters with TMDLs
NHDPlus Indexed
Dataset with Program
Attributes" shapefiles,
May 2015 version;
NHDPlus2 NHD
Snapshot, downloaded
March 2014. HUC12
Version: NHDPlus2
WBD Snapshot,
EnviroAtlas Version
(February 2015
version).
Removed
Waterbody
Area 303d-
Listed (2015)
WBAREA_303D Area of lakes, estuaries, and other areal
water features listed as impaired and
requiring a TMDL under Section 303(d)
of the Clean Water Act in the HUC12
(square kilometers). Source data used for
calculating the area of waterbody
EPA "303(d) Listed
Impaired Waters
NHDPlus Indexed
Dataset with Program
Attributes" shapefiles,
May 2015 version.
Removed

321
features that are 303(d) listed was the
EPA Office of Water 303(d) Listed
Waters geospatial dataset. (See also
303(d) Listed Waters glossary
definition).
HUC12 Version:
NHDPlus2 WBD
Snapshot, EnviroAtlas
Version (February
2015 version).
% Waterbody
Area 303d-
Listed (2015)
WBAREA_303D
_PCT
Percent of the area of lakes, estuaries,
and other areal water features in the
HUC12 listed as impaired and requiring
a TMDL under Section 303(d) of the
Clean Water Act. Source data for
calculating the area of waterbody
features that are 303(d) listed was the
EPA Office of Water 303(d) Listed
Waters geospatial dataset. The
denominator used for percentage
calculations is the area of NHDPlus2
NHD Snapshot waterbodies in the
HUC12 plus any additional custom-
mapped waterbodies in the 303(d) Listed
Waters dataset. (See also 303(d) Listed
Waters and NHD Snapshot glossary
definitions).
EPA "303(d) Listed
Impaired Waters
NHDPlus Indexed
Dataset with Program
Attributes" shapefiles,
May 2015 version;
NHDPlus2 NHD
Snapshot, downloaded
March 2014. HUC12
Version: NHDPlus2
WBD Snapshot,
EnviroAtlas Version
(February 2015
version).
None

322
Waterbody
Area 303d-
Listed Custom
Adds (2015)
WBAREA_303D
_CUSTOM
Area of custom-added lake, estuary, and
other areal surface water features in the
EPA Office of Water 303(d) Listed
Waters dataset in the HUC12 (square
kilometers). Custom-added waterbody
features are those that are present in the
303(d) Listed Waters dataset only and do
not have a match in the NHDPlus2 NHD
Snapshot. The area of custom-added
waterbody features is used to calculate
indicators of the percentage of waterbody
area in a HUC12 that is 303(d) listed.
The denominator of percentage
calculations is total waterbody area in the
HUC12, calculated as NHD waterbody
area plus custom-added waterbody area.
(See also 303(d) Listed Waters and
NHDPlus2 NHD Snapshot glossary
definitions).
EPA "303(d) Listed
Impaired Waters
NHDPlus Indexed
Dataset with Program
Attributes" shapefiles,
May 2015 version.
HUC12 Version:
NHDPlus2 WBD
Snapshot, EnviroAtlas
Version (February
2015 version).
Removed
Nutrients 303d-
Listed
Segments
Count (2015)
CNT_303D_WA
TERS_NUTRIEN
TS
Count of surface water segments listed as
impaired due to nutrients and requiring a
TMDL under Section 303(d) of the Clean
Water Act in the HUC12. Calculated as
the number of unique state-assigned
surface water segment IDs with
"Nutrients", "Organic
Enrichment/Oxygen Depletion", "Algal
Growth", or "Noxious Aquatic Plants"
listed as a parent cause of impairment in
the HUC12 from the EPA Office of
Water 303(d) Listed Waters geospatial
EPA "303(d) Listed
Impaired Waters
NHDPlus Indexed
Dataset with Program
Attributes" shapefiles,
May 2015 version.
HUC12 Version:
NHDPlus2 WBD
Snapshot, EnviroAtlas
Version (February
2015 version).
Removed

323
dataset. (See also 303(d) Listed Waters
glossary definition).
Streamlength
303d-Listed
Nutrients
(2015)
STREAMLGTH_
303D_NUTRIEN
TS
Length of stream features listed as
impaired due to nutrient-related causes
and requiring a TMDL under Section
303(d) of the Clean Water Act in the
HUC12 (kilometers). Source data used
for calculating the length of stream
features that are 303(d) listed was the
EPA Office of Water 303(d) Listed
Waters geospatial dataset. Only includes
the length of stream features with
"Nutrients", "Organic
Enrichment/Oxygen Depletion", "Algal
Growth", or "Noxious Aquatic Plants"
listed as a parent cause of impairment.
(See also 303(d) Listed Waters glossary
definition).
EPA "303(d) Listed
Impaired Waters
NHDPlus Indexed
Dataset with Program
Attributes" shapefiles,
May 2015 version;
NHDPlus2 NHD
Snapshot, downloaded
March 2014. HUC12
Version: NHDPlus2
WBD Snapshot,
EnviroAtlas Version
(February 2015
version).
Removed

324
% Streamlength
303d-Listed
Nutrients
(2015)
STREAMLGTH_
303D_NUTRIEN
TS_PCT
Percent of streamlength in the HUC12
listed as impaired due to nutrient-related
causes and requiring a TMDL under
Section 303(d) of the Clean Water Act.
Source data for calculating the length of
stream features that are 303(d) listed was
the EPA Office of Water 303(d) Listed
Waters geospatial dataset. Only includes
the length of stream features with
"Nutrients", "Organic
Enrichment/Oxygen Depletion", "Algal
Growth", or "Noxious Aquatic Plants"
listed as a parent cause of impairment.
The denominator used for percentage
calculations (total streamlength) is the
length of NHDPlus2 NHD Snapshot
stream features plus any additional
custom-added streams in the 303(d)
Listed Waters dataset. (See also 303(d)
Listed Waters and NHD Snapshot
glossary definitions).
EPA "303(d) Listed
Impaired Waters
NHDPlus Indexed
Dataset with Program
Attributes" shapefiles,
May 2015 version;
NHDPlus2 NHD
Snapshot, downloaded
March 2014. HUC12
Version: NHDPlus2
WBD Snapshot,
EnviroAtlas Version
(February 2015
version).
Removed
Waterbody
Area 303d-
Listed Nutrients
(2015)
WBAREA_303D
_NUTRIENTS
Area of lakes, estuaries, and other areal
water features listed as impaired due to
nutrient-related causes and requiring a
TMDL under Section 303(d) of the Clean
Water Act in the HUC12 (kilometers).
Source data used for calculating the area
of waterbody features that are 303(d)
listed was the EPA Office of Water
303(d) Listed Waters geospatial dataset.
Only includes area of waterbodies with
EPA "303(d) Listed
Impaired Waters
NHDPlus Indexed
Dataset with Program
Attributes" shapefiles,
May 2015 version.
HUC12 Version:
NHDPlus2 WBD
Snapshot, EnviroAtlas
Removed

325
"Nutrients", "Organic
Enrichment/Oxygen Depletion", "Algal
Growth", or "Noxious Aquatic Plants"
listed as a parent cause of impairment.
(See also 303(d) Listed Waters glossary
definition).
Version (February
2015 version).
% Waterbody
Area 303d-
Listed Nutrients
(2015)
WBAREA_303D
_NUTRIENTS_P
CT
Percent of the area of lakes, estuaries,
and other areal water features in the
HUC12 listed as impaired due to
nutrient-related causes and requiring a
TMDL under Section 303(d) of the Clean
Water Act. Source data for calculating
the area of waterbody features that are
303(d) listed was the EPA Office of
Water 303(d) Listed Waters geospatial
dataset. Only includes area of
waterbodies with "Nutrients", "Organic
Enrichment/Oxygen Depletion", "Algal
Growth", or "Noxious Aquatic Plants"
listed as a parent cause of impairment.
The denominator used for percentage
calculations is the area of NHDPlus2
NHD Snapshot waterbodies in the
HUC12 plus any additional custom-
mapped waterbodies in the 303(d) Listed
Waters dataset. (See also 303(d) Listed
Waters and NHD Snapshot glossary
definitions).
EPA "303(d) Listed
Impaired Waters
NHDPlus Indexed
Dataset with Program
Attributes" shapefiles,
May 2015 version;
NHDPlus2 NHD
Snapshot, downloaded
March 2014. HUC12
Version: NHDPlus2
WBD Snapshot,
EnviroAtlas Version
(February 2015
version).
Removed
326
Pathogen 303d-
Listed
Segments
Count (2015)
CNT_303D_WA
TERS_PATHOG
ENS
Count of surface water segments listed as
impaired due to pathogens and requiring
a TMDL under Section 303(d) of the
Clean Water Act in the HUC12.
Calculated as the number of unique state-
assigned surface water segment IDs with
"Pathogens" listed as a parent cause of
impairment in the HUC12 from the EPA
Office of Water 303(d) Listed Waters
geospatial dataset. (See also 303(d)
Listed Waters glossary definition).
EPA "303(d) Listed
Impaired Waters
NHDPlus Indexed
Dataset with Program
Attributes" shapefiles,
May 2015 version.
HUC12 Version:
NHDPlus2 WBD
Snapshot, EnviroAtlas
Version (February
2015 version).
Removed
Streamlength
303d-Listed
Pathogens
(2015)
STREAMLGTH_
303D_PATHOGE
NS
Length of stream features listed as
impaired due to pathogens and requiring
a TMDL under Section 303(d) of the
Clean Water Act in the HUC12
(kilometers). Source data used for
calculating the length of stream features
that are 303(d) listed was the EPA Office
of Water 303(d) Listed Waters geospatial
dataset. Only includes the length of
stream features with "Pathogens" listed
as a parent cause of impairment. (See
also 303(d) Listed Waters glossary
definition).
EPA "303(d) Listed
Impaired Waters
NHDPlus Indexed
Dataset with Program
Attributes" shapefiles,
May 2015 version;
NHDPlus2 NHD
Snapshot, downloaded
March 2014. HUC12
Version: NHDPlus2
WBD Snapshot,
EnviroAtlas Version
(February 2015
version).
Removed

327
% Streamlength
303d-Listed
Pathogens
(2015)
STREAMLGTH_
303D_PATHOGE
NS_PCT
Percent of streamlength in the HUC12
listed as impaired due to pathogens and
requiring a TMDL under Section 303(d)
of the Clean Water Act. Source data for
calculating the length of stream features
that are 303(d) listed was the EPA Office
of Water 303(d) Listed Waters geospatial
dataset. Only includes the length of
stream features with "Pathogens" listed
as a parent cause of impairment. The
denominator used for percentage
calculations (total streamlength) is the
length of NHDPlus2 NHD Snapshot
stream features plus any additional
custom-added streams in the 303(d)
Listed Waters dataset. (See also 303(d)
Listed Waters and NHD Snapshot
glossary definitions).
EPA "303(d) Listed
Impaired Waters
NHDPlus Indexed
Dataset with Program
Attributes" shapefiles,
May 2015 version;
NHDPlus2 NHD
Snapshot, downloaded
March 2014. HUC12
Version: NHDPlus2
WBD Snapshot,
EnviroAtlas Version
(February 2015
version).
Removed
Waterbody
Area 303d-
Listed
Pathogens
(2015)
WBAREA_303D
_PATHOGENS
Area of lakes, estuaries, and other areal
water features listed as impaired due to
pathogens and requiring a TMDL under
Section 303(d) of the Clean Water Act in
the HUC12 (kilometers). Source data
used for calculating the area of
waterbody features that are 303(d) listed
was the EPA Office of Water 303(d)
Listed Waters geospatial dataset. Only
includes area of waterbodies with
"Pathogens" listed as a parent cause of
impairment. (See also 303(d) Listed
Waters glossary definition).
EPA "303(d) Listed
Impaired Waters
NHDPlus Indexed
Dataset with Program
Attributes" shapefiles,
May 2015 version.
HUC12 Version:
NHDPlus2 WBD
Snapshot, EnviroAtlas
Version (February
2015 version).
Removed

328
% Waterbody
Area 303d-
Listed
Pathogens
(2015)
WBAREA_303D
_PATHOGENS_
PCT
Area of lakes, estuaries, and other areal
water features in the HUC12 listed as
impaired due to pathogens and requiring
a TMDL under Section 303(d) of the
Clean Water Act. Source data for
calculating the area of waterbody
features that are 303(d) listed was the
EPA Office of Water 303(d) Listed
Waters geospatial dataset. The
denominator used for percentage
calculations is the area of NHDPlus2
NHD Snapshot waterbodies in the
HUC12 plus any additional custom-
mapped waterbodies in the 303(d) Listed
Waters dataset. (See also 303(d) Listed
Waters and NHD Snapshot glossary
definitions).
EPA "303(d) Listed
Impaired Waters
NHDPlus Indexed
Dataset with Program
Attributes" shapefiles,
May 2015 version;
NHDPlus2 NHD
Snapshot, downloaded
March 2014. HUC12
Version: NHDPlus2
WBD Snapshot,
EnviroAtlas Version
(February 2015
version).
Removed
Sediment 303d-
Listed
Segments
Count (2015)
CNT_303D_WA
TERS_SEDIMEN
T
Count of surface water segments listed as
impaired due to sediment and requiring a
TMDL under Section 303(d) of the Clean
Water Act in the HUC12. Calculated as
the number of unique state-assigned
surface water segment IDs with
"Sediment" or "Turbidity" listed as a
parent cause of impairment in the
HUC12 from the EPA Office of Water
303(d) Listed Waters geospatial dataset.
(See also 303(d) Listed Waters glossary
definition).
EPA "303(d) Listed
Impaired Waters
NHDPlus Indexed
Dataset with Program
Attributes" shapefiles,
May 2015 version.
HUC12 Version:
NHDPlus2 WBD
Snapshot, EnviroAtlas
Version (February
2015 version).
Removed

329
Streamlength
303d-Listed
Sediment
(2015)
STREAMLGTH_
303D_SEDIMEN
T
Length of stream features listed as
impaired due to sediment and requiring a
TMDL under Section 303(d) of the Clean
Water Act in the HUC12 (kilometers).
Source data used for calculating the
length of stream features that are 303(d)
listed was the EPA Office of Water
303(d) Listed Waters geospatial dataset.
Only includes the length of stream
features with "Sediment" or "Turbidity"
listed as a parent cause of impairment.
(See also 303(d) Listed Waters glossary
definition).
EPA "303(d) Listed
Impaired Waters
NHDPlus Indexed
Dataset with Program
Attributes" shapefiles,
May 2015 version;
NHDPlus2 NHD
Snapshot, downloaded
March 2014. HUC12
Version: NHDPlus2
WBD Snapshot,
EnviroAtlas Version
(February 2015
version).
Removed
% Streamlength
303d-Listed
Sediment
(2015)
STREAMLGTH_
303D_SEDIMEN
T_PCT
Percent of streamlength in the HUC12
listed as impaired due to sediment and
requiring a TMDL under Section 303(d)
of the Clean Water Act. Source data for
calculating the length of stream features
that are 303(d) listed was the EPA Office
of Water 303(d) Listed Waters geospatial
dataset. Only includes the length of
stream features with "Sediment" or
"Turbidity" listed as a parent cause of
impairment. The denominator used for
percentage calculations (total
streamlength) is the length of NHDPlus2
NHD Snapshot stream features plus any
additional custom-added streams in the
303(d) Listed Waters dataset. (See also
EPA "303(d) Listed
Impaired Waters
NHDPlus Indexed
Dataset with Program
Attributes" shapefiles,
May 2015 version;
NHDPlus2 NHD
Snapshot, downloaded
March 2014. HUC12
Version: NHDPlus2
WBD Snapshot,
EnviroAtlas Version
(February 2015
version).
Removed

330
303(d) Listed Waters and NHD Snapshot
glossary definitions).
Waterbody
Area 303d-
Listed Sediment
(2015)
WBAREA_303D
_SEDIMENT
Area of lakes, estuaries, and other areal
water features listed as impaired due to
sediment and requiring a TMDL under
Section 303(d) of the Clean Water Act in
the HUC12 (kilometers). Source data
used for calculating the area of
waterbody features that are 303(d) listed
was the EPA Office of Water 303(d)
Listed Waters geospatial dataset. Only
includes area of waterbodies with
"Sediment" or "Turbidity" listed as a
parent cause of impairment. (See also
303(d) Listed Waters glossary
definition).
EPA "303(d) Listed
Impaired Waters
NHDPlus Indexed
Dataset with Program
Attributes" shapefiles,
May 2015 version.
HUC12 Version:
NHDPlus2 WBD
Snapshot, EnviroAtlas
Version (February
2015 version).
Removed
331
% Waterbody
Area 303d-
Listed Sediment
(2015)
WBAREA_303D
_SEDIMENT_PC
T
Percent of the area of lakes, estuaries,
and other areal water features in the
HUC12 listed as impaired due to
sediment and requiring a TMDL under
Section 303(d) of the Clean Water Act.
Source data for calculating the area of
waterbody features that are 303(d) listed
was the EPA Office of Water 303(d)
Listed Waters geospatial dataset. Only
includes area of waterbodies with
"Sediment" or "Turbidity" listed as a
parent cause of impairment. The
denominator used for percentage
calculations is the area of NHDPlus2
NHD Snapshot waterbodies in the
HUC12 plus any additional custom-
mapped waterbodies in the 303(d) Listed
Waters dataset. (See also 303(d) Listed
Waters and NHD Snapshot glossary
definitions).
EPA "303(d) Listed
Impaired Waters
NHDPlus Indexed
Dataset with Program
Attributes" shapefiles,
May 2015 version;
NHDPlus2 NHD
Snapshot, downloaded
March 2014. HUC12
Version: NHDPlus2
WBD Snapshot,
EnviroAtlas Version
(February 2015
version).
Removed
Metals 303d-
Listed
Segments
Count (2015)
CNT_303D_WA
TERS_METALS
Count of surface water segments listed as
impaired due to metals and requiring a
TMDL under Section 303(d) of the Clean
Water Act in the HUC12. Calculated as
the number of unique state-assigned
surface water segment IDs with "Metals
(other than Mercury)" listed as a parent
cause of impairment in the HUC12 from
the EPA Office of Water 303(d) Listed
Waters geospatial dataset. (See also
EPA "303(d) Listed
Impaired Waters
NHDPlus Indexed
Dataset with Program
Attributes" shapefiles,
May 2015 version.
HUC12 Version:
NHDPlus2 WBD
Snapshot, EnviroAtlas
Version (February
2015 version).
Removed

332
303(d) Listed Waters glossary
definition).
Streamlength
303d-Listed
Metals (2015)
STREAMLGTH_
303D_METALS
Length of stream features listed as
impaired due to metals and requiring a
TMDL under Section 303(d) of the Clean
Water Act in the HUC12 (kilometers).
Source data used for calculating the
percent of stream features that are 303(d)
listed was the EPA Office of Water
303(d) Listed Waters geospatial dataset.
Only includes the length of stream
features with "Metals (other than
Mercury)" listed as a parent cause of
impairment. (See also 303(d) Listed
Waters glossary definition).
EPA "303(d) Listed
Impaired Waters
NHDPlus Indexed
Dataset with Program
Attributes" shapefiles,
May 2015 version;
NHDPlus2 NHD
Snapshot, downloaded
March 2014. HUC12
Version: NHDPlus2
WBD Snapshot,
EnviroAtlas Version
(February 2015
version).
Removed
% Streamlength
303d-Listed
Metals (2015)
STREAMLGTH_
303D_METALS_
PCT
Percent of streamlength in the HUC12
listed as impaired due to metals and
requiring a TMDL under Section 303(d)
of the Clean Water Act. Source data for
calculating the length of stream features
that are 303(d) listed was the EPA Office
of Water 303(d) Listed Waters geospatial
dataset. Only includes the length of
stream features with "Metals (other than
Mercury)" listed as a parent cause of
EPA "303(d) Listed
Impaired Waters
NHDPlus Indexed
Dataset with Program
Attributes" shapefiles,
May 2015 version;
NHDPlus2 NHD
Snapshot, downloaded
March 2014. HUC12
Version: NHDPlus2
Removed

333
impairment. The denominator used for
percentage calculations (total
streamlength) is the length of NHDPlus2
NHD Snapshot stream features plus any
additional custom-added streams in the
303(d) Listed Waters dataset. (See also
303(d) Listed Waters and NHD Snapshot
glossary definitions).
WBD Snapshot,
EnviroAtlas Version
(February 2015
version).
Waterbody
Area 303d-
Listed Metals
(2015)
WBAREA_303D
_METALS
Area of lakes, estuaries, and other areal
water features listed as impaired due to
metals and requiring a TMDL under
Section 303(d) of the Clean Water Act in
the HUC12 (kilometers). Source data
used for calculating the area of
waterbody features that are 303(d) listed
was the EPA Office of Water 303(d)
Listed Waters geospatial dataset. Only
includes area of waterbodies with
"Metals (other than Mercury)" listed as a
parent cause of impairment. (See also
303(d) Listed Waters glossary
definition).
EPA "303(d) Listed
Impaired Waters
NHDPlus Indexed
Dataset with Program
Attributes" shapefiles,
May 2015 version.
HUC12 Version:
NHDPlus2 WBD
Snapshot, EnviroAtlas
Version (February
2015 version).
Removed

334
% Waterbody
Area 303d-
Listed Metals
(2015)
WBAREA_303D
_METALS_PCT
Percent of the area of lakes, estuaries,
and other areal water features in the
HUC12 listed as impaired due to metals
and requiring a TMDL under Section
303(d) of the Clean Water Act. Source
data for calculating the area of waterbody
features that are 303(d) listed was the
EPA Office of Water 303(d) Listed
Waters geospatial dataset. Only includes
area of waterbodies with "Metals (other
than Mercury)" listed as a parent cause of
impairment. The denominator used for
percentage calculations is the area of
NHDPlus2 NHD Snapshot waterbodies
in the HUC12 plus any additional
custom-mapped waterbodies in the
303(d) Listed Waters dataset. (See also
303(d) Listed Waters and NHD Snapshot
glossary definitions).
EPA "303(d) Listed
Impaired Waters
NHDPlus Indexed
Dataset with Program
Attributes" shapefiles,
May 2015 version;
NHDPlus2 NHD
Snapshot, downloaded
March 2014. HUC12
Version: NHDPlus2
WBD Snapshot,
EnviroAtlas Version
(February 2015
version).
Removed
Neutral
Variable,
Stressor
Category
NEUTRAL_STR Equal to 0.5 for all HUC12s. Can be used
for an analysis that focuses on just the
Ecological and Social indicator
categories, with the Stressor category left
out. If using this indicator do not select
any other Stressor indicators.
Not applicable. Removed
% of HUC12
Instate
INST2013_PCT Percent of total HUC12 area that is
comprised by a specific named state.
Source data was the US Census Bureau
2013 TIGER state boundary dataset from
http://www2.census.gov/geo/tiger/TIGE
R2013/STATE/ downloaded in July
US Census Bureau
TIGER state boundary
polygons (2013
version). HUC12
Version: NHDPlus2
WBD Snapshot,
Removed

335
2013. Equation used: Instate Area /
HUC12 Area * 100.
EnviroAtlas Version
(February 2015
version).
Single State in
HUC12 Flag
INSTATE_SOC_
2013
Flag indicating whether the HUC12 is
located entirely within a single state. A
value of 1 means that the HUC12 is
located in one state and a value of 0
means that the HUC12 crosses multiple
states. Source data was the US Census
Bureau 2013 TIGER state boundary
dataset
(http://www2.census.gov/geo/tiger/TIGE
R2013/STATE/; downloaded July 2013).
US Census Bureau
TIGER state boundary
polygons (2013
version). HUC12
Version: NHDPlus2
WBD Snapshot,
EnviroAtlas Version
(February 2015
version).
Removed
% Any IUCN
Status
IUCN_ALL_PCT
_WS
Percent of the HUC12 that is designated
as protected by the International Union
for Conservation of Nature (IUCN).
Lands considered protected by the IUCN
have long-term protections in place to
conserve ecosystem services and cultural
values; they include lands held by
national, state, or local governments,
non-profit organizations, and voluntarily
protected private land. Source data was
the Protected Areas Database of the
United States Version 1.2 from the
USGS Gap Analysis Program
(http://gapanalysis.usgs.gov/). Includes
all lands that have been classified by the
IUCN as protected areas; IUCN
EPA EnviroAtlas
"Protected Lands for
the Conterminous
United States" dataset.
May 7, 2015 version.
Removed

336
categories include Ia, Ib, II, III, IV, V,
and VI. Equation used: IUCN Protected
Land Area / HUC12 Area * 100. This
indicator was calculated for EPA
EnviroAtlas. Additional information on
source data and calculation methods can
be found at:
https://edg.epa.gov/metadata/catalog/sear
ch/resource/details.page?uuid=%7BC5F
FDE8E-7C27-4F50-AFEF-
082E8A08C00A%7D.
% Protected
Land, IUCN
Status Ia
IUCN_IA_PCT_
WS
Percent of the HUC12 that is designated
as an International Union for
Conservation of Nature (IUCN) Category
Ia protected area. Category Ia lands are
nature reserves set aside to protect
biodiversity and also possibly
geological/geomorphologic features,
where human visitation, use, and impacts
are strictly controlled and limited to
ensure preservation of the conservation
values. Source data was the Protected
Areas Database of the United States
Version 1.2 from the USGS Gap
Analysis Program
(http://gapanalysis.usgs.gov/). Equation
used: IUCN Category Ia Protected Land
Area / HUC12 Area * 100. This indicator
EPA EnviroAtlas
"Protected Lands for
the Conterminous
United States" dataset.
May 7, 2015 version.
Removed
337
was calculated for EPA EnviroAtlas.
Additional information on source data
and calculation methods can be found at:
https://edg.epa.gov/metadata/catalog/sear
ch/resource/details.page?uuid=%7BC5F
FDE8E-7C27-4F50-AFEF-
082E8A08C00A%7D.
% Protected
Land, IUCN
Status II
IUCN_II_PCT_W
S
Percent of the HUC12 that is designated
as an International Union for
Conservation of Nature (IUCN) Category
II protected area. Category II lands are
large natural or near natural national park
areas set aside to protect large-scale
ecological processes, along with the
complement of species and ecosystems
characteristic of the area, which also
provide a foundation for environmentally
and culturally compatible spiritual,
scientific, educational, recreational and
visitor opportunities. Source data was the
Protected Areas Database of the United
States Version 1.2 from the USGS Gap
Analysis Program
(http://gapanalysis.usgs.gov/). Equation
used: IUCN Category II Protected Land
Area / HUC12 Area * 100. This indicator
EPA EnviroAtlas
"Protected Lands for
the Conterminous
United States" dataset.
May 7, 2015 version.
Removed

338
was calculated for EPA EnviroAtlas.
Additional information on source data
and calculation methods can be found at:
https://edg.epa.gov/metadata/catalog/sear
ch/resource/details.page?uuid=%7BC5F
FDE8E-7C27-4F50-AFEF-
082E8A08C00A%7D.
% Protected
Land, IUCN
Status III
IUCN_III_PCT_
WS
Percent of the HUC12 that is designated
as an International Union for
Conservation of Nature (IUCN) Category
III protected area. Category III lands are
set aside to protect a specific natural
monument, which can be a land form,
sea mount, submarine caverns,
geological feature such as caves or even
a living feature such as an ancient grove.
They are generally quite small protected
areas and often have high visitor value.
Source data was the Protected Areas
Database of the United States Version
1.2 from the USGS Gap Analysis
Program (http://gapanalysis.usgs.gov/).
Equation used: IUCN Category III
Protected Land Area / HUC12 Area *
EPA EnviroAtlas
"Protected Lands for
the Conterminous
United States" dataset.
May 7, 2015 version.
Removed
339
100. This indicator was calculated for
EPA EnviroAtlas. Additional
information on source data and
calculation methods can be found at:
https://edg.epa.gov/metadata/catalog/sear
ch/resource/details.page?uuid=%7BC5F
FDE8E-7C27-4F50-AFEF-
082E8A08C00A%7D.
% Protected
Land, IUCN
Status IV
IUCN_IV_PCT_
WS
Percent of the HUC12 that is designated
as an International Union for
Conservation of Nature (IUCN) Category
IV protected area. Category IV lands set
aside to protect particular species or
habitats and management reflects this
priority. Many category IV protected
areas will need regular, active
interventions to address the requirements
of particular species or to maintain
habitats, but this is not a requirement of
this category. Source data was the
Protected Areas Database of the United
States Version 1.2 from the USGS Gap
Analysis Program
(http://gapanalysis.usgs.gov/). Equation
used: IUCN Category IV Protected Land
Area / HUC12 Area * 100. This indicator
EPA EnviroAtlas
"Protected Lands for
the Conterminous
United States" dataset.
May 7, 2015 version.
Removed

340
was calculated for EPA EnviroAtlas.
Additional information on source data
and calculation methods can be found at:
https://edg.epa.gov/metadata/catalog/sear
ch/resource/details.page?uuid=%7BC5F
FDE8E-7C27-4F50-AFEF-
082E8A08C00A%7D.
% Protected
Land, IUCN
Status V
IUCN_V_PCT_
WS
Percent of the HUC12 that is designated
as an International Union for
Conservation of Nature (IUCN) Category
V protected area. Category V lands occur
where the interaction of people and
nature over time has produced an area of
distinct character with significant
ecological, biological, cultural and scenic
value. Source data was the Protected
Areas Database of the United States
Version 1.2 from the USGS Gap
Analysis Program
(http://gapanalysis.usgs.gov/). Equation
used: IUCN Category V Protected Land
Area / HUC12 Area * 100. This indicator
was calculated for EPA EnviroAtlas.
Additional information on source data
and calculation methods can be found at:
EPA EnviroAtlas
"Protected Lands for
the Conterminous
United States" dataset.
May 7, 2015 version.
Removed

341
https://edg.epa.gov/metadata/catalog/sear
ch/resource/details.page?uuid=%7BC5F
FDE8E-7C27-4F50-AFEF-
082E8A08C00A%7D.
% Protected
Land, IUCN
Status VI
IUCN_VI_PCT_
WS
Percent of the HUC12 that is designated
as an International Union for
Conservation of Nature (IUCN) Category
VI protected area. Category VI lands
have sustainable use (community based,
non industrial) of natural resources, with
much of the area in a more-or-less
natural condition and a proportion of
land under sustainable natural resource
management. Source data was the
Protected Areas Database of the United
States Version 1.2 from the USGS Gap
Analysis Program
(http://gapanalysis.usgs.gov/). Equation
used: IUCN Category VI Protected Land
Area / HUC12 Area * 100. This indicator
was calculated for EPA EnviroAtlas.
Additional information on source data
and calculation methods can be found at:
EPA EnviroAtlas
"Protected Lands for
the Conterminous
United States" dataset.
May 7, 2015 version.
Removed

342
https://edg.epa.gov/metadata/catalog/sear
ch/resource/details.page?uuid=%7BC5F
FDE8E-7C27-4F50-AFEF-
082E8A08C00A%7D.
% Protected
Land, IUCN
Status Ib
IUCN_IB_PCT_
WS
Percent of the HUC12 that is designated
as an International Union for
Conservation of Nature (IUCN) Category
Ib protected area. Category Ib lands are
wilderness areas that are usually large
unmodified or slightly modified areas,
retaining their natural character and
influence, without permanent or
significant human habitation, which are
protected and managed so as to preserve
their natural condition. Source data was
the Protected Areas Database of the
United States Version 1.2 from the
USGS Gap Analysis Program
(http://gapanalysis.usgs.gov/). Equation
used: IUCN Category Ib Protected Land
Area / HUC12 Area * 100. This indicator
was calculated for EPA EnviroAtlas.
Additional information on source data
EPA EnviroAtlas
"Protected Lands for
the Conterminous
United States" dataset.
May 7, 2015 version.
Removed

343
and calculation methods can be found at:
https://edg.epa.gov/metadata/catalog/sear
ch/resource/details.page?uuid=%7BC5F
FDE8E-7C27-4F50-AFEF-
082E8A08C00A%7D.

344
% GAP Status 1
and 2
GAP_PROT_1_2
_PCT_WS
Percent of the HUC12 designated as
having Status 1 or Status 2 protection by
the USGS Gap Analysis Program. Status
1 lands are defined as having permanent
protection from conversion of natural
land cover and a mandated management
plan in operation to maintain a natural
state within which disturbance events (of
natural type, frequency, intensity, and
legacy) are allowed to proceed without
interference or are mimicked through
management. Status 2 lands are defined
as having permanent protection from
conversion of natural land cover and a
mandated management plan in operation
to maintain a primarily natural state, but
which may receive uses or management
practices that degrade the quality of
existing natural communities, including
suppression of natural disturbance. These
include lands held by national, state, or
local governments or non-profit
organizations, as well as voluntarily
protected private lands. Source data used
was the Protected Areas Database of the
United States Version 1.2 from the
USGS Gap Analysis Program
(http://gapanalysis.usgs.gov/). Equation
used: (Status 1 Area + Status 2 Area) /
HUC12 Area * 100. This indicator was
calculated for EPA EnviroAtlas.
EPA EnviroAtlas
"Protected Lands for
the Conterminous
United States" dataset.
May 7, 2015 version.
Removed

345
Additional information on source data
and calculation methods can be found at:
https://edg.epa.gov/metadata/catalog/sear
ch/resource/details.page?uuid=%7BC5F
FDE8E-7C27-4F50-AFEF-
082E8A08C00A%7D

346
% GAP Status 3 GAP_PROT_3_P
CT_WS
Percent of the HUC12 that is designated
as having Status 3 protection by the
USGS Gap Analysis Program. Status 3
lands are defined as having permanent
protection from conversion of natural
land cover for the majority of the area
but are subject to extractive uses of either
a broad, low-intensity type (e.g., logging)
or localized intense type (e.g., mining). It
also confers protection to federally listed
endangered and threatened species
throughout the area. These include lands
held by national, state, or local
governments or non-profit organizations,
as well as voluntarily protected private
lands. Source data used was the
Protected Areas Database of the United
States Version 1.2 from the USGS Gap
Analysis Program
(http://gapanalysis.usgs.gov/). Equation
used: Status 3 Area / HUC12 Area * 100.
This indicator was calculated for EPA
EnviroAtlas. Additional information on
source data and calculation methods can
be found at:
https://edg.epa.gov/metadata/catalog/sear
ch/resource/details.page?uuid=%7BC5F
FDE8E-7C27-4F50-AFEF-
082E8A08C00A%7D
EPA EnviroAtlas
"Protected Lands for
the Conterminous
United States" dataset.
May 7, 2015 version.
Removed

347
% GAP Status
1, 2, and 3
GAP_PROT_1_2
_3_PCT_WS
Percent of the HUC12 designated as
having Status 1, Status 2, or Status 3
protection by the USGS Gap Analysis
Program. Status 1 lands are defined as
having permanent protection from
conversion of natural land cover and a
mandated management plan in operation
to maintain a natural state within which
disturbance events (of natural type,
frequency, intensity, and legacy) are
allowed to proceed without interference
or are mimicked through management.
Status 2 lands are defined as having
permanent protection from conversion of
natural land cover and a mandated
management plan in operation to
maintain a primarily natural state, but
which may receive uses or management
practices that degrade the quality of
existing natural communities, including
suppression of natural disturbance. Status
3 lands are defined as having permanent
protection from conversion of natural
land cover for the majority of the area
but are subject to extractive uses of either
a broad, low-intensity type (e.g., logging)
or localized intense type (e.g., mining).
These include lands held by national,
state, or local governments or non-profit
organizations, as well as voluntarily
protected private lands. Source data used
EPA EnviroAtlas
"Protected Lands for
the Conterminous
United States" dataset.
May 7, 2015 version.
Removed
348
was the Protected Areas Database of the
United States Version 1.2 from the
USGS Gap Analysis Program
(http://gapanalysis.usgs.gov/). Equation
used: (Status 1 Area + Status 2 Area +
Status 3 Area) / HUC12 Area * 100. This
indicator was calculated for EPA
EnviroAtlas. Additional information on
source data and calculation methods can
be found at:
https://edg.epa.gov/metadata/catalog/sear
ch/resource/details.page?uuid=%7BC5F
FDE8E-7C27-4F50-AFEF-
082E8A08C00A%7D
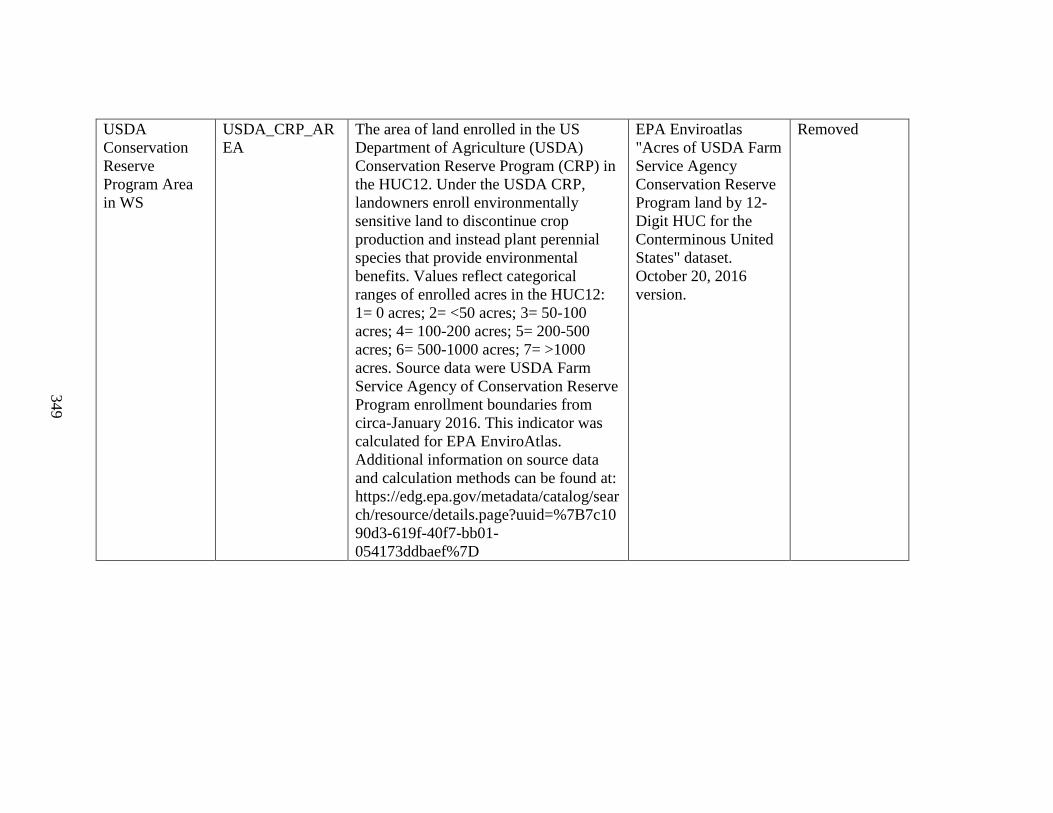
349
USDA
Conservation
Reserve
Program Area
in WS
USDA_CRP_AR
EA
The area of land enrolled in the US
Department of Agriculture (USDA)
Conservation Reserve Program (CRP) in
the HUC12. Under the USDA CRP,
landowners enroll environmentally
sensitive land to discontinue crop
production and instead plant perennial
species that provide environmental
benefits. Values reflect categorical
ranges of enrolled acres in the HUC12:
1= 0 acres; 2= <50 acres; 3= 50-100
acres; 4= 100-200 acres; 5= 200-500
acres; 6= 500-1000 acres; 7= >1000
acres. Source data were USDA Farm
Service Agency of Conservation Reserve
Program enrollment boundaries from
circa-January 2016. This indicator was
calculated for EPA EnviroAtlas.
Additional information on source data
and calculation methods can be found at:
https://edg.epa.gov/metadata/catalog/sear
ch/resource/details.page?uuid=%7B7c10
90d3-619f-40f7-bb01-
054173ddbaef%7D
EPA Enviroatlas
"Acres of USDA Farm
Service Agency
Conservation Reserve
Program land by 12-
Digit HUC for the
Conterminous United
States" dataset.
October 20, 2016
version.
Removed

350
Drinking Water
Source
Protection Area,
Cumulative
DW14_SWPA_P
CTCUM_WS
Percent of the HUC12 that is classified
as a source water protection area
(SWPA) for one or more public water
system (PWS) drinking water sources.
Source data was a SWPA geospatial
dataset from the EPA Safe Drinking
Water Information System (SDWIS;
extracted December 2014). Calculated
from the area of all SWPAs in the
HUC12; overlapping SWPAs are
counted separately and percentages can
therefore exceed 100% if the HUC12
contains multiple overlapping SWPAs.
Equation used: SWPA Area / HUC12
Area * 100.
EPA Safe Drinking
Water Information
System (SDWIS;
extracted December
2014). Processed for
WATERSCAPE by
Seth Mann in fall
2014.
Removed
Drinking Water
Source
Protection Area,
Total
DW14_SWPA_P
CTAREA_WS
Percent of the HUC12 that is classified
as a source water protection area
(SWPA) for public water system (PWS)
drinking water sources. Source data was
a SWPA geospatial dataset from the EPA
Safe Drinking Water Information System
(SDWIS; extracted December 2014).
Calculated from the area of SWPAs in
the HUC12; overlapping SWPAs are
counted only once and percentages
therefore cannot exceed 100%. Equation
used: SWPA Area / HUC12 Area * 100.
EPA Safe Drinking
Water Information
System (SDWIS;
extracted December
2014). Processed for
WATERSCAPE by
Seth Mann in fall
2014.
Removed

351
Drinking
Groundwater
Well Count
DW14_GWCOU
NT_WS
Count of drinking water groundwater
wells in the HUC12. Only includes
public water system (PWS) groundwater
wells that are located in the HUC12.
Source data was a groundwater well
geospatial dataset from the EPA Safe
Drinking Water Information System
(SDWIS; extracted December 2014).
EPA Safe Drinking
Water Information
System (SDWIS;
extracted December
2014). Processed for
WATERSCAPE by
Seth Mann in fall
2014.
Removed
Drinking
Groundwater
Population
Served
DW14_GWPOPU
L_CNT_WS
Count of population served by
groundwater sources of drinking water in
the HUC12. Only includes the population
served by public water system (PWS)
groundwater sources that have a
designated source water protection area
(SWPA) in the HUC12. Source data was
a SWPA geospatial dataset from the EPA
Safe Drinking Water Information System
(SDWIS; extracted December 2014).
Calculated as the sum of the population
served for all groundwater SWPAs in the
HUC12.
EPA Safe Drinking
Water Information
System (SDWIS;
extracted December
2014). Processed for
WATERSCAPE by
Seth Mann in fall
2014.
Removed
Drinking
Surface Water
Population
Served
DW14_SWPOPU
L_CNT_WS
Count of population served by surface
water sources of drinking water in the
HUC12. Only includes the population
served by public water system (PWS)
surface water sources that have a
designated source water protection area
(SWPA) in the HUC12. Source data was
a SWPA geospatial dataset from the EPA
Safe Drinking Water Information System
(SDWIS; extracted December 2014).
EPA Safe Drinking
Water Information
System (SDWIS;
extracted December
2014). Processed for
WATERSCAPE by
Seth Mann in fall
2014.
Removed

352
Calculated as the sum of the population
served for all surface water SWPAs in
the HUC12.
% Potentially
Restorable
Wetlands
WTLD_REST_P
OT_PCT_WS
Percent of the HUC12 that is classified
as a potentially restorable wetland.
Potentially restorable wetlands are lands
with agricultural cover that naturally
accumulate water and historically had
poor drainage and hydric soils. Source
data for mapping potentially restorable
wetlands were the National Land Cover
Database (NLCD) 2006 Land Cover
dataset, the National Elevation Dataset
(NED), and the Natural Resources
Conservation Service (NRCS) 2009
SSURGO and STATSGO soil attributes
datasets. Potentially restorable wetlands
were mapped as areas with: (1)
pasture/hay or cultivated crop cover in
NLCD 2006 (classes 81 & 82); (2) a
compound topographic index (CTI)
greater than 550 calculated from the
NED; and (3) areas with poorly drained
or very poorly drained soils from the
SSURGO/STATSGO datasets. Equation
used: Area of Potentially Restorable
Wetlands in HUC12 / HUC12 Land Area
EPA EnviroAtlas
"Percent Land Cover
with Potentially
Restorable Wetlands
on Agricultural Land
per 12-Digit HUC -
Contiguous United
States" dataset. May
20, 2016 version.
Removed
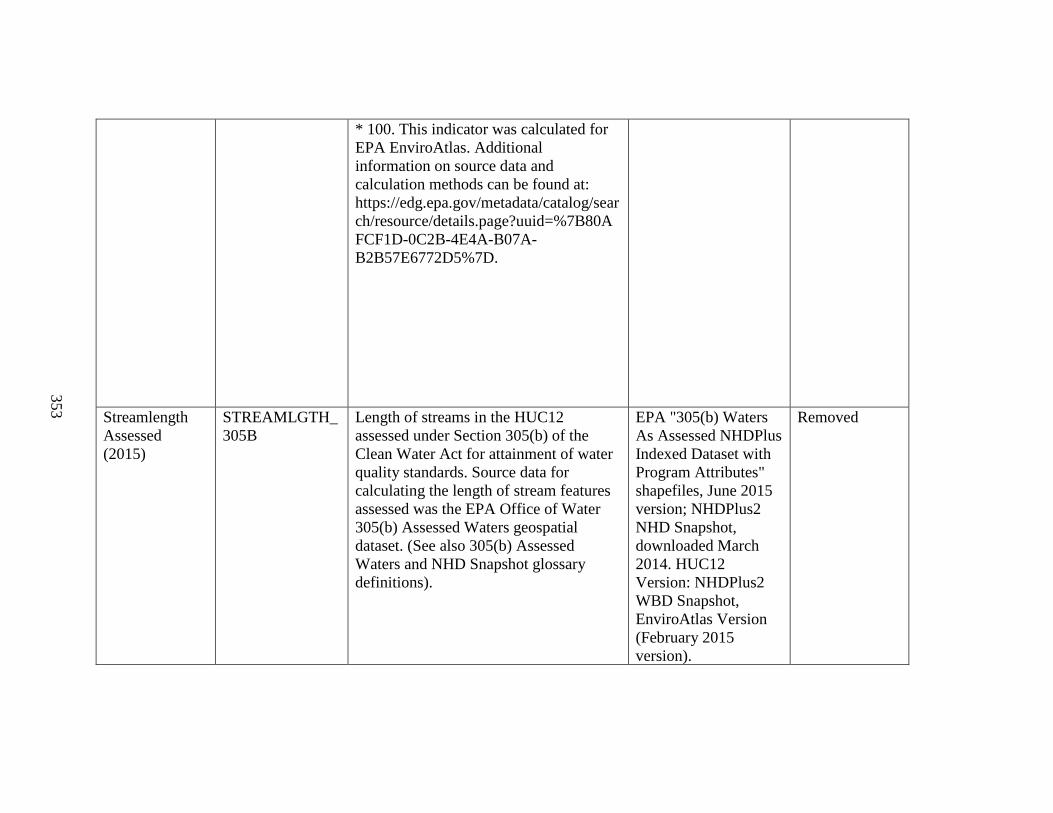
353
* 100. This indicator was calculated for
EPA EnviroAtlas. Additional
information on source data and
calculation methods can be found at:
https://edg.epa.gov/metadata/catalog/sear
ch/resource/details.page?uuid=%7B80A
FCF1D-0C2B-4E4A-B07A-
B2B57E6772D5%7D.
Streamlength
Assessed
(2015)
STREAMLGTH_
305B
Length of streams in the HUC12
assessed under Section 305(b) of the
Clean Water Act for attainment of water
quality standards. Source data for
calculating the length of stream features
assessed was the EPA Office of Water
305(b) Assessed Waters geospatial
dataset. (See also 305(b) Assessed
Waters and NHD Snapshot glossary
definitions).
EPA "305(b) Waters
As Assessed NHDPlus
Indexed Dataset with
Program Attributes"
shapefiles, June 2015
version; NHDPlus2
NHD Snapshot,
downloaded March
2014. HUC12
Version: NHDPlus2
WBD Snapshot,
EnviroAtlas Version
(February 2015
version).
Removed

354
% Streamlength
Assessed
(2015)
STREAMLGTH_
305B_PCT
Percent of streamlength in the HUC12
assessed under Section 305(b) of the
Clean Water Act for attainment of water
quality standards. Source data for
calculating the length of stream features
assessed was the EPA Office of Water
305(b) Assessed Waters geospatial
dataset. The denominator used for
percentage calculations (total
streamlength) is the length of NHDPlus2
NHD Snapshot stream features plus any
additional custom-added stream features
in the 305(b) Assessed Waters dataset.
(See also 305(b) Assessed Waters and
NHD Snapshot glossary definitions).
EPA "305(b) Waters
As Assessed NHDPlus
Indexed Dataset with
Program Attributes"
shapefiles, June 2015
version; NHDPlus2
NHD Snapshot,
downloaded March
2014. HUC12
Version: NHDPlus2
WBD Snapshot,
EnviroAtlas Version
(February 2015
version).
Removed
Streamlength
Assessed
Custom Adds
(2015)
STREAMLGTH_
305B_CUSTOM
Length of custom-added stream features
in the EPA Office of Water 305(b)
Assessed Waters dataset in the HUC12
(kilometers). Custom-added stream
features are those that are present in the
305(b) Assessed Waters dataset only and
do not have a match in the NHDPlus2
NHD Snapshot. The length of custom-
added stream features is used to calculate
indicators of the percentage of
streamlength in a HUC12 that is 305(b)
assessed. The denominator of percentage
calculations is total streamlength in the
HUC12, calculated as NHD streamlength
plus custom-added streamlength. (See
EPA "305(b) Waters
As Assessed NHDPlus
Indexed Dataset with
Program Attributes"
shapefiles, June 2015
version; NHDPlus2
NHD Snapshot,
downloaded March
2014. HUC12
Version: NHDPlus2
WBD Snapshot,
EnviroAtlas Version
(February 2015
version).
Removed

355
also 305(b) Assessed Waters and NHD
Snapshot glossary definitions).
Waterbody
Area Assessed
(2015)
WBAREA_305B Area of lakes, estuaries, and other areal
water features in the HUC12 assessed
under Section 305(b) of the Clean Water
Act for attainment of water quality
standards (square kilometers). Source
data used for calculating the area of
waterbodies assessed was the EPA
Office of Water 305(b) Assessed Waters
geospatial dataset. (See also 305(b)
Assessed Waters glossary definition).
EPA "305(b) Waters
As Assessed NHDPlus
Indexed Dataset with
Program Attributes"
shapefiles, June 2015
version. HUC12
Version: NHDPlus2
WBD Snapshot,
EnviroAtlas Version
(February 2015
version).
Removed
% Waterbody
Area Assessed
(2015)
WBAREA_305B
_PCT
Percent of the area of lakes, estuaries,
and other areal water features in the
HUC12 assessed under Section 305(b) of
the Clean Water Act. Source data for
calculating the area of waterbodies
assessed was the EPA Office of Water
305(b) Assessed Waters geospatial
dataset. The denominator used for
percentage calculations (total waterbody
area) is the area of NHDPlus2 NHD
Snapshot waterbodies plus any additional
EPA "305(b) Waters
As Assessed NHDPlus
Indexed Dataset with
Program Attributes"
shapefiles, June 2015
version; NHDPlus2
NHD Snapshot,
downloaded March
2014. HUC12
Version: NHDPlus2
WBD Snapshot,
Removed

356
custom-added waterbodies in the 305(b)
Assessed Waters dataset. (See also
305(b) Assessed Waters and NHD
Snapshot glossary definitions).
EnviroAtlas Version
(February 2015
version).
Waterbody
Area Assessed
Custom Adds
(2015)
WBAREA_305B
_CUSTOM
Area of custom-added lakes, estuaries,
and other areal water features in the EPA
Office of Water 305(b) Assessed Waters
dataset in the HUC12 (square
kilometers). Custom-added waterbody
features are those that are present in the
305(b) Assessed Waters dataset only and
do not have a match in the NHDPlus2
NHD Snapshot. The area of custom-
added waterbody features is used to
calculate indicators of the percentage of
waterbody area in a HUC12 that is
305(b) assessed. The denominator of
percentage calculations is total
waterbody area in the HUC12, calculated
as NHD waterbody area plus custom-
added waterbody area. (See also 305(b)
Assessed Waters and NHD Snapshot
glossary definitions).
EPA "305(b) Waters
As Assessed NHDPlus
Indexed Dataset with
Program Attributes"
shapefiles, June 2015
version. HUC12
Version: NHDPlus2
WBD Snapshot,
EnviroAtlas Version
(February 2015
version).
Removed
Streamlength
with TMDLs
(2015)
STREAMLGTH_
TMDL
Length of stream features with TMDLs
in the HUC12 (kilometers). Source data
used for calculating the length of stream
features with TMDLs was the EPA
EPA "Impaired
Waters with TMDLs
NHDPlus Indexed
Dataset with Program
Removed
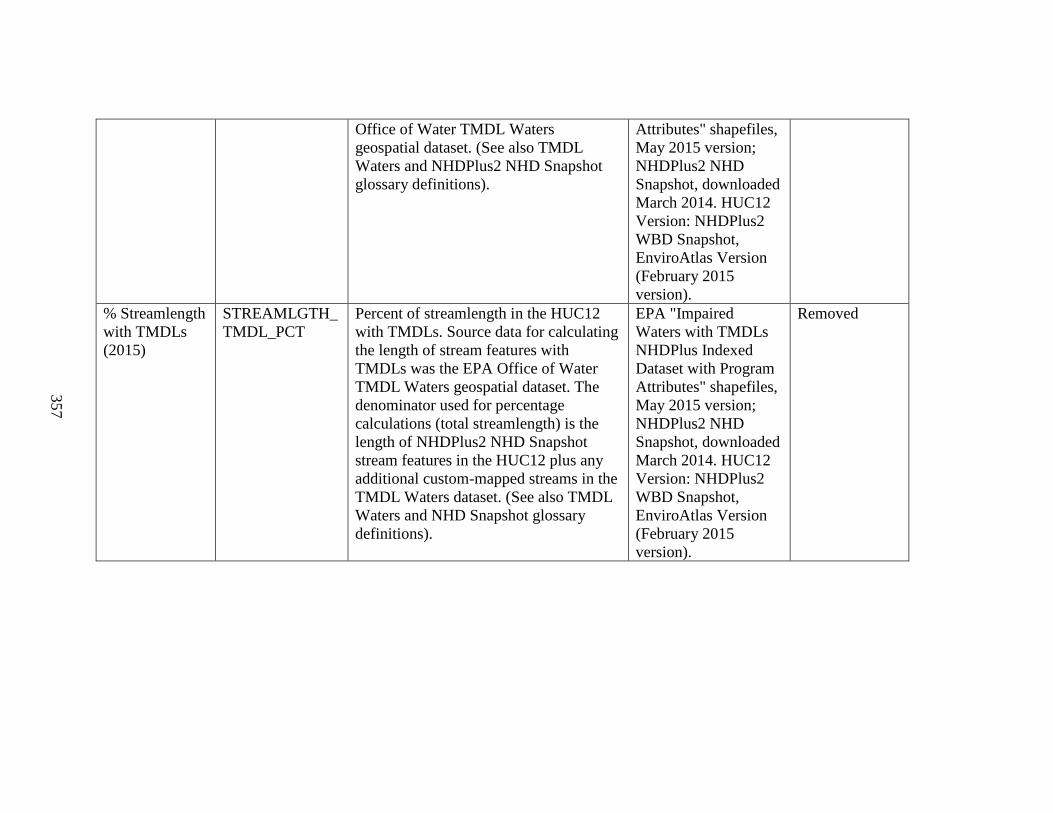
357
Office of Water TMDL Waters
geospatial dataset. (See also TMDL
Waters and NHDPlus2 NHD Snapshot
glossary definitions).
Attributes" shapefiles,
May 2015 version;
NHDPlus2 NHD
Snapshot, downloaded
March 2014. HUC12
Version: NHDPlus2
WBD Snapshot,
EnviroAtlas Version
(February 2015
version).
% Streamlength
with TMDLs
(2015)
STREAMLGTH_
TMDL_PCT
Percent of streamlength in the HUC12
with TMDLs. Source data for calculating
the length of stream features with
TMDLs was the EPA Office of Water
TMDL Waters geospatial dataset. The
denominator used for percentage
calculations (total streamlength) is the
length of NHDPlus2 NHD Snapshot
stream features in the HUC12 plus any
additional custom-mapped streams in the
TMDL Waters dataset. (See also TMDL
Waters and NHD Snapshot glossary
definitions).
EPA "Impaired
Waters with TMDLs
NHDPlus Indexed
Dataset with Program
Attributes" shapefiles,
May 2015 version;
NHDPlus2 NHD
Snapshot, downloaded
March 2014. HUC12
Version: NHDPlus2
WBD Snapshot,
EnviroAtlas Version
(February 2015
version).
Removed

358
Streamlength
with TMDLs
Custom Adds
(2015)
STREAMLGTH_
TMDL_CUSTO
M
Length of custom-added stream features
in the EPA Office of Water TMDL
Waters geospatial dataset (kilometers).
Custom-added stream features are those
that are present in the TMDL Waters
dataset only and do not have a match in
the NHDPlus2 NHD Snapshot. The
length of custom-added stream features
is used to calculate indicators of the
percentage of streamlength in a HUC12
that have a TMDL. The denominator of
percentage calculations is total
streamlength in the HUC12, calculated as
NHD streamlength plus custom-added
streamlength. (See also TMDL Waters
and NHDPlus2 NHD Snapshot glossary
definitions).
EPA "Impaired
Waters with TMDLs
NHDPlus Indexed
Dataset with Program
Attributes" shapefiles,
May 2015 version;
NHDPlus2 NHD
Snapshot, downloaded
March 2014. HUC12
Version: NHDPlus2
WBD Snapshot,
EnviroAtlas Version
(February 2015
version).
Removed
Waterbody
Area with
TMDLs (2015)
WBAREA_TMD
L
Area of lakes, estuaries, and other areal
water features with TMDLs in the
HUC12 (square kilometers). Source data
used for calculating the area of
waterbody features with TMDLs was the
EPA Office of Water TMDL Waters
geospatial dataset. (See also TMDL
Waters glossary definition).
EPA "Impaired
Waters with TMDLs
NHDPlus Indexed
Dataset with Program
Attributes" shapefiles,
May 2015 version.
HUC12 Version:
NHDPlus2 WBD
Snapshot, EnviroAtlas
Version (February
2015 version).
Removed

359
% Waterbody
Area with
TMDLs (2015)
WBAREA_TMD
L_PCT
Percent of the area of lakes, estuaries,
and other areal water features in the
HUC12 with TMDLs. Source data for
calculating the area of waterbody
features with TMDLs was the EPA
Office of Water TMDL Waters
geospatial dataset. The denominator used
for percentage calculations is the area of
NHDPlus2 NHD Snapshot waterbodies
in the HUC12 plus any additional
custom-mapped waterbodies in the
TMDL Waters dataset. (See also TMDL
Waters dataset and NHD Snapshot
glossary definitions).
EPA "Impaired
Waters with TMDLs
NHDPlus Indexed
Dataset with Program
Attributes" shapefiles,
May 2015 version;
NHDPlus2 NHD
Snapshot, downloaded
March 2014. HUC12
Version: NHDPlus2
WBD Snapshot,
EnviroAtlas Version
(February 2015
version).
Removed
Waterbody
Area with
TMDLs
Custom Adds
(2015)
WBAREA_TMD
L_CUSTOM
Area of custom-added lakes, estuaries,
and other areal water features in the EPA
Office of Water TMDL Waters
geospatial dataset (square kilometers).
Custom-added waterbody features are
those that are present in the TMDL
Waters dataset only and do not have a
match in the NHDPlus2 NHD Snapshot.
The area of custom-added waterbody
features is used to calculate indicators of
the percentage of waterbody area in a
HUC12 with TMDLs. The denominator
of percentage calculations is total
waterbody area in the HUC12, calculated
as NHD waterbody area plus custom-
added waterbody area. (See also TMDL
EPA "Impaired
Waters with TMDLs
NHDPlus Indexed
Dataset with Program
Attributes" shapefiles,
May 2015 version.
HUC12 Version:
NHDPlus2 WBD
Snapshot, EnviroAtlas
Version (February
2015 version).
Removed
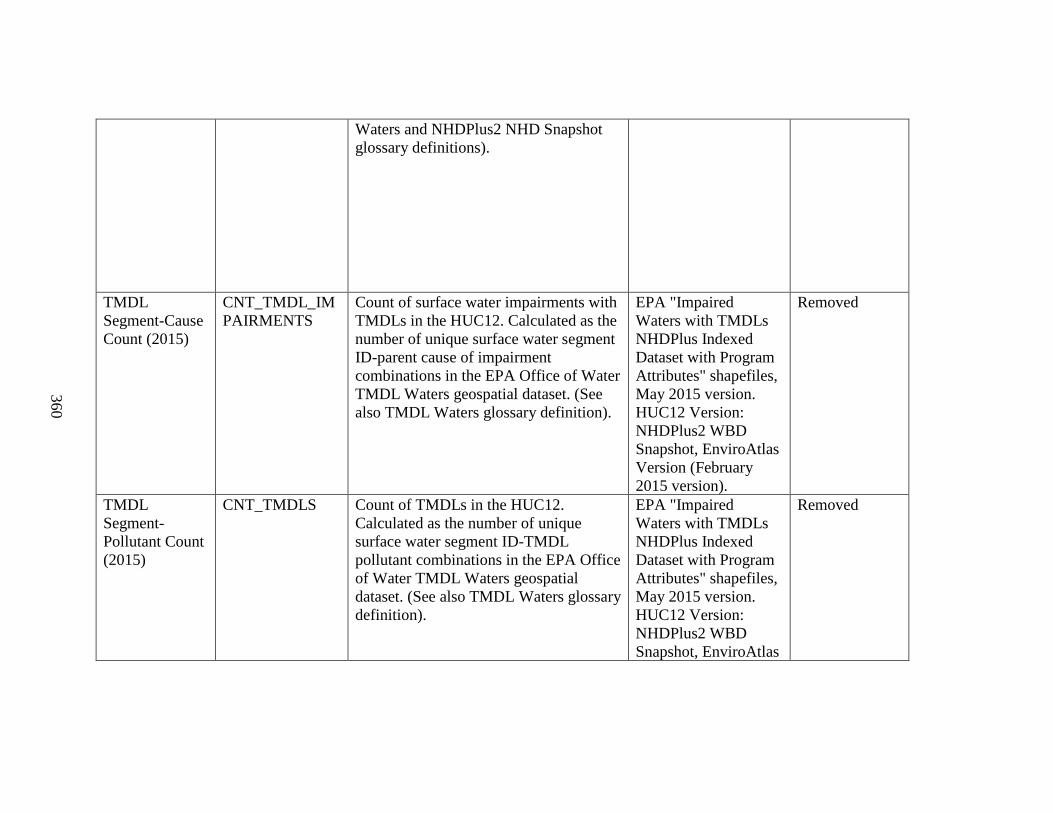
360
Waters and NHDPlus2 NHD Snapshot
glossary definitions).
TMDL
Segment-Cause
Count (2015)
CNT_TMDL_IM
PAIRMENTS
Count of surface water impairments with
TMDLs in the HUC12. Calculated as the
number of unique surface water segment
ID-parent cause of impairment
combinations in the EPA Office of Water
TMDL Waters geospatial dataset. (See
also TMDL Waters glossary definition).
EPA "Impaired
Waters with TMDLs
NHDPlus Indexed
Dataset with Program
Attributes" shapefiles,
May 2015 version.
HUC12 Version:
NHDPlus2 WBD
Snapshot, EnviroAtlas
Version (February
2015 version).
Removed
TMDL
Segment-
Pollutant Count
(2015)
CNT_TMDLS Count of TMDLs in the HUC12.
Calculated as the number of unique
surface water segment ID-TMDL
pollutant combinations in the EPA Office
of Water TMDL Waters geospatial
dataset. (See also TMDL Waters glossary
definition).
EPA "Impaired
Waters with TMDLs
NHDPlus Indexed
Dataset with Program
Attributes" shapefiles,
May 2015 version.
HUC12 Version:
NHDPlus2 WBD
Snapshot, EnviroAtlas
Removed

361
Version (February
2015 version).
Segments with
TMDLs Count
(2015)
CNT_TMDL_W
ATERS
Count of surface water segments with
TMDLs in the HUC12. Calculated as the
number of unique state-assigned surface
water segment IDs in the HUC12 from
the EPA Office of Water TMDL Waters
geospatial dataset. (See also TMDL
Waters glossary definition).
EPA "Impaired
Waters with TMDLs
NHDPlus Indexed
Dataset with Program
Attributes" shapefiles,
May 2015 version.
HUC12 Version:
NHDPlus2 WBD
Snapshot, EnviroAtlas
Version (February
2015 version).
Removed
Count Ratio
TMDLs to
Impairments
(2015)
TMDL_IMPAIR
MENT_RAT
Ratio of the number of surface water
impairments with TMDLs to the total
number of impairments in the HUC12.
The total number of impairments is the
number of impairments with TMDLs
plus the number of impairments listed as
requiring a TMDL under Section 303(d)
of the Clean Water Act. The number of
impairments with TMDLs is calculated
from the number of unique surface water
segment ID-parent cause of impairment
combinations in the HUC12 from the
EPA Office of Water TMDL Waters
geospatial dataset. The number of
impairments listed as requiring a TMDL
is calculated from the number of unique
surface water segment ID-parent cause of
EPA "303(d) Listed
Impaired Waters
NHDPlus Indexed
Dataset with Program
Attributes" shapefiles,
May 2015 version;
EPA "Impaired
Waters with TMDLs
NHDPlus Indexed
Dataset with Program
Attributes" shapefiles,
May 2015 version.
HUC12 Version:
NHDPlus2 WBD
Snapshot, EnviroAtlas
Version (February
2015 version).
Removed

362
impairment combinations in the HUC12
from the EPA Office of Water 303(d)
Listed Waters geospatial dataset. (See
also TMDL Waters and 303(d) Listed
Waters glossary definitions).
Streamlength
with Nutrient
TMDLs (2015)
STREAMLGTH_
TMDL_NUTRIE
NTS
Length of stream features with a nutrient-
related TMDL in the HUC12
(kilometers). Source data used for
calculating the length of stream features
with TMDLs was the EPA Office of
Water TMDL Waters geospatial dataset.
Only includes the length of stream with
"Nutrients", "Organic
Enrichment/Oxygen Depletion", "Algal
Growth", or "Noxious Aquatic Plants"
listed as a parent TMDL pollutant. (See
also TMDL Waters glossary definition).
EPA "Impaired
Waters with TMDLs
NHDPlus Indexed
Dataset with Program
Attributes" shapefiles,
May 2015 version;
NHDPlus2 NHD
Snapshot, downloaded
March 2014. HUC12
Version: NHDPlus2
WBD Snapshot,
EnviroAtlas Version
(February 2015
version).
Removed

363
% Streamlength
with Nutrient
TMDLs (2015)
STREAMLGTH_
TMDL_NUTRIE
NTS_PCT
Percent of streamlength in the HUC12
with a nutrient-related TMDL. Source
data for calculating the length of stream
features with TMDLs was the EPA
Office of Water TMDL Waters
geospatial dataset. Only includes the
length of stream with "Nutrients",
"Organic Enrichment/Oxygen
Depletion", "Algal Growth", or "Noxious
Aquatic Plants" listed as a parent TMDL
pollutant. The denominator used for
percentage calculations (total
streamlength) is the length of NHDPlus2
NHD Snapshot stream features in the
HUC12 plus any additional custom-
mapped streams in the TMDL Waters
dataset. (See also TMDL Waters and
NHD Snapshot glossary definitions).
EPA "Impaired
Waters with TMDLs
NHDPlus Indexed
Dataset with Program
Attributes" shapefiles,
May 2015 version;
NHDPlus2 NHD
Snapshot, downloaded
March 2014. HUC12
Version: NHDPlus2
WBD Snapshot,
EnviroAtlas Version
(February 2015
version).
Removed
Waterbody
Area with
Nutrient
TMDLs (2015)
WBAREA_TMD
L_NUTRIENTS
Area of lakes, estuaries, and other areal
water features with a nutrient-related
TMDL in the HUC12 (kilometers).
Source data used for calculating the area
of waterbody features with TMDLs was
the EPA Office of Water TMDL Waters
geospatial dataset. Only includes area of
waterbodies with "Nutrients", "Organic
Enrichment/Oxygen Depletion", "Algal
Growth", or "Noxious Aquatic Plants"
listed as a parent TMDL pollutant. (See
also TMDL Waters glossary definition).
EPA "Impaired
Waters with TMDLs
NHDPlus Indexed
Dataset with Program
Attributes" shapefiles,
May 2015 version.
HUC12 Version:
NHDPlus2 WBD
Snapshot, EnviroAtlas
Version (February
2015 version).
Removed

364
% Waterbody
Area with
Nutrient
TMDLs (2015)
WBAREA_TMD
L_NUTRIENTS_
PCT
Percent of the area of lakes, estuaries,
and other areal water features in the
HUC12 with a nutrient-related TMDL.
Source data for calculating the area of
waterbody features with TMDLs was the
EPA Office of Water TMDL Waters
geospatial dataset. Only includes area of
waterbodies with "Nutrients", "Organic
Enrichment/Oxygen Depletion", "Algal
Growth", or "Noxious Aquatic Plants"
listed as a parent TMDL pollutant. The
denominator used for percentage
calculations is the area of NHDPlus2
NHD Snapshot waterbodies in the
HUC12 plus any additional custom-
mapped waterbodies in the TMDL
Waters dataset. (See also TMDL Waters
and NHD Snapshot glossary definitions).
EPA "Impaired
Waters with TMDLs
NHDPlus Indexed
Dataset with Program
Attributes" shapefiles,
May 2015 version;
NHDPlus2 NHD
Snapshot, downloaded
March 2014. HUC12
Version: NHDPlus2
WBD Snapshot,
EnviroAtlas Version
(February 2015
version).
Removed
Segments with
Nutrient
TMDLs Count
(2015)
CNT_TMDL_W
ATERS_NUTRIE
NTS
Count of surface water segments with a
nutrient-related TMDL in the HUC12.
Calculated as the number of unique state-
assigned surface water segment IDs in
the HUC12 from the EPA Office of
Water TMDL Waters geospatial dataset
with "Nutrients", "Organic
Enrichment/Oxygen Depletion", "Algal
Growth", or "Noxious Aquatic Plants"
listed as a parent TMDL pollutant. (See
also TMDL Waters glossary definition).
EPA "Impaired
Waters with TMDLs
NHDPlus Indexed
Dataset with Program
Attributes" shapefiles,
May 2015 version.
HUC12 Version:
NHDPlus2 WBD
Snapshot, EnviroAtlas
Version (February
2015 version).
Removed

365
Streamlength
with Pathogen
TMDLs (2015)
STREAMLGTH_
TMDL_PATHOG
ENS
Length of stream features with a
pathogen TMDL in the HUC12
(kilometers). Source data used for
calculating the length of stream features
with TMDLs was the EPA Office of
Water TMDL Waters geospatial dataset.
Only includes the length of stream
features with "Pathogens" listed as a
parent TMDL pollutant. (See also TMDL
Waters glossary definition).
EPA "Impaired
Waters with TMDLs
NHDPlus Indexed
Dataset with Program
Attributes" shapefiles,
May 2015 version;
NHDPlus2 NHD
Snapshot, downloaded
March 2014. HUC12
Version: NHDPlus2
WBD Snapshot,
EnviroAtlas Version
(February 2015
version).
Removed
% Streamlength
with Pathogen
TMDLs (2015)
STREAMLGTH_
TMDL_PATHOG
ENS_PCT
Percent of streamlength in the HUC12
with a pathogen TMDL. Source data for
calculating the length of stream features
with TMDLs was the EPA Office of
Water TMDL Waters geospatial dataset.
Only includes the length of stream
features with "Pathogens" listed as a
parent TMDL pollutant. The
denominator used for percentage
calculations (total streamlength) is the
length of NHDPlus2 NHD Snapshot
stream features in the HUC12 plus any
additional custom-mapped streams in the
TMDL Waters dataset. (See also TMDL
Waters and NHD Snapshot glossary
definitions).
EPA "Impaired
Waters with TMDLs
NHDPlus Indexed
Dataset with Program
Attributes" shapefiles,
May 2015 version;
NHDPlus2 NHD
Snapshot, downloaded
March 2014. HUC12
Version: NHDPlus2
WBD Snapshot,
EnviroAtlas Version
(February 2015
version).
Removed

366
Waterbody
Area with
Pathogen
TMDLs (2015)
WBAREA_TMD
L_PATHOGENS
Area of lakes, estuaries, and other areal
water features with a pathogens TMDL
in the HUC12 (kilometers). Source data
used for calculating the area of
waterbody features with TMDLs was the
EPA Office of Water TMDL Waters
geospatial dataset. Only includes area of
waterbodies with "Pathogens" listed as a
parent TMDL pollutant. (See also TMDL
Waters glossary definition).
EPA "Impaired
Waters with TMDLs
NHDPlus Indexed
Dataset with Program
Attributes" shapefiles,
May 2015 version.
HUC12 Version:
NHDPlus2 WBD
Snapshot, EnviroAtlas
Version (February
2015 version).
Removed
% Waterbody
Area with
Pathogen
TMDLs (2015)
WBAREA_TMD
L_PATHOGENS
_PCT
Percent of the area of lakes, estuaries,
and other areal water features in the
HUC12 with a pathogens TMDL. Source
data for calculating the area of waterbody
features with TMDLs was the EPA
Office of Water TMDL Waters
geospatial dataset. Only includes area of
waterbodies with "Pathogens" listed as a
parent TMDL pollutant. The
denominator used for percentage
calculations is the area of NHDPlus2
NHD Snapshot waterbodies in the
HUC12 plus any additional custom-
mapped waterbodies in the TMDL
Waters dataset. (See also TMDL Waters
and NHD Snapshot glossary definitions).
EPA "Impaired
Waters with TMDLs
NHDPlus Indexed
Dataset with Program
Attributes" shapefiles,
May 2015 version;
NHDPlus2 NHD
Snapshot, downloaded
March 2014. HUC12
Version: NHDPlus2
WBD Snapshot,
EnviroAtlas Version
(February 2015
version).
Removed

367
Segments with
Pathogen
TMDLs Count
(2015)
CNT_TMDL_W
ATERS_PATHO
GENS
Count of surface water segments with a
pathogens TMDL in the HUC12.
Calculated as the number of unique state-
assigned surface water segment IDs in
the HUC12 from the EPA Office of
Water TMDL Waters geospatial dataset
with "Pathogens" listed as a parent
TMDL pollutant. (See also TMDL
Waters glossary definition).
EPA "Impaired
Waters with TMDLs
NHDPlus Indexed
Dataset with Program
Attributes" shapefiles,
May 2015 version.
HUC12 Version:
NHDPlus2 WBD
Snapshot, EnviroAtlas
Version (February
2015 version).
Removed
Streamlength
with Sediment
TMDLs (2015)
STREAMLGTH_
TMDL_SEDIME
NT
Length of stream features with a
sediment TMDL in the HUC12
(kilometers). Source data used for
calculating the length of stream features
with TMDLs was the EPA Office of
Water TMDL Waters geospatial dataset.
Only includes the length of stream
features with "Sediment" or "Turbidity"
listed as a parent TMDL pollutant. (See
also TMDL Waters glossary definition).
EPA "Impaired
Waters with TMDLs
NHDPlus Indexed
Dataset with Program
Attributes" shapefiles,
May 2015 version;
NHDPlus2 NHD
Snapshot, downloaded
March 2014. HUC12
Version: NHDPlus2
WBD Snapshot,
EnviroAtlas Version
(February 2015
version).
Removed

368
% Streamlength
with Sediment
TMDLs (2015)
STREAMLGTH_
TMDL_SEDIME
NT_PCT
Percent of streamlength in the HUC12
with a sediment TMDL. Source data for
calculating the length of stream features
with TMDLs was the EPA Office of
Water TMDL Waters geospatial dataset.
Only includes the length of stream
features with "Sediment" or "Turbidity"
listed as a parent TMDL pollutant. The
denominator used for percentage
calculations (total streamlength) is the
length of NHDPlus2 NHD Snapshot
stream features in the HUC12 plus any
additional custom-mapped streams in the
TMDL Waters dataset. (See also TMDL
Waters and NHD Snapshot glossary
definitions).
EPA "Impaired
Waters with TMDLs
NHDPlus Indexed
Dataset with Program
Attributes" shapefiles,
May 2015 version;
NHDPlus2 NHD
Snapshot, downloaded
March 2014. HUC12
Version: NHDPlus2
WBD Snapshot,
EnviroAtlas Version
(February 2015
version).
Removed
Waterbody
Area with
Sediment
TMDLs (2015)
WBAREA_TMD
L_SEDIMENT
Area of lakes, estuaries, and other areal
water features with a sediment TMDL in
the HUC12 (kilometers). Source data
used for calculating the area of
waterbody features with TMDLs was the
EPA Office of Water TMDL Waters
geospatial dataset. Only includes area of
waterbodies with "Sediment" or
"Turbidity" listed as a parent TMDL
pollutant. (See also TMDL Waters
glossary definition).
EPA "Impaired
Waters with TMDLs
NHDPlus Indexed
Dataset with Program
Attributes" shapefiles,
May 2015 version.
HUC12 Version:
NHDPlus2 WBD
Snapshot, EnviroAtlas
Version (February
2015 version).
Removed

369
% Waterbody
Area with
Sediment
TMDLs (2015)
WBAREA_TMD
L_SEDIMENT_P
CT
Percent of the area of lakes, estuaries,
and other areal water features in the
HUC12 with a sediment TMDL. Source
data for calculating the area of waterbody
features with TMDLs was the EPA
Office of Water TMDL Waters
geospatial dataset. Only includes area of
waterbodies with "Sediment" or
"Turbidity" listed as a parent TMDL
pollutant. The denominator used for
percentage calculations is the area of
NHDPlus2 NHD Snapshot waterbodies
in the HUC12 plus any additional
custom-mapped waterbodies in the
TMDL Waters dataset. (See also TMDL
Waters and NHD Snapshot glossary
definitions).
EPA "Impaired
Waters with TMDLs
NHDPlus Indexed
Dataset with Program
Attributes" shapefiles,
May 2015 version;
NHDPlus2 NHD
Snapshot, downloaded
March 2014. HUC12
Version: NHDPlus2
WBD Snapshot,
EnviroAtlas Version
(February 2015
version).
Removed
Segments with
Sediment
TMDLs Count
(2015)
CNT_TMDL_W
ATERS_SEDIME
NT
Count of surface water segments with a
sediment TMDL in the HUC12.
Calculated as the number of unique state-
assigned surface water segment IDs in
the HUC12 from the EPA Office of
Water TMDL Waters geospatial dataset
with "Sediment" or "Turbidity" listed as
a parent TMDL pollutant. (See also
TMDL Waters glossary definition).
EPA "Impaired
Waters with TMDLs
NHDPlus Indexed
Dataset with Program
Attributes" shapefiles,
May 2015 version.
HUC12 Version:
NHDPlus2 WBD
Snapshot, EnviroAtlas
Version (February
2015 version).
Removed

370
Streamlength
with Metals
TMDLs (2015)
STREAMLGTH_
TMDL_METALS
Length of stream features with a metals
TMDL in the HUC12 (kilometers).
Source data used for calculating the
length of stream features with TMDLs
was the EPA Office of Water TMDL
Waters geospatial dataset. Only includes
the length of stream features with
"Metals (other than Mercury)" listed as a
parent TMDL pollutant. (See also TMDL
Waters glossary definition).
EPA "Impaired
Waters with TMDLs
NHDPlus Indexed
Dataset with Program
Attributes" shapefiles,
May 2015 version;
NHDPlus2 NHD
Snapshot, downloaded
March 2014. HUC12
Version: NHDPlus2
WBD Snapshot,
EnviroAtlas Version
(February 2015
version).
Removed
% Streamlength
with Metals
TMDLs (2015)
STREAMLGTH_
TMDL_METALS
_PCT
Percent of streamlength in the HUC12
with a metals TMDL. Source data for
calculating the length of stream features
with TMDLs was the EPA Office of
Water TMDL Waters geospatial dataset.
Only includes the length of stream
features with "Metals (other than
Mercury)" listed as a parent TMDL
pollutant. The denominator used for
percentage calculations (total
streamlength) is the length of NHDPlus
NHD Snapshot stream features in the
HUC12 plus any additional custom-
mapped streams in the TMDL Waters
dataset. (See also TMDL Waters and
NHD Snapshot glossary definitions).
EPA "Impaired
Waters with TMDLs
NHDPlus Indexed
Dataset with Program
Attributes" shapefiles,
May 2015 version;
NHDPlus2 NHD
Snapshot, downloaded
March 2014. HUC12
Version: NHDPlus2
WBD Snapshot,
EnviroAtlas Version
(February 2015
version).
Removed

371
Waterbody
Area with
Metals TMDLS
(2015)
WBAREA_TMD
L_METALS
Area of lakes, estuaries, and other areal
water features with a metals TMDL in
the HUC12 (kilometers). Source data
used for calculating the area of
waterbody features with TMDLs was the
EPA Office of Water TMDL Waters
geospatial dataset. Only includes area of
waterbodies with "Metals (other than
Mercury)" listed as a parent TMDL
pollutant. (See also TMDL Waters
glossary definition).
EPA "Impaired
Waters with TMDLs
NHDPlus Indexed
Dataset with Program
Attributes" shapefiles,
May 2015 version.
HUC12 Version:
NHDPlus2 WBD
Snapshot, EnviroAtlas
Version (February
2015 version).
Removed
% Waterbody
Area with
Metals TMDLs
(2015)
WBAREA_TMD
L_METALS_PC
T
Percent of the area of lakes, estuaries,
and other areal water features in the
HUC12 with a metals TMDL. Source
data for calculating the area of waterbody
features with TMDLs was the EPA
Office of Water TMDL Waters
geospatial dataset. Only includes area of
waterbodies with "Metals (other than
Mercury)" listed as a parent TMDL
pollutant. The denominator used for
percentage calculations is the area of
NHDPlus2 NHD Snapshot waterbodies
in the HUC12 plus any additional
custom-mapped waterbodies in the
TMDL Waters dataset. (See also TMDL
Waters and NHD Snapshot glossary
definitions).
EPA "Impaired
Waters with TMDLs
NHDPlus Indexed
Dataset with Program
Attributes" shapefiles,
May 2015 version;
NHDPlus2 NHD
Snapshot, downloaded
March 2014. HUC12
Version: NHDPlus2
WBD Snapshot,
EnviroAtlas Version
(February 2015
version).
Removed

372
Segments with
Metals TMDLs
Count (2015)
CNT_TMDL_W
ATERS_METAL
S
Count of surface water segments with a
metals TMDL in the HUC12. Calculated
as the number of unique state-assigned
surface water segment IDs in the HUC12
from the EPA Office of Water TMDL
Waters geospatial dataset with "Metals
(other than Mercury)" listed as a parent
TMDL pollutant. (See also TMDL
Waters glossary definition).
EPA "Impaired
Waters with TMDLs
NHDPlus Indexed
Dataset with Program
Attributes" shapefiles,
May 2015 version.
HUC12 Version:
NHDPlus2 WBD
Snapshot, EnviroAtlas
Version (February
2015 version).
Removed
% Small
Natural Areas
in WS
NAT_SM_AREA
_PCT_WS
Percent of the HUC12 that is classified
as a small natural area. Small natural
areas are contiguous patches of natural
land cover that are less than 500 acres.
Source data for mapping natural land
cover was a custom land cover dataset
that combined the 2006 National Land
Cover Database (NLCD 2006) and the
2010 USDA Cropland Data Layer
(CDL). Natural land cover included the
following land cover types: Open Water
(codes 83, 111), Perennial Ice/Snow
(code 112), Barren Land
(Rock/Sand/Clay) (code 131), Forest
(codes 63, 141, 142, 143), Shrub/Scrub
(codes 151, 152), Grassland/Herbaceous
(code 171), and Wetlands (codes 87, 190,
195). Equation used: Small Natural Area
/ HUC12 Area * 100. This indicator was
calculated for EPA EnviroAtlas.
EPA EnviroAtlas
"Percent Large,
Medium, and Small
Natural Areas for the
Conterminous United
States" dataset. May 7,
2015 version.
Removed

373
Additional information on source data
and calculation methods can be found at:
https://edg.epa.gov/metadata/catalog/sear
ch/resource/details.page?uuid=%7BB803
EDB7-3BE0-4ADF-870C-
2EB9733310AE%7D
% Medium
Natural Areas
in WS
NAT_MD_AREA
_PCT_WS
Percent of the HUC12 that is classified
as a medium natural area. Medium
natural areas are contiguous patches of
natural land cover that are 500 to 25,000
acres. Source data for mapping natural
land cover was a custom land cover
dataset that combined the 2006 National
Land Cover Database (NLCD 2006) and
the 2010 USDA Cropland Data Layer
(CDL). Natural land cover included the
following land cover types: Open Water
(codes 83, 111), Perennial Ice/Snow
(code 112), Barren Land
(Rock/Sand/Clay) (code 131), Forest
(codes 63, 141, 142, 143), Shrub/Scrub
(codes 151, 152), Grassland/Herbaceous
(code 171), and Wetlands (codes 87, 190,
EPA EnviroAtlas
"Percent Large,
Medium, and Small
Natural Areas for the
Conterminous United
States" dataset. May 7,
2015 version.
Removed

374
195). Equation used: Medium Natural
Area / HUC12 Area * 100. This indicator
was calculated for EPA EnviroAtlas.
Additional information on source data
and calculation methods can be found at:
https://edg.epa.gov/metadata/catalog/sear
ch/resource/details.page?uuid=%7BB803
EDB7-3BE0-4ADF-870C-
2EB9733310AE%7D
% Large
Natural Areas
in WS
NAT_LG_AREA
_PCT_WS
Percent of the HUC12 that is classified
as a large natural area. Large natural
areas are contiguous patches of natural
land cover that greater than 25,000 acres.
Source data for mapping natural land
cover was a custom land cover dataset
that combined the 2006 National Land
Cover Database (NLCD 2006) and the
2010 USDA Cropland Data Layer
(CDL). Natural land cover included the
following land cover types: Open Water
(codes 83, 111), Perennial Ice/Snow
(code 112), Barren Land
(Rock/Sand/Clay) (code 131), Forest
(codes 63, 141, 142, 143), Shrub/Scrub
(codes 151, 152), Grassland/Herbaceous
(code 171), and Wetlands (codes 87, 190,
EPA EnviroAtlas
"Percent Large,
Medium, and Small
Natural Areas for the
Conterminous United
States" dataset. May 7,
2015 version.
Removed
375
195). Equation used: Large Natural Area
/ HUC12 Area * 100. This indicator was
calculated for EPA EnviroAtlas.
Additional information on source data
and calculation methods can be found at:
https://edg.epa.gov/metadata/catalog/sear
ch/resource/details.page?uuid=%7BB803
EDB7-3BE0-4ADF-870C-
2EB9733310AE%7D
Freshwater
Fishing
Demand in WS
FISHING_REC_
DMD
The demand for recreational freshwater
fishing in the HUC12 (number of fishing
day trips per year). Source data were
2011 U.S. Fish and Wildlife Service
Fish, Hunting, and Wildlife-Associated
Recreation (FHWAR) survey data, 2011
U.S. Department of Agriculture (USDA)
Forest Service National Visitor Use
Monitoring program data, and 2010
population data from the U.S. Census
Bureau. This indicator was calculated for
EPA EnviroAtlas. Additional
information on source data and
calculation methods can be found at:
https://edg.epa.gov/metadata/catalog/sear
ch/resource/details.page?uuid=%7B28db
EPA Enviroatlas
"Freshwater Fishing
Recreation Demand by
12-Digit HUC in the
Conterminous United
States" dataset. June
13, 2016 version.
None

376
3b57-618c-4257-bb4a-
4946e9c1e8c4%7D
Nonpoint
Control Projects
Count
NPS_319_PROJE
CTS_COUNT
Count of nonpoint source pollution
control projects funded by Clean Water
Act Section 319 grants located in the
HUC12. Source data was the EPA Grants
Reporting and Tracking System (GRTS;
https://iaspub.epa.gov/apex/waters/f?p=1
10:199). GRTS is the primary tool for
tracking Section 319 funded projects by
EPA’s Nonpoint Source (NPS) Pollution
Control Program. A query of the GRTS
database was performed in March 2016
to quantify the number of NPS projects
per HUC12. Counts include projects
entered into GRTS between January
2002 through March 2016 that are
ongoing or completed and that have a
HUC12 ID for the project stored in
GRTS.
Query of NPS projects
by HUC12 from EPA
Grants Reporting and
Tracking System
(GRTS) completed in
March 2016.
Removed

377
Nonpoint
Control Projects
Presence Flag
NPS_319_PROJE
CTS_FLAG
Presence or absence of nonpoint source
pollution control projects funded by
Clean Water Act Section 319 grants in
the HUC12. Source data was the EPA
Grants Reporting and Tracking System
(GRTS;
https://iaspub.epa.gov/apex/waters/f?p=1
10:199). GRTS is the primary tool for
tracking Section 319 funded projects by
EPA’s Nonpoint Source (NPS) Pollution
Control Program. A query of the GRTS
database was performed in March 2016
to identify HUC12s with NPS projects.
Includes projects entered into GRTS
between January 2002 through March
2016 that are ongoing or completed with
a HUC12 ID for the project stored in
GRTS.
Query of NPS projects
by HUC12 from EPA
Grants Reporting and
Tracking System
(GRTS) completed in
March 2016.
Removed
Sediment
Nonpoint
Control Projects
Presence
NPS_319_PROJE
CTS_SEDMT_FL
AG
Presence or absence of sediment-related
nonpoint source pollution control
projects funded by Clean Water Act
Section 319 grants in the HUC12. Source
data was the EPA Grants Reporting and
Tracking System (GRTS;
https://iaspub.epa.gov/apex/waters/f?p=1
10:199). GRTS is the primary tool for
tracking Section 319 funded projects by
EPA’s Nonpoint Source (NPS) Pollution
Control Program. A query of the GRTS
database was performed in March 2016
to identify HUC12s with sediment-
Query of NPS projects
by HUC12 from EPA
Grants Reporting and
Tracking System
(GRTS) completed in
March 2016.
Removed

378
related NPS projects. Sediment-related
projects are those projects focused
directly on sediment (e.g., turbidity) or
pollutant issues causing sediment
pollution (e.g., habitat alterations).
Includes projects entered into GRTS
between January 2002 through March
2016 that are ongoing or completed with
a HUC12 ID for the project stored in
GRTS.
Metals
Nonpoint
Control Projects
Presence
NPS_319_PROJE
CTS_METL_FL
AG
Presence or absence of metals-related
nonpoint source pollution control
projects funded by Clean Water Act
Section 319 grants in the HUC12. Source
data was the EPA Grants Reporting and
Tracking System (GRTS;
https://iaspub.epa.gov/apex/waters/f?p=1
10:199). GRTS is the primary tool for
tracking Section 319 funded projects by
EPA’s Nonpoint Source (NPS) Pollution
Control Program. A query of the GRTS
database was performed in March 2016
to identify HUC12s with metals-related
NPS projects. Metals-related projects are
those projects focused directly on metals
(e.g., mercury) or pollutant issues caused
by metal pollution (e.g., pH). Includes
projects entered into GRTS between
January 2002 through March 2016 that
Query of NPS projects
by HUC12 from EPA
Grants Reporting and
Tracking System
(GRTS) completed in
March 2016.
Removed

379
are ongoing or completed with a HUC12
ID for the project stored in GRTS.
Pathogens
Nonpoint
Control Projects
Presence
NPS_319_PROJE
CTS_PATHG_FL
AG
Presence or absence of pathogen-related
nonpoint source pollution control
projects funded by Clean Water Act
Section 319 grants in the HUC12. Source
data was the EPA Grants Reporting and
Tracking System (GRTS;
https://iaspub.epa.gov/apex/waters/f?p=1
10:199). GRTS is the primary tool for
tracking Section 319 funded projects by
EPA’s Nonpoint Source (NPS) Pollution
Control Program. A query of the GRTS
database was performed in March 2016
to identify HUC12s with pathogen-
related NPS projects. Pathogen-related
projects are those projects focused
directly on pathogens (e.g., fecal
coliform) or pollutant issues caused by
pathogen pollution (e.g., biological
oxygen demand). Includes projects
Query of NPS projects
by HUC12 from EPA
Grants Reporting and
Tracking System
(GRTS) completed in
March 2016.
Removed

380
entered into GRTS between January
2002 through March 2016 that are
ongoing or completed with a HUC12 ID
for the project stored in GRTS.
Nutrients
Nonpoint
Control Projects
Presence
NPS_319_PROJE
CTS_NP_FLAG
Presence or absence of nutrient-related
nonpoint source pollution control
projects funded by Clean Water Act
Section 319 grants in the HUC12. Source
data was the EPA Grants Reporting and
Tracking System (GRTS;
https://iaspub.epa.gov/apex/waters/f?p=1
10:199). GRTS is the primary tool for
tracking Section 319 funded projects by
EPA’s Nonpoint Source (NPS) Pollution
Control Program. A query of the GRTS
database was performed in March 2016
to identify HUC12s with nutrient-related
NPS projects. Nutrient-related projects
are those projects focused directly on
nutrients (e.g., phosphorus) or pollutant
issues caused by nutrient pollution (e.g.,
dissolved oxygen). Includes projects
entered into GRTS between January
Query of NPS projects
by HUC12 from EPA
Grants Reporting and
Tracking System
(GRTS) completed in
March 2016.
Removed
381
2002 through March 2016 that are
ongoing or completed with a HUC12 ID
for the project stored in GRTS.
NPDES Permit
Count
NPDES_PERMIT
_CNT
Count of National Permit Discharge
Elimination System (NPDES) permits in
the HUC12, including both active and
expired NPDES permits. Calculated from
the EPA Office of Water "Facilities that
Discharge to Water NHDPlus Index
Dataset" (February 2014 version;
https://edg.epa.gov/metadata/catalog/sear
ch/resource/details.page?uuid=%7B091F
C504-8762-8E7F-DCD7-
513F648BC5B5%7D).
EPA Office of Water
"Facilities that
Discharge to Water
NHDPlus Index
Dataset", February
2014 version. HUC12
Version: NHDPlus2
WBD Snapshot
Version 03.
Removed
Neutral
Variable, Social
Category
NEUTRAL_SOC Equal to 0.5 for all HUC12s. Can be used
for an analysis that focuses on just the
Ecological and Stressor indicator
categories, with the Social category left
out. If using this indicator do not select
any other Social indicators.
Not applicable. Removed