Embed Size (px)
Citation preview
This is a repository copy of Exploring consumer preferences towards electric vehicles: Theinfluence of consumer innovativeness.
White Rose Research Online URL for this paper:http://eprints.whiterose.ac.uk/99477/
Version: Accepted Version
Article:
Morton, C, Anable, J orcid.org/0000-0002-4259-1641 and Nelson, JD (2016) Exploring consumer preferences towards electric vehicles: The influence of consumer innovativeness. Research in Transportation Business and Management, 18. pp. 18-28. ISSN 2210-5395
https://doi.org/10.1016/j.rtbm.2016.01.007
© 2016, Elsevier. Licensed under the Creative Commons Attribution-NonCommercial-NoDerivatives 4.0 International http://creativecommons.org/licenses/by-nc-nd/4.0/
[email protected]://eprints.whiterose.ac.uk/
Reuse
Unless indicated otherwise, fulltext items are protected by copyright with all rights reserved. The copyright exception in section 29 of the Copyright, Designs and Patents Act 1988 allows the making of a single copy solely for the purpose of non-commercial research or private study within the limits of fair dealing. The publisher or other rights-holder may allow further reproduction and re-use of this version - refer to the White Rose Research Online record for this item. Where records identify the publisher as the copyright holder, users can verify any specific terms of use on the publisher’s website.
Takedown
If you consider content in White Rose Research Online to be in breach of UK law, please notify us by emailing [email protected] including the URL of the record and the reason for the withdrawal request.
1
Exploring Consumer Preferences towards Electric Vehicles: The Influence of Consumer
Innovativeness
Craig Morton A1
([email protected]), Jillian Anable B ([email protected]) and
John D. Nelson A
A Centre for Transport Research, Department of Geography and Environment, University of
Aberdeen, St Marys Building, Elphinstone Road, Aberdeen, AB24 3UF, United Kingdom.
B Institute for Transport Studies, Faculty of Environment, 1-3 Lifton Place, University of
Leeds, Leeds, LS2 9JT, United Kingdom.
ABSTRACT
The diffusion of Electric Vehicles (EVs) is regarded as an important aspect of government policy
which aims to generate a transition to a low-carbon mobility system in the United Kingdom and the
wider European context. This paper investigates consumer demand for EVs by examining the
influence of consumer innovativeness alongside attitudes concerning the functional capabilities of
EVs over EV preferences. A conceptual framework is developed and applied which includes
measurements of innovativeness at both an adoptive level, through an assessment of technology
ownership, and at an innate level, by measuring a cohort of psychological and sociological factors.
Additionally, the framework incorporates measurements of attitudes towards the functional
performance of EVs to determine their effect on preferences. Data has been collected through the
application of a self-completion household survey distributed over the cities of Dundee and
Newcastle upon Tyne in the United Kingdom. Results of the analysis indicate that adoptive
innovativeness and attitudes concerning the functional performance of EVs significantly affect
preferences for Plug-In Hybrid Electric Vehicles (PHEVs) and Battery Electric Vehicles (BEVs).
Key Words
Electric Vehicles; Consumer Innovativeness; Vehicle Preferences; Psychometric Analysis
1 Correspondence author: [email protected]
2
1 INTRODUCTION
The challenge of transitioning the transport sector onto a low carbon trajectory is one that will likely
define research in this field over the next decade (Schwanen, 2011). The magnitude of this challenge
is significant, with the transport sector accounting for 40% of final energy consumption in the United
Kingdom (UK) in 2011, with consumption having increased by 52% since 1980 (DECC, 2012). This
energy is sourced almost entirely from fuels derived from crude oil (DECC, 2013a) resulting in a
situation where the transport sector represents the second largest emitter of greenhouse gases
(GHG), accounting for 21% of UK territorial emissions in 2011 (DECC, 2013b).
The UK Government has expressed a commitment to encouraging the uptake of Electric Vehicles
(EVs; comprising both pure battery electric vehicles (BEVs) and plug-in hybrid electric vehicles
(PHEVS)) (OLEV, 2013), which are viewed as representing a means by which significant reductions in
GHG emissions from the transport sector can be realized (CCC, 2013). Moreover, the UK
Government considers EVs to ヴWヮヴWゲWミデ ; ┘;┞ キミ ┘エキIエ デエW UKげs strength in propulsion system
technology can be maintained (BIS, 2013) and a mechanism to generate consumer demand for low
carbon products (BIS, 2010). This strategic vision is replicated at the EU level, with the European
Commission establishing a Green Cars Initiative to ensure the EU is a world leader in EV technology
(EC, 2013).
The technical specification of EVs represents a substantial divergence from vehicles operating
internal combustion engine (ICE) propulsion systems (van Vliet et al., 2010; Dijk et al., 2013).
Specifically, functional issues concerning vehicle range, price premiums, operating costs, refuelling
behaviours and stated environmental benefits combine to distinguish EVs from conventionally
powered vehicles. This has led commentators to define EVs as representing a form of disruptive
innovation (Christensen, 1997). As a result of the unique features of EVs and the current low sales
volumes of these vehicles (DfT, 2013), it proves challenging to determine likely consumer response
based on the existing market. Nonetheless, a detailed understanding of consumer response to EVs is
likely to be necessary if the diffusion of these vehicles is to be widespread.
This paper contributes to improving the understanding of consumer response to EVs by evaluating if
consumer innovativeness is related to the expressed preference towards EVs using a UK case study.
The concept of consumer innovativeness can be considered to represent the inherent and revealed
propensity of a consumer to adopt new products with different or advanced features and functions.
3
This concept has been widely researched in the marketing sciences (Midgley and Dowling, 1978;
Goldsmith, 1991; Roehrich, 2004; Bartels and Reinders, 2011) though has received only modest
attention in transport studies (Lin and Filieri, 2015). With the transport sector likely to witness a
range of new innovations being introduced over the next decade, this paper provides a first step in
evaluating if the concept of consumer innovativeness can be useful in distinguishing the early
adopters of innovations in private vehicle transport.
2 CONSUMER DEMAND FOR ELECTRIC VEHICLES
Whilst EVs remain a niche market application, research examining consumer demand for EVs has
been an active area of enquiry for the past thirty years. Research was initiated in the early 1980s due
to the occurrence of the 1970s oil shocks and the growing awareness of air quality issues in some of
the major conurbations of California which combined to generate interest in the possibility of
shifting away from ICE vehicles (Sperling and Eggert, 2014). Initial research tended to approach the
assessment of consumer demand using econometric methods, such as discrete choice modelling
based on random utility theory (Train, 2009), which allowed researchers to quantify the effect of the
novel functional features of EVs over consumer preferences (Mannering and Train, 1985). Research
conducted using these methods assisted in identifying prominent adoption barriers such as aversion
to the limited range of EV, the price premiums associated with EVs and high discount rates for
operating costs (Beggs et al., 1981; Calfee, 1985). These issues corresponded with generally low
expectations of the potential market for EVs (Train, 1980) which have been validated by low sales
figures. As anxieties relating to the stability of oil supplies began to subside and the technical
deficiencies associated with the functional performance of EVs became clearer, interest in
understanding the market potential of EVs declined.
Over the past decade, interest in EVs has resurfaced (Rezvani et al. 2015), mostly due to the
importance placed on this technology in transitioning the transport sector onto a low carbon
trajectory (van Bree et al. 2010; Dijk et al. 2013; Geels, 2012; Stienhilber et al. 2013; Greene et al.
2014). A significant quantity of forecasting studies have been conducted to assess potential adoption
pathways for EV demand (Karplus et al. 2010; Eggers and Eggers, 2011; Musti and Kockleman, 2011;
Anable et al. 2012; Shepherd et al. 2012). These forecasting studies have tended to investigate the
potential effect of different market developments, such as improvements to battery technology and
reductions in price premiums, alongside the influence of government incentives. Whilst market
forecasting at the system level allows for the effect of different technical development scenarios and
policy mixes to be considered, it provides little insight regarding how EVs are being evaluated by
4
individual consumers. In an effort to shed light on this issue, research activity in consumer demand
for EVs has progressed through the application of psychometric models which draw on concepts
originating in psychology and sociology (Lane and Potter, 2007). This is an extension of the
increasing application of socio-psychological methods in order to evaluate the challenge of
transitioning towards a sustainable transport system (Gehlert et al., 2013), with the importance of
attitudes (Gärling et al., 1998) alongside affective and symbolic motives (Steg et al., 2001; Steg,
2005) in explaining travel behaviour now being well established (van Acker et al., 2010).
In relation to EVs, studies which apply psychological theory comprise a rapidly growing and already
substantial body of literature examining a variety of emotional or non-conscious regulatory
processes, but with only loose consensus as to the factors emerging as most directly or even
キミSキヴWIデノ┞ キミaノ┌Wミデキ;ノ ラミ ;ミ キミSキ┗キS┌;ノげゲ ;Sラヮデキラミ キミデWミデキラミ ラヴ HWエ;┗キラ┌ヴ ふAnable et al. 2014). The
examined factors include relatively rational and linear relationships between consumer attitudes
and their EV adoption intentions (Moons and De Pelsmacker, 2012), more normative models of
behaviour investigating personal norms such as strong moral obligation towards environmental
issues or values (Moons and De Pelsmacker, 2015), as well as those focusing on indirect and social
processes (Axsen et al. 2013) that impinge on behaviour including symbolic meanings attached to
cars (Heffner et al. 2007; Morton et al. 2015; Noppers et al. 2015), self-identity (Peters et al., 2011a;
Barbarossa et al., 2015) and personality (Skippon and Garwood, 2011). Whilst methodologically and
theoretically diverse, these studies consistently demonstrate the importance of the degree to which
EVs are perceived to be compatible with lifestyle and personal image alongside the relative
advantage of operation. For example, several studies have found that hedonic and symbolic motives
are valid predictors of preferences towards EV variants (Ozaki and Sevastyanova, 2011; Schuitema et
al., 2013) and others have concentrated specifically on how pro-environmental values, beliefs and
social norms assist in explaining the adoption of an alternatively fuelled vehicle (Peters et al., 2011b;
Jannson et al., 2011; Ozaki and Sevastyanova, 2011). Whilst the majority of studies attempting to
include psychological factors in their models of EV adoption behaviour have found these elements to
explain more or at least as much of the variance as functional factors, this is not always the case. For
instance, when comparing adopters of EVs to owners of conventional cars in Norway, Nayum et al.
(2016) found that attitudes towards functional issues such as car performance and convenience are
most useful in distinguishing EV owners vis a vis norms and values.
Whilst existing research has explored some of the psychological antecedents to preferences towards
EVs and has attempted to identify the prominent characteristics of consumers more inclined to
5
consider the purchase of an EV, little attention has been paid to the fundamental predisposition of
consumers to be attracted to the innovative and unique features of EVs. To this end, this paper
specifically concentrates on the concept of consumer innovativeness in order to consider if this
characteristic is useful in distinguishing consumers who are more likely to adopt an EV. In this sense,
the research presented here responds to a call for a broadening of the factors included in demand
models for EVs in order to more fully account for the diverse range of aspects which potentially hold
influence in this emerging market (Daziano and Chiew, 2012).
3 CONSUMER INNOVATIVENESS
When new innovations are introduced into a market, they undergo a diffusion process. The process
is illustrated in the Diffusion of Innovation (DOI) theory which postulates that the adoption of
innovations tends to follow a normal temporal distribution, with a small quantity of innovators and
early adopters acquiring the innovation relatively early, followed by the majority of mainstream
consumers with the diffusion process concluded when the laggard consumers decide to adopt
(Rogers and Shoemaker, 1971; Rogers, 2003). Central to this theory is the concept of consumer
innovativeness, which can be considered at a general level to represent a characteristic which
ヴWノ;デWゲ デラ ;ミ キミSキ┗キS┌;ノげゲ H;ゲキI デWミSWミI┞ デラ ;Sラヮデ ミW┘ キミミラ┗;デキラミゲく
Midgley and Dowling (1978) note that the initial research investigating the concept of consumer
innovativeness tended to be vague in the description of the concept and usually assigned degrees of
innovativeness to individuals based on a simple measurement of the relative time taken to adopt an
innovation. They proceed to argue that such an approach is prone to error due to factors which may
inhibit individuals from being innovative across all contexts. To account for the described limitations,
Midgley and Dowling (ibid.) propose that consumer innovativeness should be considered as a
multidimensional concept which has different levels of operation.
At the abstract level, individuals have an innate tendency to be attracted to the unique qualities of
キミミラ┗;デキラミゲく Tエキゲ キゲ ェWミWヴ;ノノ┞ ヴWaWヴヴWS デラ ;ゲ キミミ;デW キミミラ┗;デキ┗WミWゲゲ ;ミS IラミIWヴミゲ ;ミ キミSキ┗キS┌;ノげゲ
inherent propensity to desire to adopt innovations. Innate innovativeness can be considered to
represent a personality trait which is possessed to a greater or lesser extent by all members of
society (Goldsmith and Hofacker, 1991) and includes psychological aspects such as curiosity,
ambition and rationality alongside sociological elements such as exposure to media sources,
heterophily and acting as a source of information concerning innovations (Midgley and Dowling,
1978). Considering innate innovativeness to be a dimension of personality was partly motivated by
6
the increasing attention placed on personality characteristics in distinguishing consumer groups
(Kassarjian, 1971) and those individuals more prone to adopt innovations (Jacoby, 1971) through the
use of psychographic analysis (Wells, 1975) to compliment traditional demographic profiling. The
concept of innate innovativeness has been empirically tested to determine its influence over the
adoption of innovations, with the evidence suggesting that innate innovativeness is a significant
factor (Manning et al., 1995; Lu et al., 2005, van Rijnsoever and Donders, 2009). Of particular
relevance to the topic of this paper, Feldman and Armstrong (1975) found that the constructs of
opinion leadership, interest in the product and venturesomeness significantly distinguished early
adopters of a rotary engine car from laggard adopters. In a recent synthesis of the consumer
innovativeness literature, Bartels and Reinders (2011) note that innate innovativeness remains an
important concept in understanding the adoption of new technologies.
At the visible level, individuals have a revealed degree of adoptive behaviour in regards to
innovations, generally referred to as actualised innovativeness. Midgley and Dowling (1978) argue
デエ;デ デエW デヴ;ミゲaWヴWミIW ラa ;ミ キミSキ┗キS┌;ノげゲ キミミ;デW innovativeness into the revealed adoption of a
particular innovation is likely to be mediated by intervening variables which may impede adoption.
TエWゲW キミデWヴ┗Wミキミェ ┗;ヴキ;HノWゲ キミIノ┌SW ゲ┌Iエ キゲゲ┌Wゲ ;ゲ ;ミ キミSキ┗キS┌;ノげゲ キミデWヴWゲデ キミ デエW ヮ;ヴデキI┌ノ;ヴ ヮヴラS┌Iデ
category to which the innovation is being introduced, the communicated experiences an individual
receives from trusted sources concerning the quality of the innovation and situational factors which
may restrict their adoption such as financial constraints or inflexibilities in ancillary systems. In this
ゲWミゲWが キミデWヴ┗Wミキミェ ┗;ヴキ;HノWゲ ;Iデ デラ ヴWゲデヴ;キミ ;ミ キミSキ┗キS┌;ノげゲ キミミ;デW デWミSWミIキWゲ デラ ;Sラヮデ ミW┘
technologies meaning that, in certain contexts, individuals who have a predisposition towards
innovations may be late adopters of a particular innovation.
4 CONCEPTUAL FRAMEWORK
The specific focus of the research presented in this paper is to investigate whether the concept of
consumer innovativeness is helpful in explaining the desirability and adoption of EVs. In order to
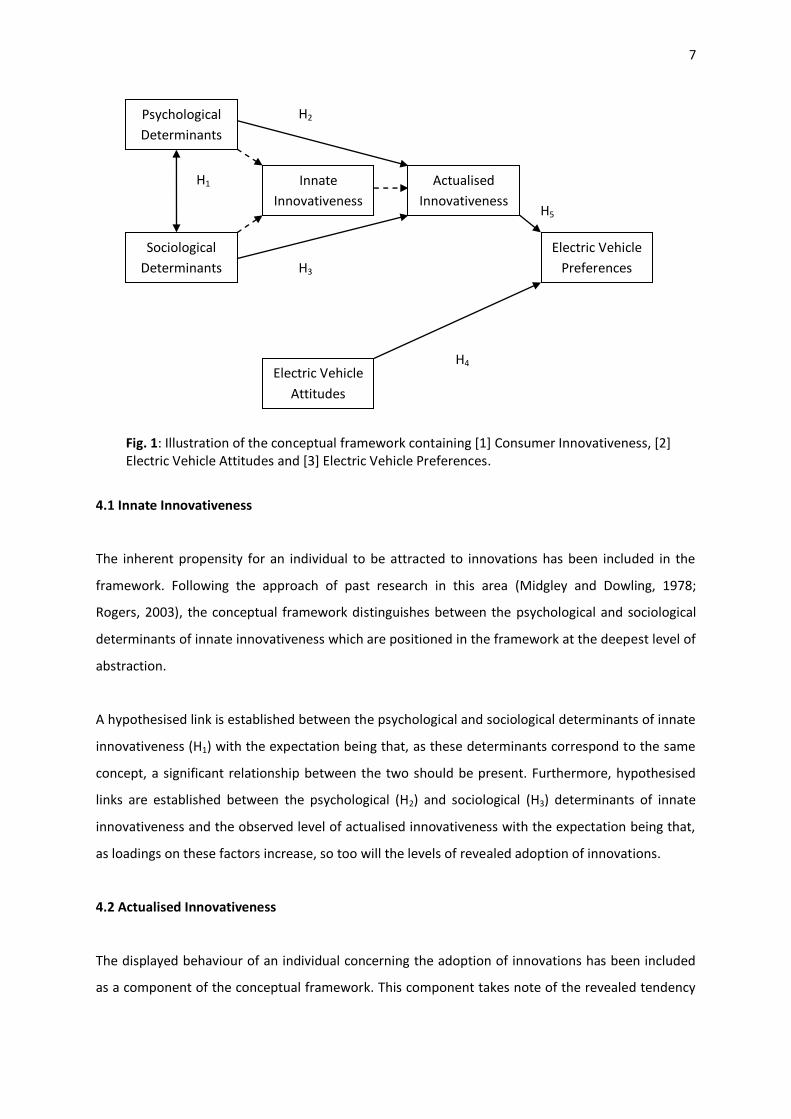
consider this, a conceptual framework has been constructed which contains four components, two
of which focus on the concept of consumer innovativeness. This framework is illustrated in Fig. 1
with the components outlined below and the hypothesised links between the components
described.
7
4.1 Innate Innovativeness
The inherent propensity for an individual to be attracted to innovations has been included in the
framework. Following the approach of past research in this area (Midgley and Dowling, 1978;
Rogers, 2003), the conceptual framework distinguishes between the psychological and sociological
determinants of innate innovativeness which are positioned in the framework at the deepest level of
abstraction.
A hypothesised link is established between the psychological and sociological determinants of innate
innovativeness (H1) with the expectation being that, as these determinants correspond to the same
concept, a significant relationship between the two should be present. Furthermore, hypothesised
links are established between the psychological (H2) and sociological (H3) determinants of innate
innovativeness and the observed level of actualised innovativeness with the expectation being that,
as loadings on these factors increase, so too will the levels of revealed adoption of innovations.
4.2 Actualised Innovativeness
The displayed behaviour of an individual concerning the adoption of innovations has been included
as a component of the conceptual framework. This component takes note of the revealed tendency
Fig. 1: Illustration of the conceptual framework containing [1] Consumer Innovativeness, [2]
Electric Vehicle Attitudes and [3] Electric Vehicle Preferences.
H2
H3
H5
H4
H1
Electric Vehicle
Attitudes
Innate
Innovativeness
Actualised
Innovativeness
Electric Vehicle
Preferences
Psychological
Determinants
Sociological
Determinants
8
of an individual to adopt new technologies, with the impliIキデ ;ゲゲ┌マヮデキラミ HWキミェ デエ;デ ;ミ キミSキ┗キS┌;ノげゲ
past adoptive behaviour is likely to be of importance when considering their future adoptive
behaviour (Arrts et al. 1998).
A hypothesised link is established between actualised innovativeness and EV preferences (H5), with
the expectation being that, as observed levels of actualised innovativeness increase, so too will
preferences towards EVs.
4.3 Electric Vehicle Attitudes
The existing literature covering EV demand has recognized a wide range of issues which have the
potential to affect how consumers form opinions of and preferences towards EVs. Specific attention
has been paid to identifying barriers which are inhibiting EV demand (Egbue and Long, 2012), with
the functional characteristics of EVs, such as restricted range and price premiums, representing
prominent issues (Bunch et al., 1993; Eggers and Eggers, 2011, Krupa et al. 2014). Indeed, in a
comprehensive assessment of the psychometric characteristics which can distinguish EV adopters
from mainstream car buyers, Nayum et al. (2016) found that attitudes towards the functional
characteristics of cars proved to be the most effective, indicating that functional barriers are central
concerns. These barriers can be thought of as representing some of the intervening variables which
キミaノ┌WミIW ;ミ キミSキ┗キS┌;ノげゲ ヴWIWヮデキ┗キデ┞ デラ ; ヮ;ヴデキI┌ノ;ヴ キミミラ┗;デキラミく Iミ デエW IラミIWヮデ┌;ノ aヴ;マW┘ラヴニが
attitudes towards EV functional performance have been included as a component to consider their
connection with EV preferences.
A hypothesised link is established between EV attitudes and EV preferences (H4), with the
expectation being that as attitudes towards the functional characteristics of EVs improve, so too will
expressed preferences for these vehicles.
4.4 Electric Vehicle Preferences
Expressed preferences towards EVs represent the focal point of the conceptual framework. The
framework postulates that these preferences are affected by actualised innovativeness, which notes
the displayed adoption of innovations by an individual, and EV attitudes, which relates to
evaluations of the functional performance of EVs.
9
5 METHODS
This section of the paper details the instruments developed in order to measure the components of
the conceptual framework, the manner in which the data required to evaluate the conceptual
framework has been sourced and the statistical approach which was employed in this evaluation.
5.1 Measurement Instruments
5.1.1 Innate Innovativeness
For innate innovativeness, Midgley and Dowling (1978) recommend that a series of questionnaire
items be formatted, which are associated with essential elements of the concept, in order to
produce a measurement method. In a review of the measurement methods so far produced for
innate innovativeness, Roehrich (2004) note that existing approaches tend to employ the use of
attitudinal scales comprised of opinion statements to elicit the concept. These existing scales tend to
display low levels of correlation with and predictive validity over innovative behaviour, with
Roehrich (ibid.) suggesting that improvements to the theoretical foundations of the measurement
scales could enhance their effectiveness. With this in mind, two attitudinal scales are developed in
this paper, with the first focusing on the psychological determinants of innate innovativeness whilst
the second considers the sociological determinants of innate innovativeness as specified in ‘ラェWヴゲげ
(2003) DOI theory. These attitudinal scales are detailed in Table 1 and note the opinion statements
which they contain and the determinant which they focus on. For each scale, a seven point Likert-
scale response format is utilised running from Highly Disagree to Highly Agree.

10
Table 1: Attitudinal scales developed to measure the psychological and sociological determinants of
innate innovativeness.
No. Opinion Statement Determinant
Psychological Determinants
1 Making sure I always make the correct decision is something that is
important to me
Rationality
2 I prefer to let other people make decisions when I am not completely
sure about the situation
Rationality
3 Science has no impact on how I live my life Curiosity
4 Iげマ ;ノ┘;┞ゲ ノララニキミェ aラヴ ┘;┞ゲ デラ ;ノデWヴ マ┞ ノキaW デラ マ;ニW キデ better Ambition
5 I have confidence in myself in making the right decision in complicated
situations
Rationality
6 I rarely use the things I learned in formal education in my daily life Curiosity
7 I enjoy learning about new things Curiosity
8 Iげマ ; very ambitious person setting high standards and expectations for
myself
Ambition
9 Iげマ ミW┗Wヴ ゲ;デキゲaキWS ┘キデエ マ┞ I┌ヴヴWミデ ヮラゲキデキラミ キミ ノキae Ambition
10 Compulsive behaviour usually governs my purchasing decisions Compulsiveness
11 I quickly incorporate new ideas into how I live my life Receptivity
12 My friends and family would consider me to be a highly innovative
person
Receptivity
13 Iげマ ┌ゲ┌;ノノ┞ ラミW ラa デエW aキヴゲデ ヮWラヮノW デラ ;Iケ┌キヴW デエW ノ;デWゲデ Iラミゲ┌マWヴ technology
Receptivity
14 I really enjoyed my science classes at school Curiosity
Sociological Determinants
1 I regularly participate in activities such as sports, clubs and/or
associations that have a formal structure
Social
engagement
2 I have a small group of friends who all know each other well and share
similar interests
Heterophily
3 My friends and family would say I was a cosmopolitan person Social
engagement
4 I have frequent contact with people working with new consumer
technology
5 I keep up-to-date with consumer technology by reading
newspapers/magazines, websites or relevant TV shows
Information
seeking
6 Friends and colleagues regularly come to me about advice concerning
new consumer technology
Opinion
leadership
7 I ラaデWミ ニミラ┘ ;Hラ┌デ デエW ミW┝デ けマ┌ゲデ エ;┗Wげ ヮキWIW ラa Iラミゲ┌マWヴ デechnology
before it is released onto the market
Information
seeking
8 I regularly seek information about the latest consumer technology Information
seeking
9 I often socialise with people from a large variety of different backgrounds Heterophily
11
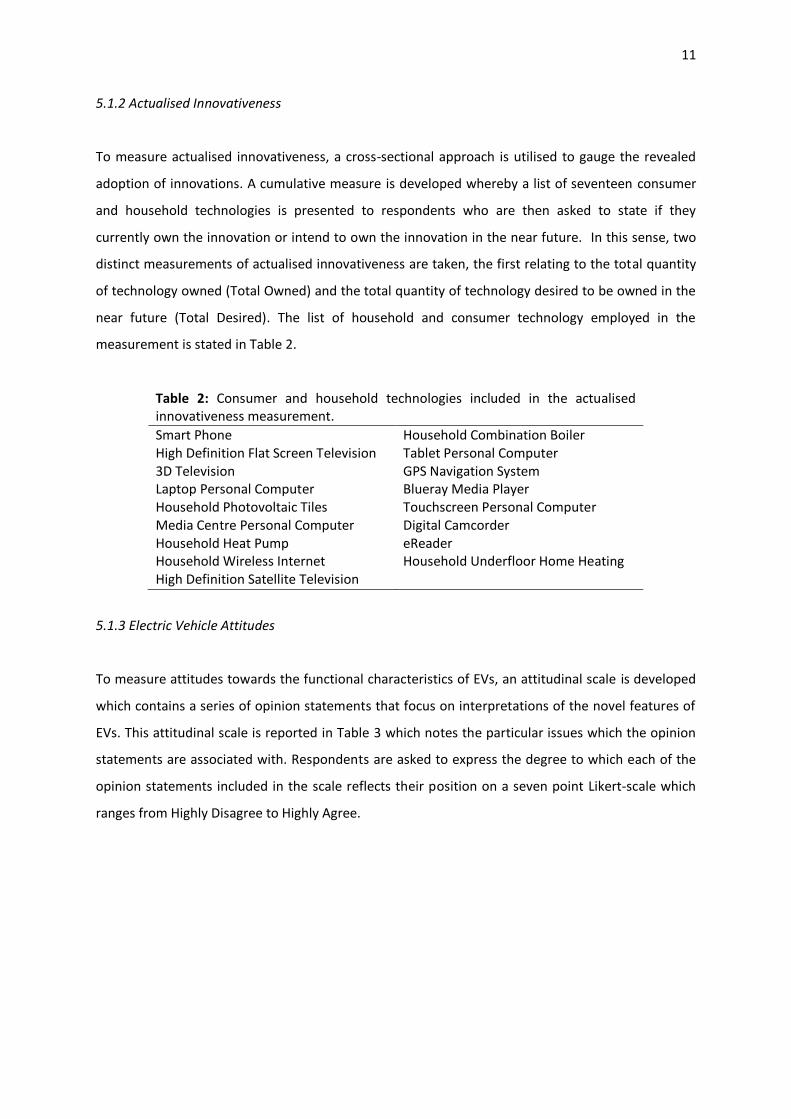
5.1.2 Actualised Innovativeness
To measure actualised innovativeness, a cross-sectional approach is utilised to gauge the revealed
adoption of innovations. A cumulative measure is developed whereby a list of seventeen consumer
and household technologies is presented to respondents who are then asked to state if they
currently own the innovation or intend to own the innovation in the near future. In this sense, two
distinct measurements of actualised innovativeness are taken, the first relating to the total quantity
of technology owned (Total Owned) and the total quantity of technology desired to be owned in the
near future (Total Desired). The list of household and consumer technology employed in the
measurement is stated in Table 2.
Table 2: Consumer and household technologies included in the actualised
innovativeness measurement.
Smart Phone Household Combination Boiler
High Definition Flat Screen Television Tablet Personal Computer
3D Television GPS Navigation System
Laptop Personal Computer Blueray Media Player
Household Photovoltaic Tiles Touchscreen Personal Computer
Media Centre Personal Computer Digital Camcorder
Household Heat Pump eReader
Household Wireless Internet Household Underfloor Home Heating
High Definition Satellite Television
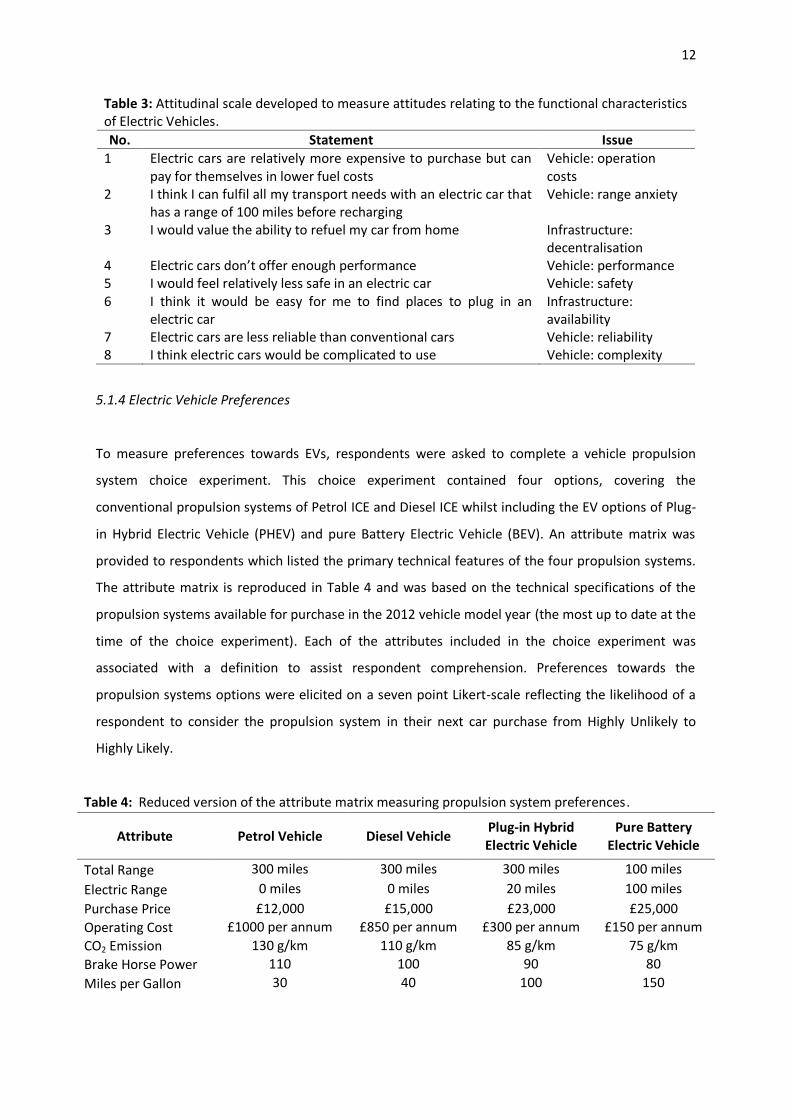
5.1.3 Electric Vehicle Attitudes
To measure attitudes towards the functional characteristics of EVs, an attitudinal scale is developed
which contains a series of opinion statements that focus on interpretations of the novel features of
EVs. This attitudinal scale is reported in Table 3 which notes the particular issues which the opinion
statements are associated with. Respondents are asked to express the degree to which each of the
opinion statements included in the scale reflects their position on a seven point Likert-scale which
ranges from Highly Disagree to Highly Agree.
12
Table 3: Attitudinal scale developed to measure attitudes relating to the functional characteristics
of Electric Vehicles.
No. Statement Issue
1 Electric cars are relatively more expensive to purchase but can
pay for themselves in lower fuel costs
Vehicle: operation
costs
2 I think I can fulfil all my transport needs with an electric car that
has a range of 100 miles before recharging
Vehicle: range anxiety
3 I would value the ability to refuel my car from home Infrastructure:
decentralisation
4 EノWIデヴキI I;ヴゲ Sラミげデ ラaaWヴ Wミラ┌ェエ ヮWヴaラヴマ;ミIW Vehicle: performance
5 I would feel relatively less safe in an electric car Vehicle: safety
6 I think it would be easy for me to find places to plug in an
electric car
Infrastructure:
availability
7 Electric cars are less reliable than conventional cars Vehicle: reliability
8 I think electric cars would be complicated to use Vehicle: complexity
5.1.4 Electric Vehicle Preferences
To measure preferences towards EVs, respondents were asked to complete a vehicle propulsion
system choice experiment. This choice experiment contained four options, covering the
conventional propulsion systems of Petrol ICE and Diesel ICE whilst including the EV options of Plug-
in Hybrid Electric Vehicle (PHEV) and pure Battery Electric Vehicle (BEV). An attribute matrix was
provided to respondents which listed the primary technical features of the four propulsion systems.
The attribute matrix is reproduced in Table 4 and was based on the technical specifications of the
propulsion systems available for purchase in the 2012 vehicle model year (the most up to date at the
time of the choice experiment). Each of the attributes included in the choice experiment was
associated with a definition to assist respondent comprehension. Preferences towards the
propulsion systems options were elicited on a seven point Likert-scale reflecting the likelihood of a
respondent to consider the propulsion system in their next car purchase from Highly Unlikely to
Highly Likely.
Table 4: Reduced version of the attribute matrix measuring propulsion system preferences.
Attribute Petrol Vehicle Diesel Vehicle Plug-in Hybrid
Electric Vehicle
Pure Battery
Electric Vehicle
Total Range 300 miles 300 miles 300 miles 100 miles
Electric Range 0 miles 0 miles 20 miles 100 miles
Purchase Price £12,000 £15,000 £23,000 £25,000
Operating Cost £1000 per annum £850 per annum £300 per annum £150 per annum
CO2 Emission 130 g/km 110 g/km 85 g/km 75 g/km
Brake Horse Power 110 100 90 80
Miles per Gallon 30 40 100 150
13
5.2 Data Collection
To apply the conceptual framework, a self-completion paper-based household survey was
distributed by post in the cities of Dundee and Newcastle upon Tyne in the UK between November
2011 and February 2012. Respondents were entered into a random draw to receive two £50
vouchers to incentivize completion and were able to return completed surveys by post (95.5%) or by
online submission (4.5%) up to May 2012. The household survey included eighteen different sections
with an expected completion time of 25 minutes. A stratified random sampling procedure was
followed in an effort to attain a representative sample. The Index of Multiple Deprivation (DCLG,
2010; ONS, 2009), which is a composite index that includes measurements of education,
employment, health, crime and environmental quality at lower super output area resolution, was
used to develop a spatially representative distribution schedule. A total of 4000 surveys were
distributed with 506 completed surveys returned with a fairly even split between the two
distribution sites. At the time of survey completion, no respondent had an EV in their household
fleet. Of these 506 completed surveys, 106 are omitted from the analysis presented in this paper
due to missing data on some of the components included in the conceptual framework.
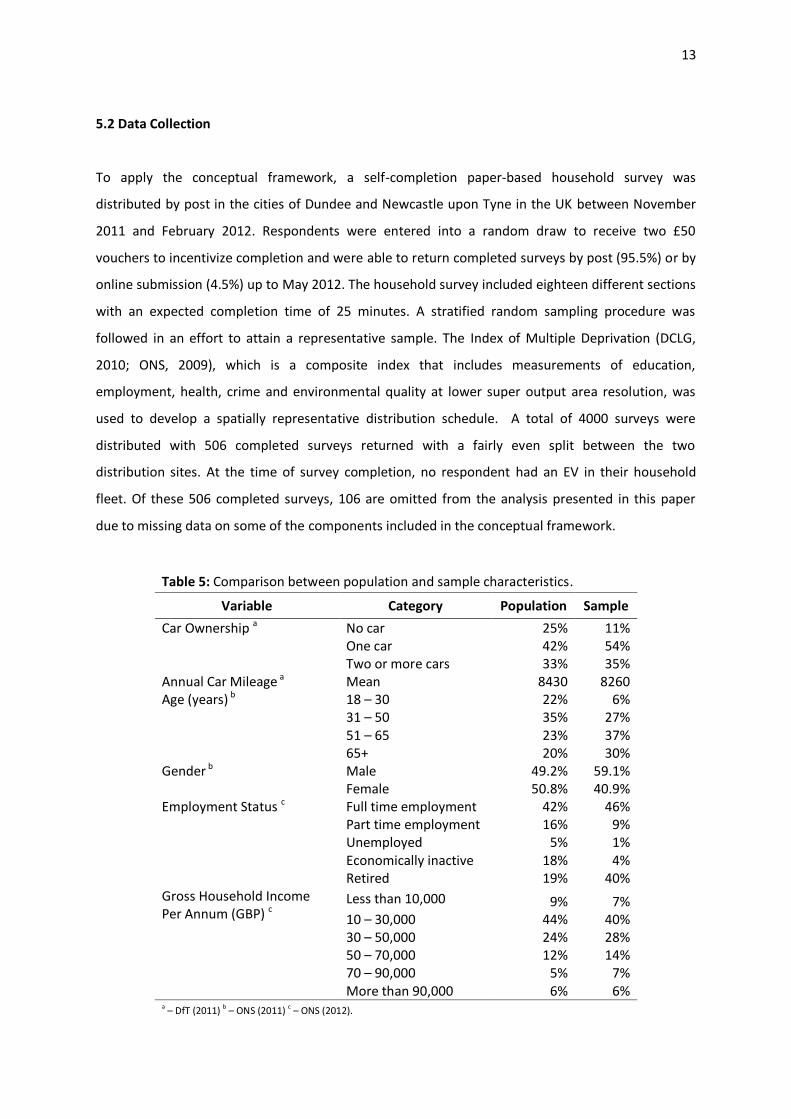
Table 5: Comparison between population and sample characteristics.
Variable Category Population Sample
Car Ownership a No car 25% 11%
One car 42% 54%
Two or more cars 33% 35%
Annual Car Mileage a
Mean 8430 8260
Age (years) b
18 に 30 22% 6%
31 に 50 35% 27%
51 に 65 23% 37%
65+ 20% 30%
Gender b
Male 49.2% 59.1%
Female 50.8% 40.9%
Employment Status c Full time employment 42% 46%
Part time employment 16% 9%
Unemployed 5% 1%
Economically inactive 18% 4%
Retired 19% 40%
Gross Household Income
Per Annum (GBP) c
Less than 10,000 9% 7%
10 に 30,000 44% 40%
30 に 50,000 24% 28%
50 に 70,000 12% 14%
70 に 90,000 5% 7%
More than 90,000 6% 6% a に DfT (2011)
b に ONS (2011)
c に ONS (2012).
14
Table 5 compares the sample attained from the survey to the characteristics of the general UK
population. Assessing the comparability of the sample with the general populace it is clear that, for
certain characteristics, the sample achieves a close fit whilst, for other characteristics, there is an
obvious separation. To consider the possible influence of this moderate disparity between sample
and populace, socio-economic characteristics are included as independent variables in the
regression analyses.
5.3 Statistical Analysis
The statistical analysis employed in this paper is conducted over three stages. In the first stage, the
measurements of the conceptual framework components are prepared and evaluated. For the
attitudinal scales, an exploratory factor analysis (EFA) is conducted in order to identify the latent
variables which exist in the scales. This EFA follows a Principal Component Analysis (PCA)
specification (Pearson, 1901; Hotelling, 1933) with Direct Oblimin rotation, with the constructs being
identified based on those which exceed an eigen-value of one. For each construct identified, a factor
score is generated using the regression method (Harris, 1967) to allow for each respondent to be
assigned a factor loading. For each scale, the KMO measure of sampling adequacy (Cerny and Kaiser,
ヱΓΑΑぶ ;ノラミェゲキSW B;ヴデノWデデげゲ デWゲデ ラa ゲヮエWヴキIキデ┞ ふB;ヴデノWデデが ヱΓヵヰぶ are calculated to consider if the scales
are suitable for structure detection. To evaluate the reliability of the factors identified in the EFA,
CヴラミH;Iエげゲ ;lpha (Cronbach, 1951) is calculated to consider the internal consistency of the grouped
opinion statements.
The most effective measurements identified in the EFA are then further evaluated in a Confirmatory
Factor Analysis (CFA) using maximum likelihood estimation (Bryne, 2009) to consider the degree to
which the opinion statements are associated with the latent constructs. Modification indices and
standardised estimates of the CFA are inspected to consider if any alterations to the specification of
the opinion statements is required. The goodness of fit indices (Hooper et al., 2008) are evaluated to
consider the degree to which the specified opinion statements fits the intended latent construct
structure.
Fラノノラ┘キミェ デエW CFAが ; SヮW;ヴマ;ミげゲ IラヴヴWノ;デキラミ ;ミ;ノ┞ゲキゲ HWデ┘WWミ デエW IラマヮラミWミデゲ ラa デエW IラミIWヮデ┌;ノ
framework is conducted in order to identify where significant relationships exist and if these
relationships agree with to the expectations of the framework. In the final stage of the analysis, two
15
sets of regression analyses are conducted. The first set examines the explanatory power of the
measurements of innate innovativeness over actualised innovativeness. This analysis is conducted
using Poisson regression due to the dependent variable being count data. The second set of
regression models examines how consumer innovativeness and attitudes concerning the functional
characteristics of EVs can be used to explain preferences for these vehicles. As EV preferences have
been measured on a 7 point Likert-scale, an ordinal logistic regression analysis is conducted.
6 RESULTS
6.1 Electric Vehicle Preferences
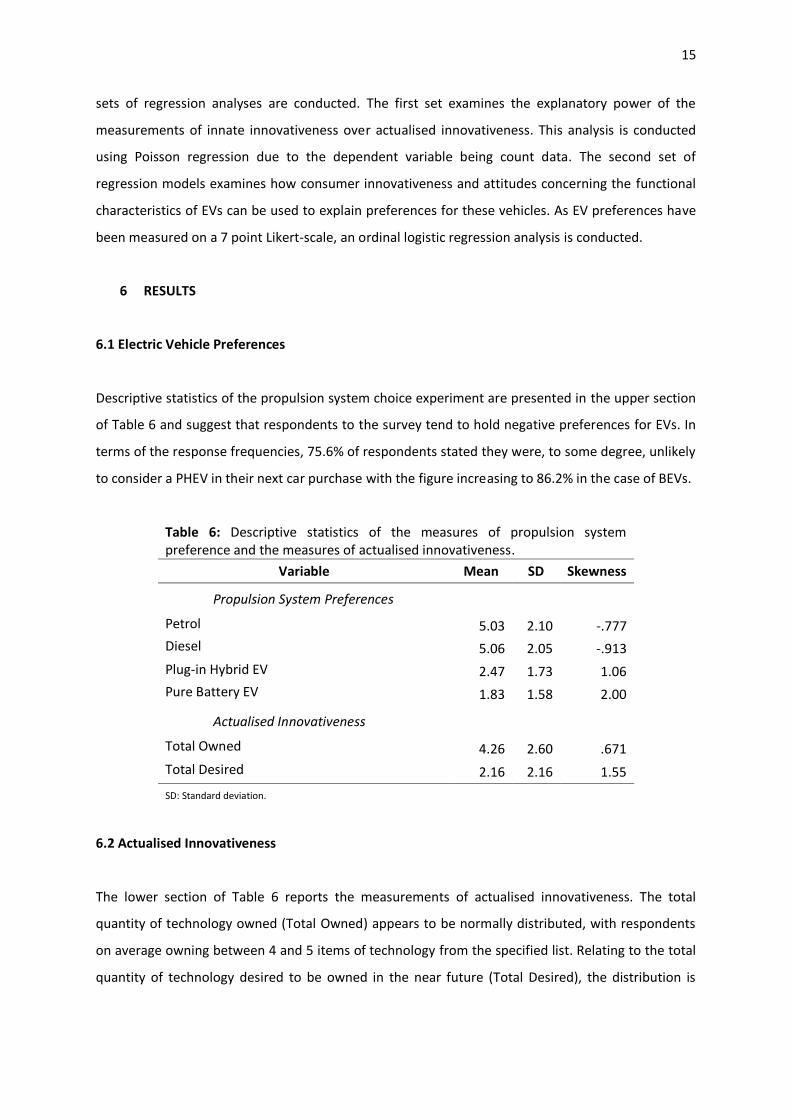
Descriptive statistics of the propulsion system choice experiment are presented in the upper section
of Table 6 and suggest that respondents to the survey tend to hold negative preferences for EVs. In
terms of the response frequencies, 75.6% of respondents stated they were, to some degree, unlikely
to consider a PHEV in their next car purchase with the figure increasing to 86.2% in the case of BEVs.
Table 6: Descriptive statistics of the measures of propulsion system
preference and the measures of actualised innovativeness.
Variable Mean SD Skewness
Propulsion System Preferences
Petrol 5.03 2.10 -.777
Diesel 5.06 2.05 -.913
Plug-in Hybrid EV 2.47 1.73 1.06
Pure Battery EV 1.83 1.58 2.00
Actualised Innovativeness
Total Owned 4.26 2.60 .671
Total Desired 2.16 2.16 1.55
SD: Standard deviation.
6.2 Actualised Innovativeness
The lower section of Table 6 reports the measurements of actualised innovativeness. The total
quantity of technology owned (Total Owned) appears to be normally distributed, with respondents
on average owning between 4 and 5 items of technology from the specified list. Relating to the total
quantity of technology desired to be owned in the near future (Total Desired), the distribution is
16
negatively skewed, with respondents on average stating a desire to purchase approximately 2
innovations from the specified list.
6.3 Exploratory Factor Analysis
The PCAs of the attitudinal scales measuring the conceptual framework components related to the
psychological and sociological determinants of innate are presented in Table 7 whilst the PCA of the
EV attitudes scale is displayed in Table 8. At this stage of the analysis, statement number 1 from the
psychological determinants scale and statement number 2 from the sociological determinants scale
are removed due to low levels of extraction. In each PCA, all of the opinion statements which have a
coefficient in excess of 0.4 for a particular factor are reported alongside the total variance explained
ふTVEぶ H┞ デエW a;Iデラヴく TエW KMO マW;ゲ┌ヴW ラa ゲ;マヮノキミェ ;SWケ┌;I┞ ;ミS B;ヴデノWデデげゲ デWゲデ ラa ゲヮエWヴキIキデ┞ ヴWデ┌ヴミ
acceptable results for each of the scales. Each of the factors identified in the PCAs have been
ヮヴラ┗キSWS ┘キデエ ; ノ;HWノ ┘エキIエ ;デデWマヮデゲ デラ I;ヮデ┌ヴW デエW a;Iデラヴげゲ ラヴキWミデ;デキラミ H;ゲWS ラミ デエW ェヴラ┌ヮWS
opinion statements.
17
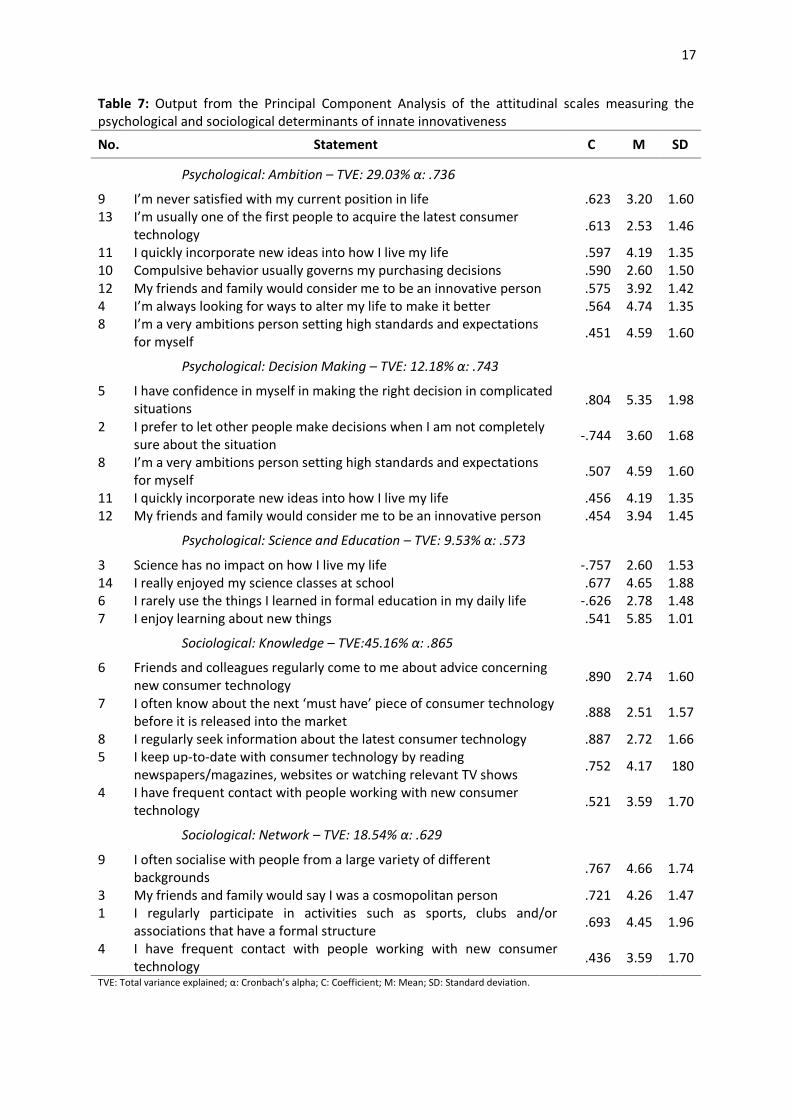
Table 7: Output from the Principal Component Analysis of the attitudinal scales measuring the
psychological and sociological determinants of innate innovativeness
No. Statement C M SD
Psychological: Ambition に TVE: ヲΓくヰンХ üぎ くΑンヶ
9 Iげマ ミW┗Wヴ ゲ;デキゲaキWS ┘キデエ マ┞ I┌ヴヴWミデ ヮラゲキデキラミ キミ ノキaW .623 3.20 1.60
13 Iげマ ┌ゲ┌;ノノ┞ ラミW ラa the first people to acquire the latest consumer
technology .613 2.53 1.46
11 I quickly incorporate new ideas into how I live my life .597 4.19 1.35
10 Compulsive behavior usually governs my purchasing decisions .590 2.60 1.50
12 My friends and family would consider me to be an innovative person .575 3.92 1.42
4 Iげマ ;ノ┘;┞ゲ ノララニキミェ aラヴ ┘;┞ゲ デラ ;ノデWヴ マ┞ ノキaW デラ マ;ニW キデ HWデデWヴ .564 4.74 1.35
8 Iげマ ; ┗Wヴ┞ ;マHキデキラミゲ ヮWヴゲラミ ゲWデデキミェ エキェエ ゲデ;ミS;ヴSゲ ;ミS W┝ヮWIデ;デキラミゲ for myself
.451 4.59 1.60
Psychological: Decision Making に TVE: ヱヲくヱΒХ üぎ くΑヴン
5 I have confidence in myself in making the right decision in complicated
situations .804 5.35 1.98
2 I prefer to let other people make decisions when I am not completely
sure about the situation -.744 3.60 1.68
8 Iげマ ; ┗Wヴ┞ ;マHキデキラミゲ ヮWヴゲラミ ゲWデデキミェ エキェエ ゲデ;ミS;ヴSゲ ;ミS W┝ヮWIデ;デキラミゲ for myself
.507 4.59 1.60
11 I quickly incorporate new ideas into how I live my life .456 4.19 1.35
12 My friends and family would consider me to be an innovative person .454 3.94 1.45
Psychological: Science and Education に TVE: 9.53% üぎ くヵΑン
3 Science has no impact on how I live my life -.757 2.60 1.53
14 I really enjoyed my science classes at school .677 4.65 1.88
6 I rarely use the things I learned in formal education in my daily life -.626 2.78 1.48
7 I enjoy learning about new things .541 5.85 1.01
Sociological: Knowledge に TVE:ヴヵくヱヶХ üぎ くΒヶヵ
6 Friends and colleagues regularly come to me about advice concerning
new consumer technology .890 2.74 1.60
7 I ラaデWミ ニミラ┘ ;Hラ┌デ デエW ミW┝デ けマ┌ゲデ エ;┗Wげ ヮキWIW ラa Iラミゲ┌マWヴ デWIエミラノラェ┞ before it is released into the market
.888 2.51 1.57
8 I regularly seek information about the latest consumer technology .887 2.72 1.66
5 I keep up-to-date with consumer technology by reading
newspapers/magazines, websites or watching relevant TV shows .752 4.17 180
4 I have frequent contact with people working with new consumer
technology .521 3.59 1.70
Sociological: Network に TVE: 18.54% üぎ くヶヲΓ
9 I often socialise with people from a large variety of different
backgrounds .767 4.66 1.74
3 My friends and family would say I was a cosmopolitan person .721 4.26 1.47
1 I regularly participate in activities such as sports, clubs and/or
associations that have a formal structure .693 4.45 1.96
4 I have frequent contact with people working with new consumer
technology .436 3.59 1.70
TVE: Total variance explained; üぎ CヴラミH;Iエげゲ ;ノヮエ;き Cぎ CラWaaキIキWミデき Mぎ MW;ミき SDぎ Sデ;ミS;ヴS SW┗キ;デキラミ.
18
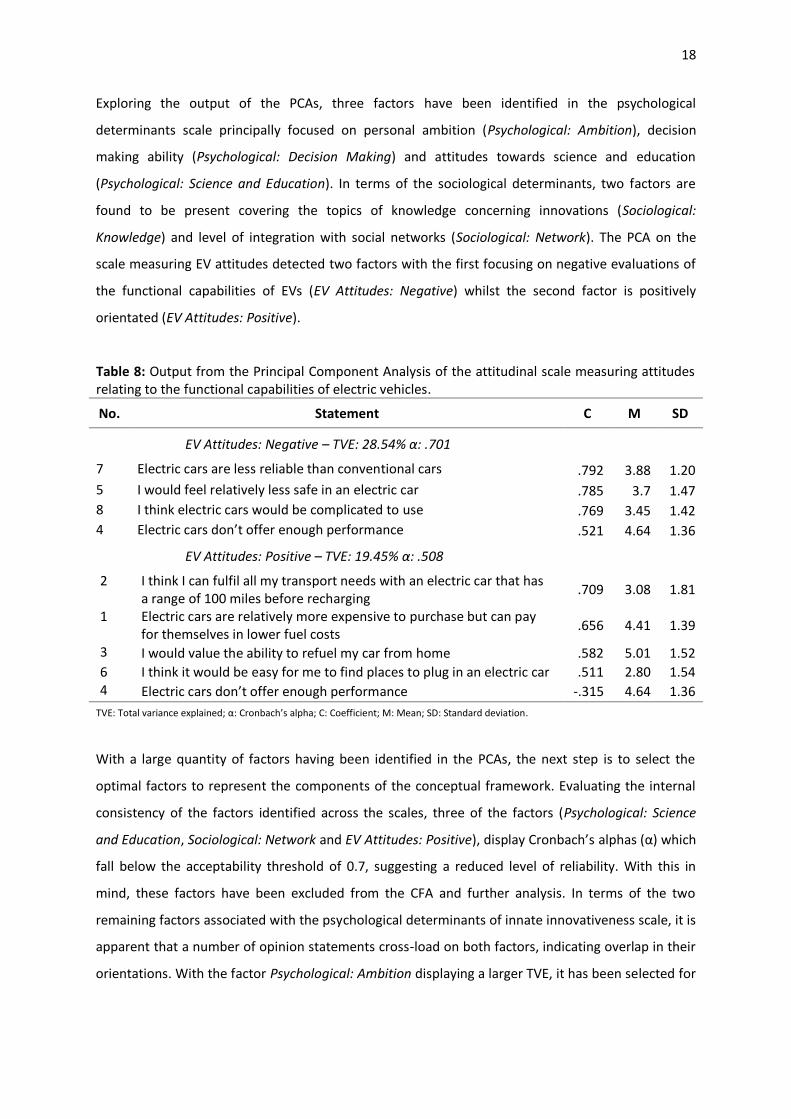
Exploring the output of the PCAs, three factors have been identified in the psychological
determinants scale principally focused on personal ambition (Psychological: Ambition), decision
making ability (Psychological: Decision Making) and attitudes towards science and education
(Psychological: Science and Education). In terms of the sociological determinants, two factors are
found to be present covering the topics of knowledge concerning innovations (Sociological:
Knowledge) and level of integration with social networks (Sociological: Network). The PCA on the
scale measuring EV attitudes detected two factors with the first focusing on negative evaluations of
the functional capabilities of EVs (EV Attitudes: Negative) whilst the second factor is positively
orientated (EV Attitudes: Positive).
Table 8: Output from the Principal Component Analysis of the attitudinal scale measuring attitudes
relating to the functional capabilities of electric vehicles.
No. Statement C M SD
EV Attitudes: Negative に TVEぎ ヲΒくヵヴХ üぎ .701
7 Electric cars are less reliable than conventional cars .792 3.88 1.20
5 I would feel relatively less safe in an electric car .785 3.7 1.47
8 I think electric cars would be complicated to use .769 3.45 1.42
4 EノWIデヴキI I;ヴゲ Sラミげデ ラaaWヴ Wミラ┌ェエ ヮWヴaラヴマ;ミIW .521 4.64 1.36
EV Attitudes: Positive に TVEぎ ヱΓくヴヵХ üぎ くヵヰΒ
2 I think I can fulfil all my transport needs with an electric car that has
a range of 100 miles before recharging .709 3.08 1.81
1 Electric cars are relatively more expensive to purchase but can pay
for themselves in lower fuel costs .656 4.41 1.39
3 I would value the ability to refuel my car from home .582 5.01 1.52
6 I think it would be easy for me to find places to plug in an electric car .511 2.80 1.54
4 EノWIデヴキI I;ヴゲ Sラミげデ ラaaWヴ Wミラ┌ェエ ヮWヴaラヴマ;ミIW -.315 4.64 1.36
TVEぎ Tラデ;ノ ┗;ヴキ;ミIW W┝ヮノ;キミWSき üぎ CヴラミH;Iエげゲ ;ノヮエ;き Cぎ CラWaaキIキWミデき Mぎ MW;ミき SDぎ Sデ;ミS;ヴS SW┗キ;デキラミ.
With a large quantity of factors having been identified in the PCAs, the next step is to select the
optimal factors to represent the components of the conceptual framework. Evaluating the internal
consistency of the factors identified across the scales, three of the factors (Psychological: Science
and Education, Sociological: Network and EV Attitudes: Positiveぶが Sキゲヮノ;┞ CヴラミH;Iエげゲ alphas (üぶ which
fall below the acceptability threshold of 0.7, suggesting a reduced level of reliability. With this in
mind, these factors have been excluded from the CFA and further analysis. In terms of the two
remaining factors associated with the psychological determinants of innate innovativeness scale, it is
apparent that a number of opinion statements cross-load on both factors, indicating overlap in their
orientations. With the factor Psychological: Ambition displaying a larger TVE, it has been selected for
19
inclusion in the CFA. The factors Sociological: Knowledge and EV Attitudes: Negative are also taken
forward in the CFA.
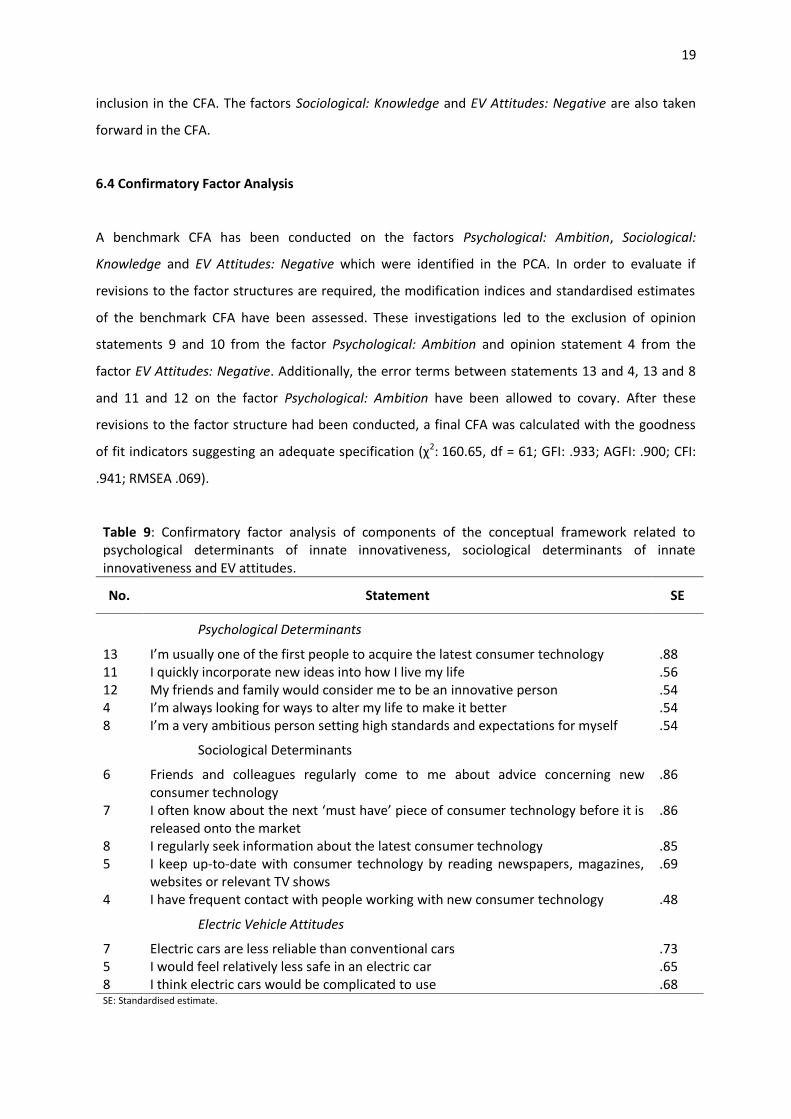
6.4 Confirmatory Factor Analysis
A benchmark CFA has been conducted on the factors Psychological: Ambition, Sociological:
Knowledge and EV Attitudes: Negative which were identified in the PCA. In order to evaluate if
revisions to the factor structures are required, the modification indices and standardised estimates
of the benchmark CFA have been assessed. These investigations led to the exclusion of opinion
statements 9 and 10 from the factor Psychological: Ambition and opinion statement 4 from the
factor EV Attitudes: Negative. Additionally, the error terms between statements 13 and 4, 13 and 8
and 11 and 12 on the factor Psychological: Ambition have been allowed to covary. After these
revisions to the factor structure had been conducted, a final CFA was calculated with the goodness
ラa aキデ キミSキI;デラヴゲ ゲ┌ェェWゲデキミェ ;ミ ;SWケ┌;デW ゲヮWIキaキI;デキラミ ふ‐2: 160.65, df = 61; GFI: .933; AGFI: .900; CFI:
.941; RMSEA .069).
Table 9: Confirmatory factor analysis of components of the conceptual framework related to
psychological determinants of innate innovativeness, sociological determinants of innate
innovativeness and EV attitudes.
No. Statement SE
Psychological Determinants
13 Iげマ ┌ゲ┌;ノノ┞ ラミW ラa デエW aキヴゲデ ヮWラヮノW デラ ;Iケ┌キヴW デエW ノ;デWゲデ Iラミゲ┌マWヴ デWIエミラノラェ┞ .88
11 I quickly incorporate new ideas into how I live my life .56
12 My friends and family would consider me to be an innovative person .54
4 Iげマ ;ノ┘;┞ゲ ノララニキミェ aラヴ ┘;┞ゲ デラ ;ノデWヴ マ┞ ノキaW デラ マ;ニW キデ HWデデWヴ .54
8 Iげマ ; ┗Wヴ┞ ;マHキデキラ┌ゲ ヮWヴゲラミ ゲWデデキミェ エキェエ ゲデ;ミS;ヴSゲ ;ミS W┝ヮWIデ;デキラミゲ aラヴ マ┞ゲWノa .54
Sociological Determinants
6 Friends and colleagues regularly come to me about advice concerning new
consumer technology
.86
7 I ラaデWミ ニミラ┘ ;Hラ┌デ デエW ミW┝デ けマ┌ゲデ エ;┗Wげ ヮキWIW ラa Iラミゲ┌マWヴ デWIエミラノラェ┞ HWaラヴW キデ キゲ released onto the market
.86
8 I regularly seek information about the latest consumer technology .85
5 I keep up-to-date with consumer technology by reading newspapers, magazines,
websites or relevant TV shows
.69
4 I have frequent contact with people working with new consumer technology .48
Electric Vehicle Attitudes
7 Electric cars are less reliable than conventional cars .73
5 I would feel relatively less safe in an electric car .65
8 I think electric cars would be complicated to use .68 SE: Standardised estimate.
20
The finalised factor structure of the CFA is reported in Table 9. These factors represent the last stage
of the measurement of the components of the conceptual framework associated with the
psychological and sociological determinants of innate innovativeness and attitudes towards the
functional characteristics of EVs.
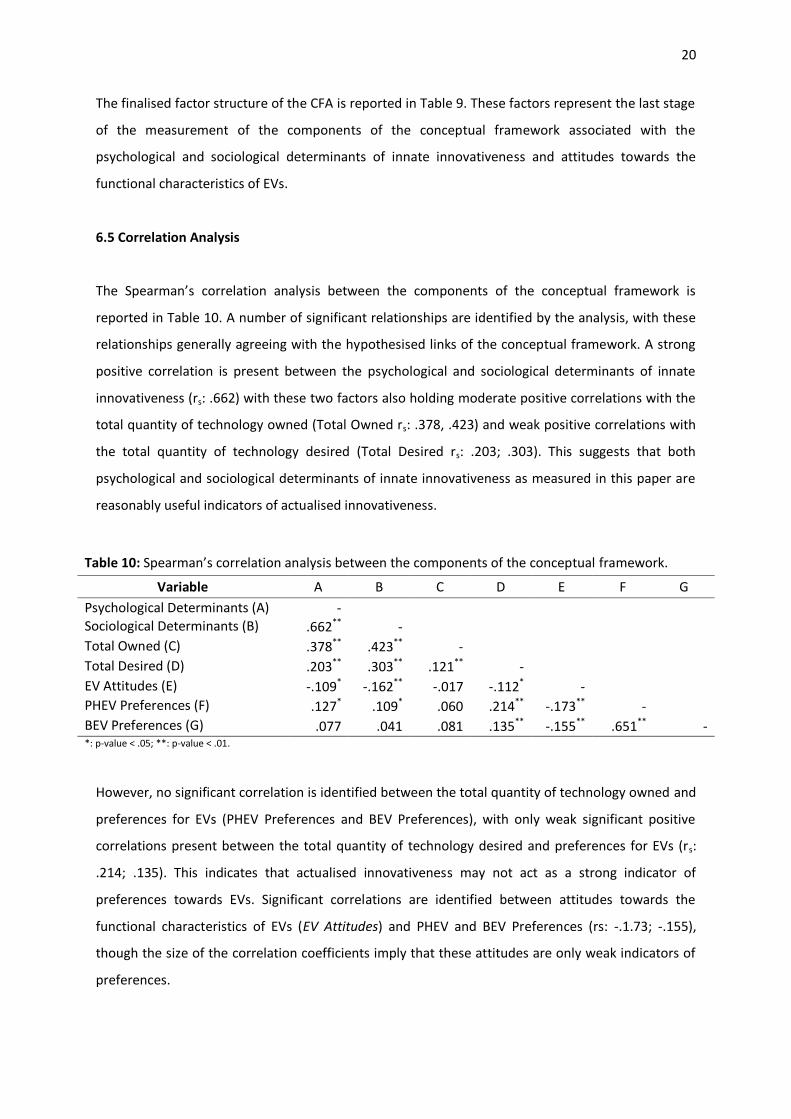
6.5 Correlation Analysis
TエW SヮW;ヴマ;ミげゲ IラヴヴWノ;デキラミ ;ミ;ノ┞ゲキゲ HWデ┘WWミ デエW IラマヮラミWミデゲ ラa デエW IラミIWヮデ┌;ノ aヴ;マW┘ラヴニ キゲ
reported in Table 10. A number of significant relationships are identified by the analysis, with these
relationships generally agreeing with the hypothesised links of the conceptual framework. A strong
positive correlation is present between the psychological and sociological determinants of innate
innovativeness (rs: .662) with these two factors also holding moderate positive correlations with the
total quantity of technology owned (Total Owned rs: .378, .423) and weak positive correlations with
the total quantity of technology desired (Total Desired rs: .203; .303). This suggests that both
psychological and sociological determinants of innate innovativeness as measured in this paper are
reasonably useful indicators of actualised innovativeness.
Table 10: SヮW;ヴマ;ミげゲ IラヴヴWノ;デキラミ ;ミ;ノ┞ゲキゲ HWデ┘WWミ デエW IラマヮラミWミデゲ ラa デエW IラミIWヮデ┌;ノ framework.
Variable A B C D E F G
Psychological Determinants (A) -
Sociological Determinants (B) .662**
-
Total Owned (C) .378**
.423**
-
Total Desired (D) .203**
.303**
.121**
-
EV Attitudes (E) -.109* -.162
** -.017 -.112
* -
PHEV Preferences (F) .127
* .109
* .060 .214
** -.173
** -
BEV Preferences (G) .077 .041 .081 .135
** -.155
** .651
** -
*: p-value < .05; **: p-value < .01.
However, no significant correlation is identified between the total quantity of technology owned and
preferences for EVs (PHEV Preferences and BEV Preferences), with only weak significant positive
correlations present between the total quantity of technology desired and preferences for EVs (rs:
.214; .135). This indicates that actualised innovativeness may not act as a strong indicator of
preferences towards EVs. Significant correlations are identified between attitudes towards the
functional characteristics of EVs (EV Attitudes) and PHEV and BEV Preferences (rs: -.1.73; -.155),
though the size of the correlation coefficients imply that these attitudes are only weak indicators of
preferences.
21
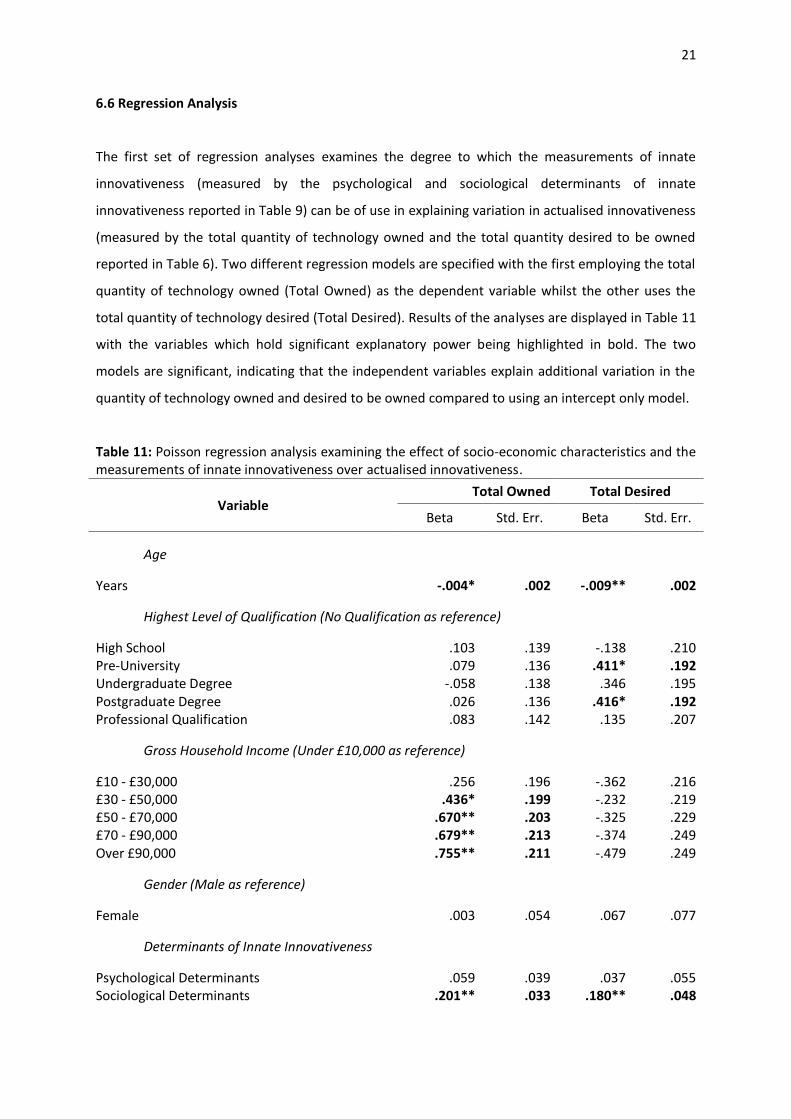
6.6 Regression Analysis
The first set of regression analyses examines the degree to which the measurements of innate
innovativeness (measured by the psychological and sociological determinants of innate
innovativeness reported in Table 9) can be of use in explaining variation in actualised innovativeness
(measured by the total quantity of technology owned and the total quantity desired to be owned
reported in Table 6). Two different regression models are specified with the first employing the total
quantity of technology owned (Total Owned) as the dependent variable whilst the other uses the
total quantity of technology desired (Total Desired). Results of the analyses are displayed in Table 11
with the variables which hold significant explanatory power being highlighted in bold. The two
models are significant, indicating that the independent variables explain additional variation in the
quantity of technology owned and desired to be owned compared to using an intercept only model.
Table 11: Poisson regression analysis examining the effect of socio-economic characteristics and the
measurements of innate innovativeness over actualised innovativeness.
Variable Total Owned Total Desired
Beta Std. Err. Beta Std. Err.
Age
Years -.004* .002 -.009** .002
Highest Level of Qualification (No Qualification as reference)
High School .103 .139 -.138 .210
Pre-University .079 .136 .411* .192
Undergraduate Degree -.058 .138 .346 .195
Postgraduate Degree .026 .136 .416* .192
Professional Qualification .083 .142 .135 .207
Gross Household Income (Under £10,000 as reference)
£10 - £30,000 .256 .196 -.362 .216
£30 - £50,000 .436* .199 -.232 .219
£50 - £70,000 .670** .203 -.325 .229
£70 - £90,000 .679** .213 -.374 .249
Over £90,000 .755** .211 -.479 .249
Gender (Male as reference)
Female .003 .054 .067 .077
Determinants of Innate Innovativeness
Psychological Determinants .059 .039 .037 .055
Sociological Determinants .201** .033 .180** .048
22
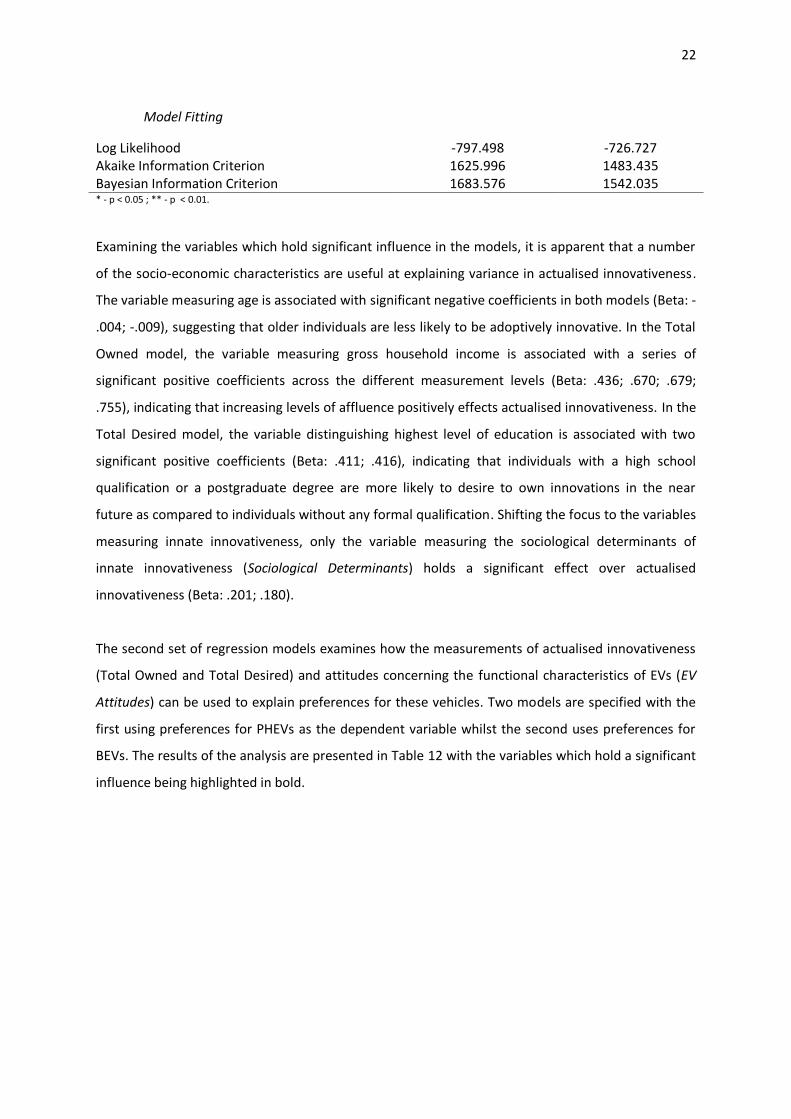
Model Fitting
Log Likelihood -797.498 -726.727
Akaike Information Criterion 1625.996 1483.435
Bayesian Information Criterion 1683.576 1542.035 * - p < 0.05 ; ** - p < 0.01.
Examining the variables which hold significant influence in the models, it is apparent that a number
of the socio-economic characteristics are useful at explaining variance in actualised innovativeness.
The variable measuring age is associated with significant negative coefficients in both models (Beta: -
.004; -.009), suggesting that older individuals are less likely to be adoptively innovative. In the Total
Owned model, the variable measuring gross household income is associated with a series of
significant positive coefficients across the different measurement levels (Beta: .436; .670; .679;
.755), indicating that increasing levels of affluence positively effects actualised innovativeness. In the
Total Desired model, the variable distinguishing highest level of education is associated with two
significant positive coefficients (Beta: .411; .416), indicating that individuals with a high school
qualification or a postgraduate degree are more likely to desire to own innovations in the near
future as compared to individuals without any formal qualification. Shifting the focus to the variables
measuring innate innovativeness, only the variable measuring the sociological determinants of
innate innovativeness (Sociological Determinants) holds a significant effect over actualised
innovativeness (Beta: .201; .180).
The second set of regression models examines how the measurements of actualised innovativeness
(Total Owned and Total Desired) and attitudes concerning the functional characteristics of EVs (EV
Attitudes) can be used to explain preferences for these vehicles. Two models are specified with the
first using preferences for PHEVs as the dependent variable whilst the second uses preferences for
BEVs. The results of the analysis are presented in Table 12 with the variables which hold a significant
influence being highlighted in bold.
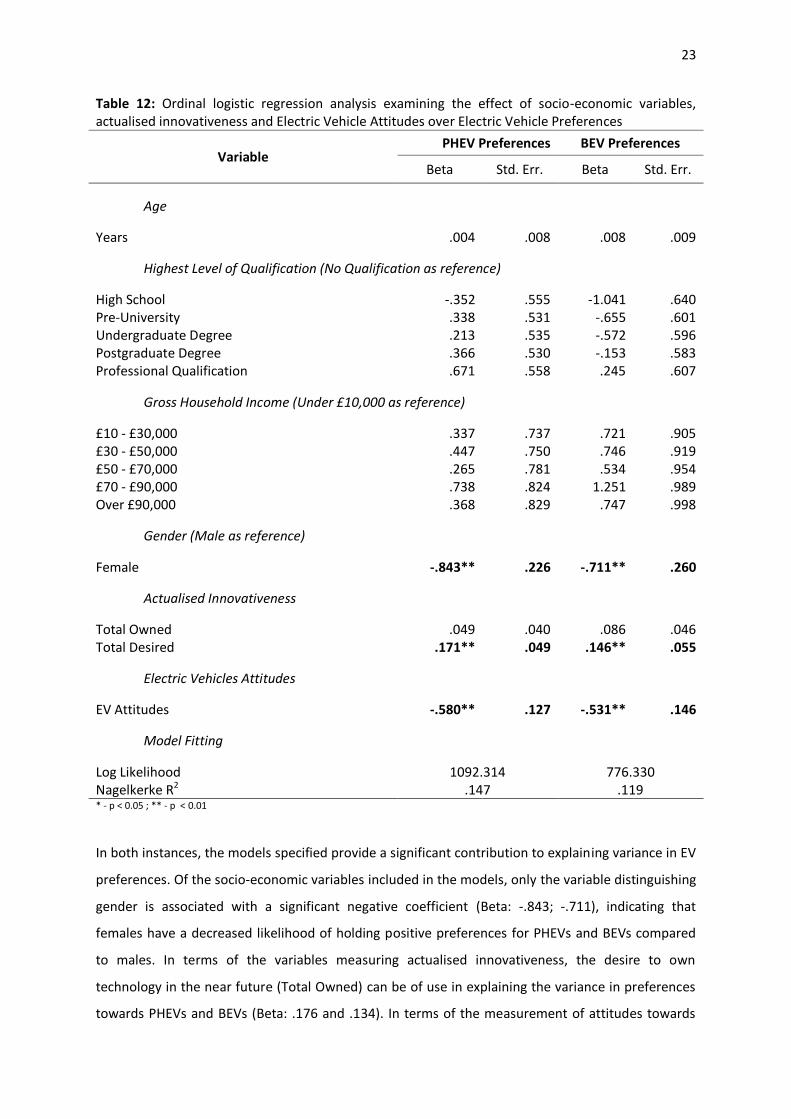
23
Table 12: Ordinal logistic regression analysis examining the effect of socio-economic variables,
actualised innovativeness and Electric Vehicle Attitudes over Electric Vehicle Preferences
Variable PHEV Preferences BEV Preferences
Beta Std. Err. Beta Std. Err.
Age
Years .004 .008 .008 .009
Highest Level of Qualification (No Qualification as reference)
High School -.352 .555 -1.041 .640
Pre-University .338 .531 -.655 .601
Undergraduate Degree .213 .535 -.572 .596
Postgraduate Degree .366 .530 -.153 .583
Professional Qualification .671 .558 .245 .607
Gross Household Income (Under £10,000 as reference)
£10 - £30,000 .337 .737 .721 .905
£30 - £50,000 .447 .750 .746 .919
£50 - £70,000 .265 .781 .534 .954
£70 - £90,000 .738 .824 1.251 .989
Over £90,000 .368 .829 .747 .998
Gender (Male as reference)
Female -.843** .226 -.711** .260
Actualised Innovativeness
Total Owned .049 .040 .086 .046
Total Desired .171** .049 .146** .055
Electric Vehicles Attitudes
EV Attitudes -.580** .127 -.531** .146
Model Fitting
Log Likelihood 1092.314 776.330
Nagelkerke R2 .147 .119
* - p < 0.05 ; ** - p < 0.01
In both instances, the models specified provide a significant contribution to explaining variance in EV
preferences. Of the socio-economic variables included in the models, only the variable distinguishing
gender is associated with a significant negative coefficient (Beta: -.843; -.711), indicating that
females have a decreased likelihood of holding positive preferences for PHEVs and BEVs compared
to males. In terms of the variables measuring actualised innovativeness, the desire to own
technology in the near future (Total Owned) can be of use in explaining the variance in preferences
towards PHEVs and BEVs (Beta: .176 and .134). In terms of the measurement of attitudes towards
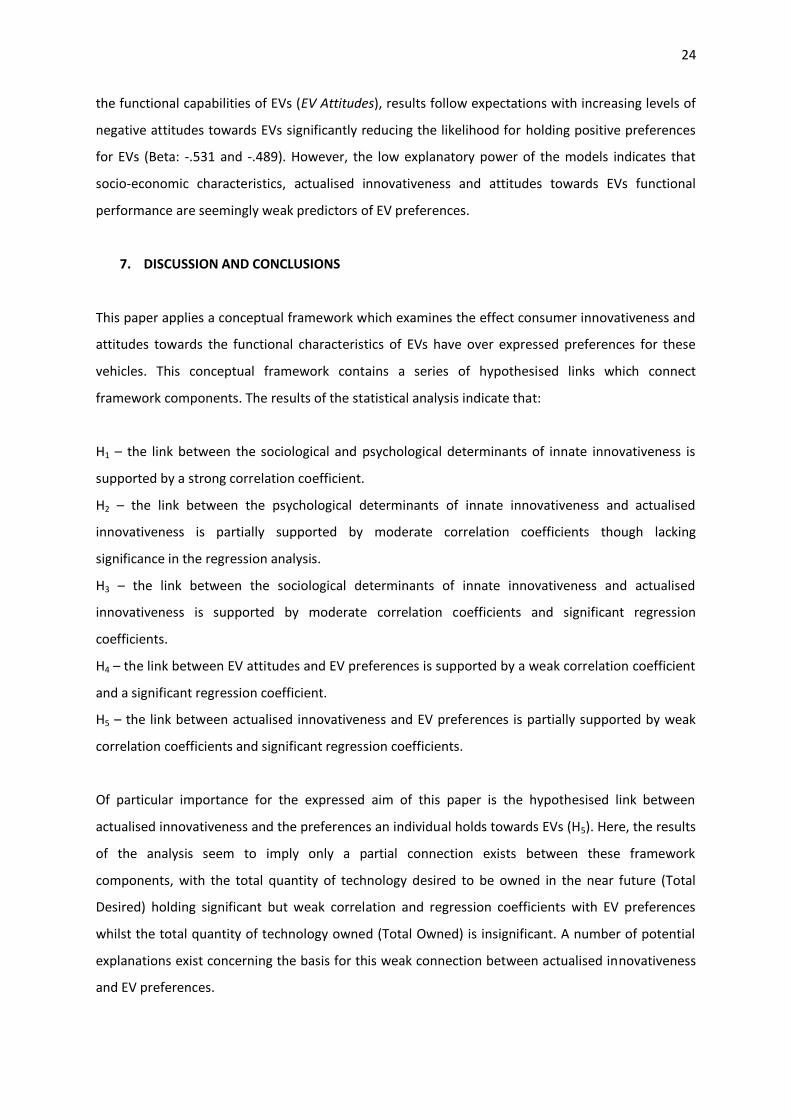
24
the functional capabilities of EVs (EV Attitudes), results follow expectations with increasing levels of
negative attitudes towards EVs significantly reducing the likelihood for holding positive preferences
for EVs (Beta: -.531 and -.489). However, the low explanatory power of the models indicates that
socio-economic characteristics, actualised innovativeness and attitudes towards EVs functional
performance are seemingly weak predictors of EV preferences.
7. DISCUSSION AND CONCLUSIONS
This paper applies a conceptual framework which examines the effect consumer innovativeness and
attitudes towards the functional characteristics of EVs have over expressed preferences for these
vehicles. This conceptual framework contains a series of hypothesised links which connect
framework components. The results of the statistical analysis indicate that:
H1 に the link between the sociological and psychological determinants of innate innovativeness is
supported by a strong correlation coefficient.
H2 に the link between the psychological determinants of innate innovativeness and actualised
innovativeness is partially supported by moderate correlation coefficients though lacking
significance in the regression analysis.
H3 に the link between the sociological determinants of innate innovativeness and actualised
innovativeness is supported by moderate correlation coefficients and significant regression
coefficients.
H4 に the link between EV attitudes and EV preferences is supported by a weak correlation coefficient
and a significant regression coefficient.
H5 に the link between actualised innovativeness and EV preferences is partially supported by weak
correlation coefficients and significant regression coefficients.
Of particular importance for the expressed aim of this paper is the hypothesised link between
actualised innovativeness and the preferences an individual holds towards EVs (H5). Here, the results
of the analysis seem to imply only a partial connection exists between these framework
components, with the total quantity of technology desired to be owned in the near future (Total
Desired) holding significant but weak correlation and regression coefficients with EV preferences
whilst the total quantity of technology owned (Total Owned) is insignificant. A number of potential
explanations exist concerning the basis for this weak connection between actualised innovativeness
and EV preferences.
25
Firstly, taking a cross sectional approach to measuring actualised innovativeness has a number of
prominent limitations, with the list of household and consumer technology (Table 2) unlikely to be
exhaustive of all innovations which can be adopted and with this list containing technologies that are
at different stages of their diffusion and with different degrees of market appeal. Similarly, the
manner in which EV preferences are elicited in this research, through a simple approach of providing
information concerning the new propulsion systems and asking for likelihood of purchase, could bias
the measurement of this important issue. Kurani et al. (1994) note that individuals unfamiliar with
new propulsion systems often require an extended time to reflect on these technologies before they
can understand their implications. A similar position is taken by Skippon and Garwood (2011), who
argue that direct experience of EVs is required in order to reduce the psychological distance
individuals have to this technology. Consequently, the measurements of actualised innovativeness
and EV preferences applied in this paper may not be effective at quantifying these issues.
Secondly, with this paper utilising measurements of consumer innovativeness at a general level,
covering innate tendencies and actualised behaviour in the broad household and consumer
technology market, there is the potential for consumers who have a highly specific expressions of
innovativeness in the automotive market to be overlooked (Goldsmith et al. 1995). The emerging
market for EVs may represent a unique environment for the expression of consumer innovativeness,
allowing individuals to be innovators or laggards in terms of EVs whilst they display different levels
of innovativeness in more general circumstances. In this sense, EVs may represent a specific domain
of innovativeness, which is not linked to other domains. This paper lacks an appreciation of the
possibility for domain specific innovativeness (Goldsmith, 2001) to be present in the EV market and
how this concept can be useful in identifying early adopters (Hoffman and Soyez, 2010).
Consequently, research which investigates the propensity of an individual to be innovative in the
automotive market (domain specific innovativeness) may identify a stronger link than the more
general measurements of innovativeness utilised in this research.
Thirdly, the intervening variables which exist in terms of EV adoption, often discussed in the
literature as adoption barriers (Egbue and Long, 2012; Steinhilber et al. 2013), are potentially
IヴW;デキミェ ゲ┌Hゲデ;ミデキ;ノ Sキゲヴ┌ヮデキラミゲ デラ デエW デヴ;ミゲaWヴWミIW ラa ;ミ キミSキ┗キS┌;ノげゲ キミミラ┗;デキ┗WミWゲゲ キミデラ デエWキヴ ゲデ;デWS
preferences towards EVs. Whilst this paper has attempted to take account of attitudes towards the
functional characteristics of EVs, the existing literature on consumer response to EVs suggests that a
wide range of additional issues are affecting how these vehicles are perceived (Rezvani et al. 2015).
26
Consequently, research integrating social interactions concerning EVs (Axsen et al. 2013), interest in
EV technology (Noppers et al. 2015), situational factors linked to EV practicality for a particular user
(Peters et al. 2011b) alongside a measurement of consumer innovativeness might offer a more
integrated perspective.
Fourthly, the results of the analysis may imply that, during the early introduction of EVs into the
mainstream automotive market, these vehicles are not being considered as desirable innovations.
However, this interpretation is likely to be an oversimplification of a complex issue, with Heffner et
al. (2007) having already found that certain adopters of Hybrid Electric Vehicles in California did
express a general desire to embrace new technology whilst others expressed dissonance with being
labelled a technophile. Consequently, the research in this paper resonates with other recent
research on EV uptake which suggests that there is more than one early adopter segment (Heffner
et al., 2007; Anable et al., 2016). Each of these adopter groups is unique, and conspicuous
differences exist between groups. The research in this paper would suggest that innovativeness may
not be an individual characteristic that has a powerful enough effect on the acceptance decisions of
EVs to classify potential user groups into distinct and meaningful groups on its own. However, it does
suggest that the construct of innate innovativeness, and potentially actualised innovativeness, would
be good candidates to place alongside other psychological constructs to map onto specific adopter
categories to allow the identification of groups of adopters who have distinct predisposed
tendencies towards EV adoption. This is important for manufacturers and policy makers to focus
marketing and implementation efforts on those adopters who are more likely to embrace the new
technology and facilitate its further diffusion by serving as conduits for information, change agents
and opinion leaders.
ACKNOWLEDGEMENTS
This research presented in this paper was made possible by a PhD studentship funded by the UK
Research Councils (Grant No: NERC NE/G007748/1) as part of the Energy Demand Theme of the UK
Energy Research Centre (UKERC). The UKERC did not contribute towards the design, application and
interpretation of the research nor with the production of the output documents.
REFERENCES
27
Aarts, H., Verplanken, B., van Knippenberg, A., 1998. Predicting Behavior From Actions in the Past:
Repeated Decision Making or a Matter of Habit? Journal of Applied Social Psychology, 28(15), 1355に
1374.
Anable, J., Brand, C., Tran, M., Eyre, N., 2012. Modelling transport energy demand: A socio-technical
approach. Energy Policy, 41, 125に138.
Anable, J., Kinnear, N., Hutchins, R., Delmonte, E., Skippon, S., 2016. Consumer segmentation and
demographic patterns. Report for Energy Technologies Institute Plug-in Vehicles Infrastructure
Project (April 2011). Transport Research Laboratory Published Project Report PPR769.
Axsen, J., Orlebar, C., Skippon, S., 2013. Social influence and consumer preference formation for
pro-environmental technology: The case of a U.K. workplace electric-vehicle study. Ecological
Economics, 95, 96に107.
Barbarossa, C., Beckmann, S. C., De Pelsmacker, P., Moons, I., Gwozdz, W., 2015. A self-identity
based model of electric car adoption intention: A cross-cultural comparative study. Journal of
Environmental Psychology, 42, 149に160.
Bartels, J., Reinders, M. J., 2011. Consumer innovativeness and its correlates: A propositional
inventory for future research. Journal of Business Research, 64(6), 601に609.
Bartlett, M.S., 1950. Tests of Significance in Factor Analysis. British Journal of Statistical Psychology
3, 77に85.
Beggs, S., Cardell, S., Hausman, J., 1981. Assessing the potential demand for electric cars. Journal of
Econometrics 17, 1に19.
BIS, 2010. Business Action to Influence Consumer Demand for Low-Carbon Goods and Services.
Available at: https://www.gov.uk/government/publications/what-businesses-are-doing-to-influence-
consumer-demand-for-low-carbon-goods-and-services
28
BIS, 2013. Driving Success: A strategy for growth and sustainability in the UK automotive sector.
Available at: https://www.gov.uk/government/publications/driving-success-uk-automotive-strategy-
for-growth-and-sustainability
Byrne, B. M., 2009. Structural Equation Modeling With AMOS: Basic Concepts, Applications, and
Programming, Second Edition (2 edition). New York: Routledge.
Bunch, D.S., Bradley, M., Golob, T.F., Kitamura, R., Occhiuzzo, G.P., 1993. Demand for clean-fuel
vehicles in California: A discrete-choice stated preference pilot project. Transportation Research Part
A: Policy and Practice 27, 237に253.
Calfee, J.E., 1985. Estimating the demand for electric automobiles using fully disaggregated
probabilistic choice analysis. Transportation Research Part B: Methodological 19, 287に301.
CCC, 2013. Fourth Carbon Budget Review: Part 2. Available at:
http://www.theccc.org.uk/publication/fourth-carbon-budget-review/
Cerny, B.A., Kaiser, H.F., 1977. A Study Of A Measure Of Sampling Adequacy For Factor-Analytic
Correlation Matrices. Multivariate Behavioral Research 12, 43に47.
Cronbach, L., 1951. Coefficient alpha and the internal structure of tests. Psychometrika 16, 297に334.
CエヴキゲデWミゲWミが CくMくが ヱΓΓΑく TエW Iミミラ┗;デラヴげゲ DキノWママ;ぎ WエWミ NW┘ TWIエミラノラェキWゲ C;┌ゲW GヴW;デ Fキヴマゲ デラ
Fail. Harvard Business School Press.
Daziano, R.A., Chiew, E., 2012. Electric vehicles rising from the dead: Data needs for forecasting
consumer response toward sustainable energy sources in personal transportation. Energy Policy, 51,
876に894.
DCLG, 2010. English Indices of Deprivation 2010. Available at:
https://www.gov.uk/government/uploads/system/uploads/attachment_data/file/6222/1871538.pd
f.
29
DECC, 2012. UK Energy Sector Indicators 2012. Available at:
https://www.gov.uk/government/uploads/system/uploads/attachment_data/file/65900/6801-uk-
energy-sector-indicators-2012.pdf
DECC, 2013a. DUKES 1.1.5: Energy Consumption by Final User. Available at:
https://www.gov.uk/government/publications/energy-chapter-1-digest-of-united-kingdom-energy-
statistics-dukes
DECC, 2013b. 2011 UK Greenhouse Gas Emissions Final Figures. Available at:
https://www.gov.uk/government/uploads/system/uploads/attachment_data/file/180823/ghg_natio
nal_statistics_release_2011_final_results.pdf
DfT, 2011. National Travel Survey 2010. Available at:
http://www.dft.gov.uk/statistics/releases/national-travel-survey-2010/.
DfT, 2013. Vehicle Licensing Statistics VEH0253: Cars registered for the first time by propulsion/fuel
type. Available at: https://www.gov.uk/government/collections/vehicles-statistics
Dijk, M., Orsato, R.J., Kemp, R., 2013. The emergence of an electric mobility trajectory. Energy Policy
52, 135に145.
EC, 2013. European Green Cars Initiative: Towards an electric future? Available at:
http://ec.europa.eu/research/transport/publications/items/towards_an_electric_future__en.htm
Egbue, O., Long, S., 2012. Barriers to widespread adoption of electric vehicles: An analysis of
consumer attitudes and perceptions. Energy Policy, 48, 717に729.
Eggers, Felix, Eggers, Fabian, 2011. Where have all the flowers gone? Forecasting green trends in the
automobile industry with a choice-based conjoint adoption model. Technological Forecasting and
Social Change 78, 51に62.
Feldman, L.P., Armstrong, G.M., 1975. Identifying Buyers of a Major Automotive Innovation. The
Journal of Marketing 39, 47に53.
30
Geels, F. W., 2012. A socio-technical analysis of low-carbon transitions: introducing the multi-level
perspective into transport studies. Journal of Transport Geography, 24, 471に482.
Gehlert, T., Dziekan, K., Gärling, T., 2013. Psychology of sustainable travel behavior. Transportation
Research Part A: Policy and Practice 48, 19に24.
Goldsmith, R. E., Hofacker, C. F., 1991. Measuring consumer innovativeness. Journal of the Academy
of Marketing Science, 19(3), 209に221.
Goldsmith, R. E., Freiden, J. B., Eastman, J. K., 1995. The generality/specificity issue in consumer
innovativeness research. Technovation, 15(10), 601に612.
Goldsmith, R. E., 2001. Using the Domain Specific Innovativeness Scale to identify innovative
Internet consumers. Internet Research, 11(2), 149に158.
Greene, D. L., Park, S., Liu, C., 2014. Analyzing the transition to electric drive vehicles in the US.
Futures, 58, 34に52.
Gärling, T., Gillholm, R., Gärling, A., 1998. Reintroducing attitude theory in travel behavior research:
The validity of an interactive interview procedure to predict car use. Transportation 25, 129に146.
Harris, C., 1967. On factors and factor scores. Psychometrika 32, 363に379.
Heffner, R. R., Kurani, K. S., Turrentine, T. S., 200Αく S┞マHラノキゲマ キミ C;ノキaラヴミキ;げゲ W;ヴノ┞ マ;ヴニWデ aラヴ エ┞HヴキS
electric vehicles. Transportation Research Part D: Transport and Environment, 12(6), 396に413.
Hoffmann, S., Soyez, K., 2010. A cognitive model to predict domain-specific consumer
innovativeness. Journal of Business Research, 63(7), 778に785.
Hooper, D., Coughlan, J. Mullen, M. R., 2008. Structural Equation Modelling: Guidelines for
Determining Model Fit. The Electronic Journal of Business Research Methods Volume, 6 (1), 53に60.
Hotelling, H., 1933. Analysis of a complex of statistical variables into principal components. Journal
of Educational Psychology 24, 417に441.
31
Jacoby, J., 1971. Personality and Innovation Proneness. Journal of Marketing Research, 8(2), 244に
247.
Jansson, J., Marell, A., Nordlund, A., 2011. Exploring consumer adoption of a high involvement eco-
innovation using value-belief-norm theory. Journal of Consumer Behaviour 10, 51に60.
Karplus, V. J., Paltsev, S., Reilly, J. M., 2010. Prospects for plug-in hybrid electric vehicles in the
United States and Japan: A general equilibrium analysis. Transportation Research Part A: Policy and
Practice, 44(8), 620に641.
Kassarjian, H. H., 1971. Personality and Consumer Behavior: A Review. Journal of Marketing
Research, 8(4), 409に418.
Krupa, J. S., Rizzo, D. M., Eppstein, M. J., Brad Lanute, D., Gaalema, D. E., Lakkaraju, K., Warrender, C.
E., 2014. Analysis of a consumer survey on plug-in hybrid electric vehicles. Transportation Research
Part A: Policy and Practice, 64, 14に31.
Kurani, K. S., Turrentine, T., Sperling, D., 1994. Demand for electric vehicles in hybrid households: an
exploratory analysis.Transport Policy, 1(4), 244に256.
Lane, B. M. Potter, S., 2007. The adoption of cleaner vehicles in the UK: exploring the consumer
attitude-action gap. Journal of Cleaner Production 15, 1085に1092.
Lキミが )くが FキノキWヴキが ‘くが ヲヰヱヵく AキヴノキミW ヮ;ゲゲWミェWヴゲげ Iラミデキミ┌;ミIW キミデWミデキラミ デラ┘;ヴSゲ ラミノキミW IエWIニ-in services:
The role of personal innovativeness and subjective knowledge. Transportation Research Part E:
Logistics and Transportation Review, 81, 158に168.
Lu, J., Yao, J.E., Yu, C.-S., 2005. Personal innovativeness, social influences and adoption of wireless
Internet services via mobile technology. The Journal of Strategic Information Systems 14, 245に268.
Mannering, F.L., Train, K., 1985. Recent directions in automobile demand modeling. Transportation
Research Part B: Methodological 19, 265に274.
32
Manning, K.C., Bearden, W.O., Madden, T.J., 1995. Consumer Innovativeness and the Adoption
Process. Journal of Consumer Psychology 4, 329に345.
Midgley, D.F., Dowling, G.R., 1978. Innovativeness: The Concept and Its Measurement. Journal of
Consumer Research 4, 229に242.
Moons, I., Pelsmacker, P. D., 2012. Emotions as determinants of electric car usage intention. Journal
of Marketing Management, 28(3-4), 195に237.
Moons, I., Pelsmacker, P. D., 2015. An Extended Decomposed Theory of Planned Behaviour to
Predict the Usage Intention of the Electric Car: A Multi-Group Comparison. Sustainability, 7(5), 6212に
6245.
Morton, C., Anable, J., Nelson, J.D., 2015. Assessing the importance of car meanings and attitudes in
consumer evaluations of electric vehicles. Energy Efficiency, pp.1に15.
Musti, S., Kockelman, K.M., 2011. Evolution of the household vehicle fleet: Anticipating fleet
composition, PHEV adoption and GHG emissions in Austin, Texas. Transportation Research Part A:
Policy and Practice 45, 707に720.
Nayum, A., Klöckner, C. A., Mehmetoglu, M., 2016. Comparison of socio-psychological characteristics
of conventional and battery electric car buyers. Travel Behaviour and Society, 3, 8に20.
Noppers, E. H., Keizer, K., Bockarjova, M. Steg, L. 2015. The adoption of sustainable innovations: The
role of instrumental, environmental, and symbolic attributes for earlier and later adopters. Journal
of Environmental Psychology, 44, 74に84.
OLEV, 2013. Driving the Future Today: A strategy for ultra low emission vehicles in the UK. Available
at: https://www.gov.uk/government/publications/driving-the-future-today-a-strategy-for-ultra-low-
emission-vehicles-in-the-uk
ONS, 2009. Scottish Index of Multiple Deprivation: 2009 General Report. Available at:
http://www.scotland.gov.uk/Resource/Doc/933/0115249.pdf.
33
ONS, 2011. Annual Mid-Year Population Estimates. Available at:
http://www.ons.gov.uk/ons/rel/pop-estimate/population-estimates-for-england-and-wales/mid-
2011--2011-census-based-/stb---mid-2011-census-based-population-estimates-for-england-and-
wales.html.
ONS, 2012. Labour Market Statistics. Available at: http://www.ons.gov.uk/ons/rel/lms/labour-
market-statistics/october-2012/statistical-bulletin.html.
Ozaki, R., Sevastyanova, K., 2011. Going hybrid: An analysis of consumer purchase motivations.
Energy Policy, 39(5), 2217に2227.
Pearson, K., 1901. LIII. On lines and planes of closest fit to systems of points in space. Philosophical
Magazine Series 6 2, 559に572.
Peters, A., Gutscher, H., Scholz, R.W., 2011a. Psychological determinants of fuel consumption of
purchased new cars. Transportation Research Part F: Traffic Psychology and Behaviour 14, 229に239.
Peters, A., Popp, M., Mareike, A., Raphael, R., B., 2011b. Electric mobility - a survey of different
consumer groups in Germany with regard to adoption. European Council for an Energy-Efficient
Economy.
Rezvani, Z., Jansson, J., Bodin, J. 2015. Advances in consumer electric vehicle adoption research: A
review and research agenda. Transportation Research Part D: Transport and Environment, 34, 122に
136.
Roehrich, G., 2004. Consumer innovativeness: Concepts and measurements. Journal of Business
Research 57, 671に677.
Rogers, E. M., Shoemaker, F. F., 1971. Communication of Innovations: A Cross-Cultural
Approach (2nd edition). Free Press.
Rogers, E.M., 2003. Diffusion of innovations. Free Press, New York.
34
Schuitema, G., Anable, J., Skippon, S., Kinnear, N., 2013. The role of instrumental, hedonic and
symbolic attributes in the intention to adopt electric vehicles. Transportation Research Part A: Policy
and Practice 48, 39に49.
Shepherd, S., Bonsall, P., Harrison, G., 2012. Factors affecting future demand for electric vehicles: A
model based study. Transport Policy, 20, 62に74.
Skippon, S., Garwood, M., 2011. Responses to battery electric vehicles: UK consumer attitudes and
attributions of symbolic meaning following direct experience to reduce psychological distance.
Transportation Research Part D: Transport and Environment, 16(7), 525に531.
SヮWヴノキミェが Dくが EェェWヴデが Aく ヲヰヱヴく C;ノキaラヴミキ;げゲ Iノキマ;デW ;ミS WミWヴェ┞ ヮラノキI┞ aラヴ デヴ;ミゲヮラヴデ;デキラミく EミWヴェ┞
Strategy Reviews, 5, 88に94.
Steinhilber, S., Wells, P., Thankappan, S., 2013. Socio-technical inertia: Understanding the barriers to
electric vehicles. Energy Policy, 60, 531に539.
Steg, L., Vlek, C., Slotegraaf, G., 2001. Instrumental-reasoned and symbolic-affective motives for
using a motor car. Transportation Research Part F: Traffic Psychology and Behaviour 4, 151に169.
Steg, L., 2005. Car use: lust and must. Instrumental, symbolic and affective motives for car use.
Transportation Research Part A: Policy and Practice 39, 147に162.
Schwanen, T., Banister, D., Anable, J., 2011. Scientific research about climate change mitigation in
transport: A critical review. Transportation Research Part A: Policy and Practice, 45(10), 993に1006.
Train, K., 1980. The potential market for non-gasoline-powered automobiles. Transportation
Research Part A: General 14, 405に414.
Tヴ;キミが Kくが ヲヰヰΓく DキゲIヴWデW CエラキIW MWデエラSゲ ┘キデエ Sキマ┌ノ;デキラミ ふヲ WSキデキラミぶく C;マHヴキSェW票き NW┘ Yラヴニぎ
Cambridge University Press.
van Acker, V., Van Wee, B. Witlox, F., 2010. When Transport Geography Meets Social Psychology:
Toward a Conceptual Model of Travel Behaviour. Transport Reviews, 30, 219に240.
35
van Bree, B., Verbong, G.P.J. Kramer, G.J., 2010. A multi-level perspective on the introduction of
hydrogen and battery-electric vehicles. Technological Forecasting and Social Change, 77(4), pp.529に
540.
van Rijnsoever, F.J., Donders, A.R.T., 2009. The effect of innovativeness on different levels of
technology adoption. Journal of the American Society for Information Science and Technology 60,
984に996.
van Vliet, O.P.R., Kruithof, T., Turkenburg, W.C., Faaij, A.P.C., 2010. Techno-economic comparison of
series hybrid, plug-in hybrid, fuel cell and regular cars. Journal of Power Sources 195, 6570に6585.
Wells, W. D., 1975. Psychographics: A Critical Review. Journal of Marketing Research, 12(2), 196に213.