Embed Size (px)
Citation preview
doi: 10.1111/j.1469-1809.2012.00730.x
Exploring Genomic Structure Differences and Similaritiesbetween the Greek and European HapMap Populations:Implications for Association Studies
Vasileios Stathias1, Georgios R. Sotiris1, Iordanis Karagiannidis1, Georgios Bourikas2,Georgios Martinis2, Dimitrios Papazoglou3, Anna Tavridou4, Nikolaos Papanas3, Efstratios Maltezos3,Marios Theodoridis5, Vassilios Vargemezis5, Vangelis G. Manolopoulos4, William C. Speed6,Judith R. Kidd6, Kenneth K. Kidd6, Petros Drineas7 and Peristera Paschou1∗
1Department of Molecular Biology and Genetics, Democritus University of Thrace, Alexandroupoli, Greece2Department of Hematology, University Hospital of Alexandroupoli, Faculty of Medicine, Democritus University of Thrace, Alexandroupoli,Greece3Second Department of Internal Medicine, University Hospital of Alexandroupoli, Faculty of Medicine, Democritus University of Thrace,Alexandroupoli, Greece4Laboratory of Pharmacology, Faculty of Medicine, Democritus University of Thrace, Alexandroupoli, Greece5Department of Nephrology, University Hospital of Alexandroupoli, Faculty of Medicine, Democritus University of Thrace, Alexandroupoli,Greece6Department of Genetics, School of Medicine, Yale University, New Haven CT, USA7Department of Computer Science, Rensselaer Polytechnic Institute, Troy, NY, USA.
Summary
Studies of the genomic structure of the Greek population and Southeastern Europe are limited, despite the centralposition of the area as a gateway for human migrations into Europe. HapMap has provided a unique tool for the analysisof human genetic variation. Europe is represented by the CEU (Northwestern Europe) and the TSI populations (TuscanItalians from Southern Europe), which serve as reference for the design of genetic association studies. Furthermore,genetic association findings are often transferred to unstudied populations. Although initial studies support the fact thatthe CEU can, in general, be used as reference for the selection of tagging SNPs in European populations, this has not beenextensively studied across Europe. We set out to explore the genomic structure of the Greek population (56 individuals)and compare it to the HapMap TSI and CEU populations. We studied 1112 SNPs (27 regions, 13 chromosomes).Although the HapMap European populations are, in general, a good reference for the Greek population, regions ofpopulation differentiation do exist and results should not be light-heartedly generalized. We conclude that, perhaps dueto the individual evolutionary history of each genomic region, geographic proximity is not always a perfect guide forselecting a reference population for an unstudied population.
Keywords: Population structure, Southern Europe, Greek population, PCA
Introduction
The genomic structure of the Greek population has not beenstudied to date, despite its central position in influencing ge-
∗Corresponding author: Dr. Peristera Paschou, Departmentof Molecular Biology and Genetics, Democritus Universityof Thrace, Panepistimioupoli, Dragana, Alexandroupoli 68100,Greece. Tel: +30 25510 30658; Fax: +30 25510 30613; E-mail:[email protected]
nomic variation throughout Europe. Greece has served as agateway to migrations from Anatolia, as well as a key refugeof Northern European populations retreating to the Southduring the last glacial maximum (Semino et al., 2000; DiGiacomo et al., 2003; Semino et al., 2004; Novelletto, 2007).It is in Greece that the earliest signs of Neolithic farmers inEurope are found, about 7000 cal BC, with the foundingof a fully fledged farming community at Knossos on the Is-land of Crete, followed slightly later in the Northwestern
472 Annals of Human Genetics (2012) 76,472–483 C© 2012 The AuthorsAnnals of Human Genetics C© 2012 Blackwell Publishing Ltd/University College London
Genomic Structure of the Greek Population
Peloponnese of mainland Greece (Efstratiou, 2005; Perles,2005). These populations were undoubtedly crucial to ex-panding farming to the rest of Europe (Di Giacomo et al.,2004; King et al., 2008). Furthermore, during the period ofthe Magna Graecia, the sea served rather as a bridge amongpopulations than as a barrier, with Greek traders formingsettlements throughout the coasts of Italy, France, and Spain(King et al., 2011).
The patterns of genetic variation across different popu-lations, shaped by history, environment, and stochastic pro-cesses, have long been studied in order to infer populationrelationships and uncover the origins of the human species(Cavalli-Sforza et al., 1994; Tishkoff & Kidd, 2004). Earlyin the 21st century, the premise of genome-wide associa-tion studies (GWAS) was built upon the notion that commonvariation in the human genome could be tagged and inter-rogated by a small number of carefully selected single nu-cleotide polymorphisms (SNPs; the so-called tagging SNPsor tSNPs for short) (Daly et al., 2001; Johnson et al., 2001).This same notion motivated the HapMap project, aiming tocharacterize the linkage disequilibrium (LD) structure of thehuman genome (International HapMap Consortium, 2003,2005; 2007). The HapMap project has become an incrediblyvaluable resource for investigators around the world, guidingtheir studies of the genetic background of human disease.
At the same time, the study of genetic structure withinEurope has proven to be a lot more complex than un-til recently appreciated, and this could also be reflectedupon the use of HapMap reference samples for the study ofEuropean populations. Two major axes of variation are ob-served within Europe, namely from North to South and fromEast to West (Lao et al., 2008; Novembre et al., 2008; Paschouet al., 2008; Drineas et al., 2010). The HapMap phase 1project only included one European population, the CEPHEuropeans (actually collected in Utah, USA) and shown tohave northwestern European ancestry (International HapMapConsortium, 2003). Since the North-to-South cline of vari-ation was discovered, a second population (Italians from theregion of Tuscany) was selected, presumably as representa-tives of Southern European descent. It is worth mentioningthat the Tuscan population, particularly during the BronzeAge and the Apennine Culture, had extensive trading rela-tionships with the Minoan and Myceanean civilizations ofGreece (Barker & Rasmussen, 2000).
A topic of considerable debate since the start of theHapMap project has been the degree to which the HapMappopulations can actually be considered representative of un-studied populations. A large number of studies have alreadyinvestigated this issue, although a large portion of the worldstill remains unstudied (Conrad et al., 2006; Gonzalez-Neiraet al., 2006; De Bakker et al., 2006; Gu et al., 2007, 2008;Paschou et al., 2007a; Hu et al., 2008; Javed et al., 2011).
Most studies support the finding that the HapMap popula-tions can indeed serve as reference for unstudied populations,assuming that a closely related or geographically neighboringpopulation is used. Within Europe, most studies comparingthe genetic structure of HapMap European populations havebeen performed for Northern European populations (Muelleret al., 2005; Montpetit et al., 2006; Willer et al., 2006;Lundmark et al., 2008; Pardo et al., 2009). Only a hand-ful of studies focused on Southern Europe [namely Spain(Laayouni et al., 2010; Rodrıguez-Ezpeleta et al., 2010)], apopulation isolate from Croatia (Navarro et al., 2010), andthe Italian population (Mueller et al., 2005). In general, ithas been shown that the HapMap CEU still capture the mostsignificant portion of variation of other studied populations.However, a couple of studies (Mueller et al., 2005; Pardoet al., 2009) point out the fact that such results are highly de-pendent on the studied region and are not uniform through-out the genome.
Here, we present for the first time an extensive study ofthe genetic structure of the Greek population, in comparisonto the HapMap reference European populations of NorthernEurope (CEPH Europeans– CEU) and Italy (Tuscan Italians–TSI). We study a total of 1112 SNPs spread across 27 regionsof the genome. We show that the HapMap reference popu-lations should be expected to serve as a good reference of ge-netic structure in the Greek population if detailed analysis perregion is not required. Regions of population differentiationdo exist and results cannot be easily generalized for the entiregenome. Furthermore, our results indicate that, perhaps dueto complex population relationships and environmental pres-sures, geographic proximity is not always a perfect guide forselecting a reference population for an unstudied population.
Methods
Samples and Genotypes
We studied samples from 56 unrelated Greeks collected inAlexandroupoli, a city that lies in the northeastern cor-ner of Greece. Participating volunteers were students of theDemocritus University of Thrace (originating from many dif-ferent regions of Greece), or healthy blood donors from thelocal University Hospital. Informed consent was taken fromevery participating individual. Self-reported ancestry was con-sidered Greek if the individual reported all four grandparentsto be of Greek ancestry and to have been born in Greece.DNA was extracted from whole blood using the QiagenPuregene kit (Qiagen, Valencia, CA, USA).
Genotyping for 1813 SNPs across 27 different chromo-somal regions was performed using an Illumina genotyp-ing custom chip (Illumina, San Diego, CA, USA). The 27regions across 13 chromosomes represent genomic regions
Annals of Human Genetics (2012) 76,472–483 473C© 2012 The AuthorsAnnals of Human Genetics C© 2012 Blackwell Publishing Ltd/University College London
V. Stathias et al.
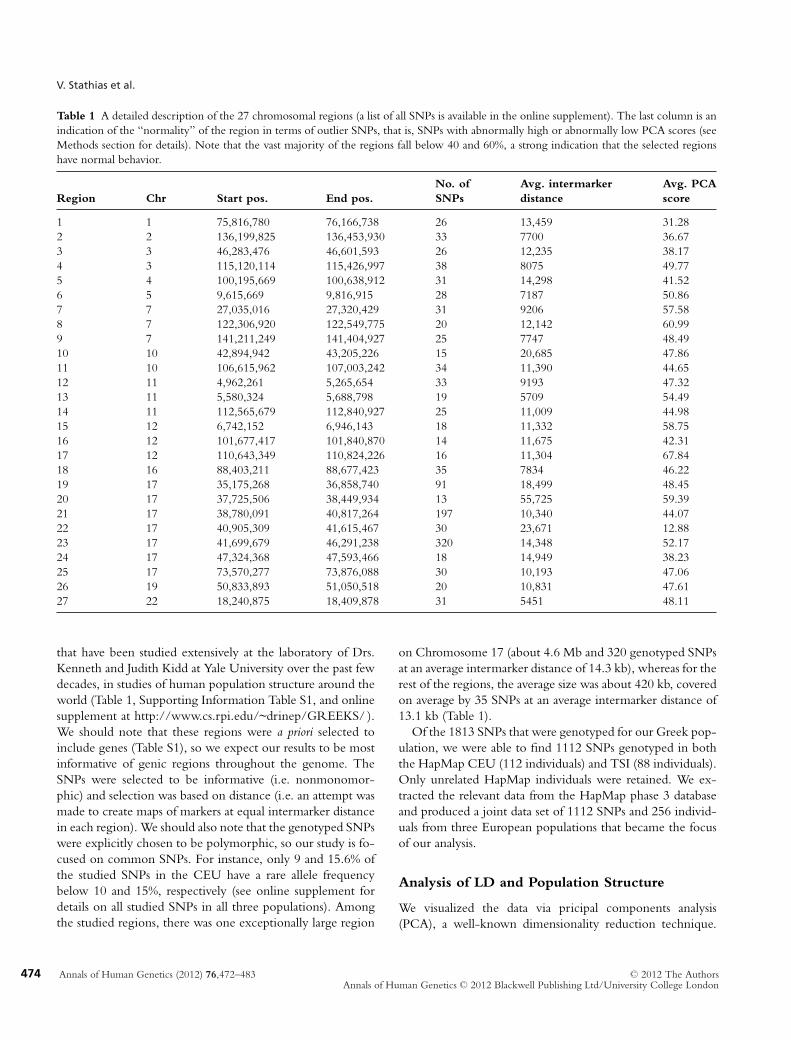
Table 1 A detailed description of the 27 chromosomal regions (a list of all SNPs is available in the online supplement). The last column is anindication of the “normality” of the region in terms of outlier SNPs, that is, SNPs with abnormally high or abnormally low PCA scores (seeMethods section for details). Note that the vast majority of the regions fall below 40 and 60%, a strong indication that the selected regionshave normal behavior.
No. of Avg. intermarker Avg. PCARegion Chr Start pos. End pos. SNPs distance score
1 1 75,816,780 76,166,738 26 13,459 31.282 2 136,199,825 136,453,930 33 7700 36.673 3 46,283,476 46,601,593 26 12,235 38.174 3 115,120,114 115,426,997 38 8075 49.775 4 100,195,669 100,638,912 31 14,298 41.526 5 9,615,669 9,816,915 28 7187 50.867 7 27,035,016 27,320,429 31 9206 57.588 7 122,306,920 122,549,775 20 12,142 60.999 7 141,211,249 141,404,927 25 7747 48.4910 10 42,894,942 43,205,226 15 20,685 47.8611 10 106,615,962 107,003,242 34 11,390 44.6512 11 4,962,261 5,265,654 33 9193 47.3213 11 5,580,324 5,688,798 19 5709 54.4914 11 112,565,679 112,840,927 25 11,009 44.9815 12 6,742,152 6,946,143 18 11,332 58.7516 12 101,677,417 101,840,870 14 11,675 42.3117 12 110,643,349 110,824,226 16 11,304 67.8418 16 88,403,211 88,677,423 35 7834 46.2219 17 35,175,268 36,858,740 91 18,499 48.4520 17 37,725,506 38,449,934 13 55,725 59.3921 17 38,780,091 40,817,264 197 10,340 44.0722 17 40,905,309 41,615,467 30 23,671 12.8823 17 41,699,679 46,291,238 320 14,348 52.1724 17 47,324,368 47,593,466 18 14,949 38.2325 17 73,570,277 73,876,088 30 10,193 47.0626 19 50,833,893 51,050,518 20 10,831 47.6127 22 18,240,875 18,409,878 31 5451 48.11
that have been studied extensively at the laboratory of Drs.Kenneth and Judith Kidd at Yale University over the past fewdecades, in studies of human population structure around theworld (Table 1, Supporting Information Table S1, and onlinesupplement at http://www.cs.rpi.edu/~drinep/GREEKS/ ).We should note that these regions were a priori selected toinclude genes (Table S1), so we expect our results to be mostinformative of genic regions throughout the genome. TheSNPs were selected to be informative (i.e. nonmonomor-phic) and selection was based on distance (i.e. an attempt wasmade to create maps of markers at equal intermarker distancein each region). We should also note that the genotyped SNPswere explicitly chosen to be polymorphic, so our study is fo-cused on common SNPs. For instance, only 9 and 15.6% ofthe studied SNPs in the CEU have a rare allele frequencybelow 10 and 15%, respectively (see online supplement fordetails on all studied SNPs in all three populations). Amongthe studied regions, there was one exceptionally large region
on Chromosome 17 (about 4.6 Mb and 320 genotyped SNPsat an average intermarker distance of 14.3 kb), whereas for therest of the regions, the average size was about 420 kb, coveredon average by 35 SNPs at an average intermarker distance of13.1 kb (Table 1).
Of the 1813 SNPs that were genotyped for our Greek pop-ulation, we were able to find 1112 SNPs genotyped in boththe HapMap CEU (112 individuals) and TSI (88 individuals).Only unrelated HapMap individuals were retained. We ex-tracted the relevant data from the HapMap phase 3 databaseand produced a joint data set of 1112 SNPs and 256 individ-uals from three European populations that became the focusof our analysis.
Analysis of LD and Population Structure
We visualized the data via pricipal components analysis(PCA), a well-known dimensionality reduction technique.
474 Annals of Human Genetics (2012) 76,472–483 C© 2012 The AuthorsAnnals of Human Genetics C© 2012 Blackwell Publishing Ltd/University College London
Genomic Structure of the Greek Population
In prior work (Paschou et al. 2007b; Paschou et al. 2008), wehave extensively described how to encode and mean-centergenotypic data in order to apply PCA. In our setting, PCArepresents all samples with respect to the top two princi-pal components (eigenSNPs). Our choice of two eigenSNPsstems from extensive prior work on the analysis of Europeangenotypic data (Paschou et al., 2008; Drineas et al., 2010).
In order to characterize the profile of the studied regionsin terms of population differentiation, we used data fromthe POPRES (population reference) sample (Nelson et al.,2008). The subset of the POPRES data set that we ana-lyzed comprises 1200 individuals from 11 European popula-tions and has been described in detail previously (Novembreet al., 2008). For each SNP, we computed its correlationwith the top two principal components of the data set (PCA-scores), which have been shown to capture the most signifi-cant axes of genetic variation within Europe (Lao et al., 2008;Novembre et al., 2008). PCA-scores were computed as wehave previously described (Paschou et al., 2007b; Paschouet al., 2008), and they were compared to the distribution ofPCA-scores for all available SNPs in the POPRES data set(447,212 SNPs).
Pairwise linkage disequilibrium tests, as well as taggingSNP (tSNP) selection and haplotype block definition, wereperformed using the algorithms implemented in Haploview(Barrett et al., 2005). For tSNP selection, the Tagger algo-rithm (as integrated in Haploview) was used without themultimarker testing option. The Gabriel et al. (2002) defi-nition was applied here in order to define “haplotype blocks”across the studied regions. Haplot was used in order to vi-sualize block boundaries across the three studied populations(Gu et al., 2005). We also measured the percentage of “blockoverlap” (see Supplementary Methods for details) betweenpairs of populations, in order to evaluate the similarity ofhaplotypic blocks between the Greek samples and the TSIsamples (and vice versa), as well as the Greek samples and theCEU samples (and vice versa).
Results
Allele Frequencies and PopulationDifferentiation over Studied Regions
A total of 1112 SNPs from 27 chromosomal regions wereincluded in our analysis. The PCA of analyzed genotypesfor the three populations is shown in Figure S1. In order tocharacterize the profile of allele frequencies over the studiedregions in comparison to the entire genome, we used thePOPRES genome-wide data set of Europeans and comparedthe PCA-scores of SNPs across the studied regions to that ofthe remaining genome (Table 1). In order to compute the
PCA-scores, we effectively calculated the correlation of eachSNP with the top two principal components of the data set;these components have been previously shown to correlatewith ancestry across Europe (Lao et al., 2008; Novembreet al., 2008; Drineas et al., 2010). For each region we studiedhere, we estimated the average PCA-score of all available SNPswithin the region. Table 1 shows the percentage of SNPs inthe genome with a higher PCA-score than the average PCA-score in a particular region. As we have analyzed in detailin earlier work, a high PCA-score is expected for SNPs thatshow high association with population ancestry.
Our results show that most regions that are included in ouranalysis are “average” in terms of allele frequencies and corre-lation to ancestry. Thus, our findings here can be considered,at least to some extent, representative for most regions of thegenome as well, when it comes to the level of populationdifferentiation. However, we would like to briefly commenton the top five population-differentiating regions includedin our analysis (less than 40% of genome-wide SNPs show ahigher PCA-score than the average PCA-score of the respec-tive region). The first is the region of 17q21 in Chromosome17, encompassing the MAPT gene and the recently identifiedinversion haplotype H2 (Stefansson et al., 2005). As we haverecently shown, this 17q21 inversion, often thought to befound at levels of ∼20% throughout Europe, actually showsa great range of frequencies within Europe (ranging from 5%up to 37.5%) (Donnelly et al., 2010). The inverted H2 hap-lotype is actually most frequent around the Mediterraneanand decreases outward in all directions. The second regionspans the SLC44A5 and ACADM genes and has also beenpreviously shown to account for high population differentia-tion as a possible candidate region for recent positive selection(Voight et al., 2006; Zhong et al., 2010). The third regionspans the LCT gene, well known for its involvement in pop-ulation differentiation across Europe (Bersaglieri et al., 2004;Campbell et al., 2005). The fourth region encompasses theCCR5 and neighboring genes. CCR5 is the coreceptor thatHIV most commonly uses to enter target cells, and, in fact,specific variants of this gene have been associated with pro-tection from HIV infection (de Silva & Stumpf, 2004). Thisregion is well known to show population differentiation andhas also been implicated as a candidate locus for natural selec-tion (Novembre et al., 2005; Sabeti et al., 2005; Edo-Mataset al., 2011). Finally, the fifth region with average PCA-scoresabove the 40th percentile includes the CA10 gene. Variationacross this particular gene has not been previously suggested aspopulation differentiating, even though it lies approximately6 Mb away from the aforementioned MAPT region.
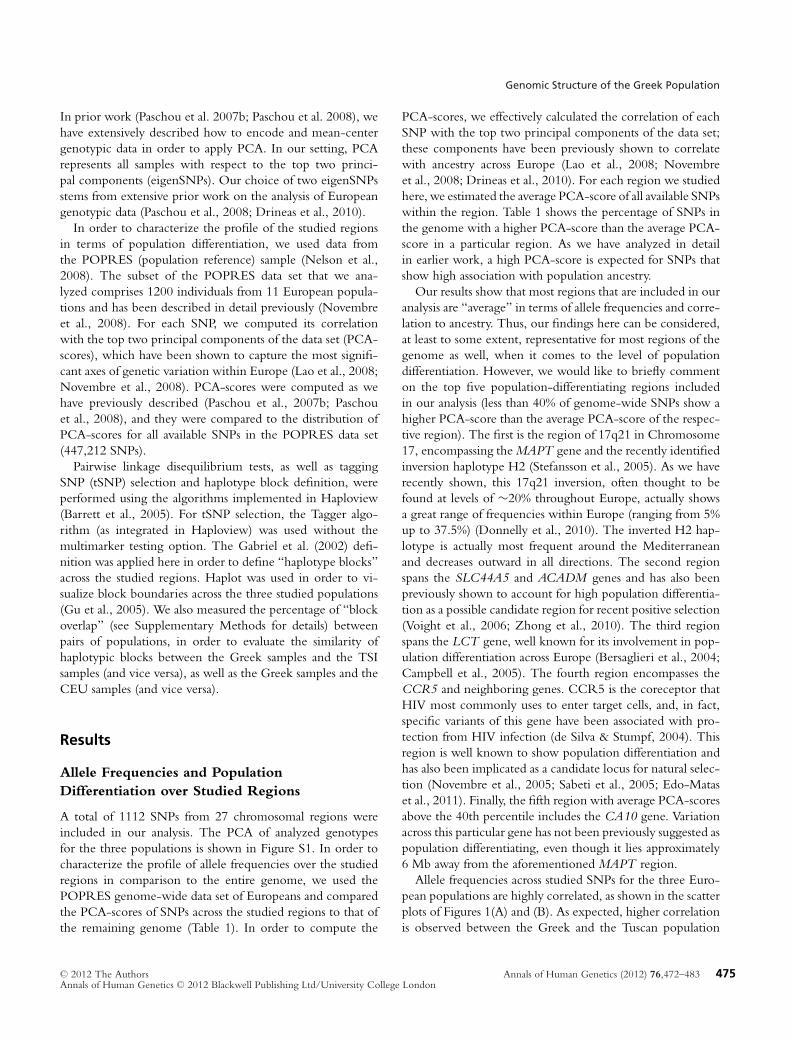
Allele frequencies across studied SNPs for the three Euro-pean populations are highly correlated, as shown in the scatterplots of Figures 1(A) and (B). As expected, higher correlationis observed between the Greek and the Tuscan population
Annals of Human Genetics (2012) 76,472–483 475C© 2012 The AuthorsAnnals of Human Genetics C© 2012 Blackwell Publishing Ltd/University College London
V. Stathias et al.
Figure 1 (A) Scatter plot of rare allele frequencies for all available SNPs between the GRE and the CEU populations. Forty-sixoutlier SNPs are observed (see also Table S2A). (B) Scatter plot of rare allele frequencies for all available SNPs between the GRE andthe TSI populations. Seven outlier SNPs are observed (see also Table S2C). (C) Scatter plot of r2 values between all pairs of SNPs(within 50 kb windows) in the GRE and the CEU populations. Clearly, SNP pairs that are in high LD in the CEU are also in highLD in the GRE, with 104 outlier pairs, as discussed in the Results section (a list of all 104 outlier pairs of SNPs is available in theonline supplement). (D) Scatter plot of r2 values between all pairs of SNPs (within 50 kb windows) in the GRE and the TSIpopulations. Clearly, SNP pairs that are in high LD in the TSI are also in high LD in the GRE, with 83 outlier pairs, as discussed inthe Results section (a list of all 83 outlier pairs of SNPs is available in the online supplement).
with a Pearson correlation coefficient r = 0.9643. The re-spective value for the correlation between the Greek and theCEU population is r = 0.9387. In order to identify the mostpopulation differentiating SNPs in our data set, we calculatedthe Informativeness (In) of each studied SNP, as defined byRosenberg et al. (2003) (Fig. S2). Outliers were defined asSNPs whose In value exceeds the mean plus three standarddeviations. Two SNPs were thus identified as outliers betweenthe Greeks and the Tuscans (residing in the CD4 and ADH4regions, respectively) and 23 SNPs were identified as outliersbetween the Greeks and the CEPH Europeans. Of the lat-ter 23 SNPs, the top one resides in the CD4 region and theremaining 22 are found across the LCT region.
LD Structure in Greeks Compared tothe HapMap 3 European Populations
We measured the extent of LD between all SNP pairs at a dis-tance of 50 kb maximum in the Greek population and com-
pared it to the respective estimates in the CEU and TSI popu-lations. As shown in the scatter plots of Figures 1(C) and (D),most SNP pairs show a high degree of correlation betweenGreeks and HapMap European populations, with the averagecorrelation coefficient being 0.9622 for comparisons betweenGreeks and TSI and 0.9614 for comparisons between Greeksand CEU. However, even though the average is high, isolatedregions of lower correlation should not be overlooked. AnSNP pair was defined to be an outlier if its residual fit to thediagonal (perfect correlation) exceeded the average residualplus three standard deviations. A total of 83 such discordantpairs were found in the Greeks to TSI comparison, whereas104 such pairs were found in the Greeks to CEU compari-son (see Supporting Information and online supplement athttp://www.cs.rpi.edu/∼drinep/GREEKS/ for considera-tions on the characteristics of the outlier pairs as well as alist of those pairs).
In order to further study the LD structure of the regions inthe three European populations, we defined haplotype blocksin each of the studied regions using the criteria proposed by
476 Annals of Human Genetics (2012) 76,472–483 C© 2012 The AuthorsAnnals of Human Genetics C© 2012 Blackwell Publishing Ltd/University College London
Genomic Structure of the Greek Population
Gabriel et al. (2002) as implemented in Haploview. Resultsof this analysis are shown in Figure S3. A total of 143 blocksover the studied regions were found in the Greek population,whereas 169 and 176 blocks were found in the TSI and CEUpopulations, respectively. The average block size was 34.2 kbin Greeks, 31 kb in the TSI, and 34.2 kb in the CEU.
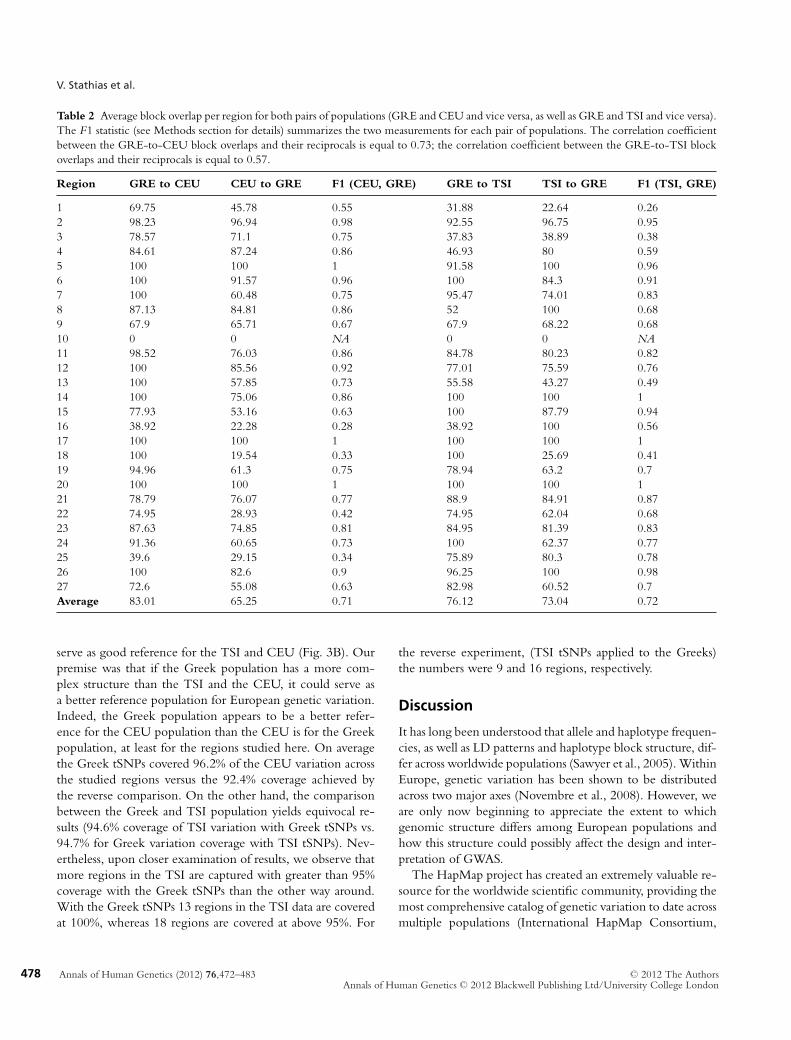
In an effort to quantify the degree of similarity between thehaplotype blocks and LD structure in the Greek populationcompared to the HapMap European populations, we esti-mated the overlap of blocks defined in the Greek populationand those defined in each of the TSI and CEU populations.The (average) block overlap values from the GRE samplesto the CEU samples (and vice versa) and the (average) blockoverlap values from the GRE samples to the TSI samples (andvice versa) are shown in Table 2 for each of the 27 studiedregions. The overall average overlap values are very similar:block overlap from GRE to CEU is (on average) 83%; blockoverlap from CEU to GRE is (on average) 65%; block overlapfrom GRE to TSI is (on average) 76%; and, block overlap fromTSI to GRE is (on average) 73%. The average F1 statisticsfor the two pairs of populations are essentially the same: 71%for the GRE and CEU pair, and 72% for the GRE and TSIpair.
Selecting tSNPs in the Greek versusthe HapMap European Populations
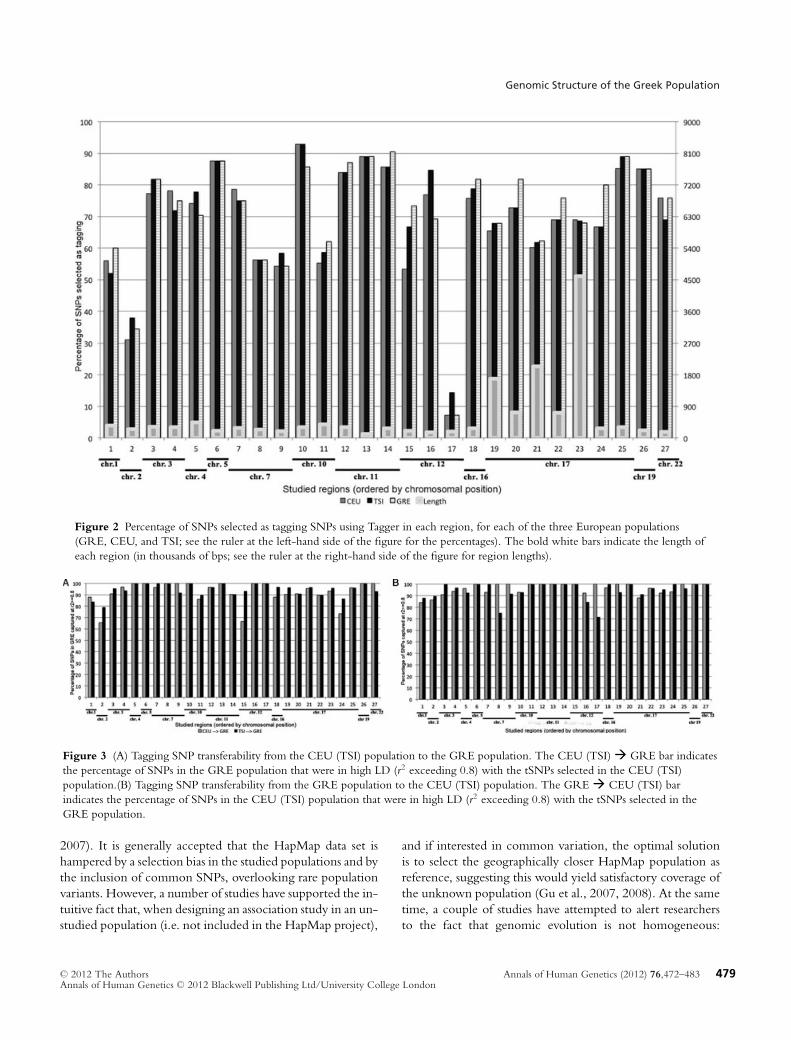
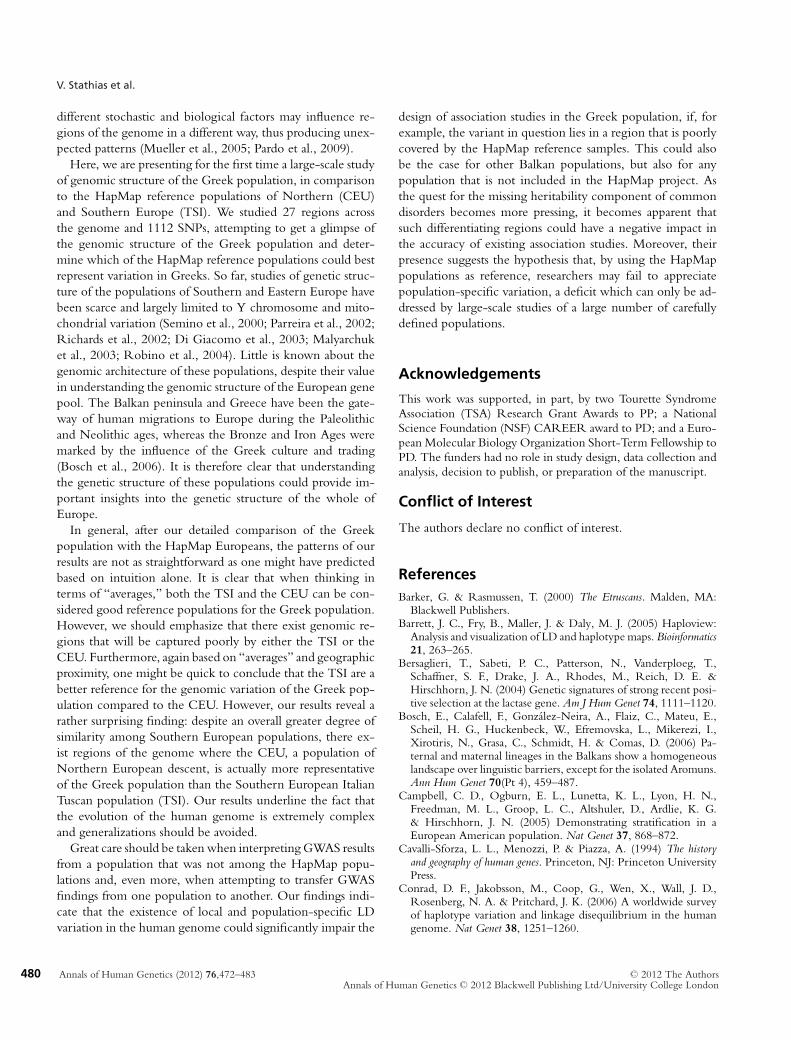
Next, we investigated the degree to which the HapMap Eu-ropean populations could serve as good reference samples forthe selection of tSNPs in the Greek population. In order todo so, we selected tSNPs in each of the HapMap Europeanreference samples (CEU and TSI) and proceeded to test thecoverage and efficiency achieved by the selected tSNPs in theGreek population in all studied regions. Results were com-pared to coverage and efficiency of tSNPs selected from theGreek sample and are shown in Figures 2 and 3. Coverage isdefined as the percentage of “untyped” SNPs in the studiedregion with r2 > 0.8 with a tSNP in the Greek population.
Overall, both the TSI and CEU, when used as referencefor tSNP selection, achieve very good coverage of variationin the Greek population (Fig. 3). The TSI tSNPs capture,on average, 94.7% of “untyped” SNPs in Greeks, whereasthe CEU capture a somewhat smaller percentage at 92.4%.For about half (13) of the studied regions, both TSI andCEU achieve exactly the same coverage, with exactly thesame efficiency (number of selected tSNPs) in nine of these13 regions. Interestingly, for eight of the regions we studied(regions 1, 2, 4, 6, 8, 9, 18, and 22) both the TSI and CEUachieve perfect (100%) coverage of variation in the Greekpopulation. For three of these regions (2, 4, and 22), theCEU are actually more efficient as reference for Greeks, with
fewer tSNPs needed; for the remaining regions, the samenumber of tSNPs is selected in both populations.
The TSI outperform the CEU as reference for the Greekpopulation in 10 regions. However, there are four regionswhere the CEU are actually better reference samples thanthe TSI, contrary to what one might expect based on ge-ographic proximity of the populations. Among them, themost notable are a region of chromosome 7 (100% coverageusing the CEU as reference vs. 91.7% using the TSI as ref-erence) and the chromosomal region around COMT (100%coverage using the CEU as reference vs. 93% coverage us-ing the TSI as reference). The Chromosome 7 region spansthe TAS2R38 gene (responsible for the PTC taster/nontasterphenotype), as well as the CLEC5A gene. The latter gene hasbeen found to have a role in immune response and interactwith dengue virus. Finally, the SLC44A5 regions (discussed inprevious sections as one of the most population-differentiatingregions in our study) were also captured more accurately inGreeks when the CEU were used as the reference populationas opposed to the TSI.
Of the 27 studied regions, five regions resulted in cov-erage less than 90% when the TSI were used as reference.Of these five regions, one is captured at a percentage of lessthan 80% (79.3% coverage). This region is the LCT region,which is well known to be correlated with population dif-ferentiation between Southern and Northern European pop-ulations. It is not surprising that this same region results inthe lower coverage when the CEU population is used as ref-erence for the Greek population (a coverage of only 65% isachieved). Using the CEU population as reference for theGreek population results in two more regions with coveragebelow 80%; interestingly, these two regions were the mostpopulation-differentiating regions in our sample, accordingto the PCA-scores-based analysis that we described earlier.More specifically, these regions are: (i) a Chromosome 12 re-gion spanning a large number of genes including CD4 (66.6%coverage), and (ii) the Chromosome 17 CA10 region (73.3%coverage). A total of seven of the 27 studied regions cannotbe covered at a percentage higher than 90% when the CEUpopulation is used as the reference population (Fig. 3).
Overall, for regions that show less than 95% coverage inGreeks with TSI or CEU tSNPs, LD patterns are typicallymore complicated in the Greek population. Indeed, moretSNPs would have been selected if the Greek population wasused as reference for itself (64.7% of the available SNPs wereselected, on average, as tSNPs in such regions in the TSI,whereas 71.4% of the available SNPs were selected, on aver-age, as tSNPs in the Greeks for the same regions; the respectivenumbers for such regions in the CEU and Greeks comparisonwere 64.4 and 69.4%).
Finally, we also performed the opposite experiment. Weselected tSNPs in Greeks and attempted to see if they could
Annals of Human Genetics (2012) 76,472–483 477C© 2012 The AuthorsAnnals of Human Genetics C© 2012 Blackwell Publishing Ltd/University College London
V. Stathias et al.
Table 2 Average block overlap per region for both pairs of populations (GRE and CEU and vice versa, as well as GRE and TSI and vice versa).The F1 statistic (see Methods section for details) summarizes the two measurements for each pair of populations. The correlation coefficientbetween the GRE-to-CEU block overlaps and their reciprocals is equal to 0.73; the correlation coefficient between the GRE-to-TSI blockoverlaps and their reciprocals is equal to 0.57.
Region GRE to CEU CEU to GRE F1 (CEU, GRE) GRE to TSI TSI to GRE F1 (TSI, GRE)
1 69.75 45.78 0.55 31.88 22.64 0.262 98.23 96.94 0.98 92.55 96.75 0.953 78.57 71.1 0.75 37.83 38.89 0.384 84.61 87.24 0.86 46.93 80 0.595 100 100 1 91.58 100 0.966 100 91.57 0.96 100 84.3 0.917 100 60.48 0.75 95.47 74.01 0.838 87.13 84.81 0.86 52 100 0.689 67.9 65.71 0.67 67.9 68.22 0.6810 0 0 NA 0 0 NA11 98.52 76.03 0.86 84.78 80.23 0.8212 100 85.56 0.92 77.01 75.59 0.7613 100 57.85 0.73 55.58 43.27 0.4914 100 75.06 0.86 100 100 115 77.93 53.16 0.63 100 87.79 0.9416 38.92 22.28 0.28 38.92 100 0.5617 100 100 1 100 100 118 100 19.54 0.33 100 25.69 0.4119 94.96 61.3 0.75 78.94 63.2 0.720 100 100 1 100 100 121 78.79 76.07 0.77 88.9 84.91 0.8722 74.95 28.93 0.42 74.95 62.04 0.6823 87.63 74.85 0.81 84.95 81.39 0.8324 91.36 60.65 0.73 100 62.37 0.7725 39.6 29.15 0.34 75.89 80.3 0.7826 100 82.6 0.9 96.25 100 0.9827 72.6 55.08 0.63 82.98 60.52 0.7Average 83.01 65.25 0.71 76.12 73.04 0.72
serve as good reference for the TSI and CEU (Fig. 3B). Ourpremise was that if the Greek population has a more com-plex structure than the TSI and the CEU, it could serve asa better reference population for European genetic variation.Indeed, the Greek population appears to be a better refer-ence for the CEU population than the CEU is for the Greekpopulation, at least for the regions studied here. On averagethe Greek tSNPs covered 96.2% of the CEU variation acrossthe studied regions versus the 92.4% coverage achieved bythe reverse comparison. On the other hand, the comparisonbetween the Greek and TSI population yields equivocal re-sults (94.6% coverage of TSI variation with Greek tSNPs vs.94.7% for Greek variation coverage with TSI tSNPs). Nev-ertheless, upon closer examination of results, we observe thatmore regions in the TSI are captured with greater than 95%coverage with the Greek tSNPs than the other way around.With the Greek tSNPs 13 regions in the TSI data are coveredat 100%, whereas 18 regions are covered at above 95%. For
the reverse experiment, (TSI tSNPs applied to the Greeks)the numbers were 9 and 16 regions, respectively.
Discussion
It has long been understood that allele and haplotype frequen-cies, as well as LD patterns and haplotype block structure, dif-fer across worldwide populations (Sawyer et al., 2005). WithinEurope, genetic variation has been shown to be distributedacross two major axes (Novembre et al., 2008). However, weare only now beginning to appreciate the extent to whichgenomic structure differs among European populations andhow this structure could possibly affect the design and inter-pretation of GWAS.
The HapMap project has created an extremely valuable re-source for the worldwide scientific community, providing themost comprehensive catalog of genetic variation to date acrossmultiple populations (International HapMap Consortium,
478 Annals of Human Genetics (2012) 76,472–483 C© 2012 The AuthorsAnnals of Human Genetics C© 2012 Blackwell Publishing Ltd/University College London
Genomic Structure of the Greek Population
Figure 2 Percentage of SNPs selected as tagging SNPs using Tagger in each region, for each of the three European populations(GRE, CEU, and TSI; see the ruler at the left-hand side of the figure for the percentages). The bold white bars indicate the length ofeach region (in thousands of bps; see the ruler at the right-hand side of the figure for region lengths).
Figure 3 (A) Tagging SNP transferability from the CEU (TSI) population to the GRE population. The CEU (TSI)� GRE bar indicatesthe percentage of SNPs in the GRE population that were in high LD (r2 exceeding 0.8) with the tSNPs selected in the CEU (TSI)population.(B) Tagging SNP transferability from the GRE population to the CEU (TSI) population. The GRE� CEU (TSI) barindicates the percentage of SNPs in the CEU (TSI) population that were in high LD (r2 exceeding 0.8) with the tSNPs selected in theGRE population.
2007). It is generally accepted that the HapMap data set ishampered by a selection bias in the studied populations and bythe inclusion of common SNPs, overlooking rare populationvariants. However, a number of studies have supported the in-tuitive fact that, when designing an association study in an un-studied population (i.e. not included in the HapMap project),
and if interested in common variation, the optimal solutionis to select the geographically closer HapMap population asreference, suggesting this would yield satisfactory coverage ofthe unknown population (Gu et al., 2007, 2008). At the sametime, a couple of studies have attempted to alert researchersto the fact that genomic evolution is not homogeneous:
Annals of Human Genetics (2012) 76,472–483 479C© 2012 The AuthorsAnnals of Human Genetics C© 2012 Blackwell Publishing Ltd/University College London
V. Stathias et al.
different stochastic and biological factors may influence re-gions of the genome in a different way, thus producing unex-pected patterns (Mueller et al., 2005; Pardo et al., 2009).
Here, we are presenting for the first time a large-scale studyof genomic structure of the Greek population, in comparisonto the HapMap reference populations of Northern (CEU)and Southern Europe (TSI). We studied 27 regions acrossthe genome and 1112 SNPs, attempting to get a glimpse ofthe genomic structure of the Greek population and deter-mine which of the HapMap reference populations could bestrepresent variation in Greeks. So far, studies of genetic struc-ture of the populations of Southern and Eastern Europe havebeen scarce and largely limited to Y chromosome and mito-chondrial variation (Semino et al., 2000; Parreira et al., 2002;Richards et al., 2002; Di Giacomo et al., 2003; Malyarchuket al., 2003; Robino et al., 2004). Little is known about thegenomic architecture of these populations, despite their valuein understanding the genomic structure of the European genepool. The Balkan peninsula and Greece have been the gate-way of human migrations to Europe during the Paleolithicand Neolithic ages, whereas the Bronze and Iron Ages weremarked by the influence of the Greek culture and trading(Bosch et al., 2006). It is therefore clear that understandingthe genetic structure of these populations could provide im-portant insights into the genetic structure of the whole ofEurope.
In general, after our detailed comparison of the Greekpopulation with the HapMap Europeans, the patterns of ourresults are not as straightforward as one might have predictedbased on intuition alone. It is clear that when thinking interms of “averages,” both the TSI and the CEU can be con-sidered good reference populations for the Greek population.However, we should emphasize that there exist genomic re-gions that will be captured poorly by either the TSI or theCEU. Furthermore, again based on “averages” and geographicproximity, one might be quick to conclude that the TSI are abetter reference for the genomic variation of the Greek pop-ulation compared to the CEU. However, our results reveal arather surprising finding: despite an overall greater degree ofsimilarity among Southern European populations, there ex-ist regions of the genome where the CEU, a population ofNorthern European descent, is actually more representativeof the Greek population than the Southern European ItalianTuscan population (TSI). Our results underline the fact thatthe evolution of the human genome is extremely complexand generalizations should be avoided.
Great care should be taken when interpreting GWAS resultsfrom a population that was not among the HapMap popu-lations and, even more, when attempting to transfer GWASfindings from one population to another. Our findings indi-cate that the existence of local and population-specific LDvariation in the human genome could significantly impair the
design of association studies in the Greek population, if, forexample, the variant in question lies in a region that is poorlycovered by the HapMap reference samples. This could alsobe the case for other Balkan populations, but also for anypopulation that is not included in the HapMap project. Asthe quest for the missing heritability component of commondisorders becomes more pressing, it becomes apparent thatsuch differentiating regions could have a negative impact inthe accuracy of existing association studies. Moreover, theirpresence suggests the hypothesis that, by using the HapMappopulations as reference, researchers may fail to appreciatepopulation-specific variation, a deficit which can only be ad-dressed by large-scale studies of a large number of carefullydefined populations.
Acknowledgements
This work was supported, in part, by two Tourette SyndromeAssociation (TSA) Research Grant Awards to PP; a NationalScience Foundation (NSF) CAREER award to PD; and a Euro-pean Molecular Biology Organization Short-Term Fellowship toPD. The funders had no role in study design, data collection andanalysis, decision to publish, or preparation of the manuscript.
Conflict of Interest
The authors declare no conflict of interest.
ReferencesBarker, G. & Rasmussen, T. (2000) The Etruscans. Malden, MA:
Blackwell Publishers.Barrett, J. C., Fry, B., Maller, J. & Daly, M. J. (2005) Haploview:
Analysis and visualization of LD and haplotype maps. Bioinformatics21, 263–265.
Bersaglieri, T., Sabeti, P. C., Patterson, N., Vanderploeg, T.,Schaffner, S. F., Drake, J. A., Rhodes, M., Reich, D. E. &Hirschhorn, J. N. (2004) Genetic signatures of strong recent posi-tive selection at the lactase gene. Am J Hum Genet 74, 1111–1120.
Bosch, E., Calafell, F., Gonzalez-Neira, A., Flaiz, C., Mateu, E.,Scheil, H. G., Huckenbeck, W., Efremovska, L., Mikerezi, I.,Xirotiris, N., Grasa, C., Schmidt, H. & Comas, D. (2006) Pa-ternal and maternal lineages in the Balkans show a homogeneouslandscape over linguistic barriers, except for the isolated Aromuns.Ann Hum Genet 70(Pt 4), 459–487.
Campbell, C. D., Ogburn, E. L., Lunetta, K. L., Lyon, H. N.,Freedman, M. L., Groop, L. C., Altshuler, D., Ardlie, K. G.& Hirschhorn, J. N. (2005) Demonstrating stratification in aEuropean American population. Nat Genet 37, 868–872.
Cavalli-Sforza, L. L., Menozzi, P. & Piazza, A. (1994) The historyand geography of human genes. Princeton, NJ: Princeton UniversityPress.
Conrad, D. F., Jakobsson, M., Coop, G., Wen, X., Wall, J. D.,Rosenberg, N. A. & Pritchard, J. K. (2006) A worldwide surveyof haplotype variation and linkage disequilibrium in the humangenome. Nat Genet 38, 1251–1260.
480 Annals of Human Genetics (2012) 76,472–483 C© 2012 The AuthorsAnnals of Human Genetics C© 2012 Blackwell Publishing Ltd/University College London
Genomic Structure of the Greek Population
Daly, M. J., Rioux, J. D., Schaffner, S. F., Hudson, T. J. & Lander,E. S. (2001) High-resolution haplotype structure in the humangenome. Nat Genet 29, 229–232.
De Bakker, P. I., Graham, R. R., Altshuler, D., Henderson, B. E.,& Haiman, C. A. (2006) Transferability of tag SNPs to capturecommon genetic variation in DNA repair genes across multiplepopulations. Pac Symp Biocomput, 478–486.
Di Giacomo, F., Luca, F., Anagnou, N., Ciavarella, G., Corbo, R.M., Cresta, M., Cucci, F., Di Stasi, L., Agostiano, V., Giparaki,M., Loutradis, A., Mammi’, C., Michalodimitrakis, E. N., Papola,F., Pedicini, G., Plata, E., Terrenato, L., Tofanelli, S., Malaspina, P.& Novelletto, A. (2003) Clinal patterns of human Y chromosomaldiversity in continental Italy and Greece are dominated by driftand founder effects. Mol Phylogenet Evol 28, 387–395.
Di Giacomo, F., Luca, F., Popa, L. O., Akar, N., Anagnou, N.,Banyko, J., Brdicka, R., Barbujani, G., Papola, F., Ciavarella,G., Cucci, F., Di Stasi, L., Gavrila, L., Kerimova, M. G.,Kovatchev, D., Kozlov, A. I., Loutradis, A., Mandarino, V.,Mammi’, C., Michalodimitrakis, E. N., Paoli, G., Pappa, K. I.,Pedicini, G., Terrenato, L., Tofanelli, S., Malaspina, P. & Nov-elletto, A. (2004) Y chromosomal haplogroup J as a signatureof the post-neolithic colonization of Europe. Hum Genet 115,357–371.
Donnelly, M. P., Paschou, P., Grigorenko, E., Gurwitz, D.,Mehdi, S. Q., Kajuna, S. L., Barta, C., Kungulilo, S.,Karoma, N. J., Lu, R. B., Zhukova, O. V., Kim, J. J.,Comas, D., Siniscalco, M., New, M., Li, P., Li, H.,Manolopoulos, V. G., Speed, W. C., Rajeevan, H., Pakstis, A.J., Kidd, J. R. & Kidd, K. K. (2010) The distribution and mostrecent common ancestor of the 17q21 inversion in humans. Am JHum Genet 86, 161–171.
Drineas, P., Lewis, J. & Paschou, P. (2010) Inferring geographiccoordinates of origin for Europeans using small panels of ancestryinformative markers. PLoS ONE 5, e11892.
Edo-Matas, D., Lemey, P., Tom, J. A., Serna-Bolea, C., van denBlink, A. E., van ’t Wout, A. B., Schuitemaker, H. & Suchard, M.A. (2011) Impact of CCR5delta32 host genetic background anddisease progression on HIV-1 intrahost evolutionary processes: Ef-ficient hypothesis testing through hierarchical phylogenetic mod-els. Mol Biol Evol 28, 1605–1616.
Efstratiou, N. (2005) Tracing the story of the first farmers in Greece–A long and winding road. In: How did farming reach Europe? (ed.C. Lichter), pp. 143–153. Istanbul: Deutsches ArchaologischesInstitut, BYZAS BAND 2.
Gabriel, S. B., Schaffner, S. F., Nguyen, H., Moore, J. M., Roy, J.,Blumenstiel, B., Higgins, J., DeFelice, M., Lochner, A., Faggart,M., Liu-Cordero, S. N., Rotimi, C., Adeyemo, A., Cooper, R.,Ward, R., Lander, E. S., Daly, M. J. & Altshuler, D. (2002) Thestructure of haplotype blocks in the human genome. Science 296,2225–2229.
Gonzalez-Neira, A., Ke, X., Lao, O., Calafell, F., Navarro, A.,Comas, D., Cann, H., Bumpstead, S., Ghori, J., Hunt, S.,Deloukas, P., Dunham, I., Cardon, L. R., & Bertranpetit, J. (2006)The portability of tagSNPs across populations: A worldwide sur-vey. Genome Res 16, 323–330.
Gu, C. C., Yu, K., Ketkar, S., Templeton, A. R. & Rao, D. C. (2008)On transferability of genome-wide tagSNPs. Genet Epidemiol 32,89–97.
Gu, S., Pakstis, A. J. & Kidd, K. K. (2005) HAPLOT: A graphicalcomparison of haplotype blocks, tagSNP sets and SNP variationfor multiple populations. Bioinformatics 21, 3938–3939.
Gu, S., Pakstis, A. J., Li, H., Speed, W. C., Kidd, J. R. & Kidd, K.K. (2007) Significant variation in haplotype block structure butconservation in tagSNP patterns among global populations. Eur JHum Genet 15, 302–312.
Hu, C., Jia, W., Zhang, W., Wang, C., Zhang, R., Wang, J., Ma,X. & Xiang, K. (2008) An evaluation of the performance ofHapMap SNP data in a Shanghai Chinese population: Analyses ofallele frequency, linkage disequilibrium pattern and tagging SNPstransferability on chromosome 1q21-q25. BMC Genet 9, 19.
International HapMap Consortium. (2003) The InternationalHapMap Project. Nature 426, 789–796.
International HapMap Consortium. (2005) A haplotype map of thehuman genome. Nature 437, 1299–1320.
International HapMap Consortium (2007) A second generationhuman haplotype map of over 3.1 million SNPs. Nature 449,851–861.
Javed, A., Drineas, P., Mahoney, M. W. & Paschou, P. (2011) Effi-cient genomewide selection of PCA-correlated tSNPs for geno-type imputation. Ann Hum Genet 75, 707–722.
Johnson, G. C., Esposito, L., Barratt, B. J., Smith, A. N., Heward, J.,Di Genova, G., Ueda, H., Cordell, H. J., Eaves, I. A., Dudbridge,F., Twells, R. C., Payne, F., Hughes, W., Nutland, S., Stevens,H., Carr, P., Tuomilehto-Wolf, E., Tuomilehto, J., Gough, S.C., Clayton, D. G. & Todd, J. A. (2001) Haplotype taggingfor the identification of common disease genes. Nat Genet 29,233–237.
King, R. J., DiCristofaro, J., Kouvatsi, A., Triantaphyllidis, C.,Scheidel, W., Myres, N. M., Lin, A. A., Eissautier, A., Mitchell,M., Binder, D., Semino, O., Novelletto, A., Underhill, P.A. &Chiaroni, J. (2011) The coming of the Greeks to Provence andCorsica: Y-chromosome models of archaic Greek colonization ofthe western Mediterranean. BMC Evol Biol 11, 69.
King, R. J., Ozcan, S. S., Carter, T., KalfoAYlu, E., Atasoy,S., Triantaphyllidis, C., Kouvatsi, A., Lin, A. A., Chow, C.E., Zhivotovsky, L. A., Michalodimitrakis, M. & Underhill, P.A. (2008) Differential Y-chromosome Anatolian influences onthe Greek and Cretan Neolithic. Ann Hum Genet 72(Pt 2),205–214.
Laayouni, H., Calafell, F. & Bertranpetit, J. (2010) A genome-widesurvey does not show the genetic distinctiveness of Basques. HumGenet 127, 455–458.
Lao, O., Lu, T. T., Nothnagel, M., Junge, O., Freitag-Wolf, S.,Caliebe, A., Balascakova, M., Bertranpetit, J., Bindoff, L. A.,Comas, D., Holmlund, G., Kouvatsi, A., Macek, M., Mollet,I., Parson, W., Palo, J., Ploski, R., Sajantila, A., Tagliabracci,A., Gether, U., Werge, T., Rivadeneira, F., Hofman, A.,Uitterlinden, A. G., Gieger, C., Wichmann, H. E., Ruther, A.,Schreiber, S., Becker, C., Nurnberg, P., Nelson, M. R., Krawczak,M. & Kayser, M. (2008) Correlation between genetic and geo-graphic structure in Europe. Curr Biol 18, 1241–1248.
Lundmark, P. E., Liljedahl, U., Boomsma, D. I., Mannila, H.,Martin, N. G., Palotie, A., Peltonen, L., Perola, M., Spector,T. D. & Syvanen, A. C. (2008) Evaluation of HapMap datain six populations of European descent. Eur J Hum Genet 16,1142–1150.
Malyarchuk, B. A., Grzybowski, T., Derenko, M. V., Czarny, J.,Drobnic, K., & Miscicka-Sliwka, D. (2003) Mitochondrial DNAvariability in Bosnians and Slovenians. Ann Hum Genet 67(Pt 5),412–425.
Montpetit, A., Nelis, M., Laflamme, P., Magi, R., Ke, X., Remm,M., Cardon, L., Hudson, T.J. & Metspalu, A. (2006) An
Annals of Human Genetics (2012) 76,472–483 481C© 2012 The AuthorsAnnals of Human Genetics C© 2012 Blackwell Publishing Ltd/University College London
V. Stathias et al.
evaluation of the performance of tag SNPs derived from HapMapin a Caucasian population. PLoS Genet 2, e27.
Mueller, J. C., Lohmussaar, E., Magi, R., Remm, M., Bettecken,T., Lichtner, P., Biskup, S., Illig, T., Pfeufer, A., Luedemann, J.,Schreiber, S., Pramstaller, P., Pichler, I., Romeo, G., Gaddi, A.,Testa, A., Wichmann, H. E., Metspalu, A. & Meitinger, T. (2005)Linkage disequilibrium patterns and tagSNP transferability amongEuropean populations. Am J Hum Genet 76, 387–398.
Navarro, P., Vitart, V., Hayward, C., Tenesa, A., Zgaga, L., Juricic,D., Polasek, O., Hastie, N. D., Rudan, I., Campbell, H., Wright,A. F., Haley, C. S. & Knott, S. A. (2010) Genetic comparison ofa Croatian isolate and CEPH European founders. Genet Epidemiol34, 140–145.
Nelson, M. R., Bryc, K., King, K. S., Indap, A., Boyko, A. R.,Novembre, J., Briley, L. P., Maruyama, Y., Waterworth, D. M.,Waeber, G., Vollenweider, P., Oksenberg, J. R., Hauser, S. L.,Stirnadel, H. A., Kooner, J. S., Chambers, J. C., Jones, B., Mooser,V., Bustamante, C. D., Roses, A. D., Burns, D. K., Ehm, M. G. &Lai, E. H. (2008) The Population Reference Sample, POPRES:A resource for population, disease, and pharmacological geneticsresearch. Am J Hum Genet 83, 347–358.
Novelletto, A. (2007) Y chromosome variation in Europe: Con-tinental and local processes in the formation of the extant genepool. Ann Hum Biol 34, 139–172.
Novembre, J., Galvani, A. P. & Slatkin, M. (2005) The geographicspread of the CCR5 Delta32 HIV-resistance allele. PLoS Biol 3,e339.
Novembre, J., Johnson, T., Bryc, K., Kutalik, Z., Boyko, A. R.,Auton, A., Indap, A., King, K. S., Bergmann, S., Nelson, M. R.,Stephens, M. & Bustamante, C. D. (2008) Genes mirror geogra-phy within Europe. Nature 456, 98–101.
Pardo, L., Bochdanovits, Z., de Geus, E., Hottenga, J. J., Sullivan, P.,Posthuma, D., Penninx, B. W., Boomsma, D. & Heutink, P. (2009)Global similarity with local differences in linkage disequilibriumbetween the Dutch and HapMap-CEU populations. Eur J HumGenet 17, 802–810.
Parreira, K. S., Lareu, M. V., Sanchez-Diz, P., Skitsa, I. &Carracedo, A. (2002) DNA typing of short tandem repeat locion Y-chromosome of Greek population. Forensic Sci Int 126,261–264.
Paschou, P., Drineas, P., Lewis, J., Nievergelt, C. M., Nickerson,D. A., Smith, J. D., Ridker, P. M., Chasman, D. I., Krauss,R. M. & Ziv, E. (2008) Tracing sub-structure in the EuropeanAmerican population with PCA-informative markers. PLoS Genet4, e1000114.
Paschou, P., Mahoney, M. W., Javed, A., Kidd, J. R., Pakstis, A. J.,Gu, S., Kidd, K. K. & Drineas, P. (2007a). Intra- and interpop-ulation genotype reconstruction from tagging SNPs. Genome Res17, 96–107.
Paschou, P., Ziv, E., Burchard, E. G., Choudhry, S., Rodriguez-Cintron, W., Mahoney, M. W. & Drineas, P. (2007b) PCA-correlated SNPs for structure identification in worldwide humanpopulations. PLoS Genet 3, 1672–1686.
Perles, C. (2005) From the near East to Greece: Let’s reverse thefocus. Cultural elements that didn’t transfer. In: How did farmingreach Europe? (ed. C. Lichter), pp. 275–290. Istanbul: DeutschesArchaologisches Institut, BYZAS BAND 2.
Richards, M., Macaulay, V., Torroni, A. & Bandelt, H. J. (2002) Insearch of geographical patterns in European mitochondrial DNA.Am J Hum Genet 71, 1168–1174.
Robino, C., Varacalli, S., Gino, S., Chatzikyriakidou, A., Kouvatsi,A., Triantaphyllidis, C., Di Gaetano, C., Crobu, F., Matullo, G.,
Piazza, A. & Torre, C. (2004) Y-chromosomal STR haplotypes ina population sample from continental Greece, and the islands ofCrete and Chios. Forensic Sci Int 145, 61–64.
Rodrıguez-Ezpeleta, N., Alvarez-Busto, J., Imaz, L., Regueiro, M.,Azcarate, M. N., Bilbao, R., Iriondo, M., Gil, A., Estonba, A.& Aransay, A. M. (2010) High-density SNP genotyping detectshomogeneity of Spanish and French Basques, and confirms theirgenomic distinctiveness from other European populations. HumGenet 128, 113–117.
Rosenberg, N., Li, L., Ward, R. & Pritchard, J. (2003) Informative-ness of genetic markers for inference of ancestry. Am J Hum Genet73, 1402–1422.
Sabeti, P. C., Walsh, E., Schaffner, S. F., Varilly, P., Fry, B.,Hutcheson, H. B., Cullen, M., Mikkelsen, T. S., Roy, J.,Patterson, N., Cooper, R., Reich, D., Altshuler, D., O’Brien, S.& Lander, E. S. (2005) The case for selection at CCR5-Delta32.PLoS Biol 3, e378.
Sawyer, S. L., Mukherjee, N., Pakstis, A. J., Feuk, L., Kidd, J. R.,Brookes, A. J. & Kidd, K. K. (2005) Linkage disequilibrium pat-terns vary substantially among populations. Eur J Hum Genet 13,677–686.
Semino, O., Magri, C., Benuzzi, G., Lin, A. A., Al-Zahery, N.,Battaglia, V., Maccioni, L., Triantaphyllidis, C., Shen, P., Oefner,P. J., Zhivotovsky, L. A., King, R., Torroni, A., Cavalli-Sforza, L.L., Underhill, P. A. & Santachiara-Benerecetti, A. S. (2004) Ori-gin, diffusion, and differentiation of Y-chromosome haplogroupsE and J: Inferences on the neolithization of Europe and later mi-gratory events in the Mediterranean area. Am J Hum Genet 74,1023–1034.
Semino, O., Passarino, G., Oefner, P. J., Lin, A. A., Arbuzova, S.,Beckman, L. E., De Benedictis, G., Francalacci, P., Kouvatsi, A.,Limborska, S., Marcikiae, M., Mika, A., Mika, B., Primorac, D.,Santachiara-Benerecetti, A. S., Cavalli-Sforza, L.L. & Underhill, P.A. (2000) The genetic legacy of Paleolithic Homo sapiens sapiensin extant Europeans: A Y chromosome perspective. Science 290,1155–1159.
de Silva, E. & Stumpf, M. P. (2004) HIV and the CCR5-Delta32resistance allele. FEMS Microbiol Lett 241, 1–12.
Stefansson, H., Helgason, A., Thorleifsson, G., Steinthorsdottir,V., Masson, G., Barnard, J., Baker, A., Jonasdottir, A., Ingason,A., Gudnadottir, V. G., Desnica, N., Hicks, A., Gylfason, A.,Gudbjartsson, D. F., Jonsdottir, G. M., Sainz, J., Agnarsson,K., Birgisdottir, B., Ghosh, S., Olafsdottir, A., Cazier, J. B.,Kristjansson, K., Frigge, M. L., Thorgeirsson, T. E., Gulcher,J. R., Kong, A. & Stefansson, K. (2005) A common inversionunder selection in Europeans. Nat Genet 37, 129–137.
Tishkoff, S. A. & Kidd, K. K. (2004) Implications of biogeography ofhuman populations for ‘race’ and medicine. Nat Genet 36(Suppl11), S21–S27.
Voight, B. F., Kudaravalli, S., Wen, X. & Pritchard, J. K. (2006) Amap of recent positive selection in the human genome. PLoS Biol4, e72.
Willer, C. J., Scott, L. J., Bonnycastle, L. L., Jackson, A. U.,Chines, P., Pruim, R., Bark, C. W., Tsai, Y. Y., Pugh, E.W., Doheny, K. F., Kinnunen, L., Mohlke, K. L., Valle, T. T.,Bergman, R. N., Tuomilehto, J., Collins, F. S. & Boehnke,M. (2006) Tag SNP selection for Finnish individuals basedon the CEPH Utah HapMap database. Genet Epidemiol 30,180–190.
Zhong, M., Lange, K., Papp, J. C. & Fan, R. (2010) A powerfulscore test to detect positive selection in genome-wide scans. Eur JHum Genet 18, 1148–1159.
482 Annals of Human Genetics (2012) 76,472–483 C© 2012 The AuthorsAnnals of Human Genetics C© 2012 Blackwell Publishing Ltd/University College London
Genomic Structure of the Greek Population
Supporting Information
Additional supporting information may be found in the onlineversion of this article:
Table S1 List of the genes that appear in each of the 27studied chromosomal regions.
Table S2 Lists of outlier SNPs in population comparisons.Figure S1 PCA plot of the three populations.Figure S2 Informativeness (In) scores for all SNPs for the
CEU-GRE and the CEU-TSI comparisons.
Figure S3 Haplotype blocks in each of the 27 studiedchromosomal regions.
As a service to our authors and readers, this journal pro-vides supporting information supplied by the authors. Suchmaterials are peer-reviewed and may be reorganised for on-line delivery, but are not copy-edited or typeset. Tech-nical support issues arising from supporting information(other than missing files) should be addressed to the authors.
Received: 12 March 2012Accepted: 13 July 2012
Annals of Human Genetics (2012) 76,472–483 483C© 2012 The AuthorsAnnals of Human Genetics C© 2012 Blackwell Publishing Ltd/University College London