Embed Size (px)
Citation preview
Exploring How Information and Communications Technology (ICT)
Firms Create ‘Value’ for Organizational Stakeholders
by
Muhammad Umair Shah
A thesis
presented to the University of Waterloo
in fulfillment of the
thesis requirement for the degree of
Doctor of Philosophy
in
Management Sciences
Waterloo, Ontario, Canada, 2015
© Muhammad Umair Shah 2015

ii
AUTHOR'S DECLARATION
I hereby declare that I am the sole author of this thesis. This is a true copy of the thesis, including any
required final revisions, as accepted by my examiners.
I understand that my thesis may be made electronically available to the public.
iii
Abstract
The understanding of how firms create value for their stakeholders is important for advancing the
empirical body of knowledge on stakeholder theory. This is especially relevant for the exploration of
technology companies operating at different organizational life cycle (OLC) stages. Our study
investigates if the use of business-stakeholder engagement models differs among firms at various
OLC stages. We have identified three distinct categories of business-stakeholder engagement models
from the literature, including: ‘corporate social responsibility’ (CSR), ‘creating shared value’ (CSV)
and ‘creating value for all stakeholders’ (VAS) (Freeman et al., 2010; Strand & Freeman, 2013).
Drawing from the stakeholder theory and organizational life cycle (OLC) frameworks, we
hypothesize that ‘start-up’ firms are more receptive toward VAS model; ‘growth’ firms toward CSR;
and ‘mature’ firms toward CSV.
We apply a ‘pragmatist’ worldview (Creswell, 2009) to collect empirical evidence on Information
and Communications Technology (ICT) firms. Our analyses include two extensive perception based
exploratory studies, described as ‘Phase-1’ and ‘Phase-2’. In the first phase of our exploratory study
we use repertory grid technique (Kelly, 1955) to systematically elicit personal constructs from the
ICT-sector business experts. We used a partial repertory grid method to interview 18 ICT-sector
business experts from Central Canada. Selected sample groups comprised of three scholars and three
practitioners from each of the start-up, growth and mature OLC stages. RepGrid and RepSocio
features of the Rep 5 enterprise software were used to conduct idiographic and nomothetic data
analyses to establish how firms at OLC stages perceive ‘value-creation’ for their stakeholders.
Evidence from this exploratory study suggested that start-up stage firms are perceived to consider
factors beyond creating economic value for both primary and secondary stakeholders. Whereas,
growth and mature stage firms are perceived to consider socioeconomic (consisting of financial as
iv
well as non-financial) scenarios for ‘value-creation’. In the second phase of research, we use survey
study design to test our proposed hypotheses. A total of 132 ICT-sector senior level practitioners,
located in the United States of America (USA) participated in our study. A one-way repeated
measures ANOVA, and factor analyses were used to systematically conduct data analyses for
common method variance, and hypotheses testing. The results from the study showed that start-up,
growth, and mature OLC stage firms are perceived to be at least partially receptive toward VAS,
CSR, and CSV models, respectively.
Our study contributes to the literature on stakeholder theory, ICT-sector organizational life cycle
framework, and methods for measuring organizational decision makers’ perceptions about
stakeholder engagement. The empirical evidence from our research strengthens Donaldson and
Preston (1995), Jones and Wicks (1999), and Jawahar and McLaughlin’s (2001) ideas about
descriptive stakeholder theory for effectively understanding business organizations. We believe that
these findings better equip us for further exploring claims of stakeholder theory – providing divergent
narratives for understanding organizations in stakeholder terms (Jones, 1995; Freeman, 1999).
Some practical implications follow as well. For example, assuming our findings replicate, a society
that seeks to encourage technology companies to broaden their range of stakeholders for innovation
(e.g., to include communities, environment) might direct instrumental change toward ‘start-up’ firms
as appreciative of VAS — even if these new firms require some time to develop perspectives of
'jointness of interest' as they strive to become ‘growth’ and ‘mature’ firms.
v
Acknowledgements
I express my utmost gratitude to my PhD supervisor, Dr. Paul Guild for his guidance, mentorship
and faith in me. I thank him for his time, energy, insight, criticism, and appreciation in the last four
years.
Beside my supervisor, I am grateful to my PhD committee members, Dr. Darren Meister, Dr.
Douglas Sparkes, Dr. Mark Weber, and Dr. Michael Wood for their indispensible guidance and
liberal research insights.
I wish to acknowledge the support received for conducting this study from The Ontario Centres of
Excellence (OCE) and the Institute For Innovation Research (IIR) at the Department of Management
Sciences, University of Waterloo.
My heartfelt gratitude to my teachers and guides in academe and life, Anjum Shahzad, Dr. Selcuk
Onay, Dr. Vanessa Bohns, Dr. Jonathan Fugelsang, Dr. Jonathan Oakman, Dr. Clifford Blake, Dr.
Peter Carr, Dr. Zafar Iqbal, Talha Ali Kushvaha, and Moeen Naseer. I would like to express my
sincere gratitude to Dr. Samir Elhedhli as the chair of our department for his support and
encouragement. My profound acknowledgement to Wendy Fleming, Kathy Tytko, Shelley Vossen,
Gini Kennings, Ian Taylor, and Kimberly Dunne for their exceptional support in the department.
I would like to extend sincere thanks to my dear friends and colleagues, Dr. Muhammad Batouk,
Dr. Julio Noriega, Lulu Resendiz, Dr. Biao Wang, Dr. Shahed Alam, Rodrigo Eng Castillo, Sanaz
Hosseini, Inta Guild, Tara Scanlan, Abdul Al Haimi, Musab Ameen, Sohail Javvad, Umair Javed,
Farhan Mirza, Usman Tariq, Mustafa Shah, Omer Butt, Gul Hassan, Usama Muhammad, Rafaeel
Chaudhry, Waqas Riaz, Ahsan Khalid, Hassan Khalid, Yasir Ali, Maila Akbar, Shehryar Khalid,
Ahsan Zaka, Umair Rehman, Shazia Ilahi, Usman Ilahi, Fahad Sohail, Daniyal Naeem, Ali Niaz, and
vi
Farhan Ghani who were with me in every step of this endeavor with their relentless encouragement
and valuable insights.
This thesis is a fruit of the endless love and encouragement of my family that I much treasure. I am
forever indebted to my parents, Nuzhat and Tahir Shah for their unconditional love and support in all
my pursuits. A special note of thanks to my brother, Usman Shah, is for being an epitome of
resilience in my life. His courage has been an inspiration for me in the completion of this thesis. I
appreciate the love and care of my sisters, Sabina Shah, and Hafsa Arman in this journey. I am
thankful to my mother-in-law, Shabnam Sabah for her love and prayers. My special thanks is for my
brothers-in-law, Hussnain Zia, Arman Khawar and Rafay Ghumman for their well wishes. I
acknowledge with great gratitude the support of Fatima and Asif Hashmi in this process. Also, my
deepest thanks go to Salman Khan, an extraordinary childhood friend for his continuous prayers and
encouragement.
Most of all, my special thanks is for my best friend and loving wife, Almas Razzaq. It is her
unconditional love, support and care, which brought this dream from conception to realization. Her
strength and patience encourages me to accept bigger challenges in life.

vii
Dedication
To my mentors in life, Dr. Paul Guild, Anjum Shahzad and Usman Shah.
You empowered me with knowledge.
Thank you for showing me the light.
Thank you for the gift of knowledge that I shall forever treasure.

viii
Table of Contents
AUTHOR'S DECLARATION ....................................................................................................................... ii
Abstract ......................................................................................................................................................... iii
Acknowledgements ........................................................................................................................................ v
Dedication .................................................................................................................................................... vii
Table of Contents ........................................................................................................................................ viii
List of Figures ............................................................................................................................................... xi
List of Tables ................................................................................................................................................ xii
Chapter 1 Introduction ................................................................................................................................... 1
Chapter 2 Literature Review .......................................................................................................................... 7
2.1 Scope Of The Review .......................................................................................................................... 7
2.2 Corporate Social Responsibility (CSR) ............................................................................................... 8
2.2.1 CSR Between The Era Of 1950s And 1980s ................................................................................ 8
2.2.2 CSR Post 1980s ............................................................................................................................. 9
2.2.3 CSR In The New Millennium (2000 And Beyond) .................................................................... 11
2.3 Creating Shared Value (CSV) ............................................................................................................ 12
2.4 Creating Value For All Stakeholders (VAS) ..................................................................................... 14
Chapter 3 Theoretical Framework and Hypotheses ..................................................................................... 16
3.1 Stakeholder Theory ............................................................................................................................ 16
3.2 Organizational Life Cycle .................................................................................................................. 22
3.2.1 Start-up Stage .............................................................................................................................. 24
3.2.2 Growth Stage .............................................................................................................................. 26
3.2.3 Mature Stage ............................................................................................................................... 29
3.2.4 Decline Stage .............................................................................................................................. 31
Chapter 4 Research Method ......................................................................................................................... 33
4.1 Overview Of The Studies ................................................................................................................... 33
4.2 Phase-1: Exploratory Field Study ...................................................................................................... 33
4.2.1 Sample Selection ......................................................................................................................... 35
4.2.2 Repertory Grid ............................................................................................................................ 36
4.2.3 Element Selection ....................................................................................................................... 37
4.2.4 Construct Elicitation ................................................................................................................... 38
4.2.5 Reliability And Validity Of Repertory Grids .............................................................................. 39
4.2.6 Phase-1 Interview Protocol ......................................................................................................... 39

ix
4.3 Phase-2: Survey Study Design ........................................................................................................... 41
4.3.1 Measurement Scale And Survey Instrument Development ........................................................ 43
4.3.2 Sample Selection ......................................................................................................................... 45
4.3.3 Validity And Reliability Of Phase-2 Study Design .................................................................... 48
Chapter 5 Findings Of Phase-1: Exploratory Field Study ............................................................................ 51
5.1 Participants ......................................................................................................................................... 51
5.2 Repertory Grid Idiographic Data Analyses ........................................................................................ 52
5.2.1 Cluster Analysis Of Individual Grids .......................................................................................... 54
5.2.2 Principal Component Analysis .................................................................................................... 55
5.2.3 Variance Explained ..................................................................................................................... 58
5.3 Repertory Grid Nomothetic Data Analyses ....................................................................................... 59
5.3.1 Mode Grids Analyses .................................................................................................................. 60
5.4 Content Analysis Of Various OLC Stages ......................................................................................... 69
5.4.1 Definitions Of ICT Sector Start-Up, Growth, And Mature OLC Stage Firms ........................... 70
5.5 Discussion For Phase-1 ...................................................................................................................... 72
Chapter 6 Findings Of Phase-2: Survey Study Design ................................................................................ 78
6.1 Participants ......................................................................................................................................... 78
6.2 Internal Consistency Of The Measurement Constructs ...................................................................... 81
6.3 Assessment Of Common Method Biases ........................................................................................... 83
6.4 Relationship Between OLC Stages And Business-Stakeholder Engagement Models ....................... 84
6.4.1 OLC Stages And Their Relationship With Firms’ Cooperative Strategic Posture ..................... 86
6.4.2 OLC Stages And Their Relationship With Narrowly Economic View Of Firms ....................... 89
6.4.3 OLC Stages And Their Relationship With Firms’ Jointness Of Interest .................................... 91
6.5 Relationship Between ICT-Sector Occupational Experience And Organizational Stakeholders ...... 94
6.6 Discussion For Phase-2 ...................................................................................................................... 99
Chapter 7 Conclusion, Limitations And Future Research .......................................................................... 103
7.1 Conclusion ........................................................................................................................................ 103
7.2 Research Limitations ........................................................................................................................ 106
7.3 Future Research ................................................................................................................................ 107
Appendix A Phase-1 Interview Protocol .................................................................................................... 109
Appendix B Cue Cards Of Elements And Definitions Of Stakeholders And OLC Stages ........................ 131
Appendix C Elicited Differentiating Constructs Among Various OLC Stages ......................................... 135
Appendix D Categorical Differentiating Constructs Among Various OLC Stages ................................... 147
Appendix E Repeated Measures Survey Design ........................................................................................ 151
x
Appendix F Determining Value-Creating Constructs Data Outliers .......................................................... 168
Appendix G Determining Value-Creating Constructs Data Normality ..................................................... 187
Appendix H Comparison With Equal Sample Sizes In Each Self Reported OLC Group ......................... 188
Appendix I Scale Reliability Analysis ....................................................................................................... 189
I.1: Reliability Analyses For Start-Up Stage ‘Jointness of Interest’ Construct .......................................... 189
I.2: Reliability Analyses For Growth Stage ‘Jointness of Interest’ Construct ........................................... 191
I.3: Reliability Analyses For Mature Stage ‘Jointness of Interest’ Construct ............................................ 193
Appendix J Factor Analysis For Common Method Bias ........................................................................... 195
Appendix K One-Way Repeated Measures ANOVA – SPSS Output ....................................................... 197
Appendix L Determining Occupational Experience Data Normality ........................................................ 204
Appendix M One-Way ANOVA Results Of Occupation Experience Data ............................................... 205
M.1: Boxplot Graphical Representation Of Data Before Removing Significant Outliers ......................... 205
M.2: Boxplot Graphical Representation Of Data After Removing Significant Outliers ........................... 210
References .................................................................................................................................................. 216
xi
List of Figures
Figure 1: Overview Of Phase-1 Research Design ............................................................................................... 34
Figure 2: Overview Of Research Design In Phase-2 .......................................................................................... 42
Figure 3: Online Survey Response Timeline ...................................................................................................... 47
Figure 4: Focus Output Of Constructs And Elements Of Individual ‘Scholar 1M’ ........................................... 55
Figure 5: PrinGrid Output Of Individual ‘Practitioner 1G’ To Show Construct Structure ................................. 56
Figure 6: PrinGrid Output Of Individual ‘Scholar 2M’ To Show Construct Structure ...................................... 56
Figure 7: PrinGrid Mode Output Of Group Perception At Start-Up OLC Stage ................................................ 61
Figure 8: Focus Mode Output Of Group Perception At Start-Up OLC Stage .................................................... 62
Figure 9: PrinGrid Mode Output Of Group Perception At Growth OLC Stage ................................................. 64
Figure 10: Focus Mode Output Of Group Perception At Growth OLC Stage .................................................... 65
Figure 11: PrinGrid Mode Output Of Group Perception At Mature OLC Stage ................................................ 67
Figure 12: Focus Mode Output Of Group Perception At Mature OLC Stage .................................................... 68

xii
List of Tables
Table 1: The Three Business-Stakeholder Engagement Models ................................................................................. 15
Table 2: Relationship Between Start-Up Firms And Business-Stakeholder Engagement Models .............................. 26
Table 3: Relationship Between Growth Firms And Business-Stakeholder Engagement Models ............................... 28
Table 4: Relationship Between Mature Firms And Business-Stakeholder Engagement Models ................................ 31
Table 5: Specifications Of Measures Used In Phase-1 Interview Protocol ................................................................. 40
Table 6: Section Details Of Questions Used In Phase-1 Interview Protocol ............................................................... 40
Table 7: Summary Details Of Interview Process And Validation Checks During Phase-1 Study .............................. 41
Table 8: Specifications Of Questions Used In Phase-2 Survey Instrument ................................................................. 44
Table 9: Section Details Of Questions Used In Phase-2 Survey Instrument ............................................................... 44
Table 10: Overview Of Survey Responses .................................................................................................................. 47
Table 11: Descriptive Characteristics Of Participants In Phase-1 Study ..................................................................... 53
Table 12: Principal Component Loadings For Each Participant .................................................................................. 57
Table 13: Details About The PVAFF ........................................................................................................................... 58
Table 14: Mode Constructs And Elements Of Group Perception At Start-Up OLC Stage ......................................... 62
Table 15: Mode Constructs And Elements Of Group Perception At Growth OLC Stage ........................................... 66
Table 16: Mode Constructs And Elements Of Group Perception At Mature OLC Stage ........................................... 69
Table 17: Summary Of ‘Value-creation’ Constructs For An Informative Phase-2 Study ........................................... 77
Table 18: Descriptive Characteristics Of Participants In Phase-2 Study ..................................................................... 79
Table 19: Test Of Between Subjects Self-Reported OLC Expertise In Phase-2 ......................................................... 81
Table 20: Details Of Multiple Items Scale To Measure Jointness Of Interest ............................................................. 82
Table 21: Statistical Results Of Relationship Between OLC Stages And ‘Cooperative Focus’ .................................. 87
Table 22: Statistical Results Of Relationship Between OLC Stages And Narrowly Economic View Of Firms ......... 89
Table 23: Statistical Results Of Relationship Between OLC Stages And Firms’ Jointness Of Interest ...................... 91
Table 24: Statistical Results Of Relationship Between Occupational Experience And Stakeholders ......................... 96
Table 25: Summary Of Hypotheses Test Results In Phase-2 Study .......................................................................... 101
1
Chapter 1 Introduction
There are over seven billion people on planet Earth, persons with diverse economic conditions and
living standards. These can be divided into five types of economies: surviving, emerging, developing,
transitioning and developed (Carayannis & Zedtwitz, 2005). In the past, various efforts were made to
try to eradicate poverty and economic inequality in world communities. For instance, foreign
monetary aid programs were once considered strategically important to deal with this inequality
predicament (Papanek, 1973). But later, due to lack of accountability mechanisms in under-developed
and developing regions of the world, some of these programs earned bad reputations. Researchers
concluded that such assistance programs promoted nothing but corruption, and unequal distribution of
wealth in those regions, which caused new problems (Boone, 1996; Alesina & Dollar, 2000; Dalgaard
et al., 2004; Moyo, 2009; Shah, 2011).
Among other approaches, using businesses to eradicate societal issues has gained popularity. It is
generally agreed that wealth creation, either directly or indirectly (such as through jobs, taxes, capital
circulation) adds to any economy’s stability. Rosling (2009) and Prahalad (2010) predicted that these
gaps would close if we promote meaningful and value-creating businesses in global markets. We have
several examples of companies like Microsoft, Apple, and Google that have positively contributed
toward creating value and resolving societal issues. At the same time, we have examples like Enron
(2001), WorldCom (2002), Lehman Brothers (2008), Fannie Mae (2008), and MF Global (2011) that
have committed business fraud and added to societal problems. Such practices raise our concerns
about the role of business in societies. Studies have been conducted to review the events of economic
crises (2008) and social movements like Occupy Wall Street (2011) that protested actions that
deprived millions of people from their jobs, savings, and homes (Amaeshi et al., 2013). Given this
scenario, academics, as well as practitioners demanded that corporations discontinue their profit
2
taking at society’s expense and to review their business policies toward achieving real sustainability
and ‘value-creation’ (Porter & Kramer, 2011; Freeman et al, 2010; Haque, 2009).
In the past, movements such as ‘corporate philanthropy’ (CP) or ‘corporate social responsibility’
(CSR) emerged to connect societies with businesses (Freeman, et al. 2010). Andrew Carnegie (a
Scottish-American businessman of 19th and early 20th century) stated that wealthy members in a
society must take care of the poor (Carnegie, 2006 – first published in 1889). Even to date, we can
find several foundations and non-governmental organizations (NGOs) run by wealthy business
families that strive to extend greater good in communities (Freeman et al. 2010). The concept of CSR
promoted partnerships between businesses and societies. It formally started in 1950s in the United
States (Carroll, 1999; Freeman et al., 2010) and gained a lot of popularity in 1990s (Henderson,
2001). Historically, the 1992 Rio Earth Summit played an important role in legitimizing this type of
business-stakeholder collaborative model (Grayson & Nelson, 2013). The suggestions put forward to
curb societal issues through technology and innovation by business leader participants of the summit
were viewed with suspicion and doubt at first (Grayson & Nelson, 2013). But later the world
witnessed technology and innovation enabling rescue workers to save lives during the Haiti disaster
in 2010, providing evidence that value-creating business services or initiatives can resolve some
societal challenges (Tapscott & Williams, 2012). A similar case was witnessed during the Arab
Spring (2010) where the masses of repressed communities, most from the Arab World (Tunisia,
Egypt, Libya, and Yemen) used social media technologies to get organized and oust their rulers from
power.
We can find several definitions and interpretations of the CSR phenomena in the literature
(Amaeshi et al., 2013). It is an old concept, one that has evolved significantly in the past few decades.
There are arguments for and against it. For instance, Friedman (1970) heavily criticized the CSR
concept as it disrupts the core business function of wealth creation for shareholders. Similarly,
3
Drucker (1994) suggested that businesses must breakeven with their cost of capital to be deemed as
responsible. Henderson (2001) advocated that CSR initiatives reduce business competition, which
may result in market destabilization. In another study conducted by Kotchen and Moon (2011), a
relationship was observed between companies doing ‘more harm’ (by acting irresponsibly), might
actually be the ones doing ‘more good’ (through programs like CSR). For instance, Lehman Brothers
(bankrupted in 2008) had an elaborate CSR program in place but became one of the causes for the
financial meltdown of 2008. It is suggested that CSR is not going far enough toward resolving world
problems (Freeman, 2013)1. Some evidence suggests that it is uncertain to achieve societal uplifting
goal through CSR-led programs (Jenkins, 2005). Such arguments raise questions as to the integrity of
the CSR approach.
The CSR concept is not limited to only Western demography, rather it has become a global
phenomena (Grayson & Nelson, 2013). Thus, in the absence of a strong systematic explanation of
where CSR fits in today, how CSR has evolved, and how new models of business-social partnerships
have emerged globally, makes the advocacy of newer ways of managing business-stakeholder
partnerships difficult to understand and support. By newer ways of conducting business-stakeholder
collaborations, we refer to the idea of businesses ‘creating value for all its stakeholders’ (VAS)
(Freeman et al. 2010).
Some scholars view that the dominant business narrative of creating profits in the short-run has
caused a lot of damage to the reputation of capitalism and corporations per se (Freeman et al, 2010;
Haque, 2009; Porter & Kramer, 2011; Grayson & Nelson, 2013; Amaeshi et al., 2013). This kind of
unregulated profit-making has brought distressing social costs to humanity (Carroll et al., 2012). But
not everyone accepts this dominant business narrative; in fact, some denounce activities that involve
1 Edward Freeman (2013) presented it in an online course on ‘New Models of Business in Society’, available at www.coursera.org.
4
irresponsible conduct by the firms. For instance, a group of consumers stopped purchasing Nike
products after they learned about foul labor conditions at some of Nike production facilities in the
developing countries (Porter & Kramer, 2006; Brugmann & Prahalad, 2007). With the help of
advancement in the media sector, penetration of NGOs, and rising of civil societies, today’s
businesses are expected to be more accountable for their actions than ever before (Porter & Kramer,
2006).
In 2011, Porter and Kramer formulated a business-stakeholder collaborative model to respond to
the criticism of CP and CSR programs. They proposed that businesses should focus on creating
‘social’ value in order to be able to create long-term ‘economic’ value. They called this idea ‘creating
shared value’ (CSV). This business engagement model highlights the fundamental need for
integrating business strategy with societal needs (Porter & Kramer, 2011). For instance, a mobile
telecom company offering online mobile banking in regions where it seeks to resolve societal issues –
while keeping in perspective matters like affordability, accessibility, and security – qualifies for
mutual ‘value-creation’. Telenor’s (telecom service company) Easy Paisa initiative in countries like
Pakistan and M-Pesa service by Safaricom in Kenya surely speak about extending business initiatives
to bring convenience of banking to millions of people living in these underdeveloped/developing
countries2.
Contrary to CP, CSR and CSV models, Freeman (1994) advocated that the distinction made
between social and economic paradigms is a ‘separation fallacy’. According to him (Freeman, 1994;
Freeman et al., 2010), creating ‘value’ is more central than defining which parts of ‘value-creation’
are ‘social’ or which parts are ‘economic’. Hence, firms should strive to ‘create value for all
stakeholders’ (VAS). By using this argument Freeman et al., (2010) equate CSV model with CSR
2 Facts taken from a report by CNN (2010), published by the name, “model for the future”, retrievable at http://www.cnn.com/2010/TECH/01/14/mobile.phone.banking/index.html.
5
practices, primarily because they cater too much to firms’ shareholders and owners (Strand &
Freeman, 2013).
To summarize, we know that in response to the dominant business narrative, organizations initially
started using CP, and CSR models of business-stakeholder engagement. Later, the ideas of VAS and
CSV emerged – where firms draw a greater harmony among its multiple stakeholders (Freeman,
1984; Porter & Kramer, 2011; Freeman, et al. 2010).
In theory and practice, other models of business-stakeholder engagement also exist but these could
potentially be termed synonymous to rather closely defined CSR, CSV, and VAS models. For
instance, concepts like ‘serving at the bottom of the pyramid’ among others can be narrowly
associated with the characteristics of the CSV model. In order to address the issue of how to
distinguish among some major business-stakeholder engagement models, this study uses the construct
of ‘value-creation’ – as per Freeman and Strand’s (2013) definitions of the three tenets of stakeholder
theory. These three tenets are the, ‘cooperative strategic posture’, ‘jointness of interest’, and
‘narrowly economic view of the firms’ addressing about how firms create value for their stakeholders.
In our study, we seek emerging evidence as to whether different paradigms of business-stakeholder
partnerships are perceived to be more receptive toward firms at various organizational life cycle
stages (OLC). These OLC stages are important for exploring the idea of how firms with idiosyncratic
characteristics at different stages of development perceive ‘value-creation’ for their stakeholders. This
study explores the ICT-sector organizations to better understand the phenomena of ‘value-creation’
for the reasons of its high potential impacts around the world. For that we conduct a focused literature
review on the topics related to corporate social responsibility (Chapter 2); build upon stakeholder
theory and organizational life cycle premise to ground testable hypotheses (Chapter 3); use a
pragmatic framework (Creswell, 2009) and research methods to empirically underpin the
6
evolutionary premise of creating ‘value’ and assess the perceived readiness of today’s ICT-sector
firms’ toward these business-stakeholder engagement models (Chapter 4); gather and analyze the
exploratory evidence using a systematic, repertory grid technique (Chapter 5); analyze an exploratory
survey study to further explore the perceived receptiveness of ICT-sector practitioners toward various
business-stakeholder engagement models (Chapter 6); and finally conclude the study, its limitation,
and future research directions (Chapter 7).

7
Chapter 2 Literature Review
2.1 Scope Of The Review
In this chapter we discuss literature on topics related to business-stakeholder collaboration, such as:
corporate philanthropy (CP), corporate social responsibility (CSR), residual view of corporate social
responsibility (R-CSR), integrated view of corporate social responsibility (I-CSR), corporate social
performance (CSP), corporate financial performance (CFP,) creating shared value (CSV), social
entrepreneurship (SE), and social innovation (SI). In addition, some recent views on new business
models, namely emergence of stakeholder approaches in businesses, their relevance with different
organizational development stages, and their impact in creating value for all stakeholders (VAS) are
examined.
The scope of the study allowed us to conduct an exclusive literature review on the topics mentioned
above. For this we used key terminologies, such as: corporate social responsibility (both, residual and
integrated), strategic corporate social responsibility, corporate philanthropy, corporate social
performance, corporate financial performance, creating shared value, inclusive business models,
serving at the bottom of the pyramid (BoP), social entrepreneurship, corporate citizenship, sustainable
responsible businesses, management of organizational stakeholders, and impact of social ventures in
our search queries. We used these items separately, as well as with different combinations in online
search engines, such as Google Scholar, Microsoft Academic Search and online databases, such as
JSTOR, Emerald, and Scopus (amongst others available at University of Waterloo’s Library) to
uncover a rather vast literature.
We acknowledge that this chapter does not include a complete list of business-stakeholder
engagement models from a rather vast literature. However, our discussion comprises of only those

8
three models (namely, CSR, CSV and VAS) – that are distinguishable with the help of contributions
in the literature on stakeholder theory. We believe that it is more important to highlight the key
differentiating characteristics of various business-stakeholder engagement models from literature –
rather than discussing every variant model to gain better learning.
2.2 Corporate Social Responsibility (CSR)
Due to limitations of space, only major contributors to the CSR literature are included in this
chapter. In the beginning, a brief history of the evolution of the CSR ideology is discussed, leading to
an overview of some recent CSR narratives. The fact remains that there is no universally accepted
definition of CSR (Grayson & Nelson, 2013). Many different theories can be found in literature
describing these CSR approaches – often representing the relationship between businesses and
societies with different objectives (Levall & Prejer, 2013).
2.2.1 CSR Between The Era Of 1950s And 1980s
The research contributions made by Carroll in the past two decades have played a pivotal role in
analyzing the origins of CSR and its alternative concepts. We will include here some of the main
ideas and findings of Carroll (1979, 1999), and the work done by Aguinis and Glavas (2012) in our
brief historical overview of the CSR concept. The concept of CSR is mostly considered to be a
phenomenon of 20th Century (Carroll, 1979). Half a century ago, CSR was defined as, “an obligation
of the businessmen to pursue those policies, to make those decisions, or to follow those lines of
actions which are desirable in terms of the objectives and values of the society” (Bowen, 1953). It is
quite intriguing to see the way that Bowen (1953) described the concept; essentially he points CSR
strategy toward gearing businesses to create value for their societies. It may make one wonder why
the concept of CSR became so complicated and started to contradict (in certain cases) some
fundamental assumptions of creating value for the societies in the later years. Theoretically speaking,
9
the definition presented by Bowen in 1953 draws very close meaning to the recent work done by
Porter and Kramer (2011) about CSV (discussed later in the chapter). Perhaps, one could argue that
the CSR concept was theoretically about ‘value-creation’ for the societies but somehow the execution
or practical implementation of it did not go well; this is evident from our later discussions in this
chapter.
Almost a decade after Bowen’s definition of CSR, this concept was sometimes viewed as partially
beyond the interest of economic, technical and legal obligations of the firm (Davis, 1960; McGuire,
1963; Walton, 1967). However, Freidman (1970) opposed these interpretations of Davis (1960),
McGuire (1963) and Walton (1967) and advocated instead that the ultimate purpose of any business is
to create value for its owner, or stock/shareholders. In the early 70s, Johnson (1971) explained the
phenomenon of a socially responsible (SR) firm in multiple complementary ways. According to him,
a SR firm is one “whose managerial staff balances a multiplicity of interests. Instead of striving only
for larger profits for its stockholders, a responsible enterprise also takes into account employees,
suppliers, dealers, local communities, and nations”. This idea seems quite similar to Freeman’s
Stakeholder Theory (Carroll, 1999); details of which are discussed in Chapter 3. Toward the end of
the 70s era, Carroll (1979) presented a definition of CSR, expressing that “the social responsibility of
business encompasses the economic, legal, ethical, and discretionary expectations that society has of
organizations at a given point in time”3. He later summarized that there is no sequence or set pattern
for satisfying economic, legal, ethical, and discretionary categories (Carroll, 1999).
2.2.2 CSR Post 1980s
Post 1980s, with new research, the CSR field became more specialized. Dahlsrud (2008) studied 37
definitions of CSR (from 1980 to 2003), originating from America, Europe, India and Canada. This
3 To understand the significance and meaning of economic, legal, ethical, and discretionary expectations, see the literature review by Carroll (1999).
10
analysis used only the definitions consisting of the term ‘corporate social responsibility’ to ensure
consistency of the results (Dahlsrud, 2008). In this study, it was pointed out that the challenge is not
to define CSR, but to understand how CSR is socially assembled in a particular framework and how it
is incorporated into developing specific business strategies. Five dimensions, namely, ‘the
environmental’, ‘the social’, ‘the economic’, ‘the stakeholder’, and ‘the voluntariness’ were identified
by Dahlsrud (2008) to reflect on the content of the CSR definitions.
During this era, the radius of CSR approach expanded as it promoted a multi-stakeholder
engagement perspective (as suggested by Dahlsrud, 2008). It was concerned with the ethical
treatment of the internal and external stakeholders of the firm, as the idea was to promote human
development (inside and outside the firm) by behaving responsibly (Hopkins, 1999).
Between 1980 and 2000, much of the focus shifted to exploring the relationship between ‘corporate
social performance’ (CSP) and ‘corporate financial performance’ (CFP) – which showed a variety of
positive, negative and inconclusive results (Anderson & Frankle, 1980; Cochran & Wood, 1984;
Aupperle et al., 1985; Davidson & Worrell, 1988; Bromiley & Marcus, 1989; Johnson & Greening,
1994; Waddock & Graves, 1994). According to Griffin and Mahon (1997), academics and
practitioners expressed concerns over these inconsistent results – perhaps arising from unclear
understanding of the concepts of social and financial performance. On a similar note, Crane et al.
(2014) discussed the struggle of CSR to effectively deal with the tensions between social and
economic goals in the real business world. They acknowledged that having a simple and narrow
perspective about social performance fails to address theses complex business and societal challenges
(Crane et al., 2014).
11
2.2.3 CSR In The New Millennium (2000 And Beyond)
According to World Business Council for Sustainable Development (WBCSD, 2000), CSR
explained “the continuing commitment by business to behave ethically and contribute to economic
development while improving the quality of life of the workforce and their families as well as the
local community and society at large”. This definition, however, seems a bit vague and does not
explicitly address all other stakeholders associated with the firm. Similarly, the Commission of the
European Communities (2001) defined CSR as “a concept whereby companies integrate social and
environmental concerns in their business operations and in their interaction with their stakeholders on
a voluntary basis”. More recently, according to the European Commission, CSR can be defined as
“the responsibility of enterprises for their impact on society” (European Commission, 2011). The
meaning associated with the ‘impact on society’ is to capitalize on the creation of shared value for
their (multiple) stakeholders (European Commission, 2011). We noticed that in late 90s and post
2000, the word: ‘stakeholder’ became a part of the vocabulary in CSR literature.
The above discussion shows that over the course of half a century, continuous research has been
conducted on the theories, as well as practices (including merits/demerits) of different CSR
approaches. One of the major and consistent criticisms of this practice has been that organizations
with a strong profit-maximization drive propagate social responsibility as one of their central
objectives, which in reality may not be true. This phenomenon is described by Johnson (1971) as the
‘lexicographic view of social responsibility’4. For instance, many studies have claimed that adapting
to the CSR approach have caused firms to achieve competitive advantage, higher customer
satisfaction and better financial returns (Maignan et al., 1999; Bansal & Roth, 2000; Sharma, 2000;
Sen & Bhattacharya, 2001; Orlitzky et al., 2003; Brammer & Pavelin, 2006). According to the
literature, personal preferences influence decisions regarding the CSR programs (Johnson &
4 See the literature review by Carroll (1999) to learn more about this phenomenon.
12
Greening, 1999; Neubaum & Zahra, 2006; Aguinis & Glavas, 2012). Firm owners use their CSR
budget according to their own personal likings – causing discontinuation of CSR initiatives during
financial turmoil. This view of CSR approach is similar to the Residual-CSR view presented by
Freeman et al. (2010). According to this view firms that give back to societies from the residual
profits are not doing enough toward making business-stakeholder model sustainable (Freeman et al.,
2010).
2.3 Creating Shared Value (CSV)
Porter and Kramer (2011) presented a case to reinvent capitalism through their ‘Creating Shared
Value’ (CSV) concept. They posed it as an alternative to a much criticized (residual) CSR approach.
According to them organizations can achieve long-term, sustainable value by focusing on the societal
issues (Porter & Kramer, 2011). This can be achieved by ‘re-conceiving products and markets’,
‘redefining productivity in the value chain’, ‘enabling local cluster development’ with a motive to
resolve societal issues at large5 (Porter & Kramer, 2011). In other words by aligning core business
strategies with social needs, corporations gain sustainability, competitive advantage, power to resolve
societal issues and gain profits at the same time (Porter & Kramer, 2006; 2011; Michelini, 2012).
Many scholars, practitioners and thinkers belonging to this field have explored business-
stakeholder phenomenon with terms like ‘creative capitalism’, ‘inclusive business’, ‘doing well by
doing good’, ‘harnessing core competencies’, ‘social business’, ‘ethical trade’, and ‘delivering shared
value’ (Ashley, 2009)6. The common understanding of these terms is allowing businesses with
commercial value to bring prosperity to poor people in the developing or under-developed regions of 5 According to FSG (Social Impact Consultants – www.fsg.org), a not-for-profit organization that provides local and global organizations may include corporations, governments, non-profit organizations, school systems, for-profit private firms, and community foundations. They have published a list of their existing 261 client organizations that, as of September, 2015, are moving toward CSV business-stakeholder engagement model. 6 For more details about the origin of these terminologies, see Ashley (2009).

13
the world. This can be achieved with balanced social and commercial value-creating initiatives
(Ashley, 2009).
There are several other business models that advocate for organizations to create value for societies
and businesses simultaneously which may link them with CSV ideology. For instance, ‘social
entrepreneurship’ (SE) is considered as an innovative utilization of available resources to exploit
opportunities for addressing social needs as a primary objective, while treating wealth generation as a
by-product for achieving organizational sustainability (Dees, 1998). The number of social
entrepreneurs is believed to have multiplied in volume with increased penetration in various
geographies (Schwartz, 2012). The economic benefit can be utilized by the poor for improving their
living standards and bringing prosperity. This phenomenon can also be called ‘social business model’
(Mair & Marti, 2006; Easterly & Miesing, 2007; Yunus 2011). Similarly, ‘social intrapreneurship’ is
another model for achieving shared value, which is termed as an organizational drive to bringing
social change through its core-business products and services for building long-term business and
societal values (Brenneke & Spitzeck, 2009). Michelini and Fiorentino (2012) introduced ‘inclusive
business model’, as another defining term toward creating value in societies through business
intervention (originally stated by the World Business Council for Sustainable Development, 2008).
This concept is similar to the concept proposed by Prahalad (2010) to serve the masses at the ‘bottom
of the pyramid (BoP)’. According to this model multi-national organizations generate growth by
altering their products and services to suit demands and needs of mass consumers, converting them
into micro-consumers, micro-producers, micro-investors, and innovators (Prahalad & Hart, 2002;
Prahalad & Hammond, 2002; Prahalad 2010). On a further note, Kanter (1999), terms ‘corporate
social innovation’ as a way of developing corporate solutions for social problems and treating them as
learning laboratories. Haque (2009) argued that businesses making profits at the expense of the
society are not beneficial for anyone. Organizations should focus on developing ‘meaningful’

14
products and services for their customers, which has been referred to as creating ‘thick value’ (Haque,
2009).
From our discussion above, we can identify variations in the business-stakeholder engagement
models. Nevertheless, CSV may complement the existing schemes of CP, CSR and sustainability
(Leth & Hems, 2013), and it still may be unfair to compare models like SE with CSV (the former
model focusing on social sustainability; whereby the latter driven by profit motives). To be able to
differentiate among the fundamentals of these models, we use a stakeholder theoretical lens,
presented by Freeman et al. (2010).
Among the most prominent critics of the CSV model, Crane et al. (2014) highlighted some of its
valid shortcomings, such as this model lacking in originality (for being very similar to the likes of
‘strategic CSR’,‘BoP’, and ‘social innovation’ concepts among others), and not addressing the core
complexities of balancing economic and social interests. However, Crane et al. (2014) still
acknowledged the potential of this model to create awareness about socially beneficial business
practices in both practice and theory.
2.4 Creating Value For All Stakeholders (VAS)
In the literature, we can also find a third type of business-stakeholder engagement model, known as
‘Creating Value for All Stakeholders’ (VAS) (Freeman et al., 2010). According to which, firms must
treat all its stakeholders equally to create value while avoiding tradeoffs (Freeman, 1984; Freeman et
al, 2010). According to Crane et al. (2014), the stakeholder theory approach has the potential to
effectively drive firms toward fulfilling their multi-purposes – which models like CSV lack. The three
tenets of ST (i.e. ‘jointness of interest’, ‘cooperative strategic posture’ and ‘rejections of a narrowly
economic view of the firm’) allow us to distinguish among our outlined models (i.e. CSR, CSV and
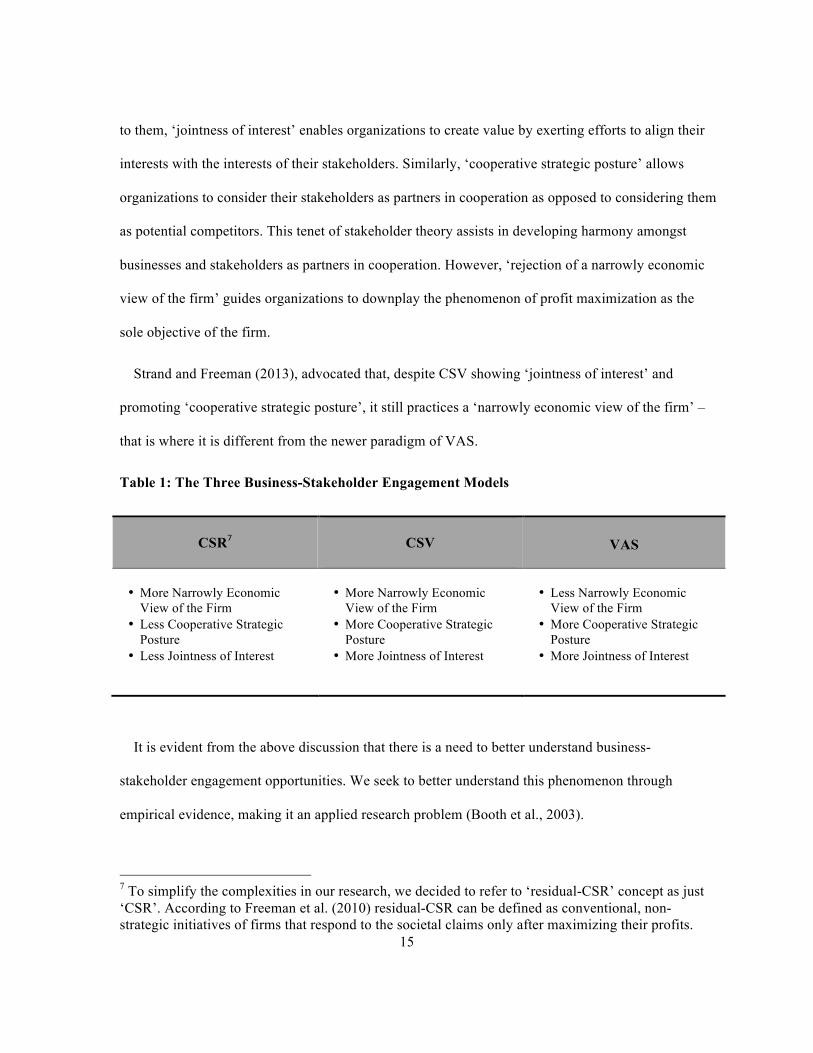
VAS) of business-stakeholder engagement as shown in Table 1 (Strand & Freeman, 2013). According
15
to them, ‘jointness of interest’ enables organizations to create value by exerting efforts to align their
interests with the interests of their stakeholders. Similarly, ‘cooperative strategic posture’ allows
organizations to consider their stakeholders as partners in cooperation as opposed to considering them
as potential competitors. This tenet of stakeholder theory assists in developing harmony amongst
businesses and stakeholders as partners in cooperation. However, ‘rejection of a narrowly economic
view of the firm’ guides organizations to downplay the phenomenon of profit maximization as the
sole objective of the firm.
Strand and Freeman (2013), advocated that, despite CSV showing ‘jointness of interest’ and
promoting ‘cooperative strategic posture’, it still practices a ‘narrowly economic view of the firm’ –
that is where it is different from the newer paradigm of VAS.
Table 1: The Three Business-Stakeholder Engagement Models
CSR7
CSV
VAS
• More Narrowly Economic
View of the Firm • Less Cooperative Strategic
Posture • Less Jointness of Interest
• More Narrowly Economic
View of the Firm • More Cooperative Strategic
Posture • More Jointness of Interest
• Less Narrowly Economic
View of the Firm • More Cooperative Strategic
Posture • More Jointness of Interest
It is evident from the above discussion that there is a need to better understand business-
stakeholder engagement opportunities. We seek to better understand this phenomenon through
empirical evidence, making it an applied research problem (Booth et al., 2003).
7 To simplify the complexities in our research, we decided to refer to ‘residual-CSR’ concept as just ‘CSR’. According to Freeman et al. (2010) residual-CSR can be defined as conventional, non-strategic initiatives of firms that respond to the societal claims only after maximizing their profits.
16
Chapter 3
Theoretical Framework and Hypotheses
Continuing with the ideas presented above, we propose to use the ‘Stakeholder Theory’ and
‘Organizational Life Cycle’ (OLC) narratives (conceptual frameworks) to understand the readiness of
today’s firms toward use of various paradigms of business-stakeholder collaboration. In this section,
we identify an opportunity to investigate the perceptions of practitioners, representing firms from
different developmental stages about the paradigms of CSR, CSV, and VAS.
Drawing from the discussions on stakeholder theory and organizational life cycle framework, we
seek the emerging evidence as to whether different OLC stages influence the perceived receptiveness
toward various business-stakeholder partnerships. The underlying assumption is that when an
organization moves typically from one stage to another in organizational development life cycle –
based on its idiosyncratic characteristics – it responds differently to organizational stakeholders. Our
study attempts to explore the models of business-stakeholder engagement as suggested by the
stakeholder theory and the various developmental stages of ICT-sector organizations to better
understand the phenomena of ‘value-creation’. New learning may enable us to understand the topic of
stakeholder engagement in a more holistic manner.
3.1 Stakeholder Theory
According to the literature, stakeholder theory is an organizational theory (Phillips, et al., 2003)
which promotes creating value for all stakeholders by avoiding tradeoffs among each other (Jones &
Wicks, 1999; Freeman et al., 2010). The concept of stakeholders has been around since 1960s, from
an era when business was seen as an essential element of society rather than a narrow profit-centric
pursuit (Freeman & Liedtka, 1997). This theory emerged as an opposing concept to the widely used
17
‘shareholder’ theory of organizations (Freeman, 1984; Freeman et al., 2010). According to the
stakeholder theory, management of an organization does not only have a fiduciary duty to the
shareholders, but also have obligations to other stakeholders of the firms (Hasnas, 2013). Some key
stakeholder theorists, such as Freeman, Wicks and Parmar (2004) elaborated this distinction and
stressed that stakeholder theory does not underplay the importance of financial stakeholders; instead,
it promotes firms to harmonize their interests with all, including non-economic stakeholders. Owing
to that, a stakeholder theory approach has been said to provide a better path for managers and
entrepreneurs to articulate broader purpose of the firms (Freeman et al., 2004).
The antithesis of the stakeholder theory posits that organizations ultimately exist to maximize their
profits and economic returns (Friedman, 1970), which would seem to negate the views of Bosse,
Phillips, and Harrison (2009) about organizational stakeholders wanting things other than just
achieving economic benefits. According to Harrison and Wicks (2013), paying attention to these
other factors may provide useful directions for understanding what enables firms to become thriving
and sustainable in the longer-term.
In the stakeholder theory literature, not many empirical studies exist to help in advancing our
understanding about how firms at different OLC stages perceive ‘value-creation’ for their
stakeholders. Prior to approaching this gap in the literature, we must highlight the legitimacy of
stakeholders through their interactivities. Typically, managers and entrepreneurs consider the interests
of “those groups and individuals who can affect (or be affected by) their activities” as their legitimate
stakeholders (Freeman, 1984; Donaldson & Preston, 1995). These include customers, employees,
financiers, communities, suppliers, and sometimes others to whom firms have responsibilities
(Freeman, 1999; Phillips et al., 2003; Freeman et al., 2007; Freeman et al., 2010).

18
In the past, several discussions were made to advance stakeholder theory on descriptive,
instrumental, and normative aspects of the theory. Donaldson and Preston (1995) shared some of the
distinctions, challenges and implications of it in their research work. According to these authors, it is
important to understand the reasons for accepting stakeholder theory over alternative ideas, such as
‘management serving the shareowners’. They (Donaldson & Preston, 1995) argued that stakeholder
theory mutually supports the descriptive, instrumental, and normative aspects of the theory. At the
first (descriptive) level, the theory explains associations that are observed in the real world. At the
next (instrumental) level, the cause and effect relationship of certain practices resulting in definite
outputs advance the descriptive observation. At the third (normative) level, the function to offer
guidance on the basis of some fundamental moral and philosophical values is exercised.
The idea falls short in supporting accuracy of descriptive, as well as instrumental aspects of the
stakeholder theory by examining the criticism and support found in the literature (Donaldson &
Preston, 1995). However, the argument of stakeholder theory being fundamentally normative is
supported, especially in the light of theory of property rights (Donaldson & Preston, 1995). To
compliment the typology of stakeholder theory by Donaldson and Preston (1995), Jones and Wicks
(1999) identified two divergent approaches: 1) social science based research and, 2) normative ethics
account prevailing in the stakeholder literature. However, in response, they proposed an integrative or
convergent stakeholder theory, connecting normative arguments and supporting it with instrumental
or practical approaches (Jones & Wicks, 1999).
Freeman (1999) criticized the convergent stakeholder approach, as well as the assumptions on
which it was built – that is normative, instrumental, and descriptive aspects of stakeholder theory
suggested by Donaldson and Preston (1995), and the association between the instrumental and
normative theories as pointed out by Jones and Wicks (1999). According to him (Freeman, 1999) this
kind of distinction gives birth to a phenomenon called ‘separation thesis’ – separating businesses
19
from ethics. It is because almost every business decision arguably has some ethical grounds attached
to it (Freeman, 1994; 1999; Freeman et al., 2010). The researchers should focus more on theory that
‘diverges’ for developing narratives that can show that organizations can succeed by promoting
cooperation amongst various ‘stakeholders’ (Freeman, 1999; Freeman et al, 2010). It was further
elaborated that the stakeholder approach was built upon instrumental foundations following a
pragmatic framework, which drives the notion that, for organizations to be successful, they must
solely satisfy those being affected or those that can affect (Freeman, 1999). As instrumental narrative
requires some reasoning, it is not necessary to have a normative justification when using this
approach (Freeman, 1999). There is a need to put more emphasis on increasing studies backed by
instrumental theory – primarily because there is more than one way to effectively manage stakeholder
groups (Freeman, 1999).
While acknowledging the aforementioned three aspects of the stakeholder theory, we consider
benefiting from our research by initially framing questions in a descriptive manner; this could
potentially prepare us better for further exploring the instrumental aspect of the stakeholder theory
eventually.
We can utilize stakeholder theory as a framework to develop several other testable theories
(Wheeler et al., 2003; Freeman et al., 2010). For instance, through studying the relationship between
businesses and their stakeholder groups as a unit of analysis, one can address the contemporary issues
about ‘value-creation’ and trade, ethics of capitalism, and managerial mindsets (Freeman et al., 2010).
Although the stakeholder theory dialogue has been extended to various industries and academic
disciplines, very little research addresses different perspectives as to how firms create ‘value’ for their
stakeholders. Harrison and Wicks (2013) developed a four-factor perspective for defining the ‘utility’
that stakeholders seek from firms. This maybe a good starting point to realize a broader understanding
of the term ‘value’, one that extends beyond a narrowly-defined perspective of ‘economic returns’ to
20
yield a legitimate expression about ‘value’ (Friedman, 1970; Donaldson & Preston, 1995; Mitchell et
al., 1997; Berman et al., 1999; Argandona, 2011; Harrison & Wicks, 2013).
As we discuss the measurement of firm performance using a multi-stakeholder focus, we note that
some researchers have established KLD data8 as a way of learning about firms creating or destroying
the overall firm ‘value’ (Berman et al., 1999; Hillman & Keim, 2001; Harrison & Wicks, 2013). This
may be an efficient way to analyze the total worth of publically listed firms; however, it does not fully
capture the notion of how firms at initial or intermediary stages of development create value for their
stakeholders. In the literature, we have not found an empirical study that addresses how firms at
different development stages perceive ‘value-creation’ or explain the responsibilities toward their
primary or secondary stakeholders.
In an attempt to pursue this opportunity we suggest applying organizational life cycle theory (OLC)
to conceptualize and capture a broader view about how firms at OLC stages vary in terms of creating
value for stakeholders. Prior research supports the approach of using OLC in research question
similar to ours (see Milliman et al., 1991; Jawahar & McLaughlin, 2001). Interestingly, Jawahar and
McLaughlin (2001) proposed that, depending upon the importance of satisfying their needs, certain
stakeholders would be more critical than others to organizations at different OLC stages.
Stakeholder theory is relevant to our work as it differs from the ‘shareholder’ dominant business
narrative and promotes the ‘value-creation’ concept. In an interview with Moutchnik (Freeman &
Moutchnik, 2013), Freeman highlighted five major postulates of the ‘stakeholder’ view that
differentiate it from ‘shareholder’ perspective. Accordingly, first, businesses are not just about
economics, they have other purposes too. Second, ‘businesses’ are about creating (or sometimes
8 KLD STATS (Kinder, Lyndenberg and Domini) is a statistical tool for analyzing trends in social, environmental, and governance performance of firms using data gathered annually from US-Publically listed companies. KLD data are now known as ESG (environmental, social, and governance) after being acquired by MSCI.

21
destroying) value. To lead a business, managers and owners should focus on getting their company
interests aligned with stakeholders. Third, humans are not simple beings who get motivated only to
create wealth. Our complexity, with many wants and needs, allows capitalism to work; indeed, such
complexity enables us to create value for each other. Fourth, we should assume that most people are
honest and responsible. Fifth, competition in free markets is not bad as it increases options for people;
however, the underlying objective of capitalism is the creation of value. Also related, due to
technological advancements and the emergence of new political realities, Freeman says we must
understand new ways of connecting businesses in societies (Freeman & Moutchnik, 2013).
In the mid 20th Century, Schumpeter (1939; 1994 – originally published in 1942) presented a
similar rationale in support of capitalistic structure. He referred to capitalism as ‘evolutionary’ rather
‘static’, where ‘creative destruction’, ‘innovation’ and ‘entrepreneurship’ builds its foundation. The
paradigm of VAS redefines the narrative of capitalism and ethics by realizing that businesses are
created with a purpose to create ‘stakeholder value’ and not just ‘shareholder value’ (Freeman, 2007;
Freeman et al., 2010; Harrison & Wicks, 2013).
In the recent past, scholars and researchers have made efforts to measure and define the concept of
VAS (Argandona, 2011; Tantalo, 2011; Harrison & Wicks, 2013). Previously, the term ‘value’ has
been either examined from the legitimacy viewpoint or from the economic perspective (Friedman,
1970; Donaldson & Preston, 1995; Mitchell et al., 1997; Berman et al., 1999; Argandona, 2011;
Harrison & Wicks, 2013). In the given scenario, ample research opportunities exist for scholars to
determine which of the models of business-stakeholder interaction are most sustainable for
organizations. More research is required to know how firms with different characteristics explain
their ‘company customer responsibility’, ‘company employee responsibility’, ‘company financier
responsibility’, ‘company supplier responsibility’, and ‘company community responsibility’
22
(Freeman et al., 2010) and then how it reflect upon adopting the right fit of business-stakeholder
engagement model.
In our opinion this gap in the literature may be explored with these questions:
1) How do firms at different developmental stages describe their responsibilities of creating
idiosyncratic ‘value’ for organizational stakeholders?
2) How do firms at different development stages perceive receptiveness toward various
business-stakeholder engagement models?
3) How can such exploration be informed by evidence?
In order to address these exploratory research questions objectively, we decided to initially focus
on business firms from one specific industry. It was believed that different industries may have their
unique classifications of the OLC stages and running a generic exploratory study might not serve our
research goals. For the purpose of scoping our research project better, we decided to focus on the
ICT-sector for-profit business firms. One of the major reasons for choosing the ICT industry was its
significant impact on the sustainable development of businesses and the economic development of
many societies in recent times (Tapscott & Williams, 2012).
3.2 Organizational Life Cycle
We suggest applying organizational life cycle theory (OLC) to conceptualize empirically a
business-stakeholder cooperative framework for firms at different OLC stages. Previous research
supports the approach of using OLC in research questions similar to ours (Milliman et al., 1991;
Jawahar & McLaughlin, 2001). Interestingly, Jawahar and McLaughlin (2001) proposed that
depending upon the importance of satisfying their needs, certain stakeholders would be more critical

23
than others when comparing organizations at different OLC stages9. The top-level managers
belonging to different organizational development stages have different priorities (Smith et al., 1985)
that could predict the effectiveness of their firms (Quinn & Rohrbaugh 1983).
According to the literature, there are multiple stages in the OLC model. These stages consist of
different sets of organizational activities and structures (Dodge, et al., 1994), which are often
classified into three to ten stages (Miller & Friesen, 1984; Hanks et al., 1993; Lester et al., 2003;
Bonn & Pettigrew, 2009). The attributes of firms at various development stages define the firms’
priorities accordingly (Miller & Friesen, 1984; Greiner, 1972; Lewis & Churchill, 1983; Moores &
Yuen, 2001). It has been demonstrated empirically that different stages of OLC have a significant
effect on the firms adopting management control systems (Miller & Friesen, 1984; Moores & Yuen,
2001; Auzair & Langfield-Smith, 2005; Davila, 2005).
Managerial practices and policies to make the organization successful can differ in each phase of
organizational development (Randolph & Posner, 1982). The results gathered by Kallunki and Silvola
(2008) confirmed that firms adopt formal accounting management systems (e.g. activity-based-
accounting practice) at the later stages of the life cycle as compared to the firms at the early stages.
This may be because the firms at different developmental stages operate and compete in diverse
environments, requiring unique administrative approaches and business strategies (Miller & Friesen,
1984) to increase their market share and reduce costs to deal with rising competition as they progress
from birth to maturity stages (Kallunki & Silvola, 2008). The exact length of each phase is not
constant and can vary according to the circumstances (Randolph & Posner, 1982). This implies that
the use of different business-stakeholder collaboration models may vary across the stages of OLC. It
creates an opportunity for exploring how business-stakeholder partnership strategies vary as
organizations develop and transition from one stage to another. 9 See the four propositions by Jawahar and McLaughlin (2001).

24
A longitudinal study conducted by Miller and Friesen (1984) was an effort to categorize
empirically organizational development stages on the basis of structure (organization), strategy,
context (situation) and decision-making styles. Recent studies by Bonn and Pettigrew (2009), and
Wang and Singh (2014) employed a four-stage organizational life cycle model, (start-up, growth,
mature and decline) for their studies on firms’ board members and CEO compensation plans
respectively – thereby providing substantial evidence that these four stages can empirically describe
the organization development cycle (Wang & Singh, 2014). We used the common features from Miller
and Friesen (1984), and Kallunki and Silvola (2008) to define the criteria to operationalize our participant
recruitment process. For instance, according to Kallunki and Silvola (2008), a typical start-up stage firm can be
less than 13 years; a growth stage organization can be 13 to 49 years; and a typical mature stage firm can be
over 49 years, among other differences10. Our study excluded the ‘declining’ stage of firm development from
the analyses because of practical constraints of obtaining information from their representative sample group.
The operational definitions of these stages (start-up, growth, mature and decline) reduce the
chances of misinterpretation of the measuring variables (Singleton & Straits, 1993). Our study
excluded the ‘declining’ stage of firm development from the analyses because of practical constraints
of obtaining information from their representative sample group. Also, from a previous study, self-
reporting approach of categorizing firms at different organizational stages showed insignificant
response from the respondents belonging to the declining stage of OLC framework (Kallunki &
Silvola, 2008).
3.2.1 Start-up Stage
In the context of our research, ‘start-up’ firms are small enterprises trying to build up as a
viable/feasible unit with no established reputation (Bonn & Pettigrew, 2009). The organizational 10 The details about the differentiating characteristics of start-up, growth, mature and decline OLC stages can be found in the work of Miller and Friesen (1984, page 1163), and Kallunki and Silvola (2008, page 69).
25
structures of these firms remain informal and flexible with the ownership held by one or a few
individuals (Miller & Friesen, 1984; Bonn & Pettigrew, 2009). The age of the firm is also defined to
be typically less than 13 years (Kallunki & Silvola, 2008). We are aware that some authors do not
classify all ‘start-up’ businesses as ‘entrepreneurial’ (Drucker, 1985). This may be because some
entrepreneurs do not require a profit purpose; instead they value innovation (Schumpeter, 1939; 1994;
Drucker, 1985; Dees, 1998).
As discussed earlier, we plan to study the case of technology enterprises, which are often
considered to be innovative so as to attain sustainable advantage (Guild & Bachher, 1996). This
understanding compels us to include ‘entrepreneurial ventures’ in the category of ‘start-up’ firms. In
order to define (in detail) the characteristics of ‘start-up’ stage, we rely on the features defined by
Miller and Friesen (1984) under the category of ‘birth phase’.
According to Balkin and Swift (2006), and Gomez-Mejia et al. (2011), the founding owners/CEOs
or top management of ‘start-up’ firms are often motivated more by their altruism, emotions and other
non-economic, intrinsic values than financial gains. We suggest (in the light of stakeholder theory)
that ‘start-up’ firms are not simply driven by the purpose of making profits and therefore they place
emphasis on equally satisfying other non-financial stakeholders too. This may be because they are not
yet heavily invested in the 'status quo'. Therefore, we propose that VAS business-stakeholder practice
is likely to be greater among firms in the ‘start-up’ phase than in firms belonging to the ‘growth’ and
‘maturity’ phases (as shown in Table 2).
If the distinctions described above are reliable and valid, we should expect to see the following
hypotheses confirmed:

26
Hypothesis 1a. With respect to VAS, ‘Start-up’ firms are perceived to be more likely to demonstrate
cooperative strategic posture than are the ‘Growth’ firms.
Hypothesis 1b. With respect to VAS, ‘Start-up’ firms are perceived to be less likely to demonstrate a
narrowly economic view of the firm than are the ‘Growth’ and ‘Mature’ firms.
Hypothesis 1c. With respect to VAS, ‘Start-up’ firms are perceived to be more likely to demonstrate
“jointness of interest” than are the ‘Growth’ firms.
Table 2: Relationship Between Start-Up Firms And Business-Stakeholder Engagement Models
Business-Stakeholder Engagement Models
CSR
CSV VAS
• More Narrowly Economic View of the Firm
• Less Cooperative Strategic Posture
• Less Jointness of Interest
• More Narrowly Economic View of the Firm
• More Cooperative Strategic Posture
• More Jointness of Interest
• Less Narrowly Economic View of the Firm
• More Cooperative Strategic Posture
• More Jointness of Interest
Organizational Life Cycle
Stage
START-UP
FIRM
!
3.2.2 Growth Stage
Firms belonging to the ‘growth’ stage of OLC are more formalized in structure with the likelihood
of the owner being replaced by professional managers and placing better coordinated internal
processes and systems to analyze complex decision making problems (Miller & Friesen, 1984; Smith
et al., 1985; Bonn & Pettigrew, 2009). Usually, in this stage the emphasis is on rapid growth of sales
27
and transfer of some of the authority to middle management (Miller & Friesen, 1984). The expansion
prospects in terms of employees, customers, products, and geographies are also catered in this stage
(Jawahar & McLaughlin, 2001; Kazanjin & Drazin, 1989; Kallunki & Silvola, 2008; Bonn &
Pettigrew, 2009; Wang & Singh, 2014). Our ‘growth’ phase is suggested by the “growth” phases of
Miller and Friesen (1984) and Kallunki and Silvola (2008). According to which, the sales growth of
the firms is the highest (typically up to 28%) with the increase in its bureaucracy and formalization of
policies. However, the approximate age would be typically between 13 to 49 years (Miller & Friesen,
1984; Kallunki & Silvola, 2008).
The 'growth' firms are expected to be preoccupied with the older paradigm of CSR. It may be that,
while making a transition to this new (growth) stage through coordination, firms decide on giving
back to the society from the surplus profits. We also assume that they do not align the business-
stakeholder initiatives with their core business strategy. The study conducted by Elsayed and Paton
(2009) has shown no significant relationship between ‘growth’ firms’ financial support and the
successful implementation of social-environmental initiatives. At the ‘growth’ stage of OLC,
emphasis remains on catering to the shareholders’ interests (Wang & Singh, 2014). Furthermore,
professional managers or CEOs adapt agency like behavior – for which firms use compensation
packages (e.g. stock options) that safeguard personal interests of their top leadership (Gomez-Mejia &
Wiseman, 1997; Wang & Singh, 2014). At this stage of development, more importance is given to
establish the financial performance of firms (Miller & Friesen, 1984) and building its legitimacy for
potential collaborators (Bonn & Pettigrew, 2009). Perhaps, the introduction of business-stakeholder
programs by the firms could be catered as one of the ways to establish that authenticity. Hence, we
propose that CSR business-stakeholder practice is likely to be greater among firms in the ‘growth’
phase than in firms belonging to the ‘start-up’ and ‘maturity’ phases (as shown in Table 3).
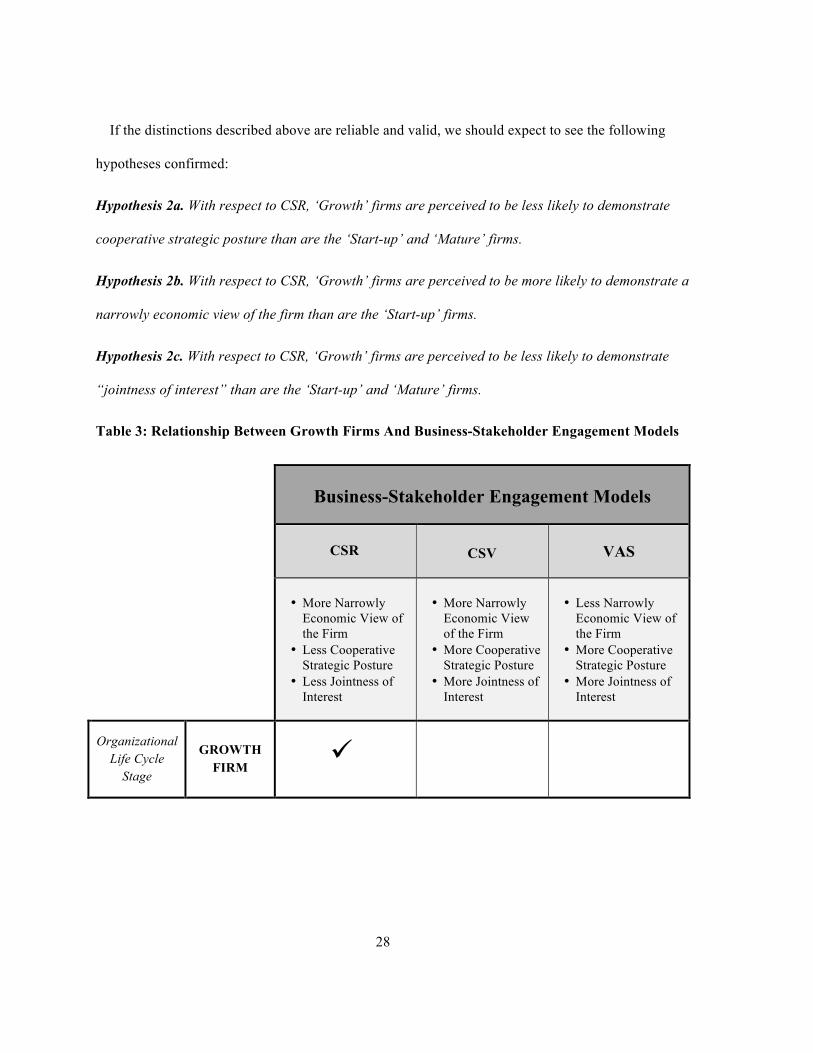
28
If the distinctions described above are reliable and valid, we should expect to see the following
hypotheses confirmed:
Hypothesis 2a. With respect to CSR, ‘Growth’ firms are perceived to be less likely to demonstrate
cooperative strategic posture than are the ‘Start-up’ and ‘Mature’ firms.
Hypothesis 2b. With respect to CSR, ‘Growth’ firms are perceived to be more likely to demonstrate a
narrowly economic view of the firm than are the ‘Start-up’ firms.
Hypothesis 2c. With respect to CSR, ‘Growth’ firms are perceived to be less likely to demonstrate
“jointness of interest” than are the ‘Start-up’ and ‘Mature’ firms.
Table 3: Relationship Between Growth Firms And Business-Stakeholder Engagement Models
Business-Stakeholder Engagement Models
CSR
CSV VAS
• More Narrowly Economic View of the Firm
• Less Cooperative Strategic Posture
• Less Jointness of Interest
• More Narrowly Economic View of the Firm
• More Cooperative Strategic Posture
• More Jointness of Interest
• Less Narrowly Economic View of the Firm
• More Cooperative Strategic Posture
• More Jointness of Interest
Organizational Life Cycle
Stage
GROWTH
FIRM
!
29
3.2.3 Mature Stage
The ‘mature’ stage in the OLC consists of large organizations having strong cash flows with the
ability to raise further capital with comparative ease (Dodge et al., 1994). They have established
product selling markets with the focus on preserving or further improving their market position
(Dodge et al., 1994; Bonn & Pettigrew, 2009). The organizational structure becomes very formal and
bureaucratic with professional managers replacing the founders of the business (Miller & Friesen,
1984; Bonn & Pettigrew, 2009). At this stage of the OLC, firms’ management exerts strong emphasis
on diversifying the products, introduces sophisticated management controls and systems, and
develops divisions for superior results (Miller & Friesen, 1984).
Our ‘mature’ phase is suggested by the “maturity” and “revival” phases of Miller and Friesen
(1984) and Kallunki and Silvola (2008). According to which, the annual sales growth of the firms
drop significantly while progressing from ‘growth’ to ‘maturity’ stages (Wang & Singh, 2014). Using
Miller and Friesen’s (1984) model and findings of Kallunki and Silvola’s (2008) study – the annual
sales growth of our defined ‘mature’ stage firms would be typically up to 4%; whereby the number of
employees would be large; with firm age of approximately 49 years and beyond.
The 'mature' firms are expected to be preoccupied with the paradigm of CSV. Perhaps, firms at this
stage of development may be prepared to look for uncontested opportunity by aligning their business
interest with societal interests, known as CSV. It may be because this technique is lucrative for new
investment opportunities, which is in line with the rationale presented by Miller and Friesen (1984),
Kallunki and Silvola (2008), and Wang and Singh (2014) about ‘mature’ firms needing to improve
their services and products to off-set competition. The firms in this stage put more emphasis on
managing market competitiveness for improved profits (Miller & Friesen, 1984; Kallunki & Silvola,
2008). Also, since the firms at this stage are largest in size and operate at economies of scale (Liao,
2008), the overall focus shift toward achieving further efficiency for its survival (Dickinson, 2011).

30
On the other hand, those that do not succeed or comply with the above mentioned narrative are more
likely to become 'declining' firms.
With respect to ‘mature’ firms’ performance (as per stakeholder theory), we can argue that these
firms give first priority to profit maximization and follow a ‘narrowly economic view of the firm’.
We can also deduce from the above discussion that there remains ‘cooperative strategic posture’
among firms and their stakeholders. Hence, we propose that CSV business-stakeholder practice is
likely to be greater among firms in the ‘mature’ phase than in firms belonging to the ‘start-up’ and
‘growth’ phases (as shown in Table 4).
If the distinctions described above are reliable and valid, we should expect to see the following
hypotheses confirmed:
Hypothesis 3a. With respect to CSV, ‘Mature’ firms are perceived to be more likely to demonstrate
cooperative strategic posture than are the ‘Growth’ firms.
Hypothesis 3b. With respect to CSV, ‘Mature’ firms are perceived to be more likely to demonstrate a
narrowly economic view of the firm than are the ‘Start-up’ firms.
Hypothesis 3c. With respect to CSV, ‘Mature’ firms are perceived to be more likely to demonstrate
“jointness of interest” than are the ‘Growth’ firms.

31
Table 4: Relationship Between Mature Firms And Business-Stakeholder Engagement Models
Business-Stakeholder Engagement Models
CSR
CSV VAS
• More Narrowly Economic View of the Firm
• Less Cooperative Strategic Posture
• Less Jointness of Interest
• More Narrowly Economic View of the Firm
• More Cooperative Strategic Posture
• More Jointness of Interest
• Less Narrowly Economic View of the Firm
• More Cooperative Strategic Posture
• More Jointness of Interest
Organizational Life Cycle
Stage
MATURE
FIRM
!
3.2.4 Decline Stage
According to Miller and Friesen (1984) at this stage, the innovation level of firms reaches its low
and profit margins decline, as consumers do not demand the products or services. At this stage,
organizations are threatened about their survival (Jawahar & McLaughlin, 2001). They experience
reduction in the market share with limited or expensive funding opportunities (Black, 1998). The
shareholders and board of directors largely favor preservation of the company resources instead of
keeping customers as their priority (Miller & Friesen, 1984).
According to Bonn and Pettigrew (2009), the ‘decline’ stage consists of different issues faced by
organizations than those in the other OLC stages. For instance, the firms belonging to this stage are
large in size, but have less innovative and diversified product and service offerings (Wang & Singh,
2014). These firms also face the challenge of getting merged or acquired in order to manage their
losses (Jawahar & McLaughlin, 2001).
32
Our proposed study of firms at different OLC stages inclining toward various paradigms of
business-stakeholder engagement does not include the ‘decline’ stage of the firm. We exclude it
because of practical constraints of obtaining information from their representative sample groups. The
self-reporting approach of categorizing firms at different organizational stages also showed
insignificant response from firms belonging to this stage (Kallunki & Silvola, 2008).
It is to be noted that the above discussions on OLC (start-up, growth, mature, and decline) stages of
business firms are not limited to the ICT-sector. Yet, in order to make more complete sense of the
theoretical rationale for this research project, we decided to conduct exploratory studies to advance
these learning in the context of ICT-sector (see Chapter 4).

33
Chapter 4 Research Method
4.1 Overview Of The Studies
Our research method followed a pragmatists’ worldview (Creswell, 2009). We applied mixed
technique (both qualitative and quantitative methods) to collect data through exploratory field
research (referred as ‘Phase-1’) and then expanded on it with structured survey design study
(indicated as ‘Phase-2’).
As an initial step toward testing the outlined hypotheses in Chapter 3, it is important to find a
common meaning of terminologies used in research publications and by business practitioners. We
conducted our study’s exploratory phase (Phase-1) by conducting a systematic, semi-structured
interview protocol, called, repertory grid methodology with a mix of open and closed ended questions
to a conveniently selected set of respondents.
In Phase-2 of our research, we expanded on Phase-1 findings through a survey design study. It
allowed us to either support or reject the proposed hypotheses empirically. Having multiple data
collection methods help in condensing methodological weaknesses and attaining internal, external
validity (Singleton & Straits, 1993; Chatman & Flynn, 2005; Merriam, 1998; Creswell, 2009; Yin,
2009).
4.2 Phase-1: Exploratory Field Study
In Phase-1 of our exploratory research study, we worked with the perceived value-creating
scenarios about business-stakeholders, elicited by sample experts associated with the ICT-sector,
including scholars and practitioners from the region of Southern Ontario, Canada. In addition to that,
our Phase-2 of research focused on how a sample of practitioners from the ICT-sector in North

34
America – belonging to start-up, growth and mature OLC stages – perceived various characteristics of
stakeholder ‘value-creation’.
Figure 1: Overview Of Phase-1 Research Design
Figure 1 elaborates on the face-to-face interview design study that engaged a total of eighteen (18)
ICT-sector experts11. We used internet-scanning technique to identify potential respondents for this
11 The details about the recruitment processes are given in Sections 4.2.1 and 5.1 of this document.
Qualitative / Quantitative Exploratory Study
Demographics Section 3
Gather
background information of respondents.
Ensure adherence to the outlined
research inclusion and
exclusion criteria.
OLC Stages Section 4
Enlist
important differentiators
of various OLC stages.
RepGrid Section 5
Elicit ‘Value-
Creating’ constructs for
various stakeholders by ICT sector
firms at different OLC developmental
stages.
Instructions Sections 1 & 2
State the
purpose of the research study along-with the
given instructions. Seek formal consent from
the participants, adhering to the research ethics requirements.
Models Section 6
Capture
respondents’ perceptions
about the key tenets of business-
stakeholder engagement
models.
PHASE 1 — FACE-TO-FACE INTERVIEWS
DATA ANALYSES
Perform repertory grid idiographic and nomothetic data analyses to identify the key ‘Value-Creating’ constructs from the study. Conduct content analysis to define ICT-
sector OLC developmental stages.
Recruitment Identification of 18 ICT Sector Experts
3 scholars & 3 practitioners from start-up, growth, and mature OLC stages each.

35
phase. Sections 1 and 2 of the designed study protocol were dedicated to explaining the purpose of
the study to the respondents and placing the instructions for the respondents to follow during the
interview respectively. Questions in Section 3 focused on the background information to justify with
our inclusion / exclusion criteria of participants recruitment. Section 4 looked at extracting key
differentiators between various OLC stages, including start-up, growth, small-to-medium, mature and
decline stage for-profit firms. Section 5 of the protocol systematically followed a repertory grid
technique to elicit value-creating constructs (‘value-scenarios’) by firms for their business
stakeholders. Section 6 focused on establishing the ‘older’ versus ‘newer’ paradigms of various
business-stakeholder engagement models as perceived by the respondents12.
In summary, Phase-1 exploratory study enabled us to:
1) Consider the extent of meaningfulness of various stakeholder groups in terms of ‘value-
creation’ as suggested by the stakeholder theory,
2) Notice differences in constructs as they find useful for describing the start-up, growth and
mature stages of organizational life cycle (OLC), and
3) Make a decision about whether to go with ‘normative-interest’ versus ‘vested-interest’
judgments in designing our successive empirical studies.
4.2.1 Sample Selection
Our criteria for inclusion of respondents in the study comprise: (1) of two expert groups; scholars
and practitioners, (2) specializing in the domain of mobile, software, Internet, media, and social
interaction technologies, (3) doing so from the region of Southern Ontario (Canada). These specific
industries were chosen from a broader ICT spectrum because of their significant impact on
sustainable development of businesses and the economic development of many societies (Tapscott & 12 See the interview protocol in Appendix A for more details.
36
Williams, 2012). We believed that, by narrowing our focus on a particular industry, the participants
may more consistently perceive the meaning associated with both internal and external stakeholders.
A fourth criterion of inclusion was to recruit our participants from start-up, growth and mature OLC
stages according to the rules outlined by Miller and Friesen (1984), and Kallunki and Silvola (2008).
We also considered that by incorporating both, theory-based and industry-based views, we could
present a more holistic picture about how firms at multiple stages of development respond to
stakeholder ‘value-creation’.
Prior to engaging our participants, the preliminary background check of all participants was done
through Internet scanning (for further details see Noriega, 2013). After carefully identifying the
companies and scholars that fit our criteria through professional social web platforms, an e-mail
invitation was exchanged with them. Once our invitation was accepted, a face-to-face interview of
hour duration was scheduled at their convenient time and place.
4.2.2 Repertory Grid
Repertory grid is a technique originally developed by George Kelly (1955), a personal construct
psychologist. He did this to investigate people’s behavior without influencing their references for
diagnosing complex matters that required expert knowledge (Eden & Jones, 1984; Bannister &
Fransella, 1986; Hisrich & Jankowicz, 1990; Easterby-Smith et al., 1996; Hunter & Beck, 2000; Diaz
De Leon & Guild, 2003; Gaines & Shaw, 2003; Jankowicz, 2004; Fransella & Bannister, 2004;
Caputi et al., 2011). The personal construct psychology (PCP) has the comprehensiveness that
enables a researcher to explore the construing of both, individuals and groups. This theory is widely
applied in the fields of counseling, psychotherapy, clinical practice, understanding of culture and
society, and study of organizations (Winter, 1992; Scheer & Sewell, 2006; Neimeyer, 2009;
Cummins, 2006; Dobosz, 2003; Raja et al., 2013).
37
This probing technique was relevant to our investigation as it allowed us to systematically
incorporate personal views of ICT-sector business experts in understanding ‘value-scenarios’ for their
stakeholders. Raja et al. (2013) used a similar study design to understanding customers’ views on
integrated products and service and the related value-in-use. To all intents and purposes, a systematic
technique like repertory grid helped us in developing paths between ‘elements’ (which in our case
were the ‘stakeholders’) and the objective of the study (which was to understand ‘value-scenarios’
through various personal ‘constructs’). These ‘constructs’ were generally described as ideas
expressing perceptions of the participants for making sense of ‘elements’ introduced by the researcher
(Bjorklund, 2008; Jankowicz, 2004).
The repertory grid technique required a question to be presented in a particular way to the study
participants. In our study, the question for the practitioner participant group stated, “in terms of your
firm creating value for stakeholders, how are two of this triad of elements similar to each other and
different from the third”? The question description was slightly modified to suit the scholar
participant group, which stated, “in terms of a firm most familiar to you creating value for its
stakeholders, how are two of this triad of elements similar to each other and different from the third”?
The same question was posed to the participants belonging to the start-up, growth and mature OLC
stages. We conducted these repertory grid interviews and generated various levels of analyses using
the Repertory Grid’s version 5 enterprise software package that we refer to as Rep 5 here onwards
(Gaines & Shaw, 2010).
4.2.3 Element Selection
Elements in this study were purposefully selected, which allowed us to analyze multiple partial
repertory grids together (Shaw, 1980). Offering the elements to participants also ensured the
researchers’ control over the interview goals (Stewart et al., 1981). It was advised to include at least
38
one set of nine discrete and homogenous elements – covering both sides of the defining boundary
while working with elements (Easterby-Smith, 1980; Stewart et al., 1981; Bjorklund, 2008).
Following this strategy in our study, a total of nine business stakeholders were identified as elements
and were allocated as customers, financiers, communities, suppliers, employees, environment,
government, trade associations, and non-governmental organizations (NGOs). This chosen set
showed a balanced representation of both internal / external, primary / secondary, as well as economic
/ non-economic stakeholders that was intended to allow us to capture a broader view of a standard
technology-driven business organization creating value for a variety of stakeholders.
4.2.4 Construct Elicitation
The data in a repertory grid were recorded when a participant provided two bi-polar anchors to a
construct on a continuum of 1 to 9. This was done after reviewing three randomly drawn elements
(triadic elicitation) – categorizing two of the elements similar to each other while differentiating them
from the third. The participant was then asked to name the property defining the two similar elements.
This construct was anchored at one pole while the respondent was again asked to name the opposite
pole with a contrasting extreme. A ‘laddering’ technique was used to further understand the theme
behind the elicited constructs. This was for the purpose of reducing any compounded attributes. Next
the remaining elements were then rated on each elicited bi-polar construct continuum of 1 to 9 (where
the similarity pole was anchored at 1 and the different pole at 9). This process was repeated until all
the elements were exhausted or respondents ran out of fresh constructs (Diaz De Leon & Guild, 2003;
Bjorklund, 2008; Shah, 2011; Day, 2013).
39
4.2.5 Reliability And Validity Of Repertory Grids
Considering the reliability and validity of using repertory grids for exploratory studies has been an
important topic of discussion in the literature. A recent article by Edwards et al. (2009) explained
about the role of repertory grids to attain high-level face, content and construct validity (especially, in
the case of partial repertory grid designs where the researchers supplied elements and elicited
constructs). This was because the content of the grids emerged directly from the study participants.
They also discussed that repertory grid technique supported the reliability issue of internal
consistency due to its ability to reveal significant correlations among the elicited constructs. However,
the test-re-test reliability issue remained questionable when using repertory grids for exploratory
research designs. This notion was consistent with Kelly’s original claim that human beings were
constantly evolving and test-retest reliability measure showed how a person had developed (or not)
over time (Diaz De Leon & Guild, 2003; Edwards et al., 2009; Day, 2013). By using repertory grids,
we may not fully duplicate the findings when replicating the same study, but that may allow the
advancement of new learning about the research question under exploration (Edwards et al., 2009).
4.2.6 Phase-1 Interview Protocol
The interview protocol in Phase-1 was designed for an hour-long meeting with the participants and
it included open-ended, partially open-ended and close-ended questions (see Table 5 & Appendix A).
A hard copy of the interview protocol was also provided to the participant during the meeting. They
were given the option to write their answers for open-ended or partially open-ended questions
themselves or let the graduate researcher take notes.
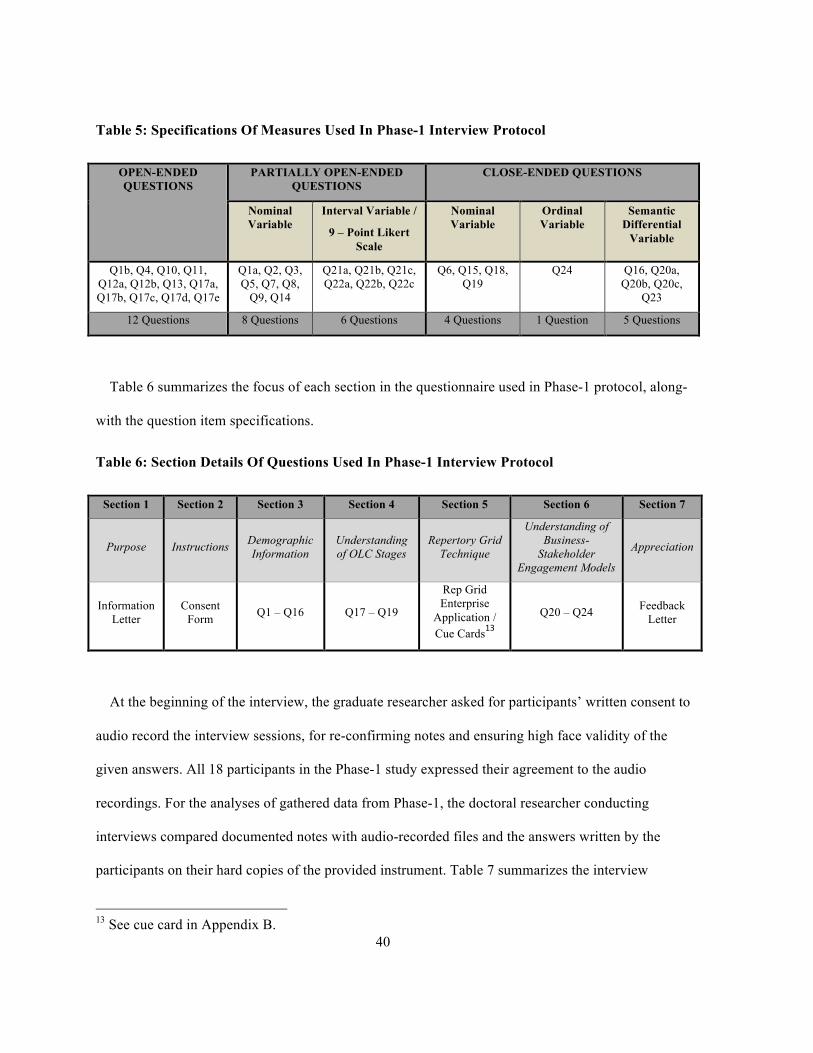
40
Table 5: Specifications Of Measures Used In Phase-1 Interview Protocol
OPEN-ENDED QUESTIONS
PARTIALLY OPEN-ENDED QUESTIONS
CLOSE-ENDED QUESTIONS
Nominal Variable
Interval Variable /
9 – Point Likert Scale
Nominal Variable
Ordinal Variable
Semantic Differential
Variable
Q1b, Q4, Q10, Q11, Q12a, Q12b, Q13, Q17a, Q17b, Q17c, Q17d, Q17e
Q1a, Q2, Q3, Q5, Q7, Q8,
Q9, Q14
Q21a, Q21b, Q21c, Q22a, Q22b, Q22c
Q6, Q15, Q18, Q19
Q24 Q16, Q20a, Q20b, Q20c,
Q23
12 Questions 8 Questions 6 Questions 4 Questions 1 Question 5 Questions
Table 6 summarizes the focus of each section in the questionnaire used in Phase-1 protocol, along-
with the question item specifications.
Table 6: Section Details Of Questions Used In Phase-1 Interview Protocol
Section 1 Section 2 Section 3 Section 4 Section 5 Section 6 Section 7
Purpose Instructions Demographic Information
Understanding of OLC Stages
Repertory Grid Technique
Understanding of Business-
Stakeholder Engagement Models
Appreciation
Information Letter
Consent Form Q1 – Q16 Q17 – Q19
Rep Grid Enterprise
Application / Cue Cards13
Q20 – Q24 Feedback Letter
At the beginning of the interview, the graduate researcher asked for participants’ written consent to
audio record the interview sessions, for re-confirming notes and ensuring high face validity of the
given answers. All 18 participants in the Phase-1 study expressed their agreement to the audio
recordings. For the analyses of gathered data from Phase-1, the doctoral researcher conducting
interviews compared documented notes with audio-recorded files and the answers written by the
participants on their hard copies of the provided instrument. Table 7 summarizes the interview
13 See cue card in Appendix B.
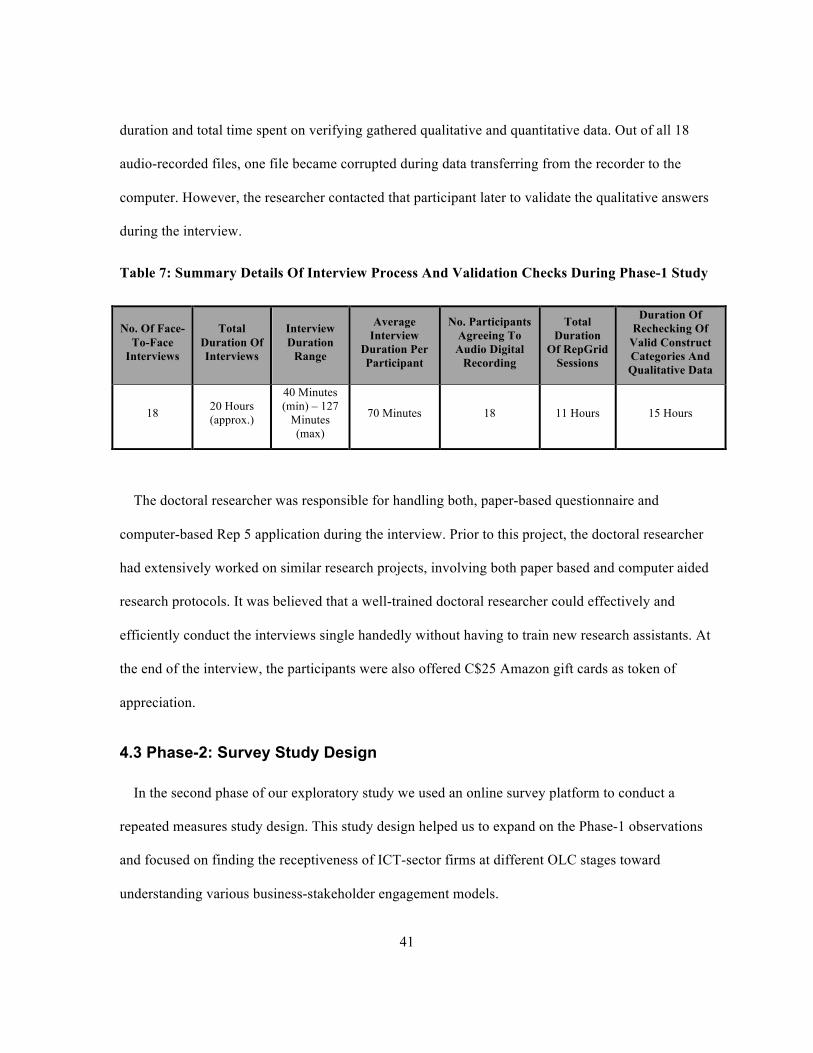
41
duration and total time spent on verifying gathered qualitative and quantitative data. Out of all 18
audio-recorded files, one file became corrupted during data transferring from the recorder to the
computer. However, the researcher contacted that participant later to validate the qualitative answers
during the interview.
Table 7: Summary Details Of Interview Process And Validation Checks During Phase-1 Study
No. Of Face-To-Face
Interviews
Total Duration Of Interviews
Interview Duration
Range
Average Interview
Duration Per Participant
No. Participants Agreeing To Audio Digital
Recording
Total Duration
Of RepGrid Sessions
Duration Of Rechecking Of
Valid Construct Categories And Qualitative Data
18 20 Hours (approx.)
40 Minutes (min) – 127
Minutes (max)
70 Minutes 18 11 Hours 15 Hours
The doctoral researcher was responsible for handling both, paper-based questionnaire and
computer-based Rep 5 application during the interview. Prior to this project, the doctoral researcher
had extensively worked on similar research projects, involving both paper based and computer aided
research protocols. It was believed that a well-trained doctoral researcher could effectively and
efficiently conduct the interviews single handedly without having to train new research assistants. At
the end of the interview, the participants were also offered C$25 Amazon gift cards as token of
appreciation.
4.3 Phase-2: Survey Study Design
In the second phase of our exploratory study we used an online survey platform to conduct a
repeated measures study design. This study design helped us to expand on the Phase-1 observations
and focused on finding the receptiveness of ICT-sector firms at different OLC stages toward
understanding various business-stakeholder engagement models.
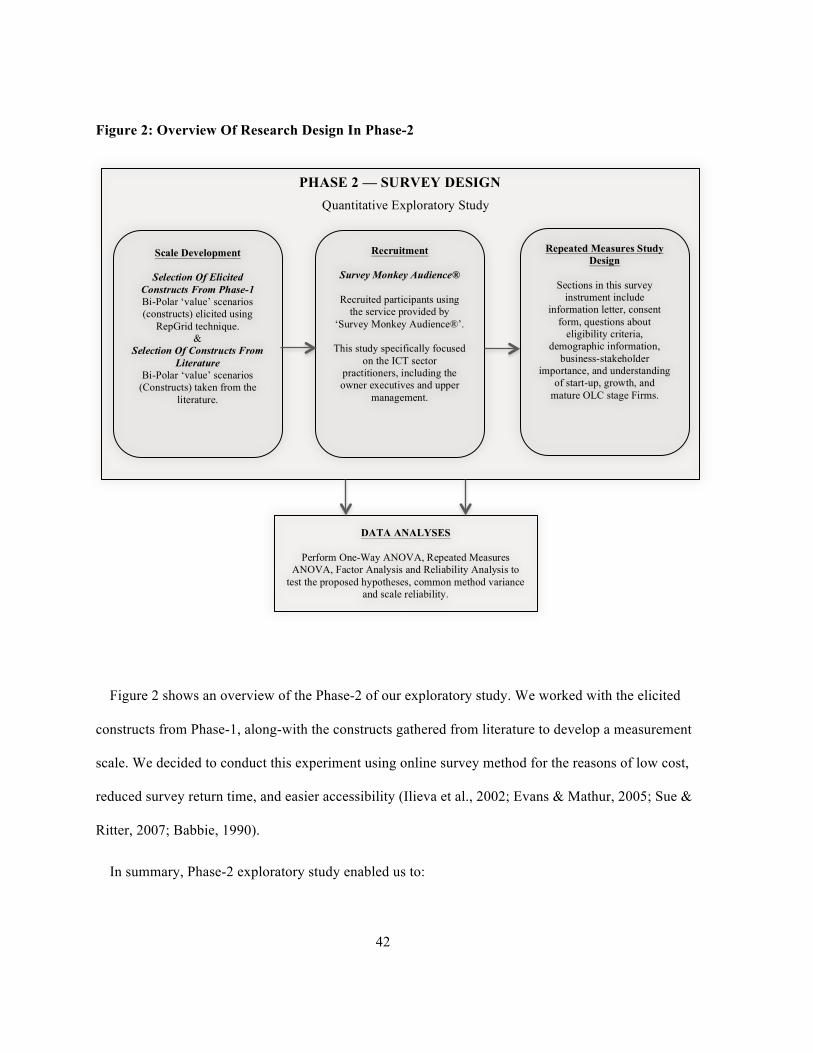
42
Figure 2: Overview Of Research Design In Phase-2
Figure 2 shows an overview of the Phase-2 of our exploratory study. We worked with the elicited
constructs from Phase-1, along-with the constructs gathered from literature to develop a measurement
scale. We decided to conduct this experiment using online survey method for the reasons of low cost,
reduced survey return time, and easier accessibility (Ilieva et al., 2002; Evans & Mathur, 2005; Sue &
Ritter, 2007; Babbie, 1990).
In summary, Phase-2 exploratory study enabled us to:
Quantitative Exploratory Study
Repeated Measures Study Design
Sections in this survey
instrument include information letter, consent
form, questions about eligibility criteria,
demographic information, business-stakeholder
importance, and understanding of start-up, growth, and
mature OLC stage Firms.
PHASE 2 — SURVEY DESIGN
DATA ANALYSES
Perform One-Way ANOVA, Repeated Measures ANOVA, Factor Analysis and Reliability Analysis to
test the proposed hypotheses, common method variance and scale reliability.
Scale Development
Selection Of Elicited Constructs From Phase-1 Bi-Polar ‘value’ scenarios (constructs) elicited using
RepGrid technique. &
Selection Of Constructs From Literature
Bi-Polar ‘value’ scenarios (Constructs) taken from the
literature.
Recruitment
Survey Monkey Audience®
Recruited participants using the service provided by
‘Survey Monkey Audience®’.
This study specifically focused on the ICT sector
practitioners, including the owner executives and upper
management.
43
1) Test our proposed hypotheses about ICT-sector firms at three OLC stages (start-up,
growth, mature) creating ‘value’ for their stakeholders,
2) Evaluate internal consistency of the measurement scale developed after Phase-1 to capture
business-stakeholder engagement ‘value’, and
3) Develop well-directed questions about Stakeholder and OLC theories for further research
in the light of gathered evidence.
4.3.1 Measurement Scale And Survey Instrument Development
The development of the measurement scale for this stage (Phase-2) is based on the new learning
from Phase-1 study and the existing concepts from the relevant literature (see Chapter 3). The
approach to use what was already available from literature along-with the findings of exploratory
studies, a well established approach in the scale development literature (Churchill, 1979; Strauss &
Cobin, 1990). In this section, we presented our rationale behind the structure of the questionnaire and
the measurement scales used in the study.
Our focus of inquiry was limited to only three ICT-sector firm developmental phases, viz., start-up,
growth, and mature stages – henceforth, we started with the scale items already developed by
Kallunki and Silvola (2008, page 77-78), and the demographic section developed by Noriega (2013).
The sequence and wordings of relevant items used in that scale were modified to match the purpose
of our research. We also excluded the items related with the ‘activity-based costing’ in the instrument
developed by Kallunki and Silvola (2008).
A repeated measures survey protocol, with multiple items scale was designed, requiring less than
15 minutes of participant’s engagement. It included open-ended, partially open-ended and close-
ended questions (see Table 8 & Appendix E). Following the requirements from the office of research
ethics (ORE) involving human participants, a detailed information letter was provided to the
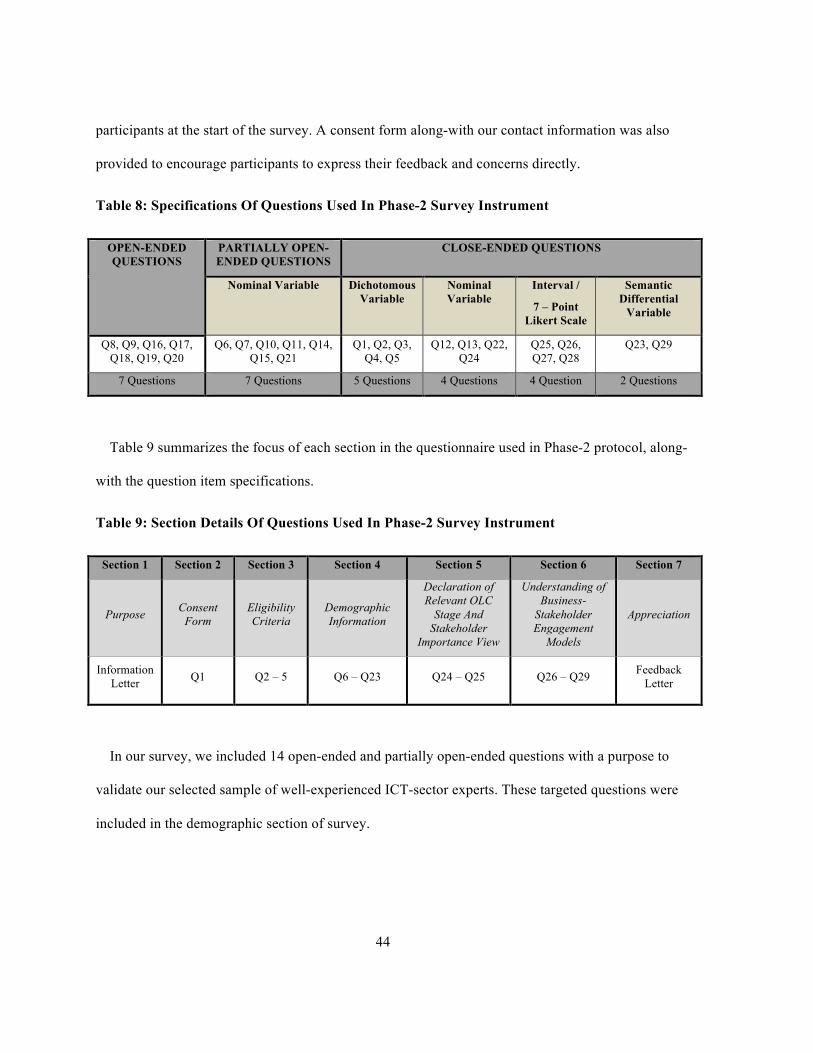
44
participants at the start of the survey. A consent form along-with our contact information was also
provided to encourage participants to express their feedback and concerns directly.
Table 8: Specifications Of Questions Used In Phase-2 Survey Instrument
OPEN-ENDED QUESTIONS
PARTIALLY OPEN-ENDED QUESTIONS
CLOSE-ENDED QUESTIONS
Nominal Variable Dichotomous Variable
Nominal Variable
Interval /
7 – Point Likert Scale
Semantic Differential
Variable
Q8, Q9, Q16, Q17, Q18, Q19, Q20
Q6, Q7, Q10, Q11, Q14, Q15, Q21
Q1, Q2, Q3, Q4, Q5
Q12, Q13, Q22, Q24
Q25, Q26, Q27, Q28
Q23, Q29
7 Questions 7 Questions 5 Questions 4 Questions 4 Question 2 Questions
Table 9 summarizes the focus of each section in the questionnaire used in Phase-2 protocol, along-
with the question item specifications.
Table 9: Section Details Of Questions Used In Phase-2 Survey Instrument
Section 1 Section 2 Section 3 Section 4 Section 5 Section 6 Section 7
Purpose Consent Form
Eligibility Criteria
Demographic Information
Declaration of Relevant OLC
Stage And Stakeholder
Importance View
Understanding of Business-
Stakeholder Engagement
Models
Appreciation
Information Letter Q1 Q2 – 5 Q6 – Q23 Q24 – Q25 Q26 – Q29 Feedback
Letter
In our survey, we included 14 open-ended and partially open-ended questions with a purpose to
validate our selected sample of well-experienced ICT-sector experts. These targeted questions were
included in the demographic section of survey.
45
4.3.2 Sample Selection
Our criteria for inclusion of respondents in Phase-2 of the study comprise of participants: (1)
physically located in the region of United States of America, (2) affiliated, either full-time or part-
time, with a for-profit business organization, (3) affiliated with an Information and Communications
Technology (ICT) sector organization, specializing in any of the domains of mobile, software,
hardware, Internet, social interaction, and media related technology, (4) affiliated with a firm that
operates in the region of United States of America, and (5) be at least 18 years old.
For this exploratory phase, we were interested in recruiting owner executives and senior
management individuals at the ICT-sector firms fulfilling our inclusion / exclusion criteria to
participate. The range of targeted respondents included, CEOs, directors, assistant directors, and
company managers. We hired paid services of SurveyMonkey Audience® (SMA) to recruit an
approximate sample of 150 participants who fulfilled our required criteria. With an objective of
reducing error variance associated with differences among individuals and increasing statistical power
of our results, a repeated measures survey study was designed.
In Phase-2, one major consideration influenced our decision to hire a paid recruitment service was
Canada’s new anti-spam legislation (CASL), which prohibits researchers from sending study
recruitment e-mails without recipients’ consent. To receive consent from relevant firms’ gatekeepers
about their employees participating in the study was believed to be impractical and time consuming.
Therefore, to ensure respondents’ anonymity, privacy, confidentiality and random selection of sample
from the focused population, we decided not to continue with convenience samples by recruiting
students or personal contacts. Alternatively, the option of hiring a reliable and externally valid online
recruitment service was selected. According to Brandon et al. (2014), SMA is classified as one of the
effective non-traditional online participant recruitment platforms – specializing in recruiting targeted
46
and externally valid audience for academic research studies14. They (Brandon et al., 2014) also argued
that the survey instrument must be simple, easily understandable and not very lengthy to be effective
for tools like SMA.
We followed a set procedure of requesting a quotation from SMA in Phase-2, which is based on
survey length, targeting criteria and number of fully completed responses. We provided our study’s
web-link to their representative, along-with the outlined recruitment criteria and an approximate
number of 150 fully completed responses for an accurate cost and time estimation. The project was
estimated at a total cost of USD 2,437.50 (i.e. USD 16.25 per completed response) with an expected
survey completion time of less than15 minutes. SMA used their partner company CINT, to administer
our project as they deal with more specialized pools of participants15. Two project managers from
SMA were assigned to overlook the project progress. The online survey collection remained open for
24 days (from February 4 to February 27, 2015). Two e-mail reminders were sent with a 10-day gap
to encourage potential participants – one on February 14 and the next on February 25, 2015 (see
Figure 3). On March 1, 2015, the researcher closed the project with SMA, as the list of potential
respondents was fully exhausted. The respondents were given an incentive of up to USD 5 by CINT
(SMA’s partner firm) for this survey. As per their reward policy, the respondents had the options to 1)
donate their earnings to charity, 2) take it in cash via PayPal, or 3) use it for online purchases. Such
14 For more details about alternative platforms to SMA, see Brandon et al. (2014). The readers can also review various advantages, disadvantages, and comparative details about SMA, Qualtrics and Amazon’s Mechanical Turk (AMT) as effective online recruitment services in the context of behavioural accounting research. 15 Visit the following URL for more information about online research guidelines of CINT, a specialized recruitment platform partnered with SMA: http://clearslide.com/view/mail?iID=JUNR4WTHLYTL93V7HJB6
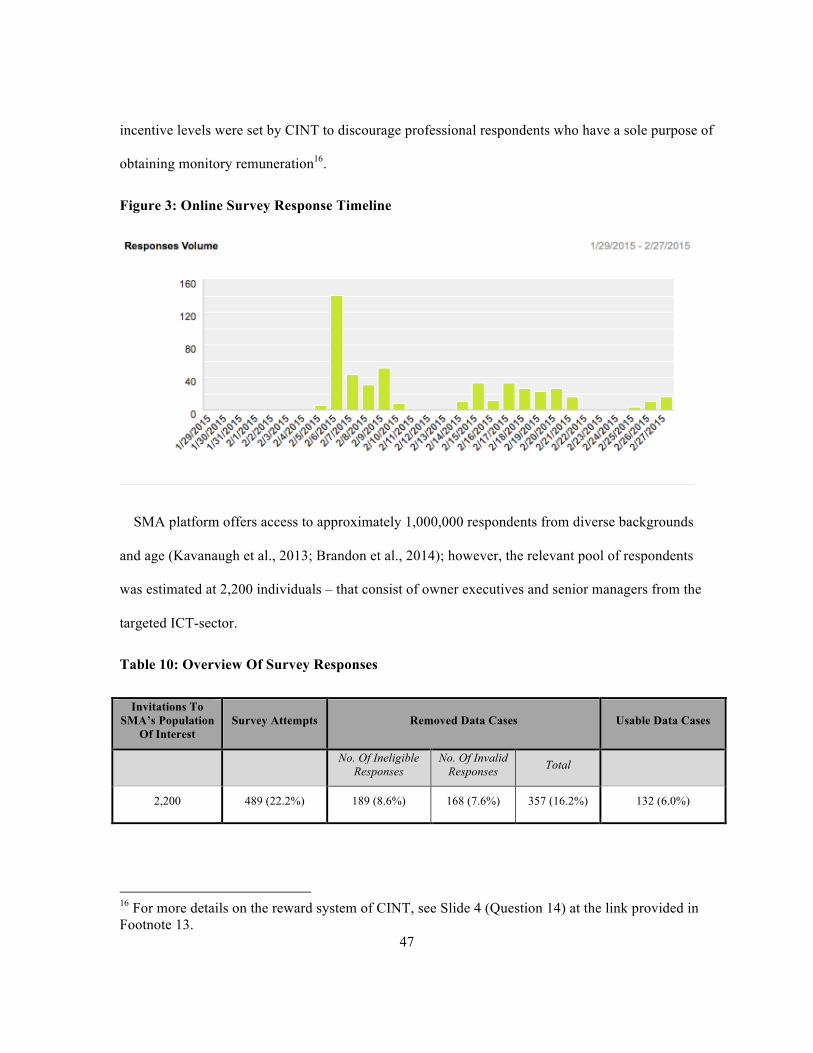
47
incentive levels were set by CINT to discourage professional respondents who have a sole purpose of
obtaining monitory remuneration16.
Figure 3: Online Survey Response Timeline
SMA platform offers access to approximately 1,000,000 respondents from diverse backgrounds
and age (Kavanaugh et al., 2013; Brandon et al., 2014); however, the relevant pool of respondents
was estimated at 2,200 individuals – that consist of owner executives and senior managers from the
targeted ICT-sector.
Table 10: Overview Of Survey Responses
Invitations To SMA’s Population
Of Interest Survey Attempts Removed Data Cases Usable Data Cases
No. Of Ineligible Responses
No. Of Invalid Responses Total
2,200 489 (22.2%) 189 (8.6%) 168 (7.6%) 357 (16.2%) 132 (6.0%)
16 For more details on the reward system of CINT, see Slide 4 (Question 14) at the link provided in Footnote 13.
48
The overall response rate of this survey was 22.2% with 489 response attempts, which is consistent
with the findings of a study conducted by Sheehan (2001), showing the average response rate to be
decreasing with the increase of online data collection17. Out of these 489 attempts, 189 were
considered ineligible following our eligibility questionnaire at the beginning of the instrument. These
respondents did not proceed further than the Eligibility Section of the survey. The remaining 300
respondents were than vetted on the grounds of incomplete data and nonsensical responses with the
help of two SMA project managers. The criteria for excluding responses at this stage were based on
invalid characters and information provided in the demographic section of the questionnaire, which
was purposefully designed to confirm the validity of responses (Section 4.3.1). As a result, a total of
132 fully completed respondents were considered usable for data analyses (see Table 10).
4.3.3 Validity And Reliability Of Phase-2 Study Design
This section is focused on acknowledging the issues related with reliability and validity of Phase-2
research design. In an effort to maintain quality of scientific research process and its findings, we
took certain measures for designing and administering the survey study. We also understand that the
objective of conducting Phase-2 study was to further explore the perceptions of ICT-sector experts
from the United States of America toward various business-stakeholder engagement models. In terms
of generalizability, we do not claim that the findings from this study would become generalizable to
other ICT-sector settings or industries. However, we believe that the results from Phase-2 exploratory
study would equip us to conduct more controlled confirmatory studies in future with an objective to
further enhance the internal validity, but at the same time conduct it with a more generalizable
inclusion / exclusion criteria to provide better externally valid results.
17 In year 2000, the mean response rate of e-mail surveys dropped to 24% from a 61.5% response rate in year 1986.
49
According to Campbell and Stanley (1963), several external factors can produce confounded
effects that undermine the inferences from experimental design research studies. Ferguson (2004)
suggested that strict controls for the purpose of improving internal validity of research could
compromise the findings’ generalizability. Therefore, we tried to address the issues of external
validity, along-with strategies to measure and control for internal validity to infer stronger and valid
research results. By randomly selecting the sample from a representative population of senior ICT-
sector practitioners does not resolve the external validity issue (Cook & Campbell, 1979; Singleton &
Straits, 1993). In our study design we acknowledge that there was little ecological control – limiting
the ability to generalize research findings.
For the purpose of ensuring construct validity, we provided definitions of the three OLC stages,
along-with the characterization about various organizational stakeholders in the survey. One of the
main purposes of conducting Phase-1 study was to identify more valid definitions of the constructs
for further analysis in Phase-2. The three OLC conditions and the dependent variables in our survey
were presented to the respondents in a random order. We pre-tested our survey instrument on a
similar sample of representation to further improve the instrument and clarify potential ambiguities in
its wordings. Following the suggestion by Shadish et al. (2002), we refrained from using wording that
could result in an expected and desirable outcome. In terms of addressing the issue of reliability, we
have clearly stated the rules of inclusion / exclusion of participation, along-with step-by-step process
details of conducting Phase-1 and Phase-2 studies.
In addition to the issues of validity and reliability of study results in research like ours, we further
tested the results for having significant common method biases that are generally associated with
similar behavioral studies (discussed in Chapter 6, Section 6.3). According to Podsakoff et al. (2003),
research method biases create systematic errors in the research results, which affect the validity of
research results. In their (Podsakodd et al., 2003) list of potential causes of biases in social research,

50
common ‘method rater effects’, ‘item characteristic effects’, ‘item context effects’, and ‘measurement
context effects’ are discussed18. To deal with the problem of social desirability, we provided our
respondents with an option to skip any question. We also ensured our participants that their identities
will be kept confidential and anonymous. To account for any serious limitations posed by common
method bias, we applied a widely used Harman’s single-factor technique to test our results (discussed
in Section 6.3).
18 See the summary of potential sources of common method biases by Padsakoff et al. (2003) for more details. In this list with some sub-items are more prominent and relevant to our study than others.
51
Chapter 5 Findings Of Phase-1: Exploratory Field Study
In our first phase of research exploration, we elicited value-creating constructs gathered from
scholars and practitioners from the start-up, growth, and mature OLC stage ICT-sector firms. The
purpose was to investigate the perceived emergent constructs about ICT-sector firms creating ‘value’
for various primary and secondary organizational stakeholders. In this chapter we present idiographic
and nomothetic results gathered from the study. These are distributed over five sections. First section
provides descriptive characteristics of Phase-1 study participants (Section 5.1). Second section
assesses the repertory grid idiographic data analyses (Section 5.2). Third section evaluates the
repertory grid nomothetic data analyses (Section 5.3). Fourth section presents the differentiating
characteristics between start-up, growth, and mature OLC stages (Section 5.4). Fifth section
summarizes the discussion of the overall Phase-1 results (Section 5.5).
5.1 Participants
Our study included a heterogeneous sample of eighteen ICT-sector business ‘scholars’ and
‘practitioners’, persons who were specialized in mobile, software, hardware, media and social
interaction technological domains. These inclusion criteria were purposefully followed to comprise
adult respondents from the region of Southern Ontario, participants who self-stated their association
with one of the three selected OLC stages for our study.
For the ‘scholars’ group, nine graduate students from the programs related to computer sciences,
business administration, social innovation, and technological entrepreneurship were selected for the
interview with three participants representing each of the start-up, growth and mature developmental
stages. Similarly, another group of nine senior level practitioners were interviewed from the ICT-
52
sector with three participants characterizing each of the start-up, growth and mature stages. A
demographic descriptive detail about our sample groups can be seen in Table 11.
According to the literature, the use of the repertory grid technique often necessitates operating with
a relatively small sample size to elicit adequate unique constructs for a study (Botterill & Crompton,
1996; Tan & Hunter, 2002; Naoi et al., 2006). This approach has proven to be useful in further
developing research instruments, such as survey questionnaires for conducting studies that were
suited for larger sample sizes (Tan & Hunter, 2002).
5.2 Repertory Grid Idiographic Data Analyses
We have performed idiographic analyses to understand how experts (scholars and practitioners)
from the ICT-sector – representing the start-up, growth and mature OLC stages – perceived the notion
of creating ‘value’ for their perceived range of stakeholders. Individual level hierarchical cluster
analysis was conducted to focus on how each participant grouped their constructs and elements
together. Then we conducted principal component analysis, along with studying the percentage of
variance accounted for by the first factor (PVAFF) to determine the cognitive complexity of our study
participants.
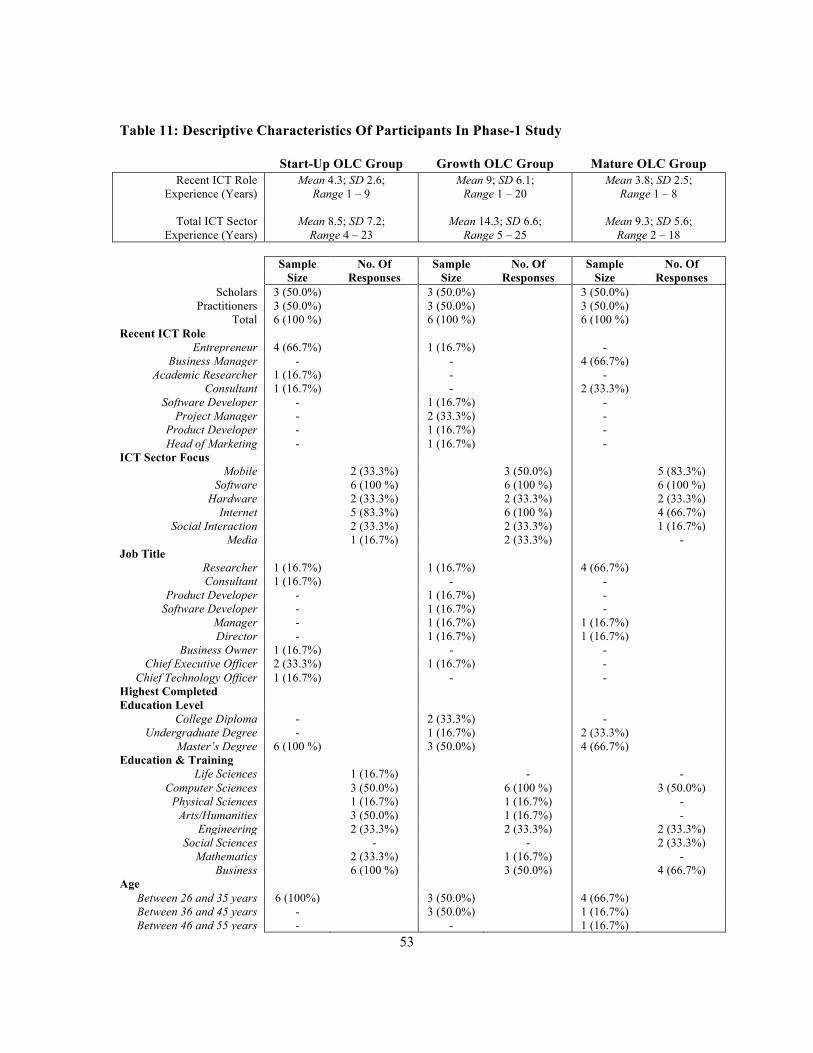
53
Table 11: Descriptive Characteristics Of Participants In Phase-1 Study
Start-Up OLC Group Growth OLC Group Mature OLC Group Recent ICT Role
Experience (Years) Mean 4.3; SD 2.6;
Range 1 – 9 Mean 9; SD 6.1;
Range 1 – 20 Mean 3.8; SD 2.5;
Range 1 – 8
Total ICT Sector Experience (Years)
Mean 8.5; SD 7.2; Range 4 – 23
Mean 14.3; SD 6.6; Range 5 – 25
Mean 9.3; SD 5.6; Range 2 – 18
Sample
Size No. Of
Responses Sample
Size No. Of
Responses Sample
Size No. Of
Responses Scholars 3 (50.0%) 3 (50.0%) 3 (50.0%)
Practitioners 3 (50.0%) 3 (50.0%) 3 (50.0%) Total 6 (100 %) 6 (100 %) 6 (100 %)
Recent ICT Role Entrepreneur 4 (66.7%) 1 (16.7%) -
Business Manager - - 4 (66.7%) Academic Researcher 1 (16.7%) - -
Consultant 1 (16.7%) - 2 (33.3%) Software Developer - 1 (16.7%) -
Project Manager - 2 (33.3%) - Product Developer - 1 (16.7%) - Head of Marketing - 1 (16.7%) -
ICT Sector Focus Mobile 2 (33.3%) 3 (50.0%) 5 (83.3%)
Software 6 (100 %) 6 (100 %) 6 (100 %) Hardware 2 (33.3%) 2 (33.3%) 2 (33.3%)
Internet 5 (83.3%) 6 (100 %) 4 (66.7%) Social Interaction 2 (33.3%) 2 (33.3%) 1 (16.7%)
Media 1 (16.7%) 2 (33.3%) - Job Title
Researcher 1 (16.7%) 1 (16.7%) 4 (66.7%) Consultant 1 (16.7%) - -
Product Developer - 1 (16.7%) - Software Developer - 1 (16.7%) -
Manager - 1 (16.7%) 1 (16.7%) Director - 1 (16.7%) 1 (16.7%)
Business Owner 1 (16.7%) - - Chief Executive Officer 2 (33.3%) 1 (16.7%) -
Chief Technology Officer 1 (16.7%) - - Highest Completed Education Level
College Diploma - 2 (33.3%) - Undergraduate Degree - 1 (16.7%) 2 (33.3%)
Master’s Degree 6 (100 %) 3 (50.0%) 4 (66.7%) Education & Training
Life Sciences 1 (16.7%) - - Computer Sciences 3 (50.0%) 6 (100 %) 3 (50.0%)
Physical Sciences 1 (16.7%) 1 (16.7%) - Arts/Humanities 3 (50.0%) 1 (16.7%) -
Engineering 2 (33.3%) 2 (33.3%) 2 (33.3%) Social Sciences - - 2 (33.3%)
Mathematics 2 (33.3%) 1 (16.7%) - Business 6 (100 %) 3 (50.0%) 4 (66.7%)
Age Between 26 and 35 years 6 (100%) 3 (50.0%) 4 (66.7%) Between 36 and 45 years - 3 (50.0%) 1 (16.7%) Between 46 and 55 years - - 1 (16.7%)
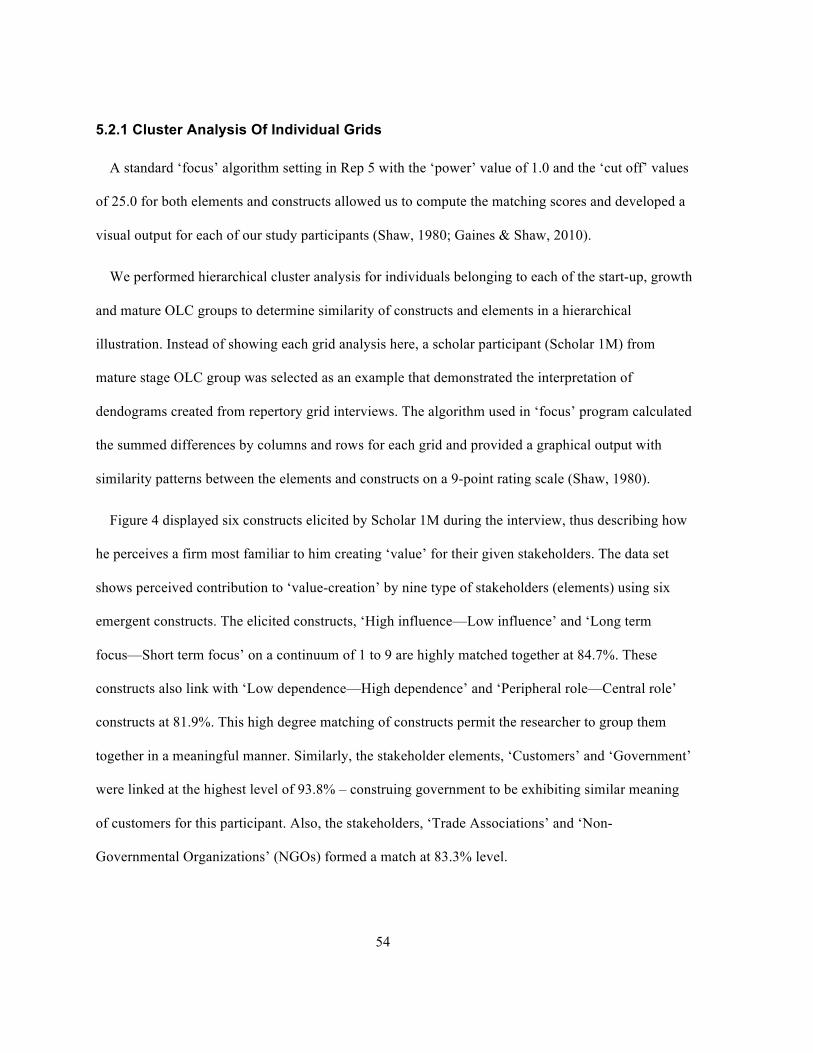
54
5.2.1 Cluster Analysis Of Individual Grids
A standard ‘focus’ algorithm setting in Rep 5 with the ‘power’ value of 1.0 and the ‘cut off’ values
of 25.0 for both elements and constructs allowed us to compute the matching scores and developed a
visual output for each of our study participants (Shaw, 1980; Gaines & Shaw, 2010).
We performed hierarchical cluster analysis for individuals belonging to each of the start-up, growth
and mature OLC groups to determine similarity of constructs and elements in a hierarchical
illustration. Instead of showing each grid analysis here, a scholar participant (Scholar 1M) from
mature stage OLC group was selected as an example that demonstrated the interpretation of
dendograms created from repertory grid interviews. The algorithm used in ‘focus’ program calculated
the summed differences by columns and rows for each grid and provided a graphical output with
similarity patterns between the elements and constructs on a 9-point rating scale (Shaw, 1980).
Figure 4 displayed six constructs elicited by Scholar 1M during the interview, thus describing how
he perceives a firm most familiar to him creating ‘value’ for their given stakeholders. The data set
shows perceived contribution to ‘value-creation’ by nine type of stakeholders (elements) using six
emergent constructs. The elicited constructs, ‘High influence—Low influence’ and ‘Long term
focus—Short term focus’ on a continuum of 1 to 9 are highly matched together at 84.7%. These
constructs also link with ‘Low dependence—High dependence’ and ‘Peripheral role—Central role’
constructs at 81.9%. This high degree matching of constructs permit the researcher to group them
together in a meaningful manner. Similarly, the stakeholder elements, ‘Customers’ and ‘Government’
were linked at the highest level of 93.8% – construing government to be exhibiting similar meaning
of customers for this participant. Also, the stakeholders, ‘Trade Associations’ and ‘Non-
Governmental Organizations’ (NGOs) formed a match at 83.3% level.
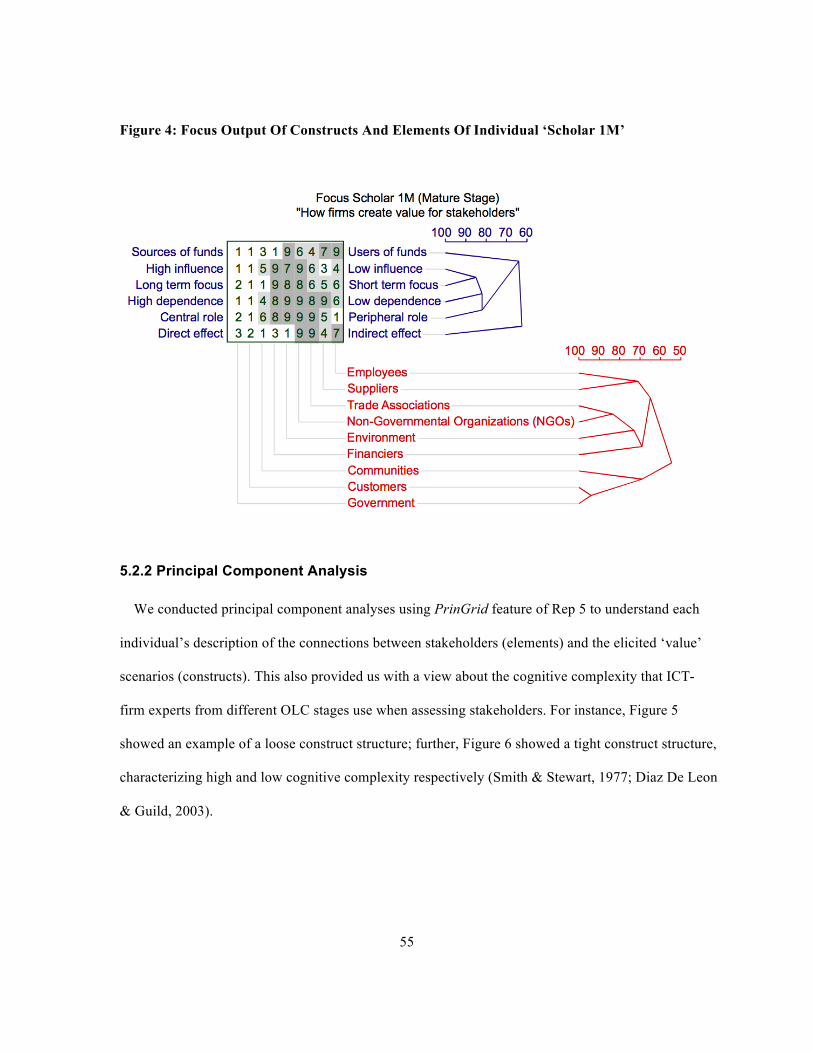
55
Figure 4: Focus Output Of Constructs And Elements Of Individual ‘Scholar 1M’
5.2.2 Principal Component Analysis
We conducted principal component analyses using PrinGrid feature of Rep 5 to understand each
individual’s description of the connections between stakeholders (elements) and the elicited ‘value’
scenarios (constructs). This also provided us with a view about the cognitive complexity that ICT-
firm experts from different OLC stages use when assessing stakeholders. For instance, Figure 5
showed an example of a loose construct structure; further, Figure 6 showed a tight construct structure,
characterizing high and low cognitive complexity respectively (Smith & Stewart, 1977; Diaz De Leon
& Guild, 2003).
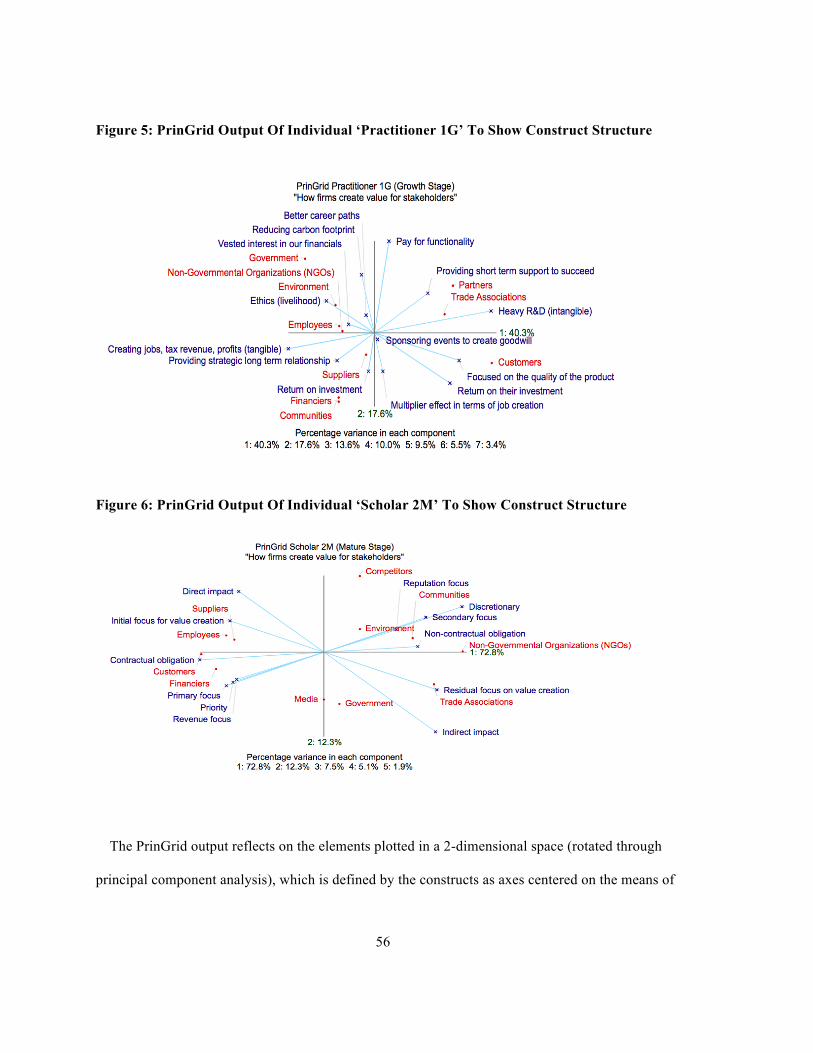
56
Figure 5: PrinGrid Output Of Individual ‘Practitioner 1G’ To Show Construct Structure
Figure 6: PrinGrid Output Of Individual ‘Scholar 2M’ To Show Construct Structure
The PrinGrid output reflects on the elements plotted in a 2-dimensional space (rotated through
principal component analysis), which is defined by the constructs as axes centered on the means of
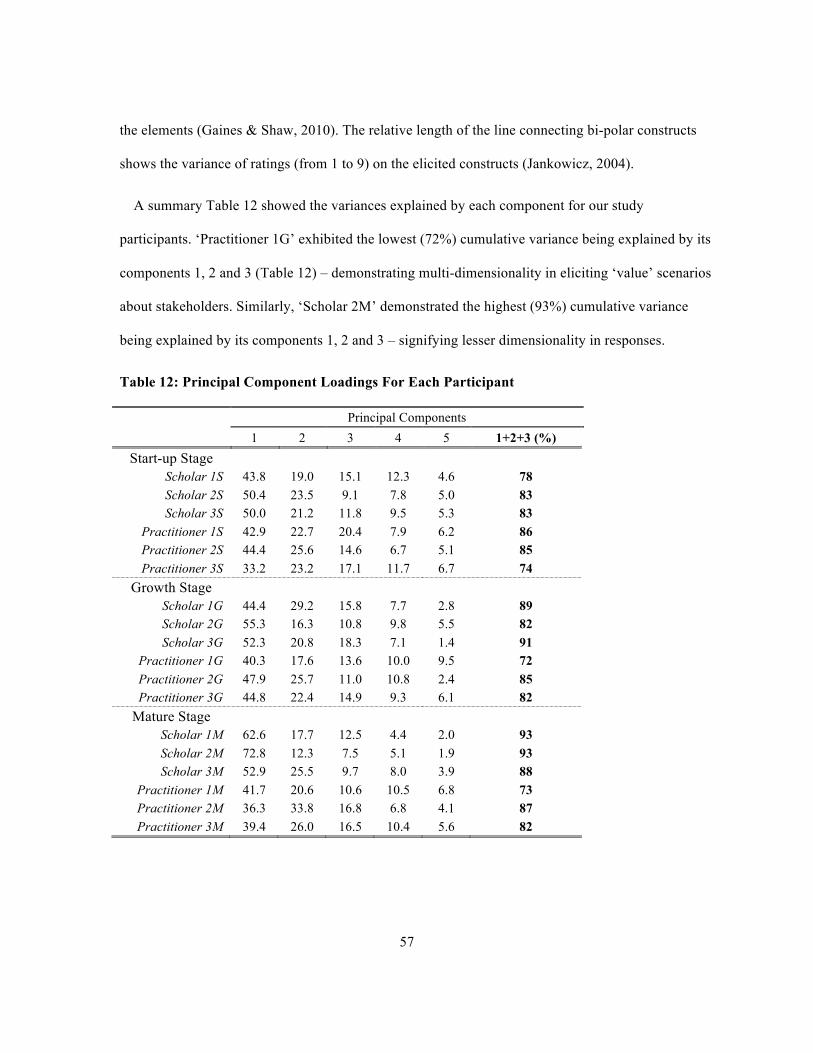
57
the elements (Gaines & Shaw, 2010). The relative length of the line connecting bi-polar constructs
shows the variance of ratings (from 1 to 9) on the elicited constructs (Jankowicz, 2004).
A summary Table 12 showed the variances explained by each component for our study
participants. ‘Practitioner 1G’ exhibited the lowest (72%) cumulative variance being explained by its
components 1, 2 and 3 (Table 12) – demonstrating multi-dimensionality in eliciting ‘value’ scenarios
about stakeholders. Similarly, ‘Scholar 2M’ demonstrated the highest (93%) cumulative variance
being explained by its components 1, 2 and 3 – signifying lesser dimensionality in responses.
Table 12: Principal Component Loadings For Each Participant
Principal Components 1 2 3 4 5 1+2+3 (%)
Start-up Stage Scholar 1S 43.8 19.0 15.1 12.3 4.6 78 Scholar 2S 50.4 23.5 9.1 7.8 5.0 83 Scholar 3S 50.0 21.2 11.8 9.5 5.3 83
Practitioner 1S 42.9 22.7 20.4 7.9 6.2 86 Practitioner 2S 44.4 25.6 14.6 6.7 5.1 85 Practitioner 3S 33.2 23.2 17.1 11.7 6.7 74
Growth Stage Scholar 1G 44.4 29.2 15.8 7.7 2.8 89 Scholar 2G 55.3 16.3 10.8 9.8 5.5 82 Scholar 3G 52.3 20.8 18.3 7.1 1.4 91
Practitioner 1G 40.3 17.6 13.6 10.0 9.5 72 Practitioner 2G 47.9 25.7 11.0 10.8 2.4 85 Practitioner 3G 44.8 22.4 14.9 9.3 6.1 82
Mature Stage Scholar 1M 62.6 17.7 12.5 4.4 2.0 93 Scholar 2M 72.8 12.3 7.5 5.1 1.9 93 Scholar 3M 52.9 25.5 9.7 8.0 3.9 88
Practitioner 1M 41.7 20.6 10.6 10.5 6.8 73 Practitioner 2M 36.3 33.8 16.8 6.8 4.1 87 Practitioner 3M 39.4 26.0 16.5 10.4 5.6 82
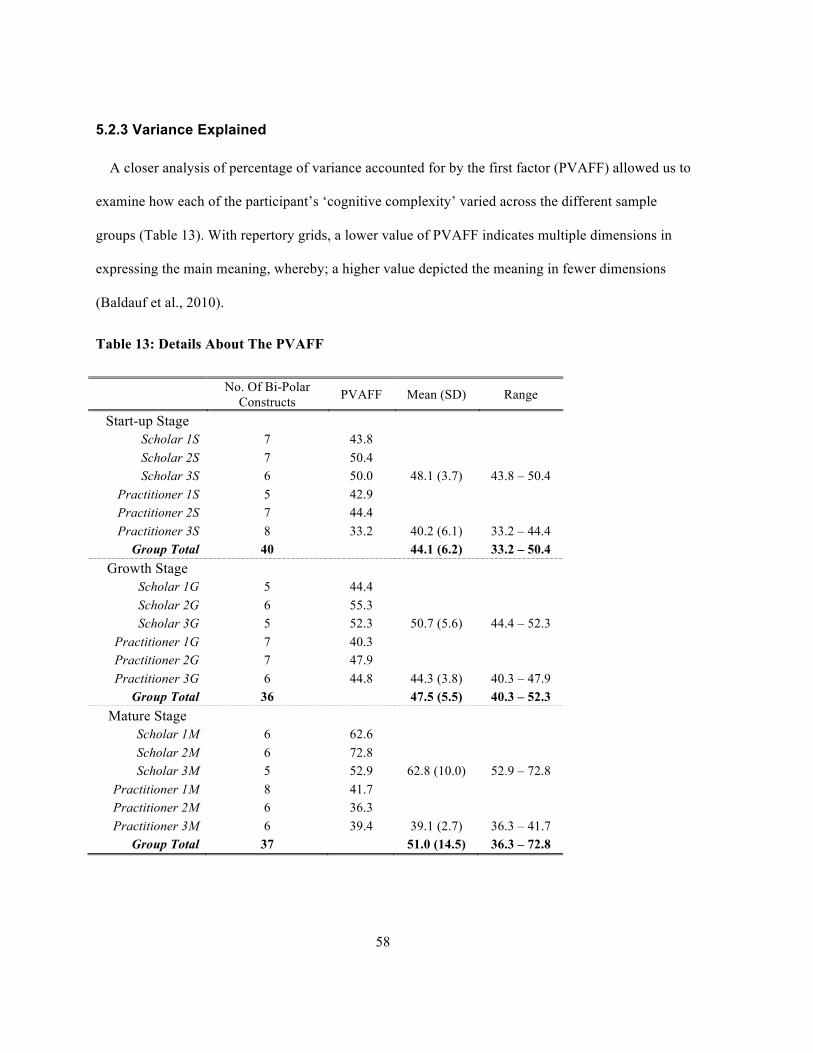
58
5.2.3 Variance Explained
A closer analysis of percentage of variance accounted for by the first factor (PVAFF) allowed us to
examine how each of the participant’s ‘cognitive complexity’ varied across the different sample
groups (Table 13). With repertory grids, a lower value of PVAFF indicates multiple dimensions in
expressing the main meaning, whereby; a higher value depicted the meaning in fewer dimensions
(Baldauf et al., 2010).
Table 13: Details About The PVAFF
No. Of Bi-Polar Constructs PVAFF Mean (SD) Range
Start-up Stage Scholar 1S 7 43.8 Scholar 2S 7 50.4 Scholar 3S 6 50.0 48.1 (3.7) 43.8 – 50.4
Practitioner 1S 5 42.9 Practitioner 2S 7 44.4 Practitioner 3S 8 33.2 40.2 (6.1) 33.2 – 44.4
Group Total 40 44.1 (6.2) 33.2 – 50.4 Growth Stage
Scholar 1G 5 44.4 Scholar 2G 6 55.3 Scholar 3G 5 52.3 50.7 (5.6) 44.4 – 52.3
Practitioner 1G 7 40.3 Practitioner 2G 7 47.9 Practitioner 3G 6 44.8 44.3 (3.8) 40.3 – 47.9
Group Total 36 47.5 (5.5) 40.3 – 52.3 Mature Stage
Scholar 1M 6 62.6 Scholar 2M 6 72.8 Scholar 3M 5 52.9 62.8 (10.0) 52.9 – 72.8
Practitioner 1M 8 41.7 Practitioner 2M 6 36.3 Practitioner 3M 6 39.4 39.1 (2.7) 36.3 – 41.7
Group Total 37 51.0 (14.5) 36.3 – 72.8
59
Overall, the means of PVAFF for the scholars in the start-up, growth and mature group samples
were 48.1 (SD 3.7; Range 43.8 to 50.4), 50.7 (SD 5.6; Range 44.4 to 52.3), and 62.8 (SD 10.0, Range
52.0 to 72.8) respectively. Relative to the level of cognitive complexity of the grids in the
practitioners group, the means for the start-up, growth and mature groups turned out to be 40.2 (SD
6.1; Range 33.2 to 44.4), 44.3 (SD 3.8; Range 40.3 to 47.9), and 39.1 (SD 2.7; Range 36.3 to 41.7)
respectively. We take this to mean that individuals differ in their construction of the universe
according to the ‘individuality corollary’ of Personal Construct Psychology (PCP).
The variability of data across individuals portrayed idiosyncrasies of personal constructs that
allowed for knowledge acquisition according to the original perspective of ‘constructive
alternativism’ by George Kelly (Shaw & Gaines, 1982). It means that experience construes people’s
reality and redefinition of their constructs appraises their understanding of the universe (Kelly, 1955).
According to the ‘commonality corollary’ of Personal Construct Psychology (PCP), the variability in
individual responses should not stop us from analyzing them together as a group. Kelly (1955)
reasoned that unique constructs of individuals might be classified together according to the general
meaning associated based on their common considerations and features.
5.3 Repertory Grid Nomothetic Data Analyses
Subsequently, nomothetic analyses were conducted by combining the grids to reveal how the
participants in the start-up, growth and mature groups perceive ‘value’ scenarios for their
stakeholders. We aggregated the data for each of the start-up, growth and mature groups (comprising
of three scholars and three practitioners in each) by using the mode grid feature of the RepSocio
function in Rep 5.
60
5.3.1 Mode Grids Analyses
The purpose of these analyses was to find common constructs. The mode grids for each of the start-
up, growth and mature stage groups were computed using standard Rep 5 settings with a match level
‘cut off’ statistic of 78.0. As a result, mode constructs represented the overall perceptions of the
participants for common elements through the highest matched scores of the constructs in all grids
within that group at or above the pre-determined match level (Shaw, 1980; Yeung & Watkins, 2000;
Gaines & Shaw, 2010). According to Shaw (1980), mode grids are most helpful for examining the
relative positions, terms and values of the members of the groups under investigation. In Rep 5 we
can set the cut off threshold to any level; in this case, by selecting 78.0 as the cut off statistic, we were
able to elicit these mode constructs as the most representative ‘value’ scenarios of the start-up, growth
and mature OLC groups for their stakeholders. We take the perspective of analyzing each OLC group
separately to better understand the differentiating constructs among them. The gathered mode grid
does not represent a ‘consensus grid’ by merely averaging out the idiosyncrasies of individuals to
concoct an imitation of the group – instead it stipulates common interactions of group construing in a
strongly weighted manner (Shaw, 1980).
The graphical PrinGrid output of start-up group mode constructs (Figure 7) pre-dominantly
represented a single dimension, represented by four constructs (displayed on the horizontal axis) that
explained 88.1% of the calculated variance (Table 14). Similarly, the focus mode constructs output
(Figure 8) for the start-up group demonstrated matching of similar constructs and elements through a
hierarchical clustering technique. Reversed construct, ‘Practical—Academic’ linked strongly with
constructs ‘High influence—Low influence’ at 87.5% and with ‘Direct benefit of growth—Indirect
benefit of growth’ at 86.1% (Figure 8). Note that the focus algorithm reversed the construct
‘Academic—Practical’ in this case to determine the highest match with other constructs (Shaw, 1980;
Gaines & Shaw, 2010).
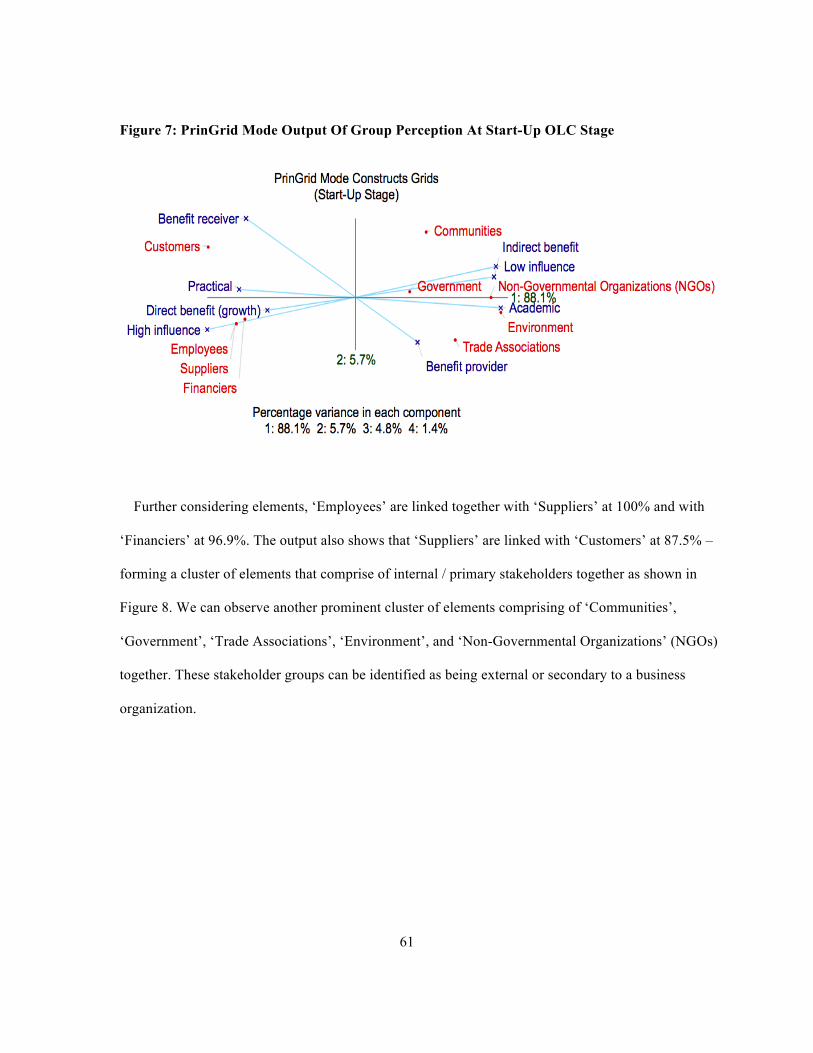
61
Figure 7: PrinGrid Mode Output Of Group Perception At Start-Up OLC Stage
Further considering elements, ‘Employees’ are linked together with ‘Suppliers’ at 100% and with
‘Financiers’ at 96.9%. The output also shows that ‘Suppliers’ are linked with ‘Customers’ at 87.5% –
forming a cluster of elements that comprise of internal / primary stakeholders together as shown in
Figure 8. We can observe another prominent cluster of elements comprising of ‘Communities’,
‘Government’, ‘Trade Associations’, ‘Environment’, and ‘Non-Governmental Organizations’ (NGOs)
together. These stakeholder groups can be identified as being external or secondary to a business
organization.

62
Figure 8: Focus Mode Output Of Group Perception At Start-Up OLC Stage
Table 14: Mode Constructs And Elements Of Group Perception At Start-Up OLC Stage
Percentage Variance In Each Component For Start-up Stage Firms 1 2 3 4
88.13 5.73 4.76 1.38 % 88.13 93.86 98.62 100.0 Cumulative %
Element (Stakeholder) Loadings On Each Component For Start-up Stage Firms 1 2 3
1 -1.56 -0.28 0.04 Employees 2 -1.92 0.57 -0.05 Customers 3 -1.44 -0.23 0.25 Financiers 4 -1.56 -0.28 0.04 Suppliers 5 0.90 0.73 -0.13 Communities 6 1.87 -0.16 0.40 Environment 7 0.69 0.08 -0.41 Government 8 1.75 0.02 0.50 Non-Governmental Organizations (NGOs) 9 1.28 -0.45 -0.65 Trade Associations
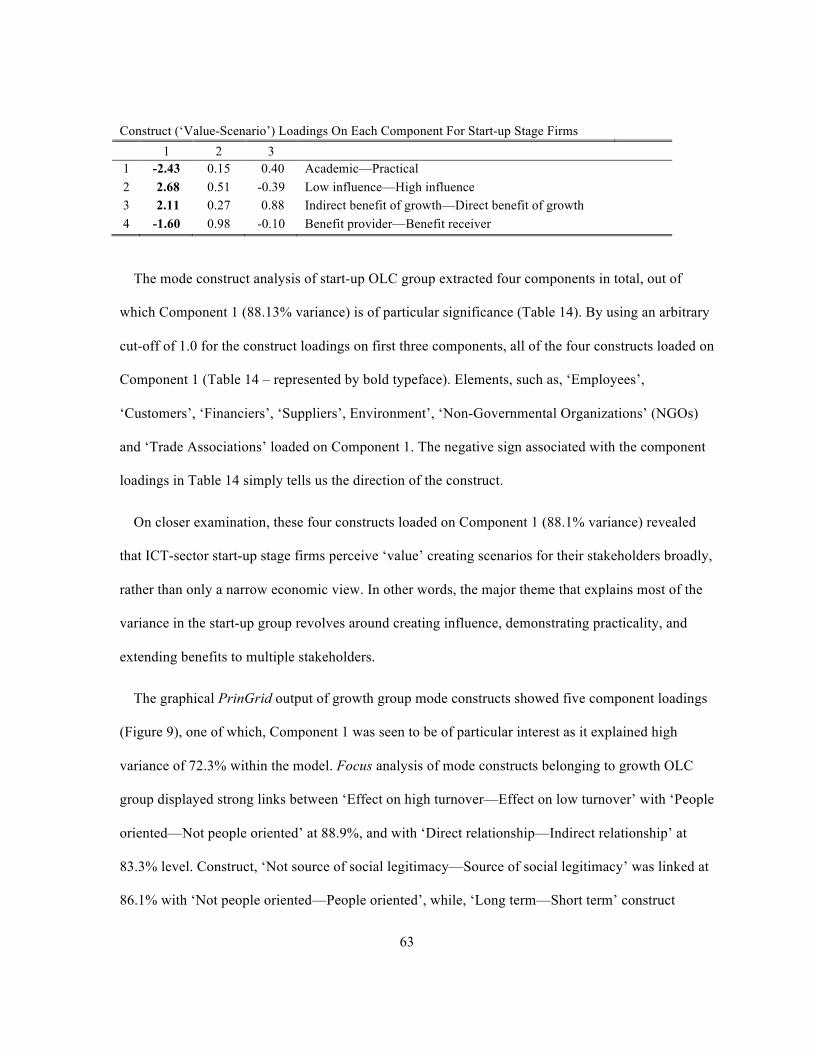
63
Construct (‘Value-Scenario’) Loadings On Each Component For Start-up Stage Firms 1 2 3
1 -2.43 0.15 0.40 Academic—Practical 2 2.68 0.51 -0.39 Low influence—High influence 3 2.11 0.27 0.88 Indirect benefit of growth—Direct benefit of growth 4 -1.60 0.98 -0.10 Benefit provider—Benefit receiver
The mode construct analysis of start-up OLC group extracted four components in total, out of
which Component 1 (88.13% variance) is of particular significance (Table 14). By using an arbitrary
cut-off of 1.0 for the construct loadings on first three components, all of the four constructs loaded on
Component 1 (Table 14 – represented by bold typeface). Elements, such as, ‘Employees’,
‘Customers’, ‘Financiers’, ‘Suppliers’, Environment’, ‘Non-Governmental Organizations’ (NGOs)
and ‘Trade Associations’ loaded on Component 1. The negative sign associated with the component
loadings in Table 14 simply tells us the direction of the construct.
On closer examination, these four constructs loaded on Component 1 (88.1% variance) revealed
that ICT-sector start-up stage firms perceive ‘value’ creating scenarios for their stakeholders broadly,
rather than only a narrow economic view. In other words, the major theme that explains most of the
variance in the start-up group revolves around creating influence, demonstrating practicality, and
extending benefits to multiple stakeholders.
The graphical PrinGrid output of growth group mode constructs showed five component loadings
(Figure 9), one of which, Component 1 was seen to be of particular interest as it explained high
variance of 72.3% within the model. Focus analysis of mode constructs belonging to growth OLC
group displayed strong links between ‘Effect on high turnover—Effect on low turnover’ with ‘People
oriented—Not people oriented’ at 88.9%, and with ‘Direct relationship—Indirect relationship’ at
83.3% level. Construct, ‘Not source of social legitimacy—Source of social legitimacy’ was linked at
86.1% with ‘Not people oriented—People oriented’, while, ‘Long term—Short term’ construct
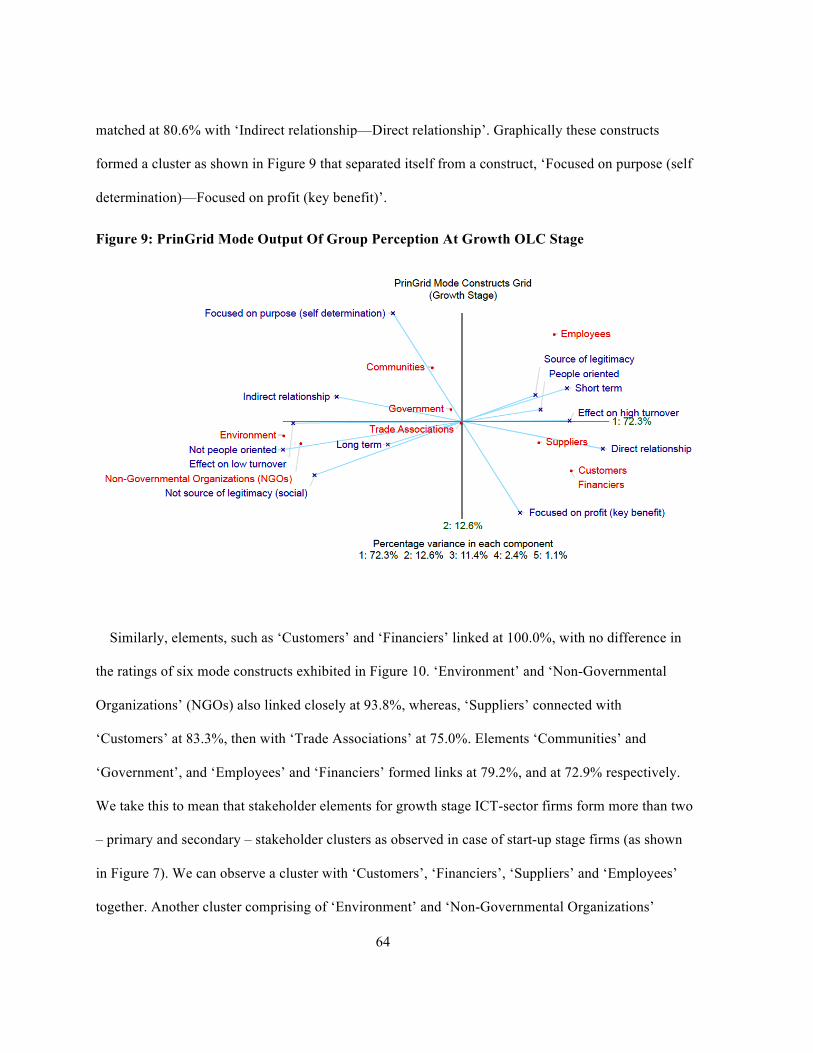
64
matched at 80.6% with ‘Indirect relationship—Direct relationship’. Graphically these constructs
formed a cluster as shown in Figure 9 that separated itself from a construct, ‘Focused on purpose (self
determination)—Focused on profit (key benefit)’.
Figure 9: PrinGrid Mode Output Of Group Perception At Growth OLC Stage
Similarly, elements, such as ‘Customers’ and ‘Financiers’ linked at 100.0%, with no difference in
the ratings of six mode constructs exhibited in Figure 10. ‘Environment’ and ‘Non-Governmental
Organizations’ (NGOs) also linked closely at 93.8%, whereas, ‘Suppliers’ connected with
‘Customers’ at 83.3%, then with ‘Trade Associations’ at 75.0%. Elements ‘Communities’ and
‘Government’, and ‘Employees’ and ‘Financiers’ formed links at 79.2%, and at 72.9% respectively.
We take this to mean that stakeholder elements for growth stage ICT-sector firms form more than two
– primary and secondary – stakeholder clusters as observed in case of start-up stage firms (as shown
in Figure 7). We can observe a cluster with ‘Customers’, ‘Financiers’, ‘Suppliers’ and ‘Employees’
together. Another cluster comprising of ‘Environment’ and ‘Non-Governmental Organizations’
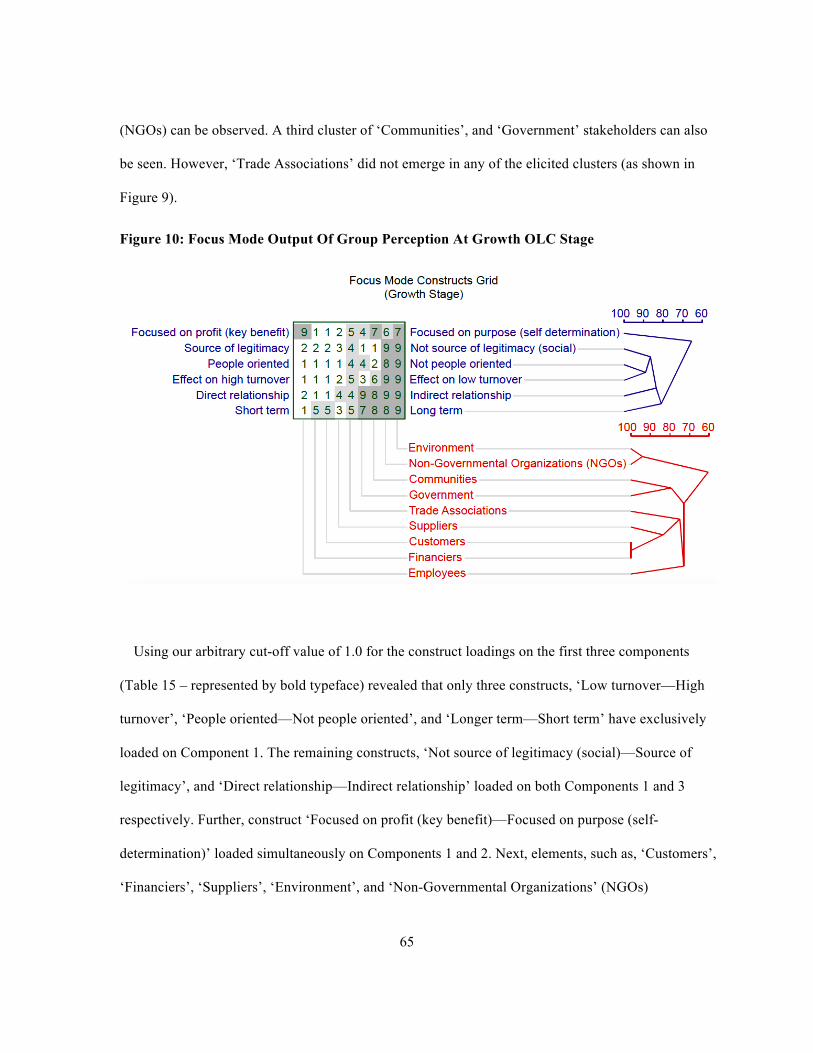
65
(NGOs) can be observed. A third cluster of ‘Communities’, and ‘Government’ stakeholders can also
be seen. However, ‘Trade Associations’ did not emerge in any of the elicited clusters (as shown in
Figure 9).
Figure 10: Focus Mode Output Of Group Perception At Growth OLC Stage
Using our arbitrary cut-off value of 1.0 for the construct loadings on the first three components
(Table 15 – represented by bold typeface) revealed that only three constructs, ‘Low turnover—High
turnover’, ‘People oriented—Not people oriented’, and ‘Longer term—Short term’ have exclusively
loaded on Component 1. The remaining constructs, ‘Not source of legitimacy (social)—Source of
legitimacy’, and ‘Direct relationship—Indirect relationship’ loaded on both Components 1 and 3
respectively. Further, construct ‘Focused on profit (key benefit)—Focused on purpose (self-
determination)’ loaded simultaneously on Components 1 and 2. Next, elements, such as, ‘Customers’,
‘Financiers’, ‘Suppliers’, ‘Environment’, and ‘Non-Governmental Organizations’ (NGOs)
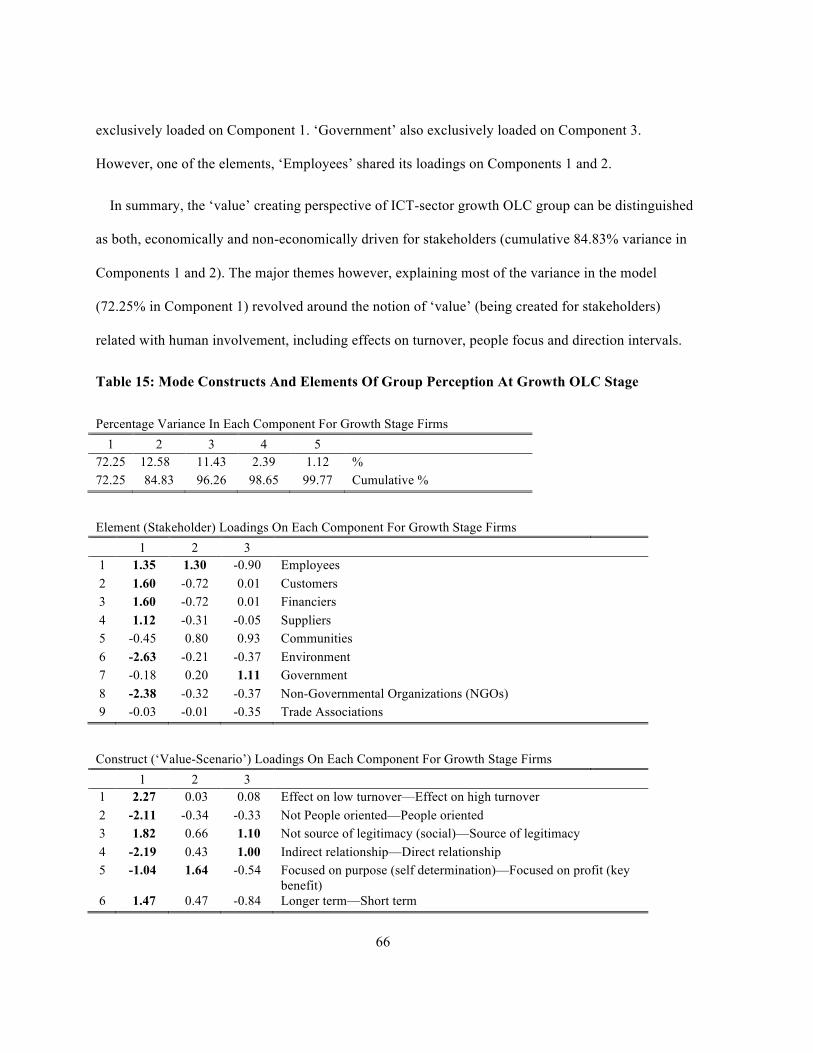
66
exclusively loaded on Component 1. ‘Government’ also exclusively loaded on Component 3.
However, one of the elements, ‘Employees’ shared its loadings on Components 1 and 2.
In summary, the ‘value’ creating perspective of ICT-sector growth OLC group can be distinguished
as both, economically and non-economically driven for stakeholders (cumulative 84.83% variance in
Components 1 and 2). The major themes however, explaining most of the variance in the model
(72.25% in Component 1) revolved around the notion of ‘value’ (being created for stakeholders)
related with human involvement, including effects on turnover, people focus and direction intervals.
Table 15: Mode Constructs And Elements Of Group Perception At Growth OLC Stage
Percentage Variance In Each Component For Growth Stage Firms 1 2 3 4 5
72.25 12.58 11.43 2.39 1.12 % 72.25 84.83 96.26 98.65 99.77 Cumulative %
Element (Stakeholder) Loadings On Each Component For Growth Stage Firms 1 2 3
1 1.35 1.30 -0.90 Employees 2 1.60 -0.72 0.01 Customers 3 1.60 -0.72 0.01 Financiers 4 1.12 -0.31 -0.05 Suppliers 5 -0.45 0.80 0.93 Communities 6 -2.63 -0.21 -0.37 Environment 7 -0.18 0.20 1.11 Government 8 -2.38 -0.32 -0.37 Non-Governmental Organizations (NGOs) 9 -0.03 -0.01 -0.35 Trade Associations
Construct (‘Value-Scenario’) Loadings On Each Component For Growth Stage Firms 1 2 3
1 2.27 0.03 0.08 Effect on low turnover—Effect on high turnover 2 -2.11 -0.34 -0.33 Not People oriented—People oriented 3 1.82 0.66 1.10 Not source of legitimacy (social)—Source of legitimacy 4 -2.19 0.43 1.00 Indirect relationship—Direct relationship 5 -1.04 1.64 -0.54 Focused on purpose (self determination)—Focused on profit (key
benefit) 6 1.47 0.47 -0.84 Longer term—Short term
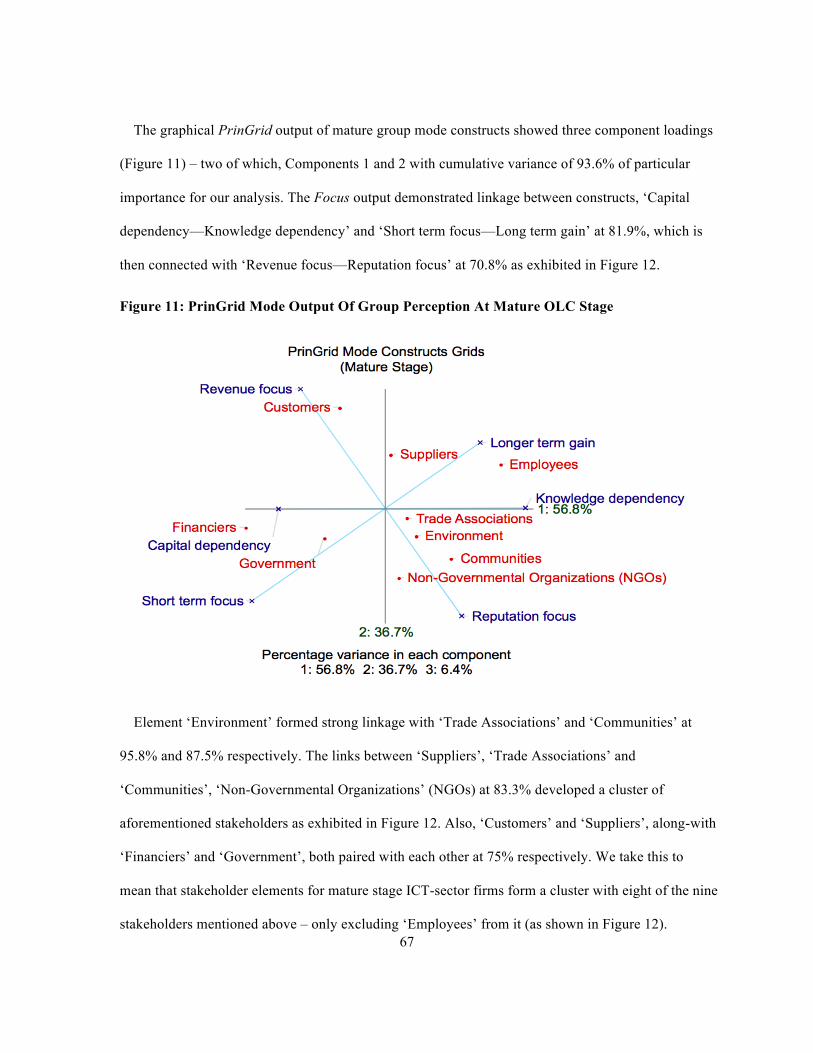
67
The graphical PrinGrid output of mature group mode constructs showed three component loadings
(Figure 11) – two of which, Components 1 and 2 with cumulative variance of 93.6% of particular
importance for our analysis. The Focus output demonstrated linkage between constructs, ‘Capital
dependency—Knowledge dependency’ and ‘Short term focus—Long term gain’ at 81.9%, which is
then connected with ‘Revenue focus—Reputation focus’ at 70.8% as exhibited in Figure 12.
Figure 11: PrinGrid Mode Output Of Group Perception At Mature OLC Stage
Element ‘Environment’ formed strong linkage with ‘Trade Associations’ and ‘Communities’ at
95.8% and 87.5% respectively. The links between ‘Suppliers’, ‘Trade Associations’ and
‘Communities’, ‘Non-Governmental Organizations’ (NGOs) at 83.3% developed a cluster of
aforementioned stakeholders as exhibited in Figure 12. Also, ‘Customers’ and ‘Suppliers’, along-with
‘Financiers’ and ‘Government’, both paired with each other at 75% respectively. We take this to
mean that stakeholder elements for mature stage ICT-sector firms form a cluster with eight of the nine
stakeholders mentioned above – only excluding ‘Employees’ from it (as shown in Figure 12).
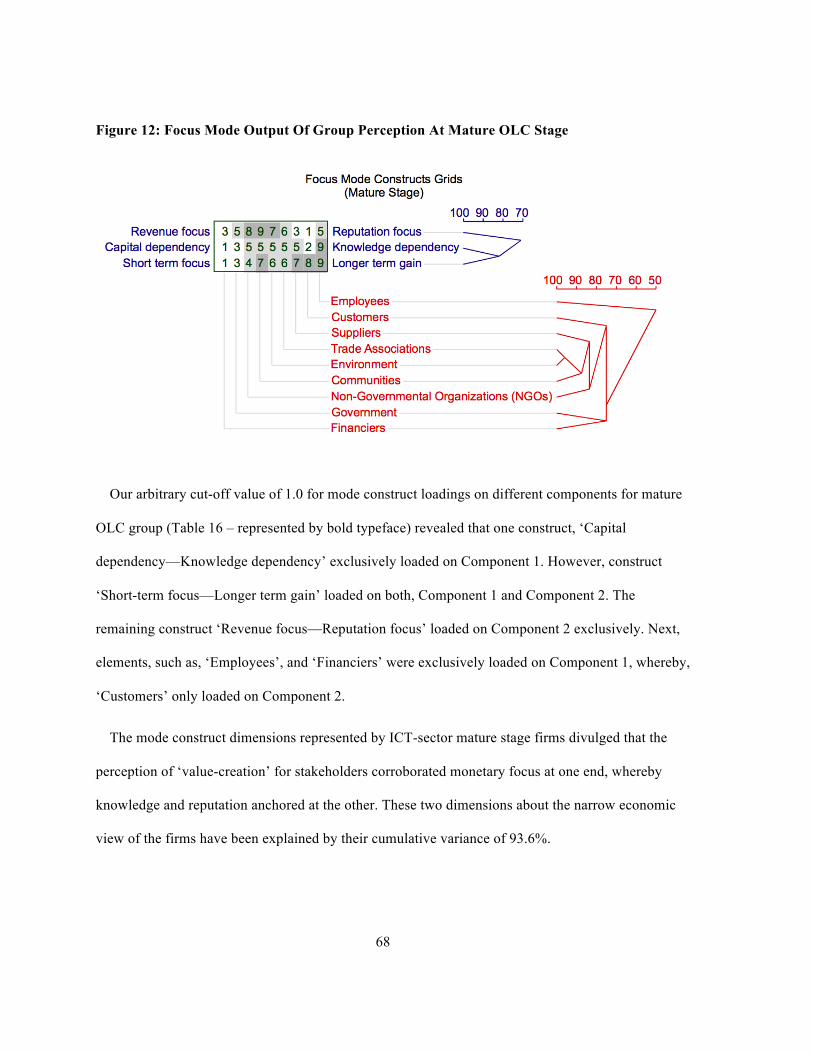
68
Figure 12: Focus Mode Output Of Group Perception At Mature OLC Stage
Our arbitrary cut-off value of 1.0 for mode construct loadings on different components for mature
OLC group (Table 16 – represented by bold typeface) revealed that one construct, ‘Capital
dependency—Knowledge dependency’ exclusively loaded on Component 1. However, construct
‘Short-term focus—Longer term gain’ loaded on both, Component 1 and Component 2. The
remaining construct ‘Revenue focus—Reputation focus’ loaded on Component 2 exclusively. Next,
elements, such as, ‘Employees’, and ‘Financiers’ were exclusively loaded on Component 1, whereby,
‘Customers’ only loaded on Component 2.
The mode construct dimensions represented by ICT-sector mature stage firms divulged that the
perception of ‘value-creation’ for stakeholders corroborated monetary focus at one end, whereby
knowledge and reputation anchored at the other. These two dimensions about the narrow economic
view of the firms have been explained by their cumulative variance of 93.6%.

69
Table 16: Mode Constructs And Elements Of Group Perception At Mature OLC Stage
Percentage Variance In Each Component For Mature Stage Firms 1 2 3
56.82 36.74 6.43 % 56.82 93.57 100.0 Cumulative %
Element (Stakeholder) Loadings On Each Component For Mature Stage Firms 1 2 3
1 1.24 0.53 0.42 Employees 2 -0.51 1.19 -0.38 Customers 3 -1.52 -0.22 0.20 Financiers 4 0.05 0.65 0.13 Suppliers 5 0.70 -0.58 -0.43 Communities 6 0.34 -0.32 -0.11 Environment 7 -0.67 -0.34 0.11 Government 8 0.14 -0.81 0.07 Non-Governmental Organizations (NGOs) 9 0.23 -0.11 -0.01 Trade Associations
Construct (‘Value-Scenario’) Loadings On Each Component For Mature Stage Firms 1 2 3
1 1.52 0.01 0.58 Capital dependency—Knowledge dependency 2 0.99 -1.51 -0.29 Revenue focus—Reputation focus 3 1.40 1.06 -0.42 Short term focus—Longer term gain
5.4 Content Analysis Of Various OLC Stages
One of the sections in Phase-1 study protocol inquired into the respondents’ (scholars and
practitioners) perceptions about at-least three key differentiators among the ICT sector start-up,
growth, small to medium-sized, mature, and decline OLC stage firms (see Appendix A; Section 4).
We performed the content analysis technique to understand these differences in a meaningful form.
Our analysis excluded the ‘small to medium sized’ and ‘decline’ ICT firm stages for the purpose of
reducing complexity and time duration of our second phase study design.
70
The main purpose of including Section 4 in the Phase-1 exploratory study protocol was to
operationalize the understanding of various OLC stages in the context of ICT sector. We used a
deductive content analysis technique as we based the outcome categories on previous knowledge
from the OLC literature and stakeholder theory. It enabled us to develop key differentiating categories
among ICT sector start-up, growth, and mature firm stages for the purpose of testing the proposed
theory and related hypotheses. On the contrary, an inductive content analysis helps research questions
that allow concepts to be derived from the data (Elo & Kyngäs, 2007).
As the first step, we organized the complete textual data from Section 4 – Questions 17a, 17b, 17c,
17d, and 17e (Appendix A) into a document. The audio recordings of the interview sessions were also
transcribed and rechecked to ensure the accuracy of the collected responses. As the second step, the
unit of analysis was set to be the three discriminating characteristics of the ICT sector start-up, growth
and mature OLC stage firms, as provided by each respondent.
On the basis of the OLC theory, we developed a categorization matrix and color-coded the data
according to the categories (see Appendix C). This structured matrix was then reviewed to condense
the total 54 (18 respondents; each providing three characteristics) elicited constructs in each of the
OLC stages to main categories. For the purpose of our research study, it was essential to describe the
exemplifications of the identified categories (see Appendix D).
5.4.1 Definitions Of ICT Sector Start-Up, Growth, And Mature OLC Stage Firms
The main intention behind conducting this step was to systematically come up with a simpler,
understandable and discriminating description of the start-up, growth and mature OLC stage firms
from the ICT sector. Henceforth, we deduced some of the major differences among these OLC stages
as below:
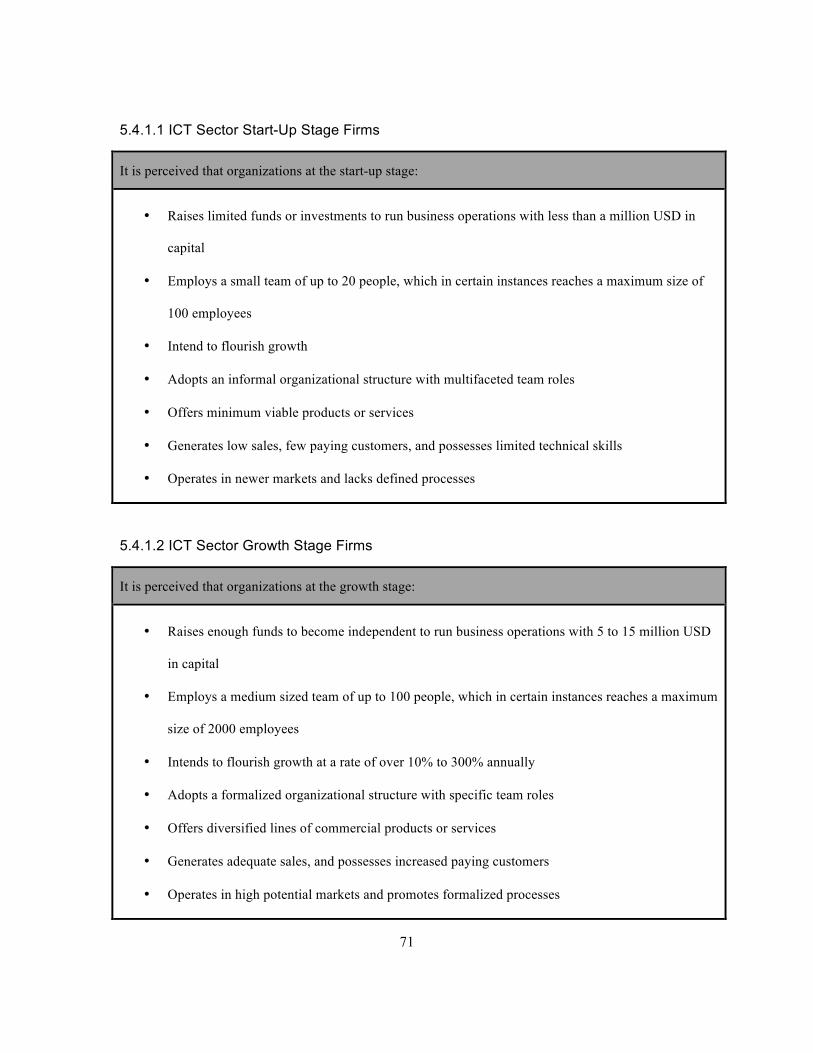
71
5.4.1.1 ICT Sector Start-Up Stage Firms
It is perceived that organizations at the start-up stage:
• Raises limited funds or investments to run business operations with less than a million USD in
capital
• Employs a small team of up to 20 people, which in certain instances reaches a maximum size of
100 employees
• Intend to flourish growth
• Adopts an informal organizational structure with multifaceted team roles
• Offers minimum viable products or services
• Generates low sales, few paying customers, and possesses limited technical skills
• Operates in newer markets and lacks defined processes
5.4.1.2 ICT Sector Growth Stage Firms
It is perceived that organizations at the growth stage:
• Raises enough funds to become independent to run business operations with 5 to 15 million USD
in capital
• Employs a medium sized team of up to 100 people, which in certain instances reaches a maximum
size of 2000 employees
• Intends to flourish growth at a rate of over 10% to 300% annually
• Adopts a formalized organizational structure with specific team roles
• Offers diversified lines of commercial products or services
• Generates adequate sales, and possesses increased paying customers
• Operates in high potential markets and promotes formalized processes
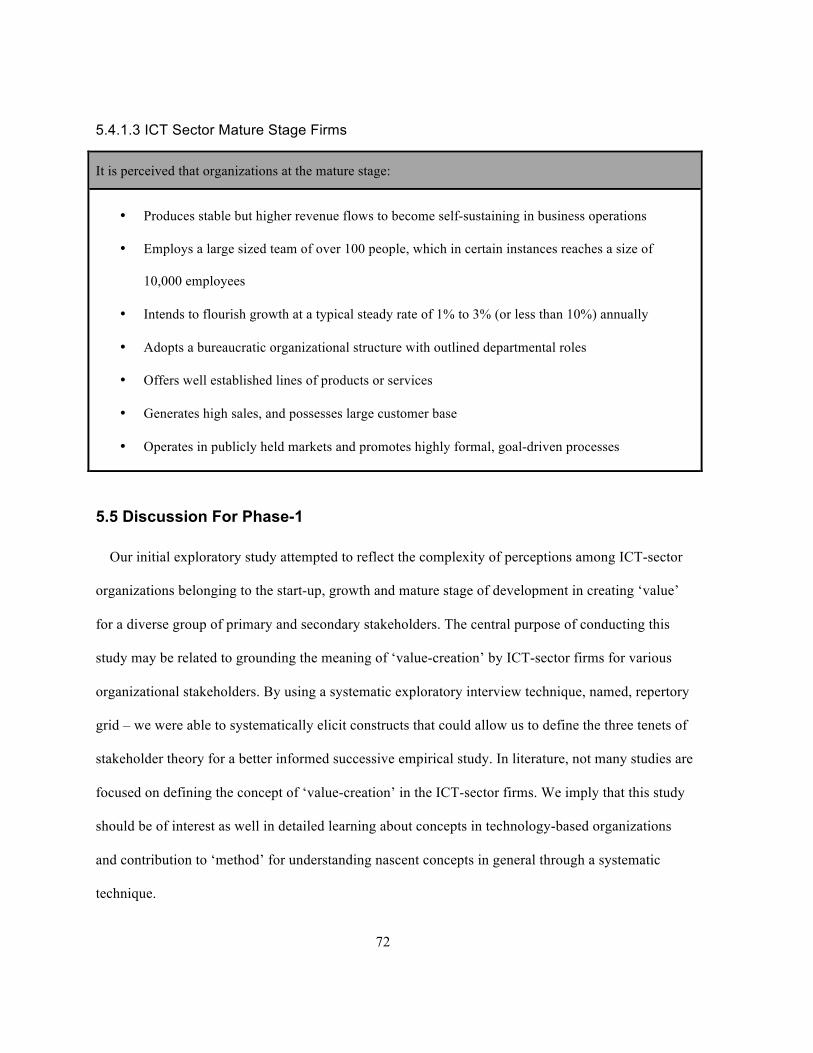
72
5.4.1.3 ICT Sector Mature Stage Firms
It is perceived that organizations at the mature stage:
• Produces stable but higher revenue flows to become self-sustaining in business operations
• Employs a large sized team of over 100 people, which in certain instances reaches a size of
10,000 employees
• Intends to flourish growth at a typical steady rate of 1% to 3% (or less than 10%) annually
• Adopts a bureaucratic organizational structure with outlined departmental roles
• Offers well established lines of products or services
• Generates high sales, and possesses large customer base
• Operates in publicly held markets and promotes highly formal, goal-driven processes
5.5 Discussion For Phase-1
Our initial exploratory study attempted to reflect the complexity of perceptions among ICT-sector
organizations belonging to the start-up, growth and mature stage of development in creating ‘value’
for a diverse group of primary and secondary stakeholders. The central purpose of conducting this
study may be related to grounding the meaning of ‘value-creation’ by ICT-sector firms for various
organizational stakeholders. By using a systematic exploratory interview technique, named, repertory
grid – we were able to systematically elicit constructs that could allow us to define the three tenets of
stakeholder theory for a better informed successive empirical study. In literature, not many studies are
focused on defining the concept of ‘value-creation’ in the ICT-sector firms. We imply that this study
should be of interest as well in detailed learning about concepts in technology-based organizations
and contribution to ‘method’ for understanding nascent concepts in general through a systematic
technique.
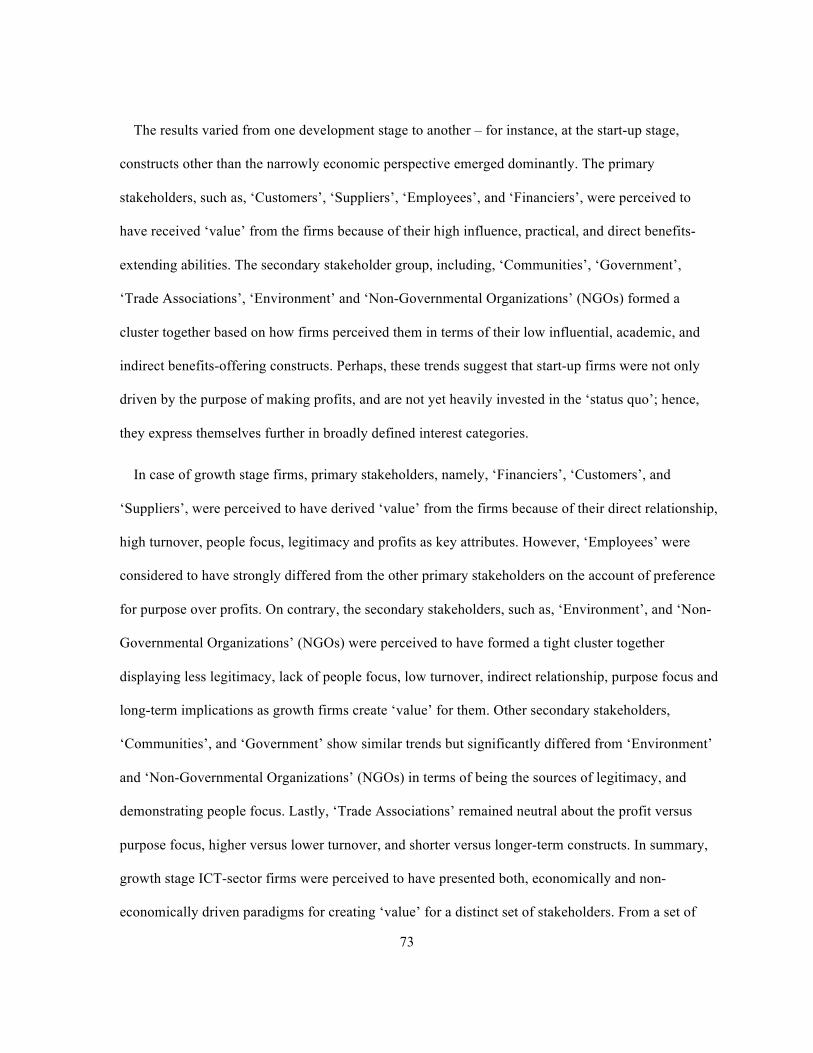
73
The results varied from one development stage to another – for instance, at the start-up stage,
constructs other than the narrowly economic perspective emerged dominantly. The primary
stakeholders, such as, ‘Customers’, ‘Suppliers’, ‘Employees’, and ‘Financiers’, were perceived to
have received ‘value’ from the firms because of their high influence, practical, and direct benefits-
extending abilities. The secondary stakeholder group, including, ‘Communities’, ‘Government’,
‘Trade Associations’, ‘Environment’ and ‘Non-Governmental Organizations’ (NGOs) formed a
cluster together based on how firms perceived them in terms of their low influential, academic, and
indirect benefits-offering constructs. Perhaps, these trends suggest that start-up firms were not only
driven by the purpose of making profits, and are not yet heavily invested in the ‘status quo’; hence,
they express themselves further in broadly defined interest categories.
In case of growth stage firms, primary stakeholders, namely, ‘Financiers’, ‘Customers’, and
‘Suppliers’, were perceived to have derived ‘value’ from the firms because of their direct relationship,
high turnover, people focus, legitimacy and profits as key attributes. However, ‘Employees’ were
considered to have strongly differed from the other primary stakeholders on the account of preference
for purpose over profits. On contrary, the secondary stakeholders, such as, ‘Environment’, and ‘Non-
Governmental Organizations’ (NGOs) were perceived to have formed a tight cluster together
displaying less legitimacy, lack of people focus, low turnover, indirect relationship, purpose focus and
long-term implications as growth firms create ‘value’ for them. Other secondary stakeholders,
‘Communities’, and ‘Government’ show similar trends but significantly differed from ‘Environment’
and ‘Non-Governmental Organizations’ (NGOs) in terms of being the sources of legitimacy, and
demonstrating people focus. Lastly, ‘Trade Associations’ remained neutral about the profit versus
purpose focus, higher versus lower turnover, and shorter versus longer-term constructs. In summary,
growth stage ICT-sector firms were perceived to have presented both, economically and non-
economically driven paradigms for creating ‘value’ for a distinct set of stakeholders. From a set of
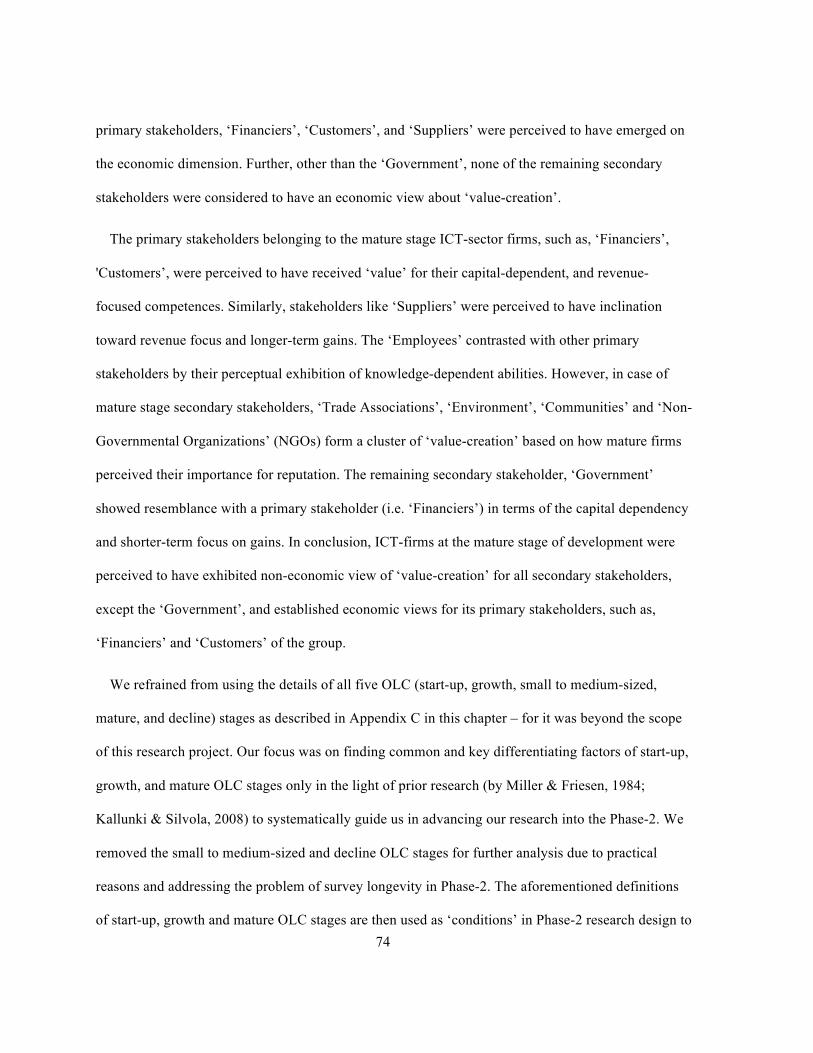
74
primary stakeholders, ‘Financiers’, ‘Customers’, and ‘Suppliers’ were perceived to have emerged on
the economic dimension. Further, other than the ‘Government’, none of the remaining secondary
stakeholders were considered to have an economic view about ‘value-creation’.
The primary stakeholders belonging to the mature stage ICT-sector firms, such as, ‘Financiers’,
'Customers’, were perceived to have received ‘value’ for their capital-dependent, and revenue-
focused competences. Similarly, stakeholders like ‘Suppliers’ were perceived to have inclination
toward revenue focus and longer-term gains. The ‘Employees’ contrasted with other primary
stakeholders by their perceptual exhibition of knowledge-dependent abilities. However, in case of
mature stage secondary stakeholders, ‘Trade Associations’, ‘Environment’, ‘Communities’ and ‘Non-
Governmental Organizations’ (NGOs) form a cluster of ‘value-creation’ based on how mature firms
perceived their importance for reputation. The remaining secondary stakeholder, ‘Government’
showed resemblance with a primary stakeholder (i.e. ‘Financiers’) in terms of the capital dependency
and shorter-term focus on gains. In conclusion, ICT-firms at the mature stage of development were
perceived to have exhibited non-economic view of ‘value-creation’ for all secondary stakeholders,
except the ‘Government’, and established economic views for its primary stakeholders, such as,
‘Financiers’ and ‘Customers’ of the group.
We refrained from using the details of all five OLC (start-up, growth, small to medium-sized,
mature, and decline) stages as described in Appendix C in this chapter – for it was beyond the scope
of this research project. Our focus was on finding common and key differentiating factors of start-up,
growth, and mature OLC stages only in the light of prior research (by Miller & Friesen, 1984;
Kallunki & Silvola, 2008) to systematically guide us in advancing our research into the Phase-2. We
removed the small to medium-sized and decline OLC stages for further analysis due to practical
reasons and addressing the problem of survey longevity in Phase-2. The aforementioned definitions
of start-up, growth and mature OLC stages are then used as ‘conditions’ in Phase-2 research design to
75
capture the difference among various dependent variables, gathered from the literature and RepGrid
interview activity described earlier in this chapter (see Section 5.3). The details about the procedure
used for Phase-2 study are discussed in Chapter 4 (see Section 4.4) with results mentioned in Chapter
6.
The outcomes from Phase-1 were seen as reflecting ‘vested-interest’ judgments from ICT business
experts. This signifies narrow, bounded, exclusive, and ‘As It Is’ approach to stakeholder ‘value-
creation’. We could benefit through extending in the direction of ‘normative-interest’ judgments,
which may imply broad, unbounded, inclusive, multi-stakeholder, and ‘As It Ought To Be’ focus with
the ‘vested-interest’ approach to gain a better understanding about various business-stakeholder
engagement models. However, for Phase-2 of our research, we decided to further explore the domain
of ‘vested-interest’ of ICT-sector practitioners to empirically examine the OLC and the main tenets of
stakeholder theory.
We take the above discussion to mean that ICT-sector organizations at different OLC stages use a
variety of constructs to define how they create ‘value’ for various organizational stakeholders. For
instance, some ICT-sector experts may think that they create ‘value’ by focusing on revenues, while
others focus more on firms’ reputation. Similarly, some may hold competitive focus as a way to
create ‘value’, whereby, others may exercise cooperative focus. There may not be just one way to
create ‘value’ and we do not claim that any one ‘value-scenario’ construct is superior to the other.
The purpose of our research is to empirically draw a picture of how the ICT-sector firms respond to
these ‘value’ scenarios.
Table 17 summarizes the most representative value-creating constructs, along with meanings that
were elicited during Phase-1 of our research. A total of nine uni-polar constructs described the three
tenets of stakeholder theory, including: focus on environmental concerns, focus on societal benefits,
76
focus on employees / human resources, longer-term focus, focus on firm reputation, multi-stakeholder
focus, focus on firm revenues, focus on firm profits and cooperative focus. RepGrid interview
sessions conducted in Phase-1 enabled us to generate 18 uni-polar value-creating constructs. For an
informative Phase-2 study, we added six more constructs to the set from literature. It was believed to
affectively capture the ‘value’ created by ICT-sector firms for various organizational stakeholders.
In Phase-2, out of these 24 constructs, only 19 were selected for the final survey study (see the
survey instrument in Appendix E). The decision was taken after conducting pre-testing sessions of the
survey instrument on a total of 12 respondents; comprising of six senior PhD students at the
Department of Management Science at the University of Waterloo, and six industry representatives
from the ICT-sector in the Waterloo, Ontario region. The feedback also enabled us to alter wordings
in the instrument to effectively represent the desired questions.

77
Table 17: Summary Of ‘Value-creation’ Constructs For An Informative Phase-2 Study
Uni-Polar Constructs Variables Describing Constructs Source Representative Tenets of
Stakeholder Theory Academic Focus on Theoretical Implications RepGrid Interview
Practical Focus on Practical Implications RepGrid Interview Low Influence Focus on Theoretical Implications RepGrid Interview High Influence Focus on Practical Implications RepGrid Interview Direct Benefit Of Growth Focus on Firm Growth RepGrid Interview
Indirect Benefit of Growth
Focus on Environmental Concerns / Focus on Societal Benefits RepGrid Interview Jointness of Interest
Benefit Provider Focus on Stakeholder Providing Us Value RepGrid Interview
Benefit Receiver Focus on Stakeholder Receiving
Value From Us RepGrid Interview
Effect on Low Turnover
Focus on Employees / Focus on Human Resources RepGrid Interview Jointness of Interest
Effect on High Turnover
Focus on Employees / Focus on Human Resources RepGrid Interview
People Oriented Focus on Employees / Focus on Human Resources RepGrid Interview Jointness of Interest
Not People Oriented
Focus on Employees / Focus on Human Resources RepGrid Interview
Longer Term Longer Term Focus RepGrid Interview Jointness of Interest Shorter Term Shorter Term Focus RepGrid Interview
Capital Dependency Focus on Capital For Firm RepGrid Interview Knowledge Dependency
Developing of New Skills / Applying of Existing Skills RepGrid Interview
Revenue Focus Focus on Firm Revenues RepGrid Interview Narrowly Economic View Of The Firm
Reputation Focus Focus on Firm Reputation RepGrid Interview Jointness of Interest Cooperative Focus Cooperative Focus Literature Cooperative Strategic Posture Competitive Focus Competitive Focus Literature Multi-Stakeholder Focus Multi-Stakeholder Focus Literature Jointness of Interest
Uni-Stakeholder Focus Uni-Stakeholder Focus Literature
Profit Focus Focus on Firm Profits Literature Narrowly Economic View Of The Firm
Purpose Focus Focus on Firm Purpose Literature
78
Chapter 6 Findings Of Phase-2: Survey Study Design
In our second phase of research exploration, we utilized value-creating constructs gathered from
Phase-1, along with constructs from literature in a repeated measures survey study design. The
purpose was to investigate empirically the perceived receptiveness of ICT-sector firms toward various
business-stakeholder engagement models. In this chapter we present results gathered from the study
conducted in Phase-2. These are distributed over six sections. First section provides descriptive
characteristics of Phase-2 study participants (Section 6.1). Second section empirically addresses the
issue of internal consistency of the measurement constructs (Section 6.2). Third section statistically
assesses the measurement bias related with common method (Section 6.3). Fourth section presents the
relationship between start-up, growth, and mature OLC stage conditions with a set of representative
variables of the three tenets of stakeholder theory (Section 6.4). The representative dependent
variables are theoretically classified as close approximates of the three main tenets of stakeholder
theory that differentiates between various business-stakeholder engagement models. Fifth section
focuses on the relationship between the ICT-sector participants’ total working experience with the
importance given to various stakeholders (Section 6.5). Sixth section summarizes the discussion of
the overall Phase-2 results (Section 6.6).
6.1 Participants
Our study included a heterogeneous sample of 132 ICT-sector business practitioners, who
specialized in mobile, software, hardware, Internet, media and social interaction technologies. Further
inclusion criteria of participants in Phase-2 comprise of adults from the United States of America,
operating in the North American or international markets. Table 18, provides descriptive
demographic details of our sample group in Phase-2.
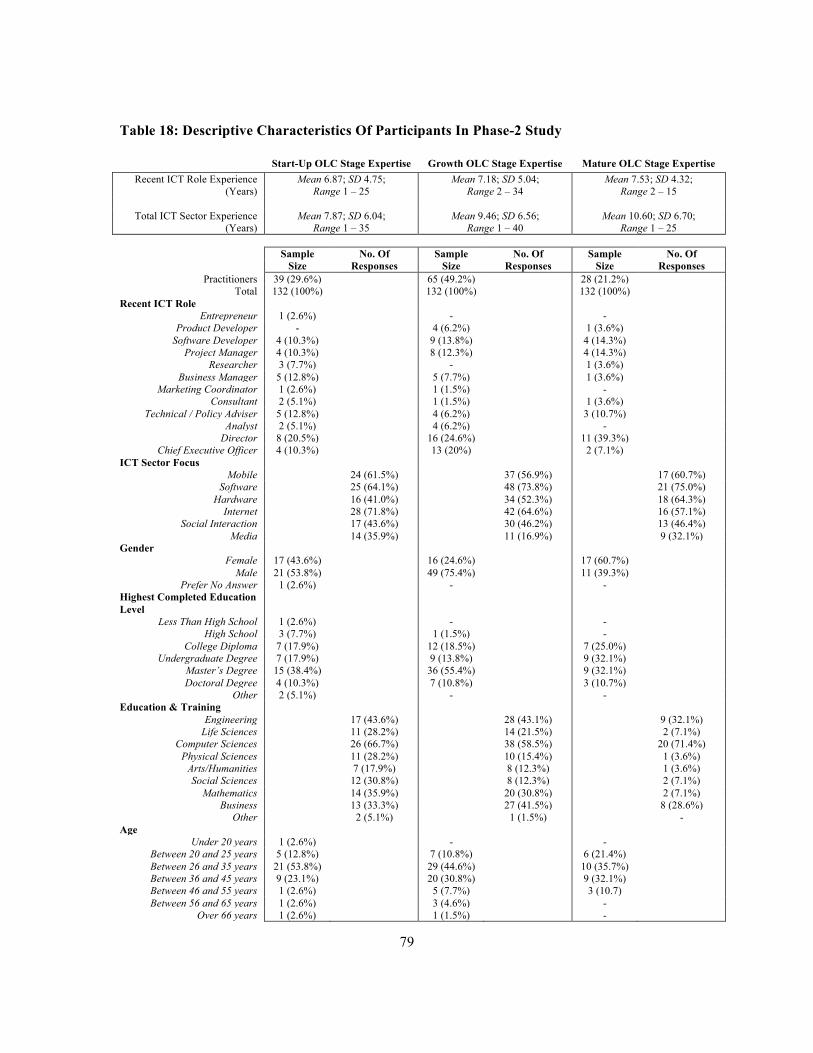
79
Table 18: Descriptive Characteristics Of Participants In Phase-2 Study
Start-Up OLC Stage Expertise Growth OLC Stage Expertise Mature OLC Stage Expertise Recent ICT Role Experience
(Years) Mean 6.87; SD 4.75;
Range 1 – 25 Mean 7.18; SD 5.04;
Range 2 – 34 Mean 7.53; SD 4.32;
Range 2 – 15
Total ICT Sector Experience (Years)
Mean 7.87; SD 6.04; Range 1 – 35
Mean 9.46; SD 6.56; Range 1 – 40
Mean 10.60; SD 6.70; Range 1 – 25
Sample
Size No. Of
Responses Sample
Size No. Of
Responses Sample
Size No. Of
Responses Practitioners 39 (29.6%) 65 (49.2%) 28 (21.2%)
Total 132 (100%) 132 (100%) 132 (100%) Recent ICT Role
Entrepreneur 1 (2.6%) - - Product Developer - 4 (6.2%) 1 (3.6%)
Software Developer 4 (10.3%) 9 (13.8%) 4 (14.3%) Project Manager 4 (10.3%) 8 (12.3%) 4 (14.3%)
Researcher 3 (7.7%) - 1 (3.6%) Business Manager 5 (12.8%) 5 (7.7%) 1 (3.6%)
Marketing Coordinator 1 (2.6%) 1 (1.5%) - Consultant 2 (5.1%) 1 (1.5%) 1 (3.6%)
Technical / Policy Adviser 5 (12.8%) 4 (6.2%) 3 (10.7%) Analyst 2 (5.1%) 4 (6.2%) -
Director 8 (20.5%) 16 (24.6%) 11 (39.3%) Chief Executive Officer 4 (10.3%) 13 (20%) 2 (7.1%)
ICT Sector Focus Mobile 24 (61.5%) 37 (56.9%) 17 (60.7%)
Software 25 (64.1%) 48 (73.8%) 21 (75.0%) Hardware 16 (41.0%) 34 (52.3%) 18 (64.3%)
Internet 28 (71.8%) 42 (64.6%) 16 (57.1%) Social Interaction 17 (43.6%) 30 (46.2%) 13 (46.4%)
Media 14 (35.9%) 11 (16.9%) 9 (32.1%) Gender
Female 17 (43.6%) 16 (24.6%) 17 (60.7%) Male 21 (53.8%) 49 (75.4%) 11 (39.3%)
Prefer No Answer 1 (2.6%) - - Highest Completed Education Level
Less Than High School 1 (2.6%) - - High School 3 (7.7%) 1 (1.5%) -
College Diploma 7 (17.9%) 12 (18.5%) 7 (25.0%) Undergraduate Degree 7 (17.9%) 9 (13.8%) 9 (32.1%)
Master’s Degree 15 (38.4%) 36 (55.4%) 9 (32.1%) Doctoral Degree 4 (10.3%) 7 (10.8%) 3 (10.7%)
Other 2 (5.1%) - - Education & Training
Engineering 17 (43.6%) 28 (43.1%) 9 (32.1%) Life Sciences 11 (28.2%) 14 (21.5%) 2 (7.1%)
Computer Sciences 26 (66.7%) 38 (58.5%) 20 (71.4%) Physical Sciences 11 (28.2%) 10 (15.4%) 1 (3.6%)
Arts/Humanities 7 (17.9%) 8 (12.3%) 1 (3.6%) Social Sciences 12 (30.8%) 8 (12.3%) 2 (7.1%)
Mathematics 14 (35.9%) 20 (30.8%) 2 (7.1%) Business 13 (33.3%) 27 (41.5%) 8 (28.6%)
Other 2 (5.1%) 1 (1.5%) - Age
Under 20 years 1 (2.6%) - - Between 20 and 25 years 5 (12.8%) 7 (10.8%) 6 (21.4%) Between 26 and 35 years 21 (53.8%) 29 (44.6%) 10 (35.7%) Between 36 and 45 years 9 (23.1%) 20 (30.8%) 9 (32.1%) Between 46 and 55 years 1 (2.6%) 5 (7.7%) 3 (10.7) Between 56 and 65 years 1 (2.6%) 3 (4.6%) -
Over 66 years 1 (2.6%) 1 (1.5%) -

80
A sample size of 132 respondents was analyzed to infer empirical results. In the survey
questionnaire, respondents were asked to express their expertise regarding different OLC stages in the
ICT-sector. A total of 39 respondents chose expertise in the start-up stage; 65 selected growth stage;
and 28 picked mature OLC stage.
In theory, we generalized that highly experienced ICT-sector participants with specific OLC stage
expertise (start-up n = 39; growth n = 65; mature n = 28) could also provide knowledgeable inputs for
other OLC stages. To test this assumption, we decided to statistically examine any significant
differences among respondents with specific OLC expertise in three OLC conditions (levels of
independent variable). We conducted one-way repeated measures ANOVA with OLC conditions as
within-subjects factor at three levels (start-up, growth, and mature) along with value-creating
constructs as dependent measures. After defining these measures, self-reported OLC stage expertise
were added as a between-subjects measure and tested for mean differences. The results shown in
Table 19 verify that there are no statistically significant differences among participants with respect to
various ‘value-creation’ constructs. A clearly non-significant alpha level (p > 0.25) is satisfied for a
total of 16 out of 19 cases with no p-value < 0.115. We acknowledge that three dependent variables,
‘Focus on Developing New Skills’ (p = 0.122), ‘Longer Term Focus’ (p = 0.150), and ‘Cooperative
Focus’ (p = 0.115) did not achieve the clearly non-significant alpha level in terms of OLC stage
(Table 19).
As the sample size for each group of OLC expertise is unequal, we also tested it by randomly
selecting an equal sample size of 28 respondents from the start-up and growth stage expertise
groups19. The results again showed no difference among the self-reported OLC stage expertise. A
clearly non-significant alpha level (p > 0.25) is satisfied for a total of 17 out of 19 cases with no p-
19 The sample size of mature stage expert group was 28, consequently, the other two groups, start-up and growth experts were randomly reduced to a sample size of 28 respondents respectively.
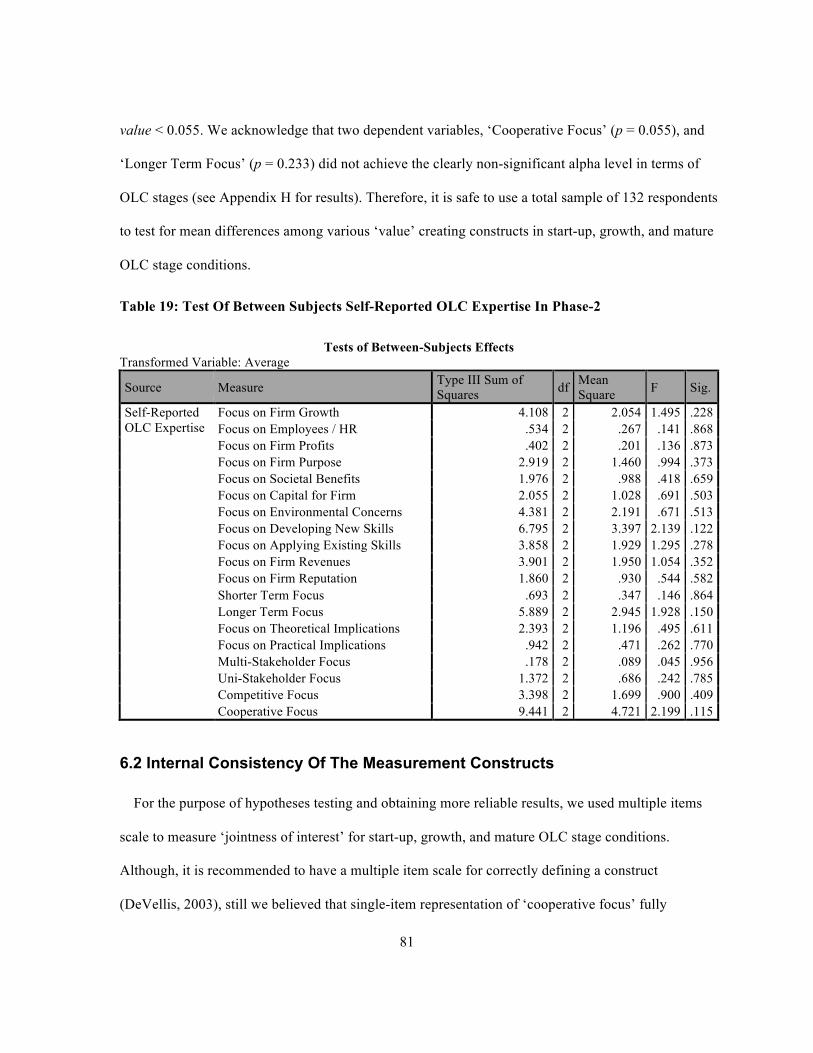
81
value < 0.055. We acknowledge that two dependent variables, ‘Cooperative Focus’ (p = 0.055), and
‘Longer Term Focus’ (p = 0.233) did not achieve the clearly non-significant alpha level in terms of
OLC stages (see Appendix H for results). Therefore, it is safe to use a total sample of 132 respondents
to test for mean differences among various ‘value’ creating constructs in start-up, growth, and mature
OLC stage conditions.
Table 19: Test Of Between Subjects Self-Reported OLC Expertise In Phase-2
Tests of Between-Subjects Effects Transformed Variable: Average
Source Measure Type III Sum of Squares df Mean
Square F Sig.
Self-Reported OLC Expertise
Focus on Firm Growth 4.108 2 2.054 1.495 .228 Focus on Employees / HR .534 2 .267 .141 .868 Focus on Firm Profits .402 2 .201 .136 .873 Focus on Firm Purpose 2.919 2 1.460 .994 .373 Focus on Societal Benefits 1.976 2 .988 .418 .659 Focus on Capital for Firm 2.055 2 1.028 .691 .503 Focus on Environmental Concerns 4.381 2 2.191 .671 .513 Focus on Developing New Skills 6.795 2 3.397 2.139 .122 Focus on Applying Existing Skills 3.858 2 1.929 1.295 .278 Focus on Firm Revenues 3.901 2 1.950 1.054 .352 Focus on Firm Reputation 1.860 2 .930 .544 .582 Shorter Term Focus .693 2 .347 .146 .864 Longer Term Focus 5.889 2 2.945 1.928 .150 Focus on Theoretical Implications 2.393 2 1.196 .495 .611 Focus on Practical Implications .942 2 .471 .262 .770 Multi-Stakeholder Focus .178 2 .089 .045 .956 Uni-Stakeholder Focus 1.372 2 .686 .242 .785 Competitive Focus 3.398 2 1.699 .900 .409 Cooperative Focus 9.441 2 4.721 2.199 .115
6.2 Internal Consistency Of The Measurement Constructs
For the purpose of hypotheses testing and obtaining more reliable results, we used multiple items
scale to measure ‘jointness of interest’ for start-up, growth, and mature OLC stage conditions.
Although, it is recommended to have a multiple item scale for correctly defining a construct
(DeVellis, 2003), still we believed that single-item representation of ‘cooperative focus’ fully
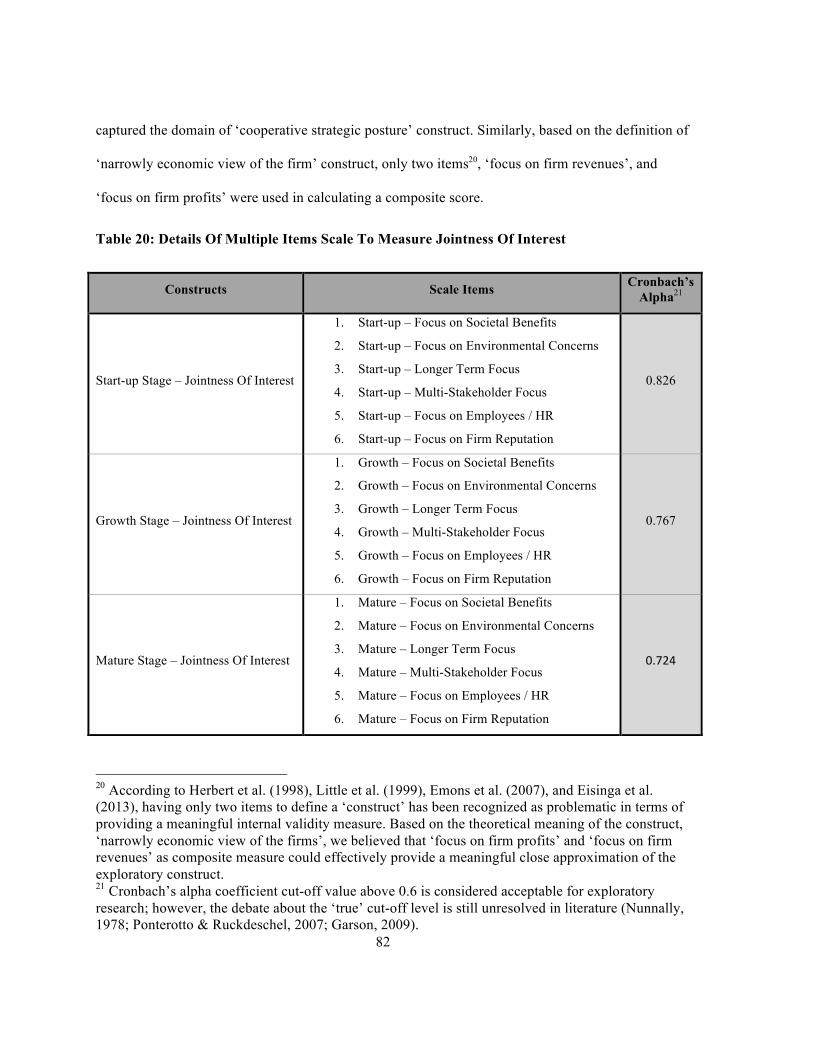
82
captured the domain of ‘cooperative strategic posture’ construct. Similarly, based on the definition of
‘narrowly economic view of the firm’ construct, only two items20, ‘focus on firm revenues’, and
‘focus on firm profits’ were used in calculating a composite score.
Table 20: Details Of Multiple Items Scale To Measure Jointness Of Interest
Constructs Scale Items Cronbach’s Alpha21
Start-up Stage – Jointness Of Interest
1. Start-up – Focus on Societal Benefits
2. Start-up – Focus on Environmental Concerns
3. Start-up – Longer Term Focus
4. Start-up – Multi-Stakeholder Focus
5. Start-up – Focus on Employees / HR
6. Start-up – Focus on Firm Reputation
0.826
Growth Stage – Jointness Of Interest
1. Growth – Focus on Societal Benefits
2. Growth – Focus on Environmental Concerns
3. Growth – Longer Term Focus
4. Growth – Multi-Stakeholder Focus
5. Growth – Focus on Employees / HR
6. Growth – Focus on Firm Reputation
0.767
Mature Stage – Jointness Of Interest
1. Mature – Focus on Societal Benefits
2. Mature – Focus on Environmental Concerns
3. Mature – Longer Term Focus
4. Mature – Multi-Stakeholder Focus
5. Mature – Focus on Employees / HR
6. Mature – Focus on Firm Reputation
0.724
20 According to Herbert et al. (1998), Little et al. (1999), Emons et al. (2007), and Eisinga et al. (2013), having only two items to define a ‘construct’ has been recognized as problematic in terms of providing a meaningful internal validity measure. Based on the theoretical meaning of the construct, ‘narrowly economic view of the firms’, we believed that ‘focus on firm profits’ and ‘focus on firm revenues’ as composite measure could effectively provide a meaningful close approximation of the exploratory construct. 21 Cronbach’s alpha coefficient cut-off value above 0.6 is considered acceptable for exploratory research; however, the debate about the ‘true’ cut-off level is still unresolved in literature (Nunnally, 1978; Ponterotto & Ruckdeschel, 2007; Garson, 2009).

83
To test the internal consistency and reliability of the measurement scale, we performed scale
reliability analysis using the 22nd version of SPSS for constructs in each condition. Table 20 presents
the Cronbach’s alpha22 levels (as coefficient of reliability) of ‘jointness of interest’ construct in the
start-up, growth and mature OLC conditions23. We can see that Cronbach’s alpha is above 0.7 in all
three conditions, which indicates a high level of internal construct consistency at all three levels of
interventions (Nunnally & Bernstein, 1994; Gliem & Gliem, 2003).
6.3 Assessment Of Common Method Biases
In Chapter 4, we discussed a few practices to deal with common method biases that are often
associated with the social sciences. According to Campbell and Fiske (1959), and Podsakoff et al.
(2003), method biases create systematic errors in the measurement and weaken the validity of
research results. There is a long list of potential causes of common method biases in research studies
like ours – a few of them being more relevant to us than others24. One major source of potential
common method bias in the context of our Phase-2 study was the fact that the measurement of
dependent and independent variables was conducted using the same medium of a self-reported online
questionnaire (Podsakoff et al., 2003).
We conducted Harman’s single-factor test to address the limitation of variance caused by common
method. This test is commonly used in similar research projects to identify any serious limitations of
research findings (Podsakoff et al., 2003, Noriega, 2013; Batouk, 2015). For this technique a list of
variables used in the study are loaded into an exploratory factor analysis without rotating the solution
(Aulakh & Gencturk, 2000; Podsakoff et al., 2003).
22 Cronbach’s coefficient alpha is a widely used measure of multi-item scale reliability (DeVellis, 2003). 23 For more details about multi-item scale reliability analysis, see Appendix I. 24 See the summary of potential sources of common method biases by Padsakoff et al. (2003) for more details.
84
A total of 31 measurement variables from our study were loaded into the exploratory factor
analysis (with principal component methods in extraction settings). We limited the extraction of
number of factors to one with no rotations to the solution. As a result, we gathered eight factors with
Eigenvalues greater than one. The first factor accounted for 31.01% of the total variance. It indicates
that no single-factor fully explains the total variance – thus validating that our Phase-2 study design
results are not seriously limited by common method bias25.
6.4 Relationship Between OLC Stages And Business-Stakeholder Engagement
Models
We used a one-way repeated measures analysis of variance (ANOVA) to empirically understand
the relationships between the three OLC conditions (i.e. start-up, growth, and mature stages) and the
three tenets of stakeholder theory. We acknowledge that methodically, the proposed hypotheses could
also be tested using other analytic approaches, such as, structural equation modeling. Nonetheless,
with this study’s outlined design to examine the difference between OLC stage conditions, which
have been repeatedly measured on the representative dependent variables of three tenets of
stakeholder theory – a repeated measures ANOVA analytic method was preferred for hypotheses
testing. In our data set, dependent variable, ‘Cooperative Focus’, provides a close representation of
Cooperative Strategic Posture tenet of stakeholder theory. Similarly, dependent variables, ‘Focus on
Firm Profits’, and ‘Focus on Revenues’ represent Narrowly Economic View of Firms. Variables,
‘Focus on Societal Benefits’, ‘Focus on Environmental Concerns’, ‘Focus on Employees / Human
Resources’, ‘Focus on Firm Reputation’, ‘Longer Term Focus’, and ‘Multi-Stakeholder Focus’
characterizes the Jointness of Interest, as three differentiating factors between the CSR, CSV, and
VAS models, respectively.
25 For more analytical details on the factor analysis, see Appendix J.
85
To run a one-way repeated measures ANOVA, the following five assumptions needs to be
satisfied26: 1) the dependent variables used in the study should be continuous – all 19 dependents
variables (‘value-scenarios’) in our study were considered as continuous variables27; 2) there should
be one within-subjects factor with three or more categorical levels – our start-up, growth, and mature
OLC stage categorical conditions were classified as three levels of the within-subjects factor; 3) no
significant outliers remain in any level of the within-subjects independent variable – a careful and
detailed analysis was conducted to account for this assumption; 4) the data should be normally
distributed – although one-way repeated measures ANOVA is considered to be robust against this
assumption’s violation, and finally; 5) the data should have homogeneity of variance and covariance,
known as the assumption of sphericity – Mauchly’s test of sphericity was conducted to apply
corrections when this assumption was violated (Howell, 2012).
We used graphical method by creating boxplots of our data to check for significant outliers. This
analysis returned a few ‘value-scenario’ dependent variables displaying extreme outliers (represented
by asterisk ‘*’ sign beside them) at different OLC conditions (see Appendix F for details). A total of
9 dependent variables out of 19, describing ‘value-scenarios’ were identified with an issue of extreme
outliers.
The data file was rechecked for potential measurement, sampling, and clerical errors. After ruling
out these possibilities, we believed that the outlier data provide genuine perceptual parameters of an
observation. Therefore, we decided to keep the outliers – instead of removing them, changing their
weightage, or transforming the dependent variables (Hawkins, 1980; Ghosh & Vogt, 2012). We
performed one-way repeated measures ANOVA on these nine dependent variables with and without
26 For more details on one-way repeated measures ANOVA assumptions and understanding different type of variables, see Laerd Statistics at https://statistics.laerd.com 27 Using parametric statistics on Likert scale studies are considered robust against the violations of normality, unequal variances, small sample or ordinal type Likert scales (Norman, 2010).
86
outliers. After comparing their results, we found no significant difference between the two groups28 –
which validates our decision to include the outliers in the data analyses.
We reviewed our data for normality using histograms and Q-Q plots (graphical), along-with
Shapiro-Wilk and Kolmogorov-Smirnov test of normality (numerical) methods for each level of
within-subjects factor. The graphical method shows our data being negatively skewed. All the 19
value-creating constructs (dependent variables) were not normally distributed at each OLC level, as
assessed by Shapiro-Wilk’s and Kolmogorov-Smirnov’s test (p < 0.001)29. One-way repeated
measures ANOVA is considered to be robust against the violation of normality; therefore, we will
continue with the analysis without suspecting results of being substantially affected by Type 1 error
rate (Norman, 2010; Howell, 2012; Laerd Statistics, 2015).
We set our data according to the recommended repeated measures ANOVA conventions in SPSS
software packages (Howell, 2012; Laerd Statistics, 2015). Repeated measures procedure was selected
in the general linear model menu options. The three levels of ‘OLC_Stages’ were defined as within-
subjects factor name (independent variable) and 19 value-creating constructs as measure names
(dependent variables) in SPSS to produce results (see Appendix K30).
6.4.1 OLC Stages And Their Relationship With Firms’ Cooperative Strategic Posture
This section provides results for the hypotheses, H1a, H2a, and H3a – that focuses on the
likelihood of start-up and mature OLC stage firms demonstrating more cooperative strategic posture
than the growth OLC stage firms with respect to various business-stakeholder engagement models. A
one-way repeated measures ANOVA was conducted to determine whether there were statistically
28 See Appendix F for more details about outlier analysis using one-way repeated measures ANOVA. 29 See Appendix G for more details about determining the normal distribution of the data. 30 The results mentioned in Appendix K provide separate results for 19 value-creating scenarios at three OLC levels. The post-hoc analysis shows no adjustment (LSD) for multiple comparisons.
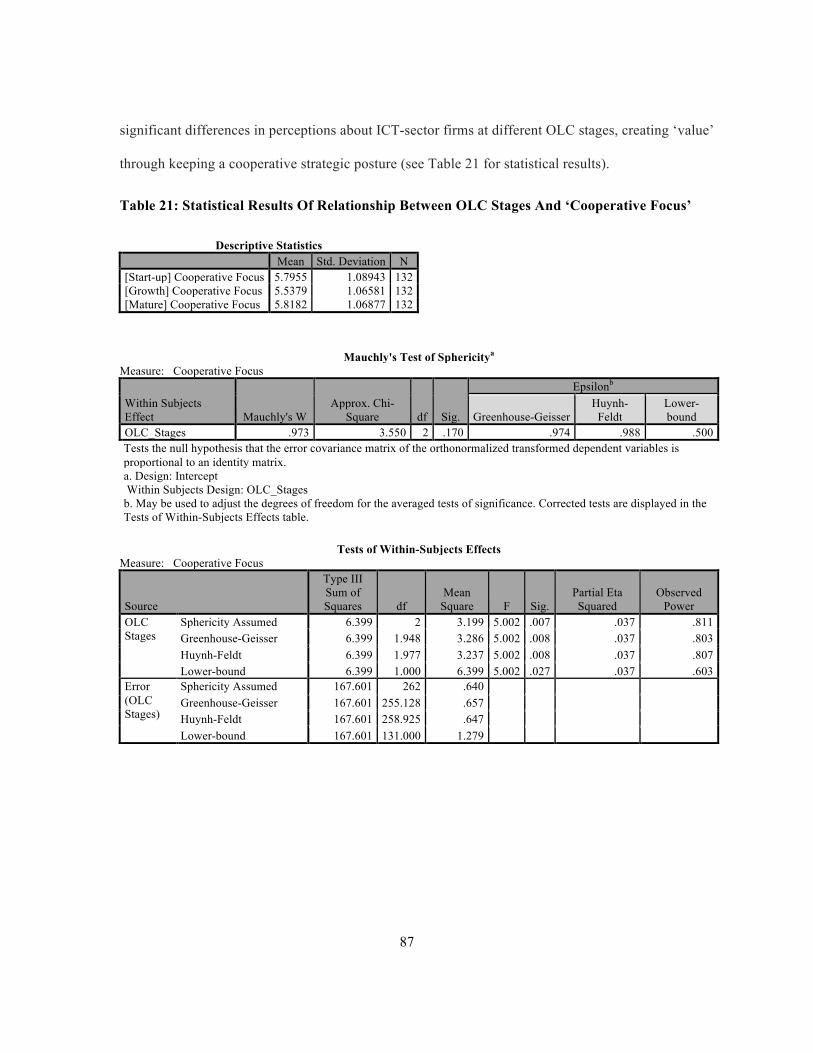
87
significant differences in perceptions about ICT-sector firms at different OLC stages, creating ‘value’
through keeping a cooperative strategic posture (see Table 21 for statistical results).
Table 21: Statistical Results Of Relationship Between OLC Stages And ‘Cooperative Focus’
Descriptive Statistics Mean Std. Deviation N [Start-up] Cooperative Focus 5.7955 1.08943 132 [Growth] Cooperative Focus 5.5379 1.06581 132 [Mature] Cooperative Focus 5.8182 1.06877 132
Mauchly's Test of Sphericitya Measure: Cooperative Focus
Within Subjects Effect Mauchly's W
Approx. Chi-Square df Sig.
Epsilonb
Greenhouse-Geisser Huynh-
Feldt Lower-bound
OLC_Stages .973 3.550 2 .170 .974 .988 .500 Tests the null hypothesis that the error covariance matrix of the orthonormalized transformed dependent variables is proportional to an identity matrix. a. Design: Intercept Within Subjects Design: OLC_Stages b. May be used to adjust the degrees of freedom for the averaged tests of significance. Corrected tests are displayed in the Tests of Within-Subjects Effects table.
Tests of Within-Subjects Effects Measure: Cooperative Focus
Source
Type III Sum of Squares df
Mean Square F Sig.
Partial Eta Squared
Observed Power
OLC Stages
Sphericity Assumed 6.399 2 3.199 5.002 .007 .037 .811 Greenhouse-Geisser 6.399 1.948 3.286 5.002 .008 .037 .803 Huynh-Feldt 6.399 1.977 3.237 5.002 .008 .037 .807 Lower-bound 6.399 1.000 6.399 5.002 .027 .037 .603
Error (OLC Stages)
Sphericity Assumed 167.601 262 .640 Greenhouse-Geisser 167.601 255.128 .657 Huynh-Feldt 167.601 258.925 .647 Lower-bound 167.601 131.000 1.279
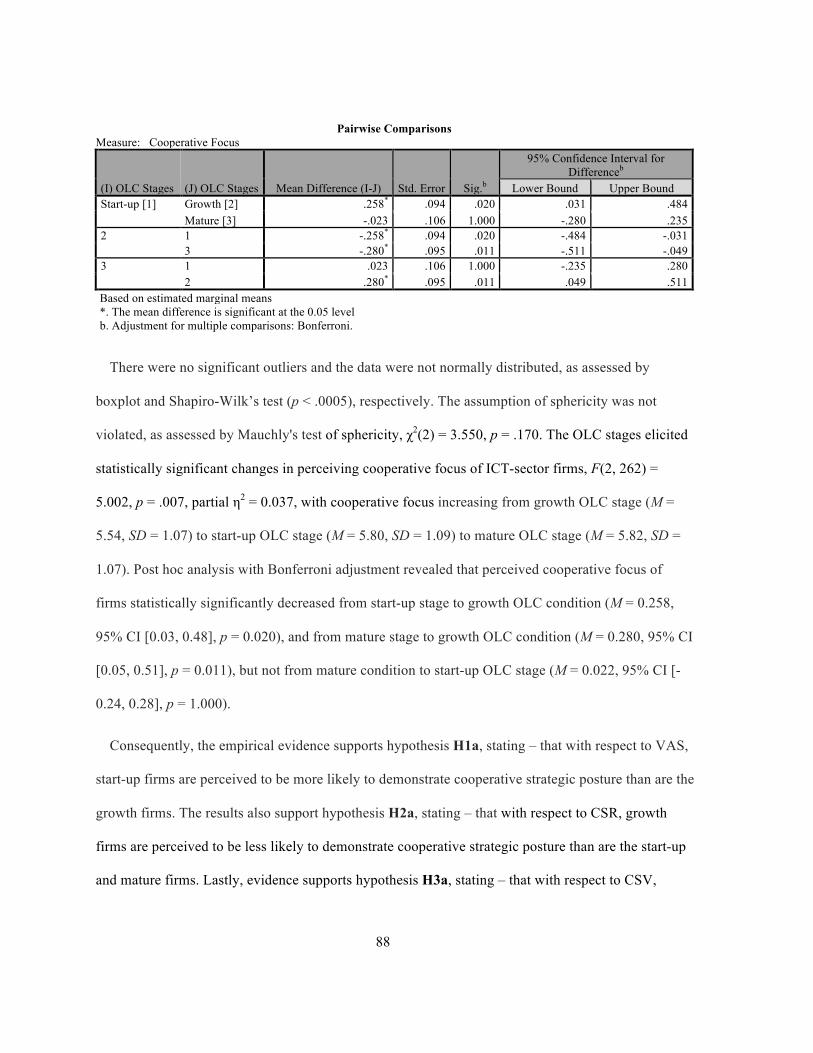
88
Pairwise Comparisons Measure: Cooperative Focus
(I) OLC Stages (J) OLC Stages Mean Difference (I-J) Std. Error Sig.b
95% Confidence Interval for Differenceb
Lower Bound Upper Bound Start-up [1] Growth [2] .258* .094 .020 .031 .484
Mature [3] -.023 .106 1.000 -.280 .235 2 1 -.258* .094 .020 -.484 -.031
3 -.280* .095 .011 -.511 -.049 3 1 .023 .106 1.000 -.235 .280
2 .280* .095 .011 .049 .511 Based on estimated marginal means *. The mean difference is significant at the 0.05 level b. Adjustment for multiple comparisons: Bonferroni.
There were no significant outliers and the data were not normally distributed, as assessed by
boxplot and Shapiro-Wilk’s test (p < .0005), respectively. The assumption of sphericity was not
violated, as assessed by Mauchly's test of sphericity, χ2(2) = 3.550, p = .170. The OLC stages elicited
statistically significant changes in perceiving cooperative focus of ICT-sector firms, F(2, 262) =
5.002, p = .007, partial η2 = 0.037, with cooperative focus increasing from growth OLC stage (M =
5.54, SD = 1.07) to start-up OLC stage (M = 5.80, SD = 1.09) to mature OLC stage (M = 5.82, SD =
1.07). Post hoc analysis with Bonferroni adjustment revealed that perceived cooperative focus of
firms statistically significantly decreased from start-up stage to growth OLC condition (M = 0.258,
95% CI [0.03, 0.48], p = 0.020), and from mature stage to growth OLC condition (M = 0.280, 95% CI
[0.05, 0.51], p = 0.011), but not from mature condition to start-up OLC stage (M = 0.022, 95% CI [-
0.24, 0.28], p = 1.000).
Consequently, the empirical evidence supports hypothesis H1a, stating – that with respect to VAS,
start-up firms are perceived to be more likely to demonstrate cooperative strategic posture than are the
growth firms. The results also support hypothesis H2a, stating – that with respect to CSR, growth
firms are perceived to be less likely to demonstrate cooperative strategic posture than are the start-up
and mature firms. Lastly, evidence supports hypothesis H3a, stating – that with respect to CSV,
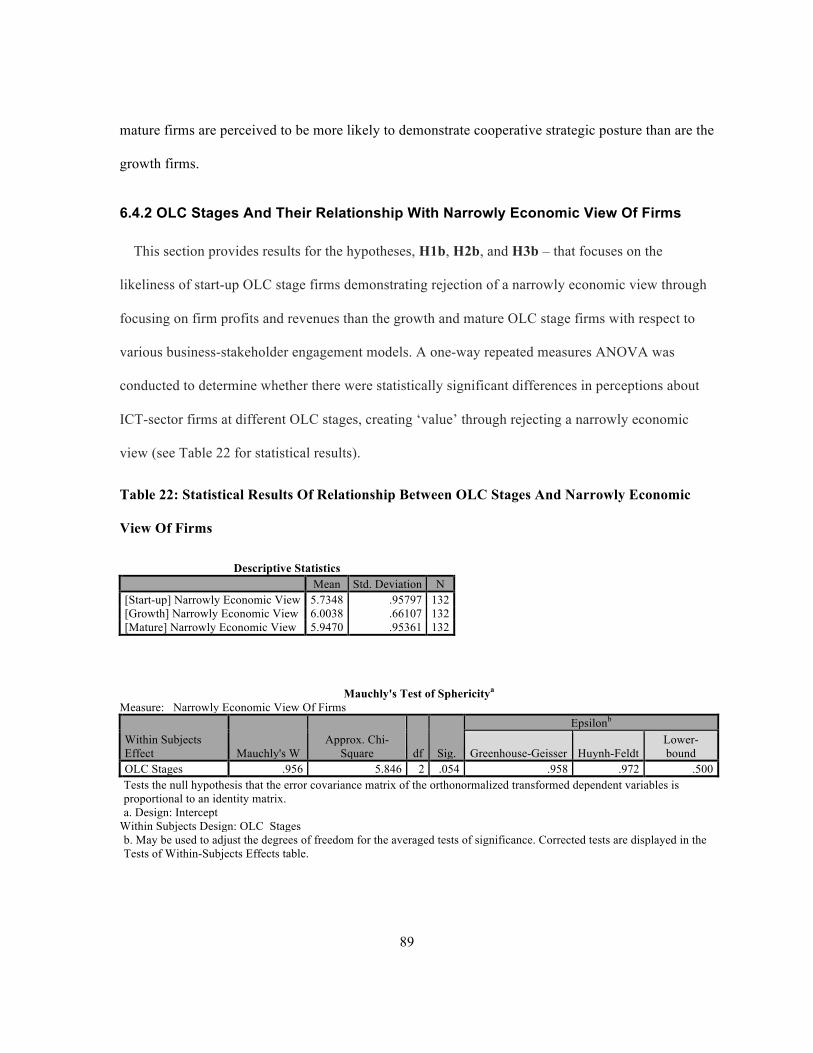
89
mature firms are perceived to be more likely to demonstrate cooperative strategic posture than are the
growth firms.
6.4.2 OLC Stages And Their Relationship With Narrowly Economic View Of Firms
This section provides results for the hypotheses, H1b, H2b, and H3b – that focuses on the
likeliness of start-up OLC stage firms demonstrating rejection of a narrowly economic view through
focusing on firm profits and revenues than the growth and mature OLC stage firms with respect to
various business-stakeholder engagement models. A one-way repeated measures ANOVA was
conducted to determine whether there were statistically significant differences in perceptions about
ICT-sector firms at different OLC stages, creating ‘value’ through rejecting a narrowly economic
view (see Table 22 for statistical results).
Table 22: Statistical Results Of Relationship Between OLC Stages And Narrowly Economic
View Of Firms
Descriptive Statistics Mean Std. Deviation N [Start-up] Narrowly Economic View 5.7348 .95797 132 [Growth] Narrowly Economic View 6.0038 .66107 132 [Mature] Narrowly Economic View 5.9470 .95361 132
Mauchly's Test of Sphericitya
Measure: Narrowly Economic View Of Firms
Within Subjects Effect Mauchly's W
Approx. Chi-Square df Sig.
Epsilonb
Greenhouse-Geisser Huynh-Feldt Lower-bound
OLC Stages .956 5.846 2 .054 .958 .972 .500 Tests the null hypothesis that the error covariance matrix of the orthonormalized transformed dependent variables is proportional to an identity matrix. a. Design: Intercept
Within Subjects Design: OLC_Stages b. May be used to adjust the degrees of freedom for the averaged tests of significance. Corrected tests are displayed in the Tests of Within-Subjects Effects table.
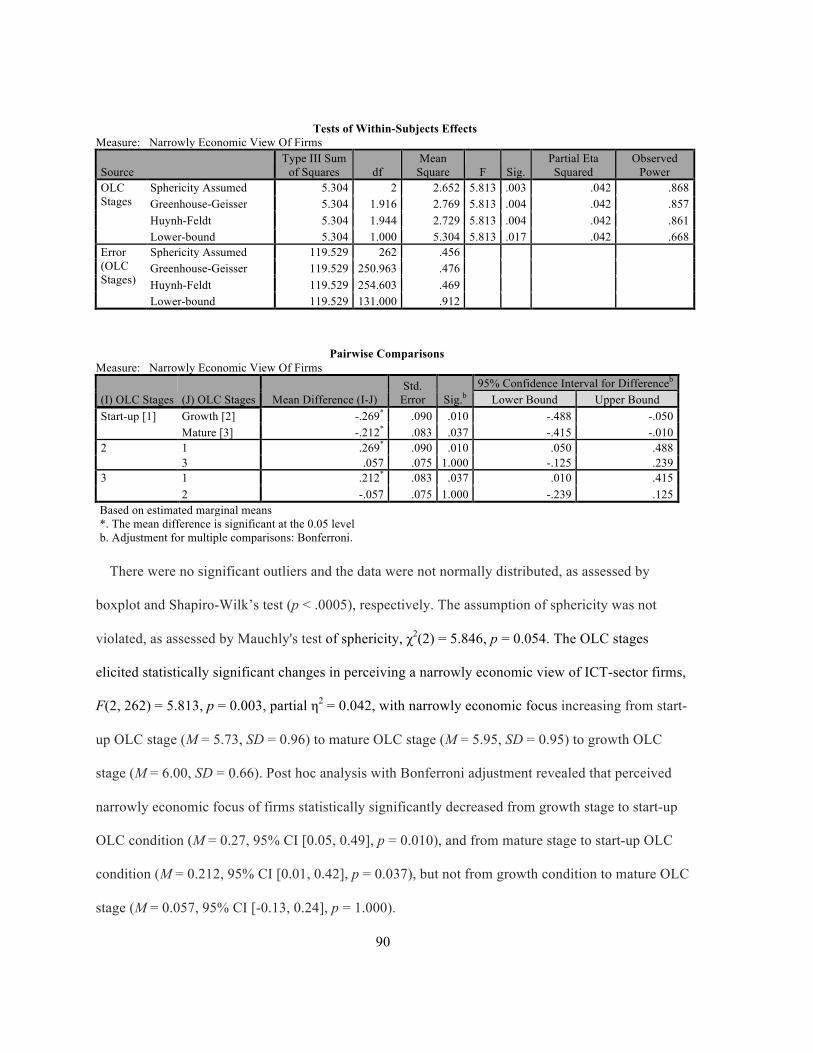
90
Tests of Within-Subjects Effects Measure: Narrowly Economic View Of Firms
Source Type III Sum
of Squares df Mean
Square F Sig. Partial Eta Squared
Observed Power
OLC Stages
Sphericity Assumed 5.304 2 2.652 5.813 .003 .042 .868 Greenhouse-Geisser 5.304 1.916 2.769 5.813 .004 .042 .857 Huynh-Feldt 5.304 1.944 2.729 5.813 .004 .042 .861 Lower-bound 5.304 1.000 5.304 5.813 .017 .042 .668
Error (OLC Stages)
Sphericity Assumed 119.529 262 .456 Greenhouse-Geisser 119.529 250.963 .476 Huynh-Feldt 119.529 254.603 .469 Lower-bound 119.529 131.000 .912
Pairwise Comparisons Measure: Narrowly Economic View Of Firms
(I) OLC Stages (J) OLC Stages Mean Difference (I-J) Std.
Error Sig.b 95% Confidence Interval for Differenceb
Lower Bound Upper Bound Start-up [1] Growth [2] -.269* .090 .010 -.488 -.050
Mature [3] -.212* .083 .037 -.415 -.010 2 1 .269* .090 .010 .050 .488
3 .057 .075 1.000 -.125 .239 3 1 .212* .083 .037 .010 .415
2 -.057 .075 1.000 -.239 .125 Based on estimated marginal means *. The mean difference is significant at the 0.05 level b. Adjustment for multiple comparisons: Bonferroni.
There were no significant outliers and the data were not normally distributed, as assessed by
boxplot and Shapiro-Wilk’s test (p < .0005), respectively. The assumption of sphericity was not
violated, as assessed by Mauchly's test of sphericity, χ2(2) = 5.846, p = 0.054. The OLC stages
elicited statistically significant changes in perceiving a narrowly economic view of ICT-sector firms,
F(2, 262) = 5.813, p = 0.003, partial η2 = 0.042, with narrowly economic focus increasing from start-
up OLC stage (M = 5.73, SD = 0.96) to mature OLC stage (M = 5.95, SD = 0.95) to growth OLC
stage (M = 6.00, SD = 0.66). Post hoc analysis with Bonferroni adjustment revealed that perceived
narrowly economic focus of firms statistically significantly decreased from growth stage to start-up
OLC condition (M = 0.27, 95% CI [0.05, 0.49], p = 0.010), and from mature stage to start-up OLC
condition (M = 0.212, 95% CI [0.01, 0.42], p = 0.037), but not from growth condition to mature OLC
stage (M = 0.057, 95% CI [-0.13, 0.24], p = 1.000).
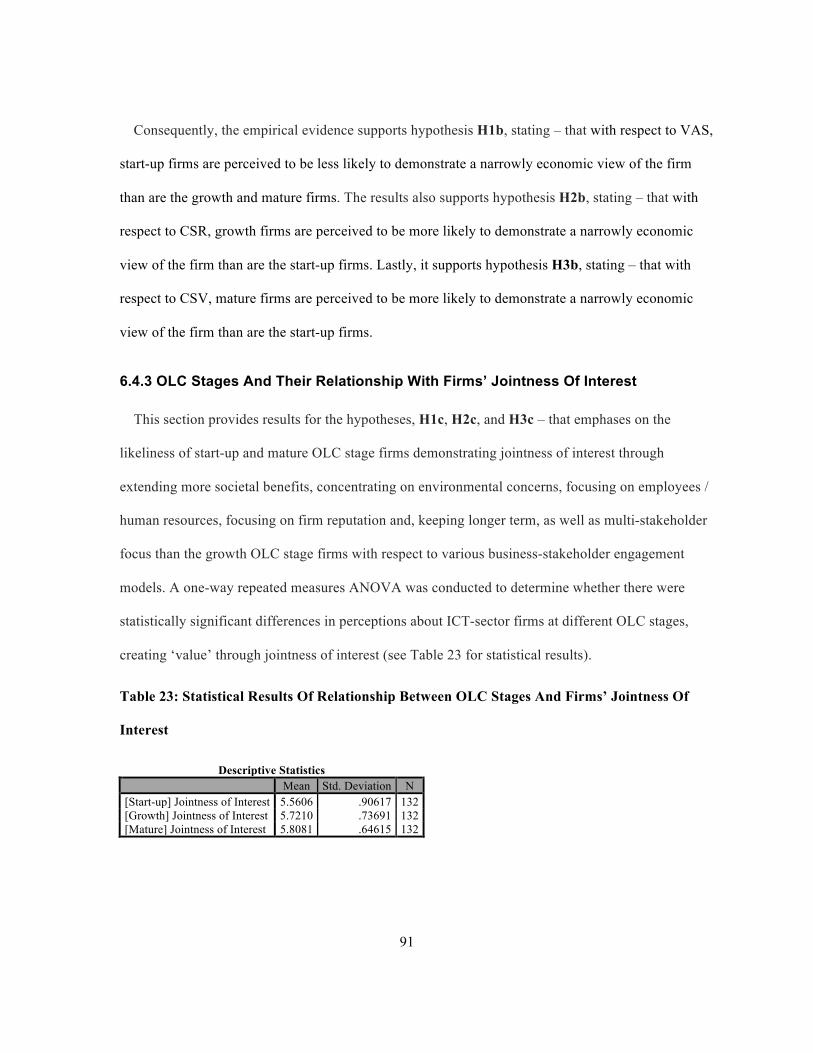
91
Consequently, the empirical evidence supports hypothesis H1b, stating – that with respect to VAS,
start-up firms are perceived to be less likely to demonstrate a narrowly economic view of the firm
than are the growth and mature firms. The results also supports hypothesis H2b, stating – that with
respect to CSR, growth firms are perceived to be more likely to demonstrate a narrowly economic
view of the firm than are the start-up firms. Lastly, it supports hypothesis H3b, stating – that with
respect to CSV, mature firms are perceived to be more likely to demonstrate a narrowly economic
view of the firm than are the start-up firms.
6.4.3 OLC Stages And Their Relationship With Firms’ Jointness Of Interest
This section provides results for the hypotheses, H1c, H2c, and H3c – that emphases on the
likeliness of start-up and mature OLC stage firms demonstrating jointness of interest through
extending more societal benefits, concentrating on environmental concerns, focusing on employees /
human resources, focusing on firm reputation and, keeping longer term, as well as multi-stakeholder
focus than the growth OLC stage firms with respect to various business-stakeholder engagement
models. A one-way repeated measures ANOVA was conducted to determine whether there were
statistically significant differences in perceptions about ICT-sector firms at different OLC stages,
creating ‘value’ through jointness of interest (see Table 23 for statistical results).
Table 23: Statistical Results Of Relationship Between OLC Stages And Firms’ Jointness Of
Interest
Descriptive Statistics Mean Std. Deviation N [Start-up] Jointness of Interest 5.5606 .90617 132 [Growth] Jointness of Interest 5.7210 .73691 132 [Mature] Jointness of Interest 5.8081 .64615 132
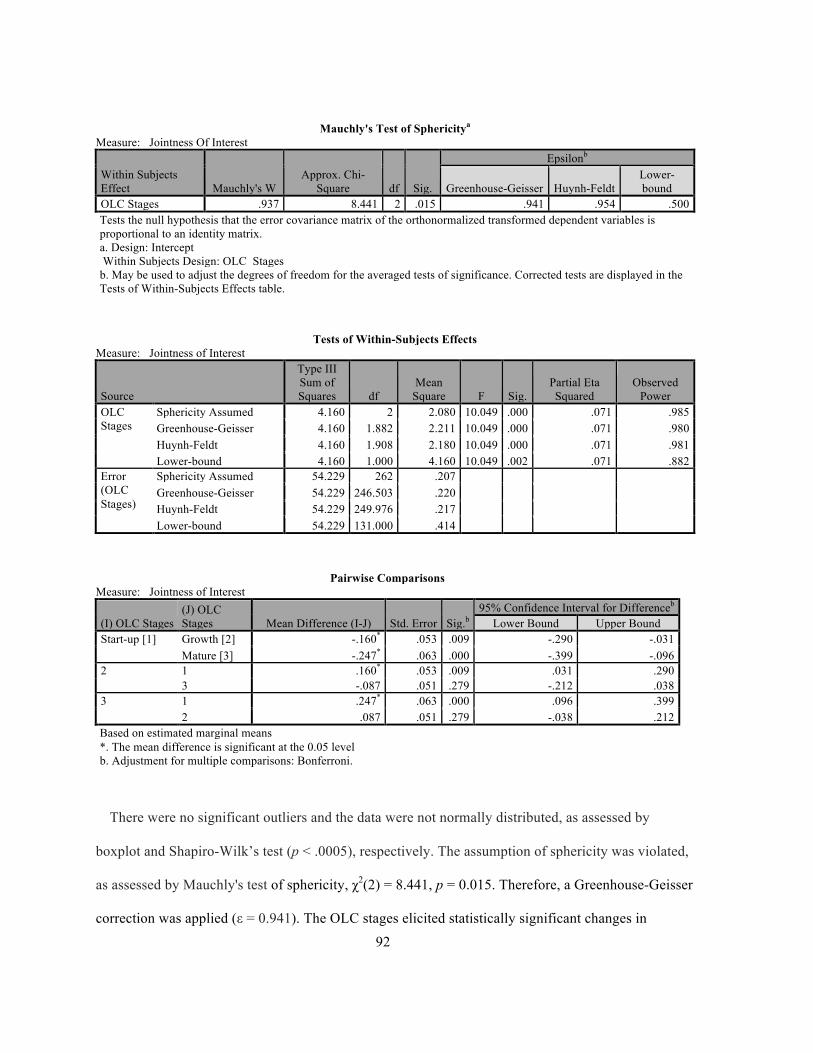
92
Mauchly's Test of Sphericitya Measure: Jointness Of Interest
Within Subjects Effect Mauchly's W
Approx. Chi-Square df Sig.
Epsilonb
Greenhouse-Geisser Huynh-Feldt Lower-bound
OLC Stages .937 8.441 2 .015 .941 .954 .500 Tests the null hypothesis that the error covariance matrix of the orthonormalized transformed dependent variables is proportional to an identity matrix. a. Design: Intercept Within Subjects Design: OLC_Stages b. May be used to adjust the degrees of freedom for the averaged tests of significance. Corrected tests are displayed in the Tests of Within-Subjects Effects table.
Tests of Within-Subjects Effects Measure: Jointness of Interest
Source
Type III Sum of Squares df
Mean Square F Sig.
Partial Eta Squared
Observed Power
OLC Stages
Sphericity Assumed 4.160 2 2.080 10.049 .000 .071 .985 Greenhouse-Geisser 4.160 1.882 2.211 10.049 .000 .071 .980 Huynh-Feldt 4.160 1.908 2.180 10.049 .000 .071 .981 Lower-bound 4.160 1.000 4.160 10.049 .002 .071 .882
Error (OLC Stages)
Sphericity Assumed 54.229 262 .207 Greenhouse-Geisser 54.229 246.503 .220 Huynh-Feldt 54.229 249.976 .217 Lower-bound 54.229 131.000 .414
Pairwise Comparisons Measure: Jointness of Interest
(I) OLC Stages (J) OLC Stages Mean Difference (I-J) Std. Error Sig.b
95% Confidence Interval for Differenceb Lower Bound Upper Bound
Start-up [1] Growth [2] -.160* .053 .009 -.290 -.031 Mature [3] -.247* .063 .000 -.399 -.096
2 1 .160* .053 .009 .031 .290 3 -.087 .051 .279 -.212 .038
3 1 .247* .063 .000 .096 .399 2 .087 .051 .279 -.038 .212
Based on estimated marginal means *. The mean difference is significant at the 0.05 level b. Adjustment for multiple comparisons: Bonferroni.
There were no significant outliers and the data were not normally distributed, as assessed by
boxplot and Shapiro-Wilk’s test (p < .0005), respectively. The assumption of sphericity was violated,
as assessed by Mauchly's test of sphericity, χ2(2) = 8.441, p = 0.015. Therefore, a Greenhouse-Geisser
correction was applied (ε = 0.941). The OLC stages elicited statistically significant changes in

93
perceiving jointness of interest of ICT-sector firms, F(1.882, 246.503) = 10.05, p < 0.001, partial η2 =
0.071, with firms’ focus on jointness of interest increasing from start-up OLC stage (M = 5.56, SD =
0.91) to growth OLC stage (M = 5.72, SD = 0.74) to mature OLC stage (M = 5.81, SD = 0.65). Post
hoc analysis with Bonferroni adjustment revealed that perceived jointness of interest of firms
statistically significantly decreased from growth stage to start-up OLC condition (M = 0.16, 95% CI
[0.03, 0.29], p = 0.009), and from mature stage to start-up OLC condition (M = 0.247, 95% CI [0.10,
0.40], p < 0.001), but not from mature condition to growth OLC stage (M = 0.087, 95% CI [-0.04,
0.21], p = 0.279).
Consequently, the empirical evidence rejects hypothesis H1c, stating – that with respect to VAS,
start-up firms are perceived to be more likely to demonstrate jointness of interest than are the growth
firms. The results also reject hypothesis H2c, stating – that with respect to CSR, growth firms are
perceived to be less likely to demonstrate jointness of interest than are the start-up and mature firms.
Lastly, it rejects hypothesis H3c, stating – that with respect to CSV, mature firms are perceived to be
more likely to demonstrate jointness of interest than are the growth firms.
In the particular case of ‘jointness of interest’, our results exhibited statistically significant
differences among OLC stages but were in opposite direction to our proposed hypotheses. We
consider that as a meaningful finding with a potential to guide our future research direction. It may be
because the start-up stage firms are perceived to have not considered as many organizational
stakeholders as legitimate, especially when compared with the growth and mature stage firms in the
ICT-sector. We may take this to mean that start-up stage firms are primarily concerned about their
survival and as a result they do not focus so much on the human resources, longer-term goals,
environmental concerns, societal benefits, and reputation. However, this speculative rationale should
be taken with caution and a critical test in follow-on research must be performed to confirm these
propositions.

94
6.5 Relationship Between ICT-Sector Occupational Experience And
Organizational Stakeholders
We used a one-way analysis of variance (ANOVA) to empirically understand the relationships
between total years of working experience in the ICT-sector and the organizational stakeholder
importance. In our data set, dependent variables, ‘Employees’, ‘Customers’, ‘ Financiers’,
‘Suppliers’, ‘Communities’, ‘Environment’, ‘Government’, ‘Non-Governmental Organizations’
(NGOs), ‘Trade Associations’, represent various organizational stakeholders. Three levels of ICT-
sector occupational experience (1 – 5 years, 6 – 10 years, and 11 years and above) were characterized
as an independent variable.
Similar to a one-way repeated measure ANOVA method, simple one-way ANOVA needs to satisfy
six basic assumptions: 1) the dependent variables used in the study should be continuous – all 9
dependents variables (organizational stakeholders) in our study were considered as continuous
variables; 2) there should be one independent variable with two or more categorical levels – our
categorical groups of ‘1 – 5’, ‘6 – 10’ and ‘11 years and above’ of ICT-sector experience were
classified as three levels of independent variable; 3) There should be no relationship between
observations in different conditions – our study participants provided independent observations in
three groups; 4) no significant outliers should influence the data – careful examination of outliers
allowed us to remove significant outliers from the data set for improved results31; 5) the data should
be approximately normally distributed – although one-way ANOVA is considered to be robust
against this assumption’s violation if the group sample sizes are equal or nearly equal32 – participants
in our study were classified into three groups nearly equal groups: 1 – 5 years (n = 44), 6 – 10 years
31 A detailed analysis of outliers is given in Appendix M. We show how extreme outliers influenced the results; and therefore they were removed from the data set. 32 For more detail see the section on ‘one-way ANOVA’ assumptions in Laerd Statistics (2015) and their recommended reference of Lix et al, (1996).
95
(n = 43), and 11 years and above (n = 38); 6) the data should have homogeneity of variance – to
assess this assumption, Levene’s test of homogeneity of variance was conducted and Welch’s
ANOVA was used instead of main ANOVA results in case of any violations (Wilcox, 2012).
In order to examine significant data outliers, we used graphical method by creating boxplots. This
analysis returned a total of 5 extreme outliers in the data set (see Appendix M for details). After ruling
out the possibilities of potential measurement and clerical errors in the data, we tested the results
with, and without extreme outliers for significant changes. The comparison of results showed
significant difference in one of the dependent variable (Financiers) result33 – therefore, we decided to
remove these extreme outliers for an improved data analyses.
We reviewed our data for normality using histograms and Q-Q plots (graphical), along-with
Shapiro-Wilk test of normality (numerical) methods for each level of within-subjects factor. The
graphical method shows our data being negatively skewed. All the 9 organizational stakeholders
(dependent variables) were not normally distributed at three levels of occupational working
experience, as assessed by Shapiro-Wilk’s test (p < 0.001)34. Similar to a one-way repeated measures
ANOVA procedure, a one-way ANOVA is also considered to be robust against the violation of
normality; therefore, we decided to continue with further analyses without suspecting results of being
substantially affected by Type 1 error rate (Laerd Statistics, 2015). Table 24 provides statistical
details of results gathered from running a one-way ANOVA procedure.
33 See Appendix M for more details about outlier analysis using one-way ANOVA. 34 See Appendix L for more details about numerically determining the normal distribution of the data.
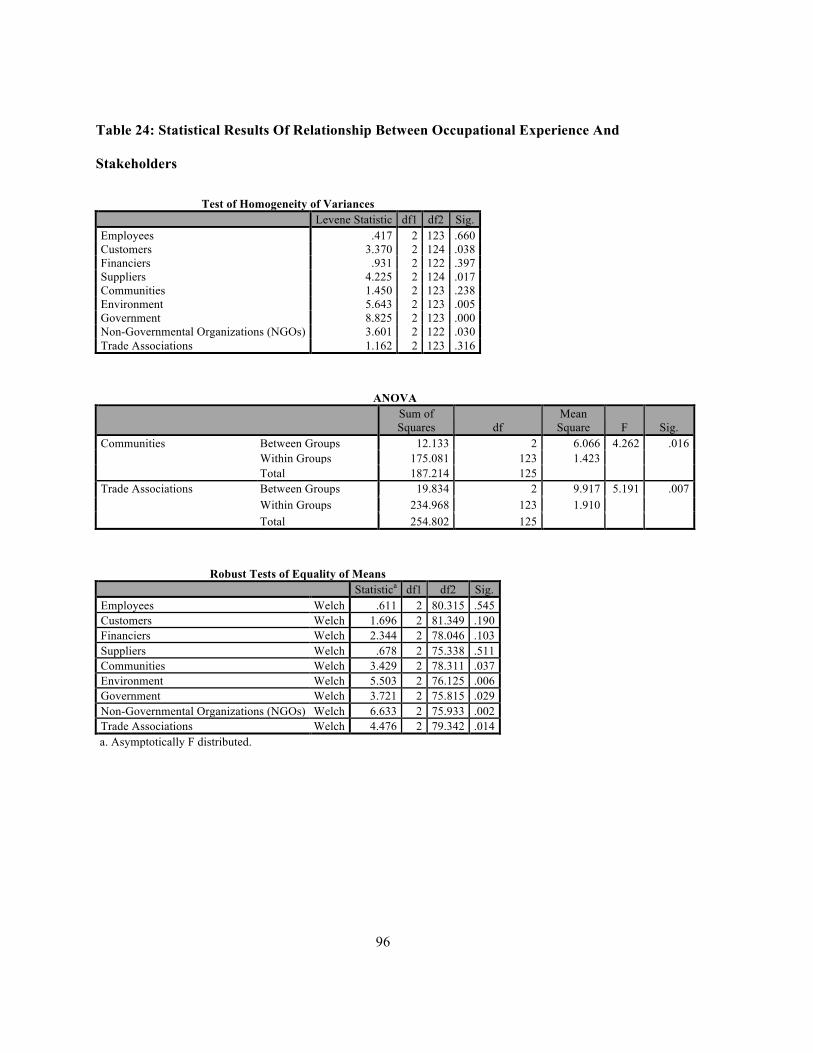
96
Table 24: Statistical Results Of Relationship Between Occupational Experience And
Stakeholders
Test of Homogeneity of Variances Levene Statistic df1 df2 Sig. Employees .417 2 123 .660 Customers 3.370 2 124 .038 Financiers .931 2 122 .397 Suppliers 4.225 2 124 .017 Communities 1.450 2 123 .238 Environment 5.643 2 123 .005 Government 8.825 2 123 .000 Non-Governmental Organizations (NGOs) 3.601 2 122 .030 Trade Associations 1.162 2 123 .316
ANOVA
Sum of Squares df
Mean Square F Sig.
Communities Between Groups 12.133 2 6.066 4.262 .016 Within Groups 175.081 123 1.423 Total 187.214 125
Trade Associations Between Groups 19.834 2 9.917 5.191 .007 Within Groups 234.968 123 1.910 Total 254.802 125
Robust Tests of Equality of Means Statistica df1 df2 Sig. Employees Welch .611 2 80.315 .545 Customers Welch 1.696 2 81.349 .190 Financiers Welch 2.344 2 78.046 .103 Suppliers Welch .678 2 75.338 .511 Communities Welch 3.429 2 78.311 .037 Environment Welch 5.503 2 76.125 .006 Government Welch 3.721 2 75.815 .029 Non-Governmental Organizations (NGOs) Welch 6.633 2 75.933 .002 Trade Associations Welch 4.476 2 79.342 .014 a. Asymptotically F distributed.
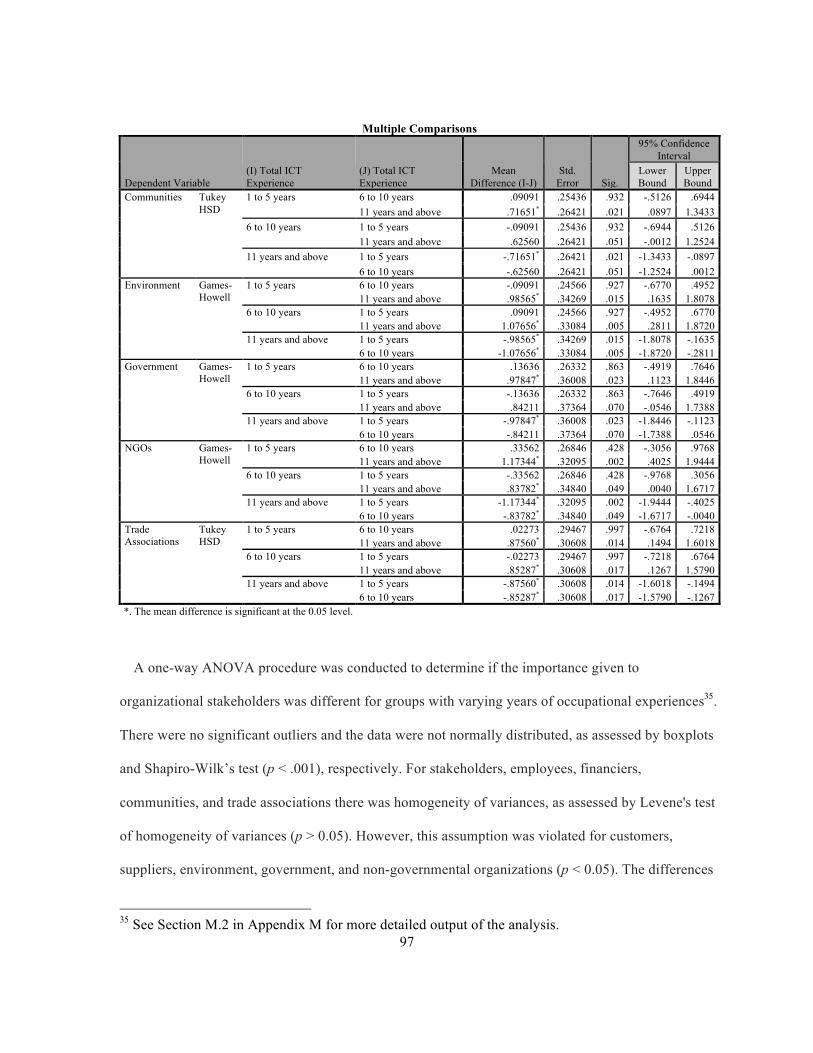
97
Multiple Comparisons
Dependent Variable (I) Total ICT Experience
(J) Total ICT Experience
Mean Difference (I-J)
Std. Error Sig.
95% Confidence Interval
Lower Bound
Upper Bound
Communities Tukey HSD
1 to 5 years 6 to 10 years .09091 .25436 .932 -.5126 .6944 11 years and above .71651* .26421 .021 .0897 1.3433
6 to 10 years 1 to 5 years -.09091 .25436 .932 -.6944 .5126 11 years and above .62560 .26421 .051 -.0012 1.2524
11 years and above 1 to 5 years -.71651* .26421 .021 -1.3433 -.0897 6 to 10 years -.62560 .26421 .051 -1.2524 .0012
Environment Games-Howell
1 to 5 years 6 to 10 years -.09091 .24566 .927 -.6770 .4952 11 years and above .98565* .34269 .015 .1635 1.8078
6 to 10 years 1 to 5 years .09091 .24566 .927 -.4952 .6770 11 years and above 1.07656* .33084 .005 .2811 1.8720
11 years and above 1 to 5 years -.98565* .34269 .015 -1.8078 -.1635 6 to 10 years -1.07656* .33084 .005 -1.8720 -.2811
Government Games-Howell
1 to 5 years 6 to 10 years .13636 .26332 .863 -.4919 .7646 11 years and above .97847* .36008 .023 .1123 1.8446
6 to 10 years 1 to 5 years -.13636 .26332 .863 -.7646 .4919 11 years and above .84211 .37364 .070 -.0546 1.7388
11 years and above 1 to 5 years -.97847* .36008 .023 -1.8446 -.1123 6 to 10 years -.84211 .37364 .070 -1.7388 .0546
NGOs Games-Howell
1 to 5 years 6 to 10 years .33562 .26846 .428 -.3056 .9768 11 years and above 1.17344* .32095 .002 .4025 1.9444
6 to 10 years 1 to 5 years -.33562 .26846 .428 -.9768 .3056 11 years and above .83782* .34840 .049 .0040 1.6717
11 years and above 1 to 5 years -1.17344* .32095 .002 -1.9444 -.4025 6 to 10 years -.83782* .34840 .049 -1.6717 -.0040
Trade Associations
Tukey HSD
1 to 5 years 6 to 10 years .02273 .29467 .997 -.6764 .7218 11 years and above .87560* .30608 .014 .1494 1.6018
6 to 10 years 1 to 5 years -.02273 .29467 .997 -.7218 .6764 11 years and above .85287* .30608 .017 .1267 1.5790
11 years and above 1 to 5 years -.87560* .30608 .014 -1.6018 -.1494 6 to 10 years -.85287* .30608 .017 -1.5790 -.1267
*. The mean difference is significant at the 0.05 level.
A one-way ANOVA procedure was conducted to determine if the importance given to
organizational stakeholders was different for groups with varying years of occupational experiences35.
There were no significant outliers and the data were not normally distributed, as assessed by boxplots
and Shapiro-Wilk’s test (p < .001), respectively. For stakeholders, employees, financiers,
communities, and trade associations there was homogeneity of variances, as assessed by Levene's test
of homogeneity of variances (p > 0.05). However, this assumption was violated for customers,
suppliers, environment, government, and non-governmental organizations (p < 0.05). The differences
35 See Section M.2 in Appendix M for more detailed output of the analysis.

98
between the occupational experience groups was not statistically significant for employees F(2, 123)
= 0.528, p = 0.591; customers, Welch’s F(2, 81.35) = 1.696, p = 0.190; financiers F(2, 122) = 2.788,
p = 0.065; and suppliers, Welch’s F(2, 75.34) = 0.678, p = 0.511.
Perceived stakeholder importance of communities was statistically significantly different between
different categories of occupational experiences, F(2, 123) = 4.262, p = 0.016. Perceived importance
increased for communities from the 11 years and above (M = 5.08, SD = 1.42), to 6 – 10 years (M =
5.70, SD = 1.70), to 1 – 5 years (M = 5.80, SD = 1.09) occupational experience groups. Tukey-HSD
post hoc analysis revealed that the mean increase from 11 years and above to 1 – 5 years was
statistically significant (p = 0.021), as well as the increase from 11 years and above to 6 – 10 years
was significantly significant (p = 0.051).
Perceived stakeholder importance of environment was statistically significantly different between
different categories of occupational experiences, Welch’s F(2,76.16) = 5.503, p = 0.006. Perceived
importance increased for environment from the 11 years and above (M = 4.61, SD = 1.78), to 1 – 5
years (M = 5.59, SD = 1.23), to 6 – 10 years (M = 5.68, SD = 1.07) occupational experience groups.
Games-Howell post hoc analysis revealed that the mean increase from 11 years and above to 1 – 5
years was statistically significant (p = 0.015), as well as the increase from 11 years and above to 6 –
10 years was significantly significant (p = 0.005).
Perceived stakeholder importance of government was statistically significantly different between
different categories of occupational experiences, Welch’s F(2,75.82) = 3.721, p = 0.029. Perceived
importance increased for government from the 11 years and above (M = 4.66, SD = 1.95), to 6 – 10
years (M = 5.50, SD = 1.32), to 1 – 5 years (M = 5.64, SD = 1.14) occupational experience groups.
Games-Howell post hoc analysis revealed that the mean increase from 11 years and above to 1 – 5
years was statistically significant (p = 0.023).
99
Perceived stakeholder importance of non-governmental organizations (NGOs) was statistically
significantly different between different categories of occupational experiences, Welch’s F(2,75.93) =
6.633, p = 0.002. Perceived importance increased for NGOs from the 11 years and above (M = 4.39,
SD = 1.70), to 6 – 10 years (M = 5.23, SD = 1.39), to 1 – 5 years (M = 5.57, SD = 1.09) occupational
experience groups. Games-Howell post hoc analysis revealed that the mean increase from 11 years
and above to 1 – 5 years was statistically significant (p = 0.002), as well as the increase from 11 years
and above to 6 – 10 years was significantly significant (p = 0.049).
Perceived stakeholder importance of trade association was statistically significantly different
between various categories of occupational experiences, F(2, 123) = 5.191, p = 0.007. Perceived
importance increased for trade associations from the 11 years and above (M = 5.58, SD = 1.55), to 6 –
10 years (M = 5.43, SD = 1.26), to 1 – 5 years (M = 5.45, SD = 1.38) occupational experience groups.
Tukey-HSD post hoc analysis revealed that the mean increase from 11 years and above to 1 – 5 years
was statistically significant (p = 0.014), as well as the increase from 11 years and above to 6 – 10
years was significantly significant (p = 0.017).
6.6 Discussion For Phase-2
The major emphasis of this chapter was to understand the perceived relationships between various
OLC stages and business-stakeholder engagement model through the three tenets of stakeholder
theory. The empirical results enabled us to establish that ICT-sector start-up stage firms are perceived
to be demonstrating a more cooperative strategic posture than the growth stage firms. We also found
that start-up stage firms perceived to be focusing lesser on narrowly economic view than the firms at
the growth and mature OLC stages. However, contrary to our prediction, start-up stage firms believed
to be exhibiting lesser degree of jointness of interest as compared to the growth and mature OLC
stages. These findings allowed us to state that the ICT-sector start-up stage firms are perceived to be
100
partially receptive toward the VAS (‘creating value for all stakeholders’) business-stakeholder
engagement model.
The evidence also suggests that growth stage firms from the ICT-sector are perceived to be lesser
cooperative than the start-up and mature stage firms. We also found that growth stage firms are
perceived to be focusing more on narrowly economic view than the firms at the start-up OLC stage.
However, contrary to our prediction, growth stage firms perceived to be exhibiting more jointness of
interest as compared to the start-up stage firms. These findings allowed us to state that the ICT-sector
growth stage firms are perceived to be partially receptive toward the CSR (‘corporate social
responsibility’) business-stakeholder engagement model.
Lastly, the evidence implies that mature stage firms from the ICT-sector are perceived to be more
cooperative than the growth stage firms. We further found that mature stage firms are perceived to be
focusing more on narrowly economic view than the start-up stage firms. However, contrary to our
prediction, mature stage firms are perceived to be exhibiting more jointness of interest than the start-
up stage firms. We predicted that both, start-up and mature stage firms should not be significantly
different in terms of their focus on the notion of jointness of interest. These findings allowed us to
state that the ICT-sector mature stage firms are perceived to be partially receptive toward the CSV
(‘creating shared value’) business-stakeholder engagement model.
Table 25 summarizes the results of hypotheses tested in the Phase-2 study.
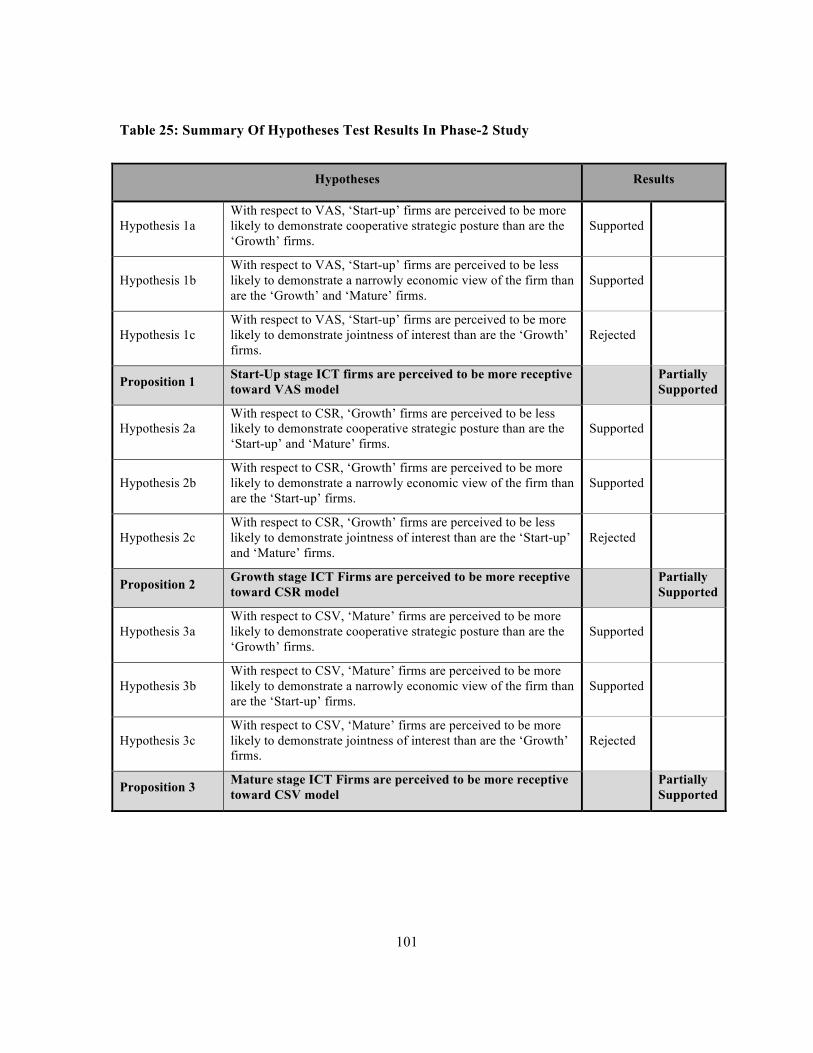
101
Table 25: Summary Of Hypotheses Test Results In Phase-2 Study
Hypotheses Results
Hypothesis 1a With respect to VAS, ‘Start-up’ firms are perceived to be more likely to demonstrate cooperative strategic posture than are the ‘Growth’ firms.
Supported
Hypothesis 1b With respect to VAS, ‘Start-up’ firms are perceived to be less likely to demonstrate a narrowly economic view of the firm than are the ‘Growth’ and ‘Mature’ firms.
Supported
Hypothesis 1c With respect to VAS, ‘Start-up’ firms are perceived to be more likely to demonstrate jointness of interest than are the ‘Growth’ firms.
Rejected
Proposition 1 Start-Up stage ICT firms are perceived to be more receptive toward VAS model Partially
Supported
Hypothesis 2a With respect to CSR, ‘Growth’ firms are perceived to be less likely to demonstrate cooperative strategic posture than are the ‘Start-up’ and ‘Mature’ firms.
Supported
Hypothesis 2b With respect to CSR, ‘Growth’ firms are perceived to be more likely to demonstrate a narrowly economic view of the firm than are the ‘Start-up’ firms.
Supported
Hypothesis 2c With respect to CSR, ‘Growth’ firms are perceived to be less likely to demonstrate jointness of interest than are the ‘Start-up’ and ‘Mature’ firms.
Rejected
Proposition 2 Growth stage ICT Firms are perceived to be more receptive toward CSR model Partially
Supported
Hypothesis 3a With respect to CSV, ‘Mature’ firms are perceived to be more likely to demonstrate cooperative strategic posture than are the ‘Growth’ firms.
Supported
Hypothesis 3b With respect to CSV, ‘Mature’ firms are perceived to be more likely to demonstrate a narrowly economic view of the firm than are the ‘Start-up’ firms.
Supported
Hypothesis 3c With respect to CSV, ‘Mature’ firms are perceived to be more likely to demonstrate jointness of interest than are the ‘Growth’ firms.
Rejected
Proposition 3 Mature stage ICT Firms are perceived to be more receptive toward CSV model Partially
Supported

102
Although, the main highlight of our research was to underpin the receptiveness of ICT-sector firms
from various OLC stages toward different business-stakeholder engagement models, we also
attempted to expand our understanding about the relationship between years of occupational
experience and importance given to a mix of internal and external organizational stakeholders. The
results showed us an interesting trend. For instance, we observed that representatives of the ICT-
sector, under 10 years of experience exhibited more importance to external stakeholders, such as,
communities, environment, government, non-governmental organizations, and trade associations – in
comparison to ICT-sector representatives above 10 years of working experience.

103
Chapter 7 Conclusion, Limitations And Future Research
7.1 Conclusion
Business dynamics have radically evolved under the catalytic effects of technological innovation
and communications around the globe. Most businesses seek to capture ‘value’ through resolution of
socio-economic issues and positive impacts. However, there are likes of Enron (2001), WorldCom
(2002), AOL (2002), Xerox (2000), MicroStrategy (2000), who are sometimes seen as promulgating
the societal impacts of fraudulent business practices and unethical ‘shareholders’ centric policies
(Cohen et al., 2013). Several academic scholars and practitioners have tried to address these complex
business issues from the viewpoints of business ethics, corporate social responsibility, environment-
business relationship, and trade sustainability, among others (Carroll, 1999; Sharma, 2000; Jenkins,
2005; Prahalad & Hart, 2002; Freeman et al., 2010; Porter & Kramer, 2011). The focus for some of
these scholars seems to have shifted toward promoting multi-stakeholder perspective, instead of
concentrating on a single or uni-stakeholder view of the firm for creating ‘value’. But without a clear
understanding and distinction between these various models, it remains difficult to assess longer-term
business sustainability and prosperity. We also seek to advance the work of Argandona (2011) which
theoretically explored the meaning of the term ‘value’ in the context of stakeholder management. Argandona
(2011) presented a view of stakeholders in his study; however, we examine firms at different organizational life
cycle (OLC) stages, describing how they actually perceive creating ‘value’ for their stakeholders. In an attempt
to advance theoretical model building of our study, we use stakeholder theory as a framework to
further measure how ‘value’ is perceived to be created or captured by organizations for their
stakeholders.
104
The main purpose of conducting this research was to explore the nascent concept of OLC stage
firms creating idiosyncratic ‘value’ for organizational stakeholders. Our efforts were driven to
underpin this notion in a systematic and scientific manner. We explored the ICT-sector firms at three:
start-up, growth, and mature OLC stages. In literature we searched for the key differentiations
between various types of business-stakeholder engagement models to hypothesize our OLC stage
trends. These business-stakeholder engagement models were identified as ‘corporate social
responsibility’ (CSR), ‘creating shared value’ (CSV) and ‘creating value for all stakeholders’ (VAS)
(Freeman et al., 2010). Using three tenets of stakeholder theory (Strand & Freeman, 2013) we
explored whether start-up, growth and mature OLC stages were more receptive toward the VAS,
CSR, and VAS models, respectively. The findings from the study established at least a partial
perceptual receptiveness relationship among the OLC stages and the business-stakeholder
engagement models in the order aforementioned.
Our study contributes to the literature on stakeholder theory, ICT-sector organizational life cycle
framework, and methods for measuring organizational decision makers’ perceptions about
stakeholder engagement. We noticed that the empirical evidence from our research – to enhance the
understanding of ICT-sector firms at various OLC stages – strengthens Donaldson and Preston
(1995), Jones and Wicks (1999), and Jawahar and McLaughlin’s (2001) notions about the descriptive
aspect of stakeholder theory. We take this to mean that the descriptive aspect of stakeholder theory
approach allow us to explore business organizations effectively. These findings could provide us with
a direction for further exploring claims of stakeholder theory – providing divergent narratives for
understanding organizations in stakeholder terms (Jones, 1995; Freeman, 1999). For instance,
instrumental claims like, multi-stakeholder perspective promoting long lasting business sustainability
and prosperity, as compared with models like residual-CSR, could be further explored using our

105
exploratory ‘value-creation’ framework. We discuss about how to apply and test these claims in the
‘Future Research’ section.
Recently, a review report was published to assess the impacts of ‘Social Value Act of United
Kingdom (2013)’. It was aimed at promoting broader social, economic and environmental benefits by
publically commissioned personnel in the procurement of supplies and services. The report
highlighted the potential and shortcomings associated with the Act in its two years tenure. The most
prominent challenges uncovered by the report were the lack of defining, measuring and quantifying
the idea of ‘social value’ (Social Value Act Review Report, 2015). We believe that our methods of
inquiry in this study may be helpful in addressing some of the outlined challenges. The overall
phenomena of promoting innovation and autonomy, even at a governmental level (in case of the
Social Value Act of UK) may be indicating that the conventional models of business-stakeholder
engagement have not delivered up to their potential. Similar legislation may influence firms in the
direction of thinking and justifying larger economic, societal and environmental impacts as a pre-
requisite to business development. However, this should not be limited to only publically funded
procurement processes – as in the case of the Social Value Act of UK.
According to Porter and Van der Linde (1995), businesses should innovate to offset the costs
associated with environmental regulations to increase industrial competitive edge. By drawing a
recent example from a non-ICT industry in a similar environmental and innovative context – the
founder of Keurig K-Cups was quoted in an interview as saying: “I feel bad sometimes that I ever did
it” – as his product threatens the environment due to the non-recyclable material used in the coffee
pods (Hamblin, 2015). This pollution attracted a severe consumer criticism and reaction.
We think some useful and practical implications follow from our work as well. For instance,
assuming our findings replicate, a society that seeks to encourage technology companies to broaden
106
their range of stakeholders for innovation (e.g., to include communities, environment) might direct
instrumental change toward ‘start-up’ firms as appreciative of VAS — even if these new firms require
some time to develop perspectives of 'jointness of interest' as they strive to become ‘growth’ and
‘mature’ firms. We may also take this to mean that typically start-up stage ICT-sector firms consider
fewer stakeholders as legitimate as compared to the growth and mature stage organizations. There
remains an opportunity to mentor start-up stage firms – such that they foster multi-stakeholder view
right from the venture inception. We believe that this ‘descriptive’ view of the stakeholder theory
provided a stronger exploratory framework to extend our understanding about how ICT-sector firms
create ‘value’ for their stakeholders. Some follow-on studies will likely be better directed based on
our study’s finding – which further advances the exploration about the ‘instrumental’ claims of the
stakeholder theory.
The evidence from our experiment-based exploratory study also showed an interesting trend. The
next generation executives, with less than 10 years of occupational experience (as compared to
executives with over 10 years of the industry experience) in the ICT-sector are perceived to be
exhibiting more importance to external / secondary business stakeholders – these including
communities, environment, government, non-governmental organizations (NGOs), and trade
associations. We take this to mean that there may be signs of a transition happening toward adapting a
multi-stakeholder view of the firms, at least as are evident in the ICT industry. Such trends increase
the importance of investigating instrumental claims about the stakeholder theory in future research.
7.2 Research Limitations
Like any other research study, our Phase-1 and Phase-2 studies also contained certain limitations.
For instance, in Phase-1 of our study, we mainly focused on three: start-up, growth, and mature OLC
stages, instead of exploring a greater variety of organizational development stages. We specifically
107
avoided including the decline stage in our study – due to practical and ethical considerations. Time
constraints also played a deciding factor for limiting the scope of our study to only three OLC stages.
Another limitation for Phase-1 study could be related to sample selections and sample size. A small
convenience sample of 18 participants was selected for this study. However, it is not uncommon in
studies using the systematic technique of repertory grid (RepGrid), working with a smaller group of
individual experts. We used the rigor of the RepGrid technique analysis to develop a better-informed
Phase-2 study to further exploring our research topic.
In the Phase-2 study, a potential limitation could be the self-reporting aspect of collecting the data,
instead of using other secondary sources. Our primary focus of conducting this research was to
understand the notion of ‘value-creation’ by organizations at different OLC stages. It was believed
that top executives of organizations have the ability to correctly reflect upon the inquired notion.
Therefore, reliance on collecting self-reported data was considered an adequate method. Another
limitation could be in terms of this study’s generalizability – we designed it as a perception-based
study. Also, the demographic characteristics of the participants make it less generalizable for a
broader ICT-sector domain and other industries.
7.3 Future Research
With the methodological adjustments to the current study – of using the differences claimed among
the start-up, growth and mature OLC stages, future empirical studies could involve the actual
behavioral observation of key tenets of stakeholder theory, such as, ‘jointness of interest’,
‘cooperative strategic posture’, and ‘narrow economic view of the firms’ (Strand & Freeman, 2013) –
instead of observing perceptions only. We may achieve these objectives by conducting longitudinal
studies or developing industrial case studies to empirically support or reject the instrumental claims of
the stakeholder theory.
108
The outcomes from Phase-1 were perceived as reflecting ‘vested-interest’ judgments from ICT
business experts. This suggests narrow, bounded, exclusive, and ‘As It Is’ tactic to understanding
stakeholder ‘value-creation’. However, we could also extend our research in the direction of
‘normative-interest’ judgments to gain further benefit. This approach may imply broad, unbounded,
inclusive, multi-stakeholder, and ‘As It Ought To Be’ focus with the ‘vested-interest’ to gain
understanding about various business-stakeholder engagement models better. We could perhaps
design a between-subjects survey study to test both, ‘vested-interest’ versus ‘normative-judgment’
constructs from a more generalized population using online crowdsourcing participant recruitment
services.
Further studying the concept of ‘value-creation’ at the global level could potentially gauge a
broader perspective about firms at different developmental stages in creating ‘value’ for primary and
secondary stakeholders. It may play a role in reducing gaps between under-developed, developing,
and developed economies of the world by promoting sustainable business models through ‘value-
creation’ that is beyond pursing the narrowly established goals.
We look to the public-policy sector to encourage ‘value-creation’ for all the stakeholders – which
could mean possibly directing businesses away from traditional CP, CSR, or CSV practices and
toward a multi-stakeholder sustainable VAS model. We might also create increased awareness about
legislation like the ‘Social Value Act of United Kingdom’ and try to replicate such initiatives to
benefit both developed economies (e.g., Canada), as well as underdeveloped / developing economies
(e.g., Pakistan), and to support resolution of some societal issues through businesses that justify
creation of broader social, economic and environmental values. However, we do acknowledge that if
such legislation is not executed well or without a clear direction, it may lead firms to ‘green wash’
their initiatives to gain social legitimacy.

109
Appendix A
Phase-1 Interview Protocol
Dear ____________________________________,
This letter is an invitation to participate in a research study. As a full-time PhD student in the Department of Management Science, Faculty of Engineering at the University of Waterloo, I am currently conducting research under the supervision of Professor Paul D. Guild toward an understanding of how firms create value.
Study Overview Our study investigates the application of various business models among ICT firms at different development stages. Your Involvement
If you agree to participate in this study, I will conduct a face-to-face interview with you. As part of the interview I would like to obtain your input on some essential elements for understanding firms creating value for their stakeholders. This activity involves me showing you some attributes about various stakeholders as identified from management literature. It will allow us to elicit personal constructs from practitioners like you. In the interview I will ask you a series of questions about how you perceive value-creation for your own stakeholders. I would ask that any opinions expressed be your own.
The interview session would last about forty-five minutes to one hour and would be arranged at a time convenient to your schedule. To ensure the effective capture of your input, I would ask your permission to audio-record the interview. Only I, the student researcher, to aid with my analyses of the input you provide and to ensure I did not miss anything you said, will review these recordings. I will erase the recordings after two years of completion of the project.
Participation in the interview session is entirely anonymous and voluntary and there are no known or anticipated risks to participation in this study. Of course, involvement in the interview will have no impact on your relationship with your performance, or your position within the organization. You may decline to answer any of the questions you do not wish to
Management Science Department - Faculty of Engineering
University of Waterloo 200 University Avenue West Waterloo, Ontario, Canada N2L 3G1
1-519 888-4567 ext. 33998 [email protected]

110
answer. Further, you may decide to withdraw from this study at any time, without any negative consequences, simply by letting me know your decision. All information you provide will be considered confidential unless otherwise agreed to, and the data collected will be kept in a secure location and confidentially disposed of in two years time.
Your name or your position will not appear in any thesis or publications resulting from this study unless you provide express consent to be identified and have reviewed the thesis text and approved the use of the quote. If you would like a summary of results, please let me know now by providing me with your email address. When the study is completed, I will send a copy of it to you. This study is expected to be completed by December 2015.
Remuneration
As a token of our appreciation, all participants will receive a $25 gift card for Amazon.
The amount received is taxable. It is your responsibility to report this amount for income tax purposes.
Contact Information
If you have any questions regarding this study, or would like additional information about participation, please contact me at 1-519-888-4567 ext. 33998 or by email [email protected]. You can also contact my supervisor Professor Paul D. Guild by telephone at 1-519-888-4567 ext. 84808 or by email at [email protected]. I assure you that this study has been reviewed and received ethics clearance through the Office of Research Ethics at the University of Waterloo. However, the final decision to participate is yours. If you have any comments or concerns resulting from you participation in this study, please contact Dr. Maureen Nummelin of this office at 1-519-888-4567 ext. 36005 or by email at [email protected].
Thank you in advance for your interest and assistance with this research.
Yours very truly,
Muhammad Umair Shah PhD Candidate Department of Management Sciences University of Waterloo
111
CONSENT FORM By signing this consent form, you are not waiving your legal rights or releasing the investigator(s) or involved institution(s) from their legal and professional responsibilities. ______________________________________________________________________
I have read the information presented in the information letter about a study being conducted by Muhammad Umair Shah (1-519-888-4567 ext. 33998 or by email at [email protected]) of the Management Science Department, Faculty of Engineering at the University of Waterloo, under the supervision of Professor Paul Guild (1-519-888-4567 ext. 84802 or by email at [email protected]). I have had an opportunity to ask any questions related to this study, to receive satisfactory answers to my questions, and any additional details I wanted. I am aware that I have the option of allowing my interview to be audio recorded to ensure an accurate recording of my responses. I am also aware that excerpts from the interview may be included in the thesis and/or publications to come from the research, with the understanding that quotations will be either anonymous or attributed to me only with my review and approval. I was informed that I may withdraw my consent at any time without penalty by advising the researcher. This project has been reviewed by, and received ethics clearance through, the Office of Research Ethics at the University of Waterloo. I was informed that if I have any comments or concerns resulting from my participation in this study, I may contact the Director, Office of Research Ethics at 519-888-4567 ext. 36005. There are a few points mentioned below, please respond by encircling any one option from the given two options:
• With full knowledge of all foregoing, I agree, of my own free will, to participate in this study (Yes / No)
• I agree to have the interview and the conversations can be audio-recorded to aid with the analyses and report writing (Yes / No)
• I agree to the use of anonymous quotations in any thesis or publication that comes of this research (Yes / No)
• I agree to the use of direct quotations attributed to me only with my review and approval (Yes / No)
Participant Name & Signature: _____________________________________________

112
TOWARD AN UNDERSTANDING OF FIRMS ‘CREATING VALUE’
An Organizational Life Cycle and Stakeholder Theory
Perspective on Business-Stakeholder Engagement Models
1. PURPOSE The purpose of this study is to understand the application of various business models among ICT firms at different developmental stages. All information provided through this interview process is completely anonymous. There will be no attribution of any opinions shared. You may stop the interview at any time. 2. INSTRUCTIONS This interview protocol follows a systematic approach for scientific purposes. Your adherence to it will be highly appreciated. The interview protocol is a mix of some open-ended and closed-ended questions and the session will last about forty-five minutes to one hour. Thank you and we hope that you enjoy it!
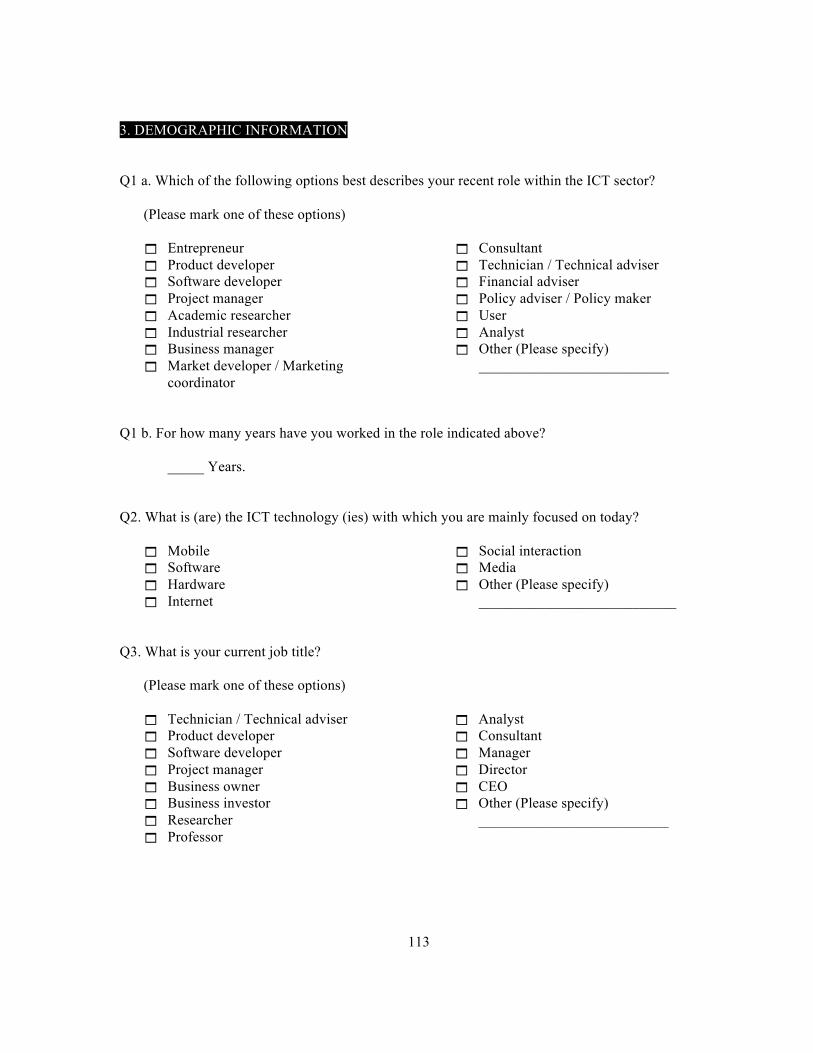
113
3. DEMOGRAPHIC INFORMATION Q1 a. Which of the following options best describes your recent role within the ICT sector?
(Please mark one of these options)
! Entrepreneur ! Product developer ! Software developer ! Project manager ! Academic researcher ! Industrial researcher ! Business manager ! Market developer / Marketing
coordinator
! Consultant ! Technician / Technical adviser ! Financial adviser ! Policy adviser / Policy maker ! User ! Analyst ! Other (Please specify)
__________________________
Q1 b. For how many years have you worked in the role indicated above?
_____ Years. Q2. What is (are) the ICT technology (ies) with which you are mainly focused on today?
! Mobile ! Software ! Hardware ! Internet
! Social interaction ! Media ! Other (Please specify)
___________________________ Q3. What is your current job title?
(Please mark one of these options)
! Technician / Technical adviser ! Product developer ! Software developer ! Project manager ! Business owner ! Business investor ! Researcher ! Professor
! Analyst ! Consultant ! Manager ! Director ! CEO ! Other (Please specify)
__________________________

114
Q4. How many years of total experience do you have in the ICT industry?
_____ Years. Q5. What is your highest educational degree?
(Please mark one of these options)
! Less than high school ! High school ! College diploma ! Undergraduate degree ! MBA or equivalent degree ! Masters degree or equivalent
graduate degree
! Doctorate degree or equivalent graduate degree
! Prefer not to answer ! Other (Please specify)
________________________
Q6. Please indicate the answer that best describes your age.
! I am under 20 years of age ! I am between 20 and 25 years of age ! I am between 26 and 35 years of age ! I am between 36 and 45 years of age ! I am between 46 and 55 years of age ! I am between 56 and 65 years of age ! I am over 66 years of age ! I prefer not to answer
Q7. What is your education and training background?
! Life sciences ! Computer sciences ! Physical sciences ! Arts / Humanities ! Engineering ! Social sciences
! Mathematics ! Business ! Prefer not to answer ! Other (Please specify)
___________________________
Q8. Which of the following terms best describe the organizations for which you work within the ICT industry?
! Business organization ! University / College ! Nonprofit organization
! Governmental organization ! Other (Please specify)
___________________________
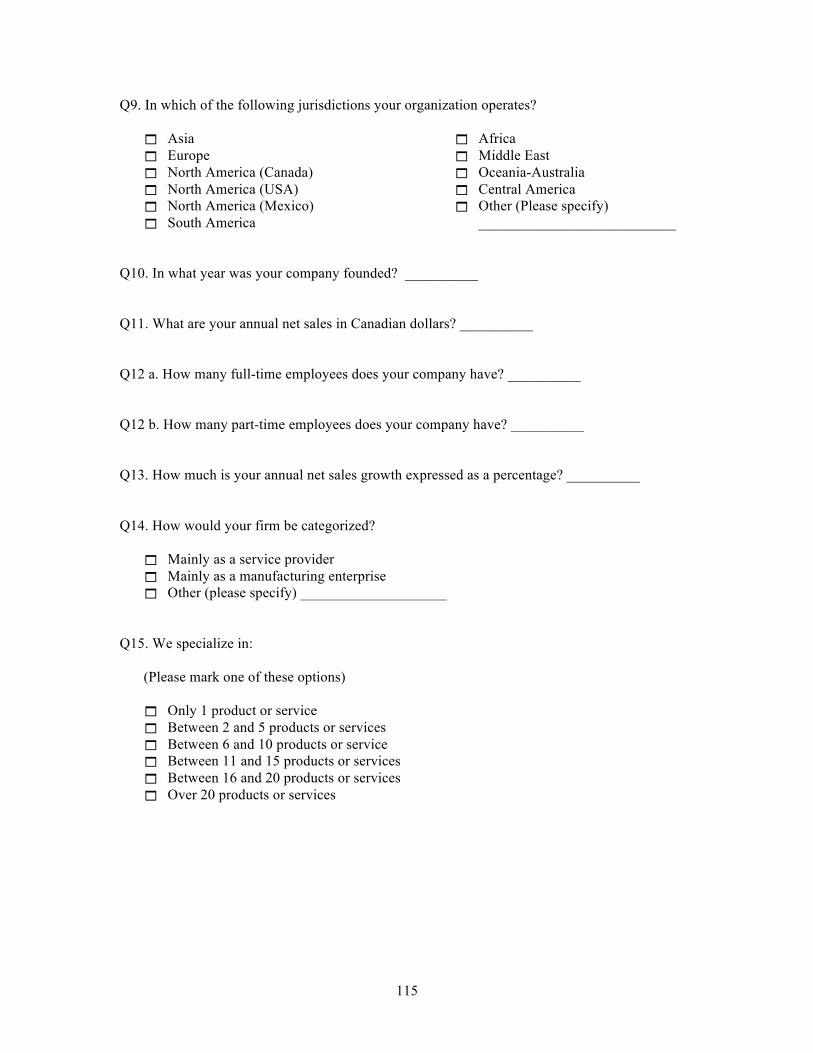
115
Q9. In which of the following jurisdictions your organization operates?
! Asia ! Europe ! North America (Canada) ! North America (USA) ! North America (Mexico) ! South America
! Africa ! Middle East ! Oceania-Australia ! Central America ! Other (Please specify)
___________________________ Q10. In what year was your company founded? __________ Q11. What are your annual net sales in Canadian dollars? __________ Q12 a. How many full-time employees does your company have? __________ Q12 b. How many part-time employees does your company have? __________ Q13. How much is your annual net sales growth expressed as a percentage? __________ Q14. How would your firm be categorized?
! Mainly as a service provider ! Mainly as a manufacturing enterprise ! Other (please specify) ____________________
Q15. We specialize in:
(Please mark one of these options)
! Only 1 product or service ! Between 2 and 5 products or services ! Between 6 and 10 products or service ! Between 11 and 15 products or services ! Between 16 and 20 products or services ! Over 20 products or services

116
Q16. On a continuum of standardized products or services versus customized products or services, in terms of the level of your product(s) or service(s) orientation, please indicate where your firm is located? Standardized Products or
Services
1 2 3 4 5 6 7 8 9 Customized Products or
Services Ο Ο Ο Ο Ο Ο Ο Ο Ο
117
4. UNDERSTANDING OF ORGANIZATIONAL LIFE CYCLE STAGES Q17 a. In your view, please identify three important differentiating factors that could define a start-up stage firm?
1. ______________________________ 2. ______________________________ 3. ______________________________
Q17 b. In your view, please identify three important differentiating factors that could define a growth stage firm?
1. ______________________________ 2. ______________________________ 3. ______________________________
Q17 c. In your view, please identify three important differentiating factors that could define a small to medium-sized enterprise?
1. ______________________________ 2. ______________________________ 3. ______________________________
Q17 d. In your view, please identify three important differentiating factors that could define a mature stage firm?
1. ______________________________ 2. ______________________________ 3. ______________________________
Q17 e. In your view, please identify three important differentiating factors that could define a decline stage firm?
1. ______________________________ 2. ______________________________ 3. ______________________________

118
Q18. Which of the following options best describe your expertise in relation to business enterprises?
(Please mark one of these options)
! Specialized knowledge of start-up stage business enterprise as a scholar (in theory)
! Specialized knowledge of start-up stage business enterprise as a practitioner (in practice)
! Specialized knowledge of growth stage business enterprise as a scholar (in theory)
! Specialized knowledge of growth stage business enterprise as a practitioner (in practice)
! Specialized knowledge of mature stage business enterprise as a scholar (in theory)
! Specialized knowledge of mature stage business enterprise as a practitioner (in practice)
Q19. In you opinion, at what stage do you consider your organization to be at?
! Start-up ! Small to medium sized ! Growth ! Maturity ! Decline

119
5. REPERTORY GRID INTERVIEW What ways two of the stakeholders are alike and in what way the third stakeholder is different from the other two in terms of your firm creating value for them. A triad is chosen at random from the following list of nine elements:
1) Financiers 2) Suppliers 3) Customers 4) Employees 5) Environment 6) Communities 7) Non-Governmental Organizations (NGOs) 8) Governments 9) Trade Associations
120
6. UNDERSTANDING OF BUSINESS-STAKEHOLDER ENGAGEMENT MODELS Q20 a. What is your most frequent way of thinking about the explanation of start-up stage organizations in terms of stakeholder engagement? Do you think that they usually have a uni-stakeholder focus OR that they have a multi-stakeholder perspective?
Uni-Stakeholder Perspective
1 2 3 4 5 6 7 8 9 Multi-Stakeholder Perspective Ο Ο Ο Ο Ο Ο Ο Ο Ο
Q20 b. What is your most frequent way of thinking about the explanation of growth stage organizations in terms of stakeholder engagement? Do you think that they usually have a uni-stakeholder focus OR that they have a multi-stakeholder perspective?
Uni-Stakeholder Perspective
1 2 3 4 5 6 7 8 9 Multi-Stakeholder Perspective Ο Ο Ο Ο Ο Ο Ο Ο Ο
Q20 c. What is your most frequent way of thinking about the explanation of mature stage organizations in terms of stakeholder engagement? Do you think that they usually have a uni-stakeholder focus OR that they have a multi-stakeholder perspective?
Uni-Stakeholder Perspective
1 2 3 4 5 6 7 8 9 Multi-Stakeholder Perspective Ο Ο Ο Ο Ο Ο Ο Ο Ο
121
Q21 a. What is your most frequent way of thinking about the explanation of start-up stage organizations in terms of their dominant aim? Do you think that they have a _____.
! Competitive focus to earn profit only
Not At All
1 2 3 4 5 6 7 8 9 A Great Deal Ο Ο Ο Ο Ο Ο Ο Ο Ο
! Cooperative focus to create profitable win-win
Not At All
1 2 3 4 5 6 7 8 9 A Great Deal Ο Ο Ο Ο Ο Ο Ο Ο Ο
! Collaborative focus including profit
Not At All
1 2 3 4 5 6 7 8 9 A Great Deal Ο Ο Ο Ο Ο Ο Ο Ο Ο
! Other (please specify) ____________________
Not At All
1 2 3 4 5 6 7 8 9 A Great Deal Ο Ο Ο Ο Ο Ο Ο Ο Ο

122
Q21 b. What is your most frequent way of thinking about the explanation of growth stage organizations in terms of their dominant aim? Do you think that they have a _____.
! Competitive focus to earn profit only
Not At All
1 2 3 4 5 6 7 8 9 A Great Deal Ο Ο Ο Ο Ο Ο Ο Ο Ο
! Cooperative focus to create profitable win-win
Not At All
1 2 3 4 5 6 7 8 9 A Great Deal Ο Ο Ο Ο Ο Ο Ο Ο Ο
! Collaborative focus including profit
Not At All
1 2 3 4 5 6 7 8 9 A Great Deal Ο Ο Ο Ο Ο Ο Ο Ο Ο
! Other (please specify) ____________________
Not At All
1 2 3 4 5 6 7 8 9 A Great Deal Ο Ο Ο Ο Ο Ο Ο Ο Ο

123
Q21 c. What is your most frequent way of thinking about the explanation of mature stage organizations in terms of their dominant aim? Do you think that they have a _____.
! Competitive focus to earn profit only
Not At All
1 2 3 4 5 6 7 8 9 A Great Deal Ο Ο Ο Ο Ο Ο Ο Ο Ο
! Cooperative focus to create profitable win-win
Not At All
1 2 3 4 5 6 7 8 9 A Great Deal Ο Ο Ο Ο Ο Ο Ο Ο Ο
! Collaborative focus including profit
Not At All
1 2 3 4 5 6 7 8 9 A Great Deal Ο Ο Ο Ο Ο Ο Ο Ο Ο
! Other (please specify) ____________________
Not At All
1 2 3 4 5 6 7 8 9 A Great Deal Ο Ο Ο Ο Ο Ο Ο Ο Ο

124
Q22 a. What is your most frequent way of thinking about the explanation of start-up stage organizations in terms of their economic focus? Do you think that it is their _____.
! Primary concern, with little or no distraction
Not At All
1 2 3 4 5 6 7 8 9 A Great Deal Ο Ο Ο Ο Ο Ο Ο Ο Ο
! Shared concern between partners
Not At All
1 2 3 4 5 6 7 8 9 A Great Deal Ο Ο Ο Ο Ο Ο Ο Ο Ο
! One concern among several
Not At All
1 2 3 4 5 6 7 8 9 A Great Deal Ο Ο Ο Ο Ο Ο Ο Ο Ο
! Other (please specify) ____________________
Not At All
1 2 3 4 5 6 7 8 9 A Great Deal Ο Ο Ο Ο Ο Ο Ο Ο Ο
125
Q22 b. What is your most frequent way of thinking about the explanation of growth stage organizations in terms of their economic focus? Do you think that it is their _____.
! Primary concern, with little or no distraction
Not At All
1 2 3 4 5 6 7 8 9 A Great Deal Ο Ο Ο Ο Ο Ο Ο Ο Ο
! Shared concern between partners
Not At All
1 2 3 4 5 6 7 8 9 A Great Deal Ο Ο Ο Ο Ο Ο Ο Ο Ο
! One concern among several
Not At All
1 2 3 4 5 6 7 8 9 A Great Deal Ο Ο Ο Ο Ο Ο Ο Ο Ο
! Other (please specify) ____________________
Not At All
1 2 3 4 5 6 7 8 9 A Great Deal Ο Ο Ο Ο Ο Ο Ο Ο Ο

126
Q22 c. What is your most frequent way of thinking about the explanation of mature stage organizations in terms of their economic focus? Do you think that it is their _____.
! Primary concern, with little or no distraction
Not At All
1 2 3 4 5 6 7 8 9 A Great Deal Ο Ο Ο Ο Ο Ο Ο Ο Ο
! Shared concern between partners
Not At All
1 2 3 4 5 6 7 8 9 A Great Deal Ο Ο Ο Ο Ο Ο Ο Ο Ο
! One concern among several
Not At All
1 2 3 4 5 6 7 8 9 A Great Deal Ο Ο Ο Ο Ο Ο Ο Ο Ο
! Other (please specify) ____________________
Not At All
1 2 3 4 5 6 7 8 9 A Great Deal Ο Ο Ο Ο Ο Ο Ο Ο Ο

127
Q23. When thinking about business-stakeholder engagement models, how could each of these be described as newer versus older paradigms?
! Corporate Social Responsibility (CSR)
Older
Paradigm
1 2 3 4 5 6 7 8 9 Newer
Paradigm
Don’t Know
Ο Ο Ο Ο Ο Ο Ο Ο Ο Ο
! Creating Shared Value (CSV)
Older
Paradigm
1 2 3 4 5 6 7 8 9 Newer
Paradigm
Don’t Know
Ο Ο Ο Ο Ο Ο Ο Ο Ο Ο
! Creating Value For All Stakeholders (VAS)
Older
Paradigm
1 2 3 4 5 6 7 8 9 Newer
Paradigm
Don’t Know
Ο Ο Ο Ο Ο Ο Ο Ο Ο Ο
128
Q24. In terms of the importance of stakeholders to an organization most familiar to you, please rank order the following (1 = most important and 9 = least important)
Communities _____ Financiers _____ Employees _____ Suppliers _____ Customers _____ Environment _____ NGOs _____ Government _____ Trade Associations _____
This example organization is a ____firm
! Start-up ! Small to medium sized ! Growth ! Mature ! Declining

129
Dear Participant, I would like to thank you for your participation in this study. As a reminder, the purpose of this study is to investigate the application of various business models among ICT firms at different development stages. The data collected through interviews will contribute to a better understanding of firms at different development stages creating 'value' for their stakeholders. Please remember that any data pertaining to you as an individual participant will be kept confidential. Once all the data are collected and analyzed for this project, I plan on sharing this information with the research community through seminars, conferences, presentations, and journal articles. If you are interested in receiving more information regarding the results of this study, or if you have any questions or concerns, please contact me at either the phone number or email address listed at the bottom of the page. If you would like a summary of the results, please let me know now by providing me with your email address. When the study is completed, I will send it to you. The study is expected to be completed by December 2015. I have also shared my faculty supervisor's name and contact information as an alternative person to contact if there are questions about the study results or final paper at the bottom of the page. This project has been reviewed and received ethics clearance through a University of Waterloo Research Ethics Committee. However, the final decision about participation is yours. Participants who have concerns or questions about their involvement in the project may contact the Chief Ethics Officer, Office of Research Ethics at 519-888-4567, Ext. 36005 or [email protected] Muhammad Umair Shah PhD Candidate Department of Management Sciences University of Waterloo 1-519-888-4567 ext. 33998 [email protected] Dr. Paul D. Guild Faculty Supervisor Department of Management Sciences University of Waterloo 1-519-888-4567 ext. 84802 [email protected]
Management Science Department - Faculty of Engineering
University of Waterloo 200 University Avenue West Waterloo, Ontario, Canada N2L 3G1
1-519 888-4567 ext. 33998 [email protected]

130
As a token of appreciation, I have received a C$25 Amazon gift certificate through email. The amount received is taxable. It is your responsibility to report this amount for income tax purposes. ____________________________ Name of the participant ____________________________ Signature of the participant ____________________________ Date ____________________________ Witness name ____________________________ Witness signature ____________________________ Date
131
Appendix B
Cue Cards Of Elements And Definitions Of Stakeholders And OLC Stages
EMPLOYEES
COMMUNITIES
CUSTOMERS
132
SUPPLIERS
NON-GOVERNMENTAL
ORGANIZATIONS
(NGOs)
FINANCIERS
133
GOVERNMENT
TRADE
ASSOCIATIONS
ENVIRONMENT
134
What is meant by Start-Up, Growth and Mature stage
organizations?
According to the literature there are multiple stages an
organization has to go through as it develops. This
phenomenon is known as ‘Organizational Life Cycle’.
The various stages, such as start-up, growth and mature
consist of different sets of organizational activities and
structures.
What is a Stakeholder?
“Business can be understood as a set of relationships among
groups which have a stake in the activities that make up the
business.
Any group or individual who can affect or is affected by the
achievement of the organization objectives.” – Freeman et
al. (2010)
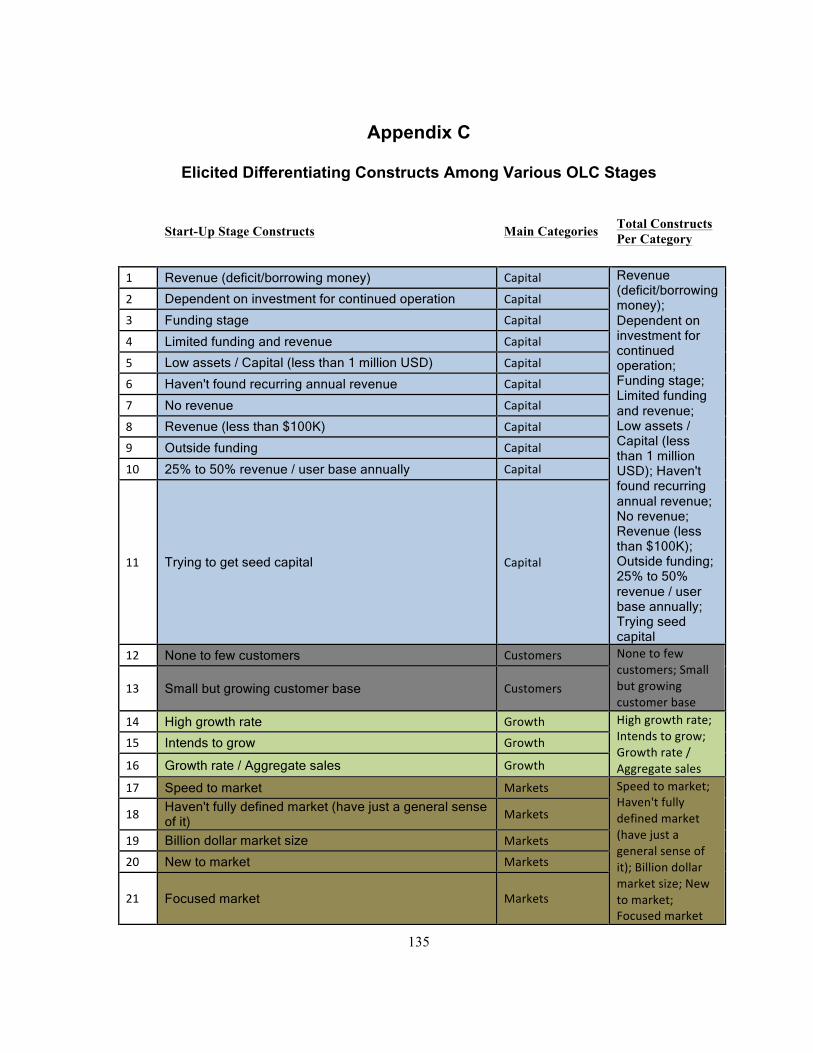
135
Appendix C
Elicited Differentiating Constructs Among Various OLC Stages
Start-Up Stage Constructs Main Categories Total Constructs Per Category
1 Revenue (deficit/borrowing money) Capital Revenue
(deficit/borrowing money); Dependent on investment for continued operation; Funding stage; Limited funding and revenue; Low assets / Capital (less than 1 million USD); Haven't found recurring annual revenue; No revenue; Revenue (less than $100K); Outside funding; 25% to 50% revenue / user base annually; Trying seed capital
2 Dependent on investment for continued operation Capital
3 Funding stage Capital
4 Limited funding and revenue Capital
5 Low assets / Capital (less than 1 million USD) Capital
6 Haven't found recurring annual revenue Capital
7 No revenue Capital
8 Revenue (less than $100K) Capital
9 Outside funding Capital
10 25% to 50% revenue / user base annually Capital
11 Trying to get seed capital Capital
12 None to few customers Customers None to few customers; Small but growing customer base
13 Small but growing customer base Customers
14 High growth rate Growth High growth rate; Intends to grow; Growth rate / Aggregate sales
15 Intends to grow Growth
16 Growth rate / Aggregate sales Growth
17 Speed to market Markets Speed to market; Haven't fully defined market (have just a general sense of it); Billion dollar market size; New to market; Focused market
18 Haven't fully defined market (have just a general sense of it)
Markets
19 Billion dollar market size Markets
20 New to market Markets
21 Focused market Markets
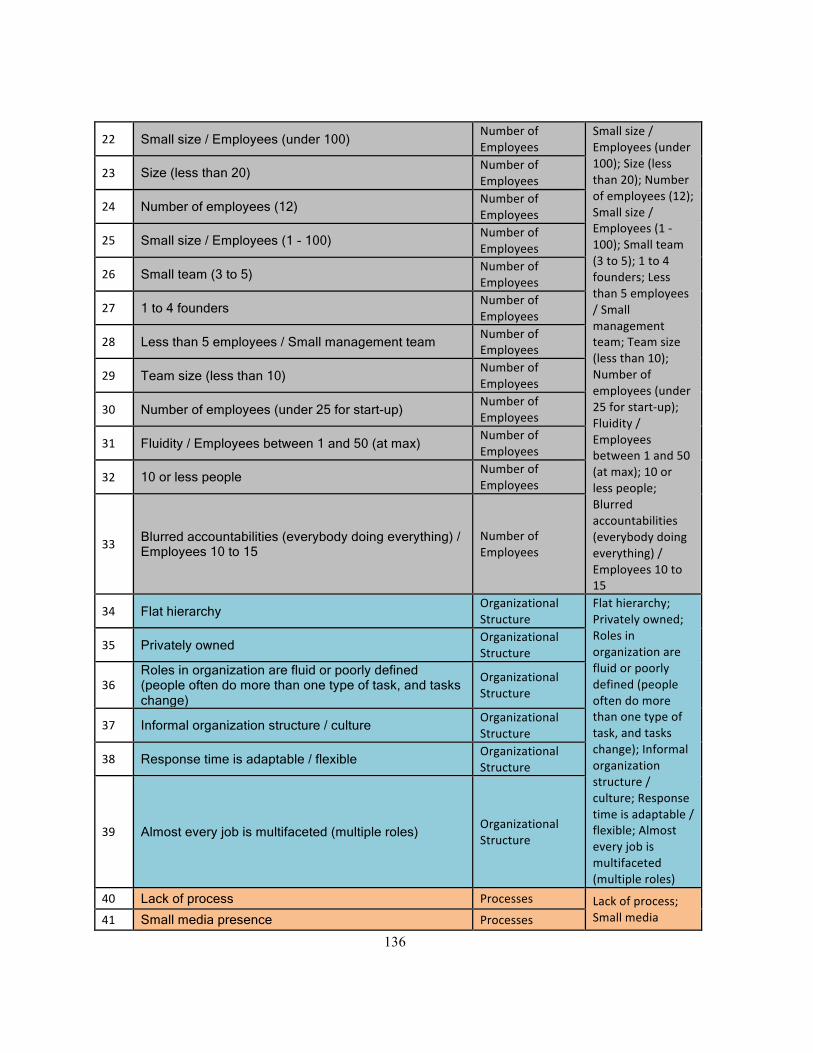
136
22 Small size / Employees (under 100) Number of Employees
Small size / Employees (under 100); Size (less than 20); Number of employees (12); Small size / Employees (1 -‐ 100); Small team (3 to 5); 1 to 4 founders; Less than 5 employees / Small management team; Team size (less than 10); Number of employees (under 25 for start-‐up); Fluidity / Employees between 1 and 50 (at max); 10 or less people; Blurred accountabilities (everybody doing everything) / Employees 10 to 15
23 Size (less than 20) Number of Employees
24 Number of employees (12) Number of Employees
25 Small size / Employees (1 - 100) Number of Employees
26 Small team (3 to 5) Number of Employees
27 1 to 4 founders Number of Employees
28 Less than 5 employees / Small management team Number of Employees
29 Team size (less than 10) Number of Employees
30 Number of employees (under 25 for start-up) Number of Employees
31 Fluidity / Employees between 1 and 50 (at max) Number of Employees
32 10 or less people Number of Employees
33 Blurred accountabilities (everybody doing everything) / Employees 10 to 15
Number of Employees
34 Flat hierarchy Organizational Structure
Flat hierarchy; Privately owned; Roles in organization are fluid or poorly defined (people often do more than one type of task, and tasks change); Informal organization structure / culture; Response time is adaptable / flexible; Almost every job is multifaceted (multiple roles)
35 Privately owned Organizational Structure
36 Roles in organization are fluid or poorly defined (people often do more than one type of task, and tasks change)
Organizational Structure
37 Informal organization structure / culture Organizational Structure
38 Response time is adaptable / flexible Organizational Structure
39 Almost every job is multifaceted (multiple roles) Organizational Structure
40 Lack of process Processes Lack of process; Small media 41 Small media presence Processes

137
presence
42 Non commercialized product Products/Services Non commercialized product; Uncertainty of target markets / Beta testing; Product development / Customers (paying); Product is not mature (hasn't reached the market); Product(s) offered are subject to substantial change (pivoting); Minimum viable product (MVP); Products/Services (less than 3)
43 Uncertainty of target markets / Beta testing Products/Services
44 Product development / Customers (paying) Products/Services
45 Product is not mature (hasn't reached the market) Products/Services
46 Product(s) offered are subject to substantial change (pivoting)
Products/Services
47 Minimum viable product (MVP) Products/Services
48 Products/Services (less than 3) Products/Services
49 Low sales Sales Low sales; Less than $500K sales 50 Less than $500K sales Sales
51 Technical knowledge (lower) Skills Technical knowledge (lower); Entrepreneur driven; One technology; Technology focus
52 Entrepreneur driven Skills
53 One technology Skills
54 Technology focus Skills
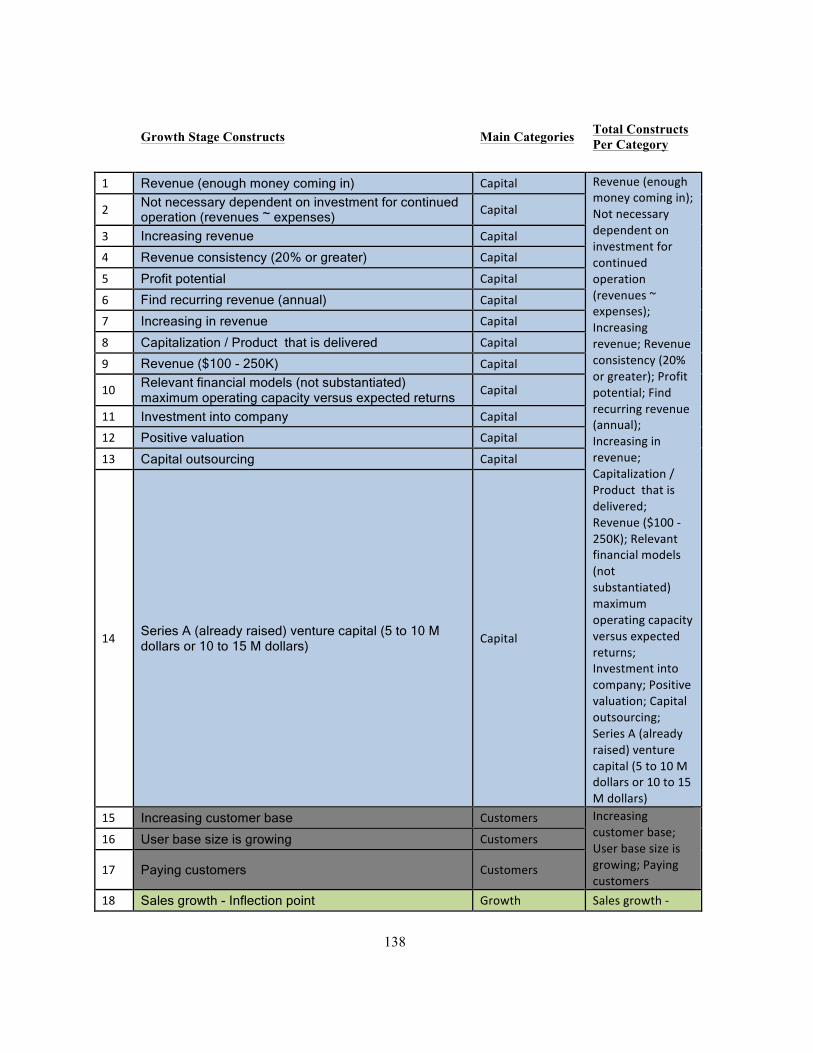
138
Growth Stage Constructs Main Categories Total Constructs Per Category
1 Revenue (enough money coming in) Capital Revenue (enough
money coming in); Not necessary dependent on investment for continued operation (revenues ~ expenses); Increasing revenue; Revenue consistency (20% or greater); Profit potential; Find recurring revenue (annual); Increasing in revenue; Capitalization / Product that is delivered; Revenue ($100 -‐ 250K); Relevant financial models (not substantiated) maximum operating capacity versus expected returns; Investment into company; Positive valuation; Capital outsourcing; Series A (already raised) venture capital (5 to 10 M dollars or 10 to 15 M dollars)
2 Not necessary dependent on investment for continued operation (revenues ~ expenses)
Capital
3 Increasing revenue Capital
4 Revenue consistency (20% or greater) Capital
5 Profit potential Capital
6 Find recurring revenue (annual) Capital
7 Increasing in revenue Capital
8 Capitalization / Product that is delivered Capital
9 Revenue ($100 - 250K) Capital
10 Relevant financial models (not substantiated) maximum operating capacity versus expected returns
Capital
11 Investment into company Capital
12 Positive valuation Capital
13 Capital outsourcing Capital
14 Series A (already raised) venture capital (5 to 10 M dollars or 10 to 15 M dollars)
Capital
15 Increasing customer base Customers Increasing customer base; User base size is growing; Paying customers
16 User base size is growing Customers
17 Paying customers Customers
18 Sales growth - Inflection point Growth Sales growth -‐

139
19 High growth rate Growth Inflection point; High growth rate; Investment required to sustain substantial growth / 300% to 2000% annual growth potential; Nearly 50% growth or maybe more; 20 % revenue growth Y/Y; 25% monthly to 100% growth annually; Growth rate is greater than 10%
20 Investment required to sustain substantial growth / 300% to 2000% annual growth potential
Growth
21 Nearly 50% growth or maybe more Growth
22 20 % revenue growth Y/Y Growth
23 25% monthly to 100% growth annually Growth
24 Growth rate is greater than 10% Growth
25 Market defined / Adequate funding Markets Market defined / Adequate funding; Billion dollar market size
26 Billion dollar market size Markets
27 Medium sized company / Employees (over 100) Number of Employees Medium sized
company / Employees (over 100); Scale of customers and employees (30 employees); 5 to 20 employees; Size (20 -‐ 50 employees); More employees (2000); Established team (5 to 10); Employee count is 100; Increased hiring; 30 to 100 employees; Bigger management team; Increasing number of employees
28 Scale of customers and employees (30 employees) Number of Employees
29 5 to 20 employees Number of Employees
30 Size (20 - 50 employees) Number of Employees
31 More employees (2000) Number of Employees
32 Established team (5 to 10) Number of Employees
33 Employee count is 100 Number of Employees
34 Increased hiring Number of Employees
35 30 to 100 employees Number of Employees
36 Bigger management team Number of Employees
37 Increasing number of employees Number of Employees
38 Devolution of management, hierarchy, but few levels (less than 5)
Organizational Structure
Devolution of management, hierarchy, but few levels (less than 5); Less flexible;
39 Less flexible Organizational Structure
40 Formalization of corporate structure - people have Organizational

140
more specific job descriptions Structure Formalization of corporate structure -‐ people have more specific job descriptions
41 Service fee is higher Processes Service fee is higher; Scramble / to get organized / process / increased marketing & awareness (with target market); Maturity in systems / processes; Formalized hiring (2 or more). Process formalized. Defined description
42 Scramble / to get organized / process / increased marketing & awareness (with target market)
Processes
43 Maturity in systems / processes Processes
44 Formalized hiring (2 or more). Process formalized. Defined description
Processes
45 Expanded scope of work (Multiple products) Products/Services Expanded scope of work (Multiple products); Product fully commercialized; Diverse product line; Products/Services (3 -‐ 5); Level of product development / stability; Scaling up production
46 Product fully commercialized Products/Services
47 Diverse product line Products/Services
48 Products/Services (3 - 5) Products/Services
49 Level of product development / stability Products/Services
50 Scaling up production Products/Services
51 Sales increasing Sales Sales increasing; $500K to $3 million sales; Certain amount of sales and revenue -‐ achieved (users) traction
52 $500K to $3 million sales Sales
53 Certain amount of sales and revenue - achieved (users) traction
Sales
54 Technology focus Skills Technology focus

141
Mature Stage Constructs Main Categories Total Constructs Per Category
1 No longer increasing annual revenue Capital No longer
increasing annual revenue; Stable revenue stream; Higher than average revenue; Revenue (over $1M); Profitable / less risk averse; Self sustaining in terms of revenue
2 Stable revenue stream Capital
3 Higher than average revenue Capital
4 Revenue (over $1M) Capital
5 Profitable / less risk averse Capital
6 Self sustaining in terms of revenue Capital
7 Actively focused to avoid customer churn/turnover Customers Actively focused to avoid customer churn/turnover; Large customer base
8 Large customer base Customers
9 Consistent profitability (with a guesstimate of 5% to 30% annual growth)
Growth Consistent profitability (with a guesstimate of 5% to 30% annual growth); Looking for new opportunities / revenue growth 1 to 3 %; Revenue growth is low (less than 10% growth); Smaller growth rate / large aggregate sales; Low growth rate; Stable year over year growth; No significant increase in revenue (~10% growth); Limited growth opportunities in primary markets (e.g. Microsoft entered games with XBox); Growth through acquisition; Growth through
10 Looking for new opportunities / revenue growth 1 to 3 %
Growth
11 Revenue growth is low (less than 10% growth) Growth
12 Smaller growth rate / large aggregate sales Growth
13 Low growth rate Growth
14 Stable year over year growth Growth
15 No significant increase in revenue (~10% growth) Growth
16 Limited growth opportunities in primary markets (e.g. Microsoft entered games with XBox)
Growth
17 Growth through acquisition Growth
18 Growth through acquisition Growth
19 "Easy marketing $" / Budget / Awareness is high / 10% to 15% annual revenue growth
Growth
20 Growth rate 5 to 8 % Growth

142
acquisition; "Easy marketing $" / Budget / Awareness is high / 10% to 15% annual revenue growth; Growth rate 5 to 8 %
21 Market leader Markets Market leader; Floated publicly; From IPO to private equity; Publicly held (IP); Diverse in several market -‐ more products; Expand into new markets, expand product line
22 Floated publicly Markets
23 From IPO to private equity Markets
24 Publicly held (IP) Markets
25 Diverse in several market - more products Markets
26 Expand into new markets, expand product line Markets
27 No significant increase (gradual increase in number of employees)
Number of Employees
No significant increase (gradual increase in number of employees); Size (over 100 employees); 20 employees; Team (500 plus); Hierarchy (upper management) / Top down approach / around 100 to 500 employees; Not actively hiring new employees; Number of employees (250 plus); Large employee numbers; Employees in 1000s; More number of employees; 10,000 employees
28 Size (over 100 employees) Number of Employees
29 20 employees Number of Employees
30 Team (500 plus) Number of Employees
31 Hierarchy (upper management) / Top down approach / around 100 to 500 employees
Number of Employees
32 Not actively hiring new employees Number of Employees
33 Number of employees (250 plus) Number of Employees
34 Large employee numbers Number of Employees
35 Employees in 1000s Number of Employees
36 More number of employees Number of Employees
37 10,000 employees Number of Employees
38 "Bureaucracy" (high process / red tape) Organizational Structure
"Bureaucracy" (high process / red tape); 39 Bureaucracy Organizational
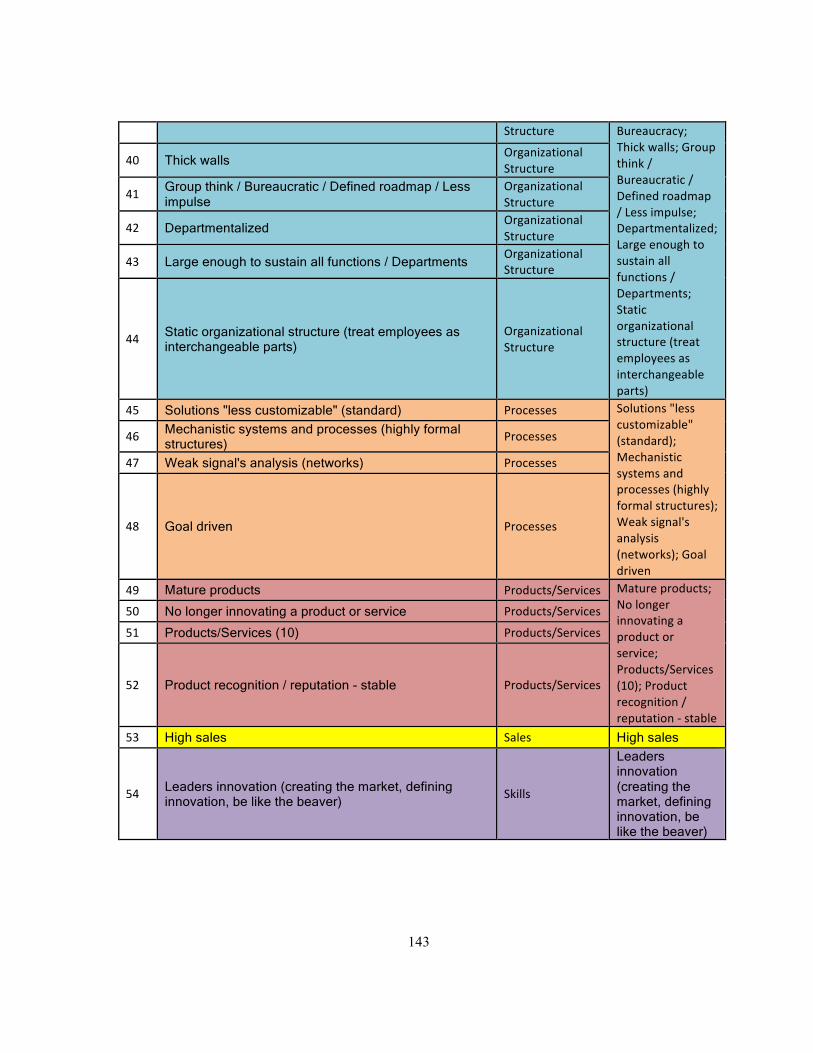
143
Structure Bureaucracy; Thick walls; Group think / Bureaucratic / Defined roadmap / Less impulse; Departmentalized; Large enough to sustain all functions / Departments; Static organizational structure (treat employees as interchangeable parts)
40 Thick walls Organizational Structure
41 Group think / Bureaucratic / Defined roadmap / Less impulse
Organizational Structure
42 Departmentalized Organizational Structure
43 Large enough to sustain all functions / Departments Organizational Structure
44 Static organizational structure (treat employees as interchangeable parts)
Organizational Structure
45 Solutions "less customizable" (standard) Processes Solutions "less customizable" (standard); Mechanistic systems and processes (highly formal structures); Weak signal's analysis (networks); Goal driven
46 Mechanistic systems and processes (highly formal structures)
Processes
47 Weak signal's analysis (networks) Processes
48 Goal driven Processes
49 Mature products Products/Services Mature products; No longer innovating a product or service; Products/Services (10); Product recognition / reputation -‐ stable
50 No longer innovating a product or service Products/Services
51 Products/Services (10) Products/Services
52 Product recognition / reputation - stable Products/Services
53 High sales Sales High sales
54 Leaders innovation (creating the market, defining innovation, be like the beaver)
Skills
Leaders innovation (creating the market, defining innovation, be like the beaver)
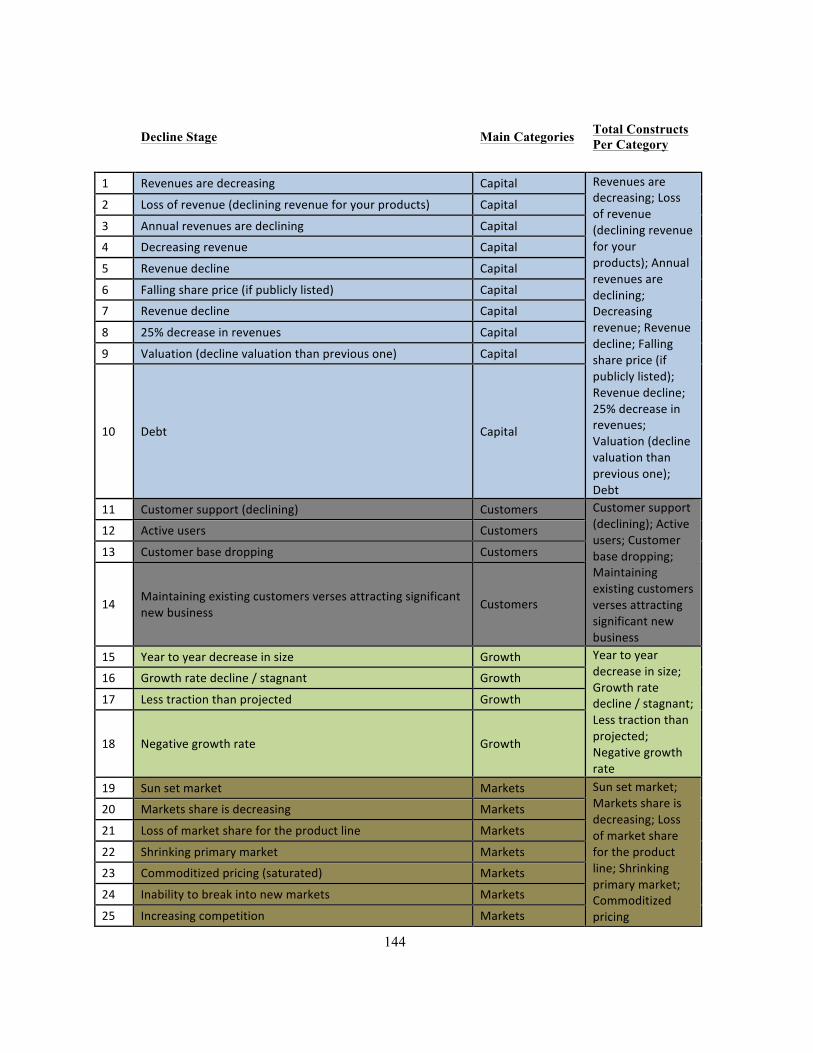
144
Decline Stage Main Categories Total Constructs Per Category
1 Revenues are decreasing Capital Revenues are
decreasing; Loss of revenue (declining revenue for your products); Annual revenues are declining; Decreasing revenue; Revenue decline; Falling share price (if publicly listed); Revenue decline; 25% decrease in revenues; Valuation (decline valuation than previous one); Debt
2 Loss of revenue (declining revenue for your products) Capital
3 Annual revenues are declining Capital
4 Decreasing revenue Capital
5 Revenue decline Capital
6 Falling share price (if publicly listed) Capital
7 Revenue decline Capital
8 25% decrease in revenues Capital
9 Valuation (decline valuation than previous one) Capital
10 Debt Capital
11 Customer support (declining) Customers Customer support (declining); Active users; Customer base dropping; Maintaining existing customers verses attracting significant new business
12 Active users Customers
13 Customer base dropping Customers
14 Maintaining existing customers verses attracting significant new business
Customers
15 Year to year decrease in size Growth Year to year decrease in size; Growth rate decline / stagnant; Less traction than projected; Negative growth rate
16 Growth rate decline / stagnant Growth
17 Less traction than projected Growth
18 Negative growth rate Growth
19 Sun set market Markets Sun set market; Markets share is decreasing; Loss of market share for the product line; Shrinking primary market; Commoditized pricing
20 Markets share is decreasing Markets
21 Loss of market share for the product line Markets
22 Shrinking primary market Markets
23 Commoditized pricing (saturated) Markets
24 Inability to break into new markets Markets
25 Increasing competition Markets

145
(saturated); Inability to break into new markets; Increasing competition
26 Large team (500 plus) that decreasing Number of Employees
Large team (500 plus) that decreasing; PR management in crisis / Negative economic impact / 100 to 250 employees; Laying off (downsizing) employees; Job cuts; Lay offs and no cost efficiencies; Stable employee numbers (or negative); Negative hiring; Attrition; Attrition (employees); Attrition rate is higher
27 PR management in crisis / Negative economic impact / 100 to 250 employees
Number of Employees
28 Laying off (downsizing) employees Number of Employees
29 Job cuts Number of Employees
30 Lay offs and no cost efficiencies Number of Employees
31 Stable employee numbers (or negative) Number of Employees
32 Negative hiring Number of Employees
33 Attrition Number of Employees
34 Attrition (employees) Number of Employees
35 Attrition rate is higher Number of Employees
36 Roles in organization become very rigid Organizational Structure
Roles in organization become very rigid; Management heavy / Slow decisioning process; Politics / bureaucratic (more time justifying than doing)
37 Management heavy / Slow decisioning process Organizational Structure
38 Politics / bureaucratic (more time justifying than doing) Organizational Structure
39 Morale is low (everyone is upset / gossip) Processes Morale is low (everyone is upset / gossip); Unwilling to listen, losing touch and humility; Incremental versus disruptive innovation, loss of creativity; Right for disruption; Actively involved
40 Unwilling to listen, losing touch and humility Processes
41 Incremental versus disruptive innovation, loss of creativity Processes
42 Right for disruption Processes
43 Actively involved in an exit strategy Processes

146
in an exit strategy
44 Stale / Expired product set Products/Services Stale / Expired product set; Product no longer "cutting edge" (Market disappearing or being replaced); Products / Services becoming irrelevant; Year to year decrease in products/services; Reduce the scope of their product line (Losing customers, lack growth)
45 Product no longer "cutting edge" (Market disappearing or being replaced) Products/Services
46 Products / Services becoming irrelevant Products/Services
47 Year to year decrease in products/services Products/Services
48 Reduce the scope of their product line (Losing customers, lack growth) Products/Services
49 Falling sales / revenue Sales Falling sales / revenue; Sales decreasing; Year to year decrease in sales; Declining aggregate sales
50 Sales decreasing Sales
51 Year to year decrease in sales Sales
52 Declining aggregate sales Sales
53 Technologically falling behind Skills Technologically falling behind; Technology is irrelevant
54 Technology is irrelevant Skills

147
Appendix D
Categorical Differentiating Constructs Among Various OLC Stages
Start-Up Stage Growth Stage Mature Stage Decline Stage
Capital Revenue
(deficit/borrowing
money); Dependent on
investment for continued
operation; Funding
stage; Limited funding
and revenue; Low assets
/ Capital (less than 1
million USD); Haven't
found recurring annual
revenue; No revenue;
Revenue (less than
$100K); Outside
funding; 25% to 50%
revenue / user base
annually; Trying seed
capital
Revenue (enough money
coming in); Not
necessary dependent on
investment for continued
operation (revenues ~
expenses); Increasing
revenue; Revenue
consistency (20% or
greater); Profit potential;
Find recurring revenue
(annual); Increasing in
revenue; Capitalization /
Product that is delivered;
Revenue ($100 - 250K);
Relevant financial
models (not
substantiated) maximum
operating capacity
versus expected returns;
Investment into
company; Positive
valuation; Capital
outsourcing; Series A
(already raised) venture
capital (5 to 10 M dollars
or 10 to 15 M dollars)
No longer increasing
annual revenue;
Stable revenue
stream; Higher than
average revenue;
Revenue (over
$1M); Profitable /
less risk averse; Self
sustaining in terms
of revenue
Revenues are
decreasing; Loss of
revenue (declining
revenue for your
products); Annual
revenues are declining;
Decreasing revenue;
Revenue decline;
Falling share price (if
publicly listed);
Revenue decline; 25%
decrease in revenues;
Valuation (decline
valuation than
previous one); Debt
Number of
Employees
Small size / Employees
(under 100); Size (less
than 20); Number of
employees (12); Small
size / Employees (1 -
100); Small team (3 to
5); 1 to 4 founders; Less
than 5 employees / Small
management team; Team
size (less than 10);
Number of employees
Medium sized company /
Employees (over 100);
Scale of customers and
employees (30
employees); 5 to 20
employees; Size (20 - 50
employees); More
employees (2000);
Established team (5 to
10); Employee count is
100; Increased hiring; 30
No significant
increase (gradual
increase in number
of employees); Size
(over 100
employees); 20
employees; Team
(500 plus);
Hierarchy (upper
management) / Top
down approach /
Large team (500 plus)
that decreasing; PR
management in crisis /
Negative economic
impact / 100 to 250
employees; Laying off
(downsizing)
employees; Job cuts;
Lay offs and no cost
efficiencies; Stable
employee numbers (or
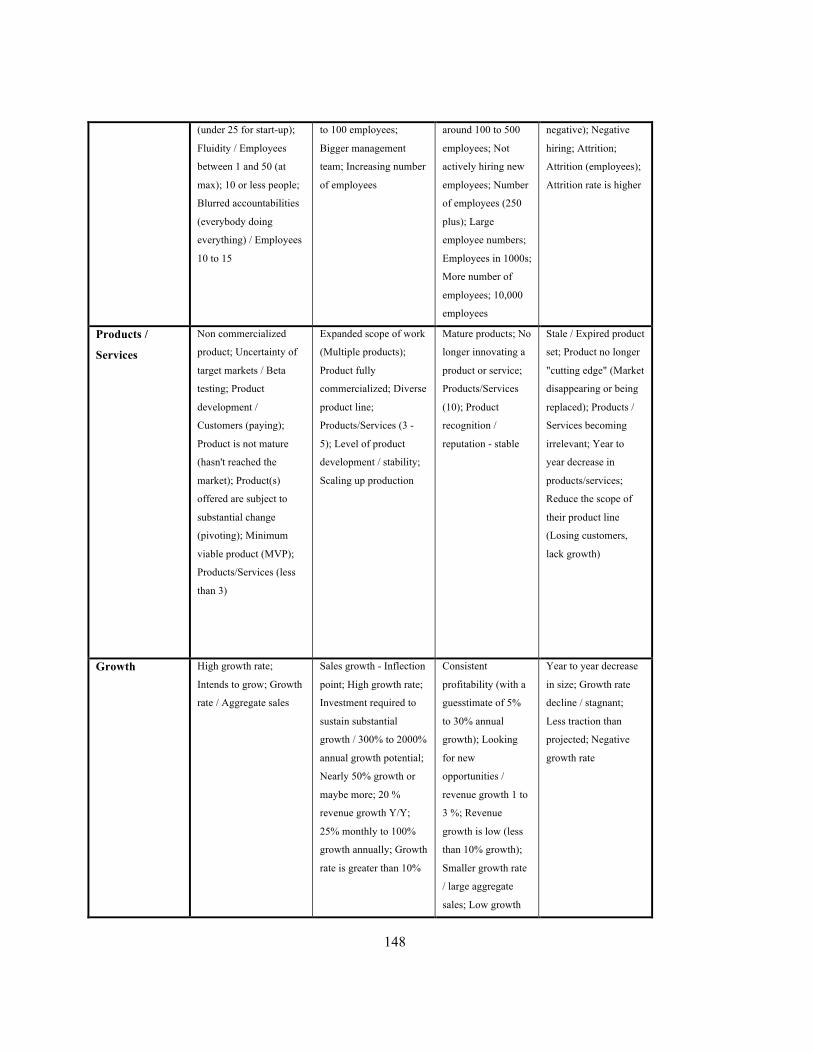
148
(under 25 for start-up);
Fluidity / Employees
between 1 and 50 (at
max); 10 or less people;
Blurred accountabilities
(everybody doing
everything) / Employees
10 to 15
to 100 employees;
Bigger management
team; Increasing number
of employees
around 100 to 500
employees; Not
actively hiring new
employees; Number
of employees (250
plus); Large
employee numbers;
Employees in 1000s;
More number of
employees; 10,000
employees
negative); Negative
hiring; Attrition;
Attrition (employees);
Attrition rate is higher
Products /
Services
Non commercialized
product; Uncertainty of
target markets / Beta
testing; Product
development /
Customers (paying);
Product is not mature
(hasn't reached the
market); Product(s)
offered are subject to
substantial change
(pivoting); Minimum
viable product (MVP);
Products/Services (less
than 3)
Expanded scope of work
(Multiple products);
Product fully
commercialized; Diverse
product line;
Products/Services (3 -
5); Level of product
development / stability;
Scaling up production
Mature products; No
longer innovating a
product or service;
Products/Services
(10); Product
recognition /
reputation - stable
Stale / Expired product
set; Product no longer
"cutting edge" (Market
disappearing or being
replaced); Products /
Services becoming
irrelevant; Year to
year decrease in
products/services;
Reduce the scope of
their product line
(Losing customers,
lack growth)
Growth High growth rate;
Intends to grow; Growth
rate / Aggregate sales
Sales growth - Inflection
point; High growth rate;
Investment required to
sustain substantial
growth / 300% to 2000%
annual growth potential;
Nearly 50% growth or
maybe more; 20 %
revenue growth Y/Y;
25% monthly to 100%
growth annually; Growth
rate is greater than 10%
Consistent
profitability (with a
guesstimate of 5%
to 30% annual
growth); Looking
for new
opportunities /
revenue growth 1 to
3 %; Revenue
growth is low (less
than 10% growth);
Smaller growth rate
/ large aggregate
sales; Low growth
Year to year decrease
in size; Growth rate
decline / stagnant;
Less traction than
projected; Negative
growth rate

149
rate; Stable year
over year growth;
No significant
increase in revenue
(~10% growth);
Limited growth
opportunities in
primary markets
(e.g. Microsoft
entered games with
XBox); Growth
through acquisition;
Growth through
acquisition; "Easy
marketing $" /
Budget / Awareness
is high / 10% to
15% annual revenue
growth; Growth rate
5 to 8 %
Organizational
Structure
Flat hierarchy; Privately
owned; Roles in
organization are fluid or
poorly defined (people
often do more than one
type of task, and tasks
change); Informal
organization structure /
culture; Response time is
adaptable / flexible;
Almost every job is
multifaceted (multiple
roles)
Devolution of
management, hierarchy,
but few levels (less than
5); Less flexible;
Formalization of
corporate structure -
people have more
specific job descriptions
"Bureaucracy" (high
process / red tape);
Bureaucracy; Thick
walls; Group think /
Bureaucratic /
Defined roadmap /
Less impulse;
Departmentalized;
Large enough to
sustain all functions
/ Departments;
Static organizational
structure (treat
employees as
interchangeable
parts)
Roles in organization
become very rigid;
Management heavy /
Slow decisioning
process; Politics /
bureaucratic (more
time justifying than
doing
Processes Lack of process; Small
media presence
Service fee is higher;
Scramble / to get
organized / process /
increased marketing &
awareness (with target
market); Maturity in
systems / processes;
Solutions "less
customizable"
(standard);
Mechanistic systems
and processes
(highly formal
structures); Weak
Morale is low
(everyone is upset /
gossip); Unwilling to
listen, losing touch and
humility; Incremental
versus disruptive
innovation, loss of
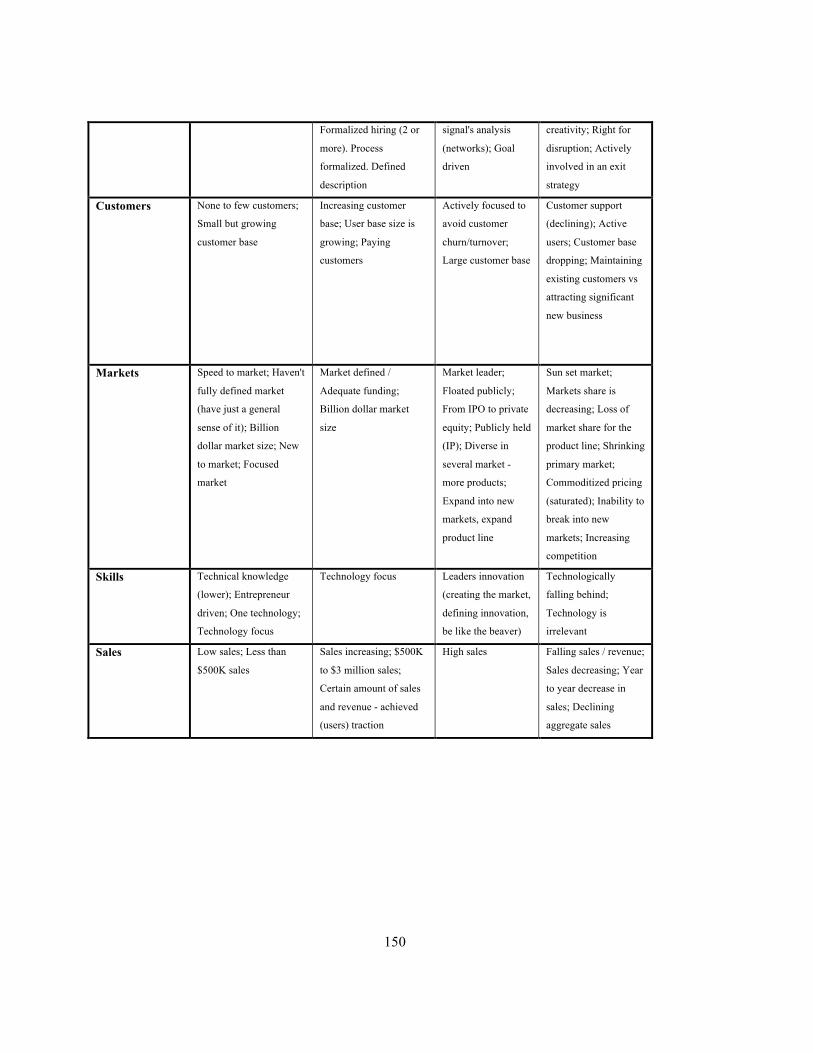
150
Formalized hiring (2 or
more). Process
formalized. Defined
description
signal's analysis
(networks); Goal
driven
creativity; Right for
disruption; Actively
involved in an exit
strategy
Customers None to few customers;
Small but growing
customer base
Increasing customer
base; User base size is
growing; Paying
customers
Actively focused to
avoid customer
churn/turnover;
Large customer base
Customer support
(declining); Active
users; Customer base
dropping; Maintaining
existing customers vs
attracting significant
new business
Markets Speed to market; Haven't
fully defined market
(have just a general
sense of it); Billion
dollar market size; New
to market; Focused
market
Market defined /
Adequate funding;
Billion dollar market
size
Market leader;
Floated publicly;
From IPO to private
equity; Publicly held
(IP); Diverse in
several market -
more products;
Expand into new
markets, expand
product line
Sun set market;
Markets share is
decreasing; Loss of
market share for the
product line; Shrinking
primary market;
Commoditized pricing
(saturated); Inability to
break into new
markets; Increasing
competition
Skills Technical knowledge
(lower); Entrepreneur
driven; One technology;
Technology focus
Technology focus Leaders innovation
(creating the market,
defining innovation,
be like the beaver)
Technologically
falling behind;
Technology is
irrelevant
Sales Low sales; Less than
$500K sales
Sales increasing; $500K
to $3 million sales;
Certain amount of sales
and revenue - achieved
(users) traction
High sales Falling sales / revenue;
Sales decreasing; Year
to year decrease in
sales; Declining
aggregate sales
151
Appendix E
Repeated Measures Survey Design

152

153

154

155

156
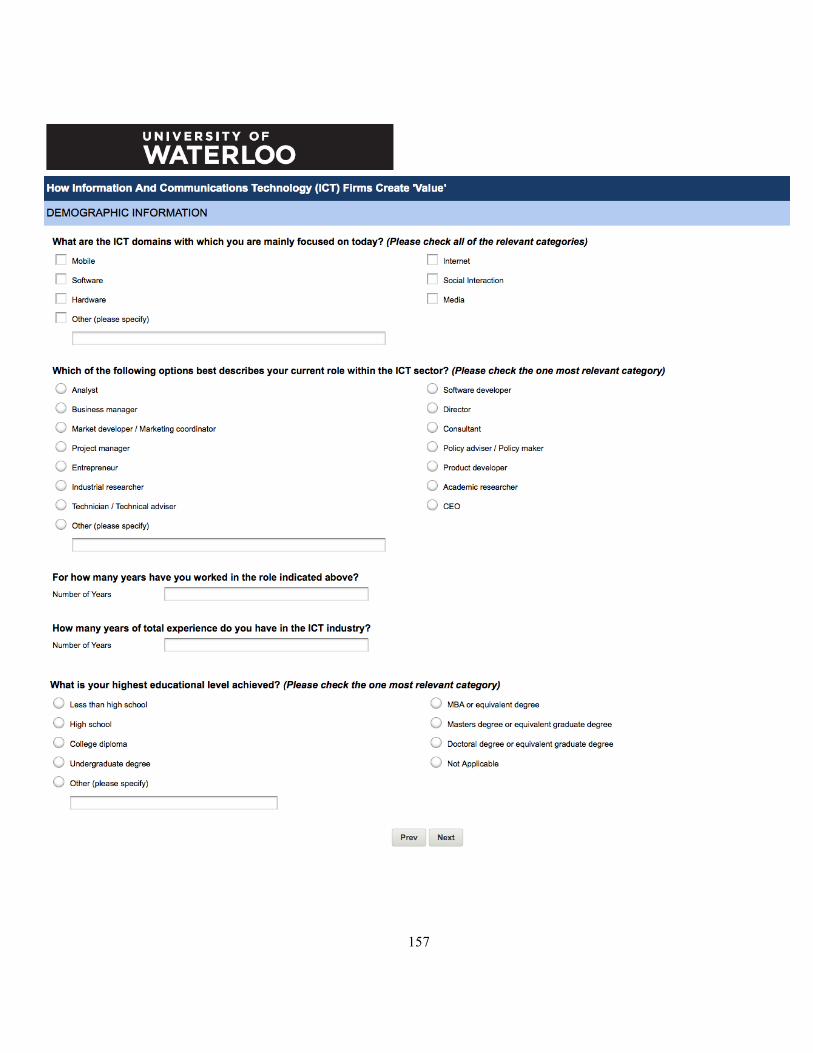
157

158

159
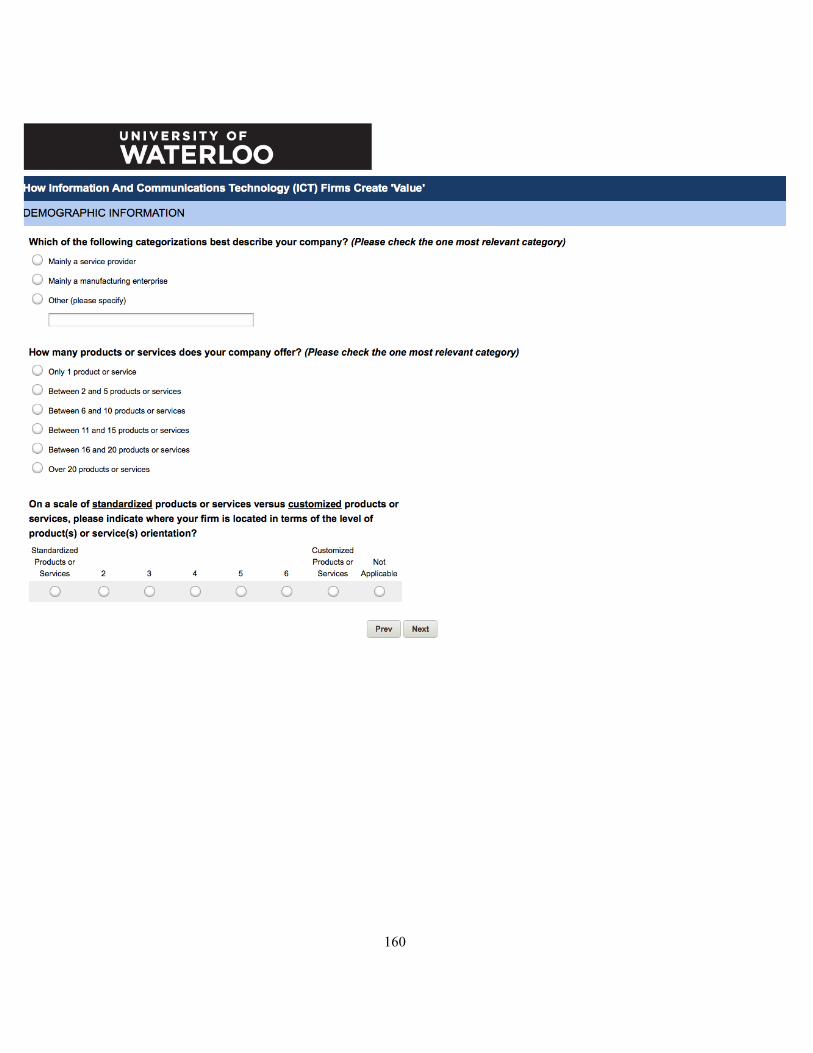
160

161
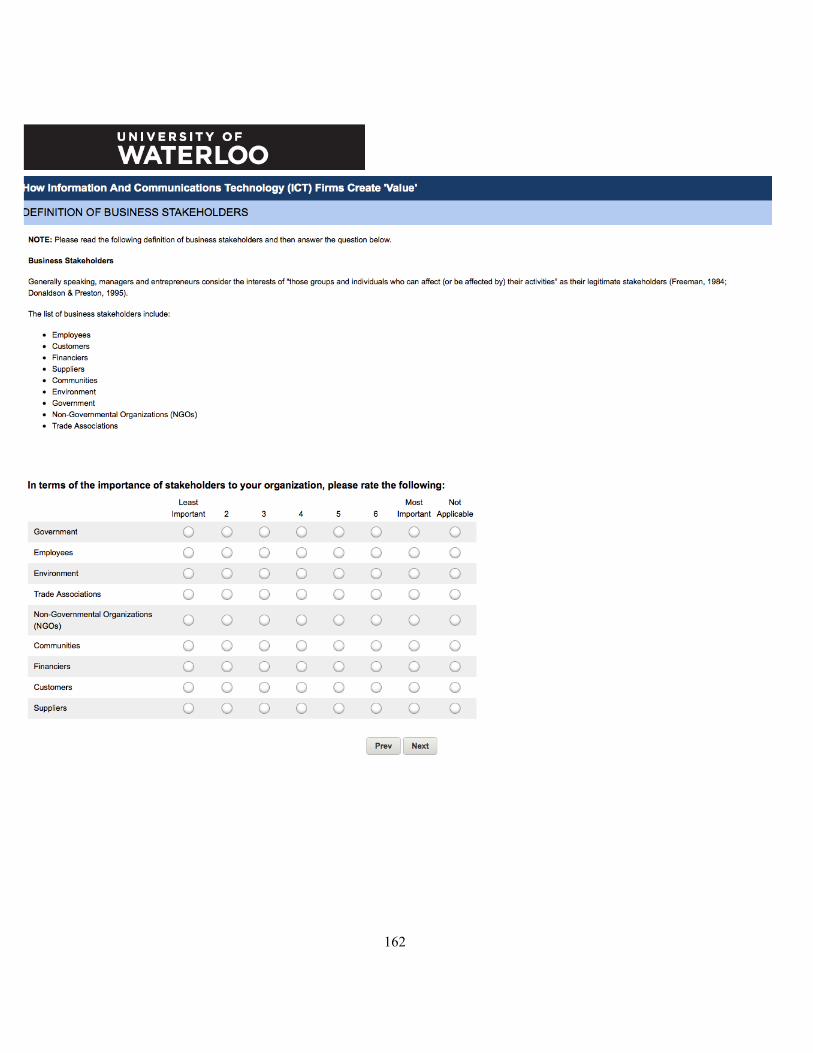
162
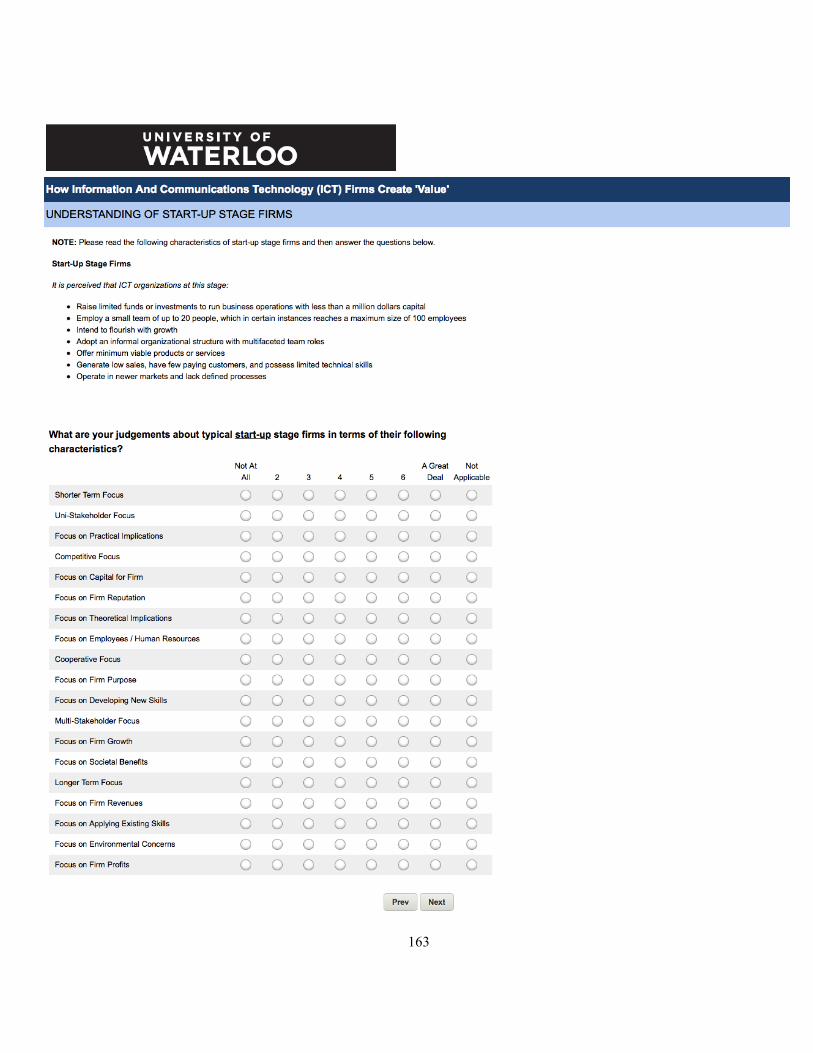
163
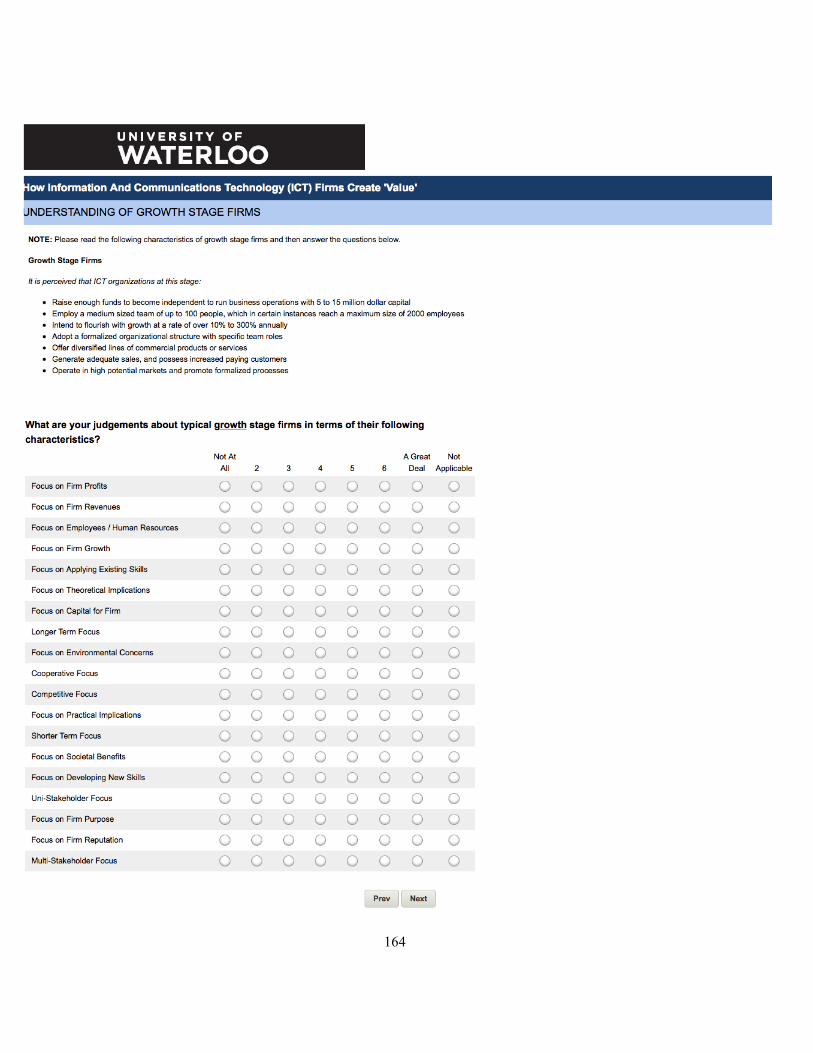
164

165
166
167
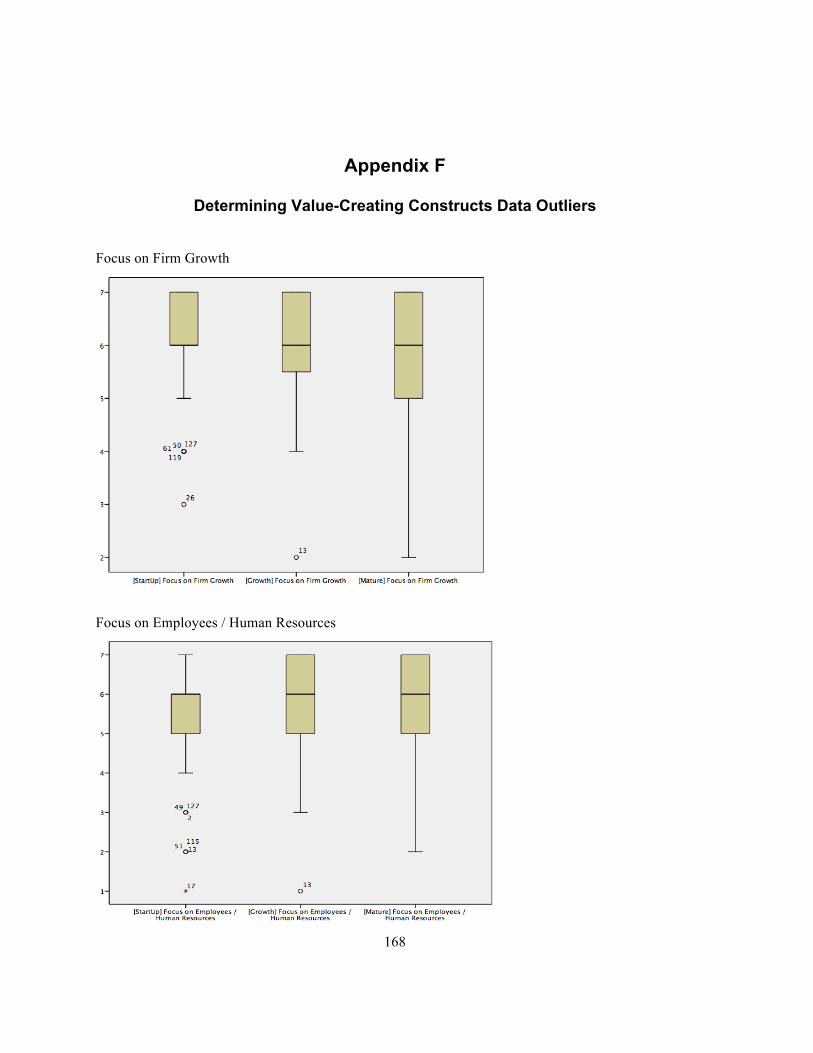
168
Appendix F
Determining Value-Creating Constructs Data Outliers
Focus on Firm Growth
Focus on Employees / Human Resources
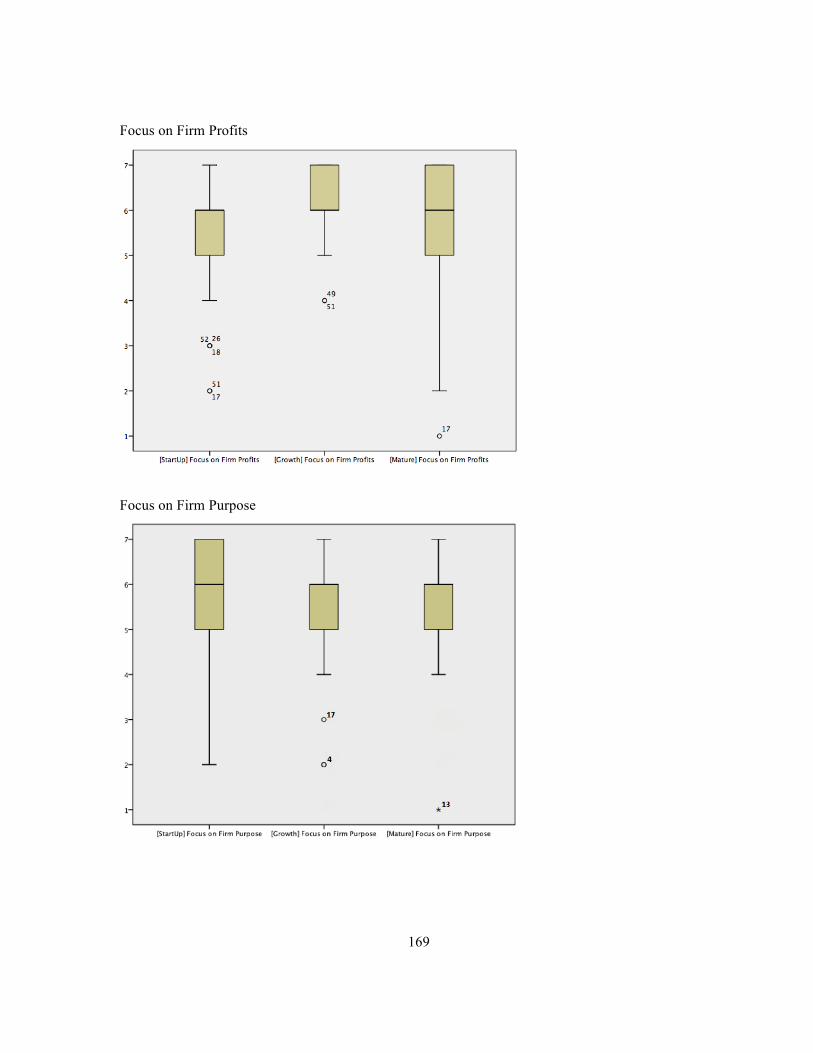
169
Focus on Firm Profits
Focus on Firm Purpose
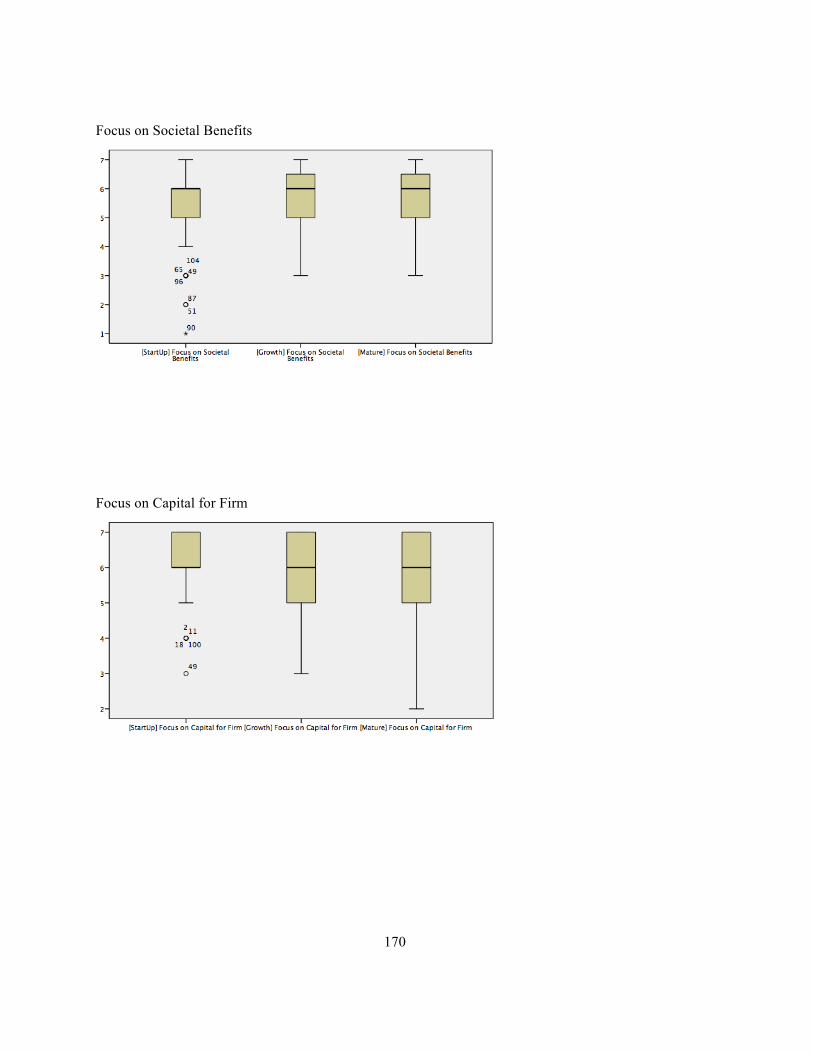
170
Focus on Societal Benefits
Focus on Capital for Firm
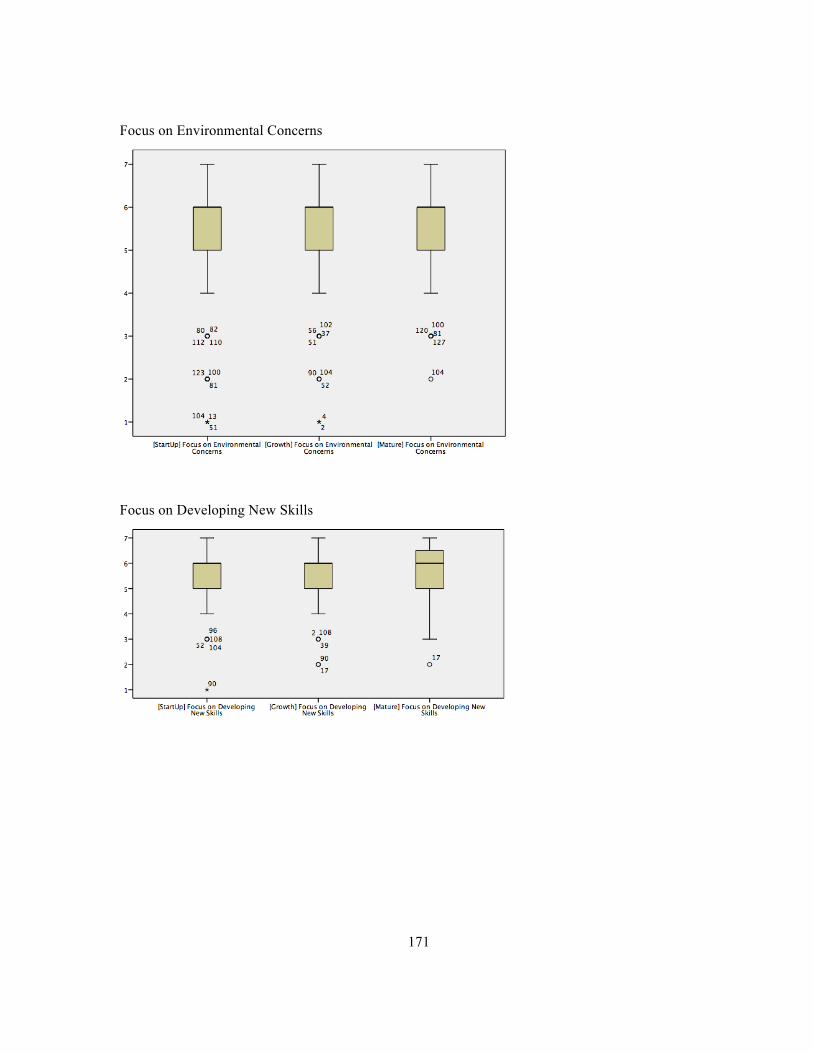
171
Focus on Environmental Concerns
Focus on Developing New Skills
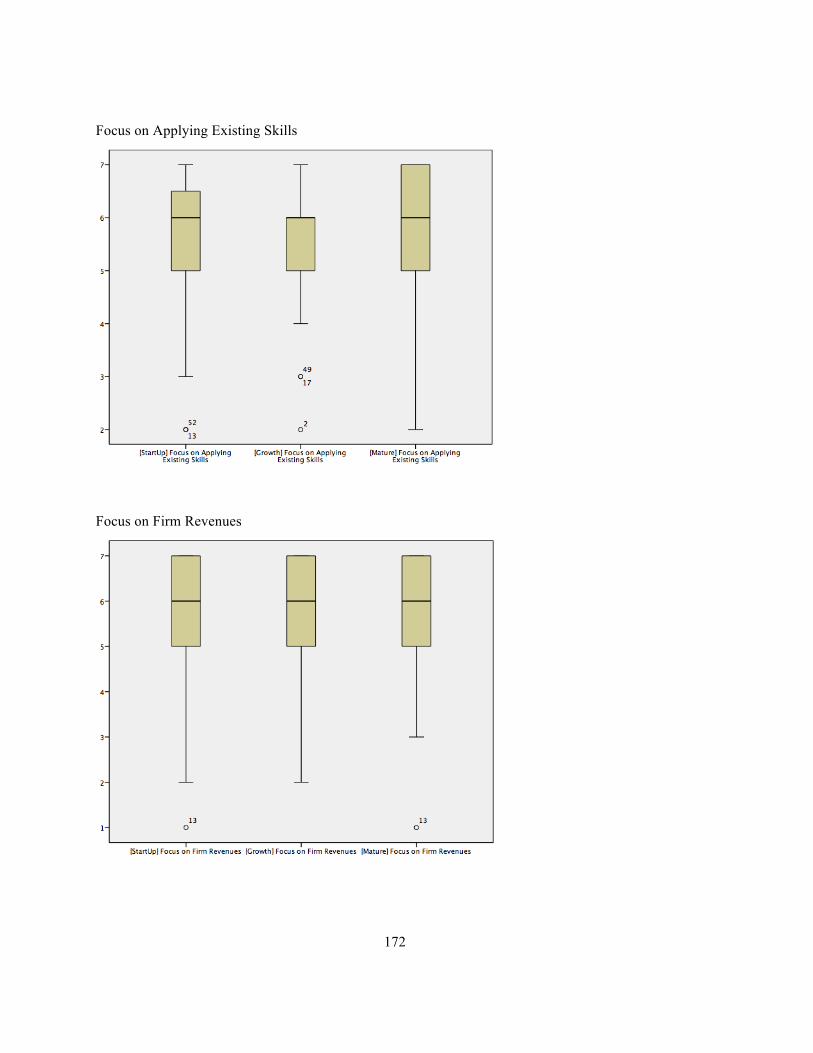
172
Focus on Applying Existing Skills
Focus on Firm Revenues
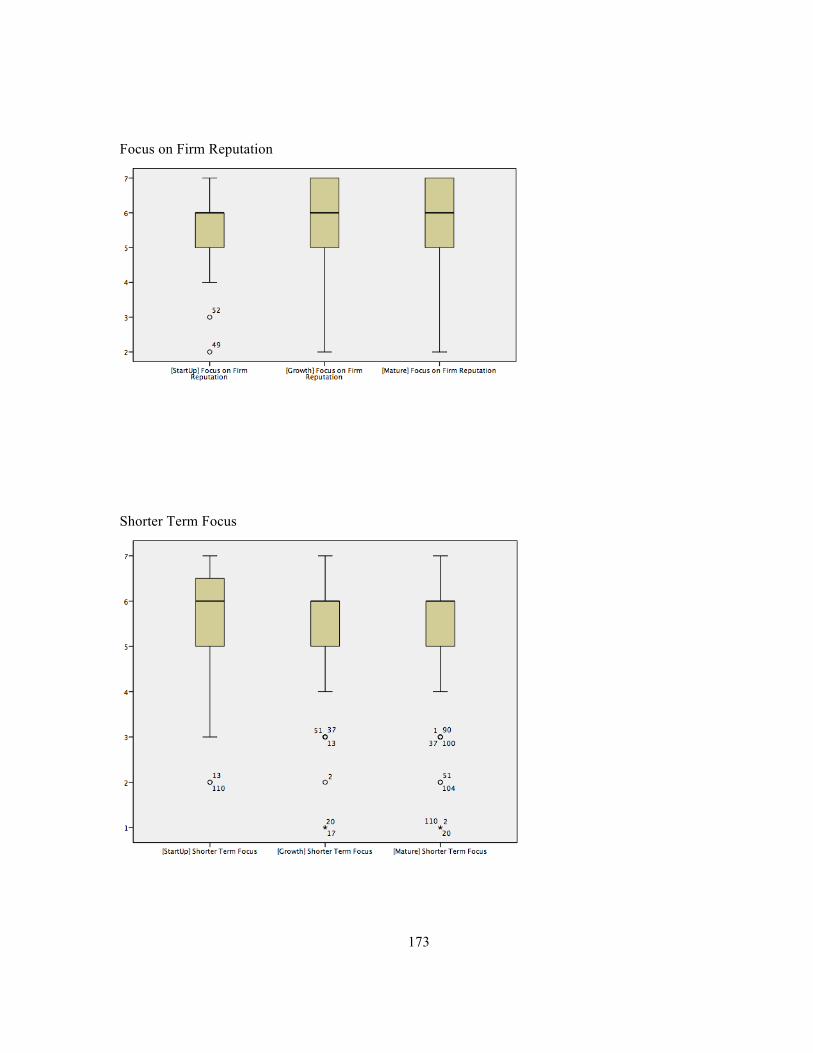
173
Focus on Firm Reputation
Shorter Term Focus
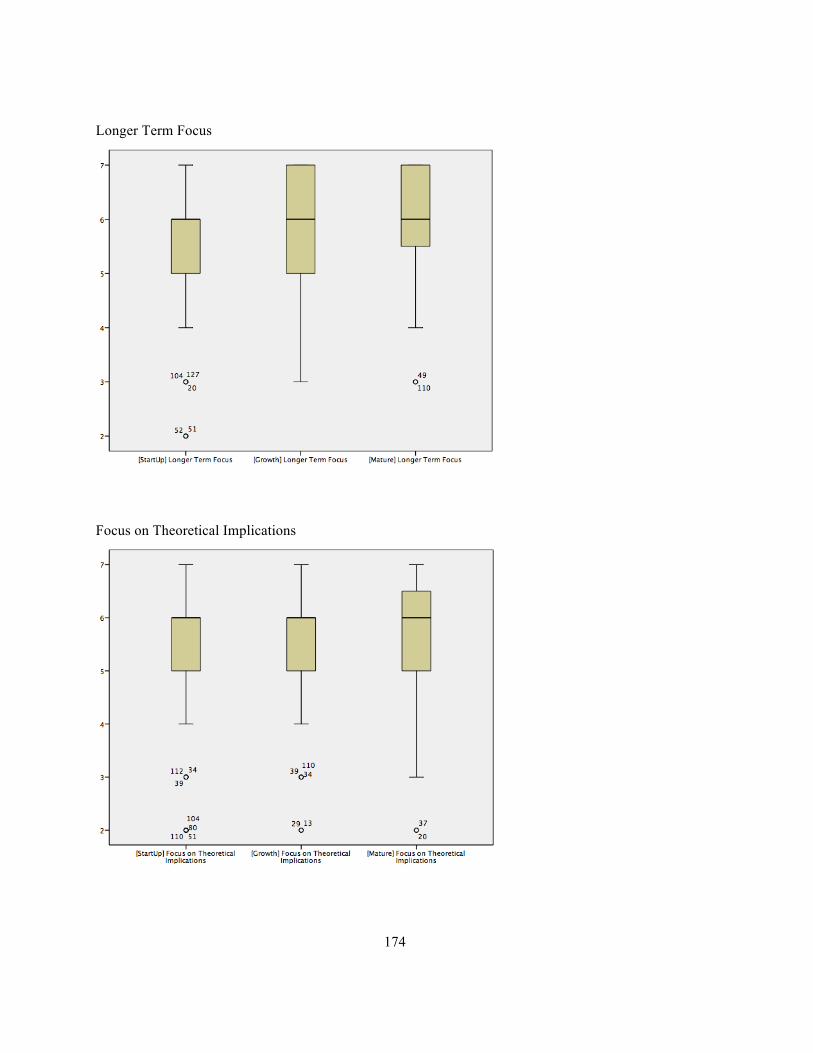
174
Longer Term Focus
Focus on Theoretical Implications
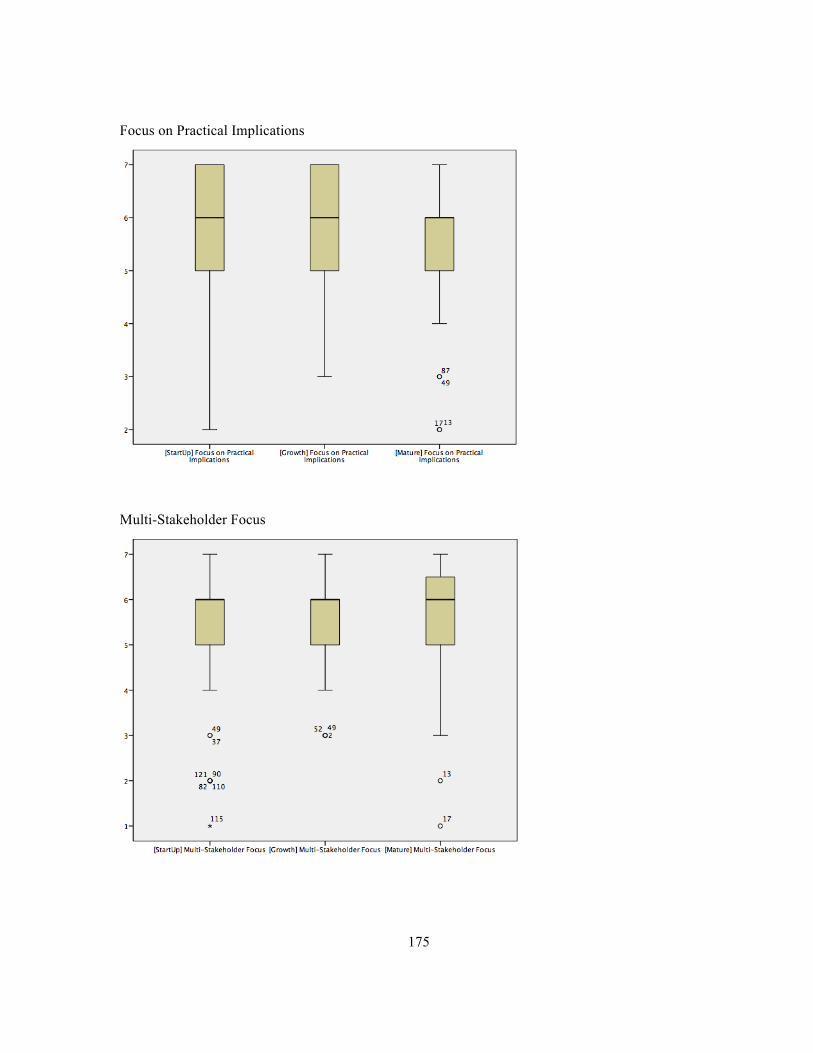
175
Focus on Practical Implications
Multi-Stakeholder Focus

176
Uni-Stakeholder Focus
Competitive Focus
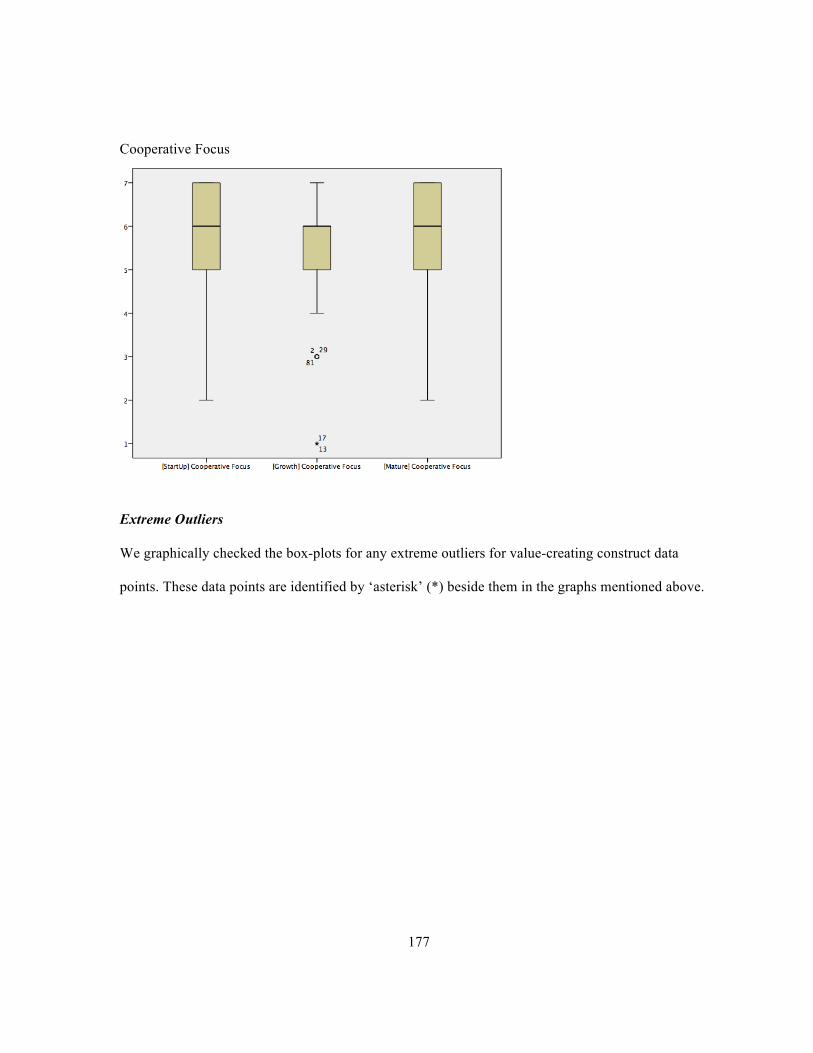
177
Cooperative Focus
Extreme Outliers
We graphically checked the box-plots for any extreme outliers for value-creating construct data
points. These data points are identified by ‘asterisk’ (*) beside them in the graphs mentioned above.

178
Comparison Of Results – Before And After Transformation Of The Data Set By
Removing The Extreme Outliers
Focus of Employees / Human Resources (Before)
Tests of Within-Subjects Effects
Measure: Employees / HR
Source Type III Sum of
Squares df Mean
Square F Sig. Partial Eta Squared
Observed Power
OLC Stages Sphericity Assumed 3.879 2 1.939 2.373 .095 .018 .477 Greenhouse-Geisser 3.879 1.915 2.025 2.373 .098 .018 .466 Huynh-Feldt 3.879 1.943 1.996 2.373 .097 .018 .470 Lower-bound 3.879 1.000 3.879 2.373 .126 .018 .334
Error (OLC Stages)
Sphericity Assumed 214.121 262 .817 Greenhouse-Geisser 214.121 250.929 .853 Huynh-Feldt 214.121 254.567 .841 Lower-bound 214.121 131.000 1.635
Focus of Employees / Human Resources (After)
Tests of Within-Subjects Effects
Measure: Employees / HR
Source Type III Sum of
Squares df Mean
Square F Sig. Partial Eta Squared
Observed Power
OLC Stages Sphericity Assumed 3.562 2 1.781 2.366 .096 .018 .476 Greenhouse-Geisser 3.562 1.915 1.860 2.366 .098 .018 .465 Huynh-Feldt 3.562 1.943 1.833 2.366 .098 .018 .469 Lower-bound 3.562 1.000 3.562 2.366 .126 .018 .333
Error (OLC Stages)
Sphericity Assumed 195.771 260 .753 Greenhouse-Geisser 195.771 248.951 .786 Huynh-Feldt 195.771 252.587 .775 Lower-bound 195.771 130.000 1.506

179
Focus on Firm Purpose (Before) 36
Tests of Within-Subjects Effects
Measure: Firm Purpose
Source Type III Sum
of Squares df Mean
Square F Sig. Partial Eta Squared
Observed Power
OLC Stages Sphericity Assumed 1.854 2 .927 1.213 .299 .009 .264 Greenhouse-Geisser 1.854 1.909 .971 1.213 .298 .009 .258 Huynh-Feldt 1.854 1.936 .957 1.213 .298 .009 .260 Lower-bound 1.854 1.000 1.854 1.213 .273 .009 .194
Error (OLC Stages)
Sphericity Assumed 200.146 262 .764 Greenhouse-Geisser 200.146 250.062 .800 Huynh-Feldt 200.146 253.668 .789 Lower-bound 200.146 131.000 1.528
Focus on Firm Purpose (After) 37
Tests of Within-Subjects Effects
Measure: Firm Purpose
Source Type III Sum
of Squares df Mean
Square F Sig. Partial Eta Squared
Observed Power
OLC Stages Sphericity Assumed 2.885 2 1.443 2.056 .130 .016 .421 Greenhouse-Geisser 2.885 1.865 1.547 2.056 .134 .016 .406 Huynh-Feldt 2.885 1.891 1.526 2.056 .133 .016 .409 Lower-bound 2.885 1.000 2.885 2.056 .154 .016 .296
Error (OLC Stages)
Sphericity Assumed 182.448 260 .702 Greenhouse-Geisser 182.448 242.440 .753 Huynh-Feldt 182.448 245.831 .742 Lower-bound 182.448 130.000 1.403
36 A clearly non-significant alpha level (p > 0.25) is satisfied for OLC stages on dependent variable, ‘Focus on Firm Purpose’ before removing the outliers. 37 We acknowledge that ‘Focus on Firm Purpose’ did not achieve clearly non-significant alpha level (p < 0.25) in terms of OLC stages after removing the outliers.

180
Focus on Societal Benefits (Before)
Tests of Within-Subjects Effects
Measure: Societal Benefits
Source
Type III Sum of Squares df
Mean Square F Sig.
Partial Eta Squared
Observed Power
OLC Stages Sphericity Assumed 4.884 2 2.442 3.559 .030 .026 .658 Greenhouse-Geisser 4.884 1.994 2.449 3.559 .030 .026 .657 Huynh-Feldt 4.884 2.000 2.442 3.559 .030 .026 .658 Lower-bound 4.884 1.000 4.884 3.559 .061 .026 .465
Error (OLC Stages)
Sphericity Assumed 179.783 262 .686 Greenhouse-Geisser 179.783 261.233 .688 Huynh-Feldt 179.783 262.000 .686 Lower-bound 179.783 131.000 1.372
Focus on Societal Benefits (After)
Tests of Within-Subjects Effects
Measure: Societal Benefits
Source
Type III Sum of Squares df
Mean Square F Sig.
Partial Eta Squared
Observed Power
OLC Stages Sphericity Assumed 4.321 2 2.160 3.161 .044 .024 .603 Greenhouse-Geisser 4.321 1.996 2.165 3.161 .044 .024 .602 Huynh-Feldt 4.321 2.000 2.160 3.161 .044 .024 .603 Lower-bound 4.321 1.000 4.321 3.161 .078 .024 .423
Error (OLC Stages)
Sphericity Assumed 177.679 260 .683 Greenhouse-Geisser 177.679 259.494 .685 Huynh-Feldt 177.679 260.000 .683 Lower-bound 177.679 130.000 1.367

181
Focus on Environmental Concerns (Before) 38
Tests of Within-Subjects Effects Measure: Environmental Concerns
Source
Type III Sum of Squares df
Mean Square F Sig.
Partial Eta Squared
Observed Power
OLC Stages Sphericity Assumed 4.005 2 2.003 1.938 .146 .015 .400 Greenhouse-Geisser 4.005 1.909 2.098 1.938 .148 .015 .390 Huynh-Feldt 4.005 1.937 2.068 1.938 .147 .015 .393 Lower-bound 4.005 1.000 4.005 1.938 .166 .015 .282
Error (OLC Stages)
Sphericity Assumed 270.662 262 1.033 Greenhouse-Geisser 270.662 250.105 1.082 Huynh-Feldt 270.662 253.711 1.067 Lower-bound 270.662 131.000 2.066
Focus on Environmental Concerns (After) 39
Tests of Within-Subjects Effects Measure: Environmental Concerns
Source Type III Sum
of Squares df Mean
Square F Sig. Partial Eta Squared
Observed Power
OLC Stages Sphericity Assumed 1.486 2 .743 .892 .411 .007 .203 Greenhouse-Geisser 1.486 1.887 .787 .892 .406 .007 .198 Huynh-Feldt 1.486 1.915 .776 .892 .407 .007 .199 Lower-bound 1.486 1.000 1.486 .892 .347 .007 .155
Error (OLC Stages)
Sphericity Assumed 209.848 252 .833 Greenhouse-Geisser 209.848 237.825 .882 Huynh-Feldt 209.848 241.327 .870 Lower-bound 209.848 126.000 1.665
38 A clearly non-significant alpha level (p > 0.25) is not achieved for OLC stages on dependent variable, ‘Focus on Environmental Concerns’ before removing the outliers. 39 We acknowledge that ‘Focus on Environmental Concerns’ satisfy the clearly non-significant alpha level (p > 0.25) in terms of OLC stages after removing the outliers.

182
Developing New Skills (Before)
Tests of Within-Subjects Effects Measure: Developing New Skills
Source Type III Sum of
Squares df Mean
Square F Sig. Partial Eta Squared
Observed Power
OLC Stages Sphericity Assumed .641 2 .321 .465 .629 .004 .126 Greenhouse-Geisser .641 1.841 .348 .465 .613 .004 .122 Huynh-Feldt .641 1.866 .344 .465 .615 .004 .123 Lower-bound .641 1.000 .641 .465 .496 .004 .104
Error (OLC Stages)
Sphericity Assumed 180.692 262 .690 Greenhouse-Geisser 180.692 241.179 .749 Huynh-Feldt 180.692 244.455 .739 Lower-bound 180.692 131.000 1.379
Developing New Skills (After)
Tests of Within-Subjects Effects Measure: Developing New Skills
Source Type III Sum
of Squares df Mean
Square F Sig. Partial Eta Squared
Observed Power
OLC Stages Sphericity Assumed .427 2 .214 .323 .725 .002 .101 Greenhouse-Geisser .427 1.871 .228 .323 .710 .002 .100 Huynh-Feldt .427 1.898 .225 .323 .713 .002 .100 Lower-bound .427 1.000 .427 .323 .571 .002 .087
Error (OLC Stages)
Sphericity Assumed 172.239 260 .662 Greenhouse-Geisser 172.239 243.279 .708 Huynh-Feldt 172.239 246.702 .698 Lower-bound 172.239 130.000 1.325

183
Shorter Term Focus (Before)
Tests of Within-Subjects Effects Measure: Shorter Term
Source Type III Sum
of Squares df Mean
Square F Sig. Partial Eta Squared
Observed Power
OLC Stages Sphericity Assumed 2.202 2 1.101 1.170 .312 .009 .256 Greenhouse-Geisser 2.202 1.897 1.161 1.170 .310 .009 .249 Huynh-Feldt 2.202 1.925 1.144 1.170 .311 .009 .251 Lower-bound 2.202 1.000 2.202 1.170 .281 .009 .189
Error (OLC Stages)
Sphericity Assumed 246.465 262 .941 Greenhouse-Geisser 246.465 248.563 .992 Huynh-Feldt 246.465 252.112 .978 Lower-bound 246.465 131.000 1.881
Shorter Term Focus (After)
Tests of Within-Subjects Effects Measure: Shorter Term
Source Type III Sum
of Squares df Mean
Square F Sig. Partial Eta Squared
Observed Power
OLC Stages Sphericity Assumed 1.193 2 .596 .791 .454 .006 .184 Greenhouse-Geisser 1.193 1.892 .630 .791 .448 .006 .180 Huynh-Feldt 1.193 1.919 .621 .791 .450 .006 .181 Lower-bound 1.193 1.000 1.193 .791 .375 .006 .143
Error (OLC Stages)
Sphericity Assumed 191.474 254 .754 Greenhouse-Geisser 191.474 240.253 .797 Huynh-Feldt 191.474 243.776 .785 Lower-bound 191.474 127.000 1.508
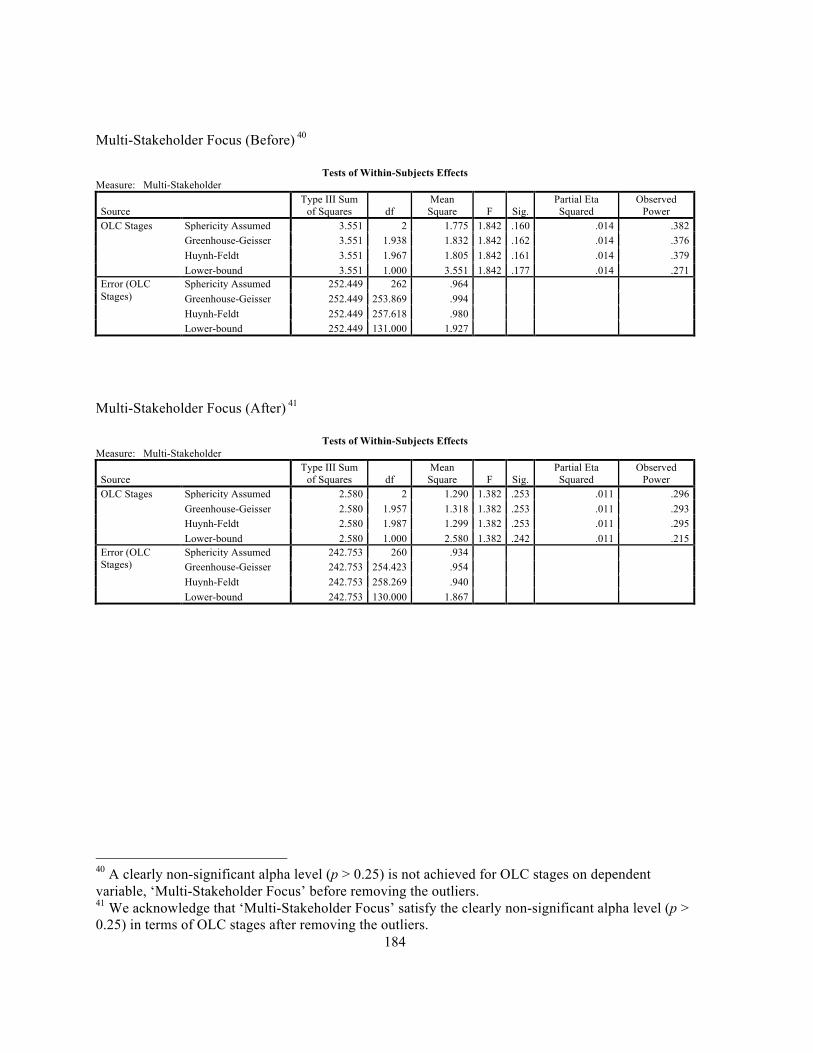
184
Multi-Stakeholder Focus (Before) 40
Tests of Within-Subjects Effects Measure: Multi-Stakeholder
Source Type III Sum
of Squares df Mean
Square F Sig. Partial Eta Squared
Observed Power
OLC Stages Sphericity Assumed 3.551 2 1.775 1.842 .160 .014 .382 Greenhouse-Geisser 3.551 1.938 1.832 1.842 .162 .014 .376 Huynh-Feldt 3.551 1.967 1.805 1.842 .161 .014 .379 Lower-bound 3.551 1.000 3.551 1.842 .177 .014 .271
Error (OLC Stages)
Sphericity Assumed 252.449 262 .964 Greenhouse-Geisser 252.449 253.869 .994 Huynh-Feldt 252.449 257.618 .980 Lower-bound 252.449 131.000 1.927
Multi-Stakeholder Focus (After) 41
Tests of Within-Subjects Effects Measure: Multi-Stakeholder
Source Type III Sum
of Squares df Mean
Square F Sig. Partial Eta Squared
Observed Power
OLC Stages Sphericity Assumed 2.580 2 1.290 1.382 .253 .011 .296 Greenhouse-Geisser 2.580 1.957 1.318 1.382 .253 .011 .293 Huynh-Feldt 2.580 1.987 1.299 1.382 .253 .011 .295 Lower-bound 2.580 1.000 2.580 1.382 .242 .011 .215
Error (OLC Stages)
Sphericity Assumed 242.753 260 .934 Greenhouse-Geisser 242.753 254.423 .954 Huynh-Feldt 242.753 258.269 .940 Lower-bound 242.753 130.000 1.867
40 A clearly non-significant alpha level (p > 0.25) is not achieved for OLC stages on dependent variable, ‘Multi-Stakeholder Focus’ before removing the outliers. 41 We acknowledge that ‘Multi-Stakeholder Focus’ satisfy the clearly non-significant alpha level (p > 0.25) in terms of OLC stages after removing the outliers.
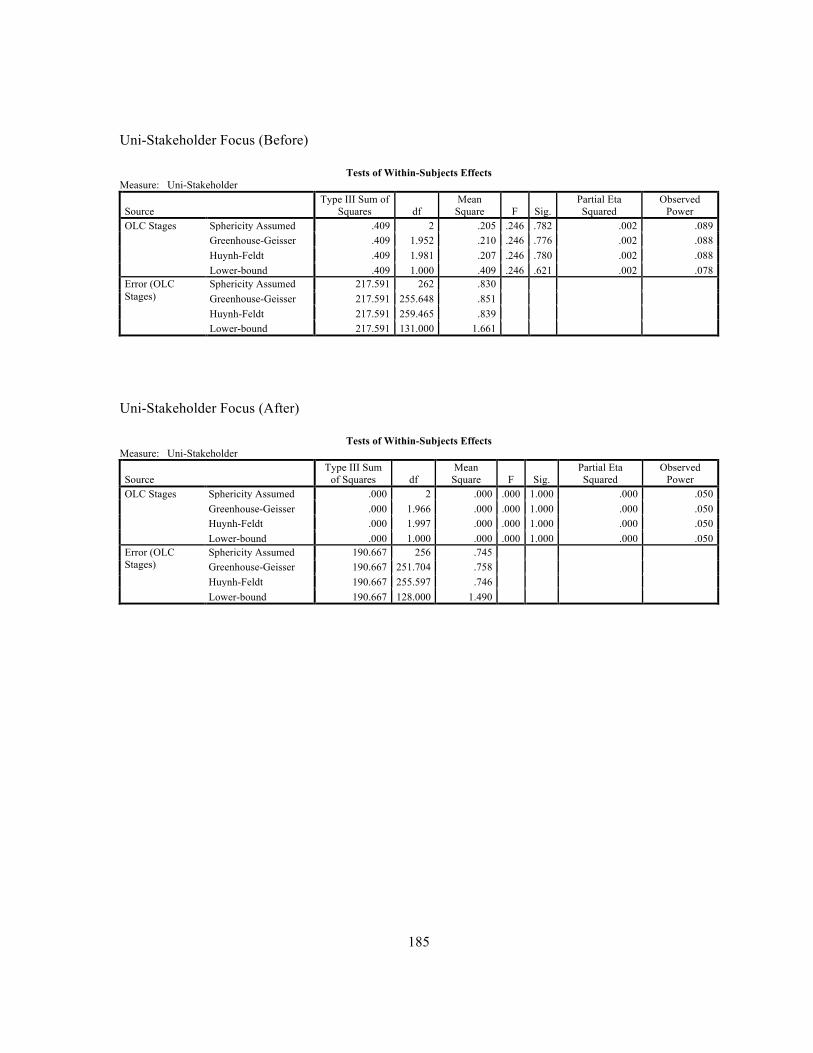
185
Uni-Stakeholder Focus (Before)
Tests of Within-Subjects Effects Measure: Uni-Stakeholder
Source Type III Sum of
Squares df Mean
Square F Sig. Partial Eta Squared
Observed Power
OLC Stages Sphericity Assumed .409 2 .205 .246 .782 .002 .089 Greenhouse-Geisser .409 1.952 .210 .246 .776 .002 .088 Huynh-Feldt .409 1.981 .207 .246 .780 .002 .088 Lower-bound .409 1.000 .409 .246 .621 .002 .078
Error (OLC Stages)
Sphericity Assumed 217.591 262 .830 Greenhouse-Geisser 217.591 255.648 .851 Huynh-Feldt 217.591 259.465 .839 Lower-bound 217.591 131.000 1.661
Uni-Stakeholder Focus (After)
Tests of Within-Subjects Effects Measure: Uni-Stakeholder
Source Type III Sum
of Squares df Mean
Square F Sig. Partial Eta Squared
Observed Power
OLC Stages Sphericity Assumed .000 2 .000 .000 1.000 .000 .050 Greenhouse-Geisser .000 1.966 .000 .000 1.000 .000 .050 Huynh-Feldt .000 1.997 .000 .000 1.000 .000 .050 Lower-bound .000 1.000 .000 .000 1.000 .000 .050
Error (OLC Stages)
Sphericity Assumed 190.667 256 .745 Greenhouse-Geisser 190.667 251.704 .758 Huynh-Feldt 190.667 255.597 .746 Lower-bound 190.667 128.000 1.490

186
Cooperative Focus (Before) Tests of Within-Subjects Effects
Measure: Cooperative Focus
Source Type III Sum
of Squares df Mean
Square F Sig. Partial Eta Squared
Observed Power
OLC Stages Sphericity Assumed 6.399 2 3.199 5.002 .007 .037 .811 Greenhouse-Geisser 6.399 1.948 3.286 5.002 .008 .037 .803 Huynh-Feldt 6.399 1.977 3.237 5.002 .008 .037 .807 Lower-bound 6.399 1.000 6.399 5.002 .027 .037 .603
Error (OLC Stages)
Sphericity Assumed 167.601 262 .640 Greenhouse-Geisser 167.601 255.128 .657 Huynh-Feldt 167.601 258.925 .647 Lower-bound 167.601 131.000 1.279
Cooperative Focus (After)
Tests of Within-Subjects Effects
Measure: Cooperative Focus
Source Type III Sum
of Squares df Mean
Square F Sig. Partial Eta Squared
Observed Power
OLC Stages Sphericity Assumed 4.615 2 2.308 4.003 .019 .030 .713 Greenhouse-Geisser 4.615 1.912 2.414 4.003 .021 .030 .698 Huynh-Feldt 4.615 1.940 2.379 4.003 .020 .030 .703 Lower-bound 4.615 1.000 4.615 4.003 .048 .030 .510
Error (OLC Stages)
Sphericity Assumed 148.718 258 .576 Greenhouse-Geisser 148.718 246.639 .603 Huynh-Feldt 148.718 250.260 .594 Lower-bound 148.718 129.000 1.153

187
Appendix G
Determining Value-Creating Constructs Data Normality
Tests of Normality
Conditions Kolmogorov-Smirnova Shapiro-Wilk Statistic df Sig. Statistic df Sig.
Focus on Firm Growth Start-up .242 132 .000 .835 132 .000 Growth .256 132 .000 .834 132 .000 Mature .208 132 .000 .838 132 .000
Focus on Employees / Human Resources Start-up .271 132 .000 .827 132 .000 Growth .231 132 .000 .852 132 .000 Mature .228 132 .000 .855 132 .000
Focus on Firm Profits Start-up .260 132 .000 .861 132 .000 Growth .253 132 .000 .832 132 .000 Mature .255 132 .000 .807 132 .000
Focus on Firm Purpose Start-up .258 132 .000 .811 132 .000 Growth .253 132 .000 .865 132 .000 Mature .306 132 .000 .789 132 .000
Focus on Societal Benefits Start-up .194 132 .000 .881 132 .000 Growth .241 132 .000 .875 132 .000 Mature .229 132 .000 .876 132 .000
Focus on Capital for Firm Start-up .254 132 .000 .839 132 .000 Growth .260 132 .000 .842 132 .000 Mature .272 132 .000 .830 132 .000
Focus on Environmental Concerns Start-up .257 132 .000 .850 132 .000 Growth .248 132 .000 .873 132 .000 Mature .222 132 .000 .885 132 .000
Focus on Developing New Skills Start-up .277 132 .000 .823 132 .000 Growth .268 132 .000 .835 132 .000 Mature .277 132 .000 .847 132 .000
Focus on Applying Existing Skills Start-up .294 132 .000 .821 132 .000 Growth .247 132 .000 .851 132 .000 Mature .259 132 .000 .822 132 .000
Focus on Firm Revenues Start-up .282 132 .000 .812 132 .000 Growth .226 132 .000 .827 132 .000 Mature .263 132 .000 .813 132 .000
Focus on Firm Reputation Start-up .241 132 .000 .869 132 .000 Growth .235 132 .000 .851 132 .000 Mature .256 132 .000 .820 132 .000
Shorter Term Focus Start-up .246 132 .000 .854 132 .000 Growth .269 132 .000 .826 132 .000 Mature .274 132 .000 .824 132 .000
Longer Term Focus Start-up .216 132 .000 .866 132 .000 Growth .265 132 .000 .854 132 .000 Mature .250 132 .000 .840 132 .000
Focus on Theoretical Implications Start-up .285 132 .000 .822 132 .000 Growth .221 132 .000 .888 132 .000 Mature .224 132 .000 .879 132 .000
Focus on Practical Implications Start-up .261 132 .000 .827 132 .000 Growth .218 132 .000 .864 132 .000 Mature .243 132 .000 .845 132 .000
Multi-Stakeholder Focus Start-up .283 132 .000 .819 132 .000 Growth .235 132 .000 .875 132 .000 Mature .215 132 .000 .847 132 .000
Uni-Stakeholder Focus Start-up .234 132 .000 .881 132 .000 Growth .257 132 .000 .856 132 .000 Mature .227 132 .000 .820 132 .000
Competitive Focus Start-up .266 132 .000 .814 132 .000 Growth .274 132 .000 .856 132 .000 Mature .245 132 .000 .860 132 .000
Cooperative Focus Start-up .249 132 .000 .851 132 .000 Growth .236 132 .000 .828 132 .000 Mature .242 132 .000 .837 132 .000
a. Lilliefors Significance Correction
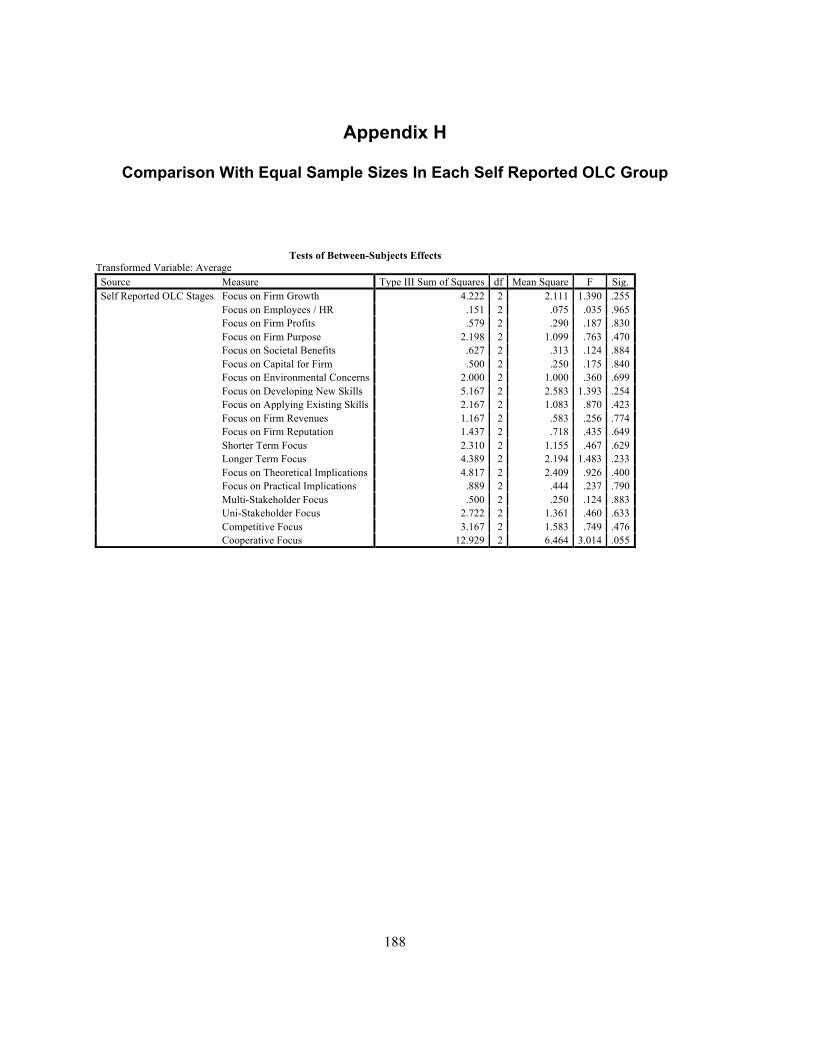
188
Appendix H
Comparison With Equal Sample Sizes In Each Self Reported OLC Group
Tests of Between-Subjects Effects Transformed Variable: Average Source Measure Type III Sum of Squares df Mean Square F Sig. Self Reported OLC Stages Focus on Firm Growth 4.222 2 2.111 1.390 .255
Focus on Employees / HR .151 2 .075 .035 .965 Focus on Firm Profits .579 2 .290 .187 .830 Focus on Firm Purpose 2.198 2 1.099 .763 .470 Focus on Societal Benefits .627 2 .313 .124 .884 Focus on Capital for Firm .500 2 .250 .175 .840 Focus on Environmental Concerns 2.000 2 1.000 .360 .699 Focus on Developing New Skills 5.167 2 2.583 1.393 .254 Focus on Applying Existing Skills 2.167 2 1.083 .870 .423 Focus on Firm Revenues 1.167 2 .583 .256 .774 Focus on Firm Reputation 1.437 2 .718 .435 .649 Shorter Term Focus 2.310 2 1.155 .467 .629 Longer Term Focus 4.389 2 2.194 1.483 .233 Focus on Theoretical Implications 4.817 2 2.409 .926 .400 Focus on Practical Implications .889 2 .444 .237 .790 Multi-Stakeholder Focus .500 2 .250 .124 .883 Uni-Stakeholder Focus 2.722 2 1.361 .460 .633 Competitive Focus 3.167 2 1.583 .749 .476 Cooperative Focus 12.929 2 6.464 3.014 .055
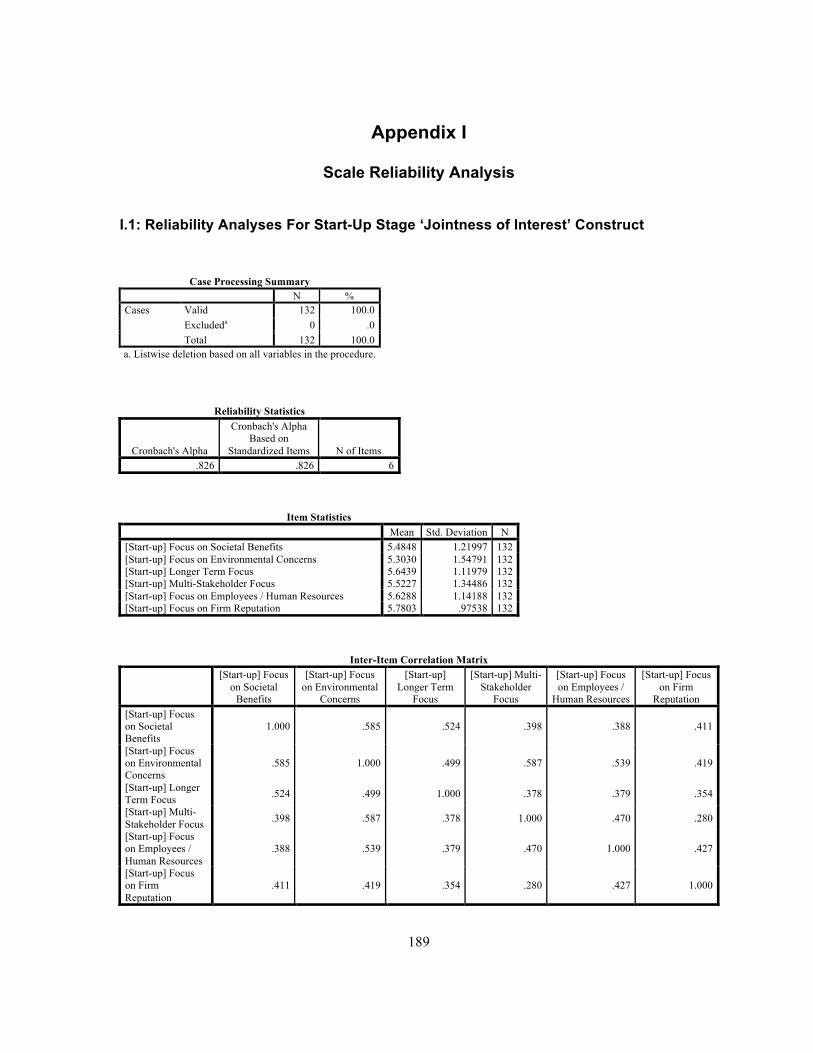
189
Appendix I
Scale Reliability Analysis
I.1: Reliability Analyses For Start-Up Stage ‘Jointness of Interest’ Construct
Case Processing Summary
N % Cases Valid 132 100.0
Excludeda 0 .0 Total 132 100.0
a. Listwise deletion based on all variables in the procedure.
Reliability Statistics
Cronbach's Alpha
Cronbach's Alpha Based on
Standardized Items N of Items .826 .826 6
Item Statistics Mean Std. Deviation N [Start-up] Focus on Societal Benefits 5.4848 1.21997 132 [Start-up] Focus on Environmental Concerns 5.3030 1.54791 132 [Start-up] Longer Term Focus 5.6439 1.11979 132 [Start-up] Multi-Stakeholder Focus 5.5227 1.34486 132 [Start-up] Focus on Employees / Human Resources 5.6288 1.14188 132 [Start-up] Focus on Firm Reputation 5.7803 .97538 132
Inter-Item Correlation Matrix
[Start-up] Focus on Societal
Benefits
[Start-up] Focus on Environmental
Concerns
[Start-up] Longer Term
Focus
[Start-up] Multi-Stakeholder
Focus
[Start-up] Focus on Employees /
Human Resources
[Start-up] Focus on Firm
Reputation [Start-up] Focus on Societal Benefits
1.000 .585 .524 .398 .388 .411
[Start-up] Focus on Environmental Concerns
.585 1.000 .499 .587 .539 .419
[Start-up] Longer Term Focus .524 .499 1.000 .378 .379 .354
[Start-up] Multi-Stakeholder Focus .398 .587 .378 1.000 .470 .280
[Start-up] Focus on Employees / Human Resources
.388 .539 .379 .470 1.000 .427
[Start-up] Focus on Firm Reputation
.411 .419 .354 .280 .427 1.000

190
Item-Total Statistics
Scale Mean if Item Deleted
Scale Variance if Item Deleted
Corrected Item-Total Correlation
Squared Multiple Correlation
Cronbach's Alpha if Item Deleted
[Start-up] Focus on Societal Benefits 27.8788 21.069 .625 .433 .792
[Start-up] Focus on Environmental Concerns 28.0606 17.615 .735 .553 .767
[Start-up] Longer Term Focus 27.7197 22.264 .572 .351 .804 [Start-up] Multi-Stakeholder Focus 27.8409 20.684 .578 .385 .803
[Start-up] Focus on Employees / Human Resources 27.7348 21.906 .594 .377 .799
[Start-up] Focus on Firm Reputation 27.5833 23.909 .493 .272 .819
Scale Statistics Mean Variance Std. Deviation N of Items
33.3636 29.561 5.43704 6
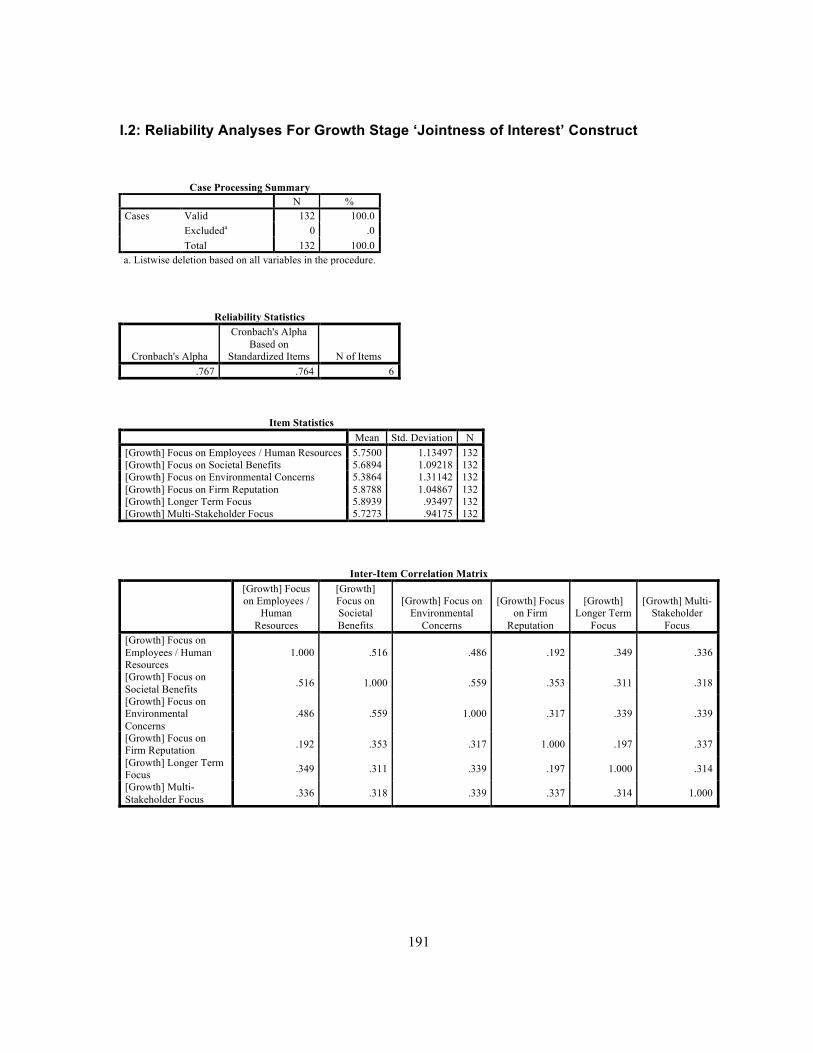
191
I.2: Reliability Analyses For Growth Stage ‘Jointness of Interest’ Construct
Case Processing Summary
N % Cases Valid 132 100.0
Excludeda 0 .0 Total 132 100.0
a. Listwise deletion based on all variables in the procedure.
Reliability Statistics
Cronbach's Alpha
Cronbach's Alpha Based on
Standardized Items N of Items .767 .764 6
Item Statistics Mean Std. Deviation N [Growth] Focus on Employees / Human Resources 5.7500 1.13497 132 [Growth] Focus on Societal Benefits 5.6894 1.09218 132 [Growth] Focus on Environmental Concerns 5.3864 1.31142 132 [Growth] Focus on Firm Reputation 5.8788 1.04867 132 [Growth] Longer Term Focus 5.8939 .93497 132 [Growth] Multi-Stakeholder Focus 5.7273 .94175 132
Inter-Item Correlation Matrix
[Growth] Focus on Employees /
Human Resources
[Growth] Focus on Societal Benefits
[Growth] Focus on Environmental
Concerns
[Growth] Focus on Firm
Reputation
[Growth] Longer Term
Focus
[Growth] Multi-Stakeholder
Focus [Growth] Focus on Employees / Human Resources
1.000 .516 .486 .192 .349 .336
[Growth] Focus on Societal Benefits .516 1.000 .559 .353 .311 .318
[Growth] Focus on Environmental Concerns
.486 .559 1.000 .317 .339 .339
[Growth] Focus on Firm Reputation .192 .353 .317 1.000 .197 .337
[Growth] Longer Term Focus .349 .311 .339 .197 1.000 .314
[Growth] Multi-Stakeholder Focus .336 .318 .339 .337 .314 1.000
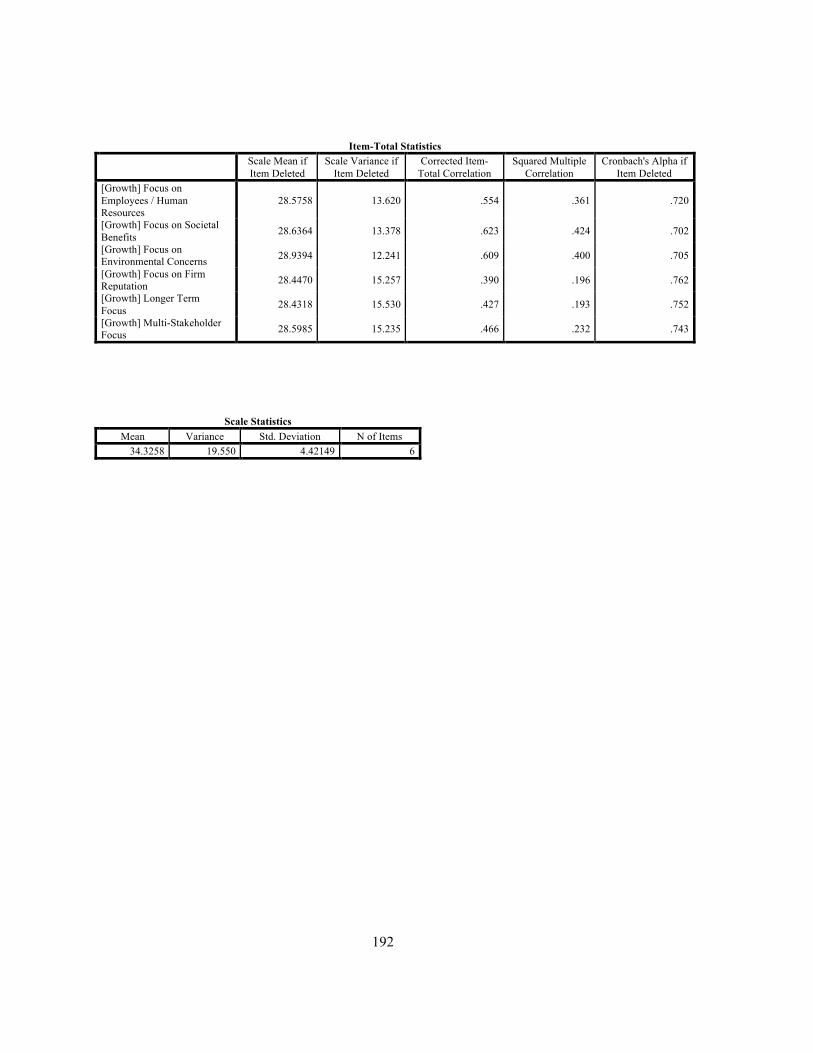
192
Item-Total Statistics
Scale Mean if Item Deleted
Scale Variance if Item Deleted
Corrected Item-Total Correlation
Squared Multiple Correlation
Cronbach's Alpha if Item Deleted
[Growth] Focus on Employees / Human Resources
28.5758 13.620 .554 .361 .720
[Growth] Focus on Societal Benefits 28.6364 13.378 .623 .424 .702
[Growth] Focus on Environmental Concerns 28.9394 12.241 .609 .400 .705
[Growth] Focus on Firm Reputation 28.4470 15.257 .390 .196 .762
[Growth] Longer Term Focus 28.4318 15.530 .427 .193 .752
[Growth] Multi-Stakeholder Focus 28.5985 15.235 .466 .232 .743
Scale Statistics Mean Variance Std. Deviation N of Items
34.3258 19.550 4.42149 6
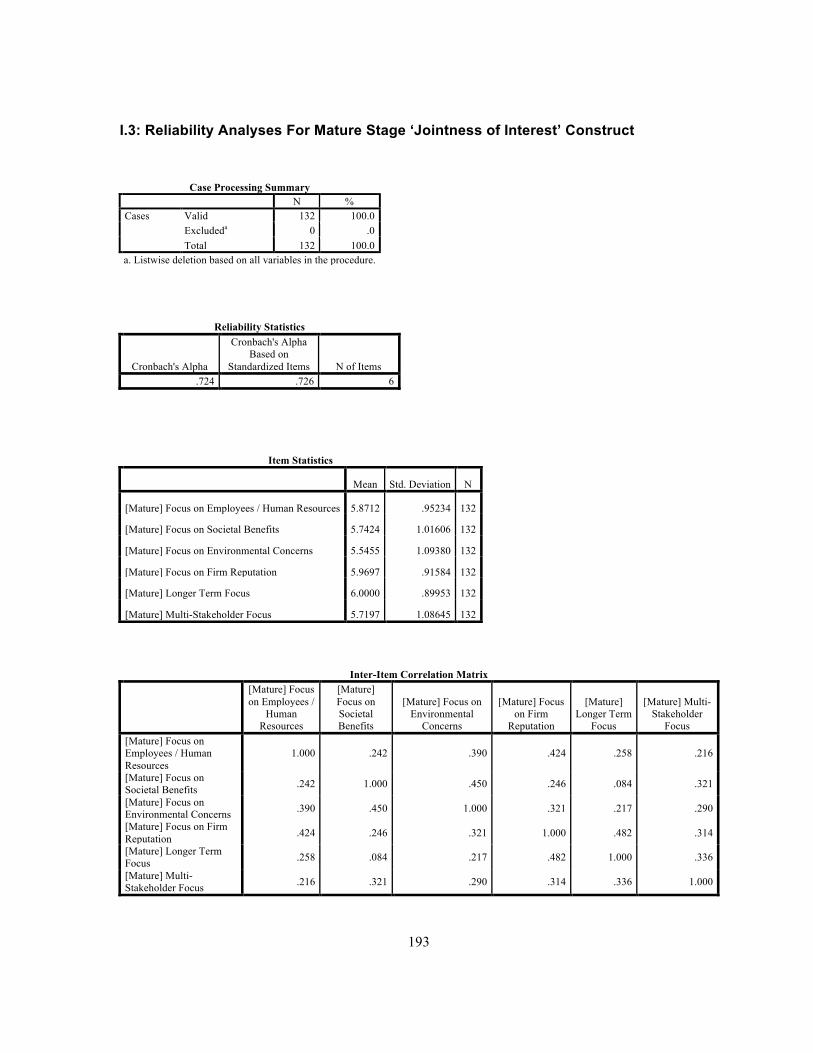
193
I.3: Reliability Analyses For Mature Stage ‘Jointness of Interest’ Construct
Case Processing Summary
N % Cases Valid 132 100.0
Excludeda 0 .0 Total 132 100.0
a. Listwise deletion based on all variables in the procedure.
Reliability Statistics
Cronbach's Alpha
Cronbach's Alpha Based on
Standardized Items N of Items .724 .726 6
Item Statistics
Mean Std. Deviation N
[Mature] Focus on Employees / Human Resources 5.8712 .95234 132
[Mature] Focus on Societal Benefits 5.7424 1.01606 132
[Mature] Focus on Environmental Concerns 5.5455 1.09380 132
[Mature] Focus on Firm Reputation 5.9697 .91584 132
[Mature] Longer Term Focus 6.0000 .89953 132
[Mature] Multi-Stakeholder Focus 5.7197 1.08645 132
Inter-Item Correlation Matrix
[Mature] Focus on Employees /
Human Resources
[Mature] Focus on Societal Benefits
[Mature] Focus on Environmental
Concerns
[Mature] Focus on Firm
Reputation
[Mature] Longer Term
Focus
[Mature] Multi-Stakeholder
Focus [Mature] Focus on Employees / Human Resources
1.000 .242 .390 .424 .258 .216
[Mature] Focus on Societal Benefits .242 1.000 .450 .246 .084 .321
[Mature] Focus on Environmental Concerns .390 .450 1.000 .321 .217 .290
[Mature] Focus on Firm Reputation .424 .246 .321 1.000 .482 .314
[Mature] Longer Term Focus .258 .084 .217 .482 1.000 .336
[Mature] Multi-Stakeholder Focus .216 .321 .290 .314 .336 1.000

194
Item-Total Statistics
Scale Mean if Item Deleted
Scale Variance if Item Deleted
Corrected Item-Total Correlation
Squared Multiple Correlation
Cronbach's Alpha if Item Deleted
[Mature] Focus on Employees / Human Resources 28.9773 11.213 .456 .256 .686
[Mature] Focus on Societal Benefits 29.1061 11.210 .410 .259 .700
[Mature] Focus on Environmental Concerns 29.3030 10.259 .510 .310 .669
[Mature] Focus on Firm Reputation 28.8788 10.932 .538 .358 .664
[Mature] Longer Term Focus 28.8485 11.748 .401 .284 .702
[Mature] Multi-Stakeholder Focus 29.1288 10.724 .439 .218 .692
Scale Statistics Mean Variance Std. Deviation N of Items
34.8485 15.030 3.87689 6
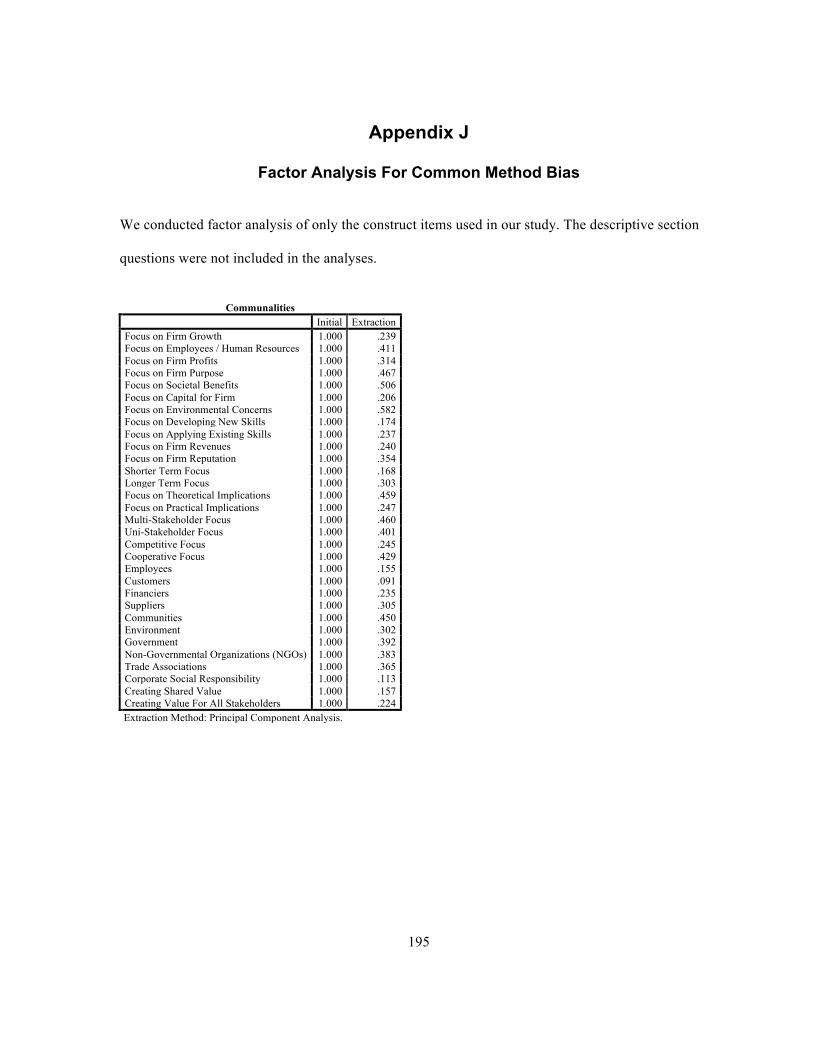
195
Appendix J
Factor Analysis For Common Method Bias
We conducted factor analysis of only the construct items used in our study. The descriptive section
questions were not included in the analyses.
Communalities
Initial Extraction Focus on Firm Growth 1.000 .239 Focus on Employees / Human Resources 1.000 .411 Focus on Firm Profits 1.000 .314 Focus on Firm Purpose 1.000 .467 Focus on Societal Benefits 1.000 .506 Focus on Capital for Firm 1.000 .206 Focus on Environmental Concerns 1.000 .582 Focus on Developing New Skills 1.000 .174 Focus on Applying Existing Skills 1.000 .237 Focus on Firm Revenues 1.000 .240 Focus on Firm Reputation 1.000 .354 Shorter Term Focus 1.000 .168 Longer Term Focus 1.000 .303 Focus on Theoretical Implications 1.000 .459 Focus on Practical Implications 1.000 .247 Multi-Stakeholder Focus 1.000 .460 Uni-Stakeholder Focus 1.000 .401 Competitive Focus 1.000 .245 Cooperative Focus 1.000 .429 Employees 1.000 .155 Customers 1.000 .091 Financiers 1.000 .235 Suppliers 1.000 .305 Communities 1.000 .450 Environment 1.000 .302 Government 1.000 .392 Non-Governmental Organizations (NGOs) 1.000 .383 Trade Associations 1.000 .365 Corporate Social Responsibility 1.000 .113 Creating Shared Value 1.000 .157 Creating Value For All Stakeholders 1.000 .224 Extraction Method: Principal Component Analysis.
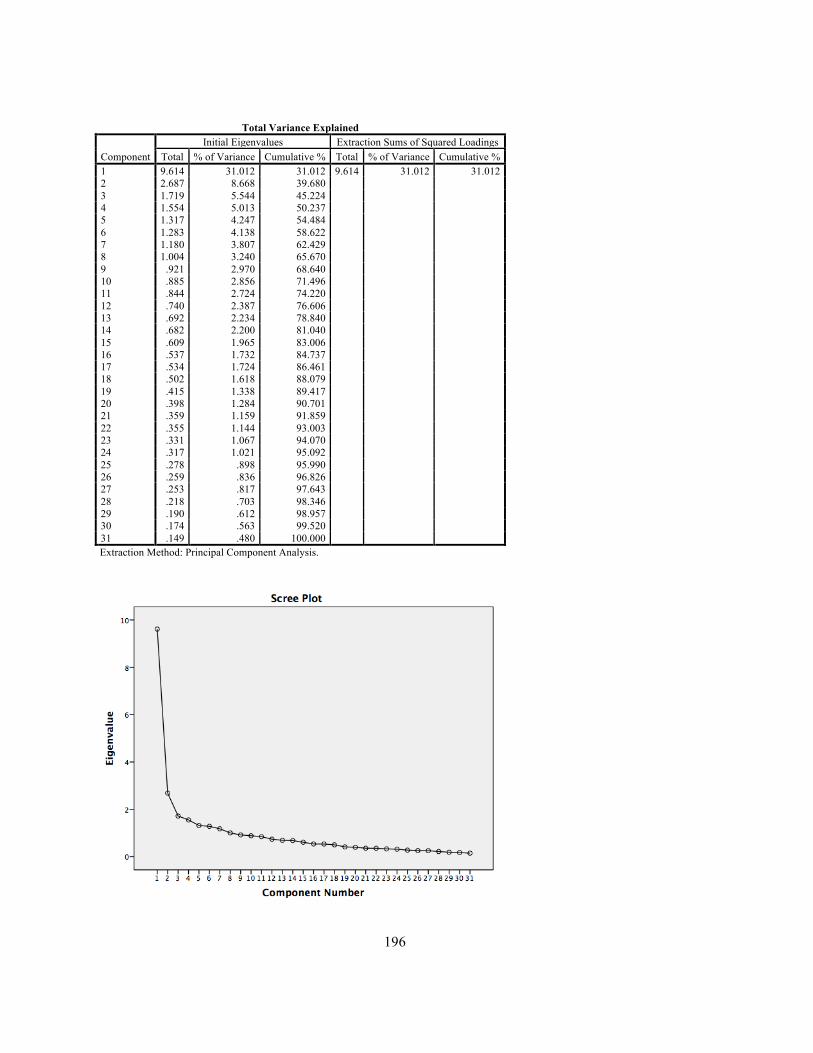
196
Total Variance Explained
Component Initial Eigenvalues Extraction Sums of Squared Loadings
Total % of Variance Cumulative % Total % of Variance Cumulative % 1 9.614 31.012 31.012 9.614 31.012 31.012 2 2.687 8.668 39.680 3 1.719 5.544 45.224 4 1.554 5.013 50.237 5 1.317 4.247 54.484 6 1.283 4.138 58.622 7 1.180 3.807 62.429 8 1.004 3.240 65.670 9 .921 2.970 68.640 10 .885 2.856 71.496 11 .844 2.724 74.220 12 .740 2.387 76.606 13 .692 2.234 78.840 14 .682 2.200 81.040 15 .609 1.965 83.006 16 .537 1.732 84.737 17 .534 1.724 86.461 18 .502 1.618 88.079 19 .415 1.338 89.417 20 .398 1.284 90.701 21 .359 1.159 91.859 22 .355 1.144 93.003 23 .331 1.067 94.070 24 .317 1.021 95.092 25 .278 .898 95.990 26 .259 .836 96.826 27 .253 .817 97.643 28 .218 .703 98.346 29 .190 .612 98.957 30 .174 .563 99.520 31 .149 .480 100.000 Extraction Method: Principal Component Analysis.

197
Appendix K
One-Way Repeated Measures ANOVA – SPSS Output
Descriptive Statistics Mean Std. Deviation N [Start-up] Focus on Firm Growth 6.0530 .90220 132 [Growth] Focus on Firm Growth 5.9848 .93274 132 [Mature] Focus on Firm Growth 5.8788 .98872 132 [Start-up] Focus on Employees / Human Resources 5.6288 1.14188 132 [Growth] Focus on Employees / Human Resources 5.7500 1.13497 132 [Mature] Focus on Employees / Human Resources 5.8712 .95234 132 [Start-up] Focus on Firm Profits 5.7045 1.07532 132 [Growth] Focus on Firm Profits 6.0227 .74614 132 [Mature] Focus on Firm Profits 5.9470 1.04344 132 [Start-up] Focus on Firm Purpose 5.8258 1.14249 132 [Growth] Focus on Firm Purpose 5.7576 .94199 132 [Mature] Focus on Firm Purpose 5.9242 .89631 132 [Start-up] Focus on Societal Benefits 5.4848 1.21997 132 [Growth] Focus on Societal Benefits 5.6894 1.09218 132 [Mature] Focus on Societal Benefits 5.7424 1.01606 132 [Start-up] Focus on Capital for Firm 6.0227 .83315 132 [Growth] Focus on Capital for Firm 5.8864 .93815 132 [Mature] Focus on Capital for Firm 5.8333 1.09939 132 [Start-up] Focus on Environmental Concerns 5.3030 1.54791 132 [Growth] Focus on Environmental Concerns 5.3864 1.31142 132 [Mature] Focus on Environmental Concerns 5.5455 1.09380 132 [Start-up] Focus on Developing New Skills 5.7955 1.01695 132 [Growth] Focus on Developing New Skills 5.7424 1.00092 132 [Mature] Focus on Developing New Skills 5.8409 .97940 132 [Start-up] Focus on Applying Existing Skills 5.8485 1.01504 132 [Growth] Focus on Applying Existing Skills 5.8258 .94502 132 [Mature] Focus on Applying Existing Skills 5.9015 1.00274 132 [Start-up] Focus on Firm Revenues 5.7652 1.20343 132 [Growth] Focus on Firm Revenues 5.9848 .90785 132 [Mature] Focus on Firm Revenues 5.9470 1.04344 132 [Start-up] Focus on Firm Reputation 5.7803 .97538 132 [Growth] Focus on Firm Reputation 5.8788 1.04867 132 [Mature] Focus on Firm Reputation 5.9697 .91584 132 [Start-up] Shorter Term Focus 5.7727 1.03813 132 [Growth] Shorter Term Focus 5.6667 1.19584 132 [Mature] Shorter Term Focus 5.5909 1.30738 132 [Start-up] Longer Term Focus 5.6439 1.11979 132 [Growth] Longer Term Focus 5.8939 .93497 132 [Mature] Longer Term Focus 6.0000 .89953 132 [Start-up] Focus on Theoretical Implications 5.5379 1.20688 132 [Growth] Focus on Theoretical Implications 5.5985 1.13823 132 [Mature] Focus on Theoretical Implications 5.6667 1.10975 132 [Start-up] Focus on Practical Implications 5.8712 1.04411 132 [Growth] Focus on Practical Implications 5.8712 1.00689 132 [Mature] Focus on Practical Implications 5.7500 .99138 132 [Start-up] Multi-Stakeholder Focus 5.5227 1.34486 132 [Growth] Multi-Stakeholder Focus 5.7273 .94175 132 [Mature] Multi-Stakeholder Focus 5.7197 1.08645 132 [Start-up] Uni-Stakeholder Focus 5.5833 1.20458 132 [Growth] Uni-Stakeholder Focus 5.5152 1.31628 132 [Mature] Uni-Stakeholder Focus 5.5152 1.12897 132 [Start-up] Competitive Focus 5.7121 1.24502 132 [Growth] Competitive Focus 5.8030 1.01470 132 [Mature] Competitive Focus 5.8636 .97113 132 [Start-up] Cooperative Focus 5.7955 1.08943 132 [Growth] Cooperative Focus 5.5379 1.06581 132 [Mature] Cooperative Focus 5.8182 1.06877 132
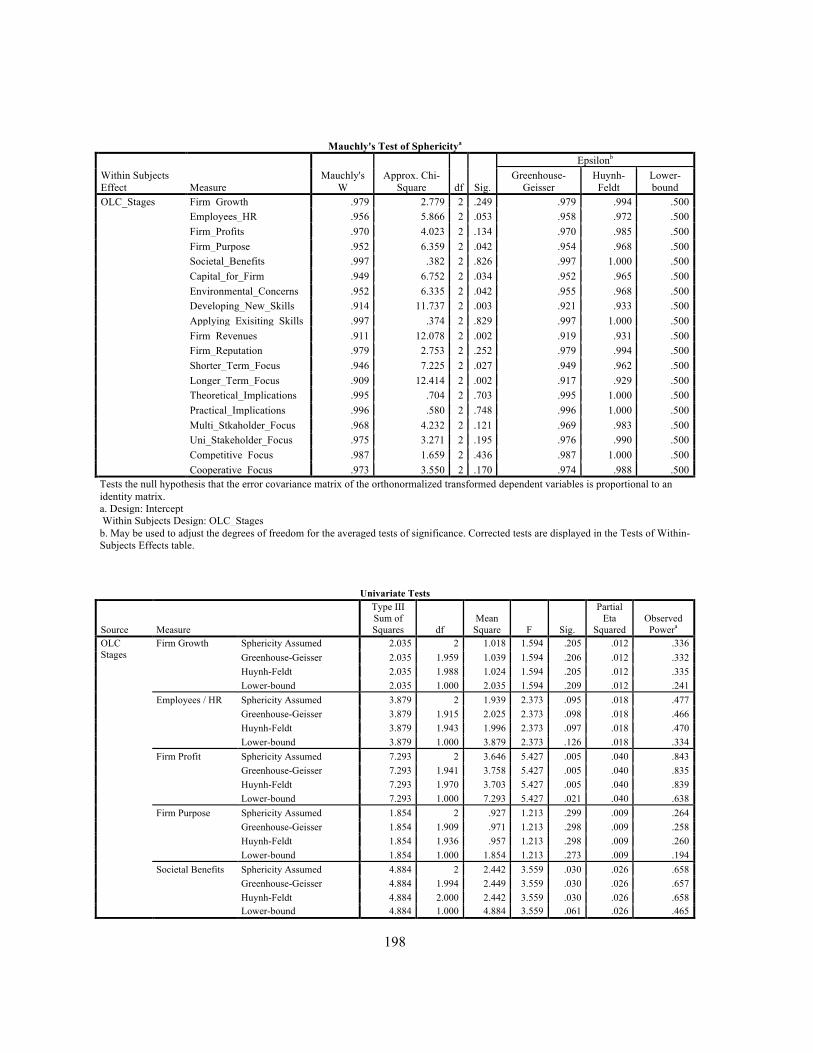
198
Mauchly's Test of Sphericitya
Within Subjects Effect Measure
Mauchly's W
Approx. Chi-Square df Sig.
Epsilonb Greenhouse-
Geisser Huynh-
Feldt Lower-bound
OLC_Stages Firm_Growth .979 2.779 2 .249 .979 .994 .500 Employees_HR .956 5.866 2 .053 .958 .972 .500 Firm_Profits .970 4.023 2 .134 .970 .985 .500 Firm_Purpose .952 6.359 2 .042 .954 .968 .500 Societal_Benefits .997 .382 2 .826 .997 1.000 .500 Capital_for_Firm .949 6.752 2 .034 .952 .965 .500 Environmental_Concerns .952 6.335 2 .042 .955 .968 .500 Developing_New_Skills .914 11.737 2 .003 .921 .933 .500 Applying_Exisiting_Skills .997 .374 2 .829 .997 1.000 .500 Firm_Revenues .911 12.078 2 .002 .919 .931 .500 Firm_Reputation .979 2.753 2 .252 .979 .994 .500 Shorter_Term_Focus .946 7.225 2 .027 .949 .962 .500 Longer_Term_Focus .909 12.414 2 .002 .917 .929 .500 Theoretical_Implications .995 .704 2 .703 .995 1.000 .500 Practical_Implications .996 .580 2 .748 .996 1.000 .500 Multi_Stkaholder_Focus .968 4.232 2 .121 .969 .983 .500 Uni_Stakeholder_Focus .975 3.271 2 .195 .976 .990 .500 Competitive_Focus .987 1.659 2 .436 .987 1.000 .500 Cooperative_Focus .973 3.550 2 .170 .974 .988 .500
Tests the null hypothesis that the error covariance matrix of the orthonormalized transformed dependent variables is proportional to an identity matrix. a. Design: Intercept Within Subjects Design: OLC_Stages b. May be used to adjust the degrees of freedom for the averaged tests of significance. Corrected tests are displayed in the Tests of Within-Subjects Effects table.
Univariate Tests
Source Measure
Type III Sum of Squares df
Mean Square F Sig.
Partial Eta
Squared Observed Powera
OLC Stages
Firm Growth Sphericity Assumed 2.035 2 1.018 1.594 .205 .012 .336 Greenhouse-Geisser 2.035 1.959 1.039 1.594 .206 .012 .332 Huynh-Feldt 2.035 1.988 1.024 1.594 .205 .012 .335 Lower-bound 2.035 1.000 2.035 1.594 .209 .012 .241
Employees / HR Sphericity Assumed 3.879 2 1.939 2.373 .095 .018 .477 Greenhouse-Geisser 3.879 1.915 2.025 2.373 .098 .018 .466 Huynh-Feldt 3.879 1.943 1.996 2.373 .097 .018 .470 Lower-bound 3.879 1.000 3.879 2.373 .126 .018 .334
Firm Profit Sphericity Assumed 7.293 2 3.646 5.427 .005 .040 .843 Greenhouse-Geisser 7.293 1.941 3.758 5.427 .005 .040 .835 Huynh-Feldt 7.293 1.970 3.703 5.427 .005 .040 .839 Lower-bound 7.293 1.000 7.293 5.427 .021 .040 .638
Firm Purpose Sphericity Assumed 1.854 2 .927 1.213 .299 .009 .264 Greenhouse-Geisser 1.854 1.909 .971 1.213 .298 .009 .258 Huynh-Feldt 1.854 1.936 .957 1.213 .298 .009 .260 Lower-bound 1.854 1.000 1.854 1.213 .273 .009 .194
Societal Benefits Sphericity Assumed 4.884 2 2.442 3.559 .030 .026 .658 Greenhouse-Geisser 4.884 1.994 2.449 3.559 .030 .026 .657 Huynh-Feldt 4.884 2.000 2.442 3.559 .030 .026 .658 Lower-bound 4.884 1.000 4.884 3.559 .061 .026 .465

199
(Continued) Capital For Firm Sphericity Assumed 2.520 2 1.260 1.933 .147 .015 .399
Greenhouse-Geisser 2.520 1.904 1.324 1.933 .149 .015 .389 Huynh-Feldt 2.520 1.931 1.305 1.933 .148 .015 .392 Lower-bound 2.520 1.000 2.520 1.933 .167 .015 .281
Environmental Concerns
Sphericity Assumed 4.005 2 2.003 1.938 .146 .015 .400 Greenhouse-Geisser 4.005 1.909 2.098 1.938 .148 .015 .390 Huynh-Feldt 4.005 1.937 2.068 1.938 .147 .015 .393 Lower-bound 4.005 1.000 4.005 1.938 .166 .015 .282
Developing New Skills
Sphericity Assumed .641 2 .321 .465 .629 .004 .126 Greenhouse-Geisser .641 1.841 .348 .465 .613 .004 .122 Huynh-Feldt .641 1.866 .344 .465 .615 .004 .123 Lower-bound .641 1.000 .641 .465 .496 .004 .104
Applying Existing Skills
Sphericity Assumed .399 2 .199 .279 .757 .002 .094 Greenhouse-Geisser .399 1.994 .200 .279 .756 .002 .094 Huynh-Feldt .399 2.000 .199 .279 .757 .002 .094 Lower-bound .399 1.000 .399 .279 .599 .002 .082
Firm Revenues Sphericity Assumed 3.641 2 1.821 2.413 .092 .018 .484 Greenhouse-Geisser 3.641 1.837 1.982 2.413 .096 .018 .463 Huynh-Feldt 3.641 1.862 1.956 2.413 .096 .018 .466 Lower-bound 3.641 1.000 3.641 2.413 .123 .018 .338
Firm Reputation Sphericity Assumed 2.369 2 1.184 1.985 .139 .015 .409 Greenhouse-Geisser 2.369 1.959 1.209 1.985 .140 .015 .404 Huynh-Feldt 2.369 1.988 1.191 1.985 .140 .015 .407 Lower-bound 2.369 1.000 2.369 1.985 .161 .015 .288
Shorter Term Sphericity Assumed 2.202 2 1.101 1.170 .312 .009 .256 Greenhouse-Geisser 2.202 1.897 1.161 1.170 .310 .009 .249 Huynh-Feldt 2.202 1.925 1.144 1.170 .311 .009 .251 Lower-bound 2.202 1.000 2.202 1.170 .281 .009 .189
Longer Term Sphericity Assumed 8.823 2 4.412 6.356 .002 .046 .898 Greenhouse-Geisser 8.823 1.833 4.813 6.356 .003 .046 .877 Huynh-Feldt 8.823 1.858 4.749 6.356 .003 .046 .881 Lower-bound 8.823 1.000 8.823 6.356 .013 .046 .706
Theoretical Implications
Sphericity Assumed 1.096 2 .548 .692 .502 .005 .166 Greenhouse-Geisser 1.096 1.989 .551 .692 .501 .005 .166 Huynh-Feldt 1.096 2.000 .548 .692 .502 .005 .166 Lower-bound 1.096 1.000 1.096 .692 .407 .005 .131
Practical Implications
Sphericity Assumed 1.293 2 .646 .988 .374 .007 .221 Greenhouse-Geisser 1.293 1.991 .649 .988 .373 .007 .221 Huynh-Feldt 1.293 2.000 .646 .988 .374 .007 .221 Lower-bound 1.293 1.000 1.293 .988 .322 .007 .167
Multi-Stakeholder Sphericity Assumed 3.551 2 1.775 1.842 .160 .014 .382 Greenhouse-Geisser 3.551 1.938 1.832 1.842 .162 .014 .376 Huynh-Feldt 3.551 1.967 1.805 1.842 .161 .014 .379 Lower-bound 3.551 1.000 3.551 1.842 .177 .014 .271
Uni-Stakeholder Sphericity Assumed .409 2 .205 .246 .782 .002 .089 Greenhouse-Geisser .409 1.952 .210 .246 .776 .002 .088 Huynh-Feldt .409 1.981 .207 .246 .780 .002 .088 Lower-bound .409 1.000 .409 .246 .621 .002 .078
Competitive Sphericity Assumed 1.535 2 .768 .938 .393 .007 .212 Greenhouse-Geisser 1.535 1.975 .777 .938 .392 .007 .210 Huynh-Feldt 1.535 2.000 .768 .938 .393 .007 .212 Lower-bound 1.535 1.000 1.535 .938 .335 .007 .161
Cooperative Sphericity Assumed 6.399 2 3.199 5.002 .007 .037 .811 Greenhouse-Geisser 6.399 1.948 3.286 5.002 .008 .037 .803 Huynh-Feldt 6.399 1.977 3.237 5.002 .008 .037 .807 Lower-bound 6.399 1.000 6.399 5.002 .027 .037 .603

200
(Continued) Error (OLC Stages)
Firm Growth Sphericity Assumed 167.298 262 .639 Greenhouse-Geisser 167.298 256.574 .652 Huynh-Feldt 167.298 260.426 .642 Lower-bound 167.298 131.000 1.277
Employees / HR Sphericity Assumed 214.121 262 .817 Greenhouse-Geisser 214.121 250.929 .853 Huynh-Feldt 214.121 254.567 .841 Lower-bound 214.121 131.000 1.635
Firm Profit Sphericity Assumed 176.040 262 .672 Greenhouse-Geisser 176.040 254.252 .692 Huynh-Feldt 176.040 258.015 .682 Lower-bound 176.040 131.000 1.344
Firm Purpose Sphericity Assumed 200.146 262 .764 Greenhouse-Geisser 200.146 250.062 .800 Huynh-Feldt 200.146 253.668 .789 Lower-bound 200.146 131.000 1.528
Societal Benefits Sphericity Assumed 179.783 262 .686 Greenhouse-Geisser 179.783 261.233 .688 Huynh-Feldt 179.783 262.000 .686 Lower-bound 179.783 131.000 1.372
Capital For Firm Sphericity Assumed 170.813 262 .652 Greenhouse-Geisser 170.813 249.378 .685 Huynh-Feldt 170.813 252.957 .675 Lower-bound 170.813 131.000 1.304
Environmental Concerns
Sphericity Assumed 270.662 262 1.033 Greenhouse-Geisser 270.662 250.105 1.082 Huynh-Feldt 270.662 253.711 1.067 Lower-bound 270.662 131.000 2.066
Developing New Skills
Sphericity Assumed 180.692 262 .690 Greenhouse-Geisser 180.692 241.179 .749 Huynh-Feldt 180.692 244.455 .739 Lower-bound 180.692 131.000 1.379
Applying Existing Skills
Sphericity Assumed 187.601 262 .716 Greenhouse-Geisser 187.601 261.249 .718 Huynh-Feldt 187.601 262.000 .716 Lower-bound 187.601 131.000 1.432
Firm Revenues Sphericity Assumed 197.692 262 .755 Greenhouse-Geisser 197.692 240.650 .821 Huynh-Feldt 197.692 243.907 .811 Lower-bound 197.692 131.000 1.509
Firm Reputation Sphericity Assumed 156.298 262 .597 Greenhouse-Geisser 156.298 256.622 .609 Huynh-Feldt 156.298 260.476 .600 Lower-bound 156.298 131.000 1.193
Shorter Term Sphericity Assumed 246.465 262 .941 Greenhouse-Geisser 246.465 248.563 .992 Huynh-Feldt 246.465 252.112 .978 Lower-bound 246.465 131.000 1.881
Longer Term Sphericity Assumed 181.843 262 .694 Greenhouse-Geisser 181.843 240.130 .757 Huynh-Feldt 181.843 243.368 .747 Lower-bound 181.843 131.000 1.388
Theoretical Implications
Sphericity Assumed 207.571 262 .792 Greenhouse-Geisser 207.571 260.592 .797 Huynh-Feldt 207.571 262.000 .792 Lower-bound 207.571 131.000 1.585
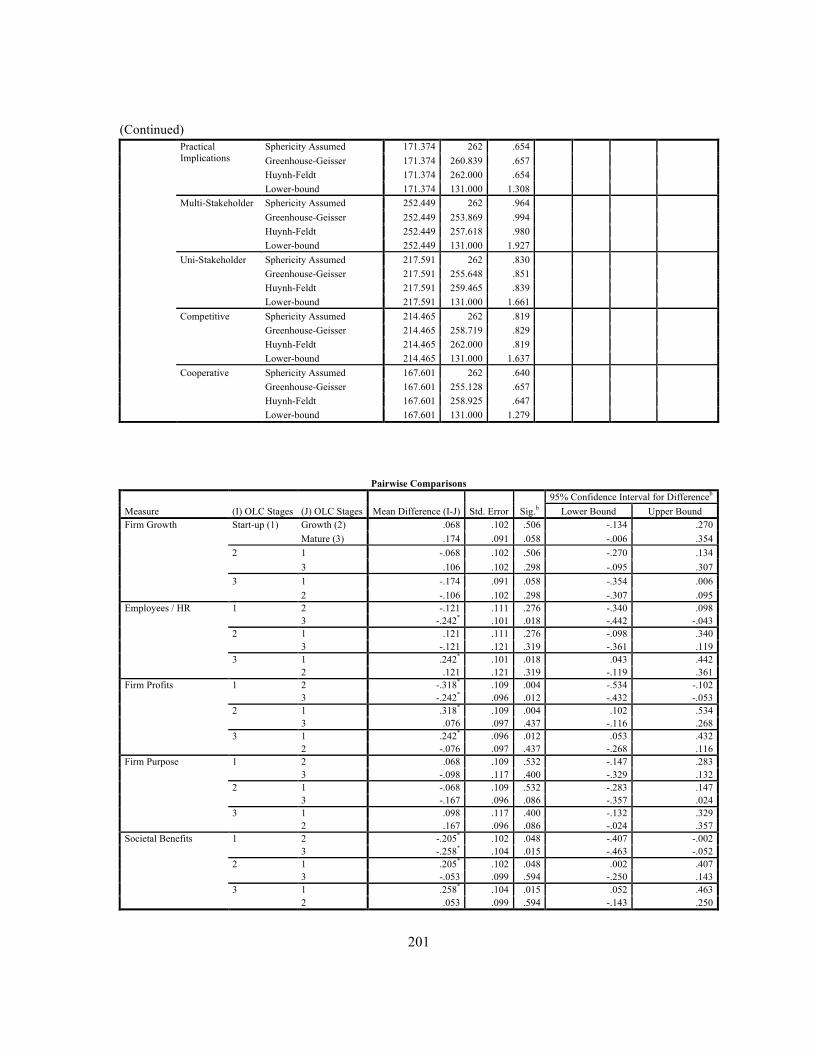
201
(Continued) Practical
Implications Sphericity Assumed 171.374 262 .654 Greenhouse-Geisser 171.374 260.839 .657 Huynh-Feldt 171.374 262.000 .654 Lower-bound 171.374 131.000 1.308
Multi-Stakeholder Sphericity Assumed 252.449 262 .964 Greenhouse-Geisser 252.449 253.869 .994 Huynh-Feldt 252.449 257.618 .980 Lower-bound 252.449 131.000 1.927
Uni-Stakeholder Sphericity Assumed 217.591 262 .830 Greenhouse-Geisser 217.591 255.648 .851 Huynh-Feldt 217.591 259.465 .839 Lower-bound 217.591 131.000 1.661
Competitive Sphericity Assumed 214.465 262 .819 Greenhouse-Geisser 214.465 258.719 .829 Huynh-Feldt 214.465 262.000 .819 Lower-bound 214.465 131.000 1.637
Cooperative Sphericity Assumed 167.601 262 .640 Greenhouse-Geisser 167.601 255.128 .657 Huynh-Feldt 167.601 258.925 .647 Lower-bound 167.601 131.000 1.279
Pairwise Comparisons
Measure (I) OLC Stages (J) OLC Stages Mean Difference (I-J) Std. Error Sig.b 95% Confidence Interval for Differenceb
Lower Bound Upper Bound Firm Growth Start-up (1) Growth (2) .068 .102 .506 -.134 .270
Mature (3) .174 .091 .058 -.006 .354 2 1 -.068 .102 .506 -.270 .134
3 .106 .102 .298 -.095 .307 3 1 -.174 .091 .058 -.354 .006
2 -.106 .102 .298 -.307 .095 Employees / HR 1 2 -.121 .111 .276 -.340 .098
3 -.242* .101 .018 -.442 -.043 2 1 .121 .111 .276 -.098 .340
3 -.121 .121 .319 -.361 .119 3 1 .242* .101 .018 .043 .442
2 .121 .121 .319 -.119 .361 Firm Profits 1 2 -.318* .109 .004 -.534 -.102
3 -.242* .096 .012 -.432 -.053 2 1 .318* .109 .004 .102 .534
3 .076 .097 .437 -.116 .268 3 1 .242* .096 .012 .053 .432
2 -.076 .097 .437 -.268 .116 Firm Purpose 1 2 .068 .109 .532 -.147 .283
3 -.098 .117 .400 -.329 .132 2 1 -.068 .109 .532 -.283 .147
3 -.167 .096 .086 -.357 .024 3 1 .098 .117 .400 -.132 .329
2 .167 .096 .086 -.024 .357 Societal Benefits 1 2 -.205* .102 .048 -.407 -.002
3 -.258* .104 .015 -.463 -.052 2 1 .205* .102 .048 .002 .407
3 -.053 .099 .594 -.250 .143 3 1 .258* .104 .015 .052 .463
2 .053 .099 .594 -.143 .250
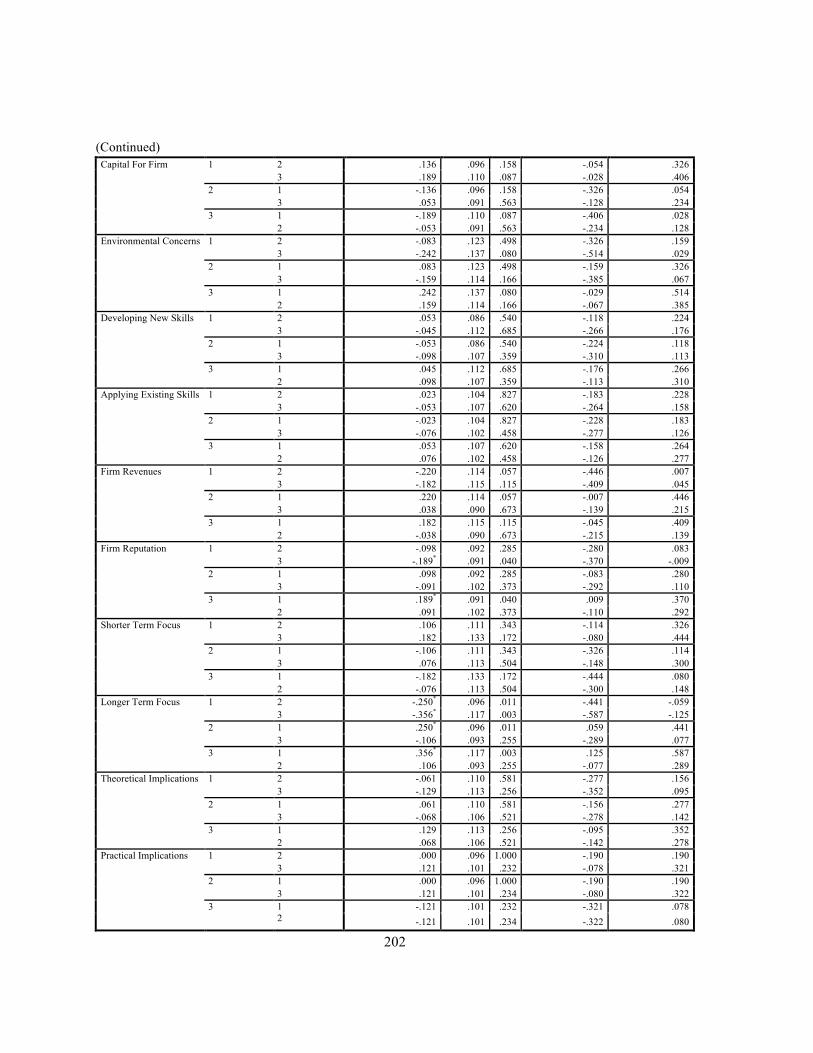
202
(Continued)
Capital For Firm 1 2 .136 .096 .158 -.054 .326 3 .189 .110 .087 -.028 .406
2 1 -.136 .096 .158 -.326 .054 3 .053 .091 .563 -.128 .234
3 1 -.189 .110 .087 -.406 .028 2 -.053 .091 .563 -.234 .128
Environmental Concerns 1 2 -.083 .123 .498 -.326 .159 3 -.242 .137 .080 -.514 .029
2 1 .083 .123 .498 -.159 .326 3 -.159 .114 .166 -.385 .067
3 1 .242 .137 .080 -.029 .514 2 .159 .114 .166 -.067 .385
Developing New Skills 1 2 .053 .086 .540 -.118 .224 3 -.045 .112 .685 -.266 .176
2 1 -.053 .086 .540 -.224 .118 3 -.098 .107 .359 -.310 .113
3 1 .045 .112 .685 -.176 .266 2 .098 .107 .359 -.113 .310
Applying Existing Skills 1 2 .023 .104 .827 -.183 .228 3 -.053 .107 .620 -.264 .158
2 1 -.023 .104 .827 -.228 .183 3 -.076 .102 .458 -.277 .126
3 1 .053 .107 .620 -.158 .264 2 .076 .102 .458 -.126 .277
Firm Revenues 1 2 -.220 .114 .057 -.446 .007 3 -.182 .115 .115 -.409 .045
2 1 .220 .114 .057 -.007 .446 3 .038 .090 .673 -.139 .215
3 1 .182 .115 .115 -.045 .409 2 -.038 .090 .673 -.215 .139
Firm Reputation 1 2 -.098 .092 .285 -.280 .083 3 -.189* .091 .040 -.370 -.009
2 1 .098 .092 .285 -.083 .280 3 -.091 .102 .373 -.292 .110
3 1 .189* .091 .040 .009 .370 2 .091 .102 .373 -.110 .292
Shorter Term Focus 1 2 .106 .111 .343 -.114 .326 3 .182 .133 .172 -.080 .444
2 1 -.106 .111 .343 -.326 .114 3 .076 .113 .504 -.148 .300
3 1 -.182 .133 .172 -.444 .080 2 -.076 .113 .504 -.300 .148
Longer Term Focus 1 2 -.250* .096 .011 -.441 -.059 3 -.356* .117 .003 -.587 -.125
2 1 .250* .096 .011 .059 .441 3 -.106 .093 .255 -.289 .077
3 1 .356* .117 .003 .125 .587 2 .106 .093 .255 -.077 .289
Theoretical Implications 1 2 -.061 .110 .581 -.277 .156 3 -.129 .113 .256 -.352 .095
2 1 .061 .110 .581 -.156 .277 3 -.068 .106 .521 -.278 .142
3 1 .129 .113 .256 -.095 .352 2 .068 .106 .521 -.142 .278
Practical Implications 1 2 .000 .096 1.000 -.190 .190 3 .121 .101 .232 -.078 .321
2 1 .000 .096 1.000 -.190 .190 3 .121 .101 .234 -.080 .322
3 1 2
-.121 .101 .232 -.321 .078 -.121 .101 .234 -.322 .080
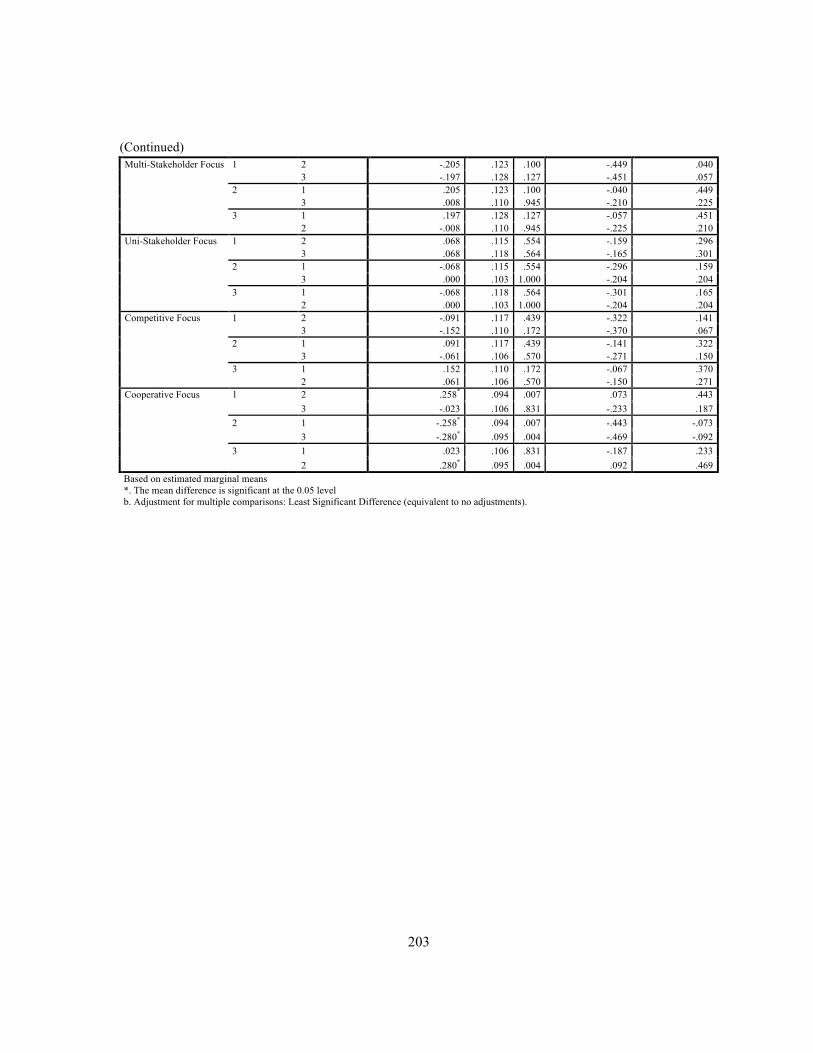
203
(Continued)
Multi-Stakeholder Focus 1 2 -.205 .123 .100 -.449 .040 3 -.197 .128 .127 -.451 .057
2 1 .205 .123 .100 -.040 .449 3 .008 .110 .945 -.210 .225
3 1 .197 .128 .127 -.057 .451 2 -.008 .110 .945 -.225 .210
Uni-Stakeholder Focus 1 2 .068 .115 .554 -.159 .296 3 .068 .118 .564 -.165 .301
2 1 -.068 .115 .554 -.296 .159 3 .000 .103 1.000 -.204 .204
3 1 -.068 .118 .564 -.301 .165 2 .000 .103 1.000 -.204 .204
Competitive Focus 1 2 -.091 .117 .439 -.322 .141 3 -.152 .110 .172 -.370 .067
2 1 .091 .117 .439 -.141 .322 3 -.061 .106 .570 -.271 .150
3 1 .152 .110 .172 -.067 .370 2 .061 .106 .570 -.150 .271
Cooperative Focus 1 2 .258* .094 .007 .073 .443 3 -.023 .106 .831 -.233 .187
2 1 -.258* .094 .007 -.443 -.073 3 -.280* .095 .004 -.469 -.092
3 1 .023 .106 .831 -.187 .233 2 .280* .095 .004 .092 .469
Based on estimated marginal means *. The mean difference is significant at the 0.05 level b. Adjustment for multiple comparisons: Least Significant Difference (equivalent to no adjustments).

204
Appendix L
Determining Occupational Experience Data Normality
Tests of Normality
Total ICT Experience Kolmogorov-Smirnova Shapiro-Wilk Statistic df Sig. Statistic df Sig.
Employees 1 to 5 years .208 45 .000 .860 45 .000 6 to 10 years .212 42 .000 .790 42 .000 11 years and above .178 41 .002 .884 41 .001
Customers 1 to 5 years .202 45 .000 .875 45 .000 6 to 10 years .223 42 .000 .826 42 .000 11 years and above .254 41 .000 .793 41 .000
Financiers 1 to 5 years .211 45 .000 .852 45 .000 6 to 10 years .229 42 .000 .886 42 .001 11 years and above .278 41 .000 .838 41 .000
Suppliers 1 to 5 years .255 45 .000 .835 45 .000 6 to 10 years .301 42 .000 .797 42 .000 11 years and above .226 41 .000 .869 41 .000
Communities 1 to 5 years .203 45 .000 .875 45 .000 6 to 10 years .322 42 .000 .830 42 .000 11 years and above .177 41 .002 .902 41 .002
Environment 1 to 5 years .184 45 .001 .847 45 .000 6 to 10 years .207 42 .000 .881 42 .000 11 years and above .262 41 .000 .901 41 .002
Government 1 to 5 years .201 45 .000 .872 45 .000 6 to 10 years .220 42 .000 .861 42 .000 11 years and above .202 41 .000 .881 41 .000
Non-Governmental Organizations (NGOs) 1 to 5 years .193 45 .000 .899 45 .001 6 to 10 years .211 42 .000 .860 42 .000 11 years and above .151 41 .020 .919 41 .007
Trade Associations 1 to 5 years .196 45 .000 .890 45 .000 6 to 10 years .223 42 .000 .886 42 .001 11 years and above .156 41 .013 .939 41 .028
a. Lilliefors Significance Correction
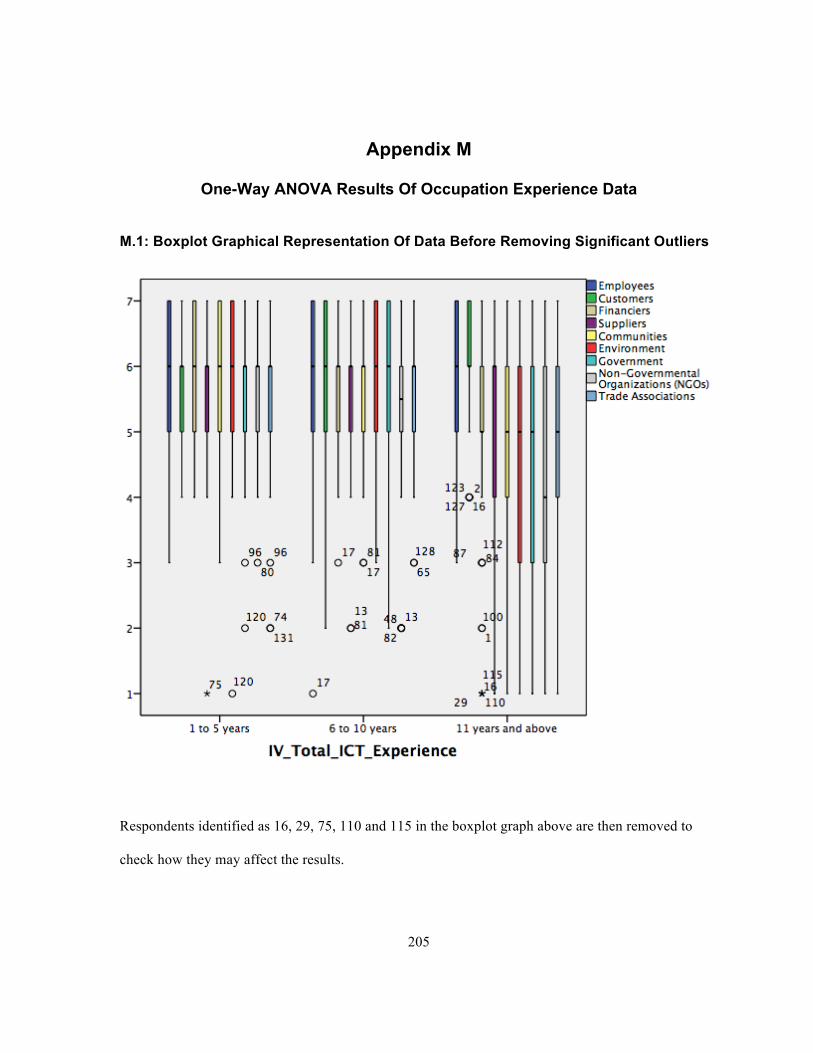
205
Appendix M
One-Way ANOVA Results Of Occupation Experience Data
M.1: Boxplot Graphical Representation Of Data Before Removing Significant Outliers
Respondents identified as 16, 29, 75, 110 and 115 in the boxplot graph above are then removed to
check how they may affect the results.
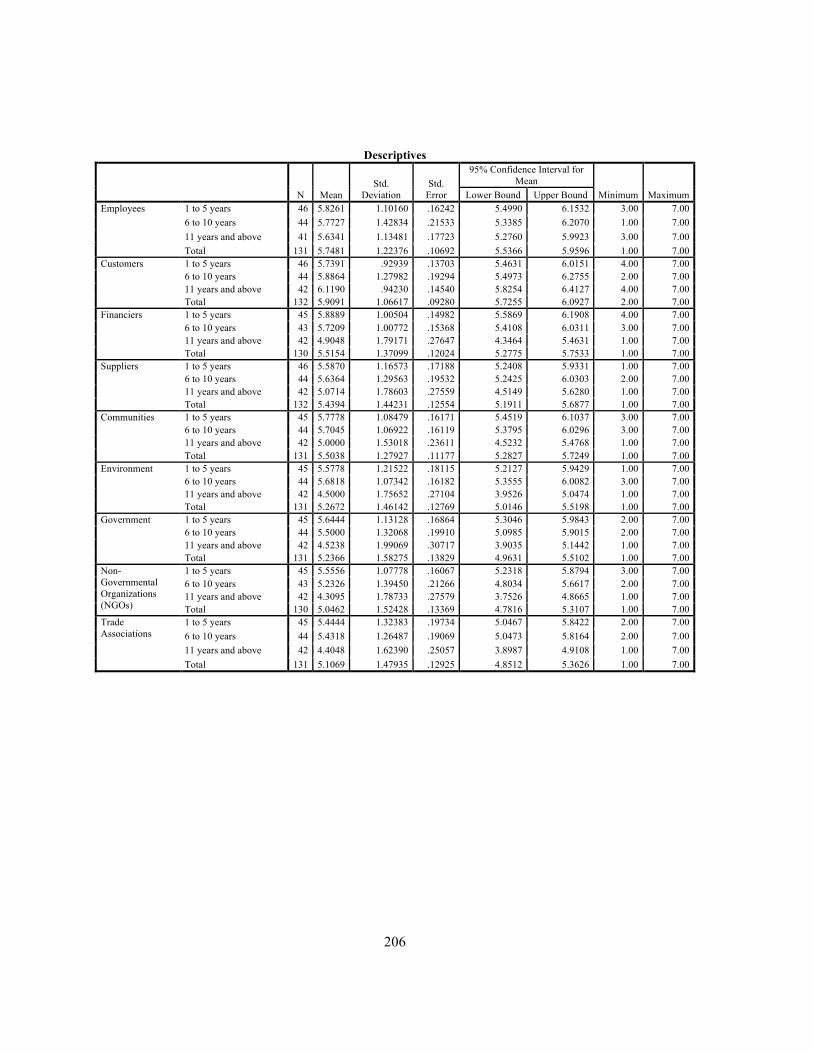
206
Descriptives
N Mean Std.
Deviation Std.
Error
95% Confidence Interval for Mean
Minimum Maximum Lower Bound Upper Bound Employees 1 to 5 years 46 5.8261 1.10160 .16242 5.4990 6.1532 3.00 7.00
6 to 10 years 44 5.7727 1.42834 .21533 5.3385 6.2070 1.00 7.00 11 years and above 41 5.6341 1.13481 .17723 5.2760 5.9923 3.00 7.00 Total 131 5.7481 1.22376 .10692 5.5366 5.9596 1.00 7.00
Customers 1 to 5 years 46 5.7391 .92939 .13703 5.4631 6.0151 4.00 7.00 6 to 10 years 44 5.8864 1.27982 .19294 5.4973 6.2755 2.00 7.00 11 years and above 42 6.1190 .94230 .14540 5.8254 6.4127 4.00 7.00 Total 132 5.9091 1.06617 .09280 5.7255 6.0927 2.00 7.00
Financiers 1 to 5 years 45 5.8889 1.00504 .14982 5.5869 6.1908 4.00 7.00 6 to 10 years 43 5.7209 1.00772 .15368 5.4108 6.0311 3.00 7.00 11 years and above 42 4.9048 1.79171 .27647 4.3464 5.4631 1.00 7.00 Total 130 5.5154 1.37099 .12024 5.2775 5.7533 1.00 7.00
Suppliers 1 to 5 years 46 5.5870 1.16573 .17188 5.2408 5.9331 1.00 7.00 6 to 10 years 44 5.6364 1.29563 .19532 5.2425 6.0303 2.00 7.00 11 years and above 42 5.0714 1.78603 .27559 4.5149 5.6280 1.00 7.00 Total 132 5.4394 1.44231 .12554 5.1911 5.6877 1.00 7.00
Communities 1 to 5 years 45 5.7778 1.08479 .16171 5.4519 6.1037 3.00 7.00 6 to 10 years 44 5.7045 1.06922 .16119 5.3795 6.0296 3.00 7.00 11 years and above 42 5.0000 1.53018 .23611 4.5232 5.4768 1.00 7.00 Total 131 5.5038 1.27927 .11177 5.2827 5.7249 1.00 7.00
Environment 1 to 5 years 45 5.5778 1.21522 .18115 5.2127 5.9429 1.00 7.00 6 to 10 years 44 5.6818 1.07342 .16182 5.3555 6.0082 3.00 7.00 11 years and above 42 4.5000 1.75652 .27104 3.9526 5.0474 1.00 7.00 Total 131 5.2672 1.46142 .12769 5.0146 5.5198 1.00 7.00
Government 1 to 5 years 45 5.6444 1.13128 .16864 5.3046 5.9843 2.00 7.00 6 to 10 years 44 5.5000 1.32068 .19910 5.0985 5.9015 2.00 7.00 11 years and above 42 4.5238 1.99069 .30717 3.9035 5.1442 1.00 7.00 Total 131 5.2366 1.58275 .13829 4.9631 5.5102 1.00 7.00
Non-Governmental Organizations (NGOs)
1 to 5 years 45 5.5556 1.07778 .16067 5.2318 5.8794 3.00 7.00 6 to 10 years 43 5.2326 1.39450 .21266 4.8034 5.6617 2.00 7.00 11 years and above 42 4.3095 1.78733 .27579 3.7526 4.8665 1.00 7.00 Total 130 5.0462 1.52428 .13369 4.7816 5.3107 1.00 7.00
Trade Associations
1 to 5 years 45 5.4444 1.32383 .19734 5.0467 5.8422 2.00 7.00 6 to 10 years 44 5.4318 1.26487 .19069 5.0473 5.8164 2.00 7.00 11 years and above 42 4.4048 1.62390 .25057 3.8987 4.9108 1.00 7.00 Total 131 5.1069 1.47935 .12925 4.8512 5.3626 1.00 7.00
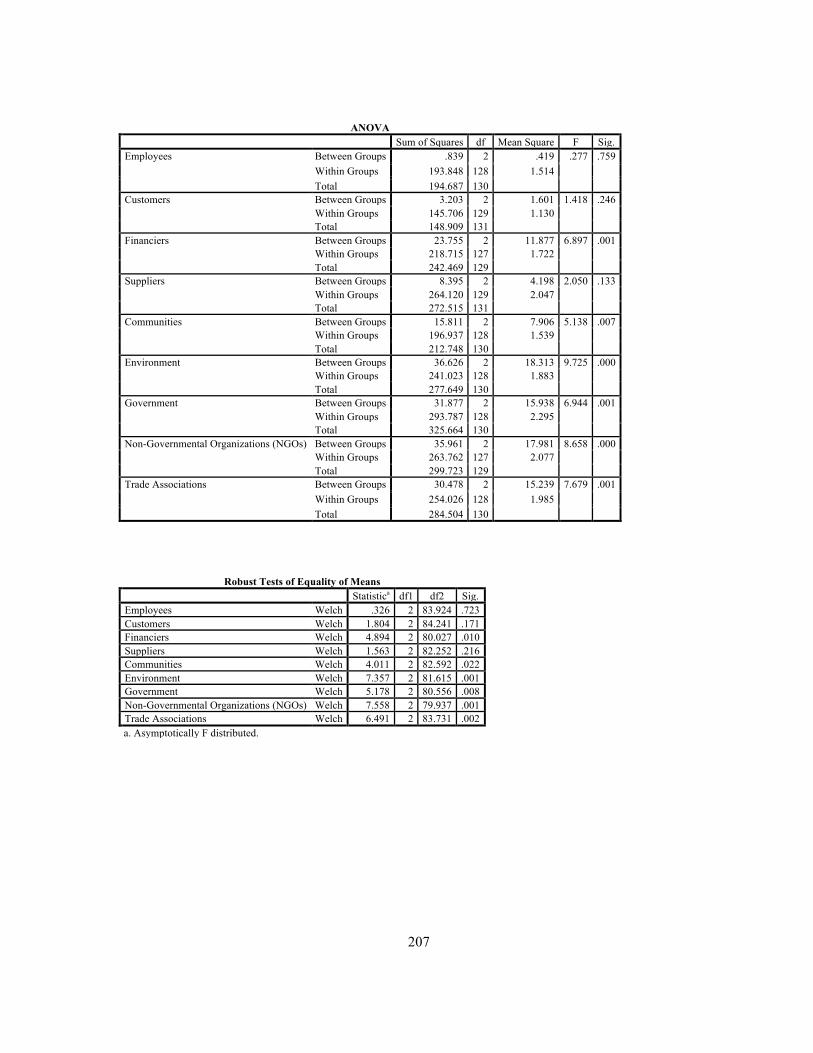
207
ANOVA Sum of Squares df Mean Square F Sig. Employees Between Groups .839 2 .419 .277 .759
Within Groups 193.848 128 1.514 Total 194.687 130
Customers Between Groups 3.203 2 1.601 1.418 .246 Within Groups 145.706 129 1.130 Total 148.909 131
Financiers Between Groups 23.755 2 11.877 6.897 .001 Within Groups 218.715 127 1.722 Total 242.469 129
Suppliers Between Groups 8.395 2 4.198 2.050 .133 Within Groups 264.120 129 2.047 Total 272.515 131
Communities Between Groups 15.811 2 7.906 5.138 .007 Within Groups 196.937 128 1.539 Total 212.748 130
Environment Between Groups 36.626 2 18.313 9.725 .000 Within Groups 241.023 128 1.883 Total 277.649 130
Government Between Groups 31.877 2 15.938 6.944 .001 Within Groups 293.787 128 2.295 Total 325.664 130
Non-Governmental Organizations (NGOs) Between Groups 35.961 2 17.981 8.658 .000 Within Groups 263.762 127 2.077 Total 299.723 129
Trade Associations Between Groups 30.478 2 15.239 7.679 .001 Within Groups 254.026 128 1.985 Total 284.504 130
Robust Tests of Equality of Means
Statistica df1 df2 Sig. Employees Welch .326 2 83.924 .723 Customers Welch 1.804 2 84.241 .171 Financiers Welch 4.894 2 80.027 .010 Suppliers Welch 1.563 2 82.252 .216 Communities Welch 4.011 2 82.592 .022 Environment Welch 7.357 2 81.615 .001 Government Welch 5.178 2 80.556 .008 Non-Governmental Organizations (NGOs) Welch 7.558 2 79.937 .001 Trade Associations Welch 6.491 2 83.731 .002 a. Asymptotically F distributed.
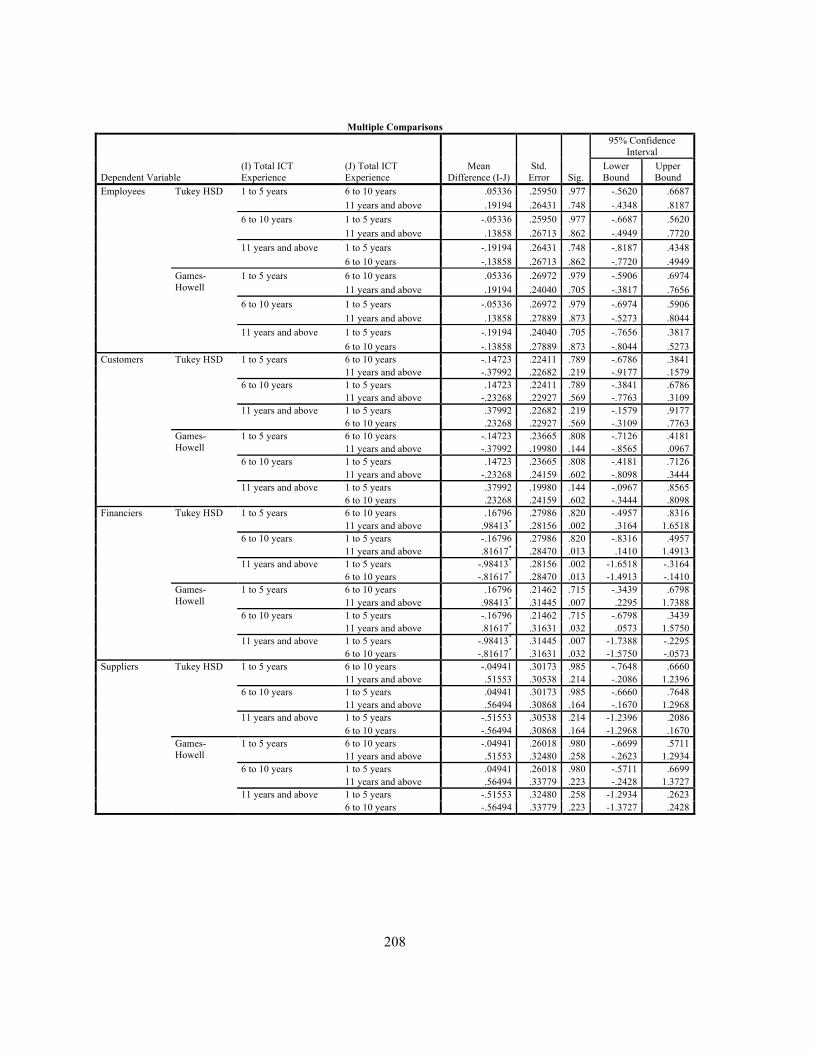
208
Multiple Comparisons
Dependent Variable (I) Total ICT Experience
(J) Total ICT Experience
Mean Difference (I-J)
Std. Error Sig.
95% Confidence Interval
Lower Bound
Upper Bound
Employees Tukey HSD 1 to 5 years 6 to 10 years .05336 .25950 .977 -.5620 .6687 11 years and above .19194 .26431 .748 -.4348 .8187
6 to 10 years 1 to 5 years -.05336 .25950 .977 -.6687 .5620 11 years and above .13858 .26713 .862 -.4949 .7720
11 years and above 1 to 5 years -.19194 .26431 .748 -.8187 .4348 6 to 10 years -.13858 .26713 .862 -.7720 .4949
Games-Howell
1 to 5 years 6 to 10 years .05336 .26972 .979 -.5906 .6974 11 years and above .19194 .24040 .705 -.3817 .7656
6 to 10 years 1 to 5 years -.05336 .26972 .979 -.6974 .5906 11 years and above .13858 .27889 .873 -.5273 .8044
11 years and above 1 to 5 years -.19194 .24040 .705 -.7656 .3817 6 to 10 years -.13858 .27889 .873 -.8044 .5273
Customers Tukey HSD 1 to 5 years 6 to 10 years -.14723 .22411 .789 -.6786 .3841 11 years and above -.37992 .22682 .219 -.9177 .1579
6 to 10 years 1 to 5 years .14723 .22411 .789 -.3841 .6786 11 years and above -.23268 .22927 .569 -.7763 .3109
11 years and above 1 to 5 years .37992 .22682 .219 -.1579 .9177 6 to 10 years .23268 .22927 .569 -.3109 .7763
Games-Howell
1 to 5 years 6 to 10 years -.14723 .23665 .808 -.7126 .4181 11 years and above -.37992 .19980 .144 -.8565 .0967
6 to 10 years 1 to 5 years .14723 .23665 .808 -.4181 .7126 11 years and above -.23268 .24159 .602 -.8098 .3444
11 years and above 1 to 5 years .37992 .19980 .144 -.0967 .8565 6 to 10 years .23268 .24159 .602 -.3444 .8098
Financiers Tukey HSD 1 to 5 years 6 to 10 years .16796 .27986 .820 -.4957 .8316 11 years and above .98413* .28156 .002 .3164 1.6518
6 to 10 years 1 to 5 years -.16796 .27986 .820 -.8316 .4957 11 years and above .81617* .28470 .013 .1410 1.4913
11 years and above 1 to 5 years -.98413* .28156 .002 -1.6518 -.3164 6 to 10 years -.81617* .28470 .013 -1.4913 -.1410
Games-Howell
1 to 5 years 6 to 10 years .16796 .21462 .715 -.3439 .6798 11 years and above .98413* .31445 .007 .2295 1.7388
6 to 10 years 1 to 5 years -.16796 .21462 .715 -.6798 .3439 11 years and above .81617* .31631 .032 .0573 1.5750
11 years and above 1 to 5 years -.98413* .31445 .007 -1.7388 -.2295 6 to 10 years -.81617* .31631 .032 -1.5750 -.0573
Suppliers Tukey HSD 1 to 5 years 6 to 10 years -.04941 .30173 .985 -.7648 .6660 11 years and above .51553 .30538 .214 -.2086 1.2396
6 to 10 years 1 to 5 years .04941 .30173 .985 -.6660 .7648 11 years and above .56494 .30868 .164 -.1670 1.2968
11 years and above 1 to 5 years -.51553 .30538 .214 -1.2396 .2086 6 to 10 years -.56494 .30868 .164 -1.2968 .1670
Games-Howell
1 to 5 years 6 to 10 years -.04941 .26018 .980 -.6699 .5711 11 years and above .51553 .32480 .258 -.2623 1.2934
6 to 10 years 1 to 5 years .04941 .26018 .980 -.5711 .6699 11 years and above .56494 .33779 .223 -.2428 1.3727
11 years and above 1 to 5 years -.51553 .32480 .258 -1.2934 .2623 6 to 10 years -.56494 .33779 .223 -1.3727 .2428
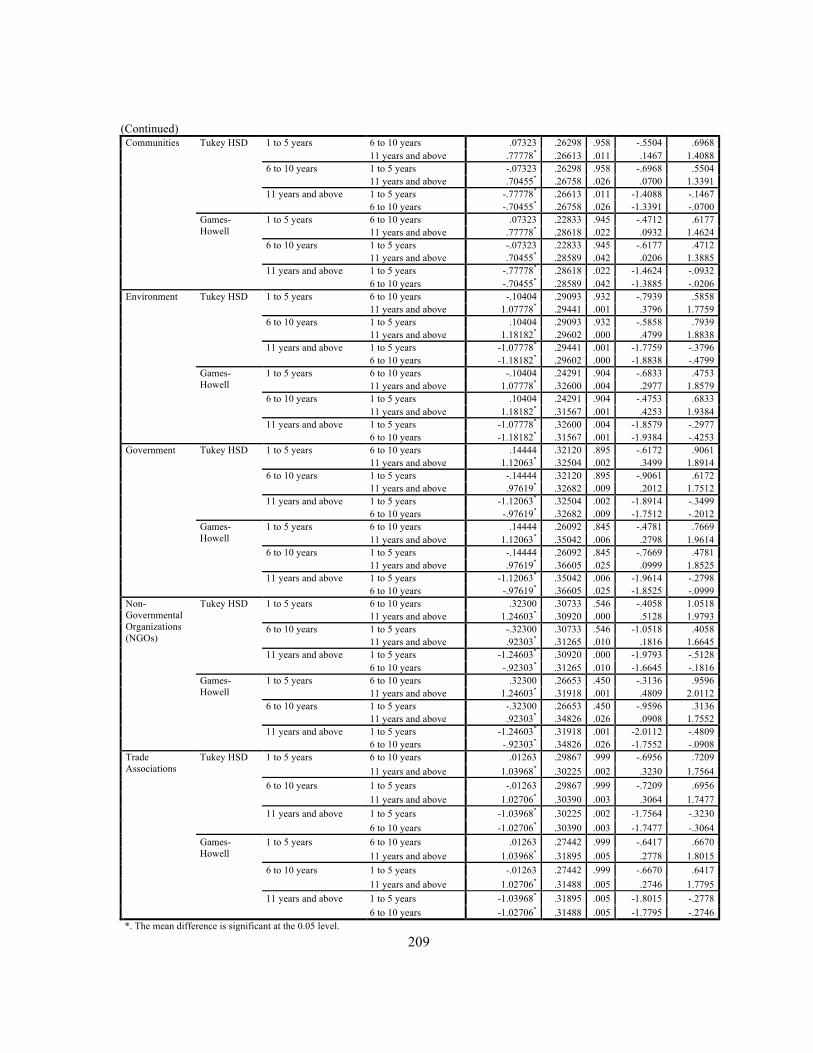
209
(Continued) Communities Tukey HSD 1 to 5 years 6 to 10 years .07323 .26298 .958 -.5504 .6968
11 years and above .77778* .26613 .011 .1467 1.4088 6 to 10 years 1 to 5 years -.07323 .26298 .958 -.6968 .5504
11 years and above .70455* .26758 .026 .0700 1.3391 11 years and above 1 to 5 years -.77778* .26613 .011 -1.4088 -.1467
6 to 10 years -.70455* .26758 .026 -1.3391 -.0700 Games-Howell
1 to 5 years 6 to 10 years .07323 .22833 .945 -.4712 .6177 11 years and above .77778* .28618 .022 .0932 1.4624
6 to 10 years 1 to 5 years -.07323 .22833 .945 -.6177 .4712 11 years and above .70455* .28589 .042 .0206 1.3885
11 years and above 1 to 5 years -.77778* .28618 .022 -1.4624 -.0932 6 to 10 years -.70455* .28589 .042 -1.3885 -.0206
Environment Tukey HSD 1 to 5 years 6 to 10 years -.10404 .29093 .932 -.7939 .5858 11 years and above 1.07778* .29441 .001 .3796 1.7759
6 to 10 years 1 to 5 years .10404 .29093 .932 -.5858 .7939 11 years and above 1.18182* .29602 .000 .4799 1.8838
11 years and above 1 to 5 years -1.07778* .29441 .001 -1.7759 -.3796 6 to 10 years -1.18182* .29602 .000 -1.8838 -.4799
Games-Howell
1 to 5 years 6 to 10 years -.10404 .24291 .904 -.6833 .4753 11 years and above 1.07778* .32600 .004 .2977 1.8579
6 to 10 years 1 to 5 years .10404 .24291 .904 -.4753 .6833 11 years and above 1.18182* .31567 .001 .4253 1.9384
11 years and above 1 to 5 years -1.07778* .32600 .004 -1.8579 -.2977 6 to 10 years -1.18182* .31567 .001 -1.9384 -.4253
Government Tukey HSD 1 to 5 years 6 to 10 years .14444 .32120 .895 -.6172 .9061 11 years and above 1.12063* .32504 .002 .3499 1.8914
6 to 10 years 1 to 5 years -.14444 .32120 .895 -.9061 .6172 11 years and above .97619* .32682 .009 .2012 1.7512
11 years and above 1 to 5 years -1.12063* .32504 .002 -1.8914 -.3499 6 to 10 years -.97619* .32682 .009 -1.7512 -.2012
Games-Howell
1 to 5 years 6 to 10 years .14444 .26092 .845 -.4781 .7669 11 years and above 1.12063* .35042 .006 .2798 1.9614
6 to 10 years 1 to 5 years -.14444 .26092 .845 -.7669 .4781 11 years and above .97619* .36605 .025 .0999 1.8525
11 years and above 1 to 5 years -1.12063* .35042 .006 -1.9614 -.2798 6 to 10 years -.97619* .36605 .025 -1.8525 -.0999
Non-Governmental Organizations (NGOs)
Tukey HSD 1 to 5 years 6 to 10 years .32300 .30733 .546 -.4058 1.0518 11 years and above 1.24603* .30920 .000 .5128 1.9793
6 to 10 years 1 to 5 years -.32300 .30733 .546 -1.0518 .4058 11 years and above .92303* .31265 .010 .1816 1.6645
11 years and above 1 to 5 years -1.24603* .30920 .000 -1.9793 -.5128 6 to 10 years -.92303* .31265 .010 -1.6645 -.1816
Games-Howell
1 to 5 years 6 to 10 years .32300 .26653 .450 -.3136 .9596 11 years and above 1.24603* .31918 .001 .4809 2.0112
6 to 10 years 1 to 5 years -.32300 .26653 .450 -.9596 .3136 11 years and above .92303* .34826 .026 .0908 1.7552
11 years and above 1 to 5 years -1.24603* .31918 .001 -2.0112 -.4809 6 to 10 years -.92303* .34826 .026 -1.7552 -.0908
Trade Associations
Tukey HSD 1 to 5 years 6 to 10 years .01263 .29867 .999 -.6956 .7209 11 years and above 1.03968* .30225 .002 .3230 1.7564
6 to 10 years 1 to 5 years -.01263 .29867 .999 -.7209 .6956 11 years and above 1.02706* .30390 .003 .3064 1.7477
11 years and above 1 to 5 years -1.03968* .30225 .002 -1.7564 -.3230 6 to 10 years -1.02706* .30390 .003 -1.7477 -.3064
Games-Howell
1 to 5 years 6 to 10 years .01263 .27442 .999 -.6417 .6670 11 years and above 1.03968* .31895 .005 .2778 1.8015
6 to 10 years 1 to 5 years -.01263 .27442 .999 -.6670 .6417 11 years and above 1.02706* .31488 .005 .2746 1.7795
11 years and above 1 to 5 years -1.03968* .31895 .005 -1.8015 -.2778 6 to 10 years -1.02706* .31488 .005 -1.7795 -.2746
*. The mean difference is significant at the 0.05 level.
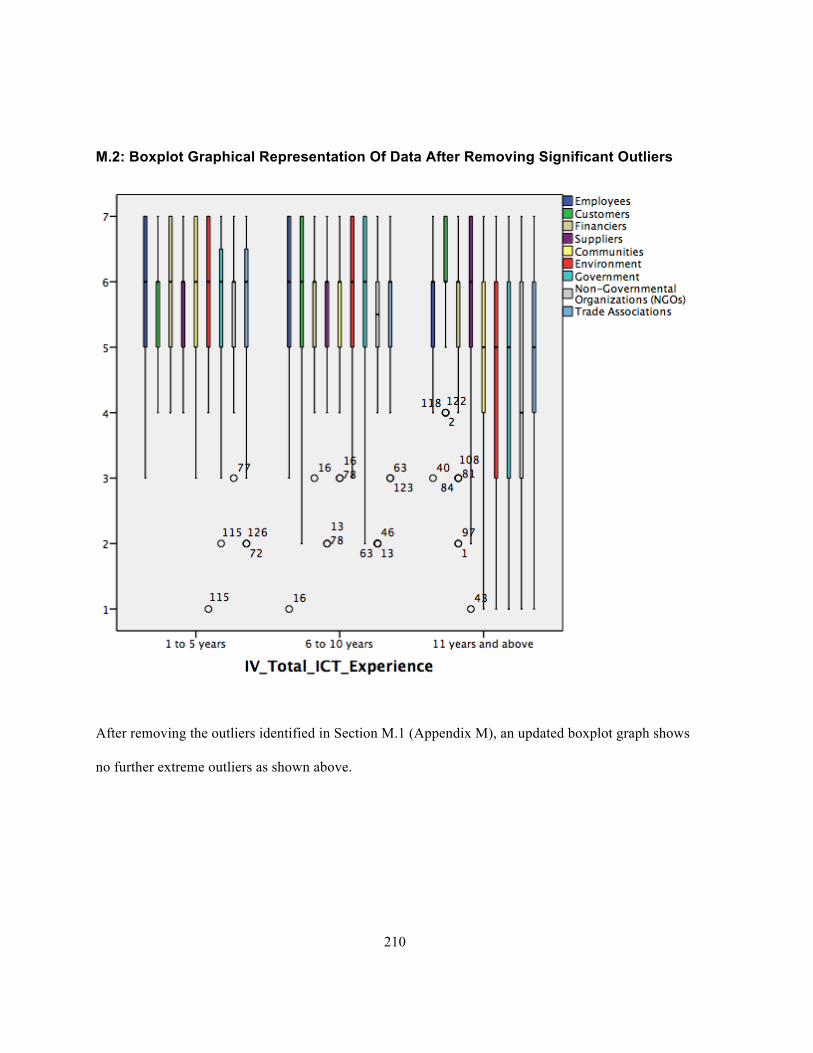
210
M.2: Boxplot Graphical Representation Of Data After Removing Significant Outliers
After removing the outliers identified in Section M.1 (Appendix M), an updated boxplot graph shows
no further extreme outliers as shown above.

211
Descriptives
N Mean Std.
Deviation Std.
Error
95% Confidence Interval for Mean
Minimum Maximum Lower Bound
Upper Bound
Employees 1 to 5 years 45 5.8000 1.09959 .16392 5.4696 6.1304 3.00 7.00 6 to 10 years 44 5.7727 1.42834 .21533 5.3385 6.2070 1.00 7.00 11 years and above 37 5.5405 1.12038 .18419 5.1670 5.9141 3.00 7.00 Total 126 5.7143 1.22544 .10917 5.4982 5.9303 1.00 7.00
Customers 1 to 5 years 45 5.7333 .93905 .13999 5.4512 6.0155 4.00 7.00 6 to 10 years 44 5.8864 1.27982 .19294 5.4973 6.2755 2.00 7.00 11 years and above 38 6.1053 .89411 .14504 5.8114 6.3991 4.00 7.00 Total 127 5.8976 1.06036 .09409 5.7114 6.0838 2.00 7.00
Financiers 1 to 5 years 44 5.8864 1.01651 .15325 5.5773 6.1954 4.00 7.00 6 to 10 years 43 5.7209 1.00772 .15368 5.4108 6.0311 3.00 7.00 11 years and above 38 5.3158 1.31735 .21370 4.8828 5.7488 2.00 7.00 Total 125 5.6560 1.12954 .10103 5.4560 5.8560 2.00 7.00
Suppliers 1 to 5 years 45 5.6889 .94922 .14150 5.4037 5.9741 4.00 7.00 6 to 10 years 44 5.6364 1.29563 .19532 5.2425 6.0303 2.00 7.00 11 years and above 38 5.3421 1.61540 .26205 4.8111 5.8731 1.00 7.00 Total 127 5.5669 1.29462 .11488 5.3396 5.7943 1.00 7.00
Communities 1 to 5 years 44 5.7955 1.09075 .16444 5.4638 6.1271 3.00 7.00 6 to 10 years 44 5.7045 1.06922 .16119 5.3795 6.0296 3.00 7.00 11 years and above 38 5.0789 1.42149 .23060 4.6117 5.5462 1.00 7.00 Total 126 5.5476 1.22381 .10903 5.3318 5.7634 1.00 7.00
Environment 1 to 5 years 44 5.5909 1.22604 .18483 5.2182 5.9637 1.00 7.00 6 to 10 years 44 5.6818 1.07342 .16182 5.3555 6.0082 3.00 7.00 11 years and above 38 4.6053 1.77885 .28857 4.0206 5.1900 1.00 7.00 Total 126 5.3254 1.44127 .12840 5.0713 5.5795 1.00 7.00
Government 1 to 5 years 44 5.6364 1.14305 .17232 5.2888 5.9839 2.00 7.00 6 to 10 years 44 5.5000 1.32068 .19910 5.0985 5.9015 2.00 7.00 11 years and above 38 4.6579 1.94903 .31617 4.0173 5.2985 1.00 7.00 Total 126 5.2937 1.53398 .13666 5.0232 5.5641 1.00 7.00
Non-Governmental Organizations (NGOs)
1 to 5 years 44 5.5682 1.08687 .16385 5.2377 5.8986 3.00 7.00 6 to 10 years 43 5.2326 1.39450 .21266 4.8034 5.6617 2.00 7.00 11 years and above 38 4.3947 1.70118 .27597 3.8356 4.9539 1.00 7.00 Total 125 5.0960 1.47246 .13170 4.8353 5.3567 1.00 7.00
Trade Associations
1 to 5 years 44 5.4545 1.33738 .20162 5.0479 5.8611 2.00 7.00 6 to 10 years 44 5.4318 1.26487 .19069 5.0473 5.8164 2.00 7.00 11 years and above 38 4.5789 1.55323 .25197 4.0684 5.0895 1.00 7.00 Total 126 5.1825 1.42773 .12719 4.9308 5.4343 1.00 7.00

212
ANOVA
Sum of Squares df Mean Square F Sig. Employees Between Groups 1.598 2 .799 .528 .591
Within Groups 186.116 123 1.513 Total 187.714 125
Customers Between Groups 2.859 2 1.429 1.277 .283 Within Groups 138.811 124 1.119 Total 141.669 126
Financiers Between Groups 6.914 2 3.457 2.788 .065 Within Groups 151.294 122 1.240 Total 158.208 124
Suppliers Between Groups 2.802 2 1.401 .834 .437 Within Groups 208.379 124 1.680 Total 211.181 126
Communities Between Groups 12.133 2 6.066 4.262 .016 Within Groups 175.081 123 1.423 Total 187.214 125
Environment Between Groups 28.398 2 14.199 7.552 .001 Within Groups 231.261 123 1.880 Total 259.659 125
Government Between Groups 22.400 2 11.200 5.070 .008 Within Groups 271.734 123 2.209 Total 294.135 125
Non-Governmental Organizations (NGOs) Between Groups 29.299 2 14.650 7.461 .001 Within Groups 239.549 122 1.964 Total 268.848 124
Trade Associations Between Groups 19.834 2 9.917 5.191 .007 Within Groups 234.968 123 1.910 Total 254.802 125

213
Multiple Comparisons
Dependent Variable (I) Total ICT Experience
(J) Total ICT Experience
Mean Difference (I-
J) Std.
Error Sig.
95% Confidence Interval
Lower Bound
Upper Bound
Employees Tukey HSD
1 to 5 years 6 to 10 years .02727 .26080 .994 -.5914 .6460 11 years and above .25946 .27299 .610 -.3882 .9071
6 to 10 years 1 to 5 years -.02727 .26080 .994 -.6460 .5914 11 years and above .23219 .27438 .675 -.4188 .8831
11 years and above
1 to 5 years -.25946 .27299 .610 -.9071 .3882 6 to 10 years -.23219 .27438 .675 -.8831 .4188
Games-Howell
1 to 5 years 6 to 10 years .02727 .27062 .994 -.6189 .6734 11 years and above .25946 .24657 .546 -.3299 .8488
6 to 10 years 1 to 5 years -.02727 .27062 .994 -.6734 .6189 11 years and above .23219 .28336 .692 -.4447 .9091
11 years and above
1 to 5 years -.25946 .24657 .546 -.8488 .3299 6 to 10 years -.23219 .28336 .692 -.9091 .4447
Customers Tukey HSD
1 to 5 years 6 to 10 years -.15303 .22432 .774 -.6852 .3791 11 years and above -.37193 .23310 .251 -.9249 .1810
6 to 10 years 1 to 5 years .15303 .22432 .774 -.3791 .6852 11 years and above -.21890 .23431 .620 -.7747 .3369
11 years and above
1 to 5 years .37193 .23310 .251 -.1810 .9249 6 to 10 years .21890 .23431 .620 -.3369 .7747
Games-Howell
1 to 5 years 6 to 10 years -.15303 .23837 .797 -.7225 .4164 11 years and above -.37193 .20158 .162 -.8533 .1095
6 to 10 years 1 to 5 years .15303 .23837 .797 -.4164 .7225 11 years and above -.21890 .24138 .638 -.7958 .3580
11 years and above
1 to 5 years .37193 .20158 .162 -.1095 .8533 6 to 10 years .21890 .24138 .638 -.3580 .7958
Financiers Tukey HSD
1 to 5 years 6 to 10 years .16543 .23880 .768 -.4012 .7320 11 years and above .57057 .24661 .058 -.0146 1.1557
6 to 10 years 1 to 5 years -.16543 .23880 .768 -.7320 .4012 11 years and above .40514 .24794 .235 -.1831 .9934
11 years and above
1 to 5 years -.57057 .24661 .058 -1.1557 .0146 6 to 10 years -.40514 .24794 .235 -.9934 .1831
Games-Howell
1 to 5 years 6 to 10 years .16543 .21703 .727 -.3523 .6831 11 years and above .57057 .26297 .084 -.0593 1.2004
6 to 10 years 1 to 5 years -.16543 .21703 .727 -.6831 .3523 11 years and above .40514 .26322 .279 -.2254 1.0357
11 years and above
1 to 5 years -.57057 .26297 .084 -1.2004 .0593 6 to 10 years -.40514 .26322 .279 -1.0357 .2254
Suppliers Tukey HSD
1 to 5 years 6 to 10 years .05253 .27484 .980 -.5994 .7045 11 years and above .34678 .28560 .447 -.3307 1.0243
6 to 10 years 1 to 5 years -.05253 .27484 .980 -.7045 .5994 11 years and above .29426 .28708 .563 -.3868 .9753
11 years and above
1 to 5 years -.34678 .28560 .447 -1.0243 .3307 6 to 10 years -.29426 .28708 .563 -.9753 .3868
Games-Howell
1 to 5 years 6 to 10 years .05253 .24119 .974 -.5236 .6287 11 years and above .34678 .29782 .479 -.3697 1.0633
6 to 10 years 1 to 5 years -.05253 .24119 .974 -.6287 .5236 11 years and above .29426 .32684 .642 -.4882 1.0767
11 years and above
1 to 5 years -.34678 .29782 .479 -1.0633 .3697 6 to 10 years -.29426 .32684 .642 -1.0767 .4882

214
(Continued) Communities Tukey
HSD 1 to 5 years 6 to 10 years .09091 .25436 .932 -.5126 .6944
11 years and above .71651* .26421 .021 .0897 1.3433 6 to 10 years 1 to 5 years -.09091 .25436 .932 -.6944 .5126
11 years and above .62560 .26421 .051 -.0012 1.2524 11 years and above
1 to 5 years -.71651* .26421 .021 -1.3433 -.0897 6 to 10 years -.62560 .26421 .051 -1.2524 .0012
Games-Howell
1 to 5 years 6 to 10 years .09091 .23027 .918 -.4583 .6401 11 years and above .71651* .28322 .036 .0381 1.3949
6 to 10 years 1 to 5 years -.09091 .23027 .918 -.6401 .4583 11 years and above .62560 .28135 .074 -.0485 1.2997
11 years and above
1 to 5 years -.71651* .28322 .036 -1.3949 -.0381 6 to 10 years -.62560 .28135 .074 -1.2997 .0485
Environment Tukey HSD
1 to 5 years 6 to 10 years -.09091 .29234 .948 -.7845 .6026 11 years and above .98565* .30366 .004 .2652 1.7061
6 to 10 years 1 to 5 years .09091 .29234 .948 -.6026 .7845 11 years and above 1.07656* .30366 .002 .3561 1.7970
11 years and above
1 to 5 years -.98565* .30366 .004 -1.7061 -.2652 6 to 10 years -1.07656* .30366 .002 -1.7970 -.3561
Games-Howell
1 to 5 years 6 to 10 years -.09091 .24566 .927 -.6770 .4952 11 years and above .98565* .34269 .015 .1635 1.8078
6 to 10 years 1 to 5 years .09091 .24566 .927 -.4952 .6770 11 years and above 1.07656* .33084 .005 .2811 1.8720
11 years and above
1 to 5 years -.98565* .34269 .015 -1.8078 -.1635 6 to 10 years -1.07656* .33084 .005 -1.8720 -.2811
Government Tukey HSD
1 to 5 years 6 to 10 years .13636 .31689 .903 -.6154 .8882 11 years and above .97847* .32916 .010 .1976 1.7594
6 to 10 years 1 to 5 years -.13636 .31689 .903 -.8882 .6154 11 years and above .84211* .32916 .031 .0612 1.6230
11 years and above
1 to 5 years -.97847* .32916 .010 -1.7594 -.1976 6 to 10 years -.84211* .32916 .031 -1.6230 -.0612
Games-Howell
1 to 5 years 6 to 10 years .13636 .26332 .863 -.4919 .7646 11 years and above .97847* .36008 .023 .1123 1.8446
6 to 10 years 1 to 5 years -.13636 .26332 .863 -.7646 .4919 11 years and above .84211 .37364 .070 -.0546 1.7388
11 years and above
1 to 5 years -.97847* .36008 .023 -1.8446 -.1123 6 to 10 years -.84211 .37364 .070 -1.7388 .0546
Non-Governmental Organizations (NGOs)
Tukey HSD
1 to 5 years 6 to 10 years .33562 .30048 .505 -.3773 1.0486 11 years and above 1.17344* .31032 .001 .4372 1.9097
6 to 10 years 1 to 5 years -.33562 .30048 .505 -1.0486 .3773 11 years and above .83782* .31198 .022 .0976 1.5781
11 years and above
1 to 5 years -1.17344* .31032 .001 -1.9097 -.4372 6 to 10 years -.83782* .31198 .022 -1.5781 -.0976
Games-Howell
1 to 5 years 6 to 10 years .33562 .26846 .428 -.3056 .9768 11 years and above 1.17344* .32095 .002 .4025 1.9444
6 to 10 years 1 to 5 years -.33562 .26846 .428 -.9768 .3056 11 years and above .83782* .34840 .049 .0040 1.6717
11 years and above
1 to 5 years -1.17344* .32095 .002 -1.9444 -.4025 6 to 10 years -.83782* .34840 .049 -1.6717 -.0040
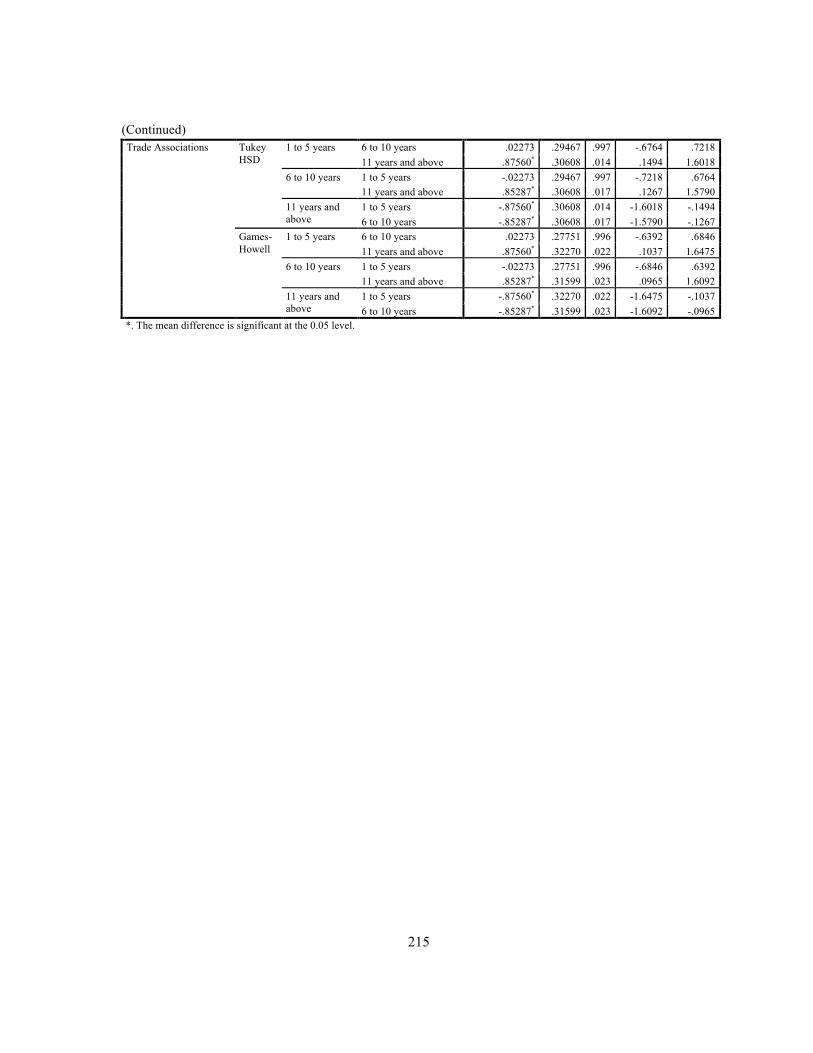
215
(Continued) Trade Associations Tukey
HSD 1 to 5 years 6 to 10 years .02273 .29467 .997 -.6764 .7218
11 years and above .87560* .30608 .014 .1494 1.6018 6 to 10 years 1 to 5 years -.02273 .29467 .997 -.7218 .6764
11 years and above .85287* .30608 .017 .1267 1.5790 11 years and above
1 to 5 years -.87560* .30608 .014 -1.6018 -.1494 6 to 10 years -.85287* .30608 .017 -1.5790 -.1267
Games-Howell
1 to 5 years 6 to 10 years .02273 .27751 .996 -.6392 .6846 11 years and above .87560* .32270 .022 .1037 1.6475
6 to 10 years 1 to 5 years -.02273 .27751 .996 -.6846 .6392 11 years and above .85287* .31599 .023 .0965 1.6092
11 years and above
1 to 5 years -.87560* .32270 .022 -1.6475 -.1037 6 to 10 years -.85287* .31599 .023 -1.6092 -.0965
*. The mean difference is significant at the 0.05 level.
216
References
Aguinis, H., and Glavas, A., 2012, What we know and don’t know about corporate social
responsibility: A review and research agenda, Journal of Management, 38(4), 932-968.
Alesina, A., and Dollar, D., 2000, Who gives foreign aid to whom and why? Journal of Economic
Growth, 5(1), 33-63.
Amaeshi, K., Nnodim, P., and Onyeka, O., 2013, Corporate social responsibility, entrepreneurship,
and innovation, New York: Routledge.
Anderson, J. C., and Frankle, A. W., 1980, Voluntary social reporting: An iso-beta portfolio analysis,
Accounting Review, 55(3), 467-479.
Argandona, A., 2011, Stakeholder theory and value creation, IESE Business School Working Paper
No. 922.
Ashley, C., 2009, Harnessing core business for development impact (United Kingdom: The Overseas
Development Institute), Retrieved on January 28, 2013 from
http://dspace.cigilibrary.org/jspui/bitstream/123456789/24106/1/Harnessing%20core%20business
%20for%20development%20impact.pdf?1
Aupperle, K. E., Carroll, A. B., and Hatfield, J. D., 1985, An empirical examination of the
relationship between corporate social responsibility and profitability, Academy of management
Journal, 28(2), 446-463.
Auzair, S. M., and Langfield-Smith, K., 2005, The effect of service process type, business strategy
and life cycle stage on bureaucratic MCS in service organizations, Management Accounting
Research, 16(4), 399-421.
Babbie, E., 1990, Survey research methods, 2nd Ed, Belmont, CA: Wadsworth / Thomson.
Baldauf, A., Cron, W. L., and Grossenbacher, S., 2010, The convergent validity of structural
measures of differentiation derived from repertory grids, Journal of Constructivist Psychology,
23(4), 321-336.
Bannister, D., and Fransella, F., 1986, Inquiring man: The psychology of personal constructs, 3rd
Edition, Croom Helm Ltd.
217
Bansal, P., and Roth, K., 2000, Why companies go green: A model of ecological responsiveness,
Academy of Management Journal, 43(4), 717-736.
Berman, S. L., Wicks, A. C., Kotha, S., and Jones, T. M., 1999, Does stakeholder orientation matter?
The relationship between stakeholder management models and firm financial performance,
Academy of Management Journal, 42(5), 488-506.
Bjorklund, L., 2008, The repertory grid technique – Making tacit knowledge explicit: Assessing
creative work and problem solving skills, H. Middleton (Ed.), Researching Technology Education:
Methods and Techniques, Netherlands: Sense Publishers.
Bonn, I., and Pettigrew, A., 2009, Towards a dynamic theory of boards: An organizational life cycle
approach, Journal of Management and Organization, 15(1), 2-16.
Boone, P., 1996, Politics and the effectiveness of foreign aid, European Economic Review, 40(2)
289-329.
Booth, W. C., Colomb, G. G., and Williams, J. M., 2003, The craft of research, University of Chicago
Press.
Bosse, D. A., Phillips, R. A., and Harrison, J. S., 2009, Stakeholders, reciprocity, and firm
performance, Strategic Management Journal, 30(4) 447-456.
Botterill, T. D., and Crompton, J. L., 1996, Two case studies exploring the nature of the tourist’s
experience, Journal of Leisure Research, 28(1), 57-82.
Bowen, H. R., 1953, Social responsibilities of the businessman, New York: Harper and Row.
Brammer, S. J., and Pavelin, S., 2006, Corporate reputation and social performance: The importance
of fit, Journal of Management Studies, 43(3), 435-455.
Brandon, D. M., Long, J. H., Loraas, T. M., Mueller-Phillips, J., & Vansant, B., 2013, Online
instrument delivery and participant recruitment services: Emerging opportunities for behavioral
accounting research, Behavioral Research in Accounting, 26(1), 1-23.
Brenneke, M., and Spitzeck, H., 2009, Social Intrapreneurship, 22nd EBEN Annual Conference, 10-
12.
Bromiley, P., and Marcus, A., 1989, The deterrent to dubious corporate behavior: Profitability,
probability and safety recalls, Strategic management journal, 10(3), 233-250.
218
Brugmann, J., and Prahalad, C. K., 2007, Co-creating business's new social compact, Harvard
Business Review, 85(2), 80-90.
Bryant, S. M., J. E. Hunton, and D. N. Stone, 2004, Internet-based experiments: Prospects and
possibilities for behavioral accounting research, Behavioral Research in Accounting, 16: 107–129.
Buchanan, E. A., and E. E. Hvizdak., 2009, Online survey tools: Ethical and methodological concerns
of human research ethics committees, Journal of Empirical Research on Human Research Ethics:
An International Journal, 4(2): 37–48.
Campbell, D. T., Stanley, J. C., and Gage, N. L., 1963, Experimental and quasi-experimental designs
for research, Boston: Houghton Mifflin.
Caputi, P., Viney, L. L., Walker, B. M., and Crittenden, N. (Eds.), 2011, Personal construct
methodology, John Wiley and Sons.
Carayannis, E. G., and Von Zedtwitz, M., 2005, Architecting gloCal (global–local), real-virtual
incubator networks (G-RVINs) as catalysts and accelerators of entrepreneurship in transitioning
and developing economies: Lessons learned and best practices from current development and
business incubation practices, Technovation, 25(2), 95-110.
Carroll, A. B., 1979, A three-dimensional conceptual model of corporate performance, Academy of
Management Review, 4(4), 497-505.
Carroll, A. B., 1999, Corporate social responsibility evolution of a definitional construct, Business
and Society, 38(3), 268-295.
Carroll, A. B., Lipartito, K. J., Post, J. E. and Werhane, P. H., 2012, Corporate responsibility: The
American experience, Cambridge University Press.
Chatman, J. A. and Flynn, F. J., 2005, Full-cycle micro-organizational behavior research,
Organization Science (INFORMS), 16(4), 434–447.
Churchill Jr., G.A. (1979), A paradigm for developing better measures of marketing constructs,
Journal of Marketing Research, 16(1), 64-73.
Cochran, P. L., and Wood, R. A., 1984, Corporate social responsibility and financial performance,
Academy of management Journal, 27(1), 42-56.
219
Cohen, J., Ding, Y., Lesage C., and Stolowy, H., 2012, Corporate fraud and managers behavior:
Evidence from the press, Journal of Business Ethics, 95(2), 271-315.
Cook, T. D., and Campbell, D. T., 1979, Quasi-experimental experimentation: Designs and analysis
for field settings, Boston: Houghton Mifflin.
Crane, A., Palazzo, G., Spence, L. J., and Matten, D., 2014, Contesting the value of “creating shared
value”, California management review, 56(2), 130-153.
Creswell, J. W., 2009, Research design, Thousand Oaks, California: SAGE Publications, Inc.
Cummins, P., 2006 (Ed.), Working with Anger, Chichester, UK: John Wiley and Sons.
Dahlsrud, A., 2008, How corporate social responsibility is defined: an analysis of 37 definitions.
Corporate Social Responsibility and Environmental Management, 15(1), 1-13.
Dalgaard, C., Hansen, H. and Tarp, F., 2004, On the empirics of foreign aid and growth, The
Economic Journal, 114(496), 191-216.
Davidson, W. N., and Worrel, D. L., 1988, The impact of announcements of corporate illegalities on
shareholder returns. Academy of management journal, 31(1), 195-200.
Davila, T., 2005, An exploratory study on the emergence of management control systems:
formalizing human resources in small growing firms, Accounting, Organizations and Society,
30(3), 223-248.
Davis, K., 1960, Can business afford to ignore social responsibilities? California Management
Review, 2(3), 70-76.
Day, Adam M.B., 2013, Constructing natural restorative environments in individuals treated for
cancer. University of Western Ontario – Electronic Thesis and Dissertation Repository, Paper
1680.
Dees, J. G., 1998, The meaning of social entrepreneurship. Comments and suggestions contributed
from the Social Entrepreneurship Funders Working Group, Durham, NC: Center for the
Advancement of Social Entrepreneurship, Fuqua School of Business, Duke University.
DeVellis, R. F., 2012, Scale development: Theory and applications, Second Edition: Vol. 26, Sage
publications.
220
Diaz De Leon, E., and Guild, P.D., 2003, Using repertory grid to identify intangibles in business
plans, Venture Capital: An International Journal of Entrepreneurial Finance, 5(2), 135-160.
Dickinson, V., 2011, Cash flow patterns as a proxy for firm life cycle, The Accounting Review,
86(6), 1969-1994.
Dobosz, D., 2003, The repertory grid interview and laddering as complementary instruments for
organizational culture analysis based on the ethnographic approach, Psychological Constructivism
and the Social World, 209-287.
Dodge, H. R., Fullerton, S., and Robbins, J. E., 1994, Stage of the organizational life cycle and
competition as mediators of problem perception for small businesses, Strategic Management
Journal, 15(2), 121-134.
Donaldson, T., and Preston, L. E., 1995, The stakeholder theory of the corporation: Concepts,
evidence, and implications, Academy of Management Review, 20(1), 65-91.
Drucker, P. F., 1985, Innovation and entrepreneurship, New York: Harper & Row.
Drucker, P. F., 1994, Post-capitalist society, New York: Harper Collins.
Easterby-Smith, M., 1980, How to use repertory grids in HRD, Journal of European Industrial
Training, 4(2), 2-32.
Easterby-Smith, M., Thorpe, R., and Holman, D., 1996, Using repertory grids in management,
Journal of European Industrial Training, 20(3), 3-30.
Easterly, L., and Miesing, P., 2007, Social venture business strategies for reducing poverty, in Stoner,
J. and Wankel, C. (Editors), Innovative Approaches to Reducing Global Poverty, Charlotte:
Information Age Publishing, Chapter 1, 3-26.
Eden, C., and Jones, S., 1984, Using repertory grids for problem construction, Journal of The
Operational Research Society, 35(9), 779-790.
Edwards, H. M., McDonald, S., and Michelle Young, S., 2009, The repertory grid technique: Its place
in empirical software engineering research, Information and Software Technology, 51(4), 785-
798.
Eisinga, R., Te Grotenhuis, M., and Pelzer, B., 2013, The reliability of a two-item scale: Pearson,
Cronbach, or Spearman-Brown?, International Journal of Public Health, 58(4), 637-642.

221
Elo, S., and Kyngas, H., 2007, The qualitative content analysis process, Journal of advanced nursing,
62(1), 107-115.
Elsayed, K. and Paton, D., 2009, The impact of financial performance on environmental policy: Does
firm life cycle matter? Business Strategy and the Environment, 18(6), 397-413.
Emons, W.H.M., Sijtsma, K., and Meijer R.R., 2007, On the consistency of individual classification
using short scales, Psychological Methods, 12(1),105-120.
European Commission, Communication from the Commission to the European Parliament, the
Council, the European Economic and Social Committee and the Committee of the Regions: A
Renewed EU Strategy 2011-14 for Corporate Social Responsibility; COM (2011) 681 final;
Brussels.
Evans, J. R., and Mathur, A., 2005, The value of online surveys, Internet Research, 15(2), 195-219.
Fransella, F., Bell, R., and Bannister, D., 2004, A manual for repertory grid technique, John Wiley
and Sons.
Freeman, E., & Moutchnik, A., 2013, Stakeholder management and CSR: questions and answers,
21(1), 5-9.
Freeman, E., and Liedtka, J., 1997, Stakeholder capitalism and the value chain, European
Management Journal, 15(3), 286-296.
Freeman, R. E., 1984, Strategic management: A stakeholder approach, Massachusetts: Pitman.
Freeman, R. E., 1994, The politics of stakeholder theory: Some future directions, Business Ethics
Quarterly, 4(4), 409-421.
Freeman, R. E., 1999, Divergent stakeholder theory, Academy of Management Review, 24(2), 233-
236.
Freeman, R. E., Harrison, J. S., and Wicks, A. C., 2007, Managing for stakeholders: Survival,
reputation, and success, Yale University Press.
Freeman, R. E., Parmar, B. L., Harrison, J. S., Wicks, A. C., Purnell, L., and De Colle, S., 2010,
Stakeholder theory: The state of the art, Cambridge University Press.
Freeman, R. E., Wicks, A. C. and Parmar, B., 2004, Stakeholder theory and the corporate objective
revisited, Organization Science, 15(3), 364-369.

222
Friedman, M., 1970, The social responsibility of business is to increase its profits, New York: The
New York Times Company.
Gaines, B. R., and Shaw, M. L., 2003, Personal construct psychology and the cognitive revolution,
University of Calgary: Knowledge Science Institute, Retrieved on October 20, 2013 from
http://pages.cpsc.ucalgary.ca/~gaines/reports/PSYCH/SIM/
Gaines, B. R., and Shaw, M. L., 2010, Rep 5 conceptual representation software: RepGrid/RepSocio
manuals for Version 1.0., Centre for Person-Computer Studies.
Garson, D.G., 2009, Reliability analysis, North Carolina State University, Retrieved on August 5,
2015 from
http://tx.liberal.ntu.edu.tw/~purplewoo/Literature/!DataAnalysis/Reliability%20Analysis.htm
Ghosh, D., and Vogt, A., 2012, Outliers: An Evaluation of Methodologies, Proceeds of the Joint
Statistical Meetings, 3455 - 3460.
Gliem, J. A., and Gliem, R. R., 2003, Calculating, interpreting, and reporting Cronbach’s alpha
reliability coefficient for Likert-type scales, Midwest Research-to-Practice Conference in Adult,
Continuing, and Community Education.
Gomez-Mejia, L., and Wiseman, R. M., 1997, Reframing executive compensation: An assessment
and outlook, Journal of Management, 23(3), 291-374.
Grayson, D., and Nelson, J., 2013, Corporate responsibility coalitions: The past, present, and future of
alliances for sustainable capitalism (Palo Alto: Stanford Business Press).
Greiner, L. E., 1972, Evolution and revolution as organizations grow, Harvard Business Review,
(Jul/Aug), 37-46.
Griffin, J. J., and Mahon, J. F., 1997, The corporate social performance and corporate financial
performance debate twenty-five years of incomparable research, Business & Society, 36(1), 5-31.
Guild, P. D., and Bachher, J. S., 1996, Equity investment decisions for technology based ventures,
International Journal of Technology Management, 12(7-8), 787-795.
Hamblin, J., 2015, A brewing problem, Retrieved on August 24, 2015 from
http://www.theatlantic.com/technology/archive/2015/03/the-abominable-k-cup-coffee-pod-
environment-problem/386501/

223
Hanks, S. H., Watson, C. J., Jansen, E. and Chandler, G. N., 1993, Tightening the life-cycle construct:
A taxonomic study of growth stage configurations in high-technology organizations,
Entrepreneurship Theory and Practice, 18(2), 5-29.
Haque, U., 2009, The value every business needs to create now, Harvard Business Review, Business
Management Ideas-Harvard Business Review Blogs, Retrieved on August 15, 2013 from
http://blogs.hbr.org/haque/2009/07/the_value_every_business_needs.html.
Harrison, J. S., and Wicks, A. C., 2013, Stakeholder theory, value, and firm performance, Business
ethics quarterly, 23(1) 97-124.
Hasnas, J., 2013, Whither stakeholder theory? A guide for the perplexed revisited, Journal of
Business Ethics, 112(1), 47-57.
Hawkins, D. M., 1980, Identification of outliers, Chapman and Hall, London.
Henderson, D., 2001, Misguided virtue, false notions of corporate social responsibility, New Zealand:
Wellington.
Herbert, W., Marsh, H.W., Hau, K.T., Balla, J.R., Grayson, D., 1998, Is more ever too much? The
number of indicators per factor in confirmatory factor analysis, Multivariate Behavioral Research,
3(2), 181-220.
Hillman, A. J., and Keim, G. D., 2001, Shareholder value, stakeholder management, and social issues:
What's the bottom line? Strategic Management Journal, 22(2), 125-139.
Hisrich, R. D., and Jankowicz, A. D., 1990, Intuition in venture capital decisions: An exploratory
study using a new technique, Journal of Business Venturing, 5(1), 49-62.
Hopkins, M., 1999, The planetary bargain: corporate social responsibility comes of age, New York:
Macmillan.
Howell, D., 2012, Statistical methods for psychology, 8th Edition, Wadsworth Cengage Learning.
Hunter, M. G., and Beck, J. E., 2000, Using repertory grids to conduct cross-cultural information
systems research, Information Systems Research, 11(1), 93-101.
Ilieva, J., Baron, S., Healey, and N. M., 2002, Online surveys in marketing research: Pros and cons,
International Journal of Market Research, 44(3), 361-379.
Jankowicz, D., 2004, The easy guide to repertory grids, Chichester, UK: John Wiley and Sons.

224
Jawahar, I. M., and McLaughlin, G. L., 2001, Toward a descriptive stakeholder theory: An
organizational life cycle approach, The Academy of Management Review, 26(3), 397-414.
Jenkins, R., 2005, Globalization, corporate social responsibility and poverty, International Affairs,
81(3), 525-540.
Johnson, H. L., 1971, Business in contemporary society: Framework and issues, Belmont: Wadsworth
Publishing Company.
Johnson, R. A., and Greening, D. W., 1994, Relationship between corporate social performance,
financial performance, and firm governance, Academy of Management Proceedings, Academy of
Management, (August 1994), 314-318.
Johnson, R. A., and Greening, D. W., 1999, The effects of corporate governance and institutional
ownership types on corporate social performance, Academy of Management Journal, 42(5), 564-
576.
Jones, T. M., 1995, Instrumental stakeholder theory: A synthesis of ethics and economics, Academy
of Management Review, 20(2), 404-437.
Jones, T. M., and Wicks, A. C., 1999, Convergent stakeholder theory, Academy of Management
Review, 24(2), 206-221.
Kallunki, J. P., and Silvola, H., 2008, The effect of organizational life cycle stage on the use of
activity-based costing, Management Accounting Research, 19(1), 62-79.
Kanter, R. M., 1999, From spare change to real change, Harvard Business Review, 77(3), 123-132.
Kavanaugh, M., Bessett, D., Littman, L., and Norris, A., 2013, Connecting knowledge about abortion
and sexual and reproductive health to belief about abortion restrictions: Findings from an online
survey, Women’s Health Issues, 23(4), 239–247.
Kazanjian, R. K., and Drazin, R., 1989, An empirical test of a stage of growth progression model,
Management Science, 35(12), 1489-1503.
Kelly, G. A., 1955, The Psychology of personal constructs, New York: Norton.
Kotchen, M. J., and Moon, J. J., 2011, Corporate social responsibility for irresponsibility, The
National Bureau of Economic Research, Working Paper No. w17254.
Krosnick, J. A., 1999, Survey research, Annual Review of Psychology, 50(1), 537-567.
225
Lester, D. L., Parnell, J. A., and Carraher, S., 2003, Organizational life cycle: A five-stage empirical
scale, International Journal of Organizational Analysis, 11(4), 339-354.
Leth, M., and Hems, L., 2013, The potential for creating shared value in Australia: How Australian
companies co-create long-term commercial and social value, Draft insights for a Green Paper in
progress, presented at the Creating Shared Value Forum, Melbourne.
Levall, S., and Prejer, B., 2013, Inclusive business and shared values: Case study of Stora Enso in
Lao PDR, Department of Economics at Swedish University of Agricultural Sciences, Retrieved on
September, 2013 from http://stud.epsilon.slu.se/5818/1/Levall_et_al_130704.pdf
Lewis, V. L. and Churchill, N. C., 1983, The five stages of small business growth, Harvard Business
Review, 61(3), 30-50.
Liao, C. N., 2008, Incentive reward control: Based on the competitive advantage, transaction cost
economics and organizational life cycle viewpoint, Human Systems Management, 27(2), 123-130.
Little, T.D., Lindenberger ,U., and Nesselroade, J.R., 1999, On selecting indicators for multivariate
measurement and modeling with latent variables: when ‘good’ indicators are bad and ‘bad’
indicators are good, Psychological Methods, 4(2),192-211.
Lix, L. M., Keselman, J. C., and Keselman, H. J., 1996, Consequences of assumption violations
revisited: A quantitative review of alternatives to the one-way analysis of variance F test, Review
of Educational Research, 66, 579-619.
Maignan, I., Ferrell, O. C. and Hult, G. T. M., 1999, Corporate citizenship: Cultural antecedents and
business benefits, Journal of the Academy of Marketing Science, 27(4), 455-469.
Mair, J., and Marti, I., 2006, Social entrepreneurship research: A source of explanation, prediction,
and delight, Journal of World Business, 41(1), 36-44.
McGuire, J. W., 1963, Business and society, New York: McGraw-Hill.
Merriam, S. B., 1988, Case study research in education, San Francisco: Jossey.
Michelini, L., 2012, Social innovation and new business models: Creating shared value in low-
income markets, Berlin Heidelberg: Springer.
Michelini, L., and Fiorentino, D., 2012, New business models for creating shared value, Social
Responsibility Journal, 8(4), 561-577.

226
Miller, D. and Friesen, P. H., 1984, A longitudinal study of the corporate life cycle, Management
Science, 30(10), 1161-1183.
Milliman, J., Von Glinow, M. A., and Nathan, M., 1991, Organizational life cycles and strategic
international human resource management in multinational companies: Implications for
congruence theory, Academy of Management Review, 16(2), 318-339.
Mitchell, R., Agle, B. R., and Wood, D. J., 1997, Toward a theory of stakeholder identification and
salience: Defining the principles of who and what really counts, Academy of Management
Review, 22(4), 853-886.
Moores, K., and Yuen, S., 2001, Management accounting systems and organizational configuration:
A life-cycle perspective, Accounting, Organizations and Society, 26(4), 351-389.
Moyo, D., 2009, Dead aid: Why aid is not working and how there is a better way for Africa, New
York: Farrar, Straus and Giroux.
Naoi, T., Airey, D., Iijima, S., and Niininen, O., 2006, Visitors’ evaluation of an historical district:
Repertory grid analysis and laddering analysis with photographs. Tourism Management, 27(3),
420-436.
Neimeyer, R.A., 2009, Constructivist Psychotherapy, London: Routledge.
Neubaum, D. O., and Zahra, S. A., 2006, Institutional ownership and corporate social performance:
The moderating effects of investment horizon, activism, and coordination, Journal of
Management, 32(1), 108-131.
Noriega, J. V., 2013, Toward an understanding of “Weak Signals” of technological change and
innovation in the internet industry, Doctoral dissertation, University of Waterloo, Retrieved on
October 11, 2013 from https://uwspace.uwaterloo.ca/handle/10012/7674
Norman, G., 2010, Likert scales, levels of measurement and the “laws” of statistics, Advances in
health sciences education, 15(5), 625-632.
Nunnally, J. C., and Bernstein, I. H., 1994, Psychometric Theory, New York: McGraw-Hill, Inc.
Nunnally, J.C., Jr., 1978, Introduction to psychological measurement, McGraw-Hill, New York.
Orlitzky, M., Schmidt, F. L., and Rynes, S. L., 2003, Corporate social and financial performance: A
meta-analysis, Organization Studies, 24(3), 403-441.
227
Papanek, G. F., 1973, Aid, foreign private investment, savings, and growth in less developed
countries, Journal of Political Economy, 81(1), 120-130.
Phillips, R., Freeman, R. E., and Wicks, A. C., 2003, What stakeholder theory is not, Business Ethics
Quarterly, 13(4), 479-502.
Ponterotto, J.G., and Ruckdeschel, D., 2007, An overview of coefficient alpha and a reliability matrix
for estimating adequacy of internal consistency coefficients with psychological research measures,
Perceptual and Motor Skills, 105, 997-1014.
Porter, M. E., and Kramer, M. R., 2006, The link between competitive advantage and corporate social
responsibility, Harvard Business Review, 84(12), 78-92.
Porter, M. E., and Kramer, M. R., 2011, Creating shared value, Harvard Business Review, 89(1/2),
62-77.
Porter, M. E., and Van der Linde, C., 1995, Toward a new conception of the environment-
competitiveness relationship, The journal of economic perspectives, 9(4), 97-118.
Prahalad, C. K., 2010, The fortune at the bottom of the pyramid: Eradicating poverty through profits,
New Jersey: Wharton School Publishing.
Prahalad, C. K., and Hammond, A., 2002, Serving the world's poor, profitably, Harvard Business
Review, 80(9), 48-59.
Prahalad, C. K., and Hart, S. L., 2002, The fortune at the bottom of the pyramid, Strategy and
Business, 26(1), 55-67.
Quinn, R. E., and Rohrbaugh, J., 1983, A spatial model of effectiveness criteria: Towards a
competing values approach to organizational analysis, Management Science, 29(3), 363-377.
Raja, J. Z., Bourne, D., Goffin, K., Çakkol, M., & Martinez, V., 2013, Achieving customer
satisfaction through integrated products and services: An exploratory study, Journal of Product
Innovation Management, 30(6), 1128-1144.
Randolph, W. A., and Posner, B. Z., 1982, The effects of an intergroup development OD intervention
as conditioned by the life cycle state of organizations: A laboratory experiment, Group and
Organization Management, 7(3), 335-352.
228
Rosling, H., 2009, Let my dataset change your mindset, In TED @ US State Department, Retrieved
on June 3, 2013 from http://www.ted.com/talks/hans_rosling_at_state.html
Scheer, J. W., and Sewell, K. W, 2006, Creative construing: Personal constructions in the
Arts, Giessen: Psychosocial-Verlag.
Schumpeter, J. A., 1939, Business cycles, Volume 1, New York: McGraw-Hill.
Schumpeter, J. A., 1994, Capitalism, socialism and democracy, Originally Published in 1942:
Routledge, 81-85.
Schwartz, B., 2012, Rippling: How social entrepreneurs spread innovation throughout the world, San
Francisco: Jossey-Bass.
Sen, S., and Bhattacharya, C. B., 2001, Does doing good always lead to doing better? Consumer
reactions to corporate social responsibility, Journal of Marketing Research, 38(2), 225-243.
Shadish, W. R., Cook, T. D., and Campbell, D. T., 2002, Experimental and quasi-experimental
designs for generalized causal inferences, Boston: Houghton Mifflin.
Shah, M. U., 2011, Toward a value proposition of “Digital Opportunity Trust”, Master’s Thesis:
University of Waterloo, Ontario, Canada.
Sharma, S., 2000, Managerial interpretations and organizational context as predictors of corporate
choice of environmental strategy, Academy of Management Journal, 43(4), 681-697.
Shaw, M. L., 1980, On becoming a personal scientist: Interactive computer elicitation of personal
models of the world, London: Academic Press.
Shaw, M. L., and Gaines, B. R., 1982, Tracking the creativity cycle with a microcomputer.
International Journal of Man-Machine Studies, 17(1), 75-85.
Sheehan, Kim B., 2006, E-mail survey response rates: A review, Journal of Computer-Mediated-
Communication, 6(2).
Singleton Jr, R. A., Straits, B. C., and Straits, M. M., 1993, Approaches to social research, Oxford
University Press.
Smith, K. G., Mitchell, T. R., and Summer, C. E., 1985, Top level management priorities in different
stages of the organizational life cycle, Academy of Management Journal, 28(4), 799-820.
229
Smith, M., and Stewart, B. J. M., 1977, Repertory grids: A flexible tool for establishing the content
and structure of a manager's thoughts, Management Bibliographies and Reviews, 3, 209-230.
Social Value Act review: Lord Young’s report, 2015, Retrieved on September 8, 2015 from
https://www.gov.uk/government/uploads/system/uploads/attachment_data/file/403748/Social_Val
ue_Act_review_report_150212.pdf
Stewart, V., Stewart, A., and Fonda, N., 1981, Business applications of repertory grid, London:
McGraw-Hill.
Strand, R., and Freeman, R. E., 2013, Scandinavian cooperative advantage: the theory and practice of
stakeholder engagement in Scandinavia, Journal of Business Ethics, 127(1), 1-21.
Sue, V. M., and Ritter, L. A., 2012, Conducting online surveys, Thousand Oaks, CA: Sage.
Tan, F.V., and Hunter, M. G., 2002, The repertory grid technique: A method for the study of
cognition in information systems, MIS Quarterly, 26(1), 39-57.
Tantalo, C., 2011, Competing for stakeholders: three essays on business sustainability, Doctoral
dissertation, LUISS Guido Carli University, Retrieved on February 18, 2014 from
http://eprints.luiss.it/990/
Tapscott, D. and Williams, A. D., 2010, Macrowikinomics: rebooting business and the world,
Toronto: Penguin Group.
Waddock, S. A., and Graves, S. B., 1997, The corporate social performance-financial performance
link, Strategic Management Journal, 18(4), 303-319.
Wang, G., and Singh, P., 2014, The evolution of CEO compensation over the organizational life
cycle: A contingency explanation, Human Resource Management Review, 24(2), 144-159.
Wheeler, D., Colbert, B., and Freeman, R. E., 2003, Focusing on value: reconciling corporate social
responsibility, sustainability and a stakeholder approach in a network world, Journal of General
Management, 28(3), 1-28.
Wilcox, R., 2012, Modern statistics for the social and behavioral sciences: A practical introduction,
Boca Raton, FL: CRC Press.
Winter, D., 1992, Personal construct psychology in clinical practice, London: Routledge.
230
World Business Council for Sustainable Development (WBCSD) and SNV Netherlands Development
Organization, 2008, Inclusive Business – profitable business for sustainable development,
Retrieved on May 17, 2013 from http://www.snvworld.org/fr/publications/inclusive-business-
profitable-business-for-sustainable-development
World Business Council for Sustainable Development (WBCSD), 2000, Corporate social
responsibility: making good business sense, Retrieved on May 17, 2013 from
http://www.wbcsd.org/web/publications/csr2000.pdf
Yeung, K. W., and Watkins, D., 2000, Hong Kong student teachers' personal construction of teaching
efficacy, Educational Psychology, 20(2), 213-235.
Yunus, M., 2011, Building social business: The new kind of capitalism that serves humanity's most
pressing needs, New York: PublicAffairs.