Embed Size (px)
Citation preview

EXPLORING INTRINSIC BIOMARKERS FOR OPTICAL ASSESSMENT OF
OUTER RETINA
by
RONGWEN LU
XINCHENG YAO, COMMITTEE CHAIR
FRANKLIN R. AMTHOR
CHRISTINE A. CURCIO
ALLAN C. DOBBINS
LEI LIU
ANDREW E. POLLARD
A DISSERTATION
Submitted to the graduate faculty of The University of Alabama at Birmingham,
in partial fulfillment of the requirements for the degree of
Doctor of Philosophy
BIRMINGHAM, ALABAMA
2014

Copyright by
Rongwen Lu
2014
iii
EXPLORING INTRINSIC BIOMARKERS FOR OPTICAL ASSESSMENT OF
OUTER RETINA
Rongwen Lu
BIOMEDICAL ENGINEERING
ABSTRACT
The retina suffers pathological changes after attacked by eye diseases. The
objective of my PhD dissertation is to explore intrinsic biomarkers for noninvasive
assessment of retinal morphological structure and physiological function. Fundus
autofluorescence (FAF), optical coherence tomography (OCT), etc. have provided
indispensable information for eye disease detection. However, better understanding of the
intrinsic biomarkers in FAF and OCT is desirable for quantitative interpretation of
clinical outcomes.
The first specific aim of the dissertation research was to characterize FAF signals
across the whole retinal depth using two-photon excitation. FAF signals are usually
attributable to fluorophores from the choroidal vessel and the retinal pigment epithelium.
However, whether other retinal layers contribute to FAF is still unknown. Results from
my study showed that FAF signals existed throughout all retinal layers. The second
specific aim was to investigate the anatomic correlates to the presumed ‘inner
segment/outer segment’ (‘IS/OS’) OCT band. This was accomplished by comparing
histological images with OCT images acquired by a custom-designed line-scan OCT with
high spatial resolution. Although OCT has been widely used in clinical diagnosis,
anatomic sources of the OCT bands at the outer retina, particularly the presumed ‘IS/OS’
photoreceptor OCT band, are still controversial. Our experimental result supported

iv
conjecture that the presumed ‘IS/OS’ OCT band actually was originated from the IS. The
third aim was to characterize a functional biomarker, stimulus-evoked transient
phototropism of photoreceptors which was dominant in rods. Functional impairments
may precede detectable structural abnormalities. Therefore, functional biomarkers
promise early detection of eye diseases. This rod-dominant transient phototropic
adaptation provides a specific functional biomarker to evaluate the functional integrity of
rod photoreceptors. The last specific aim was to develop an easy, low-cost and phase-
artifact free super-resolution method, termed virtually structured detection (VSD), to
double the resolution of a confocal point/line scanning system. High resolution imaging
is important for reliable identification of structural and functional biomarkers. However,
the transverse resolution of conventional imaging systems is fundamentally limited by
light diffraction.
This dissertation research could not only generate in-depth understanding of
intrinsic biomarkers of outer retina but also provide insights into the optimal design of
imaging instruments for improved structural and functional assessment of the retina.
Keywords: optical coherence tomography, transient phototropism, photoreceptor, fundus
autofluorescence, virtually structured detection

v
DEDICATION
I would like to dedicate this thesis to my parents who trust me and encourage me
to pursuit my dreams. Also, I would like to dedicate this thesis to my beloved wife,
Qiuxiang Zhang, and to my lovely daughter, Mabel E. Lu. Both of them are the greatest
gifts to me.

vi
ACKNOWLEDGEMENT
First, I would like to thank my supervisor Dr. Xincheng Yao. He is a great mentor
for me, leading me to step into the research field, giving me enough space to have
independent judgment, guiding me back on the track when I went astray and preparing
me for the next step of my research career. I have learnt the importance of planning
research projects ahead in time and doing research meticulously.
I am grateful to my dissertation committee members, Dr. Franklin Amthor, Dr.
Christine Curcio, Dr. Allan Dobbins, Dr. Lei Liu and Dr. Andrew Pollard, for their caring
and encouragement. I see their wisdom from their teaching, passion from their research
and vision from insightful suggestions and comments at my annual committee meeting.
I also want to express my sincere gratitude to coworkers at BCCC campus
fellowship, Guoqiao Wang, Jige Guo, Lingfei Guo, Yanli Xie, Qiqi He, Benquan Wang,
Jiaguang Zhu, Xinyan Zhang, etc.. They are also my dear friends. I learnt from them that
research is analogous to the service in campus fellowship. Communication skills are
important for interpersonal relationship. However, love is fundamental to this relationship.
Likewise, although technical skills such as image processing and data analysis are
important to the research, other factors are essential to become a good scientist: love,
creativity and perseverance. Among these the greatest is love.
This dissertation was supported in part by R01EY023522, NSF CBET-1055889,
NSF EPSCoR-1158862, NIH R21 RR025788, NIH R21 EB012264, and UASOM I3
Pilot Award.

vii
TABLE OF CONTENTS
Page
ABSTRACT ....................................................................................................................... iii
DEDICATION .................................................................................................................... v
ACKNOWLEDGEMENT ................................................................................................. vi
LIST OF FIGURES ........................................................................................................... ix
LIST OF ABBREVIATIONS ........................................................................................... xii
INTRODUCTION .............................................................................................................. 1
Section I: Background ..................................................................................................... 4
Confocal scanning imaging system ............................................................................. 4
LS-OCT ....................................................................................................................... 7
Fast functional imaging ............................................................................................. 14
VSD ........................................................................................................................... 16
Section II: Overview of dissertation research ............................................................... 22
TWO-PHOTON EXCITED AUTOFLUORESCENCE IMAGING OF FRESHLY
ISOLATED FROG RETINAS ......................................................................................... 26
INVESTIGATION OF THE HYPER-REFLECTIVE INNER/OUTER SEGMENT
BAND IN OPTICAL COHERENCE TOMOGRAPHY OF LIVING FROG
RETINA ............................................................................................................................ 47
DYNAMIC NEAR-INFRARED IMAGING REVEALS TRANSIENT
PHOTOTROPIC CHANGE IN RETINAL ROD PHOTORECEPTORS........................ 59
SUPER-RESOLUTION SCANNING LASER MICROSCOPY THROUGH
VIRTUALLY STRUCTURED DETECTION ................................................................. 79
RAPID SUPER-RESOLUTION LINE SCANNING MICROSCOPY THROUGH
VIRTUALLY STRUCTURED DETECTION ................................................................. 99
SUMMARY .................................................................................................................... 113
GENERAL LIST OF REFERENCES ............................................................................ 117

viii
APPENDIX A: INSTITUTIONAL ANIMAL CARE AND USE COMMITTEE ..........122
ix
LIST OF FIGURES
Figure Page
INTRODUCTION
1 Fig. 1. Histological image of the frog retina. .................................................................. 1
2 Fig. 2. Optical diagram for confocal imaging system. .................................................... 5
3 Fig. 3. Confocal line-scan microscopy. .......................................................................... 7
4 Fig. 4. Simulation of OCT principle. .............................................................................. 9
5 Fig. 5. Optical diagram of LS-OCT. ............................................................................. 12
6 Fig. 6. OCT IOS imaging. ............................................................................................. 15
7 Fig. 7. Optical diagram for conventional SIM. ............................................................. 18
8 Fig. 8. Schematic diagram of the optical setup of the VSD-based SLM. ..................... 21
TWO-PHOTON EXCITED AUTOFLUORESCENCE IMAGING OFFRESHLY
ISOLATED FROG RETINAS
1 Fig. 1. Schematic diagram of the experimental setup for two-photon imaging of
the frog retina. .............................................................................................................. 32
2 Fig. 2. Autofluorescence imaging of retinal slice. ........................................................ 33
3 Fig. 3. Two-photon excited autofluorescence imaging of the flat-mounted retina. ...... 35
4 Fig. 4. Autofluorescence comparison between rods and cones. ................................... 36
5 Fig. 5. Quantitative analysis of PIO autofluorescence. ................................................. 38
6 Fig. 6. Averaged autofluorescence of the PIO, ONL, OPL, INL, IPL and GCL. ......... 39
x
INVESTIGATION OF THE HYPER-REFLECTIVE INNER/OUTER SEGMENT
BAND IN OPTICAL COHERENCE TOMOGRAPHY OF LIVING FROG RETINA
1 Fig. 1. Optical setup of LS-OCT. .................................................................................. 51
2 Fig.2. LS-OCT images. ................................................................................................. 53
3 Fig. 3. Comparison between OCT and histological images.......................................... 55
DYNAMIC NEAR-INFRARED IMAGING REVEALS TRANSIENT PHOTOTROPIC
CHANGE IN RETINAL ROD PHOTORECEPTORS
1 Fig. 1. Schematic diagram of stimulation patterns. ...................................................... 63
2 Fig. 2. Oblique stimulus-evoked photoreceptor displacements. ................................... 68
3 Fig. 3. Photoreceptor displacements and IOS responses stimulated by circular
stimulus (in transverse plane) with a Gaussian profile (in axial plane). ...................... 71
4 Fig. 4. Stimulus-evoked photoreceptor displacements at the mouse retina. ................. 72
SUPER-RESOLUTION SCANNING LASER MICROSCOPY THROUGH
VIRTUALLY STRUCTURED DETECTION
1 Fig. 1. Schematic diagram of experimental setup. ........................................................ 83
2 Fig.2. Computational simulation of the VSD-based super-resolution imaging. ........... 89
3 Fig. 3. Implementation of the VSD-based super-resolution imaging on the
resolution test target. .................................................................................................... 91
4 Fig. 4. VSD-based super-resolution imaging of freshly isolated frog retina. ............... 92
RAPID SUPER-RESOLUTION LINE SCANNING MICROSCOPY THROUGH
VIRTUALLY STRUCTURED DETECTION
1 Fig. 1. Schematic diagram of experimental setup. ...................................................... 103
2 Fig. 2. VSD-based super-resolution LSM on the resolution test target. ..................... 106

xi
3 Fig. 3. VSD-based super-resolution LSM imaging of freshly isolated
frog retina. .................................................................................................................. 108
xii
LIST OF ABBREVIATIONS
AMD age-related macular degeneration
AP avalanche photodiode
FAF fundus autofluorescence
GCL ganglion cell layer
INL inner nuclear layer
IOS intrinsic optical imaging
IPL inner plexiform layer
IS inner segment
LSM line-scan microscopy
LS-OCT line-scan optical coherence tomography
NA numerical aperture
NFL nerve fiber layer
NIR near infrared
OCT optical coherence tomography
OLM outer limiting membrane
ONL outer nuclear layer
OPL outer plexiform layer
OS outer segment
PIO photoreceptor inner segment and outer segment
xiii
PMT photomultiplier tube
PSF point spread function
RP retinitis pigmentosa
RPE retinal pigment epithelium
SIM structured illumination microscopy
SLD superluminescent diode
SLM scanning laser microscopy
SLO scanning laser ophthalmoscopy
VSD virtually structured detection
1
INTRODUCTION
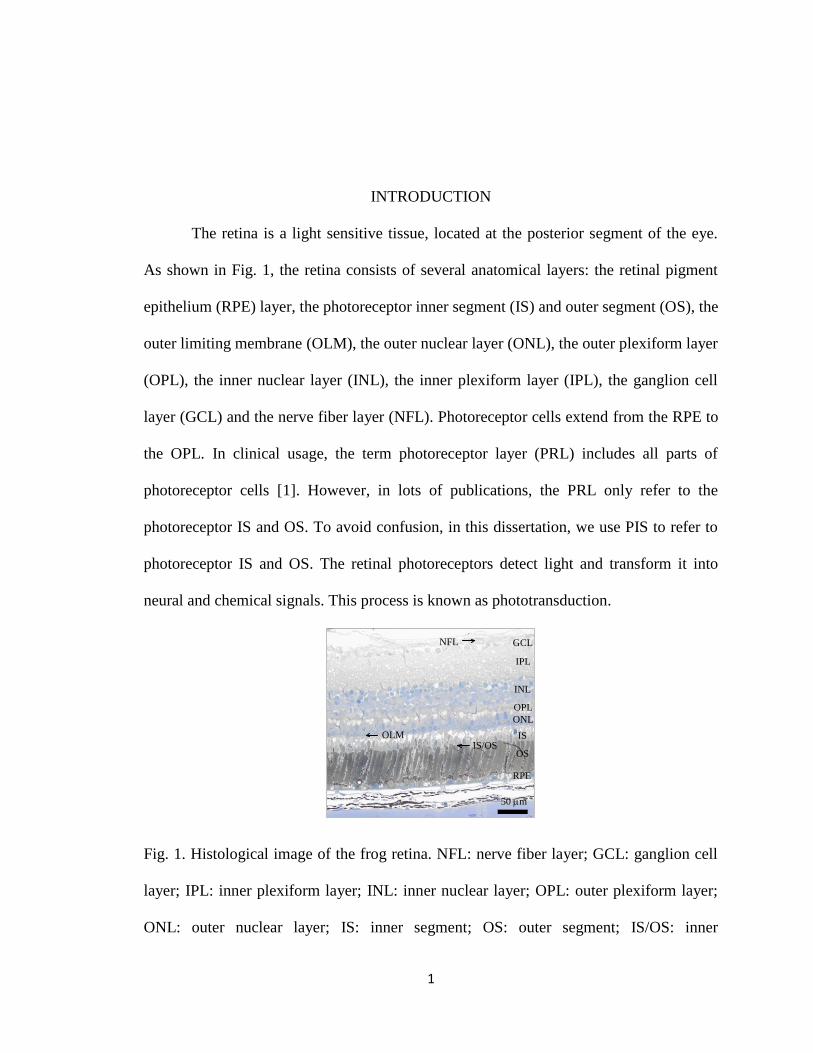
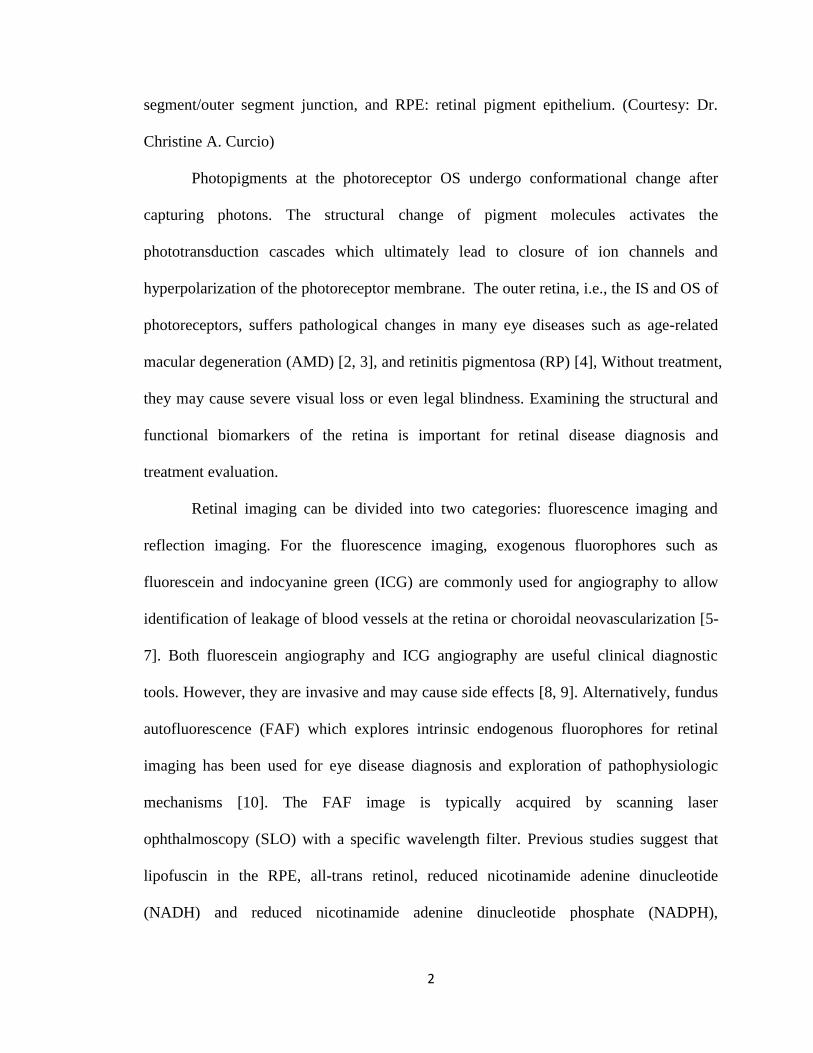
The retina is a light sensitive tissue, located at the posterior segment of the eye.
As shown in Fig. 1, the retina consists of several anatomical layers: the retinal pigment
epithelium (RPE) layer, the photoreceptor inner segment (IS) and outer segment (OS), the
outer limiting membrane (OLM), the outer nuclear layer (ONL), the outer plexiform layer
(OPL), the inner nuclear layer (INL), the inner plexiform layer (IPL), the ganglion cell
layer (GCL) and the nerve fiber layer (NFL). Photoreceptor cells extend from the RPE to
the OPL. In clinical usage, the term photoreceptor layer (PRL) includes all parts of
photoreceptor cells [1]. However, in lots of publications, the PRL only refer to the
photoreceptor IS and OS. To avoid confusion, in this dissertation, we use PIS to refer to
photoreceptor IS and OS. The retinal photoreceptors detect light and transform it into
neural and chemical signals. This process is known as phototransduction.
Fig. 1. Histological image of the frog retina. NFL: nerve fiber layer; GCL: ganglion cell
layer; IPL: inner plexiform layer; INL: inner nuclear layer; OPL: outer plexiform layer;
ONL: outer nuclear layer; IS: inner segment; OS: outer segment; IS/OS: inner
50 mm
GCL
IPL
INL
OPL
ONL
OLM IS
OS
RPE
NFL
IS/OS
2
segment/outer segment junction, and RPE: retinal pigment epithelium. (Courtesy: Dr.
Christine A. Curcio)
Photopigments at the photoreceptor OS undergo conformational change after
capturing photons. The structural change of pigment molecules activates the
phototransduction cascades which ultimately lead to closure of ion channels and
hyperpolarization of the photoreceptor membrane. The outer retina, i.e., the IS and OS of
photoreceptors, suffers pathological changes in many eye diseases such as age-related
macular degeneration (AMD) [2, 3], and retinitis pigmentosa (RP) [4], Without treatment,
they may cause severe visual loss or even legal blindness. Examining the structural and
functional biomarkers of the retina is important for retinal disease diagnosis and
treatment evaluation.
Retinal imaging can be divided into two categories: fluorescence imaging and
reflection imaging. For the fluorescence imaging, exogenous fluorophores such as
fluorescein and indocyanine green (ICG) are commonly used for angiography to allow
identification of leakage of blood vessels at the retina or choroidal neovascularization [5-
7]. Both fluorescein angiography and ICG angiography are useful clinical diagnostic
tools. However, they are invasive and may cause side effects [8, 9]. Alternatively, fundus
autofluorescence (FAF) which explores intrinsic endogenous fluorophores for retinal
imaging has been used for eye disease diagnosis and exploration of pathophysiologic
mechanisms [10]. The FAF image is typically acquired by scanning laser
ophthalmoscopy (SLO) with a specific wavelength filter. Previous studies suggest that
lipofuscin in the RPE, all-trans retinol, reduced nicotinamide adenine dinucleotide
(NADH) and reduced nicotinamide adenine dinucleotide phosphate (NADPH),
3
collectively referred to as NAD(P)H, at the PIO could contribute to FAF signals [11-13].
However, whether other retinal layers contribute to FAF signals is still unknown. It is
thus important to characterize FAF signals throughout all retinal layers for accurate
quantification and interpretation of FAF.
FAF detects signals in wavelengths longer than that of the excitation light. In
contrast, the reflection imaging modality detects reflection light at the same wavelength
as the illumination light. The most common clinical reflection retinal imaging modalities
include fundus camera, SLO and optical coherence tomography (OCT). A fundus camera
has a big field of view, but it suffers from low resolution which precludes it from
detecting fine structures. SLO is an imaging modality based on confocal configuration
which can reject out-of-focus light. With the aid of adaptive optics, SLO is able to reach
diffraction-limited resolution on transverse direction. OCT is celebrated by its three-
dimensional imaging capacity with unparalleled axial resolution. OCT has provided
indispensable information for clinical applications.
This dissertation research focused on investigation of intrinsic structural
biomarkers from FAF [14] and OCT [15]. Sources of FAF signals and origins of ‘IS/OS’
OCT band were investigated. In addition, this dissertation research extended the intrinsic
structural biomarkers to intrinsic functional biomarkers which promised early detection
of eye diseases [16]. Particularly, transient photoreceptor phototropic adaptation was
studied [17]. Moreover, this dissertation research developed a super-resolution method,
termed virtually structured detection (VSD), which can break the diffraction limit for
both SLO [18], OCT [19] and other confocal scanning imaging systems on transverse
direction. Super-resolution allows characterizing fine biomarkers which is not resolvable
4
by conventional imaging modalities with diffraction-limited resolution. To fully
understand my work, I include background information on confocal scanning imaging
system, line-scan OCT (LS-OCT), fast functional imaging and VSD in Section I and the
overview of this dissertation research in Section II.
Section I: Background
Confocal scanning imaging system
The confocal scanning imaging system is in the key of this dissertation research.
In a confocal scanning imaging system, only one point on the specimen is illuminated
and detected at a time. Thus, unwanted scattered light from other areas of the specimen
could be minimized comparing to wide field illumination. In addition, the confocal
configuration can further reject out-of-focus light and multiple scattered light to increase
the contrast of the image, particularly in thick specimens. The prototype of confocal
scanning laser microscopy (SLM) was invented by Minsky in 1950s [20]. However, it
took another thirty years for confocal SLM to become a standard technique for biological
imaging.
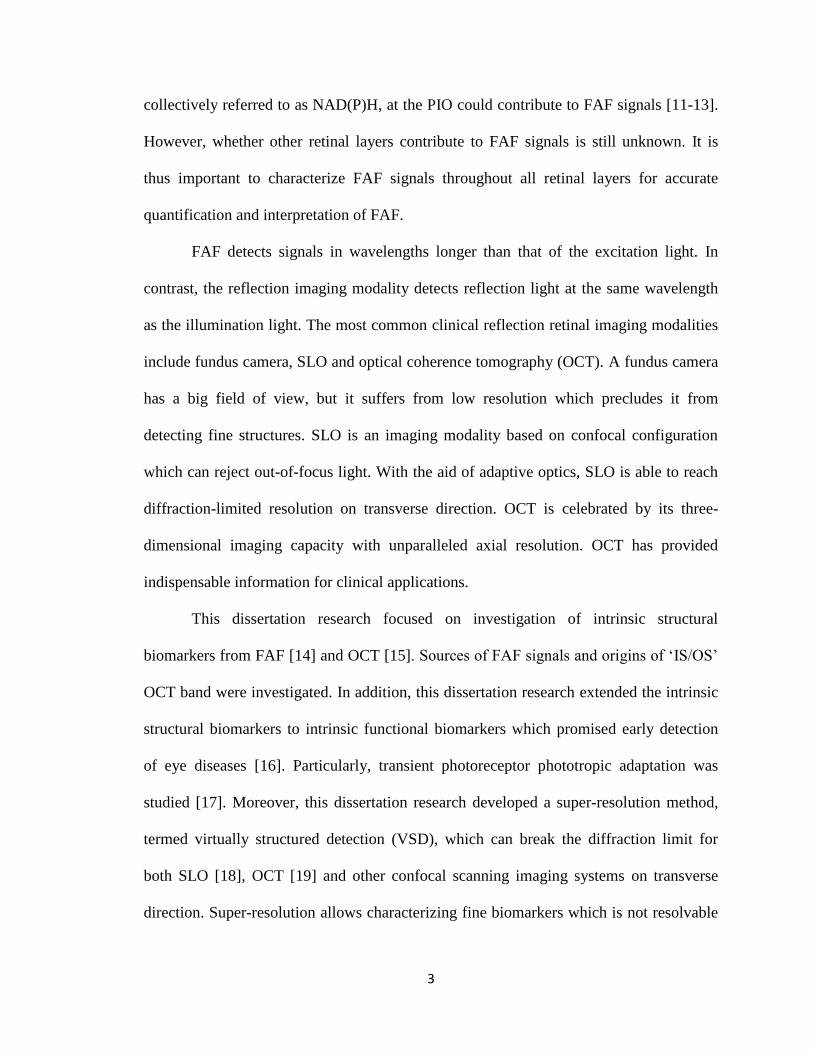
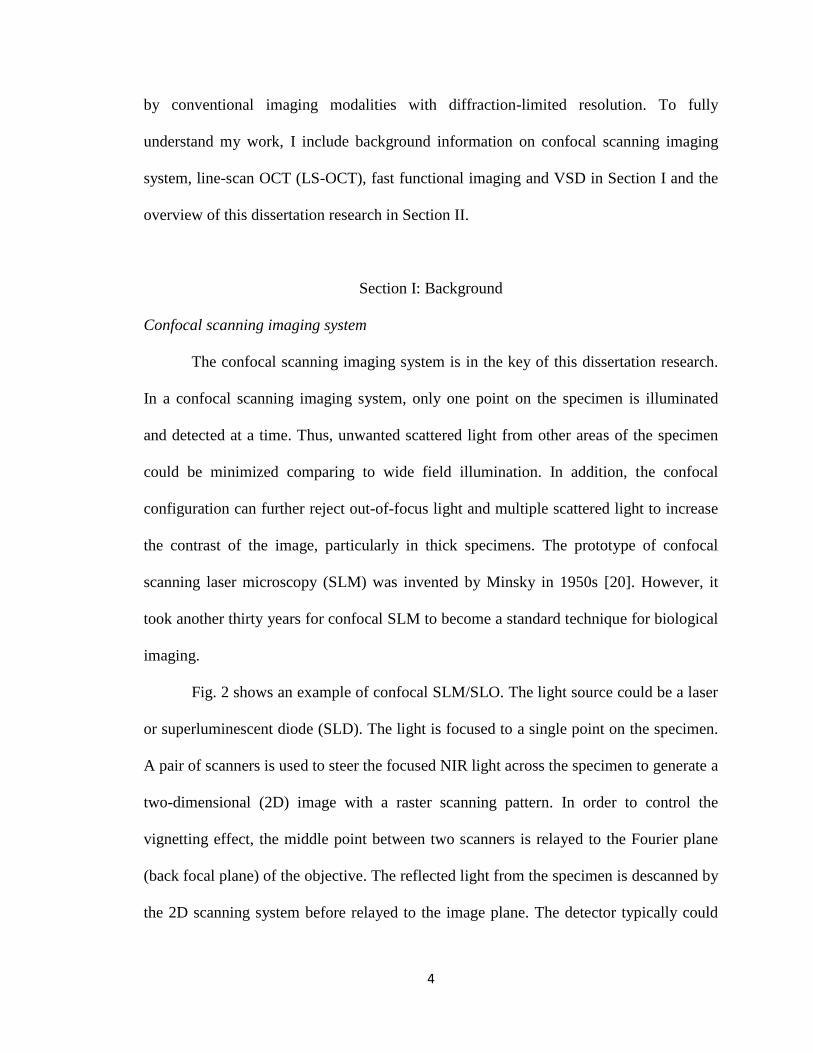
Fig. 2 shows an example of confocal SLM/SLO. The light source could be a laser
or superluminescent diode (SLD). The light is focused to a single point on the specimen.
A pair of scanners is used to steer the focused NIR light across the specimen to generate a
two-dimensional (2D) image with a raster scanning pattern. In order to control the
vignetting effect, the middle point between two scanners is relayed to the Fourier plane
(back focal plane) of the objective. The reflected light from the specimen is descanned by
the 2D scanning system before relayed to the image plane. The detector typically could
5
be avalanche photodiode (AP) or photomultiplier tube (PMT). In front of the detector a
pinhole is placed. The pinhole is conjugate to the specimen. The pinhole can reject the
out-of-focus light, as shown in Fig. 2B.
Fig. 2. Optical diagram for confocal imaging system. (A) Optical diagram for confocal
SLM and SLO. CO: collimator; BS: beam splitter; OB: objective and L1-L3 lenses.
Confocal SLO in principle is the same as SLM, except that there is not objective. In SLO,
parallel light is delivered to the eye and converged to a single point at the retina by the
cornea and the lens in the eye. (B) Diagram showing optical sectioning ability of confocal
configuration.
In theory, confocal configuration can improve the resolution by a factor of the
square of 2, if the confocal pinhole is small enough [21]. However, confocal SLM gains
its reputation mainly because of its sectioning ability rather than the enhancement of
lateral resolution. First, to achieve the lateral resolution enhancement, the confocal
pinhole should be minimized, in theory to zero, which reduces the throughput of light for
imaging. Second, microscopies, particularly in the thick specimens, may not even achieve
6
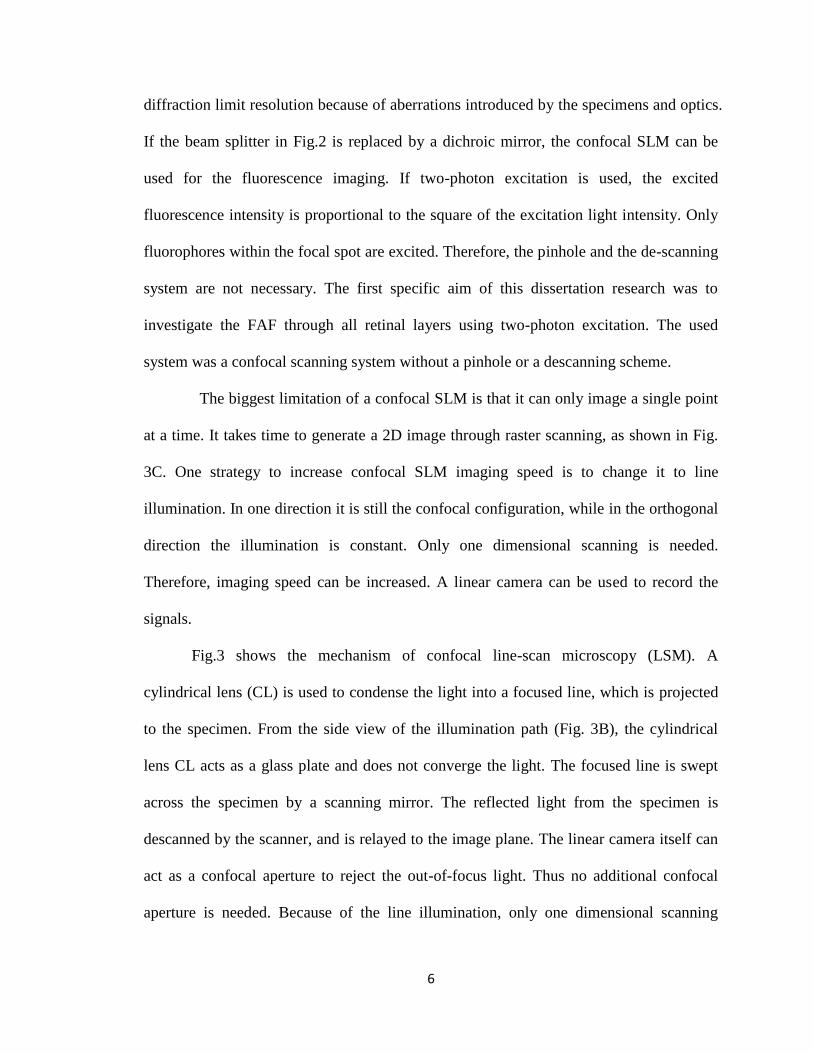
diffraction limit resolution because of aberrations introduced by the specimens and optics.
If the beam splitter in Fig.2 is replaced by a dichroic mirror, the confocal SLM can be
used for the fluorescence imaging. If two-photon excitation is used, the excited
fluorescence intensity is proportional to the square of the excitation light intensity. Only
fluorophores within the focal spot are excited. Therefore, the pinhole and the de-scanning
system are not necessary. The first specific aim of this dissertation research was to
investigate the FAF through all retinal layers using two-photon excitation. The used
system was a confocal scanning system without a pinhole or a descanning scheme.
The biggest limitation of a confocal SLM is that it can only image a single point
at a time. It takes time to generate a 2D image through raster scanning, as shown in Fig.
3C. One strategy to increase confocal SLM imaging speed is to change it to line
illumination. In one direction it is still the confocal configuration, while in the orthogonal
direction the illumination is constant. Only one dimensional scanning is needed.
Therefore, imaging speed can be increased. A linear camera can be used to record the
signals.
Fig.3 shows the mechanism of confocal line-scan microscopy (LSM). A
cylindrical lens (CL) is used to condense the light into a focused line, which is projected
to the specimen. From the side view of the illumination path (Fig. 3B), the cylindrical
lens CL acts as a glass plate and does not converge the light. The focused line is swept
across the specimen by a scanning mirror. The reflected light from the specimen is
descanned by the scanner, and is relayed to the image plane. The linear camera itself can
act as a confocal aperture to reject the out-of-focus light. Thus no additional confocal
aperture is needed. Because of the line illumination, only one dimensional scanning
7
pattern is necessary, as shown in Fig. 3D. Therefore, the imaging speed can be enhanced
comparing to the raster scanning pattern (Fig. 3C).
Fig. 3. Confocal line-scan microscopy. (A) Optical diagram for confocal SLM and SLO.
CO: collimator; CL: cylindrical lens; BS: beam splitter; OB: objective and L1-L4 lenses.
Confocal SLO has the same spirit with SLM, except that there is not objective. (B) Side
view of the illumination path. (C) Raster scanning pattern; (D) Line scanning pattern.
LS-OCT
The aforementioned confocal SLM configuration with a single point scanning
pattern and the LSM with a line scanning pattern can reject out-of-focus light, thus
allowing optical sectioning ability. However, their axial resolution is fundamentally
limited by the numerical aperture (NA) of the objective.
8
2/4.1 NAnraxial (1)
where λ is the wavelength and n is the refractive index of the specimen. The NA of the
human eye is 0.1 [22]. If the illumination with a wavelength of 0.83 nm is used, the axial
resolution is more than 150 mm, coarser than individual retinal functional layers. To
improve the axial resolution, OCT technique can be employed. OCT uses a light source
with a low coherence length to generate interference fringes to gate the signals from
different depths. The axial resolution of the OCT is independent of the NA of the
objective.
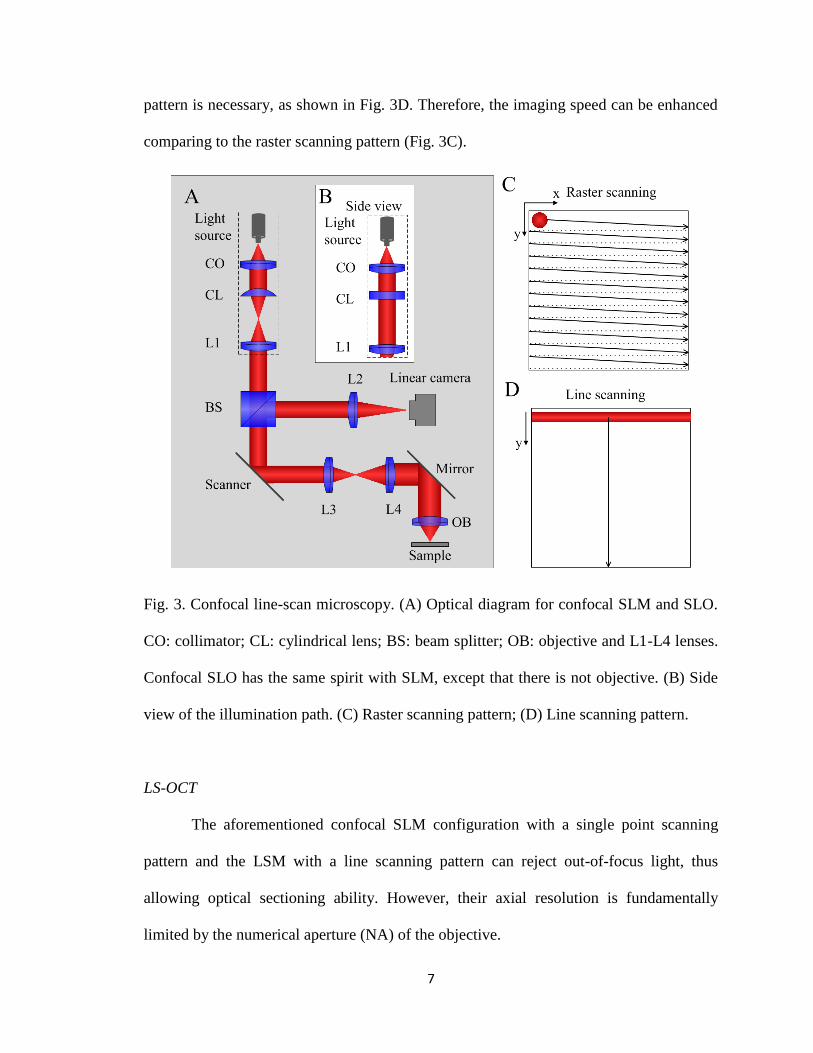
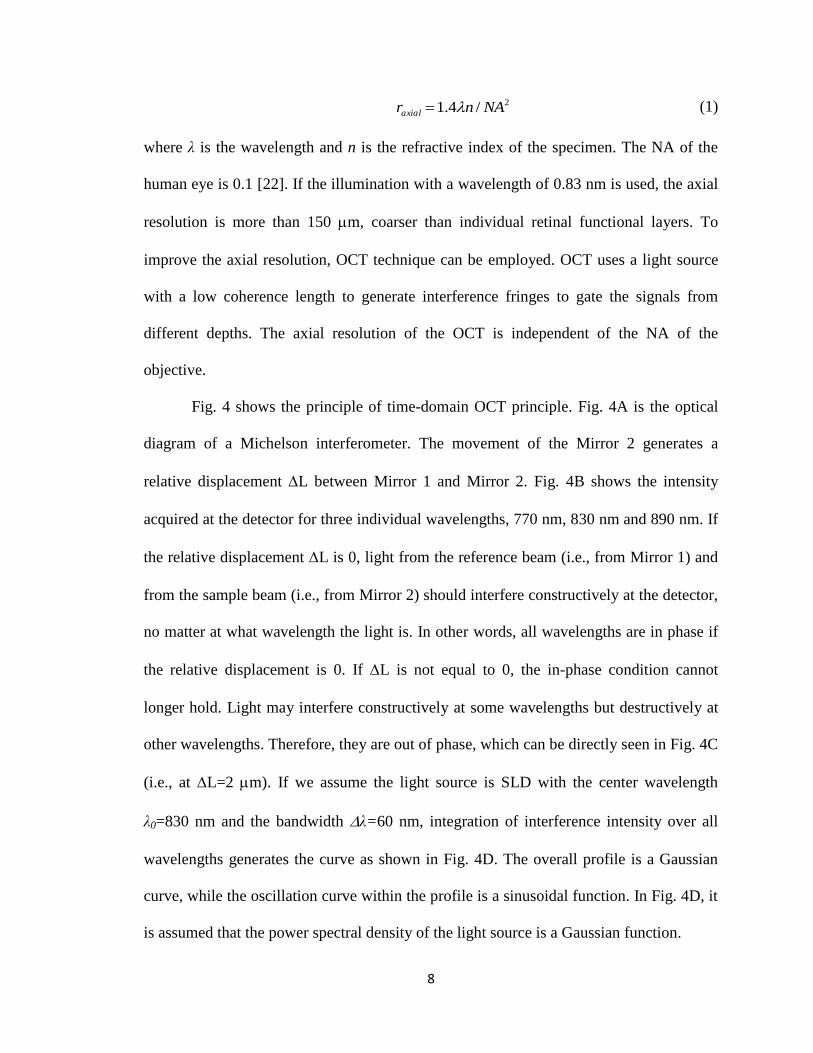
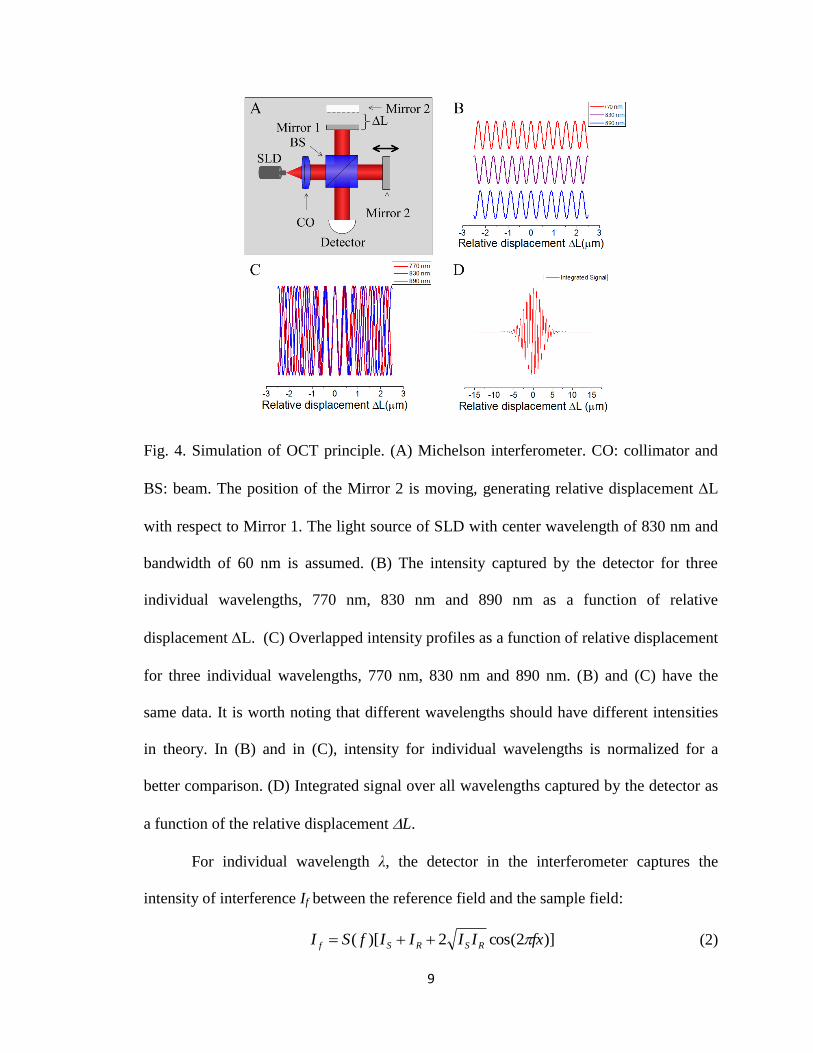
Fig. 4 shows the principle of time-domain OCT principle. Fig. 4A is the optical
diagram of a Michelson interferometer. The movement of the Mirror 2 generates a
relative displacement L between Mirror 1 and Mirror 2. Fig. 4B shows the intensity
acquired at the detector for three individual wavelengths, 770 nm, 830 nm and 890 nm. If
the relative displacement L is 0, light from the reference beam (i.e., from Mirror 1) and
from the sample beam (i.e., from Mirror 2) should interfere constructively at the detector,
no matter at what wavelength the light is. In other words, all wavelengths are in phase if
the relative displacement is 0. If L is not equal to 0, the in-phase condition cannot
longer hold. Light may interfere constructively at some wavelengths but destructively at
other wavelengths. Therefore, they are out of phase, which can be directly seen in Fig. 4C
(i.e., at L=2 mm). If we assume the light source is SLD with the center wavelength
λ0=830 nm and the bandwidth λ=60 nm, integration of interference intensity over all
wavelengths generates the curve as shown in Fig. 4D. The overall profile is a Gaussian
curve, while the oscillation curve within the profile is a sinusoidal function. In Fig. 4D, it
is assumed that the power spectral density of the light source is a Gaussian function.
9
Fig. 4. Simulation of OCT principle. (A) Michelson interferometer. CO: collimator and
BS: beam. The position of the Mirror 2 is moving, generating relative displacement L
with respect to Mirror 1. The light source of SLD with center wavelength of 830 nm and
bandwidth of 60 nm is assumed. (B) The intensity captured by the detector for three
individual wavelengths, 770 nm, 830 nm and 890 nm as a function of relative
displacement L. (C) Overlapped intensity profiles as a function of relative displacement
for three individual wavelengths, 770 nm, 830 nm and 890 nm. (B) and (C) have the
same data. It is worth noting that different wavelengths should have different intensities
in theory. In (B) and in (C), intensity for individual wavelengths is normalized for a
better comparison. (D) Integrated signal over all wavelengths captured by the detector as
a function of the relative displacement L.
For individual wavelength λ, the detector in the interferometer captures the
intensity of interference If between the reference field and the sample field:
)]2cos(2)[( fxIIIIfSI RSRSf (2)
10
where Lx 2 ; f=1/ λ S(f) is the power spectral density of the light source, and IR and IS
are the mean intensities of the reference arm and the sample arm for individual
wavelength λ, respectively. In Eq. (2), S(f) means different wavelengths have different
weights. Integration of Eq. (2) over all wavelengths yields:
(3) )2cos()(
)2cos()(2))((
)(
dffxfSBA
dffxfSIIdfIIfS
dfIxI
RSRS
f
where A and B are constant coefficients. Applying Euler’s formula in Eq. (3) generates:
(4) )](Re[)( xKBAxI
where
dffxjfSxK
)2exp()()( (5)
Eq. (5) means that )(xK coincides with the Fourier transform of the power spectrum
density of the light source. If we assume S(f) is a Gaussian function symmetric with
respect to f0:
),()( 0 ffGaussfS (6)
where:
)]2/(exp[2
1),( 22
ffGauss (7)
Substituting Eq.(6) into Eq. (5) generates:
)(ˆ)2exp()2exp(),()2exp()( 00 xGxfjdffxjfGaussxfjxK
(8)
11
where )(ˆ xG is the Fourier transform of the ),( fGauss . Because ),( fGauss is a
Gaussian function symmetric with respect to 0, its Fourier transform )(ˆ xG is also a real
Gaussian function. Therefore,
)2cos()(ˆ)](ˆ)2Re[exp()](Re[ 00 xfxGxGxfjxK (9)
It consists of two functions. The overall profile is a Gaussian function, while within the
profile it is a sinusoidal function, as shown in Fig. 4D. The axial resolution of the OCT is
defined by the full width at half maximum of )(ˆ xG [23] :
2
02ln2axialr (10)
If we assume the center wavelength is λ0=830 nm the bandwidth is λ=60 nm, the axial
resolution is about 5 mm.
Because of its high axial resolution, OCT technique is ideal for imaging the retina.
It has provided invaluable information about the retinal diseases. However, the anatomic
sources of the OCT bands at the outer retina, in particular, the presumed ‘IS/OS’ OCT
band, are still controversial. The second specific aim of this dissertation research was to
investigate the anatomic correlates to the presumed ‘IS/OS’ OCT band. To facilitate the
investigation, we used a LS-OCT system that combined the LSM and OCT techniques, as
shown in Fig. 5. It has several advantages. First, the axial resolution is high which is 5
mm in the air according to Eq. (10). Second, the transverse resolution is determined by
the NA of the objective. Because it is a time domain OCT, we move the sample so that
each layer is acquired at the focal plane. Therefore, the transverse resolution of the
system is consistent with respect to all retinal depths, which is useful to obtain high-
quality OCT image of the retina. Third, it is a line-scan system with a fast enface imaging
12
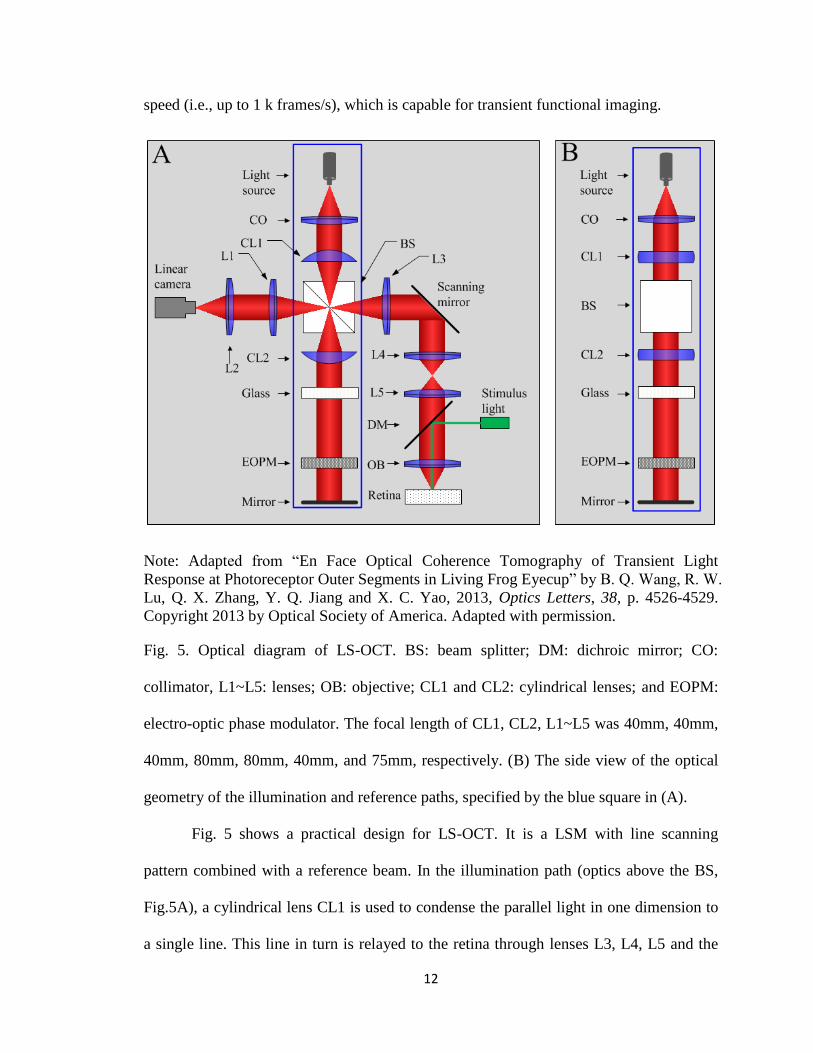
speed (i.e., up to 1 k frames/s), which is capable for transient functional imaging.
Note: Adapted from “En Face Optical Coherence Tomography of Transient Light
Response at Photoreceptor Outer Segments in Living Frog Eyecup” by B. Q. Wang, R. W.
Lu, Q. X. Zhang, Y. Q. Jiang and X. C. Yao, 2013, Optics Letters, 38, p. 4526-4529.
Copyright 2013 by Optical Society of America. Adapted with permission.
Fig. 5. Optical diagram of LS-OCT. BS: beam splitter; DM: dichroic mirror; CO:
collimator, L1~L5: lenses; OB: objective; CL1 and CL2: cylindrical lenses; and EOPM:
electro-optic phase modulator. The focal length of CL1, CL2, L1~L5 was 40mm, 40mm,
40mm, 80mm, 80mm, 40mm, and 75mm, respectively. (B) The side view of the optical
geometry of the illumination and reference paths, specified by the blue square in (A).
Fig. 5 shows a practical design for LS-OCT. It is a LSM with line scanning
pattern combined with a reference beam. In the illumination path (optics above the BS,
Fig.5A), a cylindrical lens CL1 is used to condense the parallel light in one dimension to
a single line. This line in turn is relayed to the retina through lenses L3, L4, L5 and the
13
objective OB. Fig. 5B shows side view of the illumination and reference paths (blue
square in Fig. 5A). In the side view, the cylindrical lenses CL1 and CL2 act as a pair of
glass plates and do not blend light. The linear camera (spL2048-140k, Basler Sprint) is
conjugate to the focused line illumination. The line-sensor (1 x 2048 pixels, 10 mm x 10
mm) of the linear camera is small and can naturally acts as a spatial-filter to reject out-of-
focus light. Therefore, the confocal configuration is achieved.
In the reference path (optics below the BS, Fig.5A), another cylindrical lens CL2
is used to convert the focused light back to a parallel light beam before entering the
electro-optic phase modulator (EOPM). EOPM is used to generate rapid vibration- and
inertia- free phase modulation [24]. The glass block in the reference arm is used to
compensate for optical dispersion of the sample beam. A four-step phase-shifting strategy
is employed to retrieve OCT images [25].
To simplify the discussion, we assume the scanning mirror is static. The
interference signal at the linear camera is
|√ √ | (11)
where Is is the intensity from sample arm. is the time. is the constant phase difference
between sample and reference arms. The phase modulation produced by EOPM is
, where . Is can be reconstructed by:
( ) (12)
If uniformity of the light intensity distribution of the reference arm is assumed:
cxIR )( (13)
Substituting Eq. (13) into Eq. (12) and ignoring constant coefficients yield:
( ) (14)
14
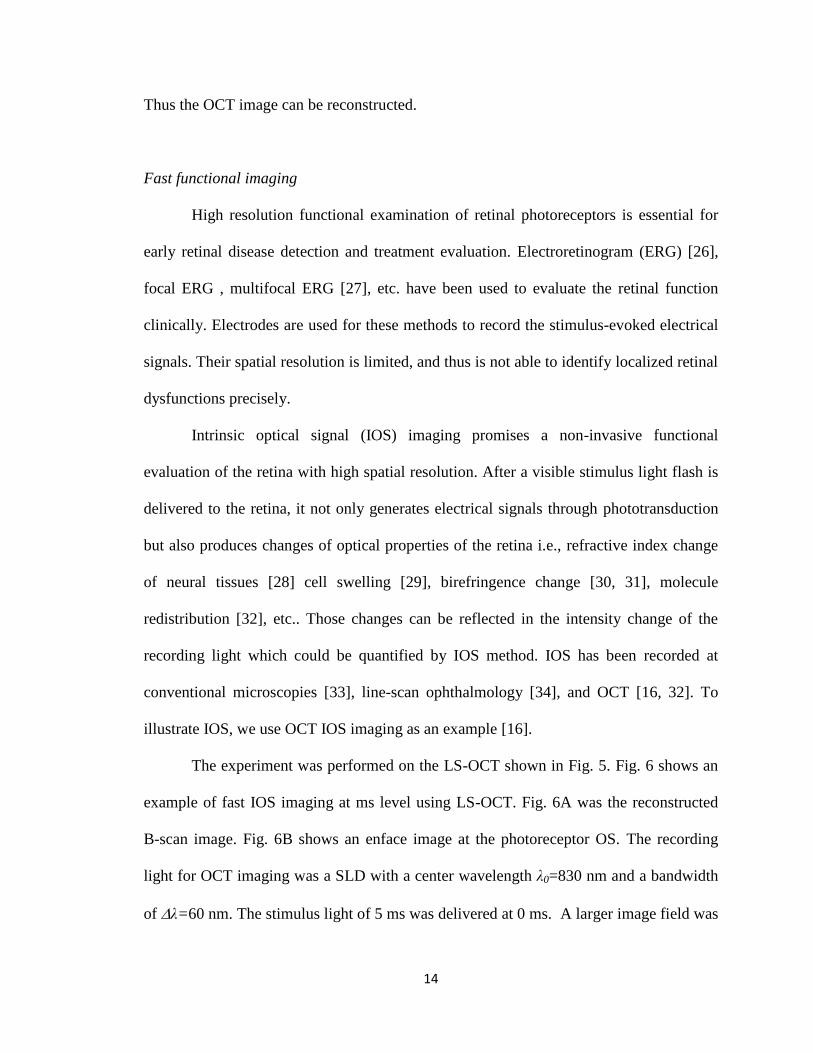
Thus the OCT image can be reconstructed.
Fast functional imaging
High resolution functional examination of retinal photoreceptors is essential for
early retinal disease detection and treatment evaluation. Electroretinogram (ERG) [26],
focal ERG , multifocal ERG [27], etc. have been used to evaluate the retinal function
clinically. Electrodes are used for these methods to record the stimulus-evoked electrical
signals. Their spatial resolution is limited, and thus is not able to identify localized retinal
dysfunctions precisely.
Intrinsic optical signal (IOS) imaging promises a non-invasive functional
evaluation of the retina with high spatial resolution. After a visible stimulus light flash is
delivered to the retina, it not only generates electrical signals through phototransduction
but also produces changes of optical properties of the retina i.e., refractive index change
of neural tissues [28] cell swelling [29], birefringence change [30, 31], molecule
redistribution [32], etc.. Those changes can be reflected in the intensity change of the
recording light which could be quantified by IOS method. IOS has been recorded at
conventional microscopies [33], line-scan ophthalmology [34], and OCT [16, 32]. To
illustrate IOS, we use OCT IOS imaging as an example [16].
The experiment was performed on the LS-OCT shown in Fig. 5. Fig. 6 shows an
example of fast IOS imaging at ms level using LS-OCT. Fig. 6A was the reconstructed
B-scan image. Fig. 6B shows an enface image at the photoreceptor OS. The recording
light for OCT imaging was a SLD with a center wavelength λ0=830 nm and a bandwidth
of λ=60 nm. The stimulus light of 5 ms was delivered at 0 ms. A larger image field was
15
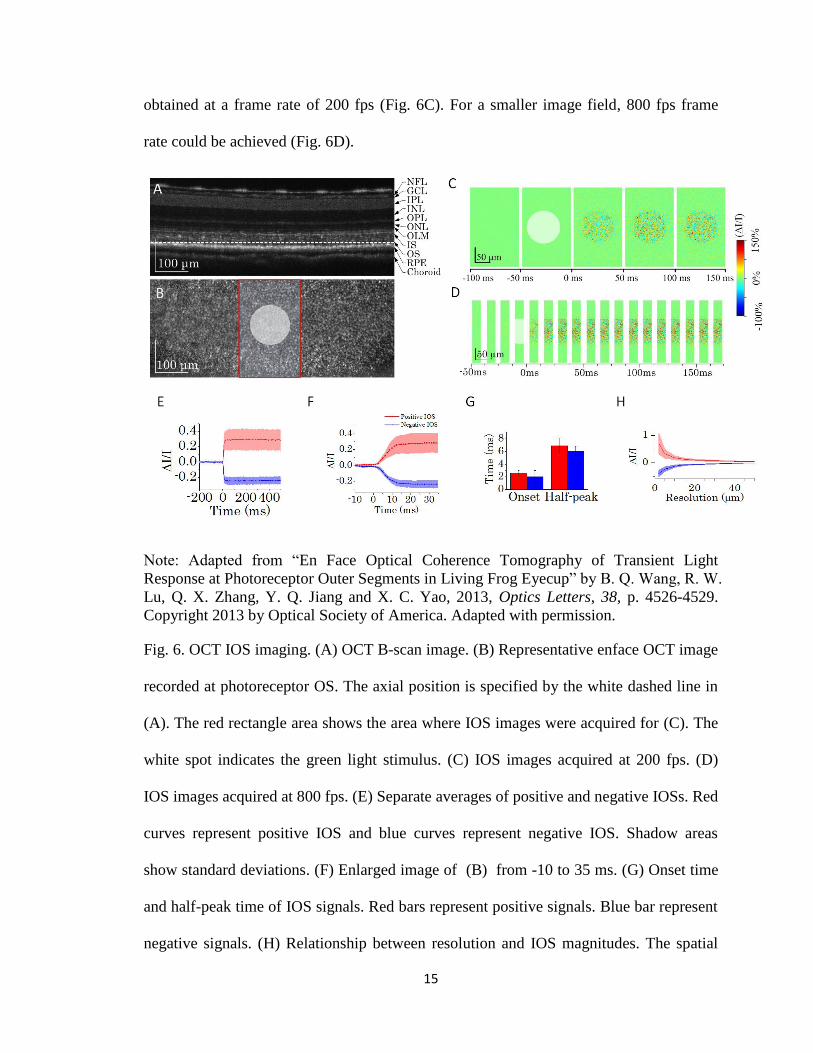
obtained at a frame rate of 200 fps (Fig. 6C). For a smaller image field, 800 fps frame
rate could be achieved (Fig. 6D).
Note: Adapted from “En Face Optical Coherence Tomography of Transient Light
Response at Photoreceptor Outer Segments in Living Frog Eyecup” by B. Q. Wang, R. W.
Lu, Q. X. Zhang, Y. Q. Jiang and X. C. Yao, 2013, Optics Letters, 38, p. 4526-4529.
Copyright 2013 by Optical Society of America. Adapted with permission.
Fig. 6. OCT IOS imaging. (A) OCT B-scan image. (B) Representative enface OCT image
recorded at photoreceptor OS. The axial position is specified by the white dashed line in
(A). The red rectangle area shows the area where IOS images were acquired for (C). The
white spot indicates the green light stimulus. (C) IOS images acquired at 200 fps. (D)
IOS images acquired at 800 fps. (E) Separate averages of positive and negative IOSs. Red
curves represent positive IOS and blue curves represent negative IOS. Shadow areas
show standard deviations. (F) Enlarged image of (B) from -10 to 35 ms. (G) Onset time
and half-peak time of IOS signals. Red bars represent positive signals. Blue bar represent
negative signals. (H) Relationship between resolution and IOS magnitudes. The spatial
16
resolution is decreased by applying different sized Butterworth windows in Fourier
domain to OCT images.
IOS at time can be calculated as:
where is the OCT image at time and is the reference image acquired by
averaging all images before stimulus delivery. Fig. 6C and Fig. 6D show IOS maps.
After stimulus flash (5 ms), both positive and negative IOSs could be observed (Figs. 6C-
6F). The signal was extremely fast (onset time <3 ms, half-peak time < 10 ms, Fig. 6G).
The time course of the fast optical signals is comparable to ERG signals and can be used
to evaluate the function of the photoreceptor OS. Fig. 6H shows that IOS magnitude
decreases as a function of the transverse resolution, which implies that resolution is
important for IOS imaging. The origins of IOS are very complex. We successfully
isolated one mechanism: transient phototropism, which was the third specific aim of this
dissertation research. Moreover, this transient phototropic adaptation was rod-dominant,
which promised a new methodology to evaluate the rod function. This is valuable,
because rods are more vulnerable than cones in initial stages in some eye diseases like
AMD [3, 35] and RP [36].
VSD
The transverse resolution of aforementioned systems including confocal SLM
with signal point scanning pattern, confocal LSM with line scanning pattern, and OCT is
all diffraction limited. For fluorescence imaging, multiple strategies have been developed
to break the diffraction limit, such as stimulated emission depletion (STED) microscopy,
17
stochastic optical reconstruction microscopy (STORM) [37], photoactivated localization
microscopy (PALM) [38], fluorescence PALM (FPALM) [39] and structured
illumination microscopy (SIM) [40-42]. For the STED imaging, the shape of effective
illumination point spread function (PSF) of the excitation light is sharpened by doughnut-
shape depletion light which deactivates peripheral regions of the center focal spot while
leaving the fluorophores at the desired center to emit fluorescence. Single-molecule
imaging, i.e., STORM, PALM, and FPALM, alternatively can achieve super-resolution
by localizing centroids of individual single molecules with photo-switchable fluorescence
probes. Both STED and single-molecular imaging modalities requires specific dyes or
fluorescent proteins, and are not suitable for autofluorescence imaging, or reflection/
transmission imaging.
The SIM is applicable to both fluorescence [40-42] and reflection/transmission
imaging [43, 44]. The SIM requires a sinusoidal patterned illumination to shift
frequencies higher than the diffraction limit to lower frequencies so that the passing band
of one optical system can be effectively expanded. However, for the purpose of the
reconstruction, the SIM requires complicated mechanical manipulation of gratings [40-42]
or grids [45, 46] to generate structured illumination patterns with specific phases, which
becomes particularly challenging for a moving specimen. In addition, the conventional
SIM requires a wide field illumination and is not feasible for confocal systems. Recently
we have demonstrated the feasibility of super-resolution SLM, OCT and LSM via VSD.
In the VSD-based system, the sinusoidal modulation is achieved by mathematical
processing of digital images. The VSD-based super-resolution imaging is phase-artifact
free and is suitable for both fluorescence (either exogenous fluorescence or
18
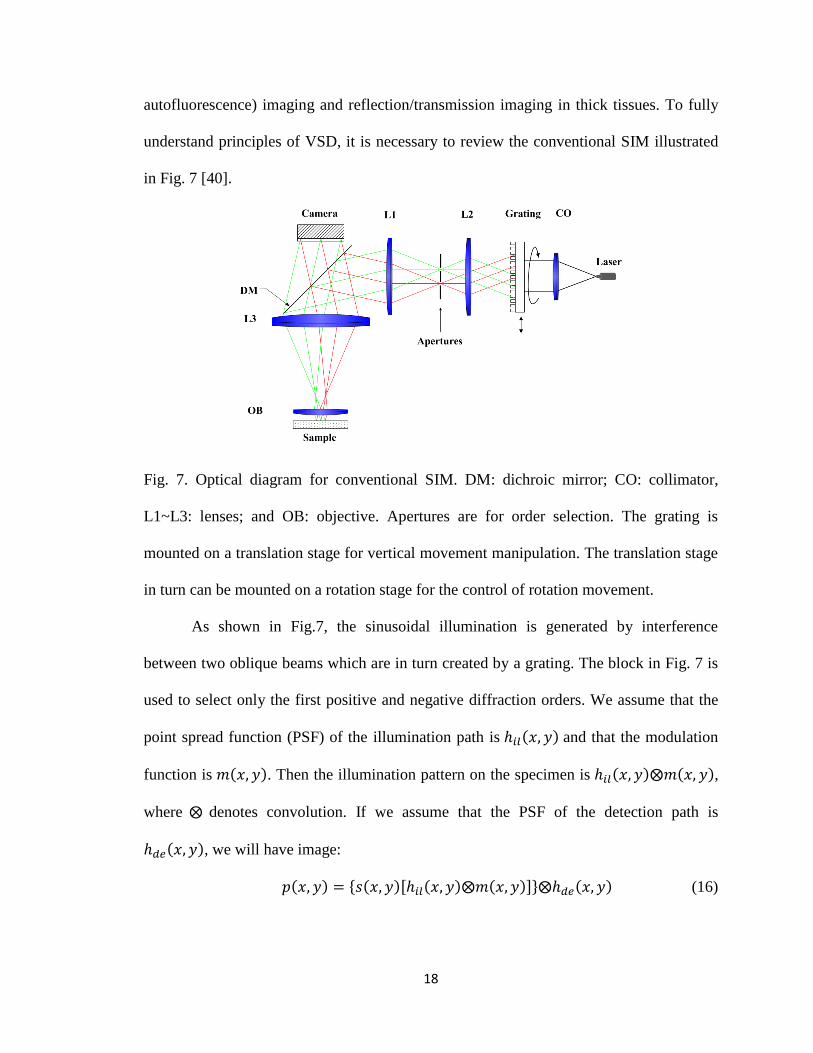
autofluorescence) imaging and reflection/transmission imaging in thick tissues. To fully
understand principles of VSD, it is necessary to review the conventional SIM illustrated
in Fig. 7 [40].
Fig. 7. Optical diagram for conventional SIM. DM: dichroic mirror; CO: collimator,
L1~L3: lenses; and OB: objective. Apertures are for order selection. The grating is
mounted on a translation stage for vertical movement manipulation. The translation stage
in turn can be mounted on a rotation stage for the control of rotation movement.
As shown in Fig.7, the sinusoidal illumination is generated by interference
between two oblique beams which are in turn created by a grating. The block in Fig. 7 is
used to select only the first positive and negative diffraction orders. We assume that the
point spread function (PSF) of the illumination path is and that the modulation
function is . Then the illumination pattern on the specimen is ,
where denotes convolution. If we assume that the PSF of the detection path is
, we will have image:
{ } (16)

19
where is the reflectance ratio of the specimen for the reflection imaging or the
fluorophore concentration for fluorescence imaging. Fourier transforming of Eq. (16)
yields:
( ) { ( ) [ ( ) ( )]} ( ) (17)
We assume the mask is a sinusoidal function:
(18)
We assume . Then Fourier transform of Eq. (18) is:
( ) ( ) ( ) ( )
(19)
Substituting Eq. (19) into Eq. (17) generates:
( ) ( ) ( ) ( )
( ) (20)
where we assume that is slightly smaller than the cutoff frequency of the illumination
PSF. The second item and the third item in the square bracket contain the super-
resolution information. We assume that:
( ) ( ) ( ) (21-a)
( ) ( ) ( ) (21-b)
( ) ( ) ( ) (21-c)
Substituting Eq. (21) into Eq. (20) yields:
( ) ( ) ( ) ( )
(22)
If we move the grating vertically to generate three phases ,
and
,
we will have:
( ) ( ) ( ) ( ) (23-a)
( ) ( ) ( ) ( )
(23-b)
20
( ) ( ) ( ) ( )
(23-c)
Solving Eq. (23) yields:
[
( )
( )
( )
] [
]
[
( )
( )
( )
] (24)
Therefore, the super-resolution information can be recovered. To achieve isotropic
resolution enhancement in all directions, it is necessary to rotate the grating.
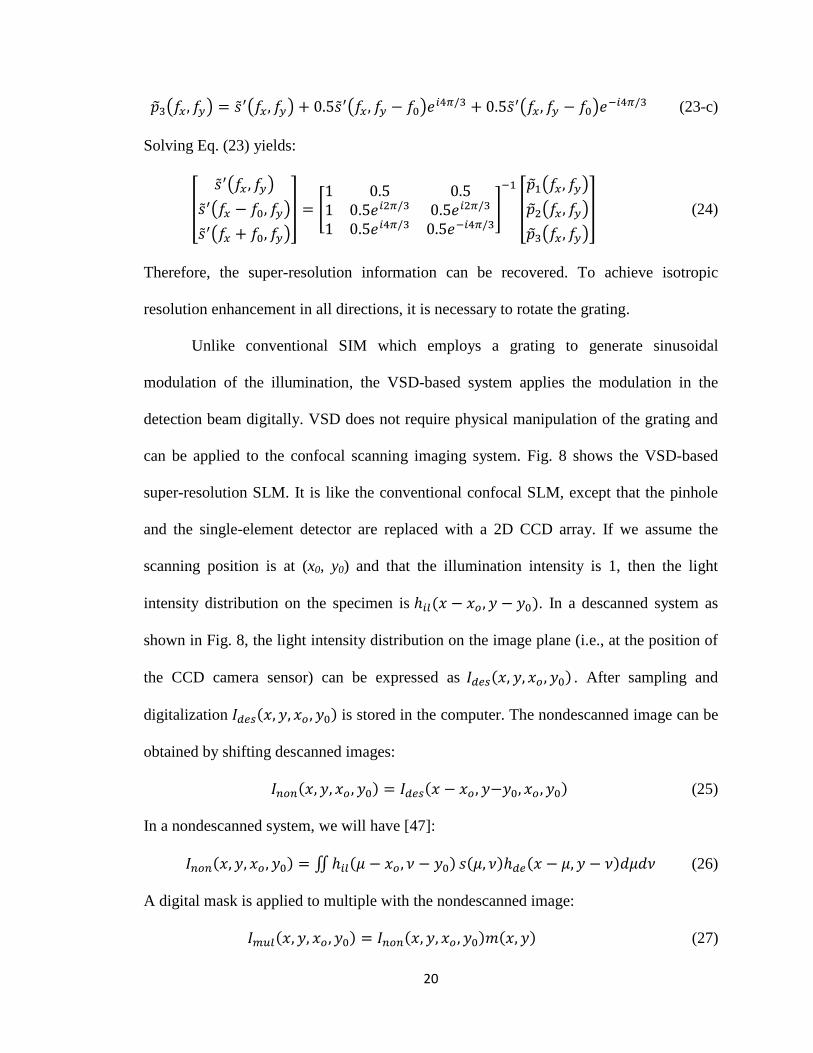
Unlike conventional SIM which employs a grating to generate sinusoidal
modulation of the illumination, the VSD-based system applies the modulation in the
detection beam digitally. VSD does not require physical manipulation of the grating and
can be applied to the confocal scanning imaging system. Fig. 8 shows the VSD-based
super-resolution SLM. It is like the conventional confocal SLM, except that the pinhole
and the single-element detector are replaced with a 2D CCD array. If we assume the
scanning position is at (x0, y0) and that the illumination intensity is 1, then the light
intensity distribution on the specimen is . In a descanned system as
shown in Fig. 8, the light intensity distribution on the image plane (i.e., at the position of
the CCD camera sensor) can be expressed as . After sampling and
digitalization is stored in the computer. The nondescanned image can be
obtained by shifting descanned images:
(25)
In a nondescanned system, we will have [47]:
∬ (26)
A digital mask is applied to multiple with the nondescanned image:
(27)
21
The spatial integral of the image is assigned to the position (x0, y0):
∬ (28)
Substituting Eqs. (26) and (27) into Eq. (28) yields [47]:
∬∬
∬ ∬
{ } (29)
where the integration order is changed, the fact that PSFs are even functions is assumed.
If we assume illumination PSF is equal to detection PSF, then Eq. (29) is equivalent to
Eq. (16). Equivalency of Eq. (16) and Eq. (29) implies that modulation on the
illumination beam and the detection beam is equivalent. Therefore, super-resolution
information of the VSD-based system can be also achieved following the reconstruction
method of the conventional SIM.
Note: From “Dynamic Near-infrared Imaging Reveals Transient Phototropic Change in
Retinal Rod Photoreceptors” by R. W. Lu, A. M. Levy, Q. X. Zhang, S. J. Pittler and X.
C. Yao, 2013, Journal of Biomedical Optics, 18, p. 106013. Copyright 2013 by SPIE.
Reprinted with permission.
Fig. 8. Schematic diagram of the optical setup of the VSD-based SLM. OB: objective;
CO: collimator; L1-L3: lens; and BS: beam splitter. Focal length of lenses L1, L2 and L3
22
was 200 mm, 40 mm and 150 mm, respectively. The objective was 5X with NA 0.1. The
measured magnification was about 21. The light source was provided by SLD with center
wavelength 830 nm and bandwidth =60 nm. The theoretical resolution of this
system is 0.61NA=5 mm.
Section II: Overview of dissertation research
This dissertation research is twofold: (1) to investigate the intrinsic structural and
functional biomarkers at the outer retina; (2) to develop the VSD super-resolution method.
The VSD can break the diffraction limit for retinal imaging, which allows for reliable
investigation of intrinsic structural and functional biomarkers of the retina.
The first kind of intrinsic structural biomarkers studied in this dissertation
research are FAF biomarkers. FAF has been helpful for better understanding of eye
diseases such as AMD [48, 49], RP [50], multifocal choroiditis and panuveitis [51] and
Stargardt disease [52]. FAF signals are originated from choroidal vessels and the retinal
pigment epithelium (RPE) [53]. Recent studies show that all-trans retinol and reduced
NAD(P)H at the PIO could also contribute to FAF [11-13]. However, whether other
retinal layers could emit FAF signals is still unknown. The first specific aim of the
dissertation research is to characterize FAF throughout the retinal depths using two-
photon excitation. Freshly prepared frog retina specimens in the Ringer solution were
used to ensure the physiological condition. Both sliced and flat-mounted retinas were
examined. Two-photon excitation and a high NA objective were used to minimize the
crosstalk among retinal layers. Two-photon FAF showed that FAF signals exist across
multiple functional layers, including the PIO, ONL, OPL, INL, IPL and GCL. This work
23
implies that FAF that is intended to image the outer retina, i.e., the RPE or PIO, cannot
exclude contamination from inner retinal layers. This contamination should be taken into
consideration during quantitative analysis of FAF signals, particularly for in vivo studies
of human, because the NA of the human is low (~0.1NA) [22], which is not able to
isolate the signal from the desired layers. The results of the first specific aim are reported
in the first article of this dissertation, which has been published by Biomedical Optical
Express as a full-length original paper.
The FAF can have good image contrast. However, the axial resolution of the in
vivo FAF is still limited by the low NA of the human eye. OCT, on the other hand, has
excellent axial resolution. However, the anatomic correlates to the OCT layers at the
outer retina, particularly the presumed ‘IS/OS’ OCT band, are still controversy. The
second set of intrinsic structural biomarkers studied in this dissertation research is OCT
biomarkers. We compared high-quality OCT images with histological images to identify
the origins of the presumed ‘IS/OS’ OCT band. A LS-OCT was constructed to achieve a
sub-cellular resolution (lateral: ~2 mm; axial: ~4 mm) of excised living frog retinas. An
electro-optic phase modulator was employed for rapid and vibration-free phase
modulation. Comparison of normalized distance measurements between LS-OCT images
and histological images revealed that the dominant source of the signal reported as the
‘IS/OS’ OCT band is actually located in the IS. This study can provide valuable
information for accurate clinical interpretation of the presumed ‘IS/OS’ OCT band [54].
The results of the second specific aim are reported in the second article of this
dissertation, published by Journal of Biomedical Optics as a full-length original research
paper.
24
The two aforementioned intrinsic structural biomarkers including FAF and OCT
biomarkers are helpful for eye disease diagnosis and studies. However, some functional
abnormalities may take place before structural abnormalities become detectable.
Therefore, functional biomarkers are critical for early detection of eye diseases. Rods,
which detect dim light, are more vulnerable than cones which are for day light vision in
the initial stages of some eye diseases such as AMD [3, 35] and RP [36]. Although
structural images of rods can be observed using adaptive optics SLO [55-57], evaluation
of rod dysfunction is still mostly confined to ERG [58] recording and psychophysical
measurement [59]. However, it is still challenging to identify localized rod dysfunctions
reliably because of the limited resolution and sensitivity. In the third specific aim of this
dissertation research, an intrinsic functional biomarker, transient phototropic adaptation
of rod was discovered and explored. After delivered a flash of the oblique stimulus, rods
rapidly shifted toward the incident direction of the stimulus on transverse direction. In
contrast, such transient phototropism was negligible in cones. Further investigation of
such rod-dominant phototropic adaptation promises a new methodology for evaluation of
localized rod dysfunction. The results of the third specific aim are reported in the third
article of this dissertation, published by Journal of Biomedical Optics as a full-length
original research paper.
High resolution imaging is important for identifying subtle intrinsic structural and
functional biomarkers. However, the transverse resolution of current retinal imaging
modalities is all limited by the light diffraction. SIM is a super-resolution method
applicable for both autofluorescence and reflection/transmission imaging modalities.
However, the conventional SIM uses full field illumination and is not applicable for thick
25
tissues. Moreover, it requires complex physical manipulation of the sinusoidal
illumination generator and may generate phase errors during image reconstruction for
moving specimens, i.e., in vivo retinal imaging. As a last specific aim of this dissertation
research, we developed VSD-based super-resolution imaging systems. VSD can be
integrated to confocal scanning systems. In addition, digital sinusoidal modulation is
applied in VSD which does not require any physical manipulation illumination generator.
We demonstrated the VSD-based super-resolution confocal SLM [18] and OCT [19] with
single point raster scanning pattern (Fig. 3C). The raster scanning pattern is slow for the
VSD method. To increase speed, VSD is integrated to confocal LSM with line scanning
pattern as shown in Fig. 3D. The VSD-based super-resolution SLM with single point
raster scanning pattern has been reported in the fourth article of this dissertation,
published by Biomedical Optics Express as a full-length original research paper. In
addition, the VSD-based super-resolution LSM with line scanning pattern are reported in
the fifth article of this dissertation, which will be submitted to Optics Letters as a full-
length original research article. In summary my dissertation includes:
1) characterization of intrinsic structural biomarker FAF through all retinal layers,
presented in the first article of this dissertation;
2) investigation of anatomic correlates to the presumed ‘IS/OS’ OCT band,
presented in the second article of this dissertation;
3) exploration of transient phototropic adaptation, an intrinsic functional biomarker,
presented in the third article of this dissertation; and
4) development of the super-resolution VSD for confocal scanning imaging systems,
presented in the fourth and fifth articles of this dissertation.
26
TWO-PHOTON EXCITED AUTOFLUORESCENCE IMAGING OF FRESHLY
ISOLATED FROG RETINAS
by
RONGWEN LU, YICHAO LI, TONG YE, CHRISTIANNE STRANG, KENT KEYSER,
CHRISTINE A. CURCIO, AND XINCHENG YAO
Biomedical Optics Express 2(6), 1494-1503, 2011
Copyright
2011
by
Optical Society of America
Used by permission
Format adapted and errata corrected for dissertation
27
Abstract
The purpose of this study was to investigate cellular sources of autofluorescence
signals in freshly isolated frog (Rana Pipiens) retinas. Equipped with an ultrafast laser, a
laser scanning two-photon excitation fluorescence microscope was employed for sub-
cellular resolution examination of both sliced and flat-mounted retinas. Two-photon
imaging of retinal slices revealed autofluorescence signals over multiple functional
layers, including the photoreceptor inner segment and outer segment (PIO), outer nuclear
layer (ONL), outer plexiform layer (OPL), inner nuclear layer (INL), inner plexiform
layer (IPL), and ganglion cell layer (GCL). Using flat-mounted retinas, depth-resolved
imaging of individual retinal layers further confirmed multiple sources of
autofluorescence signals. Cellular structures were clearly observed at the PIO, ONL, INL,
and GCL. At the PIO, the autofluorescence was dominantly recorded from the
intracellular compartment of the photoreceptors; while mixed intracellular and
extracellular autofluorescence signals were observed at the ONL, INL, and GCL. High
resolution autofluorescence imaging clearly revealed mosaic organization of rod and cone
photoreceptors; and sub-cellular bright autofluorescence spots, which might relate to
connecting cilium, was observed in the cone photoreceptors only. Moreover, single-cone
and double-cone outer segments could be directly differentiated.
1. Introduction
Functional evaluation of the retina is important for early detection and treatment
evaluation of eye diseases, such as age-related macular degeneration (AMD) [1, 2],
diabetic retinopathy (DR) [3, 4], and glaucoma [5, 6]. Previous investigations have
28
demonstrated that autofluorescence alterations could be used to detect metabolic
parameters such as partial pressure of oxygen [7] in biological tissues, and could also act
as unique biomarker for selective evaluation of individual cell types such as retinal
pigment epithelium (RPE) [8-11]. Without complexities of sample preparation and
potential toxicity of exogenous biomarkers, autofluorescence imaging of endogenous
fluorophores promises a noninvasive method for functional measurement of the retina
[12]. Fundus imaging has revealed autofluorescence from choroidal vessels and the
retinal pigment epithelium (RPE) [13]. In principle, fundus autofluorescence imaging
may provide high resolution identification of localized retinal dysfunction and thus allow
improved disease detection and treatment evaluation. However, multiple types of retinal
cells may contribute to fundus autofluorescence. Previous investigations of the retina [14,
15] and other systems [16-18] have revealed that abundant endogenous fluorophores exist
in both intracellular and extracellular compartments of biological tissues. Therefore,
better understanding of cellular sources of fundus autofluorescence is essential to pursue
advanced applications of this imaging technology.
Because of ocular aberrations and complex retinal structure, in vivo evaluation of
the autofluorescence correlated with individual retinal cell types is challenging. In
coordination with adaptive optics to compensate for ocular aberrations, in vivo
autofluorescence imaging with cellular resolution in transverse direction has recently
been demonstrated in macaque and human eyes [19, 20]. However, axial resolution of
adaptive optics imaging is limited, typically larger than the thickness of individual
functional layers of the retina [21, 22]. Therefore, in vivo dissection of the
autofluorescence from individual retinal layers is still difficult.
29
Without the complication of ocular optics, isolated retinas can provide a simple ex
vivo preparation for quantitative analysis of the contribution of individual retinal
layers/cells, including the photoreceptor and inner retinal neurons, to the fundus
autofluorescence. Fluorescence microscopy has been used to disclose robust
autofluorescence in both outer and inner segments [23, 24]. In principle, two-photon
imaging can provide sub-cellular resolution in both transverse and axial directions to
characterize autofluorescence in intact retinas. Recently, two-photon autofluorescence
imaging of both fixed [14, 15, 25, 26] and unfixed [27-29] ex vivo retinal preparations has
been demonstrated. However, quantitative two-photon autofluorescence examination of
the photoreceptor and inner retinal neurons has not been examined in freshly isolated,
i.e., living, retinas. Early investigations suggested that excitation efficiencies and emitted
spectra of the fluorophores can be very sensitive to various environmental factors such as
partial pressure of oxygen, solvent polarity or viscosity, etc [7, 30]. Therefore,
physiological solutions may provide for more accurate measurement of autofluorescence
associated with live tissue.
The purpose of this study is to quantify two-photon excited autofluorescence
signals from photoreceptors and inner neurons in freshly isolated retinas. In oxygenated
Ringer’s solution, freshly isolated retinas are viable and excitable, at least for a few hours.
We have recently using freshly isolated retinas, including both sliced [31] and flat-
mounted [32-39] retinas, to investigate stimulus-evoked retinal neural activities. In this
study, the same retinal preparation, i.e., isolated but living retinas, to characterize cellular
sources of retinal autofluorescence. In the freshly isolated retinas, robust
autofluorescence signals were consistently observed across whole retinal depth, i.e., the
30
photoreceptor inner segment and outer segment (PIO), outer nuclear layer (ONL), outer
plexiform layer (OPL), inner nuclear layer (INL), inner plexiform layer (IPL), and
ganglion cell layer (GCL). Characteristic autofluorescence patterns were imaged over
different retinal layers, and autofluorescence signals of individual retinal layers were
quantitatively compared.
2. Method
2.1. Retinal Preparation
Isolated leopard (Rana Pipiens) frog retinas were used for the experiments. Isolated
retinas provide a simple preparation to investigate cellular sources of autofluorescence in
the retina without the complications associated with the presence of other ocular tissues
and eye movements. Both sliced and flat-mounted retinas were used for this study. A
retinal slice opens a cross-section of the retina, and thus allows simultaneous monitoring
of autofluorescence signal from the photoreceptor outer segments to inner retina; while a
flat-mounted retina allows depth-resolved imaging of individual retinal layers. The
experimental procedures were approved by the Institutional Animal Care and Use
Committee of University of Alabama at Birmingham. Details of the preparation of flat-
mounted retinas [34] and retinal slices [31] have been previously reported. Briefly, retinal
dissection was conducted in a dark room with dim red illumination. The frog was
sacrificed by rapid decapitation and double pithing before the eyes were enucleated. The
eyeball was hemisected below the equator with fine scissors to remove the lens and
anterior structures before separating the retina from the retinal pigment epithelium. The
isolated retina was directly used for flat-mounted imaging, or cut into ~200 mm slices for
31
cross section imaging of the retina. During the recording, the retina was immersed in
oxygenated Ringer’s solution containing (in mM) [40]: 110 NaCl, 2.5 KCl, 1.6 MgCl2,
1.0 CaCl2, 22 NaHCO3, and 10 D-glucose.
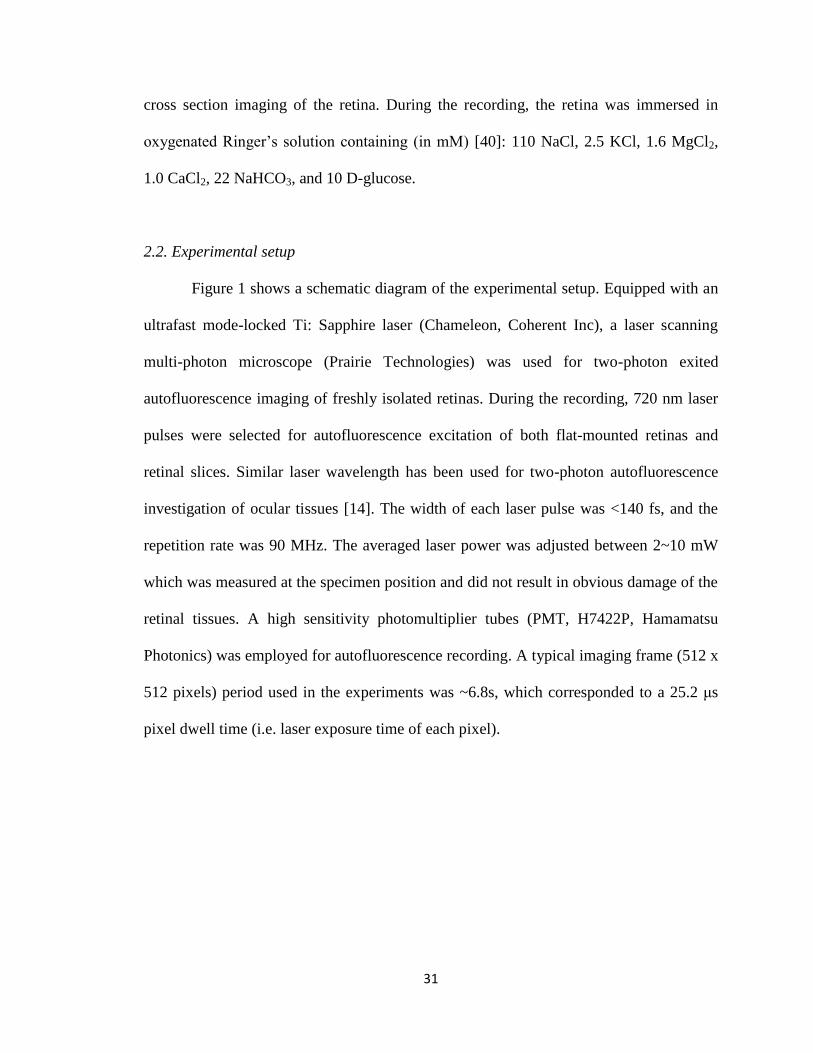
2.2. Experimental setup
Figure 1 shows a schematic diagram of the experimental setup. Equipped with an
ultrafast mode-locked Ti: Sapphire laser (Chameleon, Coherent Inc), a laser scanning
multi-photon microscope (Prairie Technologies) was used for two-photon exited
autofluorescence imaging of freshly isolated retinas. During the recording, 720 nm laser
pulses were selected for autofluorescence excitation of both flat-mounted retinas and
retinal slices. Similar laser wavelength has been used for two-photon autofluorescence
investigation of ocular tissues [14]. The width of each laser pulse was <140 fs, and the
repetition rate was 90 MHz. The averaged laser power was adjusted between 2~10 mW
which was measured at the specimen position and did not result in obvious damage of the
retinal tissues. A high sensitivity photomultiplier tubes (PMT, H7422P, Hamamatsu
Photonics) was employed for autofluorescence recording. A typical imaging frame (512 x
512 pixels) period used in the experiments was ~6.8s, which corresponded to a 25.2 μs
pixel dwell time (i.e. laser exposure time of each pixel).
32
Ti: Sapphire laser
(Mode Locked)
PMT
LensFilter
Sample
Objective
Dichroic Mirror
Lens
Lens
Scanning Mirror
Fig. 1. Schematic diagram of the experimental setup for two-photon imaging of the frog
retina. A mode-locked Ti: Sapphire laser (Chameleon, Coherent Inc) was used to provide
excitation light (720 nm). At the dichroic mirror, the long-wavelength 720 nm excitation
light (red rays) was passed through and the short-wavelength emission light (green rays)
was reflected. A band-pass (450-550 nm) filter was placed in front of the photomultiplier
tube (PMT).
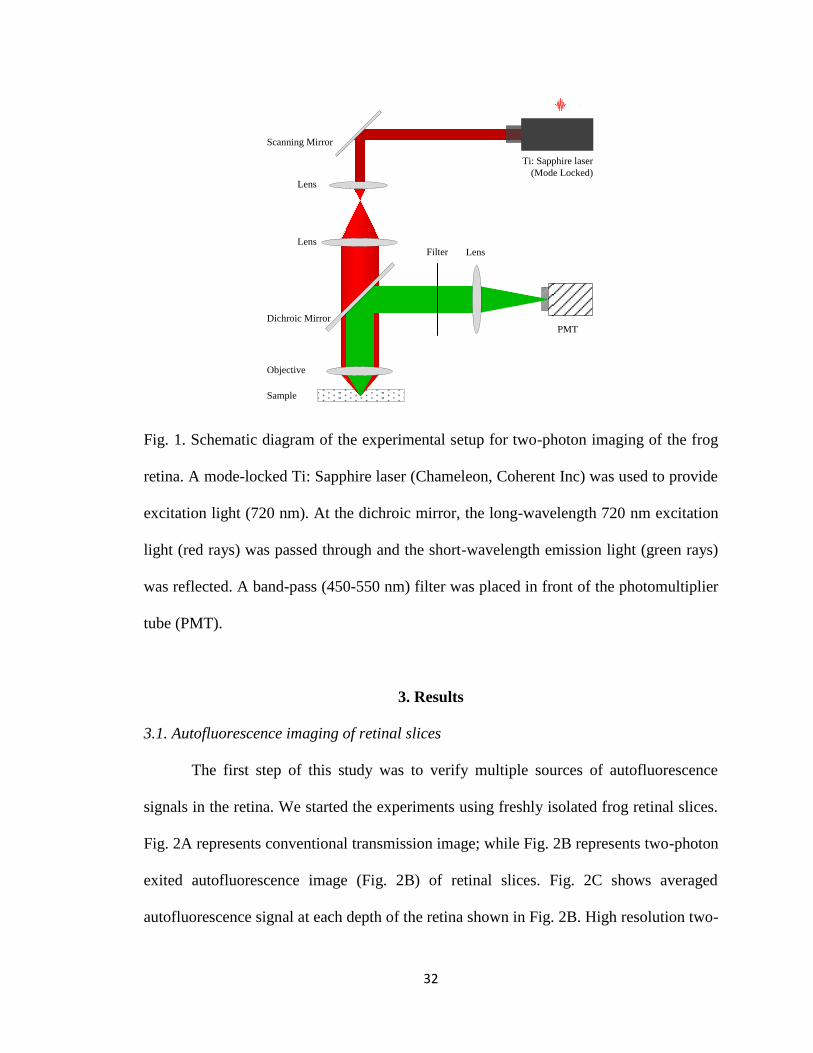
3. Results
3.1. Autofluorescence imaging of retinal slices
The first step of this study was to verify multiple sources of autofluorescence
signals in the retina. We started the experiments using freshly isolated frog retinal slices.
Fig. 2A represents conventional transmission image; while Fig. 2B represents two-photon
exited autofluorescence image (Fig. 2B) of retinal slices. Fig. 2C shows averaged
autofluorescence signal at each depth of the retina shown in Fig. 2B. High resolution two-
33
photon imaging disclosed robust autofluorescence from multiple retinal layers, including
PIO, ONL, OPL, INL, IPL and GCL, with sub-cellular spatial resolution. Retinal slice
experiments indicated that the 720 nm pulse laser can provide autofluorescence excitation
of both photoreceptors and inner retinal cells. In comparison with the conventional
transmission imaging (Fig. 2A), the two-photon autofluorescence measurement (Fig. 2B)
showed significantly improved image contrast, allowing direct observation of single cells
(green arrowheads in Fig. 2B) at individual functional layers, and also fiber like Müller
glial cells that initiated from the GCL and penetrated into inner retinal layers (red
arrowheads in Fig. 2B). Although autofluorescence signals were consistently observed
throughout the retina, the signal efficiency of the outer retina, e.g., PIO, was significantly
higher than that of inner retinal layers (Fig. 2C).
Fig. 2. Autofluorescence imaging of retinal slice. (A) Transmission image of a frog
retinal slice. During the recording, the retinal slice was continuously illuminated by an
infrared (800-1000 nm) light. The PIO, ONL, OPL, INL, IPL, GCL could be directly
differentiated. (B) Representative two-photon fluorescence image of frog retinal slices.
The excitation light was set at 720 nm, and the average power is ~ 5 mW. In this image,
single cellular structures (green arrowheads) were clearly observed in the PIO, ONL,
34
INL, and GCL. Individual Müller glial cells (red arrowheads) were observed. (C)
Averaged autofluorescence (AF) signal at each depth of the retinal slice shown in Fig.
2B.
3.2. Autofluorescence imaging of flat-mounted retinas
The second phase of this study was to test the feasibility of depth-resolved
imaging of two-photon excited autofluorescence in flat-mounted retinas, i.e., isolated but
living retinas. Fig. 3A-F represents two-photon images of the PIO, ONL, OPL, INL, IPL,
and GCL, respectively. Fig. 3G shows a cross-section scan, from the GCL to the PIO, of
the flat-mounted retina. As shown in Fig. 3A, PIO autofluorescence was dominantly
localized at intracellular compartment of individual photoreceptors; while ONL, INL and
GCL autofluorescence images were dominated by extracellular signals, although mixed
intracellular and extracellular patterns were observed. Different brightness of individual
cells, which might reflect variable cell types, was observed. Bright spots were observed
in the OPL and IPL (Fig. 3C and 3E). Mosaic pattern of rod and cone photoreceptors was
clearly observed in Fig. 3A. The rod (blue arrowheads in Fig. 3A) and cone (red
arrowheads in Fig. 3A) photoreceptors could be separated simply based on their cellular
sizes. In general, the outer segment diameter of frog rods (~5-8 mm) is larger than that of
the cones (~1-3 mm) [41, 42]. Moreover, single and double cones could be further
separated (green arrowheads in Fig. 4B). In overall, the cones show brighter
autofluorescence than that of the rods (Fig. 3H).
35
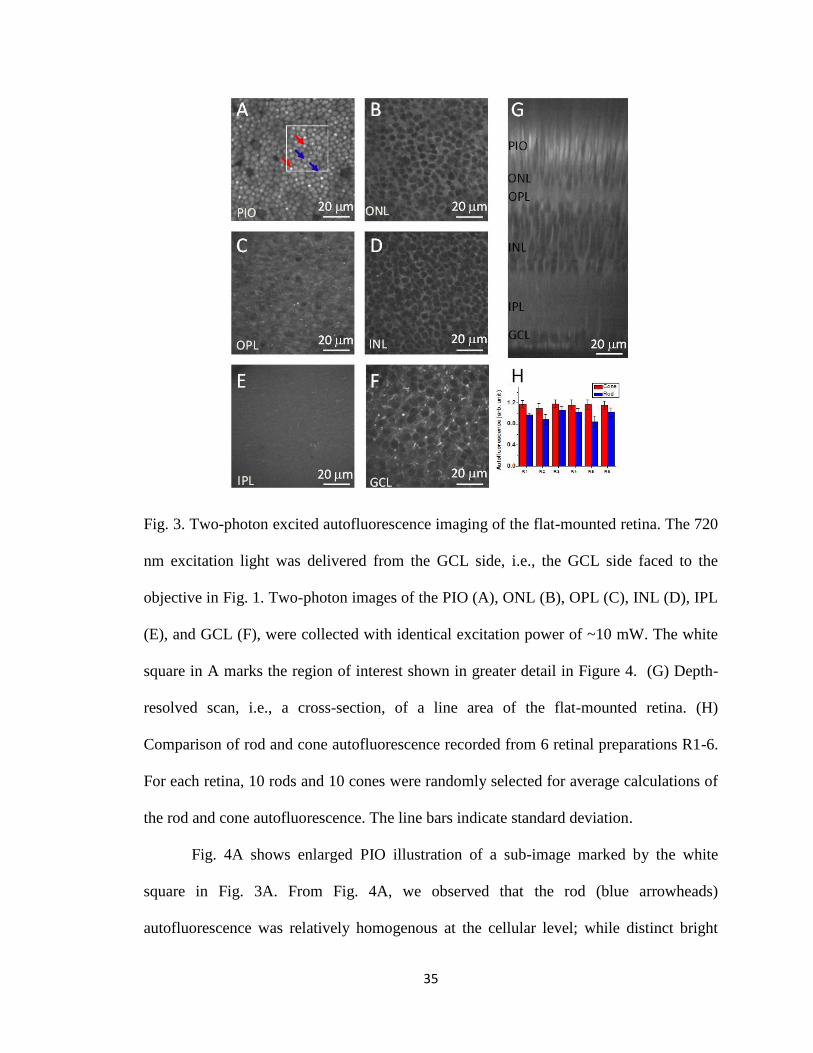
Fig. 3. Two-photon excited autofluorescence imaging of the flat-mounted retina. The 720
nm excitation light was delivered from the GCL side, i.e., the GCL side faced to the
objective in Fig. 1. Two-photon images of the PIO (A), ONL (B), OPL (C), INL (D), IPL
(E), and GCL (F), were collected with identical excitation power of ~10 mW. The white
square in A marks the region of interest shown in greater detail in Figure 4. (G) Depth-
resolved scan, i.e., a cross-section, of a line area of the flat-mounted retina. (H)
Comparison of rod and cone autofluorescence recorded from 6 retinal preparations R1-6.
For each retina, 10 rods and 10 cones were randomly selected for average calculations of
the rod and cone autofluorescence. The line bars indicate standard deviation.
Fig. 4A shows enlarged PIO illustration of a sub-image marked by the white
square in Fig. 3A. From Fig. 4A, we observed that the rod (blue arrowheads)
autofluorescence was relatively homogenous at the cellular level; while distinct bright
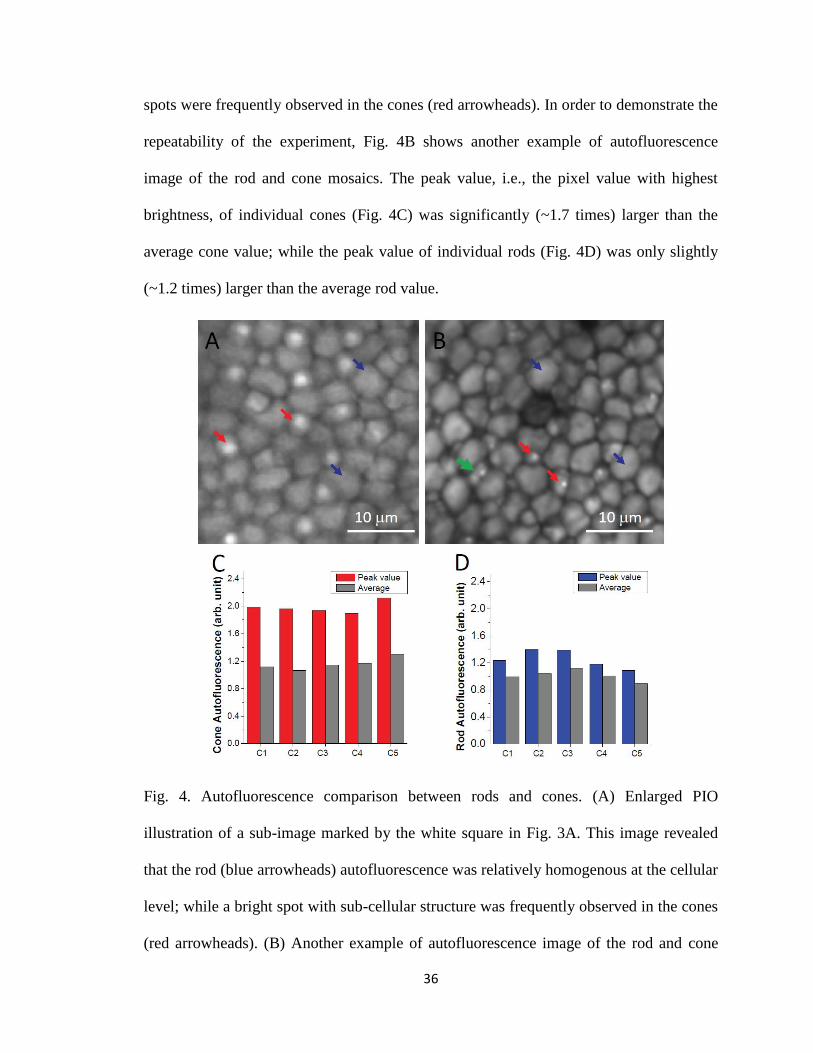
36
spots were frequently observed in the cones (red arrowheads). In order to demonstrate the
repeatability of the experiment, Fig. 4B shows another example of autofluorescence
image of the rod and cone mosaics. The peak value, i.e., the pixel value with highest
brightness, of individual cones (Fig. 4C) was significantly (~1.7 times) larger than the
average cone value; while the peak value of individual rods (Fig. 4D) was only slightly
(~1.2 times) larger than the average rod value.
Fig. 4. Autofluorescence comparison between rods and cones. (A) Enlarged PIO
illustration of a sub-image marked by the white square in Fig. 3A. This image revealed
that the rod (blue arrowheads) autofluorescence was relatively homogenous at the cellular
level; while a bright spot with sub-cellular structure was frequently observed in the cones
(red arrowheads). (B) Another example of autofluorescence image of the rod and cone
37
mosaics. Bright autofluorescence spots were consistently observed in the cones (red
arrowheads) and double cones (green arrowhead). (C) and (D) show peak and average
values of 5 representative cones and 5 rods, respectively.
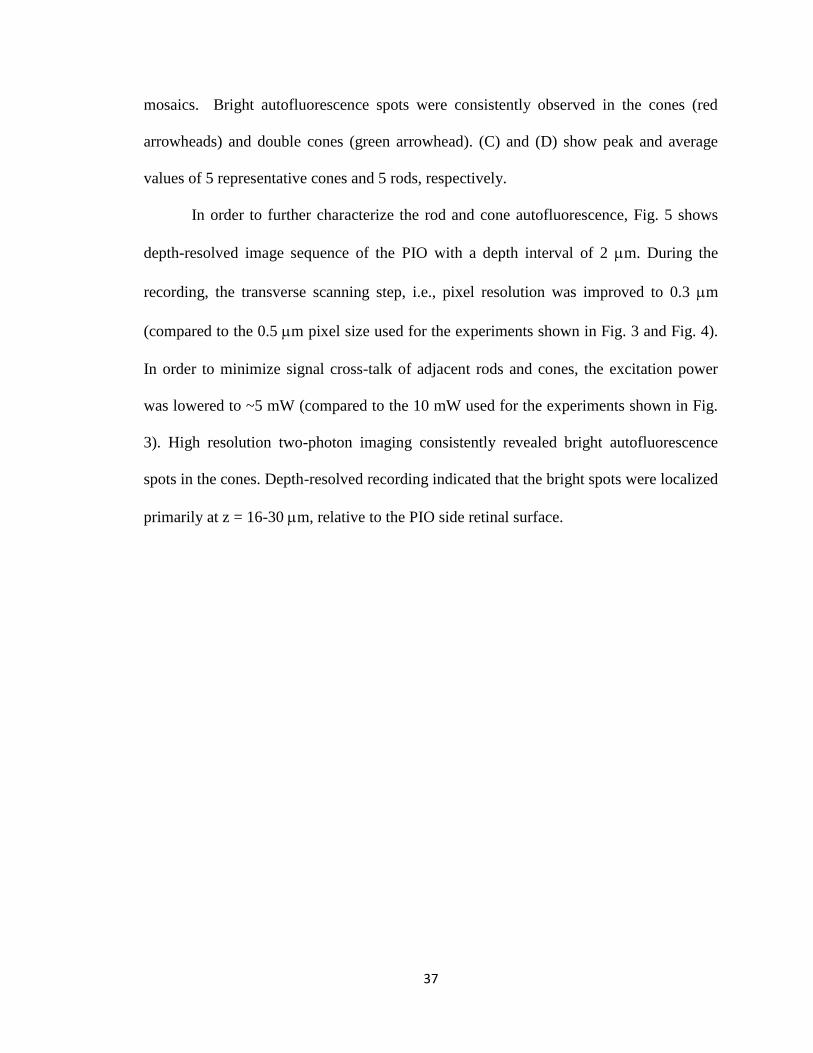
In order to further characterize the rod and cone autofluorescence, Fig. 5 shows
depth-resolved image sequence of the PIO with a depth interval of 2 mm. During the
recording, the transverse scanning step, i.e., pixel resolution was improved to 0.3 mm
(compared to the 0.5 mm pixel size used for the experiments shown in Fig. 3 and Fig. 4).
In order to minimize signal cross-talk of adjacent rods and cones, the excitation power
was lowered to ~5 mW (compared to the 10 mW used for the experiments shown in Fig.
3). High resolution two-photon imaging consistently revealed bright autofluorescence
spots in the cones. Depth-resolved recording indicated that the bright spots were localized
primarily at z = 16-30 mm, relative to the PIO side retinal surface.
38
Fig. 5. Quantitative analysis of PIO autofluorescence. Top panel shows depth-resolved
imaging of the PIO autofluorescence. The images were collected with 2 mm depth
interval and 0.3 mm pixel size. The excitation power was ~5 mW. A bright
autofluorescence spot was frequently observed in the cone. Primary bright spots were
localized at z = 16-30 mm relative to the PIO side retinal surface. Bottom panel is
quantitative comparison of autofluorescence between rods and cones at z = 12-34 mm. At
each depth, 6 rods and 6 cones were used for averaging. The line bars indicate standard
deviation.
3.3. Comparison of autofluorescence signals in retinal slices and flat-mounted retinas.
In retinal slices, the autofluorescence sensitivity of the PIO was significantly
Z=0 mm Z=2 mm Z=4 mm Z=6 mm Z=8 mm Z=10 mm
Z=12 mm Z=14 mm Z=16 mm Z=18 mm Z=20 mm Z=22 mm
Z=24 mm Z=26 mm Z=28 mm Z=30 mm Z=32 mm Z=34 mm
Z=36 mm Z=38 mm Z=40 mm Z=42 mm Z=44 mm Z=46 mm
12 14 16 18 20 22 24 26 28 30 32 34 36
Au
toflu
ore
sce
nce
(a
rb.
un
it)
Retinal depth (mm)
Cone
Rod
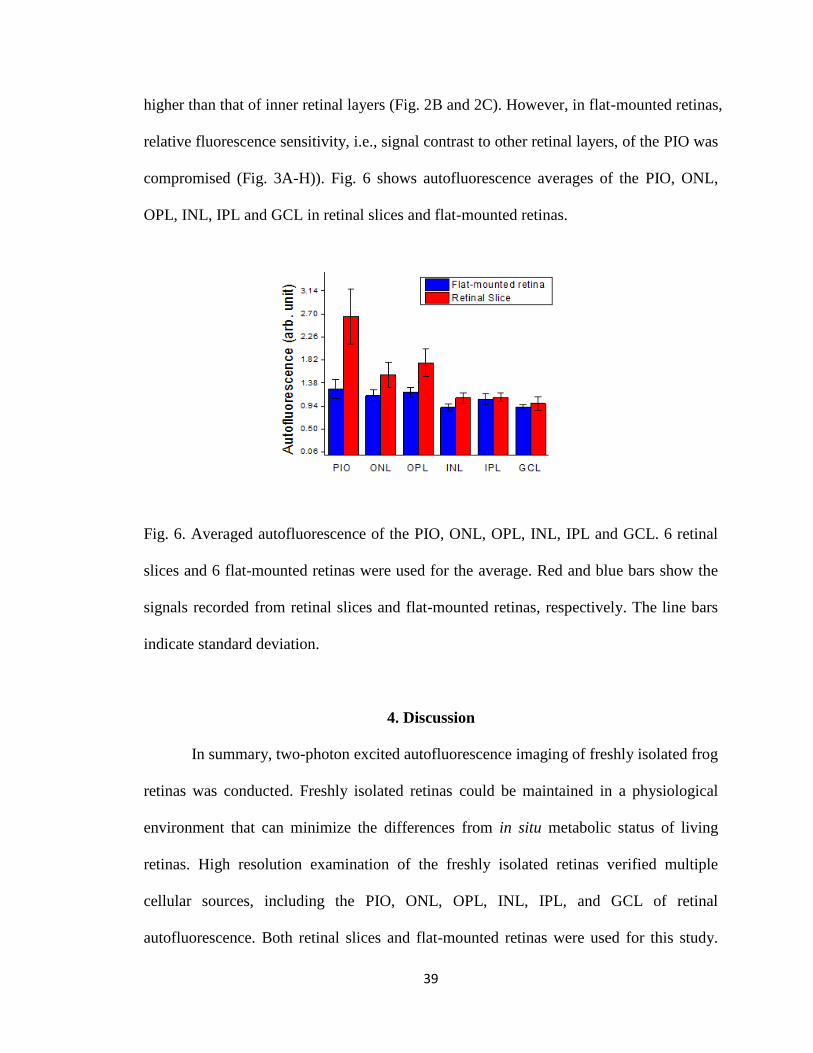
39
higher than that of inner retinal layers (Fig. 2B and 2C). However, in flat-mounted retinas,
relative fluorescence sensitivity, i.e., signal contrast to other retinal layers, of the PIO was
compromised (Fig. 3A-H)). Fig. 6 shows autofluorescence averages of the PIO, ONL,
OPL, INL, IPL and GCL in retinal slices and flat-mounted retinas.
Fig. 6. Averaged autofluorescence of the PIO, ONL, OPL, INL, IPL and GCL. 6 retinal
slices and 6 flat-mounted retinas were used for the average. Red and blue bars show the
signals recorded from retinal slices and flat-mounted retinas, respectively. The line bars
indicate standard deviation.
4. Discussion
In summary, two-photon excited autofluorescence imaging of freshly isolated frog
retinas was conducted. Freshly isolated retinas could be maintained in a physiological
environment that can minimize the differences from in situ metabolic status of living
retinas. High resolution examination of the freshly isolated retinas verified multiple
cellular sources, including the PIO, ONL, OPL, INL, IPL, and GCL of retinal
autofluorescence. Both retinal slices and flat-mounted retinas were used for this study.
40
Two-photon image of the retinal slice revealed that signal efficiency of the PIO was
significantly higher than that of inner retinal layers, although autofluorescence signals
were consistently observed over the whole thickness of the retina (Fig. 2C). In contrast,
autofluorescence sensitivity of the PIO was compromised in flat-mounted retinas (Fig.
3A-H). This might result from reduced light efficiency due to light scattering, absorption,
and aberration, in the flat-mounted retinal preparation.
At the PIO, autofluorescence was dominantly confined to the intracellular
compartment. High-resolution imaging revealed the mosaic organization of rod and cone
photoreceptors, and single and double cones could be identified (Figs. 3 and Fig. 4).
Autofluorescence distribution in the rod outer segment was relatively homogenous; while
sub-cellular bright spots with light intensity well above average level were revealed in the
cone outer segment (Figs. 3 and 4). Early investigations suggested that autofluorescence
signals of outer and inner photoreceptor segments were related to all-trans retinol and
nicotinamide adenine dinucleotide phosphate (NADPH), respectively [14, 23, 26].
However, the observed bright autofluorescence spots in cones might not, at least not
completely, result from the all-trans retinol. These bright spots were frequently observed
at the periphery of the cones (Fig. 4). We speculate that the bright autofluorescence spots
might be related to the connecting cilium (CC), which links the inner segments to the
outer segments. It is well established that the CC constitutes a sort of highway for
proteins, such as rhodopsin, travelling to and from the outer segment [43]. These proteins
might contribute to the observed bright autofluorescence spots by producing
autofluorescence signals directly. Alternatively, the CC might act as a light waveguide to
affect the excitation and collection efficiency of all-trans retinol in sub-cellular locations,
41
relative to the CC axis, in the cone outer segments. Early investigations indicated that the
length of the cone outer segment is 7-13 mm [41], which is consistent with the observed
depth range (~14 mm, i.e., z =16-30 mm in Fig. 5) of the bright autofluorescence spots.
In other retinal layers, both intracellular and extracellular autofluorescence signals
were observed. Cellular structures were clearly observed at the ONL, INL, and GCL,
while bright autofluorescence spots, which might relate to individual nerve terminals,
were observed in the OPL and IPL. According to previous investigations with retina and
other biological tissues, the observed autofluorescence might result from reduced
nicotinamide adenine dinucleotide (NADH) and reduced nicotinamide adenine
dinucleotide phosphate (NADPH), collectively referred to as NAD(P)H, and the oxidized
forms of flavoproteins [14]. Most of the NAD(P)H fluorescence originates from the
mitochondria and can serve as the basis for redox fluorometry. Therefore, pyridine
nucleotides and flavins not only can provide morphological contrast, but may also act as
valuable biomarkers for functional imaging of metabolic activity of living tissues [14].
In conclusion, two-photon imaging of freshly isolated retinas revealed multiple,
intracellular and extracellular, sources of endogenous fluorophores that were
simultaneously excited by the constant-wavelength (720 nm) light from a pulsed laser.
Because autofluorescence signals originated from both outer and inner retinal layers,
signal specificity of fundus autofluorescence imaging is limited and cross-contamination
among different cell types is not negligible. Further investigations are necessary to
understand biophysical and biochemical mechanisms of retinal autofluorescence better.
We are currently pursuing further experiments with mammalian retinas that have a closer
similarity with human retinas to verify the autofluorescence inhomogeneity observed in
42
the frog photoreceptors, and to characterize the autofluorescence mechanisms. In
coordination with variable controls of excitation wavelength and spectral measurement,
advanced investigations of retinal autofluorescence in the retina of animal models may
provide insight in the development of a new imaging methodology for selective
evaluation of the rod, cone, and inner retinal neurons, which may lead to better study and
improved diagnosis of AMD [1, 2], diabetic retinopathy (DR) [3, 4], and glaucoma [5, 6],
retinitis pigmentosa (RP) [44], and other eye diseases that can produce functional
damages of retinal cells.
Acknowledgments
This research is supported by the Dana Foundation (Brain and Immuno-Imaging
Grant program), the Eyesight Foundation of Alabama, the National Institutes of Health
(NIH) (5R21RR025788-02 and 1R21EB012264-01A1), and the National Science
Foundation (CBET-1055889). The two-photon fluorescence images were acquired in the
Neuroimaging Core, which was supported by NIH Neuroscience Blueprint Core Grant
NS57098 to the University of Alabama at Birmingham.
Reference
1. G. R. Jackson, C. Owsley, and C. A. Curcio, "Photoreceptor degeneration and
dysfunction in aging and age-related maculopathy," Ageing Res. Rev. 1, 381-396
(2002).
2. R. E. Hogg, and U. Chakravarthy, "Visual function and dysfunction in early and late
age-related maculopathy," Prog. Retin. Eye. Res. 25, 249-276 (2006).
3. B. Meyer-Rusenberg, M. Pavlidis, T. Stupp, and S. Thanos, "Pathological changes in
human retinal ganglion cells associated with diabetic and hypertensive retinopathy,"
Graefes Arch. Clin. Exp. Ophthalmol. 245, 1009-1018 (2007).
43
4. Y. Qin, G. Xu, and W. Wang, "Dendritic abnormalities in retinal ganglion cells of
three-month diabetic rats," Curr. Eye Res. 31, 967-974 (2006).
5. R. S. Harwerth, and H. A. Quigley, "Visual field defects and retinal ganglion cell
losses in patients with glaucoma," Arch. Ophthalmol. 124, 853-859 (2006).
6. R. W. Nickells, "Ganglion cell death in glaucoma: from mice to men," Vet.
Ophthalmol. 10 Suppl 1, 88-94 (2007).
7. B. Chance, "Pyridine nucleotide as an indicator of the oxygen requirements for
energy-linked functions of mitochondria," Circ. Res. 38, I31-38 (1976).
8. S. Bearelly, A. A. Khanifar, D. E. Lederer, J. J. Lee, J. H. Ghodasra, S. S. Stinnett,
and S. W. Cousins, "Use of Fundus Autofluorescence Images to Predict Geographic
Atrophy Progression," Retina 31, 81-86 (2011).
9. F. C. Delori, C. K. Dorey, G. Staurenghi, O. Arend, D. G. Goger, and J. J. Weiter,
"In-Vivo Fluorescence of the Ocular Fundus Exhibits Retinal-Pigment Epithelium
Lipofuscin Characteristics," Invest. Ophthalmol. Vis. Sci. 36, 718-729 (1995).
10. O. La Schiazza, and J. F. Bille, "High-speed two-photon excited autofluorescence
imaging of ex vivo human retinal pigment epithelial cells toward age-related macular
degeneration diagnostic," J. Biomed. Opt. 13, 064008 (2008).
11. D. Schweitzer, S. Schenke, M. Hammer, F. Schweitzer, S. Jentsch, E. Birckner, W.
Becker, and A. Bergmann, "Towards metabolic mapping of the human retina,"
Microsc. Res. Tech. 70, 410-419 (2007).
12. Y. Imanishi, K. H. Lodowski, and Y. Koutalos, "Two-photon microscopy: Shedding
light on the chemistry of vision," Biochemistry 46, 9674-9684 (2007).
13. J. C. Hwang, D. Y. Kim, C. L. Chou, and S. H. Tsang, "Fundus Autofluorescence,
Optical Coherence Tomography, and Electroretinogram Findings Choroidal
Sclerosis," Retina 30, 1095-1103 (2010)
14. A. Bindewald-Wittich, M. Han, S. Schmitz-Valckenberg, S. R. Snyder, G. Giese, J. F.
Bille, and F. G. Holz, "Two-photon-excited fluorescence imaging of human RPE cells
with a femtosecond Ti : sapphire laser," Invest. Ophthalmol. Vis. Sci. 47, 4553-4557
(2006).
15. Y. Hagiwara, K. Hattori, T. Aoki, H. Ohgushi, and H. Ito, "Autofluorescence
assessment of extracellular matrices of a cartilage-like tissue construct using a
fluorescent image analyser," J. Tissue Eng. Regen. Med. 5, 163-168 (2011).
16. H. Hillman, T. Hussain, and P. Sartory, "Autofluorescence of isolated unfixed rabbit
Deiters' neurons and surrounding neuroglial clamps," Experientia 29, 1113-1115
(1973).
44
17. K. C. Reinert, R. L. Dunbar, W. C. Gao, G. Chen, and T. J. Ebner, "Flavoprotein
autofluorescence imaging of neuronal activation in the cerebellar cortex in vivo,"
Journal of Neurophysiology 92, 199-211 (2004).
18. J. I. Morgan, J. J. Hunter, W. H. Merigan, and D. R. Williams, "The reduction of
retinal autofluorescence caused by light exposure," Invest. Ophthalmol. Vis. Sci. 50,
6015-6022 (2009).
19. J. I. W. Morgan, A. Dubra, R. Wolfe, W. H. Merigan, and D. R. Williams, "In Vivo
Autofluorescence Imaging of the Human and Macaque Retinal Pigment Epithelial
Cell Mosaic," Invest. Ophthalmol. Vis. Sci. 50, 1350-1359 (2009).
20. K. Grieve, and A. Roorda, "Intrinsic signals from human cone photoreceptors,"
Invest. Ophthalmol. Vis. Sci. 49, 713-719 (2008).
21. F. Romero-Borja, K. Venkateswaran, A. Roorda, and T. Hebert, "Optical slicing of
human retinal tissue in vivo with the adaptive optics scanning laser ophthalmoscope,"
Appl. Opt. 44, 4032-4040 (2005).
22. C. H. Chen, E. Tsina, M. C. Cornwall, R. K. Crouch, S. Vijayaraghavan, and Y.
Koutalos, "Reduction of all-trans retinal to all-trans retinol in the outer segments of
frog and mouse rod photoreceptors," Biophys. J. 88, 2278-2287 (2005).
23. Q. Q. Wu, C. H. Chen, and Y. Koutalos, "All-trans retinol in rod photoreceptor outer
segments moves unrestrictedly by passive diffusion," Biophys J 91, 4678-4689
(2006).
24. M. Han, A. Bindewald-Wittich, F. G. Holz, G. Giese, M. H. Niemz, S. Snyder, H.
Sun, J. Y. Yu, M. Agopov, O. La Schiazza, and J. F. Bille, "Two-photon excited
autofluorescence imaging of human retinal pigment epithelial cells," J. Biomed. Opt.
11, 010501 (2006).
25. M. Han, G. Giese, S. Schmitz-Valckenberg, A. Bindewald-Wittich, F. G. Holz, J. Y.
Yu, J. F. Bille, and M. H. Niemz, "Age-related structural abnormalities in the human
retina-choroid complex revealed by two-photon excited autofluorescence imaging," J.
Biomed. Opt. 12, 024012 (2007).
26. J. M. Bueno, E. J. Gualda, and P. Artal, "Adaptive optics multiphoton microscopy to
study ex vivo ocular tissues," J. Biomed. Opt. 15, 066004 (2010).
27. E. J. Gualda, J. M. Bueno, and P. Artal, "Wavefront optimized nonlinear microscopy
of ex vivo human retinas," J. Biomed. Opt. 15, 026007 (2010).
28. L. L. Zhao, J. L. Qu, D. N. Chen, and H. B. Niu, "Layered-resolved autofluorescence
imaging of photoreceptors using two-photon excitation," J. Biomedical Science and
Engineering 2, 363-365 (2009).
45
29. P. Yan, A. Xie, M. Wei, and L. M. Loew, "Amino(oligo)thiophene-based
environmentally sensitive biomembrane chromophores," J. Org. Chem. 73, 6587-
6594 (2008).
30. Y. C. Li, C. Strang, F. R. Amthor, L. Liu, Y. G. Li, Q. X. Zhang, K. Keyser, and X.
C. Yao, "Parallel optical monitoring of visual signal propagation from the
photoreceptors to the inner retina layers," Opt. Lett. 35, 1810-1812 (2010).
31. Y. B. Zhao, and X. C. Yao, "Intrinsic optical imaging of stimulus-modulated
physiological responses in amphibian retina," Opt. Lett. 33, 342-344 (2008).
32. Q. X. Zhang, J. Y. Wang, L. Liu, and X. C. Yao, "Microlens array recording of
localized retinal responses," Opt. Lett. 35, 3838-3840 (2010).
33. X. C. Yao, and Y. B. Zhao, "Optical dissection of stimulus-evoked retinal activation,"
Opt. Express 16, 12446-12459 (2008).
34. Y. G. Li, Q. X. Zhang, L. Liu, F. R. Amthor, and X. C. Yao, "High spatiotemporal
resolution imaging of fast intrinsic optical signals activated by retinal flicker
stimulation," Opt. Express 18, 7210-7218 (2010).
35. Y. G. Li, L. Liu, F. Amthor, and X. C. Yao, "High-speed line-scan confocal imaging
of stimulus-evoked intrinsic optical signals in the retina," Opt. Lett. 35, 426-428
(2010).
36. X. C. Yao, A. Yamauchi, B. Perry, and J. S. George, "Rapid optical coherence
tomography and recording functional scattering changes from activated frog retina,"
Appl. Opt. 44, 2019-2023 (2005).
37. X. C. Yao, and J. S. George, "Near-infrared imaging of fast intrinsic optical responses
in visible light-activated amphibian retina," J. Biomed. Opt. 11, 064030 (2006).
38. X. C. Yao, and J. S. George, "Dynamic neuroimaging of retinal light responses using
fast intrinsic optical signals," Neuroimage 33, 898-906 (2006).
39. P. A. Sieving, K. Murayama, and F. Naarendorp, "Push-pull model of the primate
photopic electroretinogram: a role for hyperpolarizing neurons in shaping the b-
wave," Vis. Neurosci. 11, 519-532 (1994).
40. S. E. Nilsson, "An Electron Microscopic Classification of the Retinal Receptors of the
Leopard Frog (Rana Pipiens)," J. Ultrastruct. Res. 10, 390-416 (1964).
41. P. A. Liebman, and G. Entine, "Visual pigments of frog and tadpole (Rana pipiens),"
Vision Res. 8, 761-775 (1968).
42. V. Ramamurthy, and M. Cayouette, "Development and disease of the photoreceptor
cilium," Clinical Genetics 76, 137-145 (2009).

46
43. A. D. Marmorstein, L. Y. Marmorstein, H. Sakaguchi, and J. G. Hollyfield, "Spectral
profiling of autofluorescence associated with lipofuscin, Bruch's Membrane, and sub-
RPE deposits in normal and AMD eyes," Invest. Ophthalmol. Vis. Sci. 43, 2435-2441
(2002).
44. T. Wakabayashi, M. Sawa, F. Gomi, and M. Tsujikawa, "Correlation of fundus
autofluorescence with photoreceptor morphology and functional changes in eyes with
retinitis pigmentosa," Acta. Ophthalmol. 88, e177-183 (2010).
47
INVESTIGATION OF THE HYPER-REFLECTIVE INNER/OUTER SEGMENT
BAND IN OPTICAL COHERENCE TOMOGRAPHY OF LIVING FROG RETINA
by
RONGWEN LU, CHRISTINE A. CURCIO, YOUWEN ZHANG, QIUXIANG ZHANG,
STEVEN J. PITTLER, DUSANKA DERETIC AND XINCHENG YAO
Journal of Biomedical Optics 17 (6), 0605041-0605043
Copyright
2012
by
SPIE
Used by permission
Format adapted and errata corrected for dissertation
48
Abstract
This study is to test anatomic correlates, including connecting cilium (CC) and
inner segment (IS) ellipsoid, to the hyper-reflective band visualized by optical coherence
tomography (OCT) and commonly attributed to the photoreceptor inner/outer segment
(IS/OS) junction. A line-scan OCT (LS-OCT) was constructed to achieve sub-cellular
resolution (lateral: ~2 mm; axial: ~4 mm) of excised living frog retinas. An electro-optic
phase modulator was employed for rapid and vibration-free phase modulation.
Comparison of normalized distance measurements between LS-OCT images and
histological images revealed that the dominant source of the signal reported as the ‘IS/OS’
OCT band actually originates from the IS.
Body of the paper
Given the excellent capability to identify morphological changes at individual
functional layers of the retina, optical coherence tomography (OCT) has increasing
application in eye disease detection [1]. In-depth understanding of anatomic sources of
the OCT signal is essential for accurate interpretation of clinical outcomes, and is
valuable for instrument optimization to improve imaging sensitivity and selectivity. Early
studies have disclosed four hyper-reflective OCT bands at the outer retina, i.e.
photoreceptor side. Anatomic sources of these four OCT bands have been typically
attributed as follows: first (1st) band at the outer limiting membrane (OLM); second (2
nd)
band at the photoreceptor inner/outer-segment (IS/OS) junction; third (3rd
) band at the
posterior tip of the OS; and fourth (4th
) band at the retinal pigment epithelium (RPE) [2].
Anatomic correlates of the 2nd
band remains controversial. The 2nd
OCT band is widely
49
attributed to the IS/OS junction, which cell biologists consider the connecting cilium (CC)
between these structures. However, comparative alignment of OCT bands with an
anatomically correct model of the outer retina suggested an alternative correlate, i.e., the
IS ellipsoid [3], to the 2nd
OCT band. Previous investigation has indicated that the
physiological condition may affect the 2nd
OCT band recording [4]. Therefore, freshly
isolated living retinas were used for OCT imaging.
Leopard (Rana Pipiens) frog was selected for this study. Large photoreceptors
(cone: ~3 mm and rod: ~6 mm) [5] of the frog enabled accurate OCT recording at sub-
cellular resolution. The experimental procedures were approved by the Institutional
Animal Care and Use Committee of the University of Alabama at Birmingham. Without
complications of ocular aberrations and signal contamination of other ocular tissues,
isolated retinas provided a simple preparation to allow high resolution OCT
characterization of the retina. Details of the preparation procedures of freshly isolated
living retinas, which have been used to investigate stimulus-evoked retinal neural
activities, have been previously reported [6, 7]. During the OCT imaging, the isolated
retina was immersed in oxygenated Ringer’s solution to maintain its viability.
In order to achieve sub-cellular resolution in both lateral and axial directions, a
rapid line-scan OCT (LS-OCT) was developed. The LS-OCT combined technical merits
of our recently demonstrated electro-optic phase modulator (EOPM) based functional
OCT [6] and line-scan confocal microscopy [7]. Figure 1 shows a simplified diagram of
the LS-OCT. In this system, a near infrared superluminescent laser diode (SLD-35-HP,
Superlum), with center wavelength 830 nm and bandwidth =60 nm, was used for
light illumination. A water immersion objective (10X, NA=0.3) was applied for OCT
50
imaging. The lateral resolution of the system was estimated at ~2 mm (0.61/NA), and
the axial resolution of the LS-OCT was ~4 mm (0.442/n, where refractive index n of
the sample was assumed ~1.4).
In the illumination path (optics above the beam splitter BS, Fig.1a), a cylindrical
lens CL1 was employed to condense the collimated SLD light in one dimension to
produce a focused line illumination which was imaged at the retina through lenses L3, L4,
L5 and the objective OB. The long axis of the focused line was parallel to the y-axis in
the OCT image (Fig. 2a). The active area of the high-speed (70,000 lines/s) linear camera
(spL2048-140k, Basler Sprint) was conjugated to the focused line illumination. The line-
sensor (1 x 2048 pixels, 10 mm x 10 mm) of the linear camera naturally acted as a spatial-
filter to reject out-of-focus light. Thus, a LS confocal mechanism was achieved to reduce
background light and therefore maximize effective OCT contrast and dynamic range.
In the reference path (optics below the BS, Fig.1a), another cylindrical lens CL2 was
used to convert the focused light back to a collimated light beam before entering the
EOPM (Model 350-50, Conoptics) that was used to generate rapid vibration- and inertia-
free phase modulation [6]. A four-step phase-shifting strategy was employed to retrieve
OCT images [8]. The glass block in the reference arm was used to compensate for optical
dispersion of the sample beam. Fig. 1b shows side view of the illumination and reference
paths (dashed square in Fig. 1a). In the side view, the cylindrical lenses CL1 and CL2
acted as a pair of glass plates.
Our custom-designed LS-OCT provided both en-face and B-scan recording
capabilities. The galvo scanning mirror (GVS001, Thorlabs) could provide rapid en-face
(Fig. 2a) imaging up to 400 Hz; while the motorized sample platform (Z825B, Thorlabs)
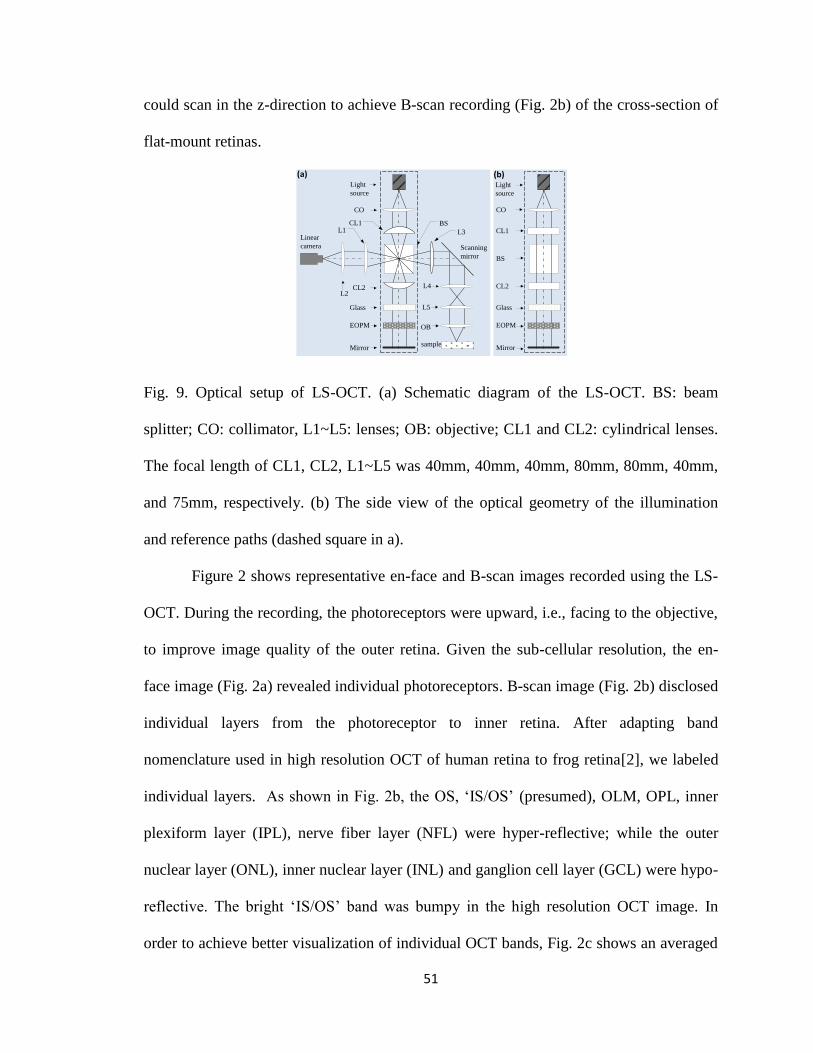
51
could scan in the z-direction to achieve B-scan recording (Fig. 2b) of the cross-section of
flat-mount retinas.
Fig. 9. Optical setup of LS-OCT. (a) Schematic diagram of the LS-OCT. BS: beam
splitter; CO: collimator, L1~L5: lenses; OB: objective; CL1 and CL2: cylindrical lenses.
The focal length of CL1, CL2, L1~L5 was 40mm, 40mm, 40mm, 80mm, 80mm, 40mm,
and 75mm, respectively. (b) The side view of the optical geometry of the illumination
and reference paths (dashed square in a).
Figure 2 shows representative en-face and B-scan images recorded using the LS-
OCT. During the recording, the photoreceptors were upward, i.e., facing to the objective,
to improve image quality of the outer retina. Given the sub-cellular resolution, the en-
face image (Fig. 2a) revealed individual photoreceptors. B-scan image (Fig. 2b) disclosed
individual layers from the photoreceptor to inner retina. After adapting band
nomenclature used in high resolution OCT of human retina to frog retina[2], we labeled
individual layers. As shown in Fig. 2b, the OS, ‘IS/OS’ (presumed), OLM, OPL, inner
plexiform layer (IPL), nerve fiber layer (NFL) were hyper-reflective; while the outer
nuclear layer (ONL), inner nuclear layer (INL) and ganglion cell layer (GCL) were hypo-
reflective. The bright ‘IS/OS’ band was bumpy in the high resolution OCT image. In
order to achieve better visualization of individual OCT bands, Fig. 2c shows an averaged
(a) (b)
EOPM
Light
source
CO
Mirror
Glass
CL1
CL2
BS
EOPM
Linear
camera
Light
source
CO
Mirror
Scanning
mirror
BSCL1
Glass
L1
L2L4
L5
OB
sample
L3
CL2
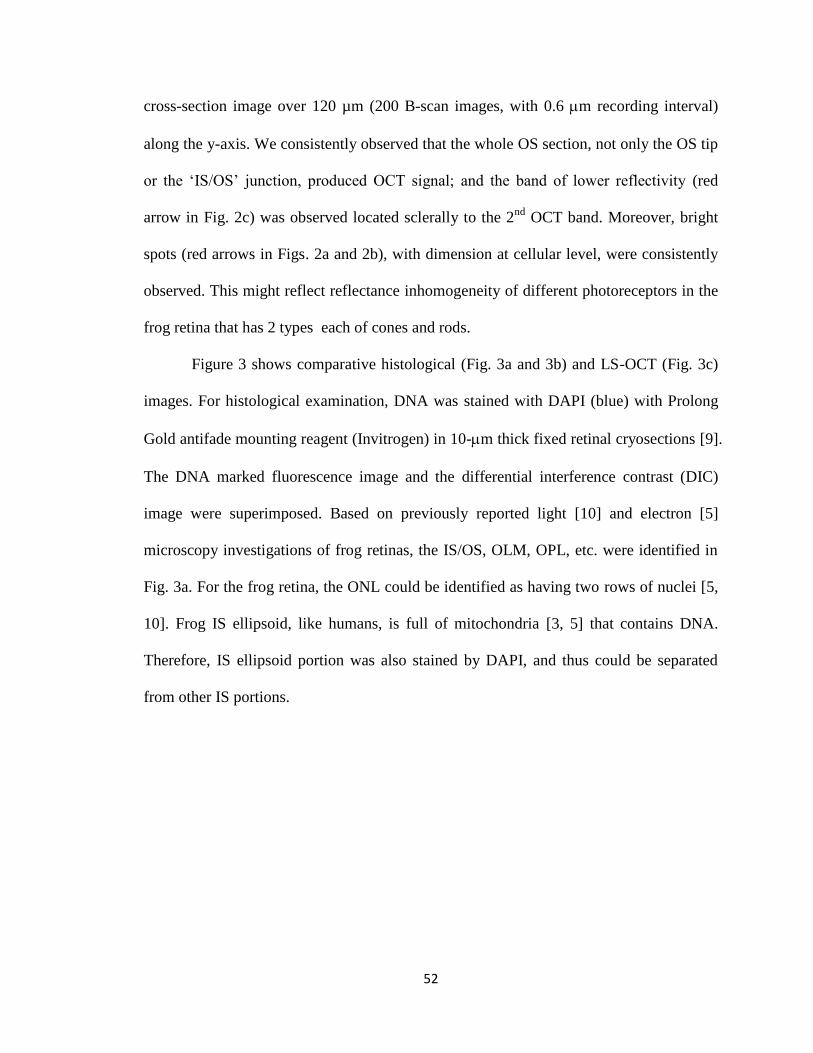
52
cross-section image over 120 µm (200 B-scan images, with 0.6 mm recording interval)
along the y-axis. We consistently observed that the whole OS section, not only the OS tip
or the ‘IS/OS’ junction, produced OCT signal; and the band of lower reflectivity (red
arrow in Fig. 2c) was observed located sclerally to the 2nd
OCT band. Moreover, bright
spots (red arrows in Figs. 2a and 2b), with dimension at cellular level, were consistently
observed. This might reflect reflectance inhomogeneity of different photoreceptors in the
frog retina that has 2 types each of cones and rods.
Figure 3 shows comparative histological (Fig. 3a and 3b) and LS-OCT (Fig. 3c)
images. For histological examination, DNA was stained with DAPI (blue) with Prolong
Gold antifade mounting reagent (Invitrogen) in 10-mm thick fixed retinal cryosections [9].
The DNA marked fluorescence image and the differential interference contrast (DIC)
image were superimposed. Based on previously reported light [10] and electron [5]
microscopy investigations of frog retinas, the IS/OS, OLM, OPL, etc. were identified in
Fig. 3a. For the frog retina, the ONL could be identified as having two rows of nuclei [5,
10]. Frog IS ellipsoid, like humans, is full of mitochondria [3, 5] that contains DNA.
Therefore, IS ellipsoid portion was also stained by DAPI, and thus could be separated
from other IS portions.
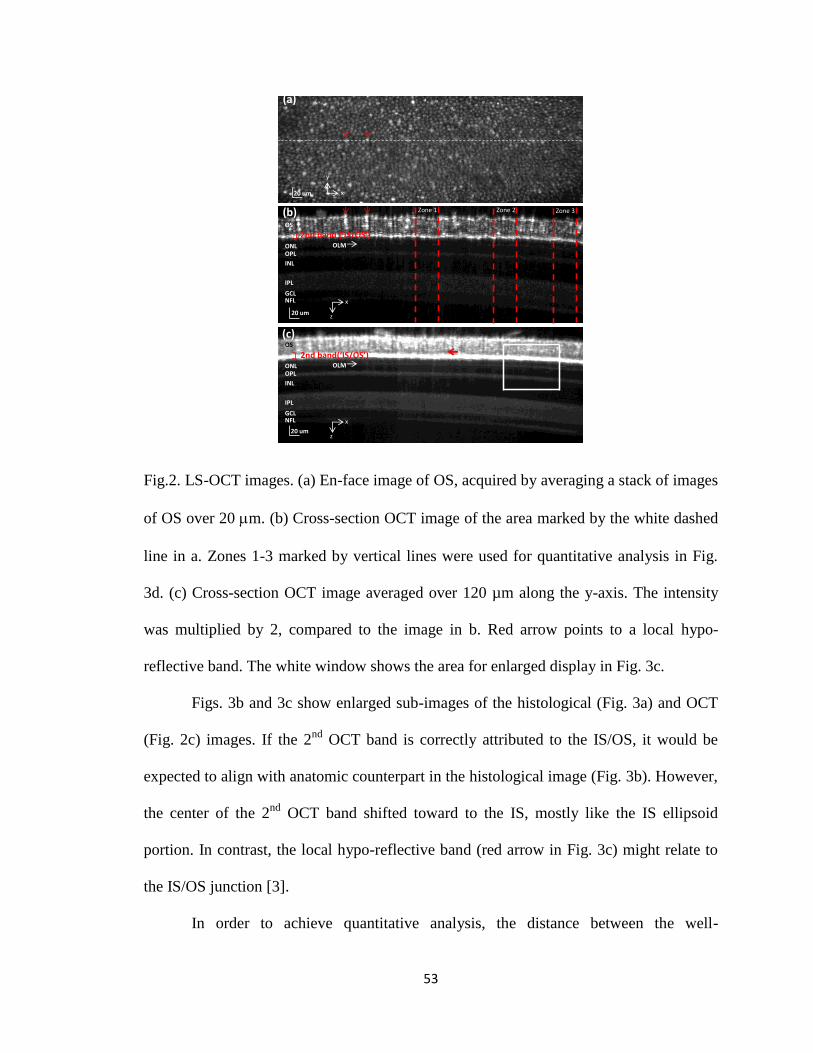
53
Fig.2. LS-OCT images. (a) En-face image of OS, acquired by averaging a stack of images
of OS over 20 mm. (b) Cross-section OCT image of the area marked by the white dashed
line in a. Zones 1-3 marked by vertical lines were used for quantitative analysis in Fig.
3d. (c) Cross-section OCT image averaged over 120 µm along the y-axis. The intensity
was multiplied by 2, compared to the image in b. Red arrow points to a local hypo-
reflective band. The white window shows the area for enlarged display in Fig. 3c.
Figs. 3b and 3c show enlarged sub-images of the histological (Fig. 3a) and OCT
(Fig. 2c) images. If the 2nd
OCT band is correctly attributed to the IS/OS, it would be
expected to align with anatomic counterpart in the histological image (Fig. 3b). However,
the center of the 2nd
OCT band shifted toward to the IS, mostly like the IS ellipsoid
portion. In contrast, the local hypo-reflective band (red arrow in Fig. 3c) might relate to
the IS/OS junction [3].
In order to achieve quantitative analysis, the distance between the well-
Zone 1 Zone 2 Zone 3(b)
x
z
OS
ONLOPL
INL
IPL
GCLNFL
OLM
2nd band (‘IS/OS’)
20 um
20 um x
y
(a)
(c)
20 um
x
z
OS
ONLOPL
INL
IPL
GCLNFL
OLM
2nd band(‘IS/OS’)
54
established OLM and OPL bands were used to normalize the axial position of the 2nd
OCT band. Fig. 3d shows 3 representative OCT longitudinal reflectance profiles (LRPs)
as a function of retinal depth for three zones specified in Fig. 2b. Each zone was averaged
over 50 mm along the x-axis to improve signal to noise ratio. In theory, the OCT bands
could be widened due to the logarithmic transformation or gamma correction of OCT
displaying [3]. However, neither the logarithmic transformation nor gamma correction
shifts the peaks. Therefore, the positions on the z-axis of peaks of the ‘IS/OS’ (2nd
) band,
the OLM (1st) band and the OPL band could be defined as their axial positions. Thus,
OCT distance ratio (OCT’IS/OS’-OCTOLM)/(OCTOLM-OCTOPL) could be quantitatively
computed and compared to histological distance ratio of (HIS/OS-HOLM)/(HOLM-HOPL).
Fig. 3e shows statistics of OCT and histological distance ratios. Five retinas were
used for OCT imaging, and corresponding five retinas were used for histology
measurement. For each sample, six lateral positions were measured for estimating the
distance ratio. As shown in Fig. 3e, the histological distance ratio of (HIS/OS-
HOLM)/(HOLM-HOPL) was 1.0±0.05. In contrast, the mean of (OCT’IS/OS’-
OCTOLM)/(OCTOLM-OCTOPL) was 0.6±0.1. The significant difference (t-test, p<0.003)
between the (OCT’IS/OS’-OCTOLM)/(OCTOLM-OCTOPL) and (HIS/OS-HOLM)/(HOLM-HOPL)
suggested that the 2nd
OCT band might not actually relate to the IS/OS junction.
55
Fig. 3. Comparison between OCT and histological images. (a) Histological image. (b)
Enlarged sub-image marked by the white window in Fig. 3a. (c) Enlarged image of OCT
sub-image marked by the white window in Fig. 2c. Four red bars in Fig. 3b and Fig. 3c
have identical length. (d) Curves of OCT intensity over retinal depth (z axis) of three
zones in Fig. 2b. The red arrow points to the local hypo-reflective band, bordering
posteriorly on the ‘IS/OS’ band (red arrows in Figs. 2c and 3c). (e) Histological distance
ratio (HIS/OS-HOLM)/(HOLM-HOPL) and the OCT distance ratio (OCT’IS/OS’-
OCTOLM)/(OCTOLM-OCTOPL). Five samples were used for histological and OCT
measurements, respectively. For each sample, six positions were measured. Error bars
indicate standard deviations.
In summary, a LS-OCT was developed to demonstrate OCT imaging at sub-
cellular resolution in both lateral (Fig. 2a) and axial (Fig. 2b) directions. Quantitative
comparison of histological images and LS-OCT images revealed that the OCT distance
ratio (OCT’IS/OS’-OCTOLM)/(OCTOLM-OCTOPL) was significantly smaller than the
histological distance ratio (HIS/OS-HOLM)/(HOLM-HOPL). The significant difference
suggests that dominant source of the signal reported as the ‘IS/OS’ OCT band actually
originates from the IS. We speculate that the IS ellipsoid, which consists of abundant
mitochondria, or the CC extended into the IS [11] may contribute to the observed 2nd
300
200
100
0
zo
ne
3
zo
ne
2
zo
ne
1
OCT Intensity
Z(m
m)
0.0
0.2
0.4
0.6
0.8
1.0
1.2histologyOCT
Ra
tio
(d)
OPL
OLM
‘IS/OS’
(a) (c)IS ellipsoidIS/OS
2nd band (‘IS/OS’)
OLM
ONL
OPL
INL
(e)
ONL
INL
OPL
IPL
GCL
OS
IS
(b)
20 um
IS/OS
OLM
56
OCT band signal.
Moreover, reflectance inhomogeneity was consistently observed at cellular level
(Figs. 2a and 2b). The bumpy 2nd
OCT band shown in Fig. 2b, might attribute to variable
lengths and axial locations of different rod/cone photoreceptors [5]. Robust OCT signal
was observed through the whole length of the photoreceptor outer segment. Early
spectral-domain OCT study (SD-OCT) did not report OCT signal in the outer segment,
i.e., the depth between the presumed ‘IS/OS’ band and the posterior tip of the OS [2]. We
speculate that this discrepancy might attribute to large (0.3) numeric aperture (NA) of the
LS-OCT system, compared to ~ 0.1 NA in typical SD-OCT system for retinal imaging.
Increased NA could improve collection efficiency of reflected light, particularly
scattering light with possible large angle changes, relative to incident light, from outer
segment discs. In addition, the large NA system might produce illumination light with
incident angle greater than the optimized acceptance of the photoreceptor, which acted as
a waveguide [12]. Therefore, more light might be scattered and thus detected from the OS.
We expect that further characterization of these observed OCT signals will provide
insight for improved instrumental design, validated image attribution, and retinal
diagnosis.
The authors thank Jerry Millican and Yangguo Li for mechanical fabrication and
prototype construction of the LS-OCT. This research is supported partially by Dana
Foundation (Brain and Immuno-Imaging Grant program); Eyesight Foundation of
Alabama, NSF CBET-1055889, NIH R21 RR025788, NIH R21 EB012264, NIH R01
EY018143 and Vision Sciences Core grant NIH P30 EY03039.
57
Reference
1. D. C. Hood, X. Zhang, R. Ramachandran, C. L. Talamini, A. Raza, J. P. Greenberg, J.
Sherman, S. H. Tsang, and D. G. Birch, "The inner segment/outer segment border
seen on optical coherence tomography is less intense in patients with diminished cone
function," Investigative ophthalmology & visual science 52, 9703-9709 (2011).
2. D. T. Miller, O. P. Kocaoglu, Q. Wang, and S. Lee, "Adaptive optics and the eye
(super resolution OCT)," Eye (Lond) 25, 321-330 (2011).
3. R. F. Spaide and C. A. Curcio, "Anatomical correlates to the bands seen in the outer
retina by optical coherence tomography: literature review and model," Retina 31,
1609-1619 (2011).
4. Y. Yamauchi, H. Yagi, Y. Usui, K. Kimura, T. Agawa, R. Tsukahara, N. Yamakawa,
and H. Goto, "Biological activity is the likely origin of the intersection between the
photoreceptor inner and outer segments of the rat retina as determined by optical
coherence tomography," Clin Ophthalmol 5, 1649-1653 (2011).
5. S. E. Nilsson, "An Electron Microscopic Classification of the Retinal Receptors of the
Leopard Frog (Rana Pipiens)," Journal of ultrastructure research 10, 390-416 (1964).
6. X. C. Yao, A. Yamauchi, B. Perry, and J. S. George, "Rapid optical coherence
tomography and recording functional scattering changes from activated frog retina,"
Applied optics 44, 2019-2023 (2005).
7. Y. G. Li, L. Liu, F. Amthor, and X. C. Yao, "High-speed line-scan confocal imaging
of stimulus-evoked intrinsic optical signals in the retina," Optics letters 35, 426-428
(2010).
8. J. M. Huntley, G. H. Kaufmann, and D. Kerr, "Phase-shifted dynamic speckle pattern
interferometry at 1 kHz," Applied optics 38, 6556-6563 (1999).
9. Y. Zhang, L. L. Molday, R. S. Molday, S. S. Sarfare, M. L. Woodruff, G. L. Fain, T.
W. Kraft, and S. J. Pittler, "Knockout of GARPs and the beta-subunit of the rod
cGMP-gated channel disrupts disk morphogenesis and rod outer segment structural
integrity," Journal of cell science 122, 1192-1200 (2009).
10. J. Mazelova, N. Ransom, L. Astuto-Gribble, M. C. Wilson, and D. Deretic, "Syntaxin
3 and SNAP-25 pairing, regulated by omega-3 docosahexaenoic acid, controls the
delivery of rhodopsin for the biogenesis of cilia-derived sensory organelles, the rod
outer segments," Journal of cell science 122, 2003-2013 (2009).
11. Q. Liu, G. Tan, N. Levenkova, T. Li, E. N. Pugh, Jr., J. J. Rux, D. W. Speicher, and
E. A. Pierce, "The proteome of the mouse photoreceptor sensory cilium complex,"
Molecular & cellular proteomics : MCP 6, 1299-1317 (2007).

58
12. C. W. Stiles and B. L. Crawford, "The luminous efficiency of rays entering the eye
pupil at different points," Proc R Soc Lond B. 112, 428-450 (1933).
59
DYNAMIC NEAR-INFRARED IMAGING REVEALS TRANSIENT PHOTOTROPIC
CHANGE IN RETINAL ROD PHOTORECEPTORS
by
RONGWEN LU, ALEXANDER M. LEVY, QIUXIANG ZHANG, STEVEN J
PITTLER AND XINCHENG YAO
Journal of Biomedical Optics 18(10), 106013-106013, 2013
Copyright
2013
by
SPIE
Used by permission
Format adapted and errata corrected for dissertation
60
Abstract
Stiles-Crawford effect (SCE) is exclusively observed in cone photoreceptors, but
why the SCE is absent in rod photoreceptors is still a mystery. In this study, we employed
dynamic near infrared (NIR) light imaging to monitor photoreceptor kinetics in freshly
isolated frog and mouse retinas stimulated by oblique visible light flashes. It was
observed that retinal rods could rapidly (onset: ~10 ms for frog and 5 ms for mouse; time-
to-peak: ~200 ms for frog and 30 ms for mouse) shift toward the direction of the visible
light, which might quickly compensate for the loss of luminous efficiency due to oblique
illumination. In contrast, such directional movement was negligible in retinal cones.
Moreover, transient rod phototropism could contribute to characteristic intrinsic optical
signal (IOS). We anticipate that further study of the transient rod phototropism may not
only provide insight into better understanding of the nature of vision but also promise an
IOS biomarker for functional mapping of rod physiology at high resolution.
Keywords: Stiles-Crawford effect; phototropism; photoreceptor; directional illumination
1 Introduction
The Stiles-Crawford effect (SCE) states that luminance efficiency is dependent on
incident light direction relative to the eye axis.(1) It is well established that the retina is
more sensitive to light entering the center of the pupil, i.e., parallel light relative to eye
axis, than light passing through the periphery, i.e., oblique light illumination. The SCE is
exclusively observed in cones, which can benefit good vision quality by suppressing
intraocular stray light under photopic conditions.(2) In contrast, the SCE has not been
detected in rods which dominates scotopic vision.(2) In other words, the absorption
61
efficiency of light by rods is not affected by the incident angle in early SCE studies which
were performed with psychophysical methods.(2) The biophysical mechanisms
underlying this rod/cone difference are not established. In this study, we conducted
dynamic near infrared (NIR) light imaging to explore transient changes in rod and cone
photoreceptors activated by oblique light stimuli. High-spatial (mm) and high-temporal
(ms) resolution NIR imaging revealed that 80% of rods could rapidly move toward the
direction of oblique stimulus light, while such directional movement was negligible in
cones. Our experimental results suggest that transient phototropic adaptation may quickly
compensate for the loss of luminous efficiency in rods activated by oblique stimulation,
which can explain the absence of the SCE in the rod system. The observed transient
phototropic adaptation of retinal rods not only provides insight into the nature of vision
but also promises an intrinsic optical signal (IOS) biomarker. This would enable
noninvasive, high-resolution assessment of rod function, which is known to be more
vulnerable than cone function in aging and early age-related macular degeneration
(AMD),(3, 4) the most common cause of severe vision loss and legal blindness in adults
over 50.(3, 5)
2 Materials and Methods
2.1 Retina preparation
Animal handling was approved by the Institutional Animal Care and Use
Committee of the University of Alabama at Birmingham. Both frog (Rana pipiens) and
mouse (Mus musculus) retinas were used to demonstrate the transient phototropic
adaptation in the retina.
62
Frog retinas were selected as primary specimens in this study for several reasons.
First, the relatively large size of frog (compared to mouse or other mammalian)
photoreceptors allows unambiguous observation of individual photoreceptors. Second,
the diameter of frog rods (~5-8 mm) is much larger than cones (~1-3 mm),(6, 7) and thus
rod and cone photoreceptors can be easily separated based on their cellular diameters.
Third, rod and cone numbers are roughly equal in frog retinas,(6, 7) and thus unbiased
analysis of rod and cone cells can be readily achieved. Preparation procedures of fresh
living whole-mount frog retinas have been reported in previous publications.(8) Briefly,
the frog was euthanized by rapid decapitation and double pithing. After enucleating the
intact eye we hemisected the globe below the equator with fine scissors. The lens and
anterior structures were removed before the retina was separated from the retinal pigment
epithelium.
Mouse retinas were used to verify the transient phototropic adaptation in
mammalians. 5-month-old wild type mice, which have been maintained for more than 20
generations from an original cross of C57Bl/6J to 129/SvEv, were used in this study. The
rd1 allele that segregated in the 129/ SvEv stock was removed by genetic crossing and
verified as previously described.(9) Protocols for handling mouse samples were
previously reported.(10) Briefly, after the eyeball was enucleated from anesthetized mice,
the retina was isolated from the eyeball in Ames media and then transferred to a
recording chamber. During the experiment, the sample was continuously super-fused
with oxygenated bicarbonate-buffered Ames medium, maintained at pH 7.4 and 33~37
οC.
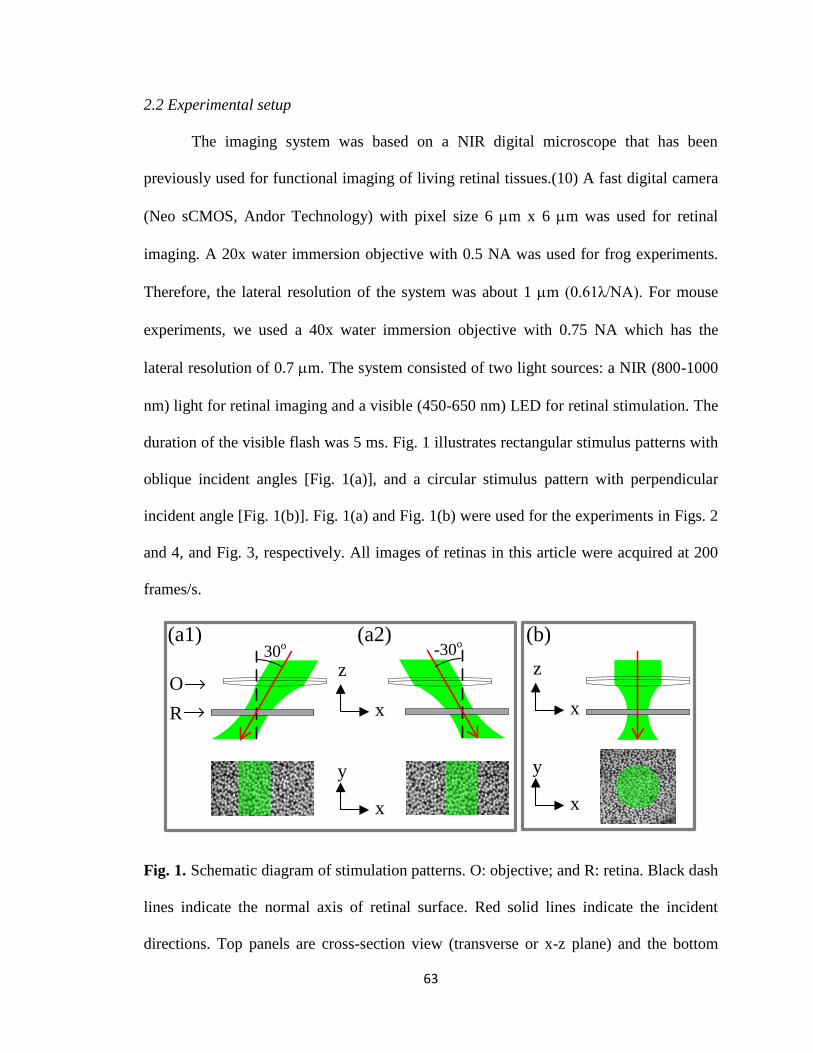
63
2.2 Experimental setup
The imaging system was based on a NIR digital microscope that has been
previously used for functional imaging of living retinal tissues.(10) A fast digital camera
(Neo sCMOS, Andor Technology) with pixel size 6 mm x 6 mm was used for retinal
imaging. A 20x water immersion objective with 0.5 NA was used for frog experiments.
Therefore, the lateral resolution of the system was about 1 mm (0.61λ/NA). For mouse
experiments, we used a 40x water immersion objective with 0.75 NA which has the
lateral resolution of 0.7 mm. The system consisted of two light sources: a NIR (800-1000
nm) light for retinal imaging and a visible (450-650 nm) LED for retinal stimulation. The
duration of the visible flash was 5 ms. Fig. 1 illustrates rectangular stimulus patterns with
oblique incident angles [Fig. 1(a)], and a circular stimulus pattern with perpendicular
incident angle [Fig. 1(b)]. Fig. 1(a) and Fig. 1(b) were used for the experiments in Figs. 2
and 4, and Fig. 3, respectively. All images of retinas in this article were acquired at 200
frames/s.
Fig. 1. Schematic diagram of stimulation patterns. O: objective; and R: retina. Black dash
lines indicate the normal axis of retinal surface. Red solid lines indicate the incident
directions. Top panels are cross-section view (transverse or x-z plane) and the bottom
(b)(a1) (a2)30o -30o
O
R
x
y
x
z
x
y
x
z
64
panels are enface view (axial or x-y plane). (a1) Rectangular stimulus (bottom panel)
with 30o incident angle with respect to the normal axis of retinal surface (top panel). (a2)
Rectangular stimulus (bottom panel) with -30o incident angle (top panel). (b) Circular
stimulus (bottom panel) with 0o incident angle (top panel). The retina was placed with the
ganglion cell layer (GCL) facing toward the objective.
2.3 Dynamic calculation of individual photoreceptor movements
In order to quantify transient phototropic changes in rod and cone systems, we
calculated the displacement of individual rods [Figs. 2(b) and 4(b) ] and cones [Fig.
2(b)].The level-set method (11) was used to identify the morphological edge of individual
rods and cones. Then the weight centroid was calculated dynamically, allowing accurate
registration of the location of individual photoreceptors at nm resolution. The same
strategy has been used in stochastic optical reconstruction microscopy (STORM) (12)
and photoactivated localization microscopy (PALM) (13, 14) to achieve nm resolution to
localize individual molecules with photo-switchable fluorescence probes. The three-
sigma rule was used to set up a threshold to distinguish silent and active
photoreceptors.(10) If the stimulus-evoked photoreceptor shifted above this threshold,
then this photoreceptor was defined as active. Otherwise, it was defined as silent. Thus,
the active ratio of the rods and cones could be obtained [Fig. 2(c)].
2.4 Computer algorithm of localized retinal movements
The activated photoreceptors were displaced due to light stimulations [Figs. 2(d),
2(c) and 3(b)]. In order to quantify the photoreceptor displacements, the normalized cross
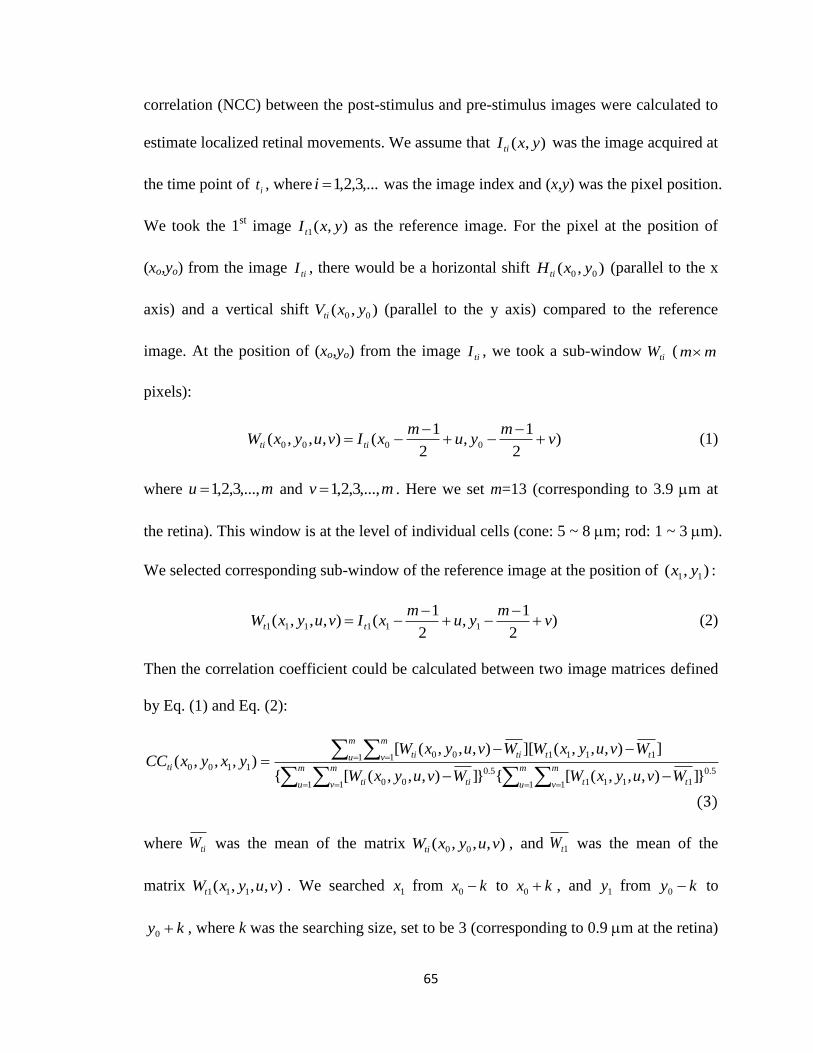
65
correlation (NCC) between the post-stimulus and pre-stimulus images were calculated to
estimate localized retinal movements. We assume that ),( yxI ti was the image acquired at
the time point of it , where ,...3,2,1i was the image index and (x,y) was the pixel position.
We took the 1st image ),(1 yxI t as the reference image. For the pixel at the position of
(xo,yo) from the image tiI , there would be a horizontal shift ),( 00 yxH ti (parallel to the x
axis) and a vertical shift ),( 00 yxVti (parallel to the y axis) compared to the reference
image. At the position of (xo,yo) from the image tiI , we took a sub-window tiW ( mm
pixels):
)2
1,
2
1(),,,( 0000 v
myu
mxIvuyxW titi
(1)
where mu ,...,3,2,1 and mv ,...,3,2,1 . Here we set m=13 (corresponding to 3.9 mm at
the retina). This window is at the level of individual cells (cone: 5 ~ 8mm; rod: 1 ~ 3 mm).
We selected corresponding sub-window of the reference image at the position of ),( 11 yx :
)2
1,
2
1(),,,( 111111 v
myu
mxIvuyxW tt
(2)
Then the correlation coefficient could be calculated between two image matrices defined
by Eq. (1) and Eq. (2):
5.0
1 1 1111
5.0
1 1 00
1 1 111100
1100
}]),,,([{}]),,,([{
]),,,(][),,,([),,,(
m
u
m
v tt
m
u
m
v titi
m
u
m
v tttiti
ti
WvuyxWWvuyxW
WvuyxWWvuyxWyxyxCC
(3)
where tiW was the mean of the matrix ),,,( 00 vuyxWti , and 1tW was the mean of the
matrix ),,,( 111 vuyxWt . We searched 1x from kx 0 to kx 0 , and 1y from ky 0 to
ky 0 , where k was the searching size, set to be 3 (corresponding to 0.9 mm at the retina)
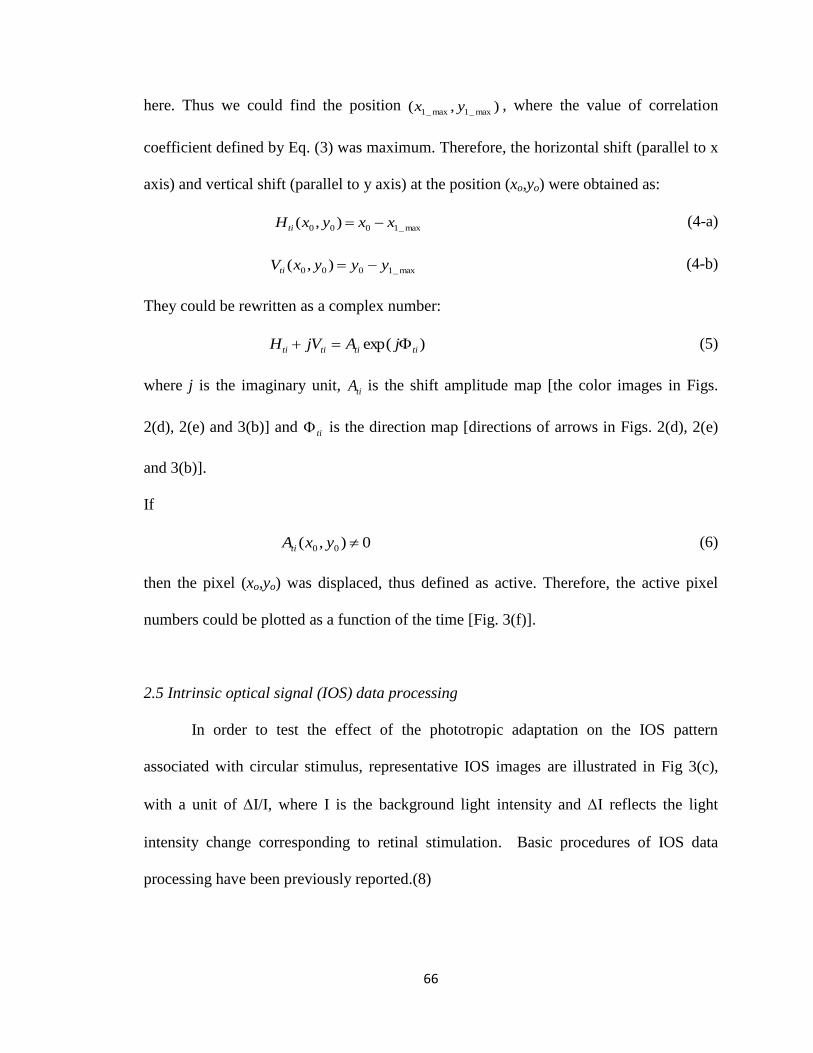
66
here. Thus we could find the position ),( max_1max_1 yx , where the value of correlation
coefficient defined by Eq. (3) was maximum. Therefore, the horizontal shift (parallel to x
axis) and vertical shift (parallel to y axis) at the position (xo,yo) were obtained as:
max_1000 ),( xxyxHti (4-a)
max_1000 ),( yyyxVti (4-b)
They could be rewritten as a complex number:
)exp( titititi jAjVH (5)
where j is the imaginary unit, tiA is the shift amplitude map [the color images in Figs.
2(d), 2(e) and 3(b)] and ti is the direction map [directions of arrows in Figs. 2(d), 2(e)
and 3(b)].
If
0),( 00 yxAti (6)
then the pixel (xo,yo) was displaced, thus defined as active. Therefore, the active pixel
numbers could be plotted as a function of the time [Fig. 3(f)].
2.5 Intrinsic optical signal (IOS) data processing
In order to test the effect of the phototropic adaptation on the IOS pattern
associated with circular stimulus, representative IOS images are illustrated in Fig 3(c),
with a unit of I/I, where I is the background light intensity and I reflects the light
intensity change corresponding to retinal stimulation. Basic procedures of IOS data
processing have been previously reported.(8)
67
Results
3.1 Transient phototropic adaptation in frog retina activated by oblique stimulation
Fig. 2 shows results of phototropic adaptation correlated with oblique light
stimulation. Fig. 2(a) shows the photoreceptor mosaic pattern. Individual rods [red arrows
in Fig. 2(a)] and cones [green arrows in Fig. 2(a)] could be observed. A rectangular
stimulus with 30o incident angle [Fig. 1(a1)] was delivered to the retina. Within the
stimulation area, photoreceptor displacements were directly observed in NIR images
(Video 1).
In order to quantify transient phototropic changes in rod and cone systems, we
calculated displacements of individual rods and cones (see Materials and Methods). Fig.
2(b) shows average displacements of 25 rods and 25 cones randomly selected from the
stimulus window. The displacement of rods occurred almost immediately (< 10 ms) and
reached magnitude peak at ~ 200 ms. The magnitude of rod displacement (average: 0.2
mm, with maximum up to 0.6 mm) was significantly larger than that of cone displacement
(average: 0.048 mm, with maximum of 0.15 mm). In addition, as shown in [Fig. 2(c)], the
active ratio (see Materials and Methods for definition) of rods was 80% ± 4%, while 20%
± 4% of cones were activated. The observation indicated that the transient phototropic
displacement was dominantly observed in rods.
In order to verify directional dependency of the phototropic adaptation, we used
template matching with the NCC to compute non-uniform motion in the retina (see
Materials and Methods).(15) As shown in Video 2 and Fig. 2(d), the stimulus-activated
retina shifted to right, i.e., towards the direction of the 30o oblique stimulation. In order
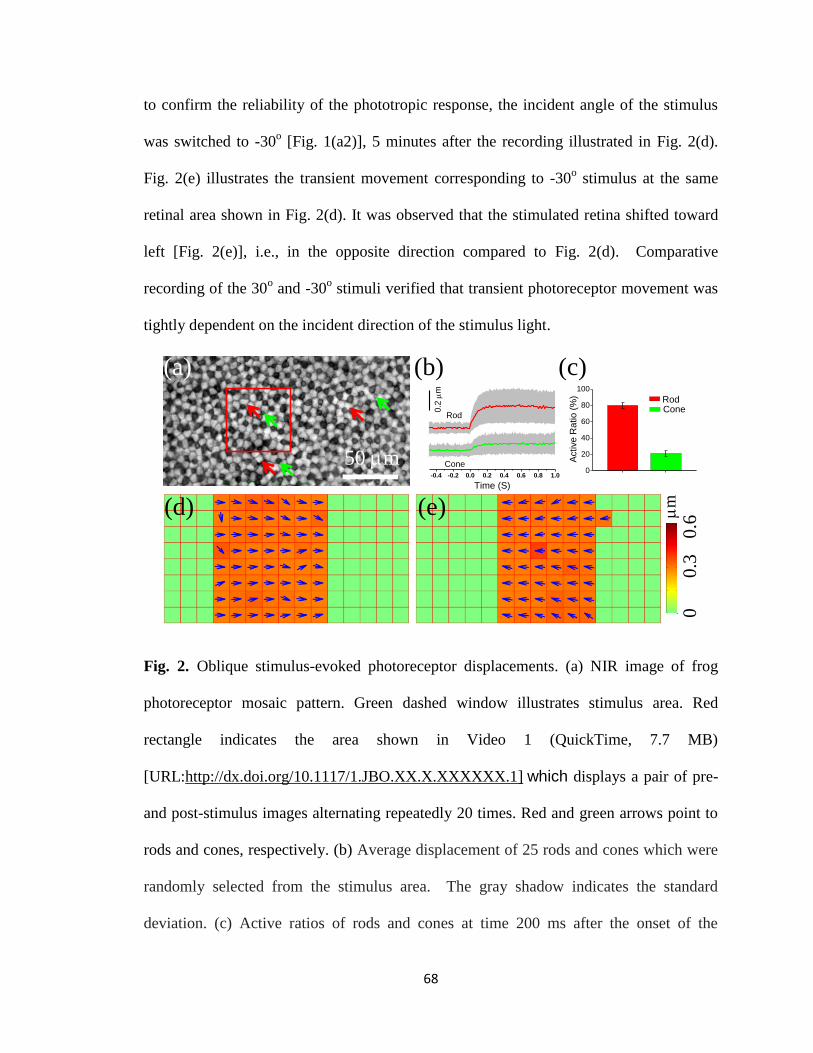
68
to confirm the reliability of the phototropic response, the incident angle of the stimulus
was switched to -30o [Fig. 1(a2)], 5 minutes after the recording illustrated in Fig. 2(d).
Fig. 2(e) illustrates the transient movement corresponding to -30o stimulus at the same
retinal area shown in Fig. 2(d). It was observed that the stimulated retina shifted toward
left [Fig. 2(e)], i.e., in the opposite direction compared to Fig. 2(d). Comparative
recording of the 30o and -30
o stimuli verified that transient photoreceptor movement was
tightly dependent on the incident direction of the stimulus light.
00
.30
.6
(a) (b) (c)
0
20
40
60
80
100
RodCone
Active
Ra
tio
(%
)
(d) (e)
50 mm
mm
-0.4 -0.2 0.0 0.2 0.4 0.6 0.8 1.0
Cone
Rod
0.2
mm
Time (S)
Fig. 2. Oblique stimulus-evoked photoreceptor displacements. (a) NIR image of frog
photoreceptor mosaic pattern. Green dashed window illustrates stimulus area. Red
rectangle indicates the area shown in Video 1 (QuickTime, 7.7 MB)
[URL:http://dx.doi.org/10.1117/1.JBO.XX.X.XXXXXX.1] which displays a pair of pre-
and post-stimulus images alternating repeatedly 20 times. Red and green arrows point to
rods and cones, respectively. (b) Average displacement of 25 rods and cones which were
randomly selected from the stimulus area. The gray shadow indicates the standard
deviation. (c) Active ratios of rods and cones at time 200 ms after the onset of the
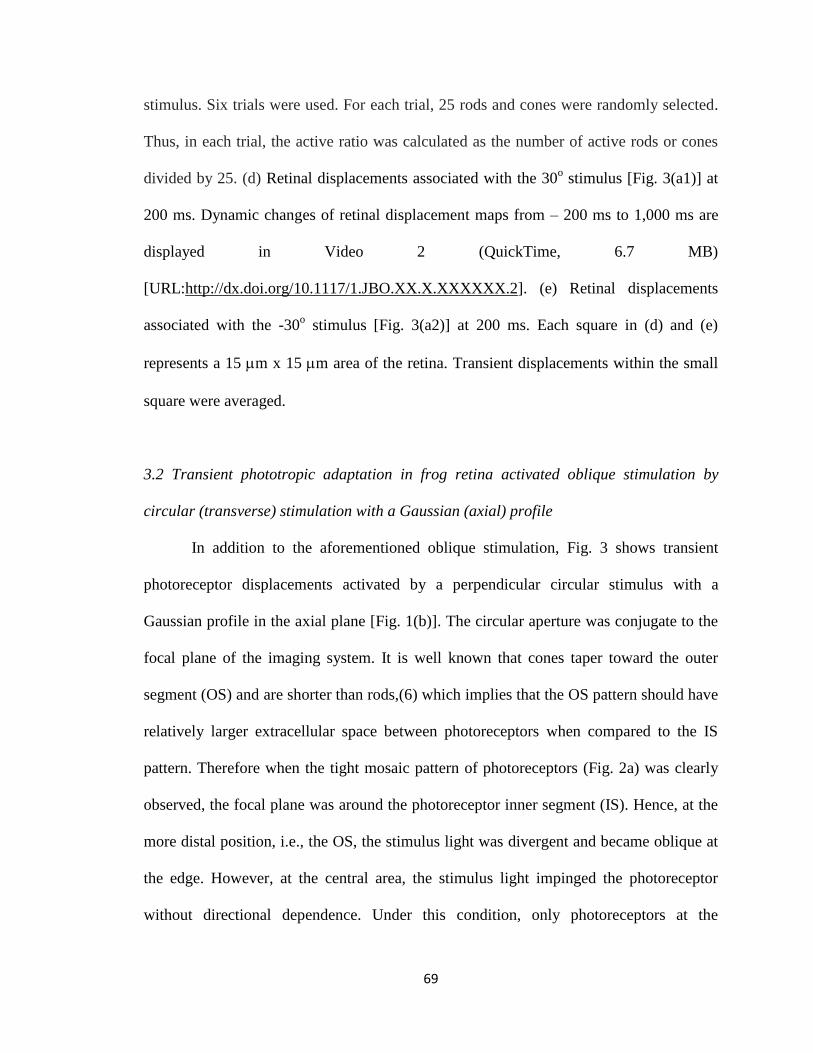
69
stimulus. Six trials were used. For each trial, 25 rods and cones were randomly selected.
Thus, in each trial, the active ratio was calculated as the number of active rods or cones
divided by 25. (d) Retinal displacements associated with the 30o stimulus [Fig. 3(a1)] at
200 ms. Dynamic changes of retinal displacement maps from – 200 ms to 1,000 ms are
displayed in Video 2 (QuickTime, 6.7 MB)
[URL:http://dx.doi.org/10.1117/1.JBO.XX.X.XXXXXX.2]. (e) Retinal displacements
associated with the -30o stimulus [Fig. 3(a2)] at 200 ms. Each square in (d) and (e)
represents a 15 mm x 15 mm area of the retina. Transient displacements within the small
square were averaged.
3.2 Transient phototropic adaptation in frog retina activated oblique stimulation by
circular (transverse) stimulation with a Gaussian (axial) profile
In addition to the aforementioned oblique stimulation, Fig. 3 shows transient
photoreceptor displacements activated by a perpendicular circular stimulus with a
Gaussian profile in the axial plane [Fig. 1(b)]. The circular aperture was conjugate to the
focal plane of the imaging system. It is well known that cones taper toward the outer
segment (OS) and are shorter than rods,(6) which implies that the OS pattern should have
relatively larger extracellular space between photoreceptors when compared to the IS
pattern. Therefore when the tight mosaic pattern of photoreceptors (Fig. 2a) was clearly
observed, the focal plane was around the photoreceptor inner segment (IS). Hence, at the
more distal position, i.e., the OS, the stimulus light was divergent and became oblique at
the edge. However, at the central area, the stimulus light impinged the photoreceptor
without directional dependence. Under this condition, only photoreceptors at the
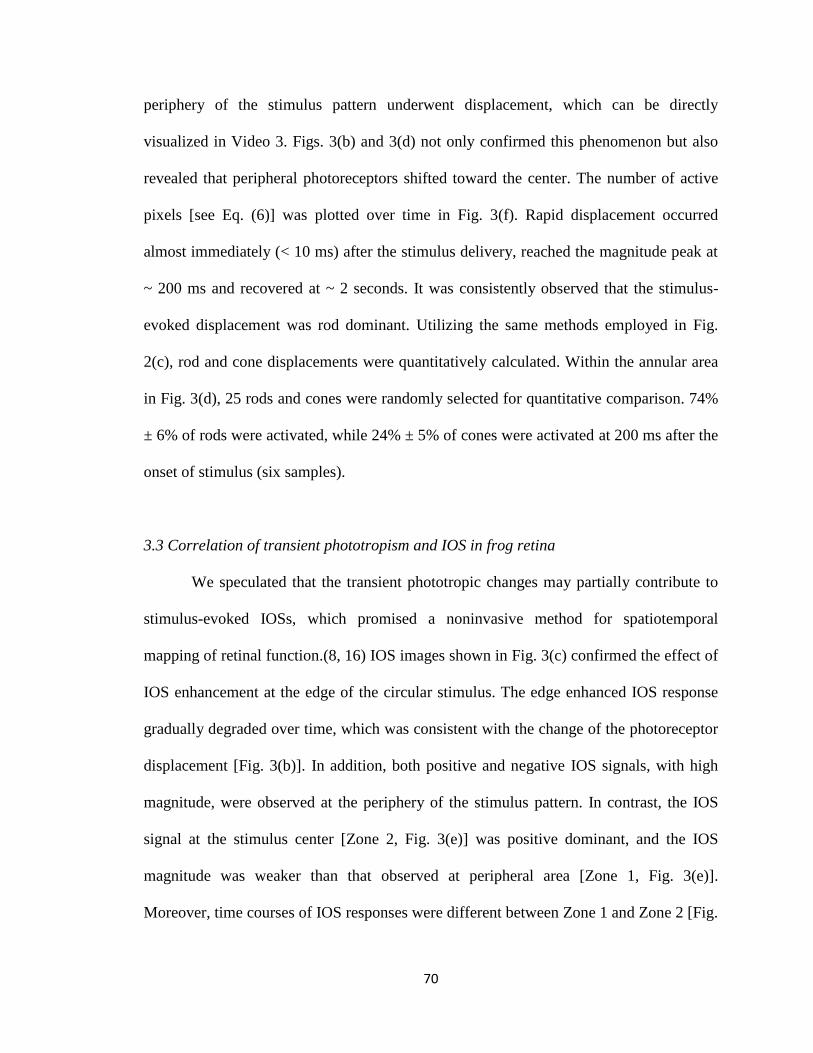
70
periphery of the stimulus pattern underwent displacement, which can be directly
visualized in Video 3. Figs. 3(b) and 3(d) not only confirmed this phenomenon but also
revealed that peripheral photoreceptors shifted toward the center. The number of active
pixels [see Eq. (6)] was plotted over time in Fig. 3(f). Rapid displacement occurred
almost immediately (< 10 ms) after the stimulus delivery, reached the magnitude peak at
~ 200 ms and recovered at ~ 2 seconds. It was consistently observed that the stimulus-
evoked displacement was rod dominant. Utilizing the same methods employed in Fig.
2(c), rod and cone displacements were quantitatively calculated. Within the annular area
in Fig. 3(d), 25 rods and cones were randomly selected for quantitative comparison. 74%
± 6% of rods were activated, while 24% ± 5% of cones were activated at 200 ms after the
onset of stimulus (six samples).
3.3 Correlation of transient phototropism and IOS in frog retina
We speculated that the transient phototropic changes may partially contribute to
stimulus-evoked IOSs, which promised a noninvasive method for spatiotemporal
mapping of retinal function.(8, 16) IOS images shown in Fig. 3(c) confirmed the effect of
IOS enhancement at the edge of the circular stimulus. The edge enhanced IOS response
gradually degraded over time, which was consistent with the change of the photoreceptor
displacement [Fig. 3(b)]. In addition, both positive and negative IOS signals, with high
magnitude, were observed at the periphery of the stimulus pattern. In contrast, the IOS
signal at the stimulus center [Zone 2, Fig. 3(e)] was positive dominant, and the IOS
magnitude was weaker than that observed at peripheral area [Zone 1, Fig. 3(e)].
Moreover, time courses of IOS responses were different between Zone 1 and Zone 2 [Fig.
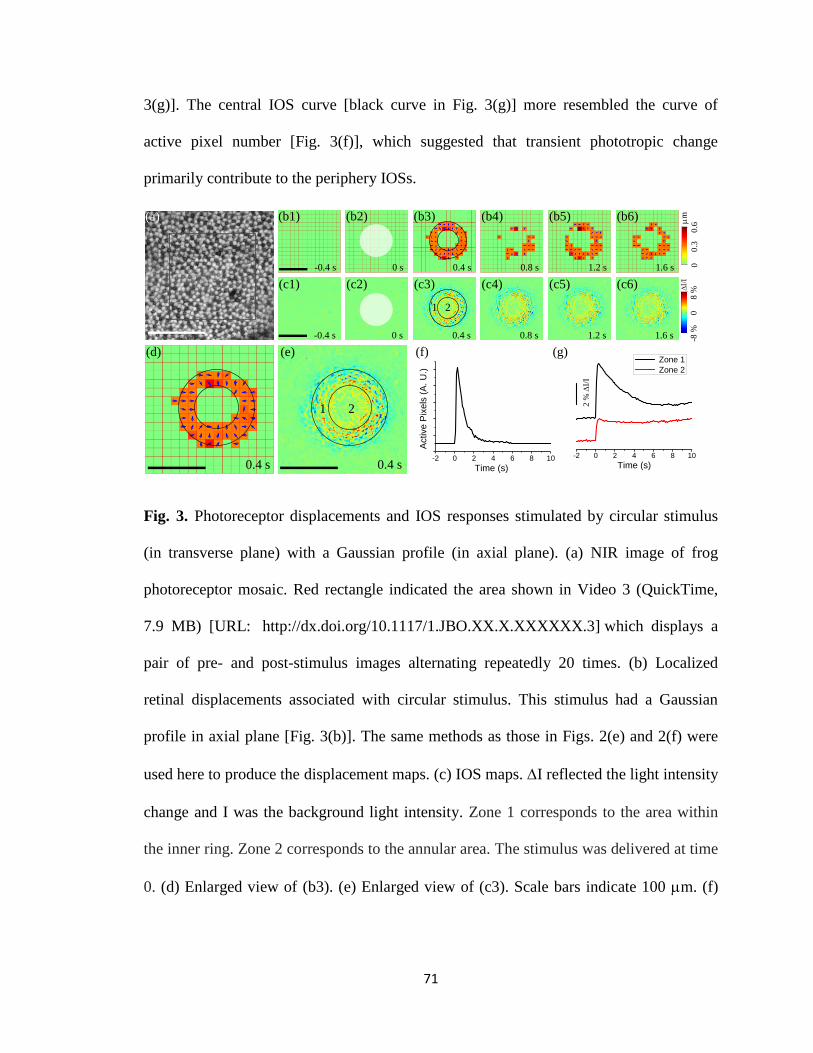
71
3(g)]. The central IOS curve [black curve in Fig. 3(g)] more resembled the curve of
active pixel number [Fig. 3(f)], which suggested that transient phototropic change
primarily contribute to the periphery IOSs.
Fig. 3. Photoreceptor displacements and IOS responses stimulated by circular stimulus
(in transverse plane) with a Gaussian profile (in axial plane). (a) NIR image of frog
photoreceptor mosaic. Red rectangle indicated the area shown in Video 3 (QuickTime,
7.9 MB) [URL: http://dx.doi.org/10.1117/1.JBO.XX.X.XXXXXX.3] which displays a
pair of pre- and post-stimulus images alternating repeatedly 20 times. (b) Localized
retinal displacements associated with circular stimulus. This stimulus had a Gaussian
profile in axial plane [Fig. 3(b)]. The same methods as those in Figs. 2(e) and 2(f) were
used here to produce the displacement maps. (c) IOS maps. I reflected the light intensity
change and I was the background light intensity. Zone 1 corresponds to the area within
the inner ring. Zone 2 corresponds to the annular area. The stimulus was delivered at time
0. (d) Enlarged view of (b3). (e) Enlarged view of (c3). Scale bars indicate 100 mm. (f)
-2 0 2 4 6 8 10
Active
Pix
els
(A
. U
.)
Time (s)
00
.60
.3
(b1) (b2) (b3) (b4) (b5) (b6)
-0.4 s 0 s 0.4 s 0.8 s 1.2 s 1.6 s
(c1) (c2) (c3) (c4) (c5) (c6)
-0.4 s 0 s 0.4 s 0.8 s 1.2 s 1.6 s
-8 %
8 %
0
II
mm
(d) (e) (f) (g)
0.4 s 0.4 s
1 2
1 2
(a)
-2 0 2 4 6 8 10
Time (s)
Zone 1
Zone 2
2 %
I/
I
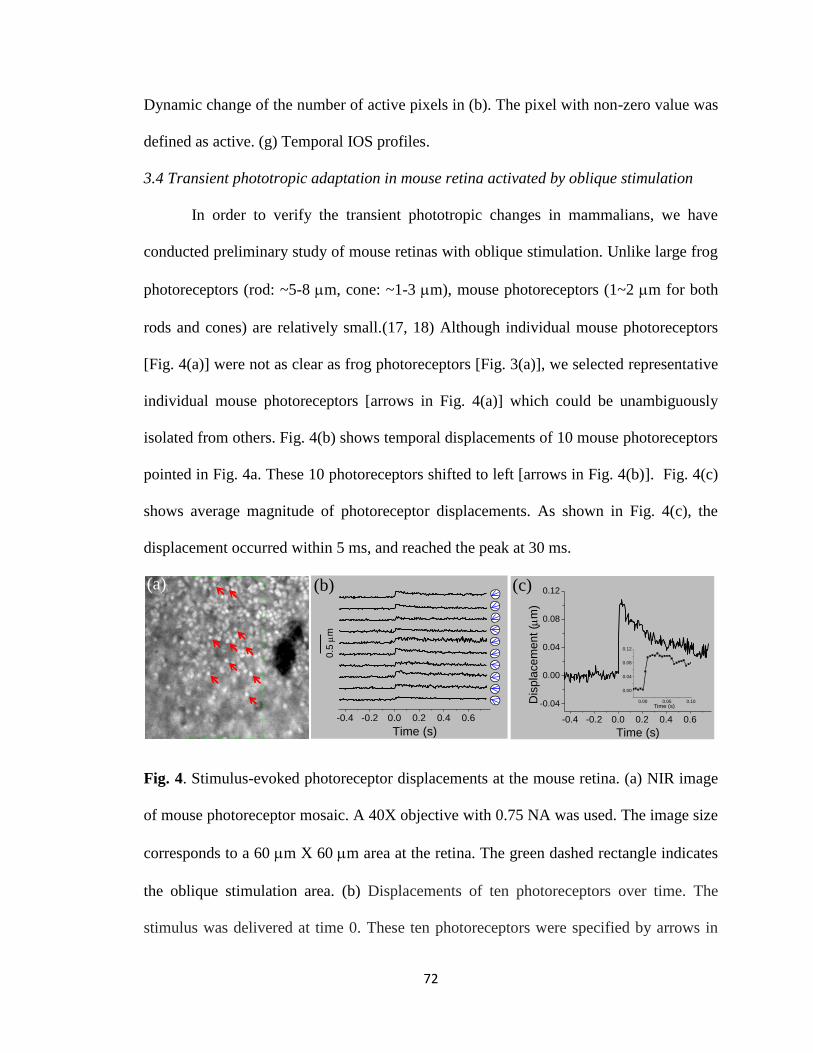
72
Dynamic change of the number of active pixels in (b). The pixel with non-zero value was
defined as active. (g) Temporal IOS profiles.
3.4 Transient phototropic adaptation in mouse retina activated by oblique stimulation
In order to verify the transient phototropic changes in mammalians, we have
conducted preliminary study of mouse retinas with oblique stimulation. Unlike large frog
photoreceptors (rod: ~5-8 mm, cone: ~1-3 mm), mouse photoreceptors (1~2 mm for both
rods and cones) are relatively small.(17, 18) Although individual mouse photoreceptors
[Fig. 4(a)] were not as clear as frog photoreceptors [Fig. 3(a)], we selected representative
individual mouse photoreceptors [arrows in Fig. 4(a)] which could be unambiguously
isolated from others. Fig. 4(b) shows temporal displacements of 10 mouse photoreceptors
pointed in Fig. 4a. These 10 photoreceptors shifted to left [arrows in Fig. 4(b)]. Fig. 4(c)
shows average magnitude of photoreceptor displacements. As shown in Fig. 4(c), the
displacement occurred within 5 ms, and reached the peak at 30 ms.
Fig. 4. Stimulus-evoked photoreceptor displacements at the mouse retina. (a) NIR image
of mouse photoreceptor mosaic. A 40X objective with 0.75 NA was used. The image size
corresponds to a 60 mm X 60 mm area at the retina. The green dashed rectangle indicates
the oblique stimulation area. (b) Displacements of ten photoreceptors over time. The
stimulus was delivered at time 0. These ten photoreceptors were specified by arrows in
(a) (b)
-0.4 -0.2 0.0 0.2 0.4 0.6
Time (s)
0.5
mm
(c)
-0.4 -0.2 0.0 0.2 0.4 0.6
-0.04
0.00
0.04
0.08
0.12
Dis
pla
cem
en
t (m
m)
Time (s)
0.00 0.05 0.10
0.00
0.04
0.08
0.12
Time (s)
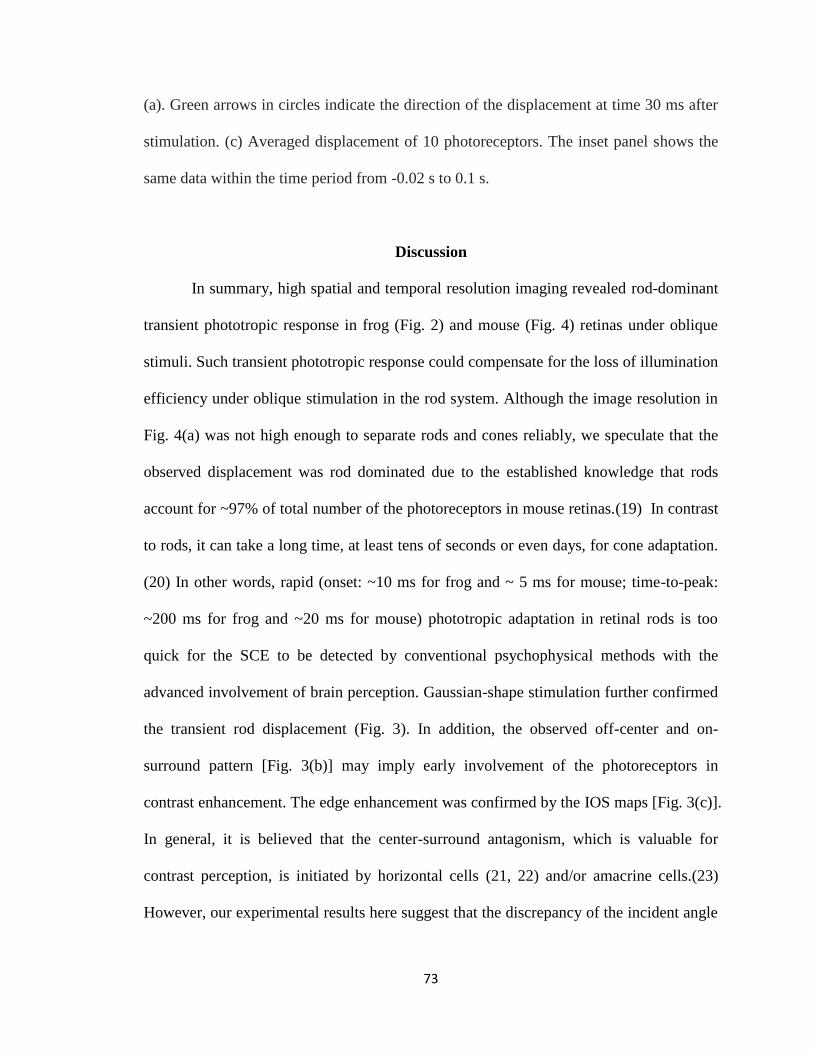
73
(a). Green arrows in circles indicate the direction of the displacement at time 30 ms after
stimulation. (c) Averaged displacement of 10 photoreceptors. The inset panel shows the
same data within the time period from -0.02 s to 0.1 s.
Discussion
In summary, high spatial and temporal resolution imaging revealed rod-dominant
transient phototropic response in frog (Fig. 2) and mouse (Fig. 4) retinas under oblique
stimuli. Such transient phototropic response could compensate for the loss of illumination
efficiency under oblique stimulation in the rod system. Although the image resolution in
Fig. 4(a) was not high enough to separate rods and cones reliably, we speculate that the
observed displacement was rod dominated due to the established knowledge that rods
account for ~97% of total number of the photoreceptors in mouse retinas.(19) In contrast
to rods, it can take a long time, at least tens of seconds or even days, for cone adaptation.
(20) In other words, rapid (onset: ~10 ms for frog and ~ 5 ms for mouse; time-to-peak:
~200 ms for frog and ~20 ms for mouse) phototropic adaptation in retinal rods is too
quick for the SCE to be detected by conventional psychophysical methods with the
advanced involvement of brain perception. Gaussian-shape stimulation further confirmed
the transient rod displacement (Fig. 3). In addition, the observed off-center and on-
surround pattern [Fig. 3(b)] may imply early involvement of the photoreceptors in
contrast enhancement. The edge enhancement was confirmed by the IOS maps [Fig. 3(c)].
In general, it is believed that the center-surround antagonism, which is valuable for
contrast perception, is initiated by horizontal cells (21, 22) and/or amacrine cells.(23)
However, our experimental results here suggest that the discrepancy of the incident angle
74
between the surround and the center of the Gaussian illumination [Fig. 1(b)] can evoke
directional displacement only at the surround [Fig. 3(b)]. Such an edge-enhanced pattern
of photoreceptor activity may suggest early involvement of the photoreceptors in contrast
perception.
Moreover, the observed transient rod movement provides an IOS biomarker to
allow early detection of eye diseases that can cause retinal dysfunction. Rod function has
been well established to be more vulnerable than cones in aging and early AMD,(3, 4)
which is the most common cause of severe vision loss and legal blindness in adults over
50.(3, 5) Structural biomarkers, such as drusen and pigmentary abnormalities in the
macula are important for retinal evaluation. Adaptive optics imaging of individual rods
has been recently demonstrated.(24-26) However, the most commonly used tool for
retinal imaging, the fundus examination, is not sufficient for a final retinal diagnosis.(27)
In principle, physiological function is degraded in diseased cells before detectable
abnormality of retinal morphology. Psychophysical methods (28-30) and
electroretinography (ERG) (31) measurements have been explored for functional
assessment of the retina, but reliable identification of localized rod dysfunctions is still
challenging due to limited resolution and sensitivity. The experimental results shown in
Fig. 3 indicate that the transient phototropic changes can partially contribute to IOS
recording which has the potential to be developed into a superior noninvasive method for
spatiotemporal mapping of retinal function.(8, 10) The different time courses of the IOSs
at Zone 1 (periphery) and Zone 2 (center) suggest that the phototropic change of rod
photoreceptors primarily contribute to the periphery IOS response. Multiple IOS origins,
including neurotransmitter secretion,(32) refractive index change of neural tissues,(33)
75
interactions between photoexcited rhodopsin and GTP-binding protein,(34) disc shape
change,(35) cell swelling,(36) etc. have been proposed. In order to investigate the
biophysical mechanism of transient phototropic adaptation, we are currently pursuing
optical coherence tomography (OCT) of retinal photoreceptors to quantify the axial
location of phototropic kinetics. Further investigations are also planned to quantify time
courses of the transient phototropic adaptations in wild type and diseased mouse retinas.
We anticipate that further investigation of the rod dominant phototropic effect can
provide a high resolution methodology to achieve objective identification of rod
dysfunction, and thereby allowing early detection and easy treatment evaluation of eye
diseases, such as AMD associated photoreceptor degeneration.
Acknowledgement
This research is supported in part by NSF CBET-1055889, NIH R21 EB012264,
UASOM I3 Pilot Award and NEI R01 EY018143-05. The authors wish to thank Dr.
Christine Curcio and Dr. Walter Makous for their valuable comments and constructive
suggestions on the manuscript, we thank Delores W. Davis in Dr. Pittler’s laboratory for
providing the mice and relevant genotype and age information.
Reference
1. W. S. Stiles and B. H. Crawford, "The luminous efficiency of rays entering the eye
pupil at different points," Proc. R. Soc. Lond.112(778), 428-450 (1933)
2. G. Westheimer, "Directional sensitivity of the retina: 75 years of Stiles-Crawford
effect," Proc. Biol. Sci. 275(1653), 2777-2786 (2008)
3. C. A. Curcio, N. E. Medeiros and C. L. Millican, "Photoreceptor loss in age-related
macular degeneration," Invest. Ophthalmol. Vis. Sci. 37(7), 1236-1249 (1996)
76
4. C. Owsley, et al., "Cone- and rod-mediated dark adaptation impairment in age-related
maculopathy," Ophthalmology 114(9), 1728-1735 (2007)
5. N. M. Bressler, S. B. Bressler and S. L. Fine, "Age-related macular degeneration,"
Surv. Opthalmol. 32(6), 375-413 (1988)
6. S. E. Nilsson, "An Electron Microscopic Classification of the Retinal Receptors of the
Leopard Frog (Rana Pipiens)," J. Ultrastruct. Res.10(5), 390-416 (1964)
7. P. A. Liebman and G. Entine, "Visual pigments of frog and tadpole (Rana pipiens),"
Vis. Res. 8(7), 761-775 (1968)
8. X. C. Yao and Y. B. Zhao, "Optical dissection of stimulus-evoked retinal activation,"
Opt. Express 16(17), 12446-12459 (2008)
9. S. J. Pittler and W. Baehr, "Identification of a nonsense mutation in the rod
photoreceptor cGMP phosphodiesterase beta-subunit gene of the rd mouse," Proc.
Natl. Acad. Sci. U. S. A. 88(19), 8322-8326 (1991)
10. Q. X. Zhang, et al., "Comparative intrinsic optical signal imaging of wild-type and
mutant mouse retinas," Opt. Express 20(7), 7646-7654 (2012)
11. C. Li, et al., "Distance regularized level set evolution and its application to image
segmentation," IEEE Trans Image Process 19(12), 3243-3254 (2010)
12. M. J. Rust, M. Bates and X. Zhuang, "Sub-diffraction-limit imaging by stochastic
optical reconstruction microscopy (STORM)," Nat. Methods 3(10), 793-795 (2006)
13. E. Betzig, et al., "Imaging intracellular fluorescent proteins at nanometer resolution,"
Science 313(5793), 1642-1645 (2006)
14. M. F. Juette, et al., "Three-dimensional sub-100 nm resolution fluorescence
microscopy of thick samples," Nat. Methods 5(6), 527-529 (2008)
15. A. J. Hii, et al., "Fast normalized cross correlation for motion tracking using basis
functions," Comput. Methods Programs Biomed. 82(2), 144-156 (2006)
16. Q. X. Zhang, et al.,"In vivo confocal intrinsic optical signal identification of localized
retinal dysfunction," Invest. Ophthalmol. Vis. Sci. 53(13), 8139-8145 (2012)
17. L. D. Carter-Dawson and M. M. LaVail, "Rods and cones in the mouse retina. I.
Structural analysis using light and electron microscopy," J. Comp. Neurol. 188(2),
245-262 (1979)
18. D. Mustafi, A. H. Engel and K. Palczewski, "Structure of cone photoreceptors," Pro.g
Retin. Eye Res. 28(4), 289-302 (2009)
77
19. C. J. Jeon, E. Strettoi and R. H. Masland, "The major cell populations of the mouse
retina," J. Neurosci. 18(21), 8936-8946 (1998)
20. H. S. Smallman, D. I. A. MacLeod and P. Doyle, "Vision: Realignment of cones after
cataract removal," Nature 412(6847), 604-605 (2001)
21. F. S. Werblin and J. E. Dowling, "Organization of the retina of the mudpuppy,
Necturus maculosus. II. Intracellular recording," J. Neurophysiol. 32(3), 339-355
(1969)
22. D. A. Baylor, M. G. Fuortes and P. M. O'Bryan, "Receptive fields of cones in the
retina of the turtle," J. Physiol. 214(2), 265-294 (1971)
23. D. S. Lebedev and D. W. Marshak, "Amacrine cell contributions to red-green color
opponency in central primate retina: a model study," Vis. Neurosci. 24(4), 535-547
(2007)
24. E. A. Rossi, et al., "Imaging retinal mosaics in the living eye," Eye 25(3), 301-308
(2011)
25. D. Merino, et al., "Observation of cone and rod photoreceptors in normal subjects and
patients using a new generation adaptive optics scanning laser ophthalmoscope,"
Biomed. Opt. Express 2(8), 2189-2201 (2011)
26. N. Doble, et al., "In vivo imaging of the human rod photoreceptor mosaic," Opt. Lett.
36(1), 31-33 (2011)
27. C. Owsley, et al., "Delays in rod-mediated dark adaptation in early age-related
maculopathy," Ophthalmology 108(7), 1196-1202 (2001)
28. R. Klein, et al., "The relationship of age-related maculopathy, cataract, and glaucoma
to visual acuity," Invest. Ophthalmol. Vis. Sci. 36(1), 182-191 (1995)
29. J. Siderov and A. L. Tiu, "Variability of measurements of visual acuity in a large eye
clinic," Acta Ophthalmol Scand 77(6), 673-676 (1999)
30. A. Loewenstein, et al., "Replacing the Amsler grid: a new method for monitoring
patients with age-related macular degeneration," Ophthalmology 110(5), 966-970
(2003)
31. A. Binns and T. H. Margrain, "Development of a technique for recording the focal
rod ERG," Ophthalmic Physiol. Opt. 26(1), 71-79 (2006)
32. B. M. Salzberg, A. L. Obaid and H. Gainer, "Large and rapid changes in light
scattering accompany secretion by nerve terminals in the mammalian
neurohypophysis," J. Gen. Physiol. 86(3), 395-411 (1985)

78
33. R. A. Stepnoski, et al., "Noninvasive detection of changes in membrane potential in
cultured neurons by light scattering," Proc. Natl. Acad. Sci. U. S. A. 88(21), 9382-
9386 (1991)
34. H. Kuhn, et al., "Interactions between photoexcited rhodopsin and GTP-binding
protein: kinetic and stoichiometric analyses from light-scattering changes," Proc. Natl.
Acad. Sci. U. S. A. 78(11), 6873-6877 (1981)
35. K. P. Hofmann, et al., "Measurements on fast light-induced light-scattering and -
absorption changes in outer segments of vertebrate light sensitive rod cells," Biophys.
Struct. Mech. 2(1), 61-77 (1976)
36. I. Tasaki and P. M. Byrne, "Rapid structural changes in nerve fibers evoked by
electric current pulses," Biochem. Biophys. Res. Commun. 188(2), 559-564 (1992)
79
SUPER-RESOLUTION SCANNING LASER MICROSCOPY THROUGH
VIRTUALLY STRUCTURED DETECTION
by
RONGWEN LU, BENQUAN WANG, QIUXIANG ZHANG AND XINCHENG YAO
Biomedical Optics Express 4(9), 1673-1682, 2013
Copyright
2013
by
Optical Society of America
Used by permission
Format adapted and errata corrected for dissertation
80
Abstract
High resolution microscopy is essential for advanced study of biological
structures and accurate diagnosis of medical diseases. The spatial resolution of
conventional microscopes is light diffraction limited. Structured illumination has been
extensively explored to break the diffraction limit in wide field light microscopy.
However, deployable application of the structured illumination in scanning laser
microscopy is challenging due to the complexity of the illumination system and possible
phase errors in sequential illumination patterns required for super-resolution
reconstruction. We report here a super-resolution scanning laser imaging system which
employs virtually structured detection (VSD) to break the diffraction limit. Without the
complexity of structured illumination, VSD provides an easy, low-cost and phase-artifact
free strategy to achieve super-resolution in scanning laser microscopy.
© 2013 Optical Society of America
OCIS codes: (100.6640) Superresolution; (110.3080) Infrared imaging; (170.3880)
Medical and biological imaging; (180.5810) Scanning Microscopy.
1. Introduction
High resolution imaging is essential for biomedical study and disease evaluation.
However, the spatial resolution of conventional imaging systems is constrained by light
diffraction, which precludes the observation of fine structures of biological specimens.
Several approaches, including stimulated emission depletion (STED) microscopy,
stochastic optical reconstruction microscopy (STORM) and photoactivated localization
microscopy (PALM), have been investigated to achieve super-resolution imaging. In a
81
STED system, the fluorophores are excited by an excitation laser and followed by a
second depletion laser with a doughnut-shaped intensity profile. The STED laser can
deactivate the fluorophores in the periphery of the excitation laser focus, allowing only
the fluorescence from the sub-diffraction-limited center to contribute to super-resolution
recording [1, 2]. However, the extremely intensive laser exposure limits its applications
for live cell imaging of biological systems, such as delicate and fragile retina.
Alternatively, STORM [3], PALM [4], or fluorescence PALM (FPALM) [5] can achieve
super-resolution by mapping localizations of individual molecules with photo-switchable
fluorescence probes. Although single molecule localization based imaging approach has
been demonstrated for live cell imaging [6-8], the imaging speed is limited due to the
requirement of acquiring multiple sub-images for super-resolution reconstruction.
Therefore, its application for high temporal resolution monitoring of live systems is still
challenging.
Moreover, aforementioned super-resolution imaging approaches require
exogenous fluorescent dyes or proteins. Therefore, they are not practical for intrinsic
signal (e.g., reflectance or transmission) imaging. Bertero and his colleagues proposed a
computational strategy suitable for both fluorescence and intrinsic signal imaging by
taking the super-resolution reconstruction as an inverse problem [9-11]. However, the
inversion process is ill-posed and sensitive to potential noise, and the reconstruction is
numerically complicated and time consuming. Alternatively, structured illumination
microscopy (SIM) has been developed to surpass the diffraction limit by shifting high
frequency signal of the sample into the passing band of imaging systems [12-14]. The
SIM can be implemented in both fluorescence and intrinsic signal imaging, However, the
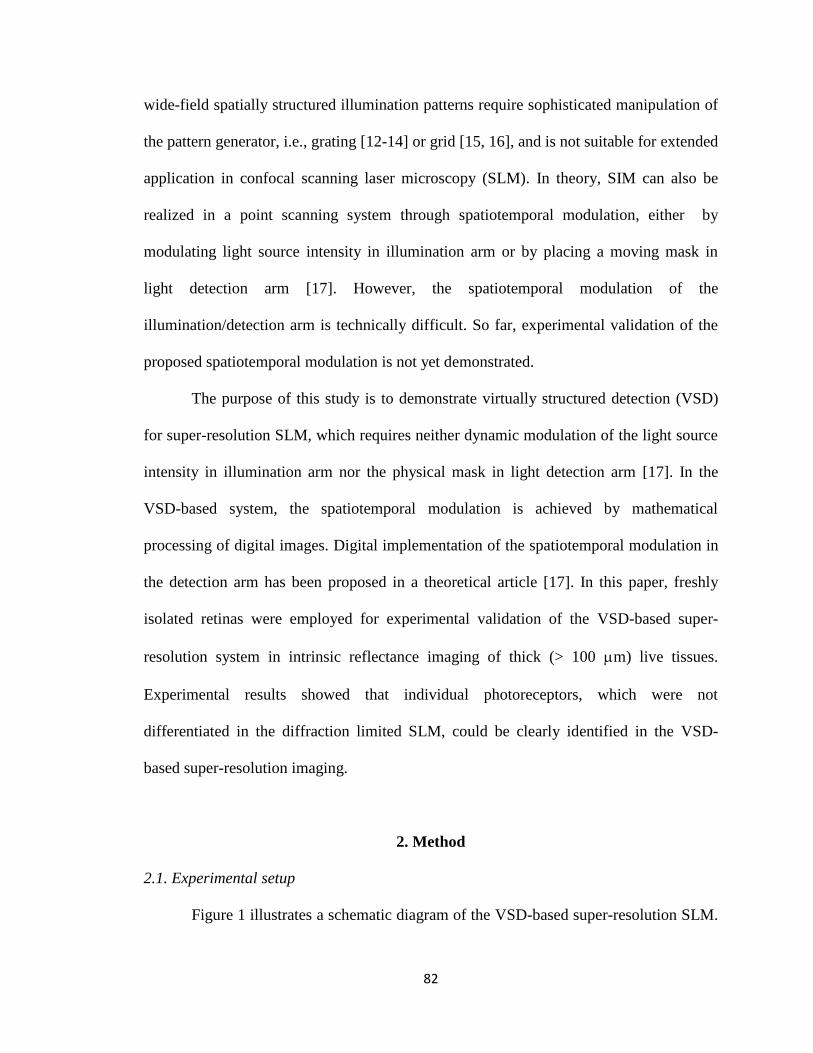
82
wide-field spatially structured illumination patterns require sophisticated manipulation of
the pattern generator, i.e., grating [12-14] or grid [15, 16], and is not suitable for extended
application in confocal scanning laser microscopy (SLM). In theory, SIM can also be
realized in a point scanning system through spatiotemporal modulation, either by
modulating light source intensity in illumination arm or by placing a moving mask in
light detection arm [17]. However, the spatiotemporal modulation of the
illumination/detection arm is technically difficult. So far, experimental validation of the
proposed spatiotemporal modulation is not yet demonstrated.
The purpose of this study is to demonstrate virtually structured detection (VSD)
for super-resolution SLM, which requires neither dynamic modulation of the light source
intensity in illumination arm nor the physical mask in light detection arm [17]. In the
VSD-based system, the spatiotemporal modulation is achieved by mathematical
processing of digital images. Digital implementation of the spatiotemporal modulation in
the detection arm has been proposed in a theoretical article [17]. In this paper, freshly
isolated retinas were employed for experimental validation of the VSD-based super-
resolution system in intrinsic reflectance imaging of thick (> 100 mm) live tissues.
Experimental results showed that individual photoreceptors, which were not
differentiated in the diffraction limited SLM, could be clearly identified in the VSD-
based super-resolution imaging.
2. Method
2.1. Experimental setup
Figure 1 illustrates a schematic diagram of the VSD-based super-resolution SLM.
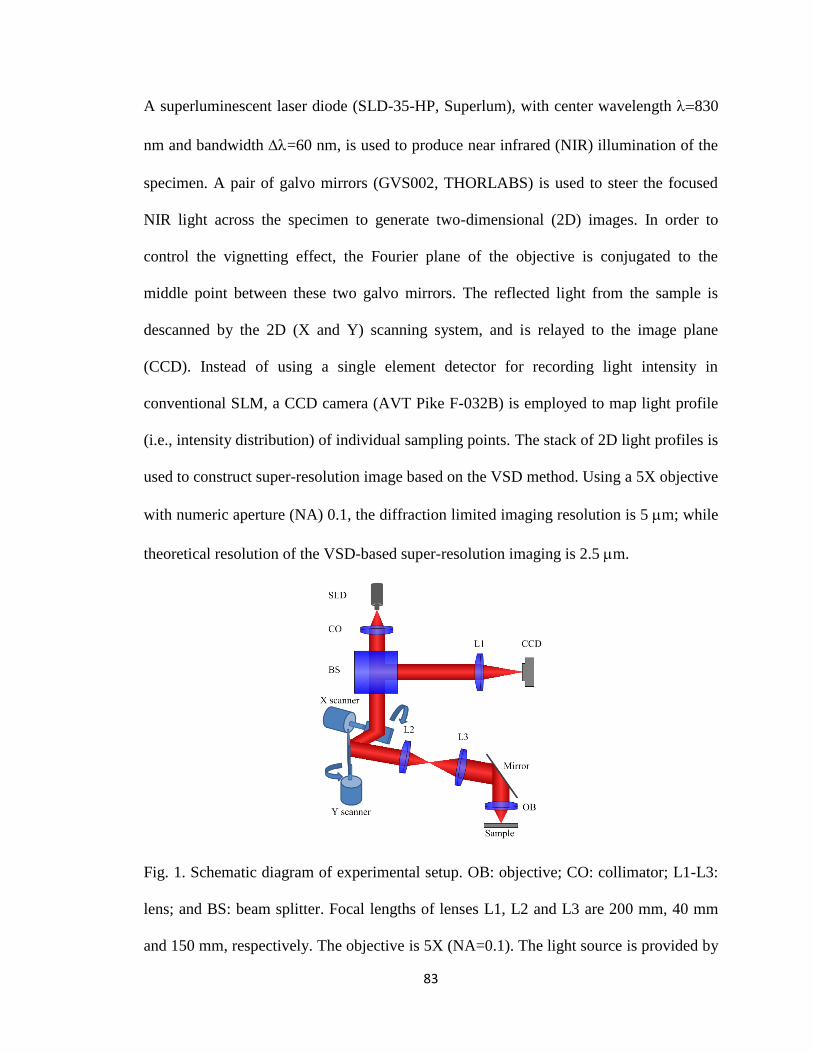
83
A superluminescent laser diode (SLD-35-HP, Superlum), with center wavelength 830
nm and bandwidth =60 nm, is used to produce near infrared (NIR) illumination of the
specimen. A pair of galvo mirrors (GVS002, THORLABS) is used to steer the focused
NIR light across the specimen to generate two-dimensional (2D) images. In order to
control the vignetting effect, the Fourier plane of the objective is conjugated to the
middle point between these two galvo mirrors. The reflected light from the sample is
descanned by the 2D (X and Y) scanning system, and is relayed to the image plane
(CCD). Instead of using a single element detector for recording light intensity in
conventional SLM, a CCD camera (AVT Pike F-032B) is employed to map light profile
(i.e., intensity distribution) of individual sampling points. The stack of 2D light profiles is
used to construct super-resolution image based on the VSD method. Using a 5X objective
with numeric aperture (NA) 0.1, the diffraction limited imaging resolution is 5 mm; while
theoretical resolution of the VSD-based super-resolution imaging is 2.5 mm.
Fig. 1. Schematic diagram of experimental setup. OB: objective; CO: collimator; L1-L3:
lens; and BS: beam splitter. Focal lengths of lenses L1, L2 and L3 are 200 mm, 40 mm
and 150 mm, respectively. The objective is 5X (NA=0.1). The light source is provided by
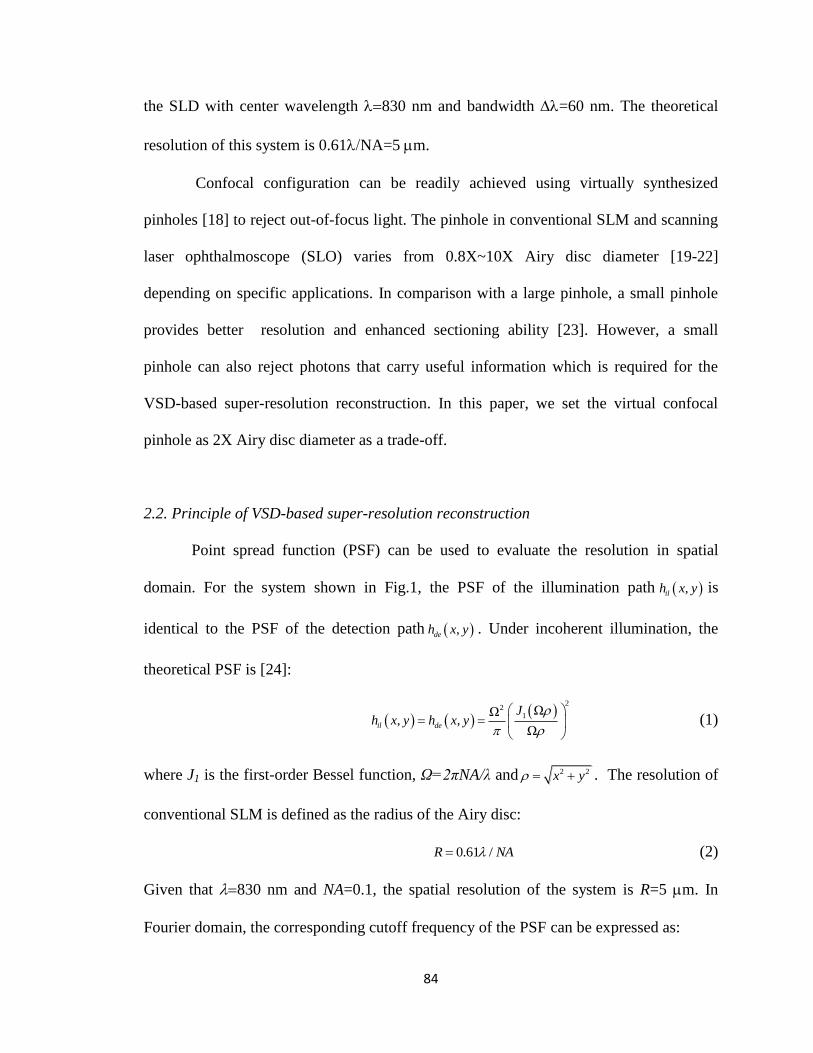
84
the SLD with center wavelength 830 nm and bandwidth =60 nm. The theoretical
resolution of this system is 0.61NA=5 mm.
Confocal configuration can be readily achieved using virtually synthesized
pinholes [18] to reject out-of-focus light. The pinhole in conventional SLM and scanning
laser ophthalmoscope (SLO) varies from 0.8X~10X Airy disc diameter [19-22]
depending on specific applications. In comparison with a large pinhole, a small pinhole
provides better resolution and enhanced sectioning ability [23]. However, a small
pinhole can also reject photons that carry useful information which is required for the
VSD-based super-resolution reconstruction. In this paper, we set the virtual confocal
pinhole as 2X Airy disc diameter as a trade-off.
2.2. Principle of VSD-based super-resolution reconstruction
Point spread function (PSF) can be used to evaluate the resolution in spatial
domain. For the system shown in Fig.1, the PSF of the illumination path ,ilh x y is
identical to the PSF of the detection path ,deh x y . Under incoherent illumination, the
theoretical PSF is [24]:
22
1 ΩΩ, ,
Ωil de
Jh x y h x y
(1)
where J1 is the first-order Bessel function, Ω=2πNA/λ and 2 2x y . The resolution of
conventional SLM is defined as the radius of the Airy disc:
0.61 /R NA (2)
Given that 830 nm and NA=0.1, the spatial resolution of the system is R=5 mm. In
Fourier domain, the corresponding cutoff frequency of the PSF can be expressed as:
85
1/cf R (3)
In other words, only frequency below the cutoff frequency is able to pass through
conventional SLM system:
c cf f f (4)
For a single point light source, we assume here that the illumination intensity has a
normalized number 1. Therefore, at the sampling position (x0, y0), corresponding light
intensity distribution on the sample is 0 0,ilh x x y y . In a descanned system in Fig. 1, the
light intensity distribution on the image plane (i.e., CCD) can be expressed as
0 0, , ,desI x y x y . The non-descanned image can be obtained by shifting descanned images:
0 0 0 0 0 0, , , , , ,non desI x y x y I x x y y x y (5)
If we assume the reflectance ratio of the sample is s(x,y) and that the magnification of the
system is ignored, then we will have [17]
0 0 0 0, , , , , ,non il deI x y x y h x y s h x y d dm m m m (6)
In order to achieve VSD, a digital mask is applied to multiply with the non-descanned
image:
0 0 0 0, , , , , , ,mul nonI x y x y I x y x y m x y (7)
We select a digital mask ,m x y with sinusoidal function:
0, cos 2 cos sinm x y f x y (8)
where θ is the rotation angle of sinusoidal stripes and α represents a constant phase. The
carrier frequency f0 is set here to the value of the cutoff frequency fc:
0 cf f (9)
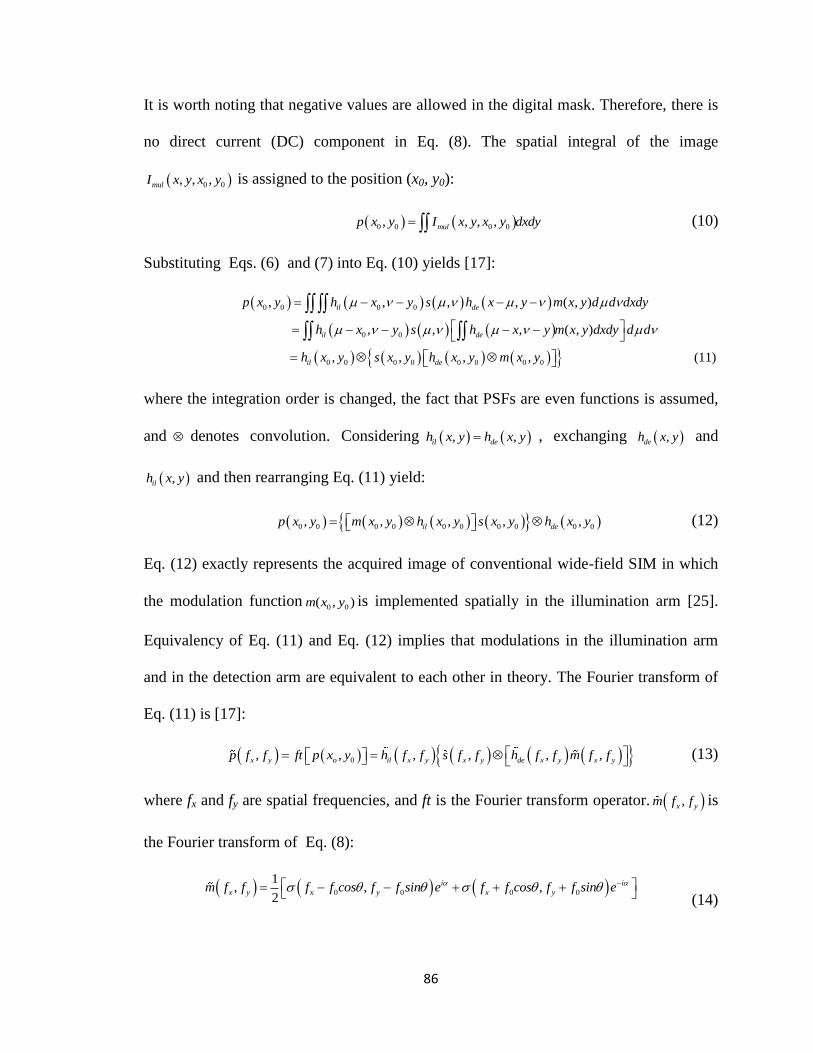
86
It is worth noting that negative values are allowed in the digital mask. Therefore, there is
no direct current (DC) component in Eq. (8). The spatial integral of the image
0 0, , ,mulI x y x y is assigned to the position (x0, y0):
0 0 0 0, , , ,mulp x y I x y x y dxdy (10)
Substituting Eqs. (6) and (7) into Eq. (10) yields [17]:
0 0 0 0
0 0
0 0 0 0 0 0 0 0
, , , , ( , )
, , , ( , )
, , , ,
il de
il de
il de
p x y h x y s h x y m x y d d dxdy
h x y s h x y m x y dxdy d d
h x y s x y h x y m x y
m m m m
m m m m
(11)
where the integration order is changed, the fact that PSFs are even functions is assumed,
and denotes convolution. Considering , ,il deh x y h x y , exchanging ,deh x y and
,ilh x y and then rearranging Eq. (11) yield:
0 0 0 0 0 0 0 0 0 0, , , , ,il dep x y m x y h x y s x y h x y (12)
Eq. (12) exactly represents the acquired image of conventional wide-field SIM in which
the modulation function0 0( , )m x y is implemented spatially in the illumination arm [25].
Equivalency of Eq. (11) and Eq. (12) implies that modulations in the illumination arm
and in the detection arm are equivalent to each other in theory. The Fourier transform of
Eq. (11) is [17]:
0, , , , , ,x y o il x y x y de x y x yp f f ft p x y h f f s f f h f f m f f (13)
where fx and fy are spatial frequencies, and ft is the Fourier transform operator. ,x ym f f is
the Fourier transform of Eq. (8):
0 0 0 0
1, , ,
2
i i
x y x y x ym f f f f cos f f sin e f f cos f f sin e (14)
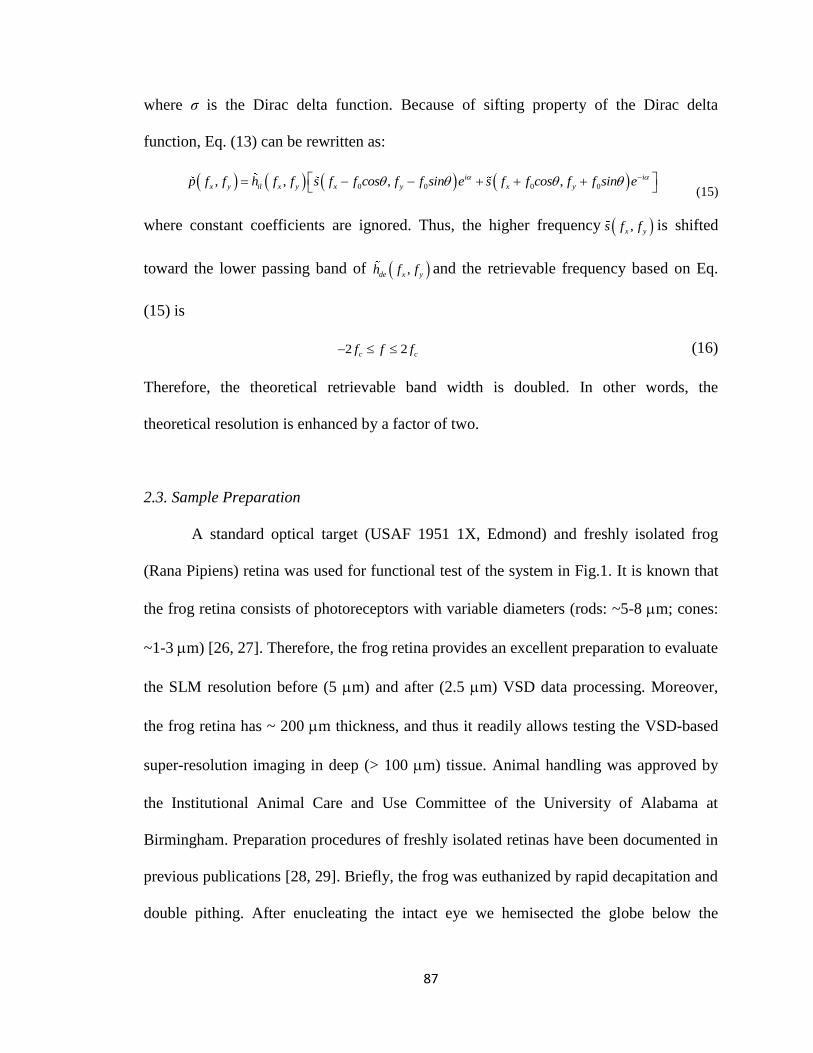
87
where σ is the Dirac delta function. Because of sifting property of the Dirac delta
function, Eq. (13) can be rewritten as:
0 0 0 0, , , ,i i
x y il x y x y x yp f f h f f s f f cos f f sin e s f f cos f f sin e (15)
where constant coefficients are ignored. Thus, the higher frequency ,x ys f f is shifted
toward the lower passing band of ,de x yh f f and the retrievable frequency based on Eq.
(15) is
2 2c cf f f (16)
Therefore, the theoretical retrievable band width is doubled. In other words, the
theoretical resolution is enhanced by a factor of two.
2.3. Sample Preparation
A standard optical target (USAF 1951 1X, Edmond) and freshly isolated frog
(Rana Pipiens) retina was used for functional test of the system in Fig.1. It is known that
the frog retina consists of photoreceptors with variable diameters (rods: ~5-8 mm; cones:
~1-3 mm) [26, 27]. Therefore, the frog retina provides an excellent preparation to evaluate
the SLM resolution before (5 mm) and after (2.5 mm) VSD data processing. Moreover,
the frog retina has ~ 200 mm thickness, and thus it readily allows testing the VSD-based
super-resolution imaging in deep (> 100 mm) tissue. Animal handling was approved by
the Institutional Animal Care and Use Committee of the University of Alabama at
Birmingham. Preparation procedures of freshly isolated retinas have been documented in
previous publications [28, 29]. Briefly, the frog was euthanized by rapid decapitation and
double pithing. After enucleating the intact eye we hemisected the globe below the
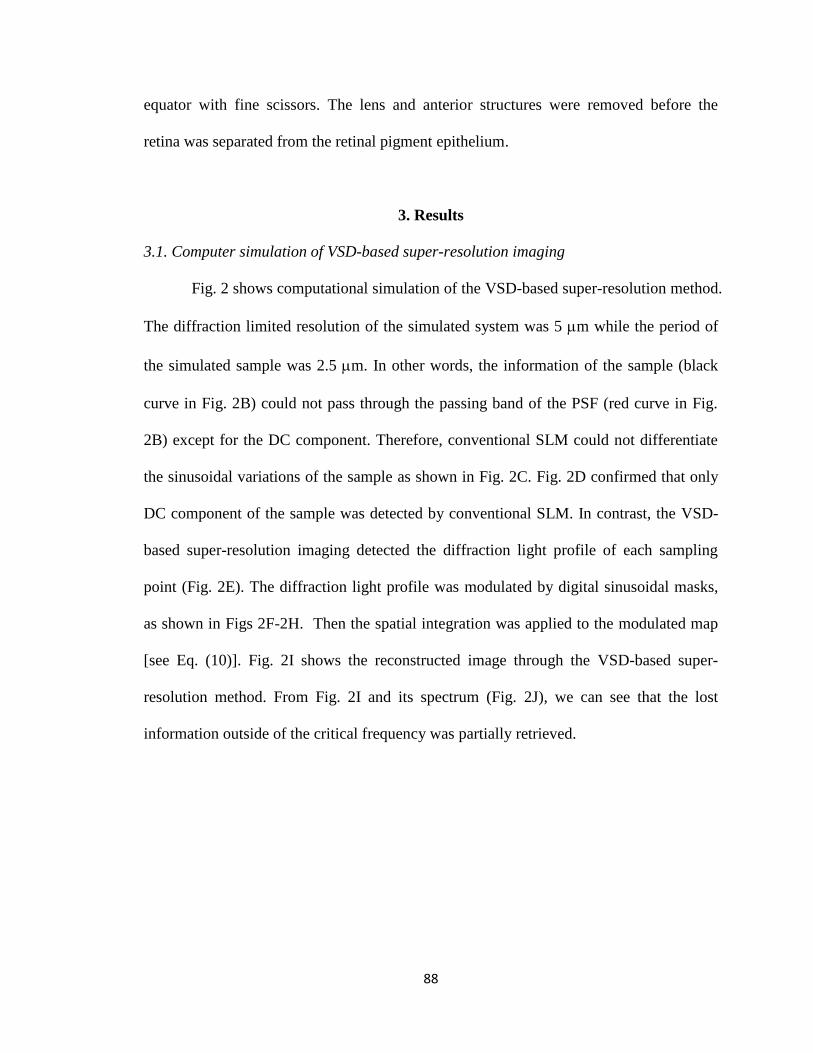
88
equator with fine scissors. The lens and anterior structures were removed before the
retina was separated from the retinal pigment epithelium.
3. Results
3.1. Computer simulation of VSD-based super-resolution imaging
Fig. 2 shows computational simulation of the VSD-based super-resolution method.
The diffraction limited resolution of the simulated system was 5 mm while the period of
the simulated sample was 2.5 mm. In other words, the information of the sample (black
curve in Fig. 2B) could not pass through the passing band of the PSF (red curve in Fig.
2B) except for the DC component. Therefore, conventional SLM could not differentiate
the sinusoidal variations of the sample as shown in Fig. 2C. Fig. 2D confirmed that only
DC component of the sample was detected by conventional SLM. In contrast, the VSD-
based super-resolution imaging detected the diffraction light profile of each sampling
point (Fig. 2E). The diffraction light profile was modulated by digital sinusoidal masks,
as shown in Figs 2F-2H. Then the spatial integration was applied to the modulated map
[see Eq. (10)]. Fig. 2I shows the reconstructed image through the VSD-based super-
resolution method. From Fig. 2I and its spectrum (Fig. 2J), we can see that the lost
information outside of the critical frequency was partially retrieved.
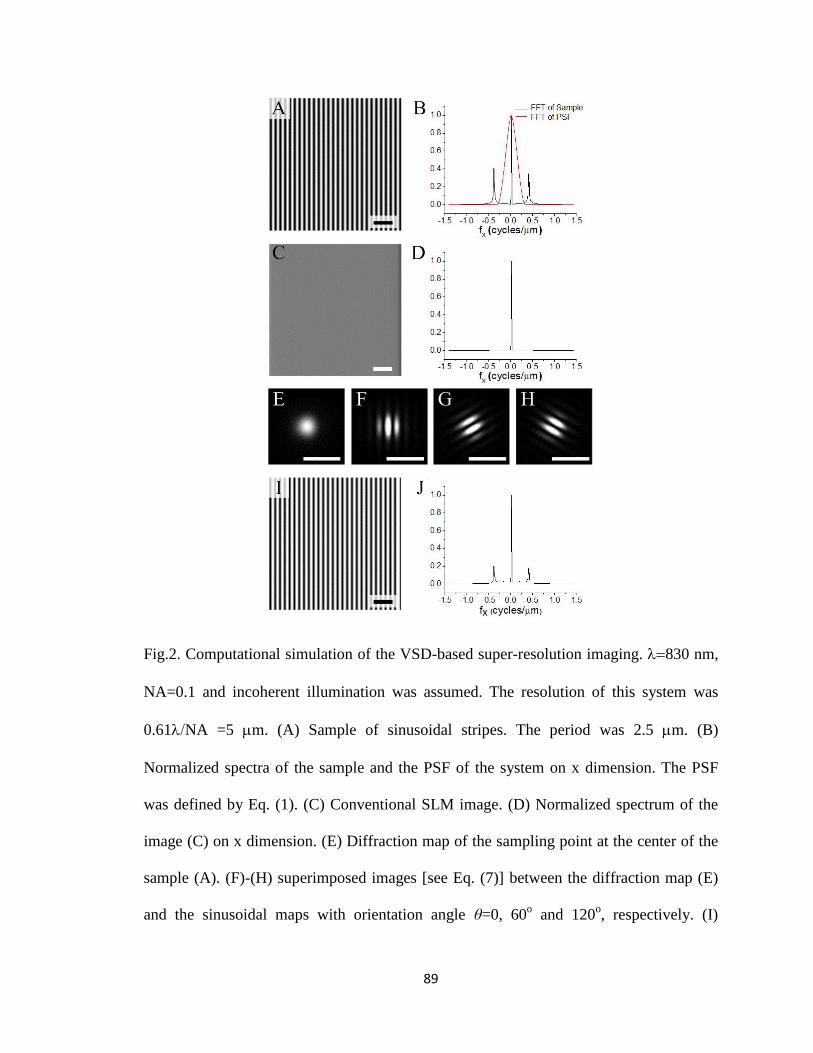
89
Fig.2. Computational simulation of the VSD-based super-resolution imaging. 830 nm,
NA=0.1 and incoherent illumination was assumed. The resolution of this system was
0.61NA =5 mm. (A) Sample of sinusoidal stripes. The period was 2.5 mm. (B)
Normalized spectra of the sample and the PSF of the system on x dimension. The PSF
was defined by Eq. (1). (C) Conventional SLM image. (D) Normalized spectrum of the
image (C) on x dimension. (E) Diffraction map of the sampling point at the center of the
sample (A). (F)-(H) superimposed images [see Eq. (7)] between the diffraction map (E)
and the sinusoidal maps with orientation angle θ=0, 60o and 120
o, respectively. (I)
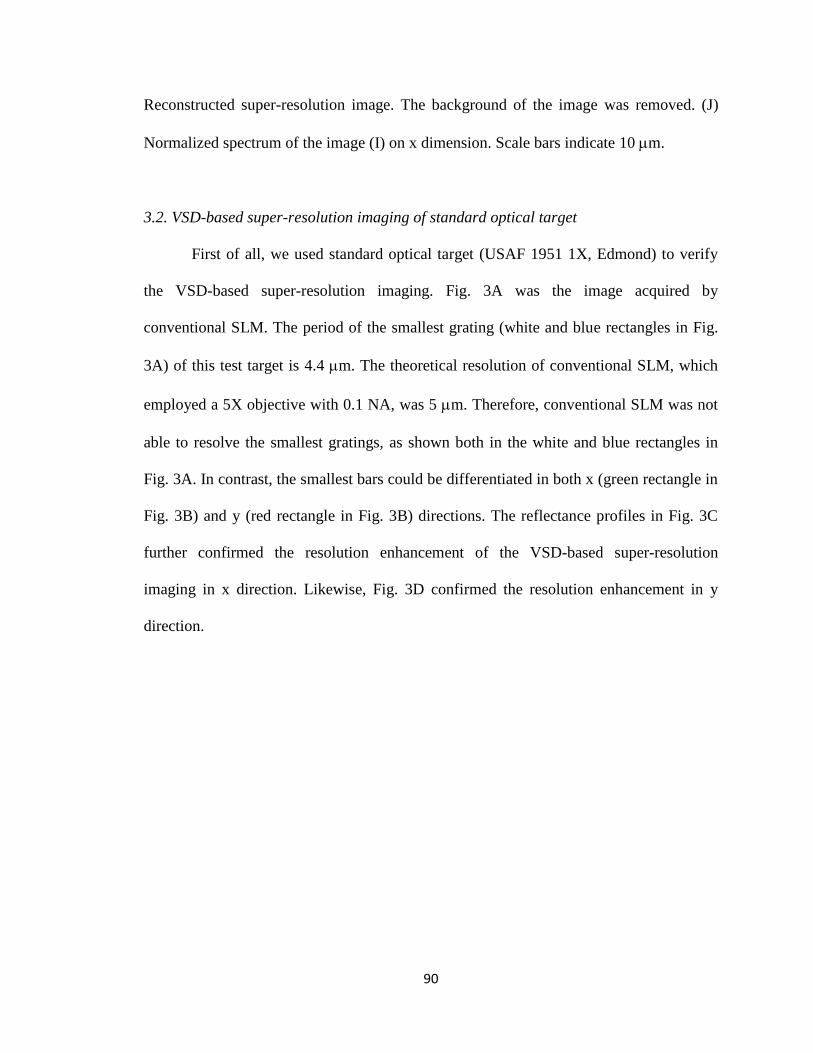
90
Reconstructed super-resolution image. The background of the image was removed. (J)
Normalized spectrum of the image (I) on x dimension. Scale bars indicate 10 mm.
3.2. VSD-based super-resolution imaging of standard optical target
First of all, we used standard optical target (USAF 1951 1X, Edmond) to verify
the VSD-based super-resolution imaging. Fig. 3A was the image acquired by
conventional SLM. The period of the smallest grating (white and blue rectangles in Fig.
3A) of this test target is 4.4 mm. The theoretical resolution of conventional SLM, which
employed a 5X objective with 0.1 NA, was 5 mm. Therefore, conventional SLM was not
able to resolve the smallest gratings, as shown both in the white and blue rectangles in
Fig. 3A. In contrast, the smallest bars could be differentiated in both x (green rectangle in
Fig. 3B) and y (red rectangle in Fig. 3B) directions. The reflectance profiles in Fig. 3C
further confirmed the resolution enhancement of the VSD-based super-resolution
imaging in x direction. Likewise, Fig. 3D confirmed the resolution enhancement in y
direction.
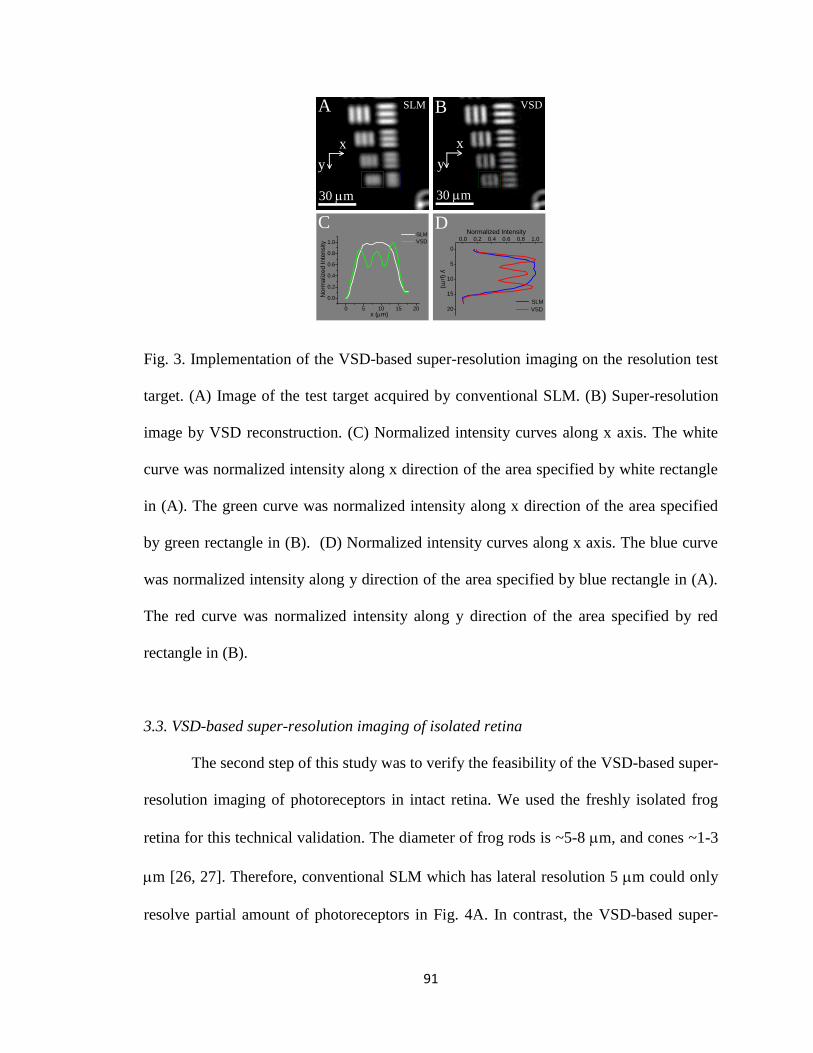
91
Fig. 3. Implementation of the VSD-based super-resolution imaging on the resolution test
target. (A) Image of the test target acquired by conventional SLM. (B) Super-resolution
image by VSD reconstruction. (C) Normalized intensity curves along x axis. The white
curve was normalized intensity along x direction of the area specified by white rectangle
in (A). The green curve was normalized intensity along x direction of the area specified
by green rectangle in (B). (D) Normalized intensity curves along x axis. The blue curve
was normalized intensity along y direction of the area specified by blue rectangle in (A).
The red curve was normalized intensity along y direction of the area specified by red
rectangle in (B).
3.3. VSD-based super-resolution imaging of isolated retina
The second step of this study was to verify the feasibility of the VSD-based super-
resolution imaging of photoreceptors in intact retina. We used the freshly isolated frog
retina for this technical validation. The diameter of frog rods is ~5-8 mm, and cones ~1-3
mm [26, 27]. Therefore, conventional SLM which has lateral resolution 5 mm could only
resolve partial amount of photoreceptors in Fig. 4A. In contrast, the VSD-based super-
x
y
A B
C D
x
y
30 mm 30 mm
SLM VSD
20
15
10
5
0
0.0 0.2 0.4 0.6 0.8 1.0
Normalized Intensity
y (m
m)
VSD
SLM0 5 10 15 20
0.0
0.2
0.4
0.6
0.8
1.0 VSD
Norm
aliz
ed Inte
nsity
x (mm)
SLM
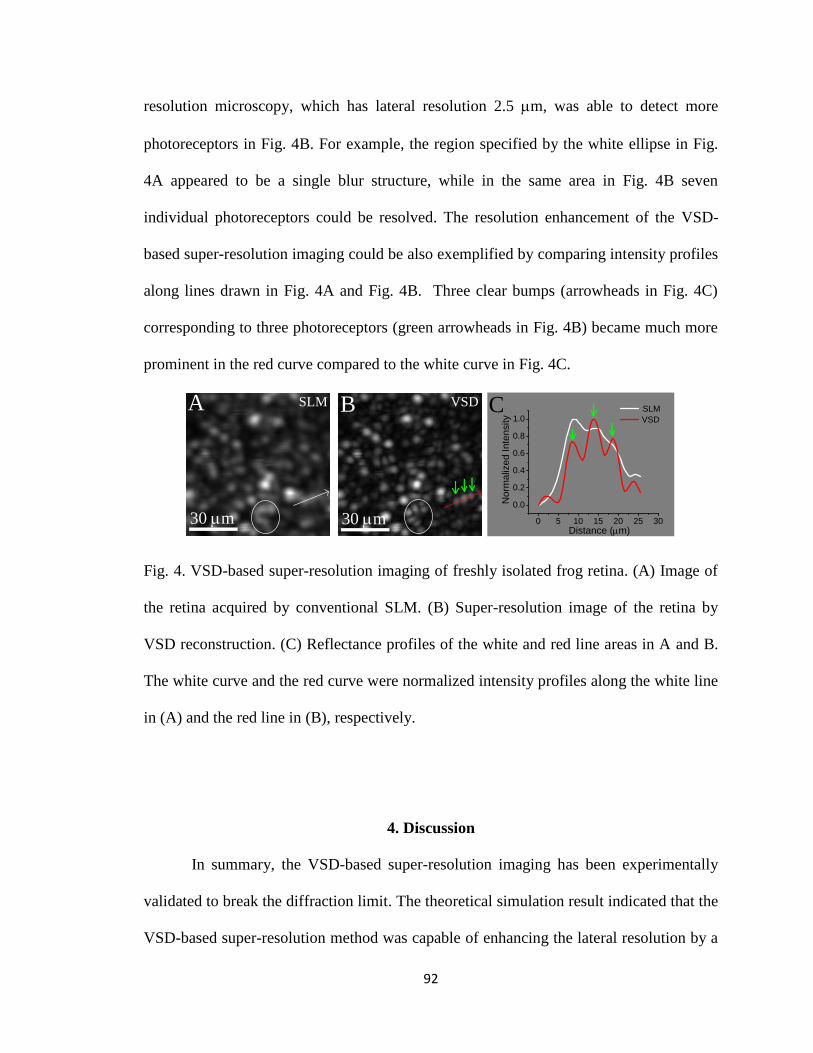
92
resolution microscopy, which has lateral resolution 2.5 mm, was able to detect more
photoreceptors in Fig. 4B. For example, the region specified by the white ellipse in Fig.
4A appeared to be a single blur structure, while in the same area in Fig. 4B seven
individual photoreceptors could be resolved. The resolution enhancement of the VSD-
based super-resolution imaging could be also exemplified by comparing intensity profiles
along lines drawn in Fig. 4A and Fig. 4B. Three clear bumps (arrowheads in Fig. 4C)
corresponding to three photoreceptors (green arrowheads in Fig. 4B) became much more
prominent in the red curve compared to the white curve in Fig. 4C.
Fig. 4. VSD-based super-resolution imaging of freshly isolated frog retina. (A) Image of
the retina acquired by conventional SLM. (B) Super-resolution image of the retina by
VSD reconstruction. (C) Reflectance profiles of the white and red line areas in A and B.
The white curve and the red curve were normalized intensity profiles along the white line
in (A) and the red line in (B), respectively.
4. Discussion
In summary, the VSD-based super-resolution imaging has been experimentally
validated to break the diffraction limit. The theoretical simulation result indicated that the
VSD-based super-resolution method was capable of enhancing the lateral resolution by a
A BSLM VSD C
30 mm 30 mm 0 5 10 15 20 25 30
0.0
0.2
0.4
0.6
0.8
1.0
No
rma
lize
d I
nte
nsity
Distance (mm)
VSD
SLM
93
factor of two (Fig. 2). Experimental imaging of optical target (Fig. 3) and isolated retina
(Fig. 4) verified that the VSD-based super-resolution imaging revealed detailed structures
that were not detectable in conventional SLM. Although the VSD-based method can be
implemented in an imaging system with a high magnification objective, we selected a
relatively low magnification objective (5X) in this study for technical validation of super-
resolution imaging of retinal photoreceptors.
The VSD-based super-resolution imaging has two technical merits over
conventional SIM. First, the VSD-based super-resolution imaging is modulation artifact
free. In conventional SIM systems, dynamic phase (e.g., 0o, 120
o and 240
o) modulation of
structured illumination (e.g., sinusoidal gratings) is necessary for super-resolution
reconstruction. Therefore, precise phase manipulation of illumination patterns is
necessary, which makes conventional SIM vulnerable to modulation artifacts [30, 31]. In
contrast, the VSD-based super-resolution imaging applies virtual modulation digitally,
and thus it is modulation artifact free. Second, the VSD-based super-resolution imaging
provides improved sectioning ability. In conventional wide-field SIM, only modulation
with positive magnitude on the illumination is allowed [12]. Therefore, there is a DC
component in Eq. (8):
0, 1 cos 2m x y f xcos ysin (17)
Eq. (15) consequently becomes:
0 0
0 0
, , ,
0.5 , ,
(18)0.5 , ,
x y il x y x y
i
il x y x y
i
il x y x y
p f f h f f s f f
h f f s f f cos f f sin e
h f f s f f cos f f sin e
94
The first item in Eq. (18) contains the zero spatial frequency that does not attenuate with
defocus in a wide-field illumination system [32]. Although the structured illumination
can theoretically remove the first item in Eq. (18), the first item may become dominant
and overwhelm the second and third items that contain super-resolution information in a
complex structure, especially in thick tissues. Thus, it has been challenging to conduct
wide-field SIM in deep (> 100 mm) tissues. In contrast, a confocal configuration, such as
the VSD-based super-resolution imaging, can provide improved sectioning capability,
due to attenuated zero spatial frequency signals correlated with out-of-focus volumes [33].
In order to further improve the sectioning ability, we are currently pursuing a VSD-based
super-resolution optical coherence tomography (OCT). We anticipate the OCT technique
can provide improved penetration capability and enhanced imaging resolution in deep
tissues. Moreover, we anticipate that VSD can have extended application in super-
resolution assessment of retinal structures in vivo. High resolution is important for
advanced retinal study and diagnosis. Adaptive optics (AO) [34] has been used to
compensate for optical aberration of ocular optics to achieve diffraction limited
resolution [35, 36]. Further integration of VSD into SLO promises a possible strategy to
break the diffraction limit in in vivo imaging of the retina.
5. Conclusion
The VSD-based super-resolution imaging has been demonstrated as a new
strategy to break the diffraction limit. The VSD method is modulation artifact free, with
improved sectioning ability, compared to wide-field SIM. In addition to confocal SLM
demonstrated in this paper, the VSD method can be integrated into other imaging

95
modalities, such as line-scan confocal imager [37, 38], multifocal scanning system [39],
OCT, SLO, etc..
Acknowledgments
This research is supported in part by NSF CBET-1055889, NIH R21 RR025788,
NIH R21 EB012264, and UASOM I3 Pilot Award.
96
Reference
1. S. W. Hell and J. Wichmann, "Breaking the diffraction resolution limit by stimulated
emission: stimulated-emission-depletion fluorescence microscopy," Opt. Lett. 19,
780-782 (1994).
2. S. Berning, K. I. Willig, H. Steffens, P. Dibaj, and S. W. Hell, "Nanoscopy in a living
mouse brain," Science 335, 551 (2012).
3. M. J. Rust, M. Bates, and X. Zhuang, "Sub-diffraction-limit imaging by stochastic
optical reconstruction microscopy (STORM)," Nat. Methods 3, 793-795 (2006).
4. E. Betzig, G. H. Patterson, R. Sougrat, O. W. Lindwasser, S. Olenych, J. S.
Bonifacino, M. W. Davidson, J. Lippincott-Schwartz, and H. F. Hess, "Imaging
intracellular fluorescent proteins at nanometer resolution," Science 313, 1642-1645
(2006).
5. M. F. Juette, T. J. Gould, M. D. Lessard, M. J. Mlodzianoski, B. S. Nagpure, B. T.
Bennett, S. T. Hess, and J. Bewersdorf, "Three-dimensional sub-100 nm resolution
fluorescence microscopy of thick samples," Nat. Methods 5, 527-529 (2008).
6. S. A. Jones, S. H. Shim, J. He, and X. Zhuang, "Fast, three-dimensional super-
resolution imaging of live cells," Nat. Methods 8, 499-508 (2011).
7. S. H. Shim, C. Xia, G. Zhong, H. P. Babcock, J. C. Vaughan, B. Huang, X. Wang, C.
Xu, G. Q. Bi, and X. Zhuang, "Super-resolution fluorescence imaging of organelles in
live cells with photoswitchable membrane probes," Proc. Natl. Acad. Sci. U. S. A.
109, 13978-13983 (2012).
8. H. Shroff, C. G. Galbraith, J. A. Galbraith, H. White, J. Gillette, S. Olenych, M. W.
Davidson, and E. Betzig, "Dual-color superresolution imaging of genetically
expressed probes within individual adhesion complexes," Proc. Natl. Acad. Sci. U. S.
A. 104, 20308-20313 (2007).
9. M. Bertero, P. Brianzi, and E. Pike, "Super-resolution in confocal scanning
microscopy," Inverse Probl. 3, 195-212 (1987).
10. M. Bertero, P. Boccacci, M. Defrise, C. De Mol, and E. Pike, "Super-resolution in
confocal scanning microscopy: II. The incoherent case," Inverse Probl. 5, 441-461
(1989).
11. M. Defrise and C. De Mol, "Super-resolution in confocal scanning microscopy:
generalized inversion formulae," Inverse Probl. 8, 175-185 (1992).
12. M. G. Gustafsson, "Surpassing the lateral resolution limit by a factor of two using
structured illumination microscopy," J. Microsc. 198, 82-87 (2000).
97
13. M. G. Gustafsson, "Nonlinear structured-illumination microscopy: wide-field
fluorescence imaging with theoretically unlimited resolution," Proc. Natl. Acad. Sci.
U. S. A. 102, 13081-13086 (2005).
14. M. G. Gustafsson, L. Shao, P. M. Carlton, C. J. Wang, I. N. Golubovskaya, W. Z.
Cande, D. A. Agard, and J. W. Sedat, "Three-dimensional resolution doubling in
wide-field fluorescence microscopy by structured illumination," Biophys. J. 94, 4957-
4970 (2008).
15. D. Debarre, E. J. Botcherby, M. J. Booth, and T. Wilson, "Adaptive optics for
structured illumination microscopy," Opt. Express 16, 9290-9305 (2008).
16. D. Karadaglic and T. Wilson, "Image formation in structured illumination wide-field
fluorescence microscopy," Micron 39, 808-818 (2008).
17. J. Lu, W. Min, J. A. Conchello, X. S. Xie, and J. W. Lichtman, "Super-resolution
laser scanning microscopy through spatiotemporal modulation," Nano Lett. 9, 3883-
3889 (2009).
18. D. M. Rector, D. M. Ranken, and J. S. George, "High-performance confocal system
for microscopic or endoscopic applications," Methods 30, 16-27 (2003).
19. M. Rajadhyaksha, R. R. Anderson, and R. H. Webb, "Video-rate confocal scanning
laser microscope for imaging human tissues in vivo," Appl. Opt. 38, 2105-2115
(1999).
20. A. Dubra, Y. Sulai, J. L. Norris, R. F. Cooper, A. M. Dubis, D. R. Williams, and J.
Carroll, "Noninvasive imaging of the human rod photoreceptor mosaic using a
confocal adaptive optics scanning ophthalmoscope," Biomed. Opt. Express 2, 1864-
1876 (2011).
21. M. J. Booth, M. A. Neil, R. Juskaitis, and T. Wilson, "Adaptive aberration correction
in a confocal microscope," Proc. Natl. Acad. Sci. U. S. A. 99, 5788-5792 (2002).
22. T. Y. Chui, D. A. Vannasdale, and S. A. Burns, "The use of forward scatter to
improve retinal vascular imaging with an adaptive optics scanning laser
ophthalmoscope," Biomed. Opt. Express 3, 2537-2549 (2012).
23. T. Wilson and A. R. Carlini, "Size of the detector in confocal imaging systems," Opt.
Lett. 12, 227-229 (1987).
24.M. Bertero and P. Boccacci, "Super-resolution in computational imaging," Micron 34,
265-273 (2003).
25. M. G. L. Gustafsson, D. A. Agard, and J. W. Sedat, "Doubling the lateral resolution
of wide-field fluorescence microscopy using structured illumination," Proc. SPIE
3919, 141-150 (2000).
98
26. S. E. Nilsson, "An Electron Microscopic Classification of the Retinal Receptors of the
Leopard Frog (Rana Pipiens)," J. Ultrastruct. Res. 10, 390-416 (1964).
27. P. A. Liebman and G. Entine, "Visual pigments of frog and tadpole (Rana pipiens),"
Vision Res. 8, 761-775 (1968).
28. X. C. Yao and Y. B. Zhao, "Optical dissection of stimulus-evoked retinal activation,"
Opt. Express 16, 12446-12459 (2008).
29. X. C. Yao, A. Yamauchi, B. Perry, and J. S. George, "Rapid optical coherence
tomography and recording functional scattering changes from activated frog retina,"
Appl. Opt. 44, 2019-2023 (2005).
30. S. A. Shroff, J. R. Fienup, and D. R. Williams, "Phase-shift estimation in sinusoidally
illuminated images for lateral superresolution," J. Opt. Soc. Am. A Opt. Image Sci.
Vis. 26, 413-424 (2009).
31. S. A. Shroff, J. R. Fienup, and D. R. Williams, "Lateral superresolution using a
posteriori phase shift estimation for a moving object: experimental results," J. Opt.
Soc. Am. A Opt. Image Sci. Vis. 27, 1770-1782 (2010).
32. M. A. Neil, R. Juskaitis, and T. Wilson, "Method of obtaining optical sectioning by
using structured light in a conventional microscope," Opt. Lett. 22, 1905-1907 (1997).
33. T. Wilson, Confocal microscopy (Academic Press, London, 1990)
34. J. Liang, D. R. Williams, and D. T. Miller, "Supernormal vision and high-resolution
retinal imaging through adaptive optics," J. Opt. Soc. Am. A 14, 2884-2892 (1997).
35. D. Merino, J. L. Duncan, P. Tiruveedhula, and A. Roorda, "Observation of cone and
rod photoreceptors in normal subjects and patients using a new generation adaptive
optics scanning laser ophthalmoscope," Biomed. Opt. Express 2, 2189-2201 (2011).
36. R. J. Zawadzki, S. M. Jones, S. Pilli, S. Balderas-Mata, D. Y. Kim, S. S. Olivier, and
J. S. Werner, "Integrated adaptive optics optical coherence tomography and adaptive
optics scanning laser ophthalmoscope system for simultaneous cellular resolution in
vivo retinal imaging," Biomed. Opt. Express 2, 1674-1686 (2011).
37. Q. X. Zhang, R. W. Lu, C. A. Curcio, and X. C. Yao, "In vivo confocal intrinsic
optical signal identification of localized retinal dysfunction," Invest. Ophthalmol. Vis.
Sci. 53, 8139-8145 (2012).
38. Q. X. Zhang, R. W. Lu, Y. G. Li, and X. C. Yao, "In vivo confocal imaging of fast
intrinsic optical signals correlated with frog retinal activation," Opt. Lett. 36, 4692-
4694 (2011).
39. Q. X. Zhang, J. Y. Wang, L. Liu, and X. C. Yao, "Microlens array recording of
localized retinal responses," Opt. Lett. 35, 3838-3840 (2010).

99
RAPID SUPER-RESOLUTION LINE SCANNING MICROSCOPY THROUGH
VIRTUALLY STRUCTURED DETECTION
by
RONGWEN LU, YANAN ZHI, BENQUAN WANG, QIUXIANG ZHANG AND
XINCHENG YAO
In Preparation for Optics Letters
Format adapted for dissertation
100
Abstract
Virtually structured detection (VSD) has been demonstrated to achieve resolution-
doubling in scanning laser microscopy (SLM) and optical coherence tomography (OCT).
The VSD provides an easy, low-cost and phase-artifact free strategy to achieve super-
resolution imaging. However, deployable application of the method is challenged by
limited frame speed. We report here to combine the VSD to line scanning microscopy
(LSM) to improve imaging speed. A motorized dove prism is employed to achieve
automatic control of four-angle (0o, 45
o, 90
o and 135
o) scanning, and thus to ensure
isotropic resolution improvement. Optical resolution target and living retinal tissue are
used to verify the resolution-doubling.
OCIS codes: (100.6640) Superresolution; (170.3880) Medical and biological imaging;
(180.5810) Scanning Microscopy.
Body of Paper
Advanced light microscopy possesses important role in laboratory research and
clinical diagnosis due to its excellent ability to identify fine structures invisible to naked
eyes. Multiple imaging modalities such as phase contrast microscopy, differential
interference contrast (DIC), confocal scanning laser microscopy (SLM), and fluorescence
microscopy have been developed to extend the capabilities of light microscopy. However,
spatial resolution of conventional microscopy is fundamentally limited by light
diffraction. For fluorescence imaging, multiple strategies have been developed to break
the diffraction limit, such as stimulated emission depletion (STED) microscopy,
stochastic optical reconstruction microscopy (STORM) [1], photoactivated localization
101
microscopy (PALM) [2], fluorescence PALM (FPALM) [3] and structured illumination
microscopy (SIM) [4-6]. For the STED imaging, the shape of effective illumination point
spread function (PSF) of the excitation light is sharpened by doughnut-shape depletion
light which deactivates peripheral regions of the center focal spot while leaving the
fluorophores at the desired center to emit fluorescence. Single-molecule imaging, i.e.,
STORM, PALM, and FPALM, alternatively can achieve super-resolution resolution by
localizing centroids of individual single molecules with photo-switchable fluorescence
probes. Both STED and single-molecular imaging modalities requires specific dyes or
fluorescent proteins, and are not suitable for autofluorescence imaging or intrinsic signal
(i.e., reflection or transmission) imaging.
The SIM is applicable to both fluorescence [4-6] and intrinsic signal imaging [7,
8]. The SIM requires a sinusoidal patterned illumination to shift some high frequency
information beyond the diffraction limit to the lower frequency, and thus the passing
band of one optical system can be effectively expanded. However, for the purpose of the
reconstruction, the SIM requires complicated mechanical manipulation of grating [4-6] or
grid [9, 10] to generate structured illumination patterns with specific phases, which is
particularly challenging for the moving sample. In addition, the SIM (i.e., epi-
illumination SIM) employs wide field illumination which is difficult to penetrate through
thick (i.e. > 100 mm) tissues. There are currently two strategies to modify the epi-
illumination SIM for applications in thick tissues. First, the wide field illumination is
condensed to a single line illumination which consists of two superimposed lines of
illumination [11, 12]. Along the longitudinal direction the intensity is modulated with
sinusoidal function because of interference of two illumination lines. Therefore, there
102
will be resolution enhancement along this direction, just as epi-illumination SIM, while at
the same time the condensed illumination allows optical sectioning by reducing the out-
of-focus light. However, in this scheme, the axial resolution is compromised by the
reduced effective numerical aperture of the objective [11]. The other strategy is to
combine the structured illumination with light sheet illumination [13, 14]. Perpendicular
to the direction of observation, a sheet of structured light pattern is sent to the sample.
Because only the volume close to the focal plane of the detection objective is illuminated,
the structured light sheet microscopy could provide unparalleled optical sectioning ability.
However, it is not practical to employ the light sheet approach for in vivo applications
such as cortex or retinal imaging.
In theory, SIM can also be realized in a point scanning system through
spatiotemporal modulation, either by modulating light source intensity in illumination
light path or by moving a physical mask in detection light path [15]. However, the
spatiotemporal modulation of the illumination/detection light is technically difficult. So
far, experimental validation of the proposed spatiotemporal modulation is not yet
demonstrated. We recently demonstrated the VSD-based super-resolution SLM [16] and
OCT [17], which requires neither dynamic modulation of the light source intensity in
illumination arm nor the physical mask in light detection arm [15]. However, the imaging
speed of our prototype SLM was limited. Instead of using a high speed photo detector in
conventional confocal microscope, a digital camera was required for capturing light
profile of individual sampling points in the VSD-based SLM. Typically, it took ~40 s
(100 × 100 mm) to collect data necessary for one super-resolution image. In this paper,
we report a system to combine VSD to line scanning microscopy (LSM) to enhance the
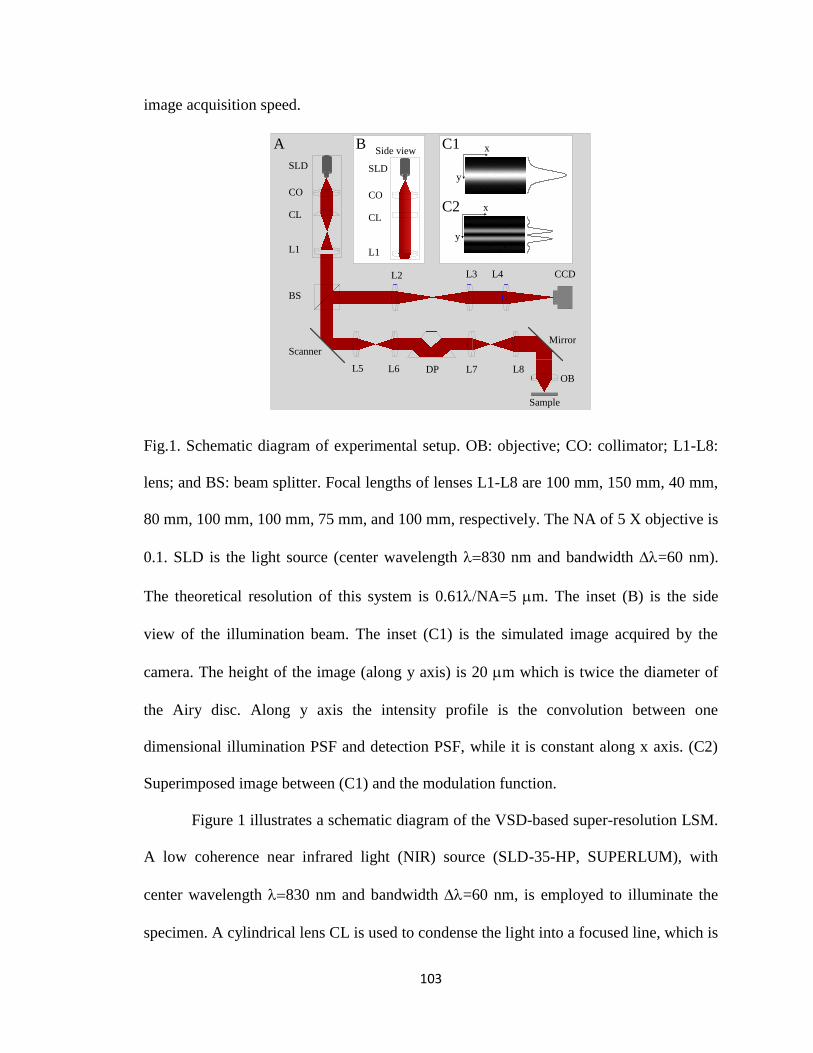
103
image acquisition speed.
Fig.1. Schematic diagram of experimental setup. OB: objective; CO: collimator; L1-L8:
lens; and BS: beam splitter. Focal lengths of lenses L1-L8 are 100 mm, 150 mm, 40 mm,
80 mm, 100 mm, 100 mm, 75 mm, and 100 mm, respectively. The NA of 5 X objective is
0.1. SLD is the light source (center wavelength 830 nm and bandwidth =60 nm).
The theoretical resolution of this system is 0.61NA=5 mm. The inset (B) is the side
view of the illumination beam. The inset (C1) is the simulated image acquired by the
camera. The height of the image (along y axis) is 20 mm which is twice the diameter of
the Airy disc. Along y axis the intensity profile is the convolution between one
dimensional illumination PSF and detection PSF, while it is constant along x axis. (C2)
Superimposed image between (C1) and the modulation function.
Figure 1 illustrates a schematic diagram of the VSD-based super-resolution LSM.
A low coherence near infrared light (NIR) source (SLD-35-HP, SUPERLUM), with
center wavelength 830 nm and bandwidth =60 nm, is employed to illuminate the
specimen. A cylindrical lens CL is used to condense the light into a focused line, which is
CL
Scanner
CO
SLD
L1
L8OB
Mirror
Sample
BS
Side view
DP L7
L4 CCD
CL
CO
SLD
L1
L2 L3
L5 L6
A B C1
C2
x
y
x
y
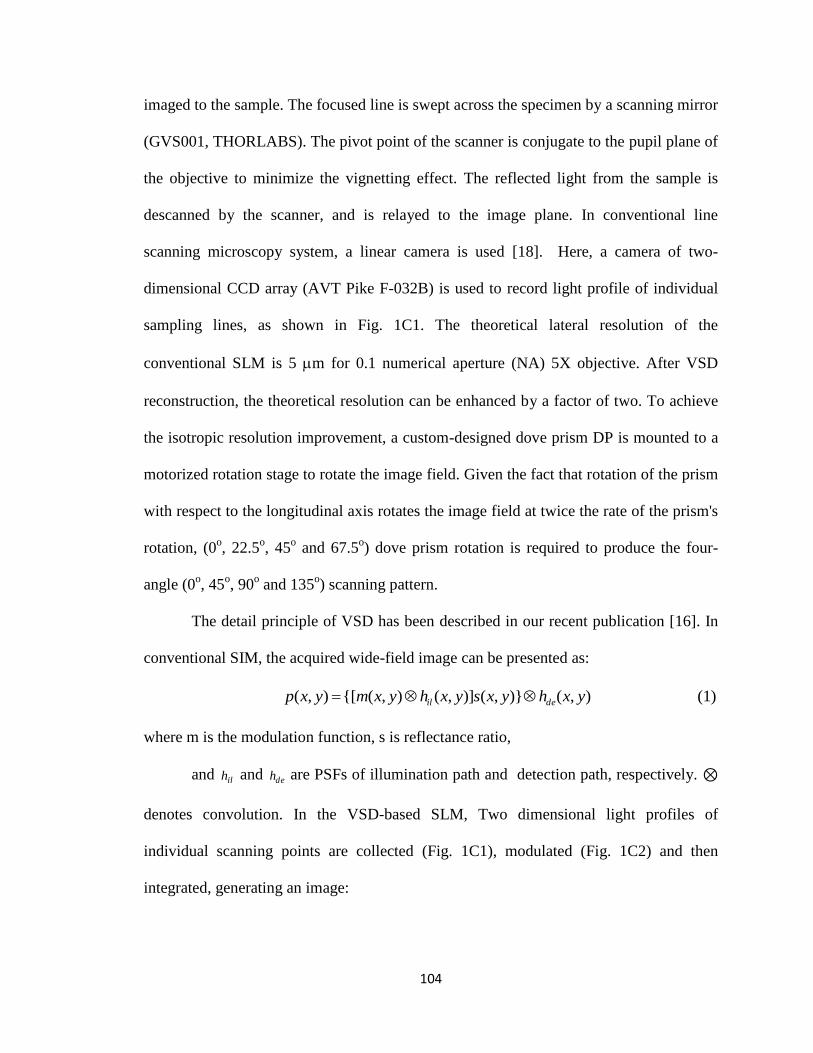
104
imaged to the sample. The focused line is swept across the specimen by a scanning mirror
(GVS001, THORLABS). The pivot point of the scanner is conjugate to the pupil plane of
the objective to minimize the vignetting effect. The reflected light from the sample is
descanned by the scanner, and is relayed to the image plane. In conventional line
scanning microscopy system, a linear camera is used [18]. Here, a camera of two-
dimensional CCD array (AVT Pike F-032B) is used to record light profile of individual
sampling lines, as shown in Fig. 1C1. The theoretical lateral resolution of the
conventional SLM is 5 mm for 0.1 numerical aperture (NA) 5X objective. After VSD
reconstruction, the theoretical resolution can be enhanced by a factor of two. To achieve
the isotropic resolution improvement, a custom-designed dove prism DP is mounted to a
motorized rotation stage to rotate the image field. Given the fact that rotation of the prism
with respect to the longitudinal axis rotates the image field at twice the rate of the prism's
rotation, (0o, 22.5
o, 45
o and 67.5
o) dove prism rotation is required to produce the four-
angle (0o, 45
o, 90
o and 135
o) scanning pattern.
The detail principle of VSD has been described in our recent publication [16]. In
conventional SIM, the acquired wide-field image can be presented as:
(1) ),()},()],(),({[),( yxhyxsyxhyxmyxp deil
where m is the modulation function, s is reflectance ratio,
and ilh and deh are PSFs of illumination path and detection path, respectively. ⊗
denotes convolution. In the VSD-based SLM, Two dimensional light profiles of
individual scanning points are collected (Fig. 1C1), modulated (Fig. 1C2) and then
integrated, generating an image:
105
(2) ),()},()],(),({[
)]},(),()[,({),(
),(),()],(),([
),(
yxhyxsyxhyxm
yxmyxhyxsyxh
dudvvumvuhvusyvxuh
yxp
ilde
deil
deil
where the fact that ilh and deh are even functions is applied. If we assume ilh and deh are
identical, then Eq. (1) is exactly equivalent to Eq. (2). In other word, modulations in the
illumination arm and in the detection arm are equivalent to each other in theory. If we
only consider one dimension (i.e., along y axis) as for the VSD-based LSM, Eq. (2) can
be rewritten:
(3) )()}()]()({[ )( yhysyhymyp ilde
Along y axis, the resolution can be doubled, while along x axis, the resolution keeps the
same as the wide field microscopy. Therefore, the image field needs to be rotated to
achieve isotropic resolution doubling.
We select a region of interest (ROI) of the camera using a virtual slit of 2X Airy
disc diameters for VSD reconstruction. Considering the pixel size of the camera is 7.4 ×
7.4 mm and the magnification of the system is 11.11, 2X Airy disc diameters is
corresponding to ~31 pixels at the image plane. At the x direction, although we could set
the maximum length of 640 pixels, we choose 150 pixels so that the field of view is
identical to our early works for quantitative comparison. Therefore, the ROI of the
camera area is 31 × 150 pixels. Along y axis, we sample 150 lines. Thus the final
reconstructed super-resolution image size is 150 × 150 pixels. Each raw CCD frame takes
1 ms. To cover the same field of view (150 × 150 pixels), the single point VSD scheme in
our prototype instrument requires ~40 s. In contrast, the line scanning scheme only
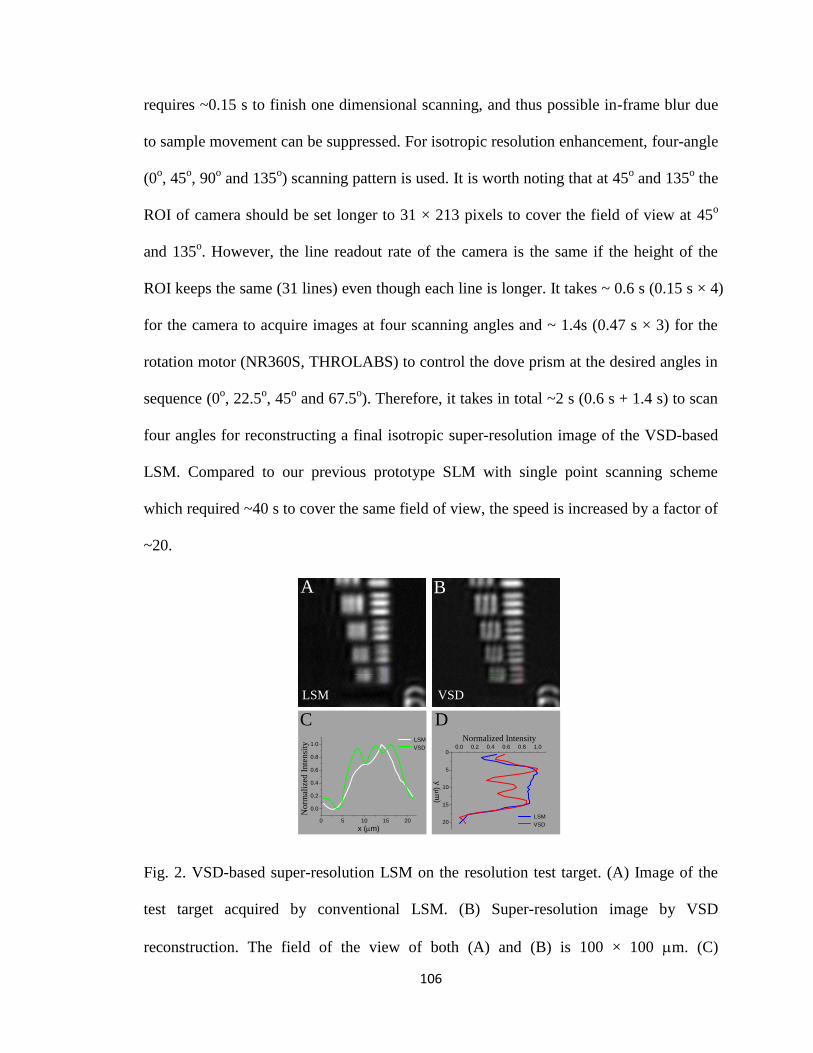
106
requires ~0.15 s to finish one dimensional scanning, and thus possible in-frame blur due
to sample movement can be suppressed. For isotropic resolution enhancement, four-angle
(0o, 45
o, 90
o and 135
o) scanning pattern is used. It is worth noting that at 45
o and 135
o the
ROI of camera should be set longer to 31 × 213 pixels to cover the field of view at 45o
and 135o. However, the line readout rate of the camera is the same if the height of the
ROI keeps the same (31 lines) even though each line is longer. It takes ~ 0.6 s (0.15 s × 4)
for the camera to acquire images at four scanning angles and ~ 1.4s (0.47 s × 3) for the
rotation motor (NR360S, THROLABS) to control the dove prism at the desired angles in
sequence (0o, 22.5
o, 45
o and 67.5
o). Therefore, it takes in total ~2 s (0.6 s + 1.4 s) to scan
four angles for reconstructing a final isotropic super-resolution image of the VSD-based
LSM. Compared to our previous prototype SLM with single point scanning scheme
which required ~40 s to cover the same field of view, the speed is increased by a factor of
~20.
Fig. 2. VSD-based super-resolution LSM on the resolution test target. (A) Image of the
test target acquired by conventional LSM. (B) Super-resolution image by VSD
reconstruction. The field of the view of both (A) and (B) is 100 × 100 mm. (C)
VSDLSM
A B
No
rmal
ized
In
ten
sity
Normalized Intensity
C D
0 5 10 15 20
0.0
0.2
0.4
0.6
0.8
1.0
x (mm)
LSM
VSD
20
15
10
5
00.0 0.2 0.4 0.6 0.8 1.0
y (m
m)
LSM
VSD
107
Normalized intensity profiles along x axis. The white curve was normalized intensity
profile along the white line in (A). The green curve was normalized intensity profile
along the green line in (B). (D) Normalized intensity profiles along y axis. The blue
curve was normalized intensity profile along the blue line in (A). The red curve was
normalized intensity profile along the red line in (B).
A standard resolution target (USAF 1951 1X, EDMOND) was employed to verify
the resolution enhancement of the VSD-based super-resolution LSM. Fig.2 shows the
comparison between conventional LSM (Fig. 2A) and VSD-based super-resolution LSM
(Fig. 2B) images. The smallest grating has a period of 4.4 mm. Therefore, the
conventional LSM which has a theoretical resolution of 5 mm could not differentiate them,
as shown in Fig. 2A. In contrast, after VSD reconstruction, the smallest grating could be
resolved, in both horizontal direction (specified by green line in Fig. 2B) and the vertical
direction (specified by red line in Fig. 2B). The resolution enhancement could be
confirmed in Figs. 2C and 2D. In Fig. 2C, three bumps could be observed in the green
curve which is the intensity profile along the horizontal green line in Fig. 2B, while it is
difficult to differentiate them at the white curve which is the intensity profile along the
horizontal white line in Fig. 2A. Likewise, in Fig. 2D three bumps along y axis could be
resolved (red curve in Fig. 2D) after VSD reconstruction, while they are hidden in the
blue curve in Fig. 2D before VSD reconstruction.
Freshly isolated frog (Rana Pipiens) retina was also used for functional validation
of the VSD-based super-resolution LSM system. It is established that the frog retina
consists of photoreceptors with variable diameters (rods: ~5-8 mm; cones: ~1-3 mm) [19,
20]. Therefore, the frog retina provides a simple preparation to evaluate the LSM
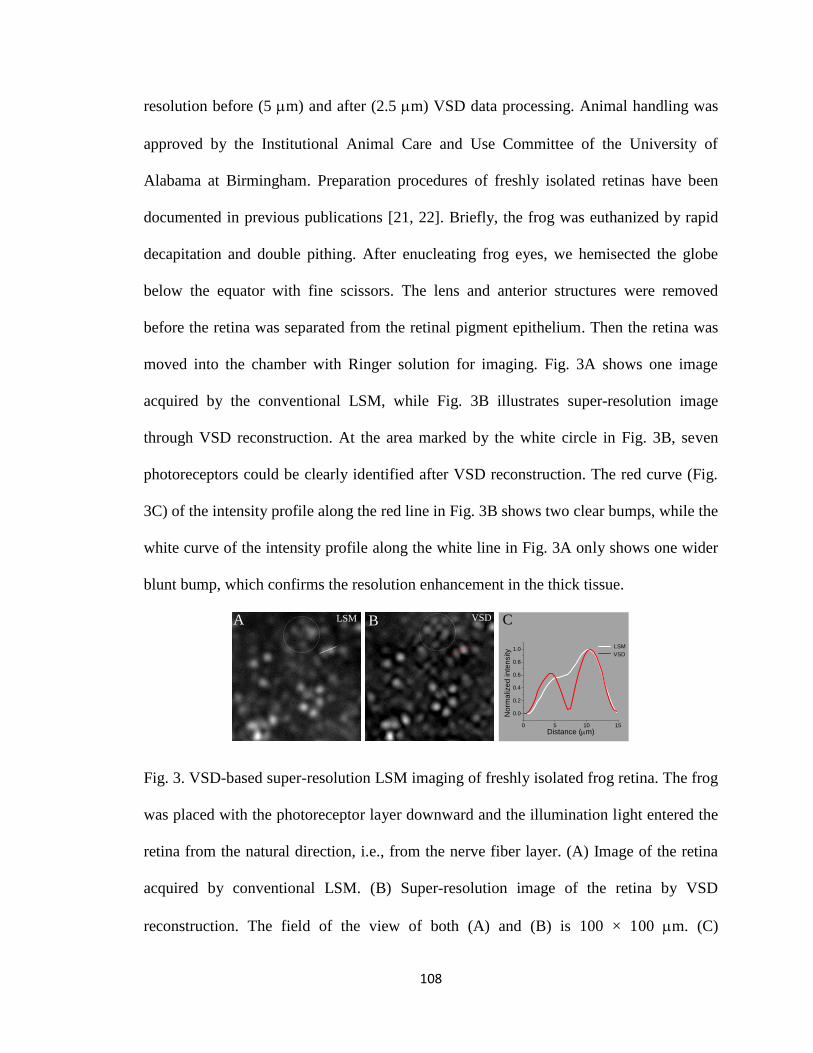
108
resolution before (5 mm) and after (2.5 mm) VSD data processing. Animal handling was
approved by the Institutional Animal Care and Use Committee of the University of
Alabama at Birmingham. Preparation procedures of freshly isolated retinas have been
documented in previous publications [21, 22]. Briefly, the frog was euthanized by rapid
decapitation and double pithing. After enucleating frog eyes, we hemisected the globe
below the equator with fine scissors. The lens and anterior structures were removed
before the retina was separated from the retinal pigment epithelium. Then the retina was
moved into the chamber with Ringer solution for imaging. Fig. 3A shows one image
acquired by the conventional LSM, while Fig. 3B illustrates super-resolution image
through VSD reconstruction. At the area marked by the white circle in Fig. 3B, seven
photoreceptors could be clearly identified after VSD reconstruction. The red curve (Fig.
3C) of the intensity profile along the red line in Fig. 3B shows two clear bumps, while the
white curve of the intensity profile along the white line in Fig. 3A only shows one wider
blunt bump, which confirms the resolution enhancement in the thick tissue.
Fig. 3. VSD-based super-resolution LSM imaging of freshly isolated frog retina. The frog
was placed with the photoreceptor layer downward and the illumination light entered the
retina from the natural direction, i.e., from the nerve fiber layer. (A) Image of the retina
acquired by conventional LSM. (B) Super-resolution image of the retina by VSD
reconstruction. The field of the view of both (A) and (B) is 100 × 100 mm. (C)
A B VSDLSM C
0 5 10 15
0.0
0.2
0.4
0.6
0.8
1.0
No
rma
lize
d in
ten
sity
Distance (mm)
LSM
VSD
109
Reflectance profiles of the white and red lines in A and B. The white curve and the red
curve were normalized intensity profiles along the white line in (A) and the red line in
(B), respectively.
In summary, a line scanning strategy is combined with VSD to achieve rapid
super-resolution imaging. A motorized dove prism is employed to achieve rapid change
of four-angle (0o, 45
o, 90
o and 135
o) scanning, and thus to ensure isotropic resolution
improvement. Both standard resolution target and living retinal tissue are used to verify
the resolution-doubling. Further combination of the VSD to line-scan OCT to improve
the axial resolution is also possible [17].
High imaging speed is important for practical application of the super-resolution
LSM for imaging biological dynamics and moving samples. Currently, it takes ~0.15 s
for one-angle scan and ~2 s in total for four-angle recordings required for one super-
resolution image. It is significantly improved compared to our prototype VSD SLM with
single point scanning scheme which required ~40 s to cover the same field of view (100 ×
100 mm) [16, 17]. Within one-angle scan, the imaging speed is limited by the line readout
rate. If a faster camera is used (i.e., pco.dimax S, PCO-TECH), it is possible to reduce the
time to 5 ms to finish one-angle scan while maintaining the field of view. Thus, in-frame
movements (i.e., movements during one-angle scan) could be minimized for in vivo
applications, i.e., cortex or retinal imaging. The imaging speed for the four-angle scan
which is to ensure isotropic resolution improvement is not only determined by the camera
but also the rotation motor of dove prism. If a faster motorized rotation stage (i.e.,
RGV160BL, NEWPORT) is used, the time required to rotate the dove prism to specific
angles in sequence (0o, 22.5
o, 45
o and 67.5
o) could be reduced to 70 ms (23 ms × 3).
110
Although the time for rotating the dove prism is relatively longer than the imaging time
for the one-angle scan (e.g., 5 ms), the displacement of the sample among different
scanning angles could be corrected by the tracking system or the global registration
method. In principle, future integration of acousto-optic dove prism can provide fast
angle rotation at microsecond speed [23]. We anticipate further development of the VSD-
based LSM could achieve super-resolution imaging in in vivo cortex imaging or retinal
imaging.
This research is supported in part by NIH R01 EY023522, NIH R01 EY024628,
NSF CBET-1055889, and NSF EPSCoR-158862.
References
1. M. J. Rust, M. Bates, and X. Zhuang, "Sub-diffraction-limit imaging by stochastic optical
reconstruction microscopy (STORM)," Nature methods 3, 793-795 (2006).
2. E. Betzig, G. H. Patterson, R. Sougrat, O. W. Lindwasser, S. Olenych, J. S. Bonifacino, M.
W. Davidson, J. Lippincott-Schwartz, and H. F. Hess, "Imaging intracellular fluorescent
proteins at nanometer resolution," Science 313, 1642-1645 (2006).
3. M. F. Juette, T. J. Gould, M. D. Lessard, M. J. Mlodzianoski, B. S. Nagpure, B. T. Bennett,
S. T. Hess, and J. Bewersdorf, "Three-dimensional sub-100 nm resolution fluorescence
microscopy of thick samples," Nature methods 5, 527-529 (2008).
4. M. G. Gustafsson, "Surpassing the lateral resolution limit by a factor of two using
structured illumination microscopy," Journal of microscopy 198, 82-87 (2000).
5. M. G. Gustafsson, "Nonlinear structured-illumination microscopy: wide-field fluorescence
imaging with theoretically unlimited resolution," Proceedings of the National Academy of
Sciences of the United States of America 102, 13081-13086 (2005).
6. M. G. Gustafsson, L. Shao, P. M. Carlton, C. J. Wang, I. N. Golubovskaya, W. Z. Cande,
D. A. Agard, and J. W. Sedat, "Three-dimensional resolution doubling in wide-field
fluorescence microscopy by structured illumination," Biophysical journal 94, 4957-4970
(2008).
111
7. S. Chowdhury, A. H. Dhalla, and J. Izatt, "Structured oblique illumination microscopy for
enhanced resolution imaging of non-fluorescent, coherently scattering samples,"
Biomedical optics express 3, 1841-1854 (2012).
8. J. H. Park, J. Y. Lee, and E. S. Lee, "Enhancing the isotropy of lateral resolution in
coherent structured illumination microscopy," Biomedical optics express 5, 1895-1912
(2014).
9. D. Debarre, E. J. Botcherby, M. J. Booth, and T. Wilson, "Adaptive optics for structured
illumination microscopy," Optics express 16, 9290-9305 (2008).
10. D. Karadaglic and T. Wilson, "Image formation in structured illumination wide-field
fluorescence microscopy," Micron 39, 808-818 (2008).
11. T. Kim, D. Gweon, and J. H. Lee, "Enhancement of fluorescence confocal scanning
microscopy lateral resolution by use of structured illumination," Meas Sci Technol
20(2009).
12. O. Mandula, M. Kielhorn, K. Wicker, G. Krampert, I. Kleppe, and R. Heintzmann, "Line
scan--structured illumination microscopy super-resolution imaging in thick fluorescent
samples," Optics express 20, 24167-24174 (2012).
13. L. Gao, L. Shao, B. C. Chen, and E. Betzig, "3D live fluorescence imaging of cellular
dynamics using Bessel beam plane illumination microscopy," Nature protocols 9, 1083-
1101 (2014).
14. T. A. Planchon, L. Gao, D. E. Milkie, M. W. Davidson, J. A. Galbraith, C. G. Galbraith,
and E. Betzig, "Rapid three-dimensional isotropic imaging of living cells using Bessel
beam plane illumination," Nature methods 8, 417-423 (2011).
15. J. Lu, W. Min, J. A. Conchello, X. S. Xie, and J. W. Lichtman, "Super-resolution laser
scanning microscopy through spatiotemporal modulation," Nano letters 9, 3883-3889
(2009).
16. R. W. Lu, B. Q. Wang, Q. X. Zhang, and X. C. Yao, "Super-resolution scanning laser
microscopy through virtually structured detection," Biomedical optics express 4, 1673-
1682 (2013).
17. B. Wang, R. Lu, Q. Zhang, and X. Yao, "Breaking diffraction limit of lateral resolution in
optical coherence tomography," Quant Imaging Med Surg 3, 243-248 (2013).
18. R. W. Lu, C. A. Curcio, Y. Zhang, Q. X. Zhang, S. J. Pittler, D. Deretic, and X. C. Yao,
"Investigation of the hyper-reflective inner/outer segment band in optical coherence
tomography of living frog retina," Journal of biomedical optics 17, 060504 (2012).
19. S. E. Nilsson, "An Electron Microscopic Classification of the Retinal Receptors of the
Leopard Frog (Rana Pipiens)," Journal of ultrastructure research 10, 390-416 (1964).
112
20. P. A. Liebman and G. Entine, "Visual pigments of frog and tadpole (Rana pipiens)," Vision
research 8, 761-775 (1968).
21. X. C. Yao and Y. B. Zhao, "Optical dissection of stimulus-evoked retinal activation,"
Optics express 16, 12446-12459 (2008).
22. X. C. Yao, A. Yamauchi, B. Perry, and J. S. George, "Rapid optical coherence tomography
and recording functional scattering changes from activated frog retina," Applied optics 44,
2019-2023 (2005).
23. E. G. Paek, J. Y. Choe, T. K. Oh, J. H. Hong, and T. Y. Chang, "Nonmechanical image
rotation with an acousto-optic dove prism," Optics letters 22, 1195-1197 (1997).
113
SUMMARY
The objective of this dissertation is to explore intrinsic structural and functional
biomarkers for assessments of morphological structures and physiological conditions of
the outer retina. This dissertation research is twofold: (1) to investigate two structural
biomarkers (FAF and OCT) and one functional biomarker (transient rod phototropic
adaptation); (2) to develop a super-resolution method, VSD, for confocal scanning
imaging systems to break the diffraction limit on transverse direction, which allows
reliable evaluation of structural and functional biomarkers.
Explorations in FAF imaging using two-photon excitation revealed origins of
FAF throughout retinal depth. Autofluorescence signals could be observed from all
retinal layers. At the PIO, ONL, INL, and GCL, cellular structures could be observed. At
the PIO, autofluorescence signals were dominant in the intracellular compartment of the
photoreceptors. Homogeneous autofluorescence could be observed in the rod outer
segment, while sub-cellular bright spots well above the surrounding area were identified
close to the edge of cone outer segment. These bright spots coincided with the position of
the connecting cilium. They may imply different fluorophores or alternatively a different
optical structure in cones. Mixed intracellular and extracellular autofluorescence signals
were observed at the ONL, INL, and GCL. Autofluorescence signals could be also
observed from the OPL and IPL. Previous studies showed that NAD(P)H and oxidized
flavoproteins in mitochondria could contribute FAF signals [60]. Therefore, they might
be also helpful for functional evaluation of metabolic activates. Further research might
114
reveal discrete features of cones and rods, respectively.
Investigation on OCT biomarkers was to identify anatomic origins of the
presumed ‘IS/OS’ OCT band by comparing OCT images with histological images
quantitatively. LS-OCT was developed to achieve sub-cellular resolution in both lateral
and axial directions to obtain high-quality OCT images to facilitate comparison. The
OCT distance ratio (OCT’IS/OS’-OCTOLM)/(OCTOLM-OCTOPL) was significantly smaller
than the histological distance ratio (HIS/OS-HOLM)/(HOLM-HOPL). The significant difference
suggests that dominant source of the signal reported as the ‘IS/OS’ OCT band actually
originates from the IS.
Examinations on the transient phototropism show that rod photoreceptors in frog
and mouse retinas rapidly shifted toward the incident direction of oblique stimuli on
transverse direction. In contrast, movements of cones were negligible. Such transient
phototropism is one mechanism of observed IOS biomarker. In addition, such rod-
dominant transient phototropic response could compensate for the loss of illumination
efficiency under oblique stimulation in the rod system which may explain for Stiles-
Crawford effect (SCE) is exclusively observed in cone photoreceptors and is absent in
rod photoreceptors. In other words, rapid (onset: ~10 ms for frog and ~ 5 ms for mouse;
time-to-peak: ~200 ms for frog and ~20 ms for mouse) phototropic adaptation in retinal
rods is too quick for the SCE to be detected by conventional psychophysical methods
with the advanced involvement of brain perception. OCT imaging could further
characterize the transient phototropism along the axial direction.
High resolution imaging is important for reliable interpretations of structural and
functional biomarkers. VSD was developed for confocal scanning system to break the
115
diffraction limit on transverse direction. VSD was first integrated to confocal SLM with
single point raster scanning pattern. The theoretical simulation result indicated that the
VSD-based super-resolution method was capable of enhancing the lateral resolution by a
factor of two. Experimental imaging of optical target and isolated retina verified that the
VSD-based super-resolution imaging revealed detailed structures that were not detectable
in conventional SLM. VSD was also applicable for time-domain OCT [19], although the
corresponding published paper was not presented in this dissertation. Because the raster
scanning pattern is time consuming, we integrated VSD to LSM with line scanning
pattern for high speed super-resolution imaging. A motorized dove prism is employed
to achieve rapid change of four-angle (0o, 45o, 90o and 135o) scanning, and thus to
ensure isotropic resolution improvement. Both standard resolution target and
living retinal tissue are used to verify the resolution-doubling. Further combination
of the VSD to line-scan OCT to improve the axial resolution is also possible. High
imaging speed is important for practical application of the super-resolution LSM for
imaging biological dynamics and moving samples. Currently, it takes ~0.15 s for one-
angle scan and ~2 s in total for four-angle recordings required for one super-resolution
image. It is significantly improved compared to the prototype VSD SLM with single
point scanning scheme which required ~40 s to cover the same field of view (100 × 100
mm). The imaging speed could be further improved by using a faster camera and a faster
rotation motor. Within one-angle scan, the imaging time could be reduced to 5 ms.
Therefore, within-frame movements could be minimized for retinal imaging. To finish
four-angle scans, the bottleneck of the imaging speed is limited by the mechanical
movement of the rotation motor. However, if within-frame blurring is minimized, the
116
displacement of the sample among different scanning angles could be corrected by the
tracking system or the global registration method. Therefore, VSD-based LSM with line
scanning pattern promises a practical super-resolution approach for sub-diffraction-
limited in vivo retinal imaging.
In summary, this dissertation research characterized FAF cross all retinal layers,
investigated the origin of the presumed ‘IS/OS’ OCT band, explored the transient
phototropic responses of rod photoreceptors and developed a super-resolution imaging
method for confocal scanning systems. This dissertation could not only contribute to a
better understanding of the existing clinical FAF and OCT biomarkers for eye disease
diagnosis, but also discovered and explored a new functional biomarker, transient
phototropism, which may promise an alternative methodology for early diagnosis of eye
diseases. Moreover, VSD, a super-resolution method developed in this dissertation
research, allows imaging of subtle structural and functional biomarkers for more reliable
assessments of the retina.

117
GENERAL LIST OF REFERENCES
1. S. G. Schuman, A. F. Koreishi, S. Farsiu, S. H. Jung, J. A. Izatt, and C. A. Toth,
"Photoreceptor layer thinning over drusen in eyes with age-related macular degeneration imaged in vivo with spectral-domain optical coherence tomography," Ophthalmology 116, 488-496 e482 (2009).
2. N. M. Bressler, S. B. Bressler, and S. L. Fine, "Age-related macular degeneration," Survey of ophthalmology 32, 375-413 (1988).
3. C. A. Curcio, N. E. Medeiros, and C. L. Millican, "Photoreceptor loss in age-related macular degeneration," Investigative ophthalmology & visual science 37, 1236-1249 (1996).
4. R. M. Petters, C. A. Alexander, K. D. Wells, E. B. Collins, J. R. Sommer, M. R. Blanton, G. Rojas, Y. Hao, W. L. Flowers, E. Banin, A. V. Cideciyan, S. G. Jacobson, and F. Wong, "Genetically engineered large animal model for studying cone photoreceptor survival and degeneration in retinitis pigmentosa," Nature biotechnology 15, 965-970 (1997).
5. C. P. Herbort, "Fluorescein and indocyanine green angiography for uveitis," Middle East African journal of ophthalmology 16, 168-187 (2009).
6. W. R. Freeman, D. U. Bartsch, A. J. Mueller, A. S. Banker, and R. N. Weinreb, "Simultaneous indocyanine green and fluorescein angiography using a confocal scanning laser ophthalmoscope," Archives of ophthalmology 116, 455-463 (1998).
7. M. D. Abramoff, M. K. Garvin, and M. Sonka, "Retinal imaging and image analysis," IEEE reviews in biomedical engineering 3, 169-208 (2010).
8. R. Alford, H. M. Simpson, J. Duberman, G. C. Hill, M. Ogawa, C. Regino, H. Kobayashi, and P. L. Choyke, "Toxicity of organic fluorophores used in molecular imaging: literature review," Molecular imaging 8, 341-354 (2009).
9. M. Hope-Ross, L. A. Yannuzzi, E. S. Gragoudas, D. R. Guyer, J. S. Slakter, J. A. Sorenson, S. Krupsky, D. A. Orlock, and C. A. Puliafito, "Adverse reactions due to indocyanine green," Ophthalmology 101, 529-533 (1994).
10. S. Schmitz-Valckenberg, F. G. Holz, A. C. Bird, and R. F. Spaide, "Fundus autofluorescence imaging: review and perspectives," Retina 28, 385-409 (2008).
11. C. H. Chen, E. Tsina, M. C. Cornwall, R. K. Crouch, S. Vijayaraghavan, and Y. Koutalos, "Reduction of all-trans retinal to all-trans retinol in the outer segments of frog and mouse rod photoreceptors," Biophys J 88, 2278-2287 (2005).
12. M. Han, G. Giese, S. Schmitz-Valckenberg, A. Bindewald-Wittich, F. G. Holz, J. Y.
118
Yu, J. F. Bille, and M. H. Niemz, "Age-related structural abnormalities in the human retina-choroid complex revealed by two-photon excited autofluorescence imaging," Journal of Biomedical Optics 12(2007).
13. Y. Imanishi, K. H. Lodowski, and Y. Koutalos, "Two-photon microscopy: Shedding light on the chemistry of vision," Biochemistry 46, 9674-9684 (2007).
14. R. W. Lu, Y. C. Li, T. Ye, C. Strang, K. Keyser, C. A. Curcio, and X. C. Yao, "Two-photon excited autofluorescence imaging of freshly isolated frog retinas," Biomedical optics express 2, 1494-1503 (2011).
15. R. W. Lu, C. A. Curcio, Y. Zhang, Q. X. Zhang, S. J. Pittler, D. Deretic, and X. C. Yao, "Investigation of the hyper-reflective inner/outer segment band in optical coherence tomography of living frog retina," Journal of biomedical optics 17, 060504 (2012).
16. B. Wang, R. Lu, Q. Zhang, Y. Jiang, and X. Yao, "En face optical coherence tomography of transient light response at photoreceptor outer segments in living frog eyecup," Optics letters 38, 4526-4529 (2013).
17. R. Lu, A. M. Levy, Q. Zhang, S. J. Pittler, and X. Yao, "Dynamic near-infrared imaging reveals transient phototropic change in retinal rod photoreceptors," Journal of biomedical optics 18, 106013 (2013).
18. R. W. Lu, B. Q. Wang, Q. X. Zhang, and X. C. Yao, "Super-resolution scanning laser microscopy through virtually structured detection," Biomedical optics express 4, 1673-1682 (2013).
19. B. Wang, R. Lu, Q. Zhang, and X. Yao, "Breaking diffraction limit of lateral resolution in optical coherence tomography," Quantitative imaging in medicine and surgery 3, 243-248 (2013).
20. M. Minsky, "Memoir on inventing the confocal scanning microscope," Scanning 10, 128-138 (1988).
21. C. Sheppard and T. Wilson, "Image formation in scanning microscopes with partially coherent source and detector," Journal of Modern Optics 25, 315-325 (1978).
22. G. Li, H. Zwick, B. Stuck, and D. J. Lund, "On the use of schematic eye models to estimate retinal image quality," Journal of biomedical optics 5, 307-314 (2000).
23. J. M. Schmitt, "Optical coherence tomography (OCT): a review," Selected Topics in Quantum Electronics, IEEE Journal of 5, 1205-1215 (1999).
24. X. C. Yao, A. Yamauchi, B. Perry, and J. S. George, "Rapid optical coherence tomography and recording functional scattering changes from activated frog retina," Applied optics 44, 2019-2023 (2005).
25. J. M. Huntley, G. H. Kaufmann, and D. Kerr, "Phase-shifted dynamic speckle pattern interferometry at 1 kHz," Applied optics 38, 6556-6563 (1999).
26. H. P. Scholl and E. Zrenner, "Electrophysiology in the investigation of acquired retinal disorders," Survey of ophthalmology 45, 29-47 (2000).
119
27. D. C. Hood, "Assessing retinal function with the multifocal technique," Progress in retinal and eye research 19, 607-646 (2000).
28. R. A. Stepnoski, A. LaPorta, F. Raccuia-Behling, G. E. Blonder, R. E. Slusher, and D. Kleinfeld, "Noninvasive detection of changes in membrane potential in cultured neurons by light scattering," Proceedings of the National Academy of Sciences of the United States of America 88, 9382-9386 (1991).
29. I. Tasaki and P. M. Byrne, "Rapid structural changes in nerve fibers evoked by electric current pulses," Biochemical and biophysical research communications 188, 559-564 (1992).
30. M. W. Kaplan and M. E. Deffebach, "Birefringence measurements of structural inhomogeneities in Rana pipiens rod outer segments," Biophysical journal 23, 59-70 (1978).
31. P. A. Liebman, W. S. Jagger, M. W. Kaplan, and F. G. Bargoot, "Membrane structure changes in rod outer segments associated with rhodopsin bleaching," Nature 251, 31-36 (1974).
32. Q. X. Zhang, R. W. Lu, J. D. Messinger, C. A. Curcio, V. Guarcello, and X. C. Yao, "In vivo Optical Coherence Tomography of Light-Driven Melanosome Translocation in Retinal Pigment Epithelium," Sci Rep 3, 2644 (2013).
33.Y. C. Li, C. Strang, F. R. Amthor, L. Liu, Y. G. Li, Q. X. Zhang, K. Keyser, and X. C. Yao, "Parallel optical monitoring of visual signal propagation from the photoreceptors to the inner retina layers," Optics letters 35, 1810-1812 (2010).
34. Q. X. Zhang, R. W. Lu, C. A. Curcio, and X. C. Yao, "In vivo confocal intrinsic optical signal identification of localized retinal dysfunction," Investigative ophthalmology & visual science 53, 8139-8145 (2012).
35. C. Owsley, G. McGwin, Jr., G. R. Jackson, K. Kallies, and M. Clark, "Cone- and rod-mediated dark adaptation impairment in age-related maculopathy," Ophthalmology 114, 1728-1735 (2007).
36. K. Shintani, D. L. Shechtman, and A. S. Gurwood, "Review and update: current treatment trends for patients with retinitis pigmentosa," Optometry-Journal of the American Optometric Association 80, 384-401 (2009).
37. M. J. Rust, M. Bates, and X. Zhuang, "Sub-diffraction-limit imaging by stochastic optical reconstruction microscopy (STORM)," Nature methods 3, 793-795 (2006).
38. E. Betzig, G. H. Patterson, R. Sougrat, O. W. Lindwasser, S. Olenych, J. S. Bonifacino, M. W. Davidson, J. Lippincott-Schwartz, and H. F. Hess, "Imaging intracellular fluorescent proteins at nanometer resolution," Science 313, 1642-1645 (2006).
39. M. F. Juette, T. J. Gould, M. D. Lessard, M. J. Mlodzianoski, B. S. Nagpure, B. T. Bennett, S. T. Hess, and J. Bewersdorf, "Three-dimensional sub-100 nm resolution fluorescence microscopy of thick samples," Nature methods 5, 527-529 (2008).
40. M. G. Gustafsson, "Surpassing the lateral resolution limit by a factor of two using structured illumination microscopy," Journal of microscopy 198, 82-87 (2000).
120
41. M. G. Gustafsson, "Nonlinear structured-illumination microscopy: wide-field fluorescence imaging with theoretically unlimited resolution," Proceedings of the National Academy of Sciences of the United States of America 102, 13081-13086 (2005).
42. M. G. Gustafsson, L. Shao, P. M. Carlton, C. J. Wang, I. N. Golubovskaya, W. Z. Cande, D. A. Agard, and J. W. Sedat, "Three-dimensional resolution doubling in wide-field fluorescence microscopy by structured illumination," Biophysical journal 94, 4957-4970 (2008).
43. S. Chowdhury, A. H. Dhalla, and J. Izatt, "Structured oblique illumination microscopy for enhanced resolution imaging of non-fluorescent, coherently scattering samples," Biomedical optics express 3, 1841-1854 (2012).
44. J. H. Park, J. Y. Lee, and E. S. Lee, "Enhancing the isotropy of lateral resolution in coherent structured illumination microscopy," Biomedical optics express 5, 1895-1912 (2014).
45. D. Debarre, E. J. Botcherby, M. J. Booth, and T. Wilson, "Adaptive optics for structured illumination microscopy," Optics express 16, 9290-9305 (2008).
46. D. Karadaglic and T. Wilson, "Image formation in structured illumination wide-field fluorescence microscopy," Micron 39, 808-818 (2008).
47. J. Lu, W. Min, J. A. Conchello, X. S. Xie, and J. W. Lichtman, "Super-resolution laser scanning microscopy through spatiotemporal modulation," Nano letters 9, 3883-3889 (2009).
48. Y. J. Sepah, A. Akhtar, M. A. Sadiq, Y. Hafeez, H. Nasir, B. Perez, N. Mawji, D. J. Dean, D. Ferraz, and Q. D. Nguyen, "Fundus autofluorescence imaging: Fundamentals and clinical relevance," Saudi Journal of Ophthalmology 28, 111-116 (2014).
49. S. Schmitz-Valckenberg, A. Bindewald-Wittich, J. Dolar-Szczasny, J. Dreyhaupt, S. Wolf, H. P. Scholl, and F. G. Holz, "Correlation between the area of increased autofluorescence surrounding geographic atrophy and disease progression in patients with AMD," Investigative ophthalmology & visual science 47, 2648-2654 (2006).
50. P. Popović, M. Jarc-Vidmar, and M. Hawlina, "Abnormal fundus autofluorescence in relation to retinal function in patients with retinitis pigmentosa," Graefe's Archive for Clinical and Experimental Ophthalmology 243, 1018-1027 (2005).
51. S. P. Haen and R. F. Spaide, "Fundus autofluorescence in multifocal choroiditis and panuveitis," American journal of ophthalmology 145, 847-853 (2008).
52.N. L. Gomes, V. C. Greenstein, J. N. Carlson, S. H. Tsang, R. T. Smith, R. E. Carr, D. C. Hood, and S. Chang, "A comparison of fundus autofluorescence and retinal structure in patients with Stargardt disease," Investigative ophthalmology & visual science 50, 3953-3959 (2009).
53. J. C. Hwang, D. Y. Kim, C. L. Chou, and S. H. Tsang, "Fundus Autofluorescence, Optical Coherence Tomography, and Electroretinogram Findings Choroidal Sclerosis," Retina-the Journal of Retinal and Vitreous Diseases 30, 1095-1103 (2010).

121
54. D. C. Hood, X. Zhang, R. Ramachandran, C. L. Talamini, A. Raza, J. P. Greenberg, J. Sherman, S. H. Tsang, and D. G. Birch, "The inner segment/outer segment border seen on optical coherence tomography is less intense in patients with diminished cone function," Investigative ophthalmology & visual science 52, 9703-9709 (2011).
55. N. Doble, S. S. Choi, J. L. Codona, J. Christou, J. M. Enoch, and D. R. Williams, "In vivo imaging of the human rod photoreceptor mosaic," Optics letters 36, 31-33 (2011).
56. D. Merino, J. L. Duncan, P. Tiruveedhula, and A. Roorda, "Observation of cone and rod photoreceptors in normal subjects and patients using a new generation adaptive optics scanning laser ophthalmoscope," Biomedical optics express 2, 2189-2201 (2011).
57. E. A. Rossi, M. Chung, A. Dubra, J. J. Hunter, W. H. Merigan, and D. R. Williams, "Imaging retinal mosaics in the living eye," Eye 25, 301-308 (2011).
58. A. Binns and T. H. Margrain, "Development of a technique for recording the focal rod ERG," Ophthalmic Physiol Opt 26, 71-79 (2006).
59. R. Klein, Q. Wang, B. E. Klein, S. E. Moss, and S. M. Meuer, "The relationship of age-related maculopathy, cataract, and glaucoma to visual acuity," Investigative ophthalmology & visual science 36, 182-191 (1995).
60. B. L'Heureux, H. Gurden, and F. Pain, "Autofluorescence imaging of NADH and flavoproteins in the rat brain: insights from Monte Carlo simulations," Optics express 17, 9477-9490 (2009).

122
APPENDIX A
INSTITUTIONAL ANIMAL CARE AND USE COMMITTEE

123

124

125