Embed Size (px)
Citation preview
EXPLORING RAPID PROTOTYPING TECHNIQUES FOR VALIDATING
NUMERICAL MODELS OF NATURALLY VENTILATED BUILDINGS
Tong Yang, Richard A. Buswell and Malcolm J. Cook
Building Energy Research Group, Civil and Building Engineering, Loughborough University,
Leicestershire, UK
ABSTRACT
An alternative to using numerical simulation to
model ventilation performance is to model internal
air flows using water-based experimental models.
However, these can be time consuming and the
manual nature of model assembly means that
exploring detail and design variations is often
prohibitively expensive. Additive, or Rapid
manufacturing processes can build physical models
directly from 3D-CAD data and is widely used in
product development within the aero-automotive and
consumer goods industries. This paper describes
ongoing work exploring the application of such
techniques for the production of physical models
which can be used in their own right in water-based
testing or for Computational fluid dynamics (CFD)
validation. The findings presented here suggest such
techniques present a worthwhile alternative to
traditional model fabrication methods.
INTRODUCTION
Modelling natural ventilation is taking on an
increasingly important role as sustainable building
design solutions push the boundaries of the technique
further. Using numerical simulation to model air flow
in and around buildings is now regularly used as part
of the design process. However, these models require
validation and are sometimes unable to predict some
of the more complex, time varying phenomenon.
Water can be used to model natural ventilation flows
by using a salt solution (brine) to create a density
difference relative to the water (Linden et al. 1990).
This technique involves submerging small perspex
models of a building, typically at a scale of between
1:20 and 1:100 into a larger tank of fresh water.
Since brine is denser than water, the buoyancy forces
acts downwards, so the perspex models must be
inverted to enable a flow to be driven through the
space. Using dye to colour the brine, an inverted
image of what happens when a heat source drives a
flow in air can be produced. Flow visualisation is an
important part of salt bath modelling experiments. In
most cases, the brine injected into a model is
coloured using dye. This highlights areas of the flow
where denser fluid is present, i.e. where warmer air
would be present in a building at full scale.
Various modes of steady-state and transient
buoyancy driven flows have been tested using the
salt bath experimental techniques and analytic
models have been developed and validated alongside
for simple rectangular box geometries (Linden et al.
1990, Linden and Cooper 1996, Kaye and Hunt 2009,
Hunt and Coffey 2010). Computational fluid
dynamics (CFD) modelling is a valuable tool for
undertaking parametric studies where a range of tests
are needed in which small modifications between
simulations are made. However, due to shortcomings
associated with turbulence modelling, transient
modelling, it is important that CFD predictions are
validated rigorously, testing features such as
stratification, flow patterns and flushing times.
One disadvantage of salt bath modelling is the time
required for model production. This is very similar
to manufacturing prototyping issues found in the
aero/automotive and consumer goods industries.
Over the past 30 years these industries have been
developing rapid prototyping devices to reduce the
design cycle time: Rather than producing a prototype
through manual craft, rapid prototyping machines are
able to produce a physical component directly from
3D CAD data, thus reducing the time for model
production from days or weeks to hours. This vastly
speeds up the design evaluation time, hence the name
rapid prototyping. This field has since grown into
what is now widely termed additive manufacturing,
where not just prototypes, but end use parts are
manufactured directly (Wohlers, 2004).
METHODS
Additive Manufacturing
There are a family of names used to describe
essentially the same type of fabrication technology;
rapid manufacturing, rapid prototyping, solid
freeform fabrication and more commonly now
additive manufacturing. These processes all operate
in a similar manner by „printing‟ 3D structures
typically in a build volume of 500mm x 500mm x
500mm, although sizes vary depending on the
process. A design is usually created using 3D CAD
solid modelling software and the surface is
tessellated in much the same way as a Finite Element
Analysis or CFD mesh is generated. This model is
then virtually „sliced‟ into multiple layers. Each layer
Proceedings of Building Simulation 2011: 12th Conference of International Building Performance Simulation Association, Sydney, 14-16 November.
- 965 -

Sequentially
sending the data to
the machine
3
Converting the Object into
‘slices’ of data for the
machine
2
The CAD model
1
Preparing the Model Information Curing photo-sensitive resin (SLA)
A mirror is used to
move the laser to
scan the surface of
the liquid
Build Chamber
Liquid
material
Solid
material
A laser
generates UV
light to cure the
liquid resin
Support
scaffold
for over
hanging
structures
Figure 1: The principal features of the Stereolithography (SLA) process
forms a 2D plane on which some areas are solid
material (the rest is not). Each slice is converted to a
set of machine operations which controls the
deposition of the material. As the layers build up
sequentially they are fused or bonded to the last and
eventually the entire 3D object is created.
There are many processes for rapid prototyping, each
uses a specific set of materials: Thermojet, Selective
Laser Sintering (SLS), Stereolithography (SLA), 3D
printing (3DP), Fuse Deposition Modelling (FDM),
are just a few. A good source of further reading is
Castle Island (2011). All use different materials and
vary in process. Figure 1 depicts the SLA process,
which is of particular interest to this work since it can
produce objects in a transparent resin, a key
requirement for the visualisation aspects of the salt
bath modelling technique.
The SLA process uses a range of UV sensitive resins,
of which some are clear. The apparatus comprises of
a horizontal mesh bed (on which the component is
built) that sits in a vat of uncured, liquid resin. The
mesh bed is lowered so that it is covered by one layer
thickness of resign (0.1mm). A UV laser scans the
surface of the resin where the solid material should
be, curing it and making it solid. The mesh bed drops
down to the second layer and the process is repeated
until the component is complete, typically taking 12-
16 hours.
After printing, some „post processing‟ measures are
required. The component must be baked in a UV
oven to cure any excess resin that is on the surface of
the model and any support structure must be
removed. The viscosity of the resin will support
overhangs up to about 30 degrees, which means
voids in solid components less than 2mm can be
created. Where larger overhanging sections are
required, the part must be supported while it is cured
and in the SLA process this is achieved by printing a
very fine (~0.5mm) scaffold structure built up on
every layer as the component is manufactured. This
is simply broken off once the part is complete.
A limitation of the design is that this support
structure needs to be removed, which can be
problematic if very long, thin channels are formed,
however, this is hugely outweighed by the virtually
limitless geometrical forms that can be created.
Almost any void shape in any shape of object can be
created which when coupled with the fast build time
opens up tremendous opportunities for the creation of
functional models that can be used in the design
process. In addition, once the principle geometry has
been modelled, making changes and printing out
alternative designs becomes trivial and opens up the
iterative use of physical models in the design process
that have an unprecedented level of detail and
sophistication.
The following section demonstrates the possibilities
of what this level of detail means for modelling an
auditorium space for use in a salt bath modelling
procedure. In order to fulfil the visualisation tasks
associated with salt bath testing, a clear resin
Accura601 was chosen as the model building
material.
Auditorium Model
Modelling buoyancy-driven models using the salt
bath approach has been reported by many
researchers, including Linden et al (1990), Kaye and
Linden (2004), Bower et al. (2008) and Kaye and
Hunt (2009). This work has been seminal for
1
http://www.3dsystems.com/products/materials/sla/dat
asheets.asp#Accura_60
Proceedings of Building Simulation 2011: 12th Conference of International Building Performance Simulation Association, Sydney, 14-16 November.
- 966 -

determining the nature and behaviour of buoyant
plumes. However, all these studies have used simple,
generally orthogonal, geometries. Auditoria are
designed for occupation by many individuals at
various elevations and are particularly interesting in
natural ventilation design because they present a
number of fundamental design challenges, for
example:
ensuring stratification remains above head
height;
preventing downdraughts from outlet stacks;
uncertainty due to solution multiplicity
caused by turbulent and transient effects;
understanding the impact on ventilation
performance of a partially occupied
auditorium
The detail of multiple inlets and individual occupants
is difficult, if not impossible to model using
traditional, Perspex style fabrication.
Stereolithography offers the possibility of
overcoming this by including internal channels to
deliver fresh water and brine solution to many
locations within the model.
The auditorium modelled here was based on a real
design proposed for a college in Oxford, UK. A
section with dimensions is depicted in Figure 2. The
auditorium has a floor area of 14.0m×14.0m and
stack height of 10.2m. Raked seating for 240 people
was modelled in 12 rows of 20 people plus an
additional person to represent the lecturer. In this
study, heat sources from lighting and equipment are
not modelled.
Figure 2: Section and auditorium dimensions.
A 1:50 scale model of the auditorium was built using
the SLA process. At the model scale, the seating step
has dimensions of 17mm in depth and 5mm in
height, which is very difficult if not impossible to
build using a traditional Perspex fabrication method.
Minimum wall thicknesses of 2mm gave the model
rigidness as well as translucency for visualisation.
The limitation in the size of the build chamber meant
that a two-part construction was necessary. In
addition, consideration was given to the orientation
of the build to minimise the need for the support
structure. This reduces the material used, build time
and minimises the surface finishing required.
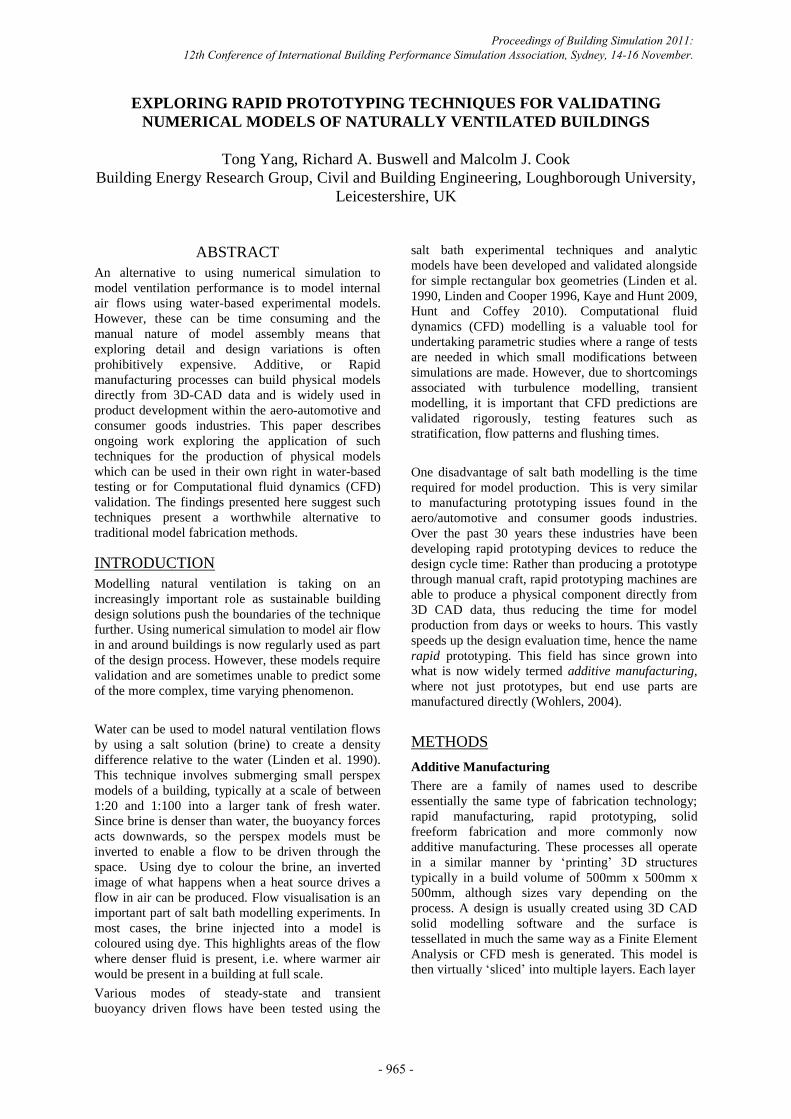
Figure 3 shows a 3D CAD rendering of the models
and Figure 4 shows the detail that was modelled.
Every seat was modelled and each individual was
represented by a brine source emanating from one of
the voids. Each plume is fed from a plenum that is
connected to the brine/dye solution feed. In addition,
at what would be ankle level, there is a secondary
opening where „cool air‟ could be introduced to
investigate entrainment of outside air. These sections
too are fed from dedicated plena connected to the
surrounding fresh water reservoir.
Figure 3: A CAD model of the auditorium (courtesy
Michael Popper Associates LLP). Insert shows
different stack opening design.
The whole auditorium model was printed in 3 parts,
stack, ceiling space and seating/floor area with
surrounding walls. Several design variations on stack
height and stack opening sizes were considered, then
individual model parts for each design were printed
separately. Surgical tape (3M Blenderm) was used to
join and seal model parts together to form a full
auditorium model. Later, the model can be
dissembled easily to enable testing of alternative
geometries.
Figures 4 and 5 clearly show the level of detail that
can be achieved using SLA.
Proceedings of Building Simulation 2011: 12th Conference of International Building Performance Simulation Association, Sydney, 14-16 November.
- 967 -
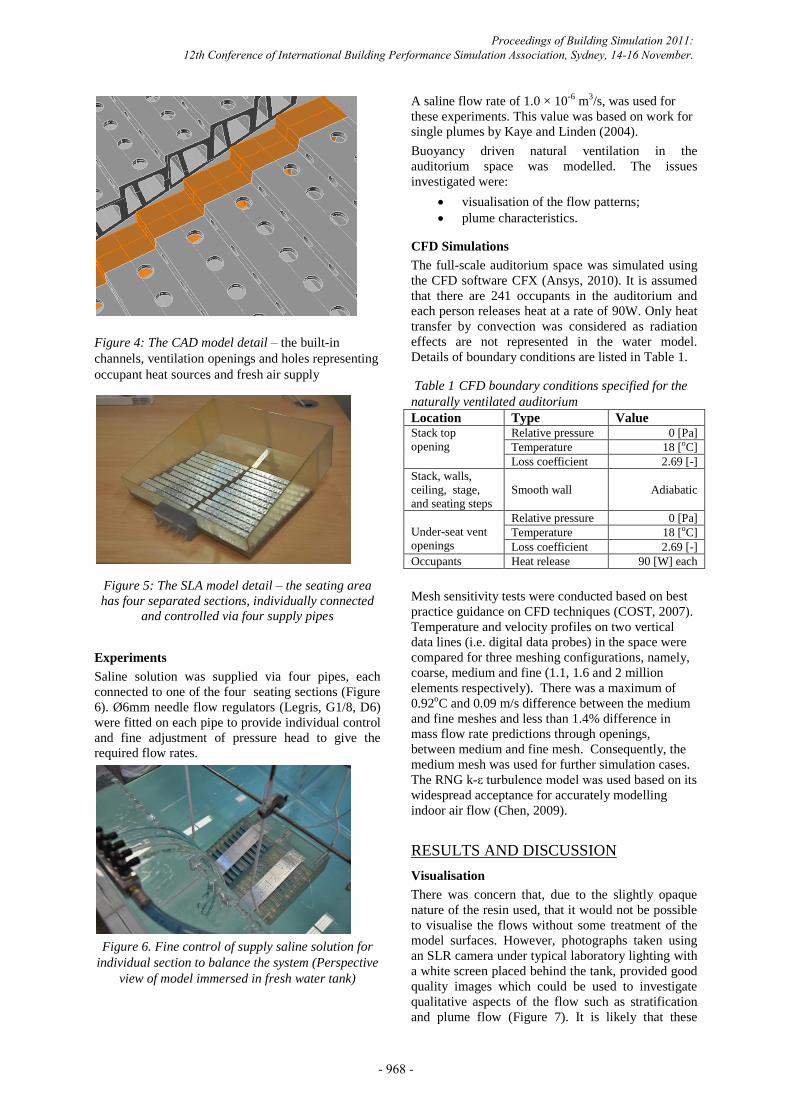
Figure 4: The CAD model detail – the built-in
channels, ventilation openings and holes representing
occupant heat sources and fresh air supply
Figure 5: The SLA model detail – the seating area
has four separated sections, individually connected
and controlled via four supply pipes
Experiments
Saline solution was supplied via four pipes, each
connected to one of the four seating sections (Figure
6). Ø6mm needle flow regulators (Legris, G1/8, D6)
were fitted on each pipe to provide individual control
and fine adjustment of pressure head to give the
required flow rates.
Figure 6. Fine control of supply saline solution for
individual section to balance the system (Perspective
view of model immersed in fresh water tank)
A saline flow rate of 1.0 × 10⁻⁶
m3/s, was used for
these experiments. This value was based on work for
single plumes by Kaye and Linden (2004).
Buoyancy driven natural ventilation in the
auditorium space was modelled. The issues
investigated were:
visualisation of the flow patterns;
plume characteristics.
CFD Simulations
The full-scale auditorium space was simulated using
the CFD software CFX (Ansys, 2010). It is assumed
that there are 241 occupants in the auditorium and
each person releases heat at a rate of 90W. Only heat
transfer by convection was considered as radiation
effects are not represented in the water model.
Details of boundary conditions are listed in Table 1.
Table 1 CFD boundary conditions specified for the
naturally ventilated auditorium
Location Type Value Stack top
opening
Relative pressure 0 [Pa]
Temperature 18 [oC]
Loss coefficient 2.69 [-]
Stack, walls,
ceiling, stage,
and seating steps
Smooth wall
Adiabatic
Under-seat vent
openings
Relative pressure 0 [Pa]
Temperature 18 [oC]
Loss coefficient 2.69 [-]
Occupants Heat release 90 [W] each
Mesh sensitivity tests were conducted based on best
practice guidance on CFD techniques (COST, 2007).
Temperature and velocity profiles on two vertical
data lines (i.e. digital data probes) in the space were
compared for three meshing configurations, namely,
coarse, medium and fine (1.1, 1.6 and 2 million
elements respectively). There was a maximum of
0.92oC and 0.09 m/s difference between the medium
and fine meshes and less than 1.4% difference in
mass flow rate predictions through openings,
between medium and fine mesh. Consequently, the
medium mesh was used for further simulation cases.
The RNG k-ε turbulence model was used based on its
widespread acceptance for accurately modelling
indoor air flow (Chen, 2009).
RESULTS AND DISCUSSION
Visualisation
There was concern that, due to the slightly opaque
nature of the resin used, that it would not be possible
to visualise the flows without some treatment of the
model surfaces. However, photographs taken using
an SLR camera under typical laboratory lighting with
a white screen placed behind the tank, provided good
quality images which could be used to investigate
qualitative aspects of the flow such as stratification
and plume flow (Figure 7). It is likely that these
Proceedings of Building Simulation 2011: 12th Conference of International Building Performance Simulation Association, Sydney, 14-16 November.
- 968 -
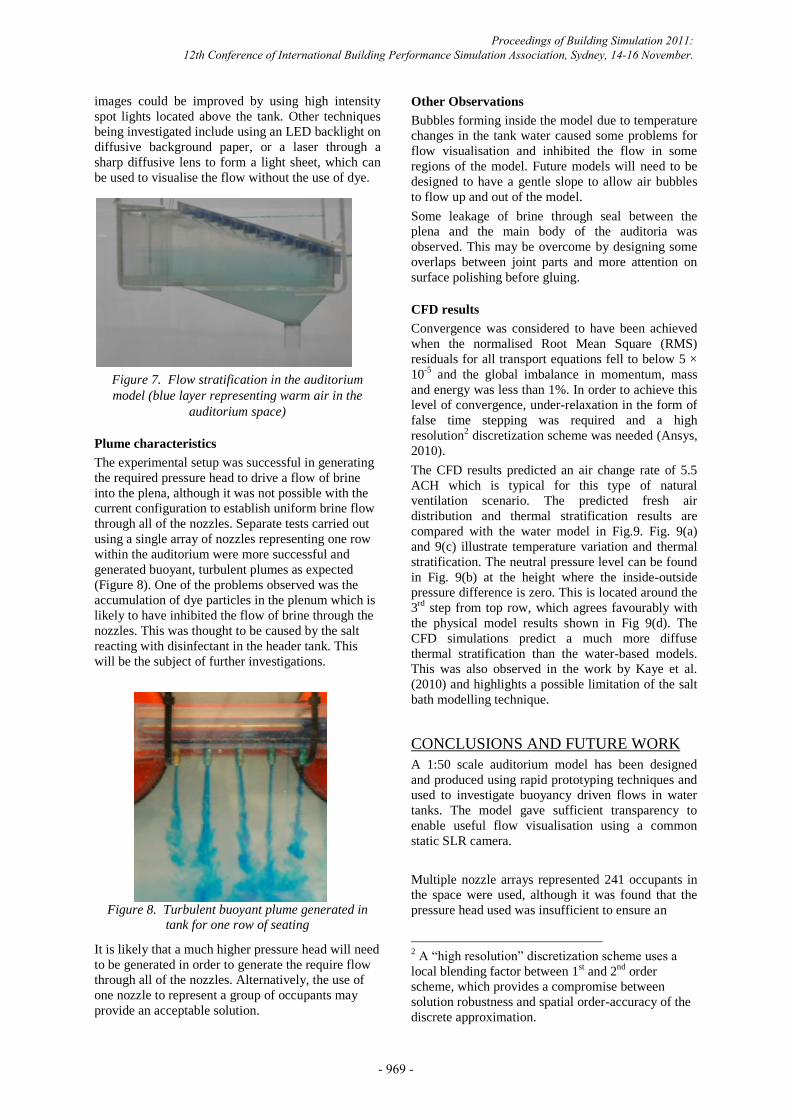
images could be improved by using high intensity
spot lights located above the tank. Other techniques
being investigated include using an LED backlight on
diffusive background paper, or a laser through a
sharp diffusive lens to form a light sheet, which can
be used to visualise the flow without the use of dye.
Figure 7. Flow stratification in the auditorium
model (blue layer representing warm air in the
auditorium space)
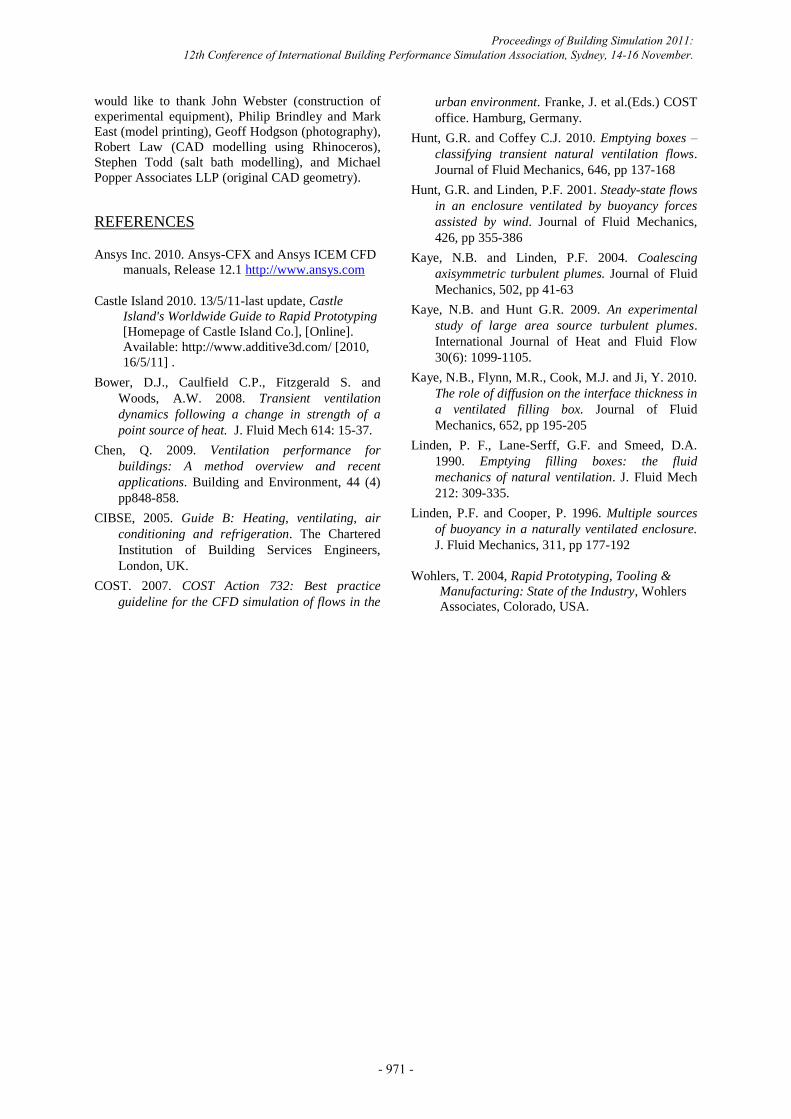
Plume characteristics
The experimental setup was successful in generating
the required pressure head to drive a flow of brine
into the plena, although it was not possible with the
current configuration to establish uniform brine flow
through all of the nozzles. Separate tests carried out
using a single array of nozzles representing one row
within the auditorium were more successful and
generated buoyant, turbulent plumes as expected
(Figure 8). One of the problems observed was the
accumulation of dye particles in the plenum which is
likely to have inhibited the flow of brine through the
nozzles. This was thought to be caused by the salt
reacting with disinfectant in the header tank. This
will be the subject of further investigations.
Figure 8. Turbulent buoyant plume generated in
tank for one row of seating
It is likely that a much higher pressure head will need
to be generated in order to generate the require flow
through all of the nozzles. Alternatively, the use of
one nozzle to represent a group of occupants may
provide an acceptable solution.
Other Observations
Bubbles forming inside the model due to temperature
changes in the tank water caused some problems for
flow visualisation and inhibited the flow in some
regions of the model. Future models will need to be
designed to have a gentle slope to allow air bubbles
to flow up and out of the model.
Some leakage of brine through seal between the
plena and the main body of the auditoria was
observed. This may be overcome by designing some
overlaps between joint parts and more attention on
surface polishing before gluing.
CFD results
Convergence was considered to have been achieved
when the normalised Root Mean Square (RMS)
residuals for all transport equations fell to below 5 ×
10-5
and the global imbalance in momentum, mass
and energy was less than 1%. In order to achieve this
level of convergence, under-relaxation in the form of
false time stepping was required and a high
resolution2 discretization scheme was needed (Ansys,
2010).
The CFD results predicted an air change rate of 5.5
ACH which is typical for this type of natural
ventilation scenario. The predicted fresh air
distribution and thermal stratification results are
compared with the water model in Fig.9. Fig. 9(a)
and 9(c) illustrate temperature variation and thermal
stratification. The neutral pressure level can be found
in Fig. 9(b) at the height where the inside-outside
pressure difference is zero. This is located around the
3rd
step from top row, which agrees favourably with
the physical model results shown in Fig 9(d). The
CFD simulations predict a much more diffuse
thermal stratification than the water-based models.
This was also observed in the work by Kaye et al.
(2010) and highlights a possible limitation of the salt
bath modelling technique.
CONCLUSIONS AND FUTURE WORK
A 1:50 scale auditorium model has been designed
and produced using rapid prototyping techniques and
used to investigate buoyancy driven flows in water
tanks. The model gave sufficient transparency to
enable useful flow visualisation using a common
static SLR camera.
Multiple nozzle arrays represented 241 occupants in
the space were used, although it was found that the
pressure head used was insufficient to ensure an
2 A “high resolution” discretization scheme uses a
local blending factor between 1st and 2
nd order
scheme, which provides a compromise between
solution robustness and spatial order-accuracy of the
discrete approximation.
Proceedings of Building Simulation 2011: 12th Conference of International Building Performance Simulation Association, Sydney, 14-16 November.
- 969 -

(a) Predicted temperature distribution showing
thermal stratification
(b) Vertical pressure profile (neutral pressure level
is indicated by the 0Pa level)
(c) Predicted temperature distribution over the
central vertical plane showing thermal
stratification
(d) Salt bath testing - flow stratification in the
1/50 scaled model (inverted image of Fig.7)
Figure 9. Temperature distribution and flow stratification in the auditorium – prediction by CFD and
observation in the water model
uniform flow through all nozzle arrays. In order to
improve this, a precisely controlled plume generation
device, for e.g. a printer head strip with an electronic
control system to create the desired buoyancy source
strength and real-time control for transient natural
ventilation scenarios could be used. Such additions to
the model could be integrated into the 3D printing
process.
It was also observed that, due to reactions between
the salt and other substances in the fluid (possibly
disinfectant), sediment formed quickly in the supply
piping system and the plena, thus reducing the
uniformity of the flow and the colour density of the
brine. Dyes with finer particles such as nano particles
could be used to overcome this problem, as well as
testing alternative means of disinfection.
Future work will include tests to investigate the use
of this technique to visualise the 3D structures of the
buoyant plumes, e. g. turbulent eddy formation and
break-up which will provide valuable data for CFD
validation. The techniques to be explored will
include fluorescent PIV (particle image velocimetry)
and 3D stereo PIV.CFD simulations to be conducted
include investigations into the differences between
large area sources and multi-point heat sources and
transient flows caused when operating conditions
(boundary conditions) change.
ACKNOWLEDGEMENTS
This work was completed under the EPSRC/IMCRC
funded Freeform Construction Project, Grant
Number EP/E002323/1. In addition, the authors
Proceedings of Building Simulation 2011: 12th Conference of International Building Performance Simulation Association, Sydney, 14-16 November.
- 970 -
would like to thank John Webster (construction of
experimental equipment), Philip Brindley and Mark
East (model printing), Geoff Hodgson (photography),
Robert Law (CAD modelling using Rhinoceros),
Stephen Todd (salt bath modelling), and Michael
Popper Associates LLP (original CAD geometry).
REFERENCES
Ansys Inc. 2010. Ansys-CFX and Ansys ICEM CFD
manuals, Release 12.1 http://www.ansys.com
Castle Island 2010. 13/5/11-last update, Castle
Island's Worldwide Guide to Rapid Prototyping
[Homepage of Castle Island Co.], [Online].
Available: http://www.additive3d.com/ [2010,
16/5/11] .
Bower, D.J., Caulfield C.P., Fitzgerald S. and
Woods, A.W. 2008. Transient ventilation
dynamics following a change in strength of a
point source of heat. J. Fluid Mech 614: 15-37.
Chen, Q. 2009. Ventilation performance for
buildings: A method overview and recent
applications. Building and Environment, 44 (4)
pp848-858.
CIBSE, 2005. Guide B: Heating, ventilating, air
conditioning and refrigeration. The Chartered
Institution of Building Services Engineers,
London, UK.
COST. 2007. COST Action 732: Best practice
guideline for the CFD simulation of flows in the
urban environment. Franke, J. et al.(Eds.) COST
office. Hamburg, Germany.
Hunt, G.R. and Coffey C.J. 2010. Emptying boxes –
classifying transient natural ventilation flows.
Journal of Fluid Mechanics, 646, pp 137-168
Hunt, G.R. and Linden, P.F. 2001. Steady-state flows
in an enclosure ventilated by buoyancy forces
assisted by wind. Journal of Fluid Mechanics,
426, pp 355-386
Kaye, N.B. and Linden, P.F. 2004. Coalescing
axisymmetric turbulent plumes. Journal of Fluid
Mechanics, 502, pp 41-63
Kaye, N.B. and Hunt G.R. 2009. An experimental
study of large area source turbulent plumes.
International Journal of Heat and Fluid Flow
30(6): 1099-1105.
Kaye, N.B., Flynn, M.R., Cook, M.J. and Ji, Y. 2010.
The role of diffusion on the interface thickness in
a ventilated filling box. Journal of Fluid
Mechanics, 652, pp 195-205
Linden, P. F., Lane-Serff, G.F. and Smeed, D.A.
1990. Emptying filling boxes: the fluid
mechanics of natural ventilation. J. Fluid Mech
212: 309-335.
Linden, P.F. and Cooper, P. 1996. Multiple sources
of buoyancy in a naturally ventilated enclosure.
J. Fluid Mechanics, 311, pp 177-192
Wohlers, T. 2004, Rapid Prototyping, Tooling &
Manufacturing: State of the Industry, Wohlers
Associates, Colorado, USA.
Proceedings of Building Simulation 2011: 12th Conference of International Building Performance Simulation Association, Sydney, 14-16 November.
- 971 -