Embed Size (px)
Citation preview
Exploring Social Media and Smartphone Use in Ontario Agriculture
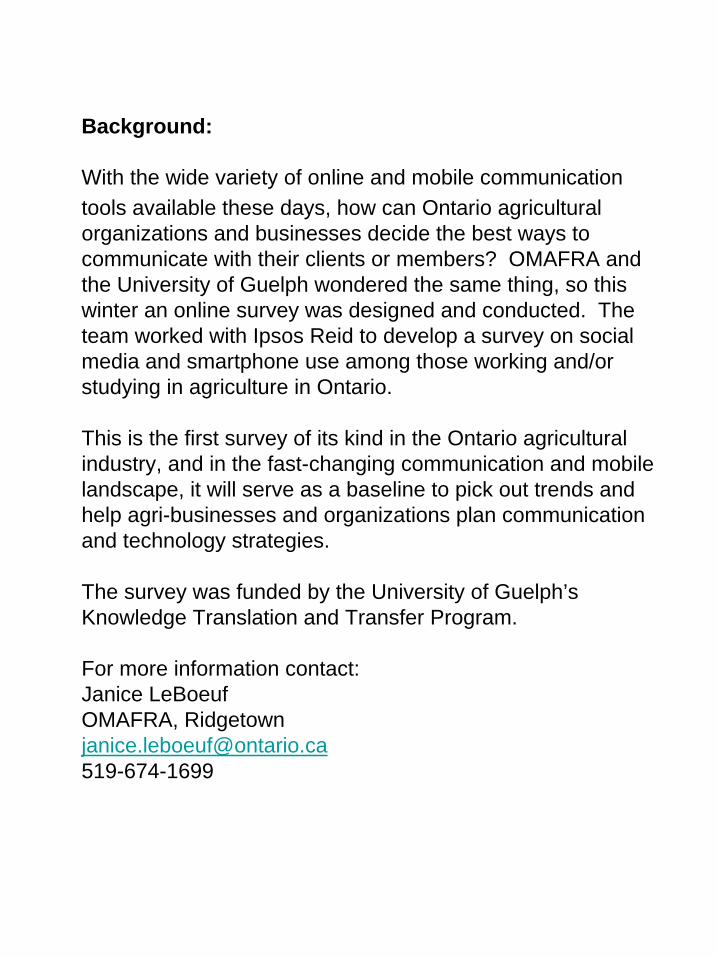
Background:
With the wide variety of online and mobile communication
tools available these days, how can Ontario agricultural organizations and businesses decide the best ways to communicate with their clients or members? OMAFRA and the University of Guelph wondered the same thing, so this winter an online survey was designed and conducted. The team worked with Ipsos Reid to develop a survey on social media and smartphone use among those working and/or studying in agriculture in Ontario.
This is the first survey of its kind in the Ontario agricultural industry, and in the fast-changing communication and mobile landscape, it will serve as a baseline to pick out trends and help agri-businesses and organizations plan communication and technology strategies.
The survey was funded by the University of Guelph’s Knowledge Translation and Transfer Program.
For more information contact:Janice LeBoeufOMAFRA, [email protected]
• No data was available on smartphone and social media use by those in the Ontario agricultural industry.
• The project team worked with Ipsos Reid on survey design, development, data collection, and analysis. The project team managed distribution and promotion of the survey. It was promoted through a number of provincial agricultural organizations, through a variety of OMAFRA distribution channels, through agricultural media, as well as social media and several rural organizations.
• Funded by the OMAFRA/University of Guelph Knowledge Translation and Transfer Funding Program http://www.uoguelph.ca/research/omafra/partnership/KTT_and_IP.shtml
• Project team: Janice LeBoeuf, Adrienne De Schutter, Kim DeKlein, Richard Hamilton, Terry Dupuis (OMAFRA); Cheryl Trueman (Ridgetown Campus - University of Guelph)
• The survey was open between February 6 and March 5, 2012.
• A total of 439 online surveys were completed.
• Respondents had to confirm that they work or study in the Ontario agricultural industry and are internet users in order to proceed to the rest of the survey.
• Agriculture students were included as a way to look a bit into the future, as they are the future producers, workforce, and leaders in the industry.

ResultsSome Highlights…
Internet use: 95% are online daily; more than four out of ten are online multiple times each day.
The survey was conducted online, so it focused on those who use the internet. Only 1% of respondents said they went online as infrequently as once or twice a week.
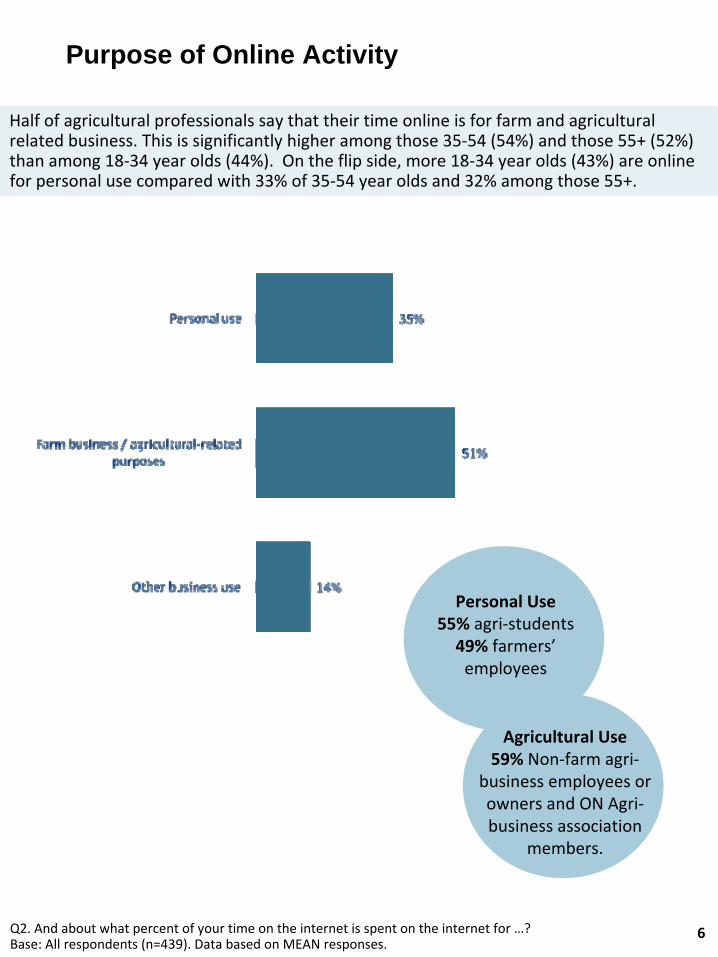
Purpose of Online Activity
6Q2. And about what percent of your time on the internet is spent
on the internet for …? Base: All respondents (n=439). Data based on MEAN responses.
Half of agricultural professionals say that their time online is
for farm and agricultural
related business. This is significantly higher among those 35‐54 (54%) and those 55+ (52%)
than among 18‐34 year olds (44%). On the flip side, more 18‐34 year olds (43%) are online
for personal use compared with 33% of 35‐54 year olds and 32% among those 55+.
Personal Use55% agri‐students49% farmers’
employees
Agricultural Use59% Non‐farm agri‐
business employees or
owners and ON Agri‐
business association
members.
Sources of information
• 79% say they usually find out about new agricultural information from paper-based publications such as newspapers and magazines.
• An equal number mention the internet as a usual information source.
• Nearly as many, 72%, say that meetings or conferences are a main source of new information.
Information Sources for New Farm Products, Programs or Information
8
Q3. First of all, from whom or from where do you usually find out about new farm products,
farm programs, or information on agriculture‐related business? Please select all that apply. Base: All respondents (n=439)
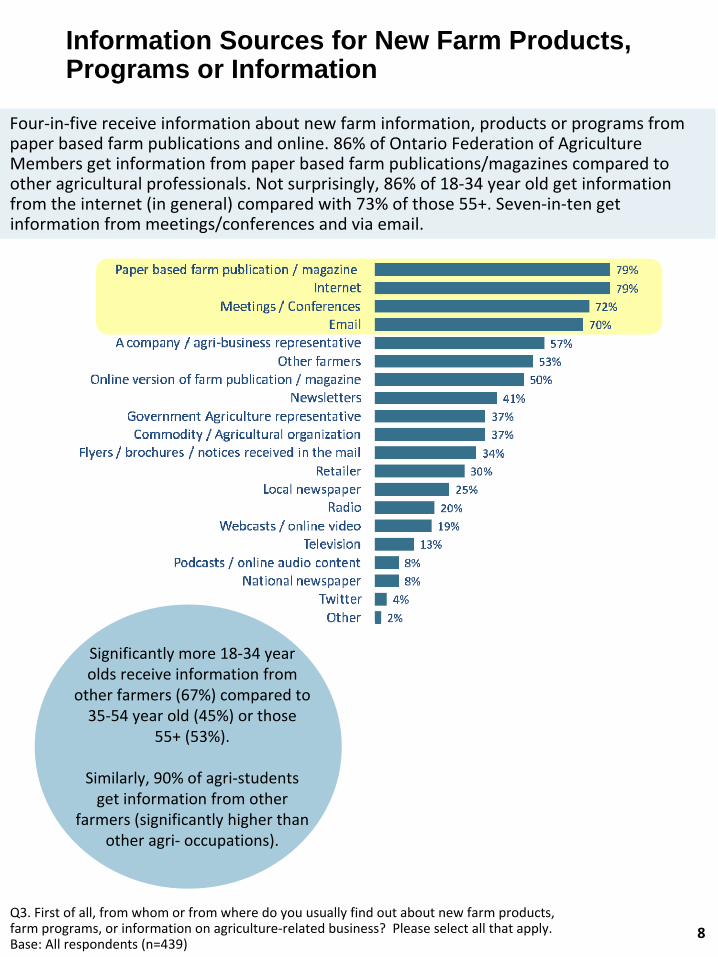
Four‐in‐five receive information about new farm information, products or
programs from
paper based farm publications and online. 86% of Ontario Federation of Agriculture
Members get information from paper based farm publications/magazines compared to
other agricultural professionals. Not surprisingly, 86% of 18‐34 year old get information
from the internet (in general) compared with 73% of those 55+. Seven‐in‐ten get
information from meetings/conferences and via email.
Significantly more 18‐34 year
olds receive information from
other farmers (67%) compared to
35‐54 year old (45%) or those
55+ (53%).
Similarly, 90% of agri‐students
get information from other
farmers (significantly higher than
other agri‐
occupations).
9Q4. Of all of these sources of information, which are you currently using more than you did a
year ago? Select all that apply. Base: All respondents (n=439)
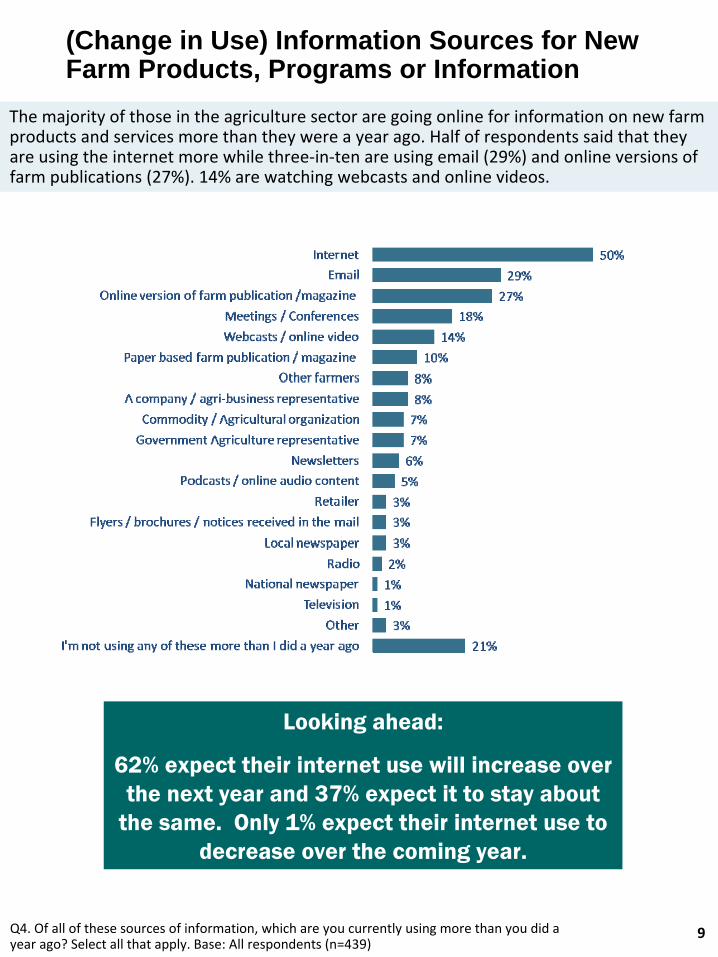
The majority of those in the agriculture sector are going online
for information on new farm
products and services more than they were a year ago. Half of respondents said that they
are using the internet more while three‐in‐ten are using email (29%) and online versions of
farm publications (27%). 14% are watching webcasts
and online videos.
(Change in Use) Information Sources for New Farm Products, Programs or Information
Looking ahead:
62% expect their internet use will increase over the next year and 37% expect it to stay about
the same. Only 1% expect their internet use to decrease over the coming year.
Smartphone use: 69% have a smartphone.
Only 62% have a desktop computer.
34% of adult Canadians own a smartphone (Ipsos Reid, January 2012). It was 24% in August 2011.
Computers, Smartphones and other Gadgets
11Q5. Which of the following devices do you currently own / use? Select all that apply.Base: All respondents (n=439)
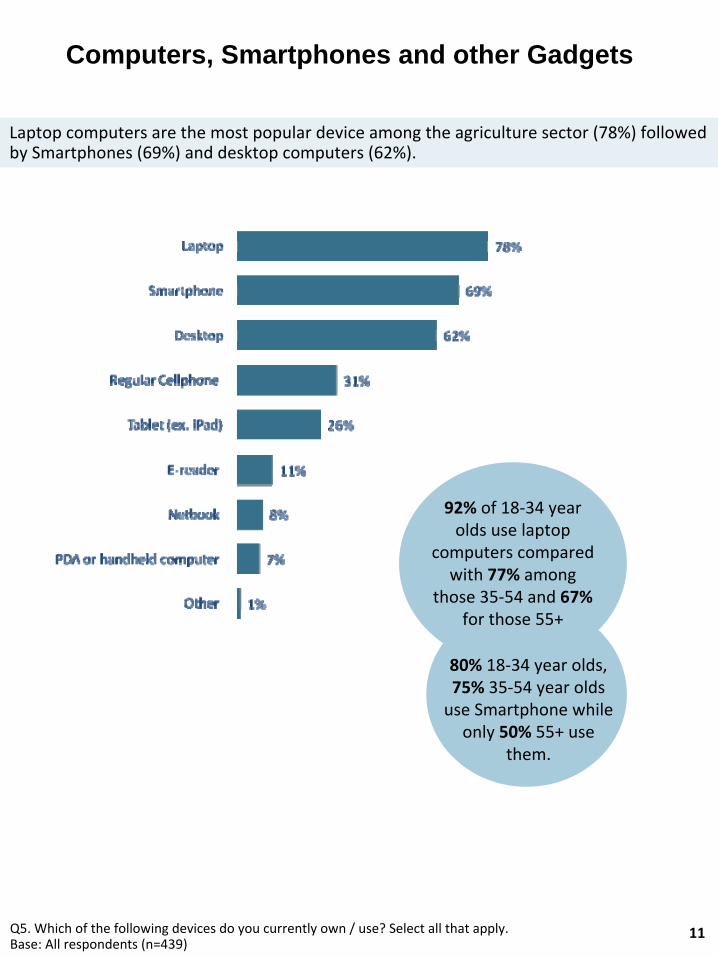
Laptop computers are the most popular device among the agriculture sector (78%) followed
by Smartphones
(69%) and desktop computers (62%).
92% of 18‐34 year
olds use laptop
computers compared
with 77% among
those 35‐54 and 67%
for those 55+
80% 18‐34 year olds,
75% 35‐54 year olds
use Smartphone while
only 50%
55+ use
them.
Smartphone use:
In popularity, BlackBerry is first in Ontario agriculture (65% of smartphone users), followed by Apple (23%), then Android (8%).
To compare, recent surveys of Canadian smartphone users put BlackBerry at 33%, Apple at 28%, and Android at 31% (Ipsos Reid, 2012).
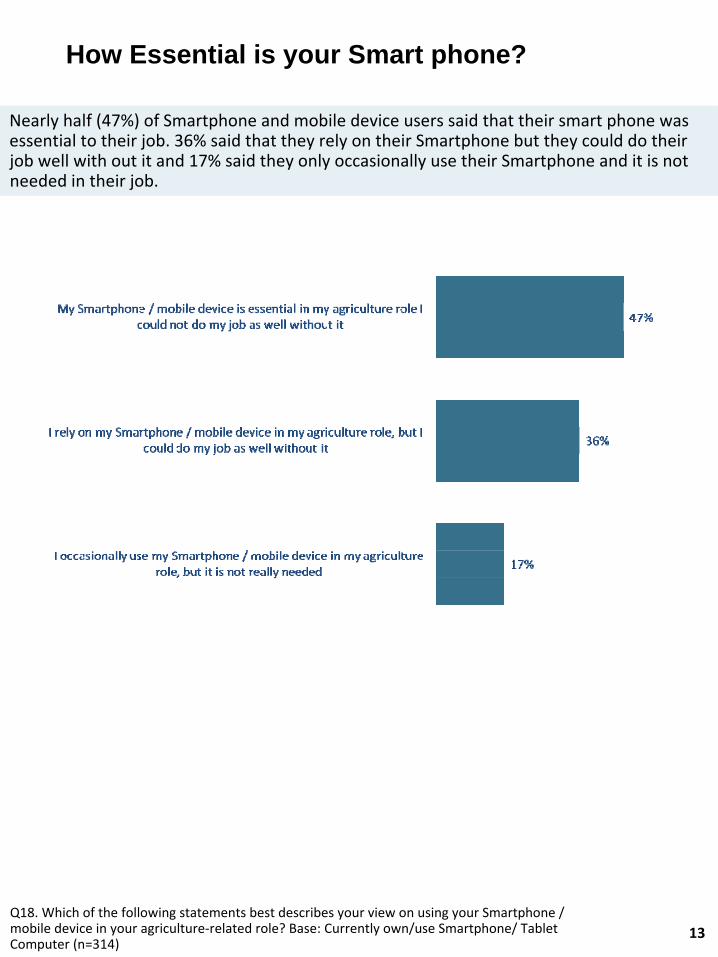
How Essential is your Smart phone?
13
Q18. Which of the following statements best describes your view on using your Smartphone /
mobile device in your agriculture‐related role? Base: Currently own/use Smartphone/ Tablet
Computer (n=314)
Nearly half (47%) of Smartphone and mobile device users said that their smart phone was
essential to their job. 36% said that they rely on their Smartphone but they could do their
job well with out it and 17% said they only occasionally use their Smartphone and it is not
needed in their job.
Overall Farmer / Producer
Employee of Farmer/producer
Non-farm agribusiness
employee/owner
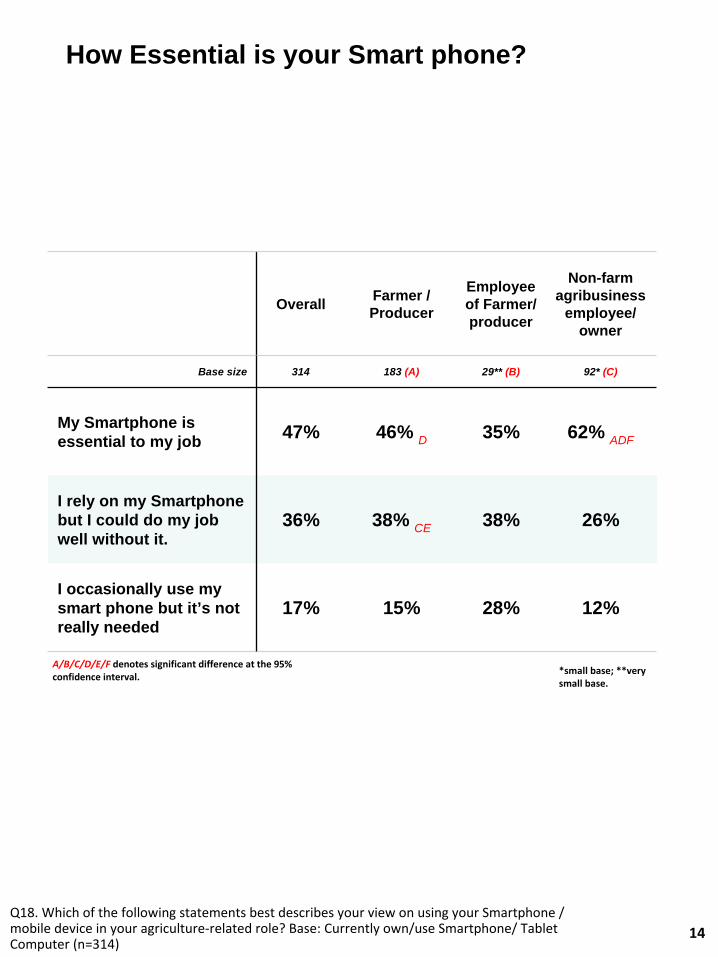
Base size 314 183 (A) 29** (B) 92* (C)
My Smartphone is essential to my job 47% 46% D 35% 62% ADF
I rely on my Smartphone but I could do my job well without it.
36% 38% CE 38% 26%
I occasionally use my smart phone but it’s not really needed
17% 15% 28% 12%
14
Q18. Which of the following statements best describes your view on using your Smartphone /
mobile device in your agriculture‐related role? Base: Currently own/use Smartphone/ Tablet
Computer (n=314)
How Essential is your Smart phone?
*small base; **very
small base.
A/B/C/D/E/F denotes significant difference at the 95%
confidence interval.
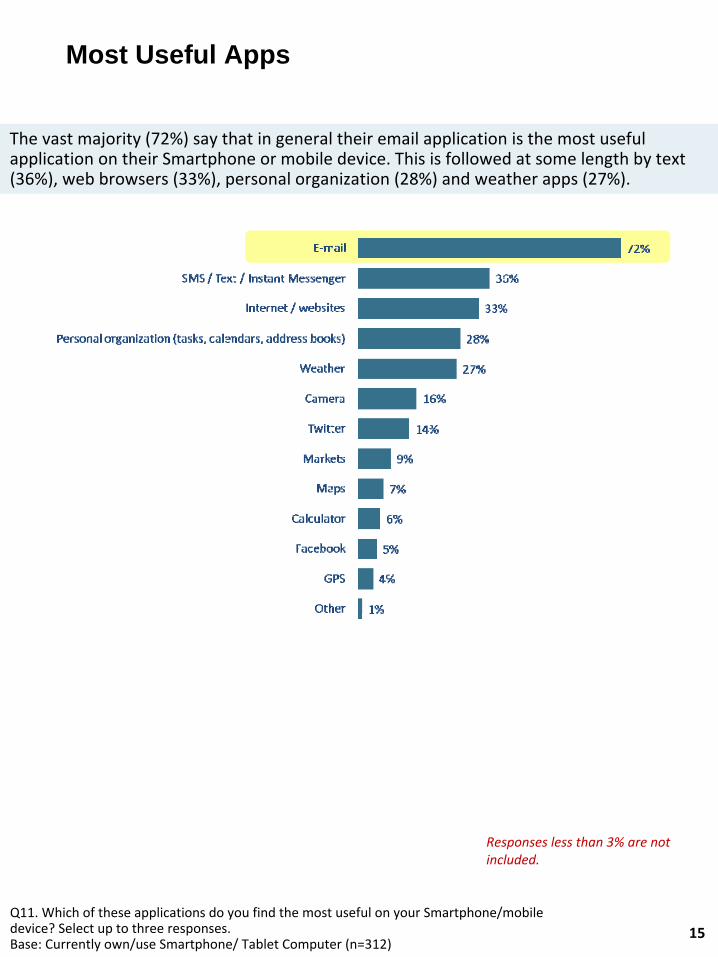
Most Useful Apps
15
Q11. Which of these applications do you find the most useful on your Smartphone/mobile
device? Select up to three responses.Base: Currently own/use Smartphone/ Tablet Computer (n=312)
The vast majority (72%) say that in general their email application is the most useful
application on their Smartphone or mobile device. This is followed at some length by text
(36%), web browsers (33%), personal organization (28%) and weather apps (27%).
Responses less than 3% are not
included.
Smartphone apps
There is an appetite for farming/agriculture applications.
74% of Smartphone users have downloaded at least one agriculture app (the average is 3.7 apps).
12% of those with Smartphones say not having proper apps is a big drawback for them.
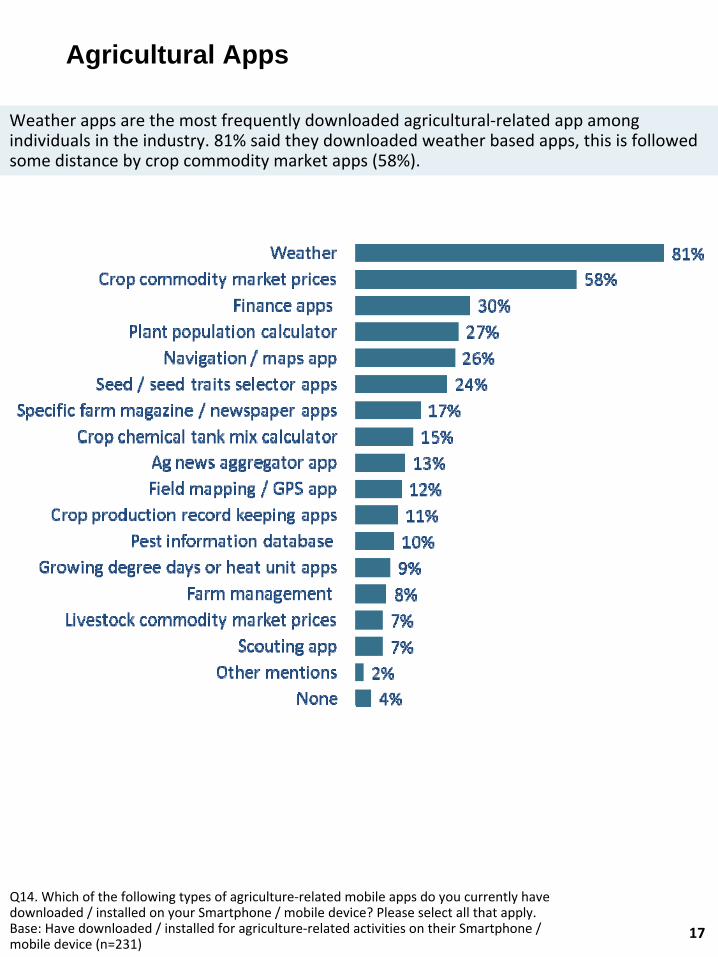
Agricultural Apps
17
Q14. Which of the following types of agriculture‐related mobile apps do you currently have
downloaded / installed on your Smartphone / mobile device? Please select all that apply.Base: Have downloaded / installed for agriculture‐related activities on their Smartphone /
mobile device (n=231)
Weather apps are the most frequently downloaded agricultural‐related app among
individuals in the industry. 81% said they downloaded weather based apps, this is followed
some distance by crop commodity market apps (58%).
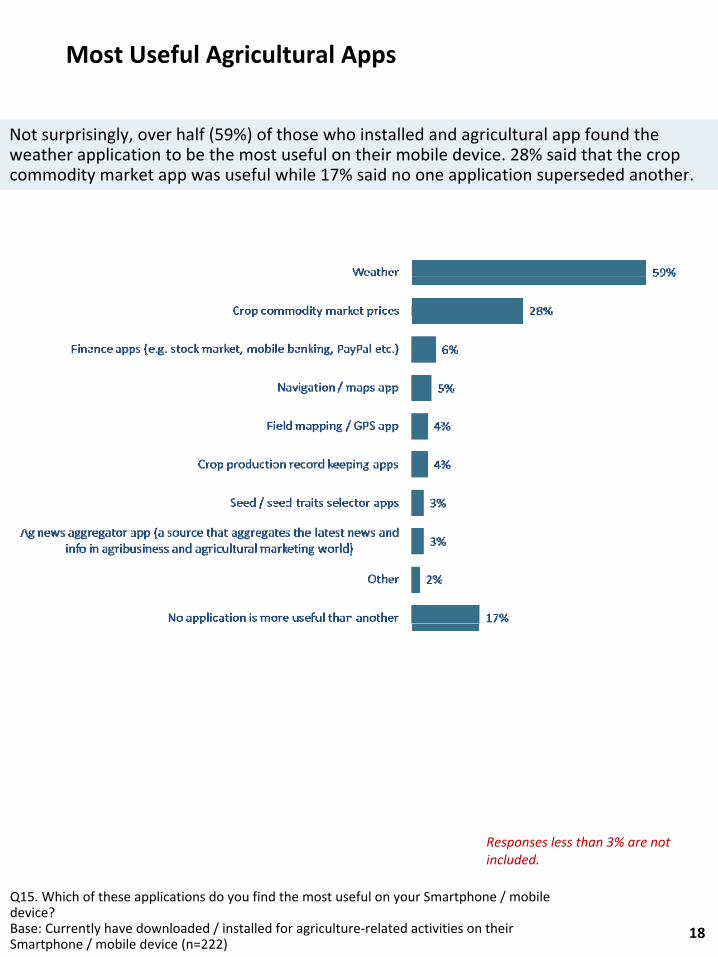
18
Q15. Which of these applications do you find the most useful on your Smartphone / mobile
device? Base: Currently have downloaded / installed for agriculture‐related activities on their
Smartphone / mobile device (n=222)
Not surprisingly, over half (59%) of those who installed and agricultural app found the
weather application to be the most useful on their mobile device. 28% said that the crop
commodity market app was useful while 17% said no one application superseded another.
Most Useful Agricultural Apps
Responses less than 3% are not
included.
Social media use:
84% have used social media in the past 12 months.
And 73% rated social media use as important or very important to them.
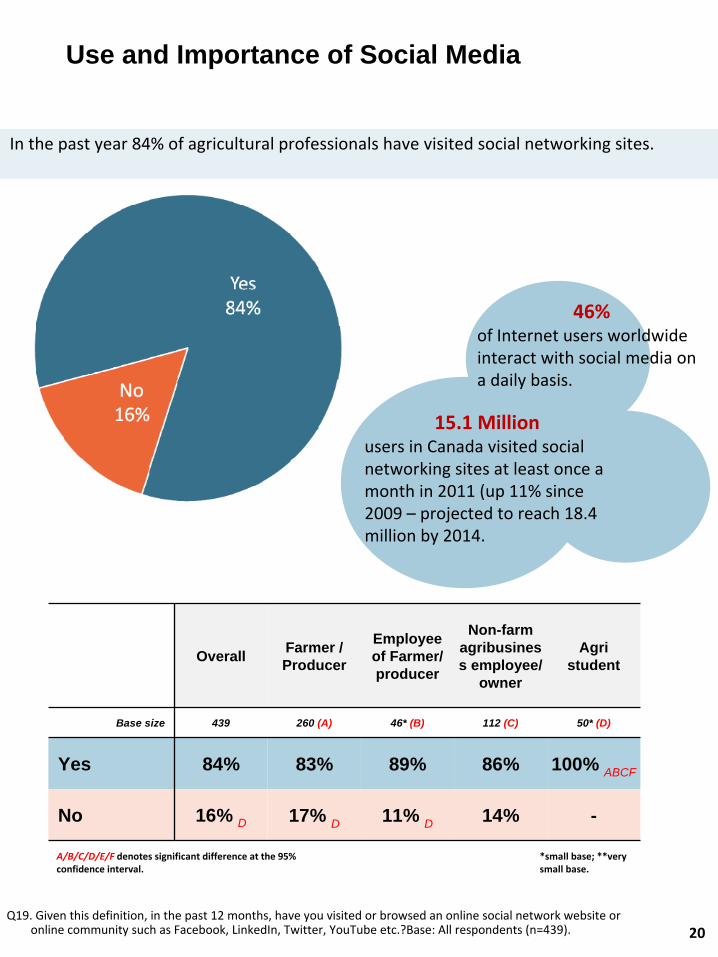
Use and Importance of Social Media
20Q19. Given this definition, in the past 12 months, have you visited or browsed an online social network website or
online community such as Facebook, LinkedIn, Twitter, YouTube etc.?Base: All respondents (n=439).
In the past year 84% of agricultural professionals have visited social networking sites.
OverallFarmer / Producer
Employee of Farmer/producer
Non-farm agribusines s employee/
owner
Agri student
Base size 439 260 (A) 46* (B) 112 (C) 50* (D)
Yes 84% 83% 89% 86% 100% ABCF
No 16% D 17% D 11% D 14% -
*small base; **very
small base.A/B/C/D/E/F denotes significant difference at the 95%
confidence interval.
15.1 Million users in Canada visited social
networking sites at least once a
month in 2011 (up 11% since
2009 – projected to reach 18.4
million by 2014.
46%of Internet users worldwide
interact with social media on
a daily basis.
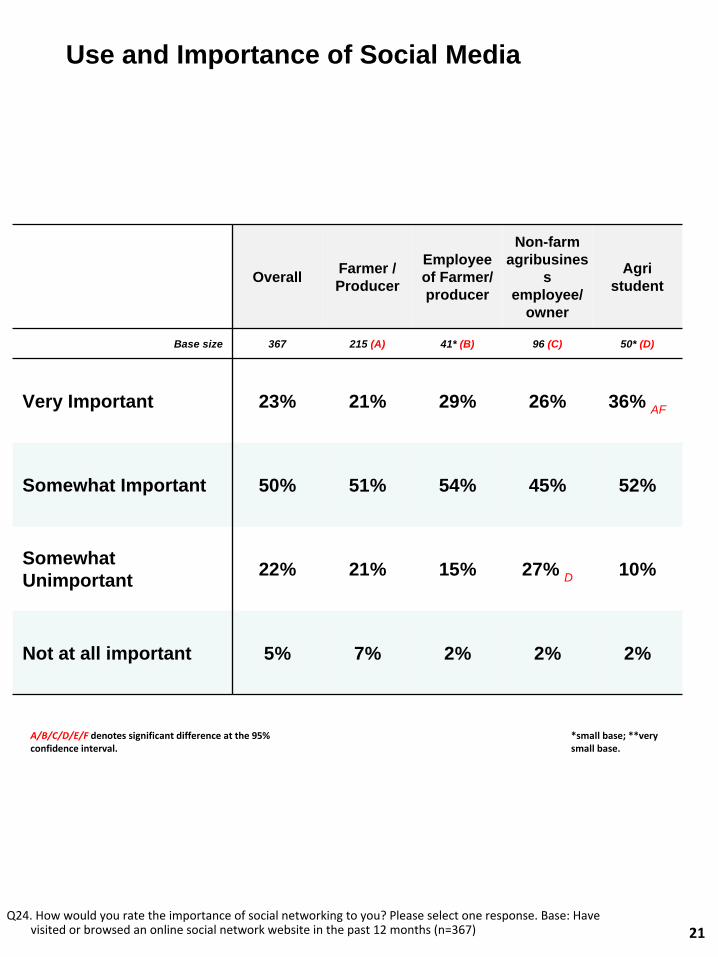
Use and Importance of Social Media
21Q24. How would you rate the importance of social networking to you? Please select one response. Base: Have
visited or browsed an online social network website in the past 12 months (n=367)
Overall Farmer / Producer
Employee of Farmer/producer
Non-farm agribusines
s employee/
owner
Agri student
Base size 367 215 (A) 41* (B) 96 (C) 50* (D)
Very Important 23% 21% 29% 26% 36% AF
Somewhat Important 50% 51% 54% 45% 52%
Somewhat Unimportant
22% 21% 15% 27% D 10%
Not at all important 5% 7% 2% 2% 2%
*small base; **very
small base.A/B/C/D/E/F denotes significant difference at the 95%
confidence interval.
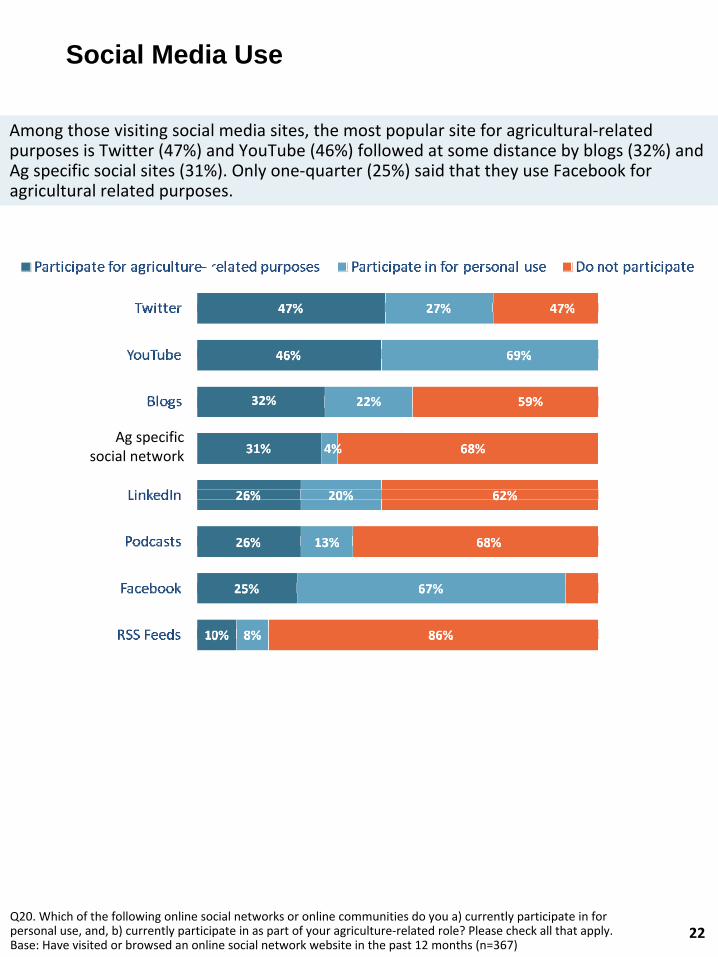
Social Media Use
22Q20. Which of the following online social networks or online communities do you a) currently participate in for
personal use, and, b) currently participate in as part of your agriculture‐related role? Please check all that apply.
Base: Have visited or browsed an online social network website in the past 12 months (n=367)
Among those visiting social media sites, the most popular site for agricultural‐related
purposes is Twitter (47%) and YouTube (46%) followed at some distance by blogs (32%) and
Ag specific social sites (31%). Only one‐quarter (25%) said that they use Facebook for
agricultural related purposes.
Ag specific social network
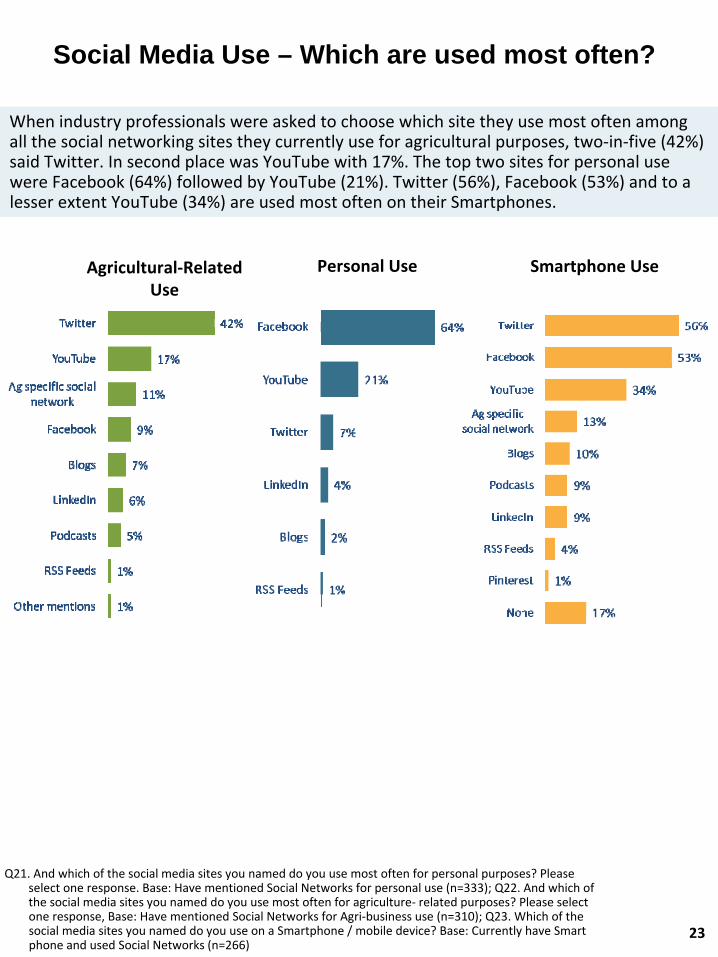
Social Media Use – Which are used most often?
23
Q21. And which of the social media sites you named do you use most often for personal purposes? Please
select one response. Base: Have mentioned Social Networks for personal use (n=333); Q22. And which of
the social media sites you named do you use most often for agriculture‐
related purposes? Please select
one response, Base: Have mentioned Social Networks for Agri‐business use (n=310); Q23. Which of the
social media sites you named do you use on a Smartphone / mobile
device? Base: Currently have Smart
phone and used Social Networks (n=266)
When industry professionals were asked to choose which site they
use most often among
all the social networking sites they currently use for agricultural purposes, two‐in‐five (42%)
said Twitter. In second place was YouTube with 17%. The top two sites for personal use
were Facebook (64%) followed by YouTube (21%). Twitter (56%), Facebook (53%) and to a
lesser extent YouTube (34%) are used most often on their Smartphones.
Agricultural‐Related
Use
Personal Use Smartphone Use
Agricultural Social Media Use
24
Q25. What are the main reasons for using social media in your agriculture‐related role? Please
select all that apply. Base: Have visited or browsed an online social network website in the past 12 months (n=367)
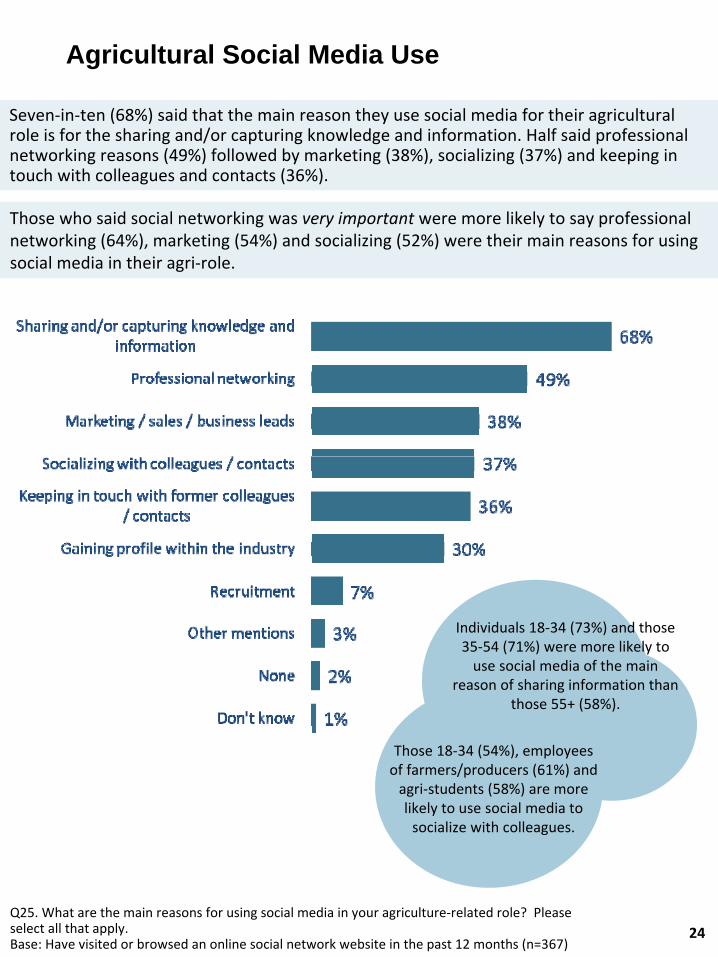
Seven‐in‐ten (68%) said that the main reason they use social media for their agricultural
role is for the sharing and/or capturing knowledge and information. Half said professional
networking reasons (49%) followed by marketing (38%), socializing (37%) and keeping in
touch with colleagues and contacts (36%).
Those who said social networking was very important
were more likely to say professional
networking (64%), marketing (54%) and socializing (52%) were their main reasons for using
social media in their agri‐role.
Individuals 18‐34 (73%) and those
35‐54 (71%) were more likely to
use social media of the main
reason of sharing information than
those 55+ (58%).
Those 18‐34 (54%), employees
of farmers/producers (61%) and
agri‐students (58%) are more
likely to use social media to
socialize with colleagues.
Social Media As Part of Government Communication Strategy
25
Q27. And do you agree with the following statement: governments (including agricultural
extension / specialists / field staff) should use social networking tools as part of their
communications strategy? Base: Have visited or browsed an online
social network website in the
past 12 months (n=367)
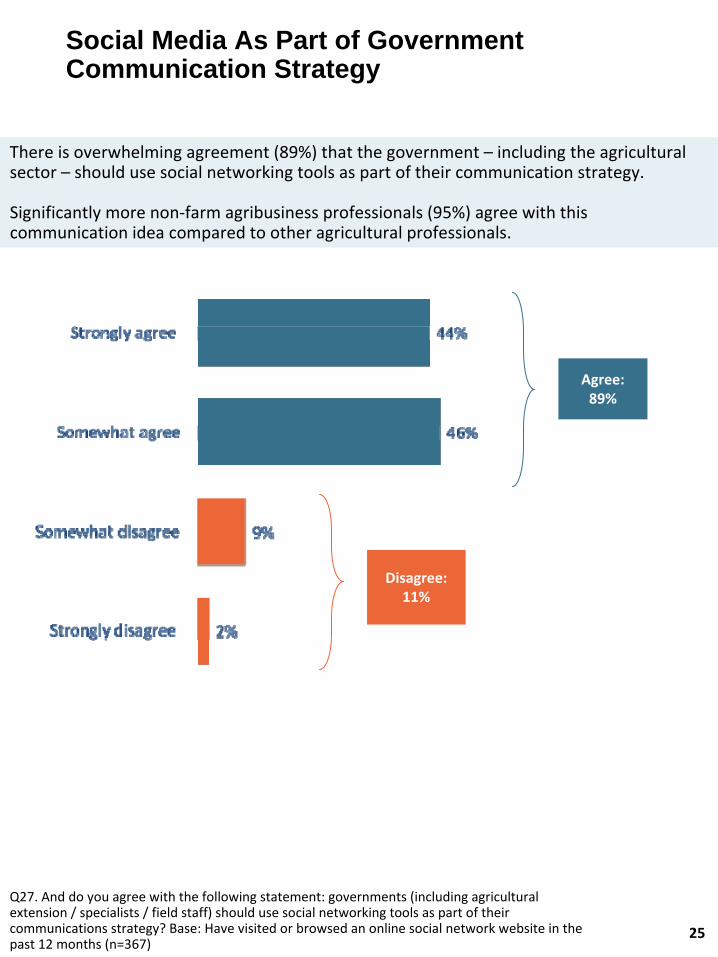
There is overwhelming agreement (89%) that the government –
including the agricultural
sector – should use social networking tools as part of their communication strategy.
Significantly more non‐farm agribusiness professionals (95%) agree with this
communication idea compared to other agricultural professionals.
Agree: 89%
Disagree: 11%
Demographic Information on Survey Respondents
26
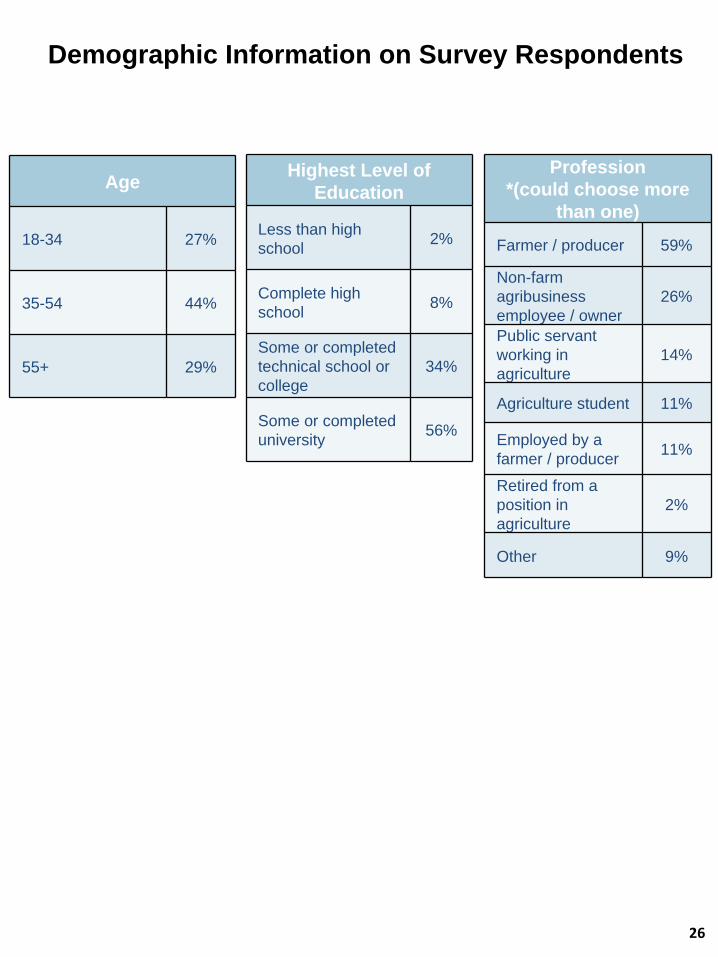
Age
18-34 27%
35-54 44%
55+ 29%
Highest Level of Education
Less than high school
2%
Complete high school
8%
Some or completed technical school or college
34%
Some or completed university
56%
Profession *(could choose more
than one)
Farmer / producer 59%
Non-farm agribusiness employee / owner
26%
Public servant working in agriculture
14%
Agriculture student 11%
Employed by a farmer / producer
11%
Retired from a position in agriculture
2%
Other 9%
27
With these results, the aim is that OMAFRA, researchers, ag organizations, and agri-business will have relevant data to help them better target effort and investment in platforms and information channels that are most widely used by their clients or stakeholders.
The results can help to provide a basis for decisions on allocating resources for:
• designing effective communication strategies using newer communication channels;
• designing applications (“apps”) that are platform specific; and,
• planning technology transfer programs that include new communication technologies.
Next steps
• Continue to share results:– Available to do presentations/workshops with
groups – can be specialized topic or general
– Can also provide slides and materials to groups for their own discussions, use
– Raw data available upon request
• Those in the Ontario agricultural industry can use the data to support and guide initiatives and investments (communications, resources, technology transfer)
• Follow-up on ideas, initiatives, collaborations that are emerging as the results are shared and discussed
• Hope to repeat survey in a year or two to measure change and update the results

Thanks to
• OMAFRA/University of Guelph Knowledge Translation and Transfer funding program
• All who helped promote the survey


![Exploring Novice Approaches to Smartphone-based ...web.stanford.edu/~mattm401/docs/2017-Mauriello-CHI... · professional energy auditing has increased [35,52]. Professional energy](https://img.pdfslide.net/doc/110x75/5f17fd47c0147d7eb37e66da/exploring-novice-approaches-to-smartphone-based-web-mattm401docs2017-mauriello-chi.jpg)