Embed Size (px)
Citation preview
Exploring Solutions to Global Environmental Problems: The Case of Fisheries Management
Edward J. Garrity Canisius College
All potential solutions in quota based fisheries management require good information flow among the stakeholders in order to provide feedback on stock levels and fishery health. The computer simulations in this paper demonstrate the effectiveness of ITQ programs in managing fisheries for long-run sustainability goals provided that political meddling via local community lobbying does not alter recommended quotas. We conclude with recommendations for co-management and methods to increase information flow among stakeholders. INTRODUCTION One of the most important environmental problems facing us is the over-fishing problem. Our growing world population and current fishing practices threaten the long-term viability of important fishing regions. Understanding the over-fishing problem can help shed light on the larger issue of managing world resources. The fisheries management problem has been known and studied for over 50 years. However, the extent of the problem was clearly and alarmingly made when Worm, et. al., (2006) concluded from their meta-analysis of 32 experimental studies on different marine environments that all commercial fish will be extinct in 40 years. Currently, about 29% of edible salt-water fish have declined by 90% - a drop that means the complete collapse of these fisheries (DeNoon, 2006). It is important to note that these effects are not predicted to happen, but are happening now (DeNoon, 2006; Dean, 2006). Marine environments are being assaulted from a number of directions, including over-fishing, environmental pollution and global climate change. Perhaps of greatest concern is the fact that human-dominated marine ecosystems are experiencing accelerating loss of species (biodiversity), with largely unknown consequences (Worm, et. al., 2006). The Fisheries Management Problem and Basic Solutions The common property problem as defined by Gordon (1954) and Hardin (1968) is difficult to solve in fisheries by assigning individual property rights. Instead economists have traditionally focused on limited entry licensing (Copes 1986) or other input restrictions. The idea is to restrict
Journal of Applied Business and Economics

inputs of capital and manpower into the fishery. However, despite these controls and even “buy-back” programs, investments in technological improvements to the existing fleet have resulted in overcapacity. This is also known as “capital stuffing.” An alternative approach to input controls is to monitor and manage fishery outputs. The simplest and most common output control is the quota or total allowable catch (TAC). The TAC typically imposes a maximum mass of fish that can be taken; and once the TAC is reached, the fishery is closed. Such an approach leads to the infamous “race to fish,” where fishermen compete feverishly to land as many fish as possible before the fishery is closed. The TAC approach leads to many problems including increased by-catch (i.e. non-target species), unsafe fishing practices and it results in a large number of fish being brought to market at once, thereby depressing fish prices and total fishermen revenue (Kura, et. al., 2004; Festa, et. al., 2008). Typically, overinvestment in fishing gear and processing equipment will result (Sutinen and Soboil, 2003). Need for a systems approach in Fisheries Management Fisheries management is characterized by increasing complexity in decision making involving the multiple viewpoints of the numerous stakeholders (Alverson 2002; Cochrane 2000; Dudley 2008). However, many researchers have focused on either one or several factors involved in fishery mismanagement, or have grouped factors into categories for analysis, such as institutional paralysis, the rapidity of technological developments, the uncertainty of science, and the inability to monitor and enforce regulations (Alverson 2002). While these may indeed be identified as primary causes, to view the problem in a factor-based or an event oriented view is to miss the point of understanding how the structure of the larger system gives rise to the observed behavior over time. Researchers have called for efforts to develop a more holistic view of fisheries management in an effort to understand the complexity and interactions. Walters (1980) emphasized the need to examine fisheries using interacting subsystems from biology, politics, economics and social viewpoints. Anderson (1984, 1987) included the notion of lobbying by the fishing community in order to influence fishery management policy. Recently, Dudley (2008) developed a comprehensive system dynamics model of fishery management. We build on the work of Dudley (2008) and others by presenting a simplified, system dynamic model in an effort to examine and compare policy solutions in fishery management. Examination of a Solution: Individual Transferable Quota (ITQ) Programs Individual quota systems prevent some of the side effects of TAC. Individual quotas are allocated among the participants in the fishery and can be thought of as a fixed share of the total catch that is allocated to an individual unit, either a company, an individual fisherman or a fishing unit in a community (Copes 1986; Festa, et. al., 2008). When quota shares can be traded in the market, the system is called an individual transferable quota (ITQ) or catch share programs. Since each individual is guaranteed their particular share of the total catch, they have freedom to pursue the timing and the degree of effort and thus undesirable sided effects such as “the race to fish” are eliminated. Why ITQs may Work Since individuals are granted a share of the total allowable catch they have responsibility and accountability over their shares along with the freedom and control over how to best manage and
Journal of Applied Business and Economics
control their shares (Festa, et. al., 2008). In short, catch shares or ITQs are management structures that are the closest to granting individual property rights or ownership stakes. While actual ownership of property is not granted per se, a fisherman’s behavior is certainly changed in the sense of creating feelings of psychological ownership. Psychological ownership is defined as the state in which an individual feels as though the target of ownership belongs to them (Pierce, et. al., 2004). Pierce, et. al., (2004) note that there are clinically based observations suggesting that responsibility, caring, stewardship, and acts of citizenship are enhanced when individuals experience feelings of ownership toward the target object. This is consistent with the experience of other publicly owned natural resources areas, such as national forests, where stewardship of the resource improves with the granting of private access rights (Festa, et. al., 2008). Indeed, in diverse environments from forests to elephant populations in Kenya, private access rights creates feelings of psychological ownership and leads to better environmental stewardship of the resource (Morrison, 2005; Esty & Winston, 2006). Since the economic value of quota shares increases when fish stocks are well managed, catch shares create an economic incentive for stewardship (Festa, et. al., 2008). Specifically, while most fishermen are directly concerned with cost-benefit in terms of catch per unit effort (CPUE), ITQ programs alter the equation to a combination of short-term CPUE and long term share value. Thus, ITQ programs create incentives for better information sharing and cooperation between fishery managers and fishing communities. This is because better information provided by fishermen to fishery managers helps in quota setting and long term management of fish stocks (i.e. sustainability goals). ITQ program successes in Canada, New Zealand, Australia, Iceland, Norway and other locations is prompting changes in the US systems and currently six of the eight federal regions are working to develop catch share or ITQ programs (Festa, et. al., 2008). System Dynamics and Simulation with Stock and Flow Understanding and managing stocks and flows, which includes resources that accumulate or decay and the flows that govern their change – is a fundamental process in social systems and business. All stock and flow problems share the same underlying structure – the resource level or stock accumulates its inflows less its outflowsi
. Formally, the stock, St, at any time T, is the integral of its net inflow, which, in turn, is the inflow, I, less the outflow, O (plus the initial value):
St = t∫t0 Net Inflow dt + St0 = t∫t0 (I – O)dt + St0
Equivalently, the rate of change of the stock is the net inflow: dS/dt = Net Inflow = I - O
System dynamics simulations are built using stock and flow models. Policy resistance, defined as the tendency for policy interventions to be defeated by the response of the system to the intervention itself, is often the result of humans’ inadequate mental models. There is a tendency to view problems from a limited, parochial viewpoint which limits our ability to see the multiple interconnections involved in the larger system definition. Further, complex social systems involve many stock and flow relationships, non-linear dynamics and feedbacks. Such complex systems mean that humans are unable to infer the long-run consequences of our actions without the use of computer simulations (Sterman 1989, 2000). Thus, the next sections explore
Journal of Applied Business and Economics
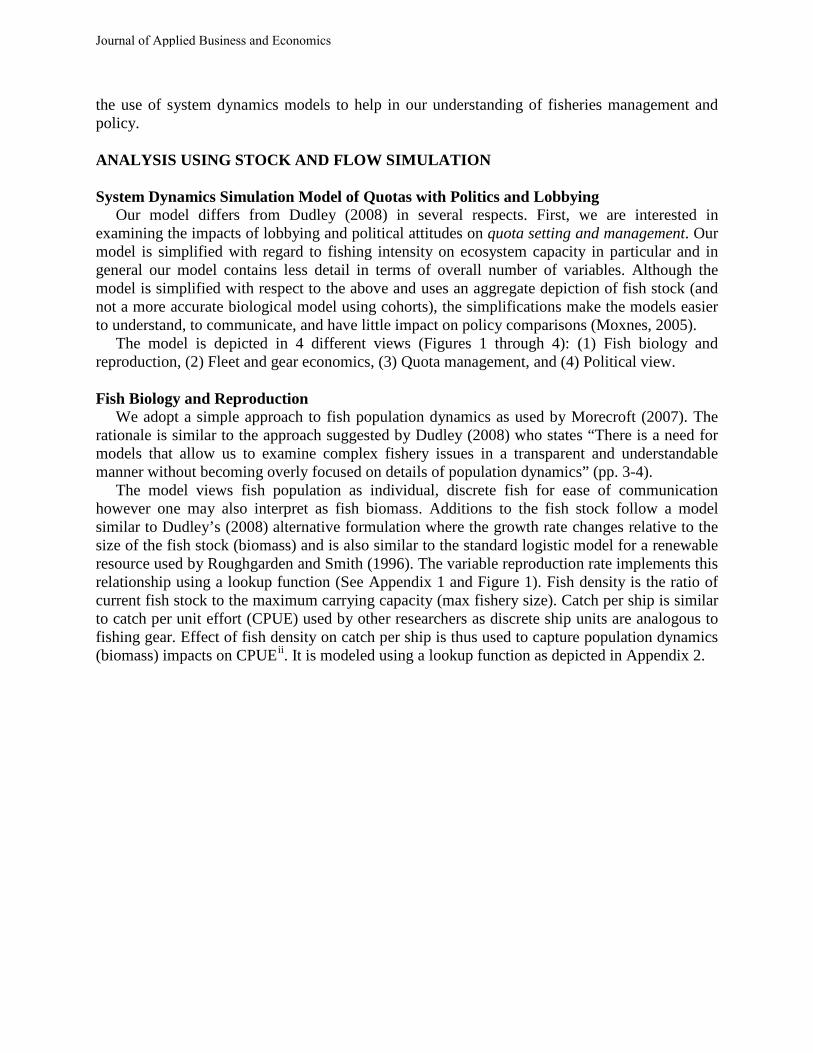
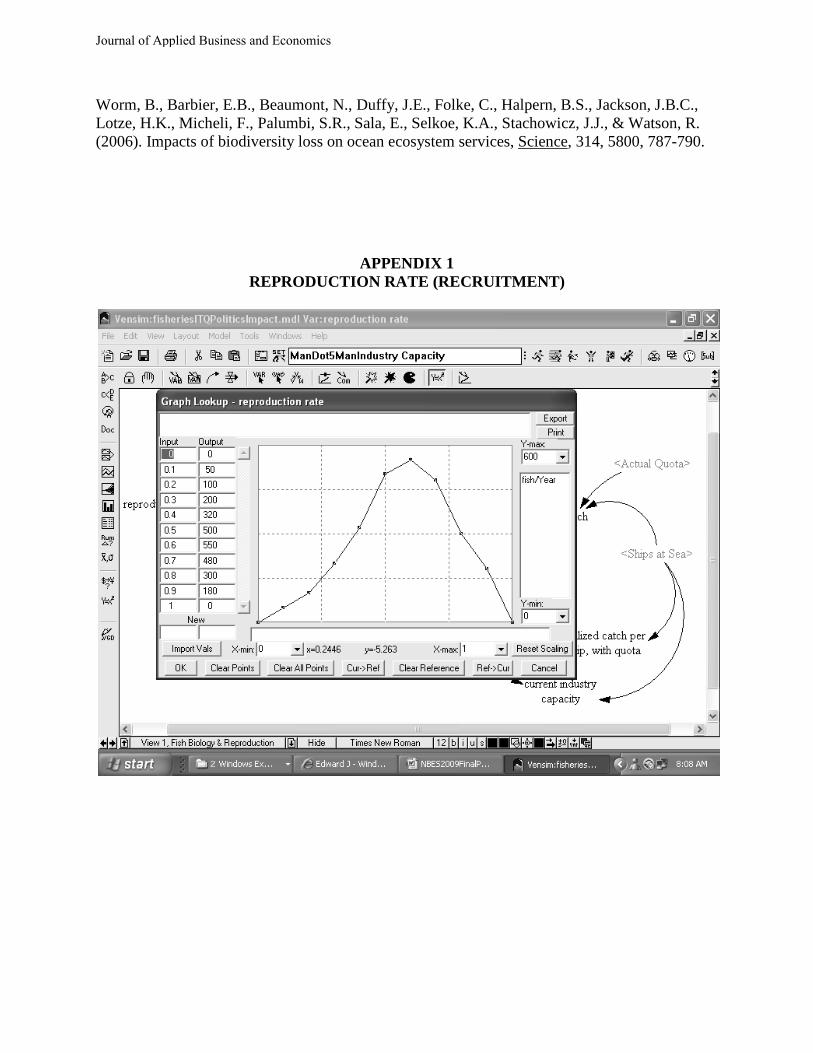
the use of system dynamics models to help in our understanding of fisheries management and policy. ANALYSIS USING STOCK AND FLOW SIMULATION System Dynamics Simulation Model of Quotas with Politics and Lobbying Our model differs from Dudley (2008) in several respects. First, we are interested in examining the impacts of lobbying and political attitudes on quota setting and management. Our model is simplified with regard to fishing intensity on ecosystem capacity in particular and in general our model contains less detail in terms of overall number of variables. Although the model is simplified with respect to the above and uses an aggregate depiction of fish stock (and not a more accurate biological model using cohorts), the simplifications make the models easier to understand, to communicate, and have little impact on policy comparisons (Moxnes, 2005). The model is depicted in 4 different views (Figures 1 through 4): (1) Fish biology and reproduction, (2) Fleet and gear economics, (3) Quota management, and (4) Political view. Fish Biology and Reproduction We adopt a simple approach to fish population dynamics as used by Morecroft (2007). The rationale is similar to the approach suggested by Dudley (2008) who states “There is a need for models that allow us to examine complex fishery issues in a transparent and understandable manner without becoming overly focused on details of population dynamics” (pp. 3-4). The model views fish population as individual, discrete fish for ease of communication however one may also interpret as fish biomass. Additions to the fish stock follow a model similar to Dudley’s (2008) alternative formulation where the growth rate changes relative to the size of the fish stock (biomass) and is also similar to the standard logistic model for a renewable resource used by Roughgarden and Smith (1996). The variable reproduction rate implements this relationship using a lookup function (See Appendix 1 and Figure 1). Fish density is the ratio of current fish stock to the maximum carrying capacity (max fishery size). Catch per ship is similar to catch per unit effort (CPUE) used by other researchers as discrete ship units are analogous to fishing gear. Effect of fish density on catch per ship is thus used to capture population dynamics (biomass) impacts on CPUEii
. It is modeled using a lookup function as depicted in Appendix 2.
Journal of Applied Business and Economics
FIGURE 1 FISHERIES MODEL (VIEW FISH BIOLOGY AND REPRODUCTION)
Fleet and Gear Economics and Bounded Rationality The investment policy uses the heuristic that fishermen will expand their fleet as long as their CPUE (catch per unit effort) or (effect of catch per ship on desire to grow) is above their minimum break even level of efficiencyiii
(Figure 2). The output from this lookup function is used to modify their maximum expansion amount (normal desire to grow). Thus, even when their CPUE is quite high, the normal desire to grow is an upper bound that reflects some risk aversion to fleet expansion. On the other hand, the variable also reflects the economic desire to expand the fleet as increased capacity allows for enhanced revenue and chances for higher profits. Finally, the gap between desired fleet size and actual fleet is altered using a balancing loop that assumes a constant or average implementation delay.
Journal of Applied Business and Economics
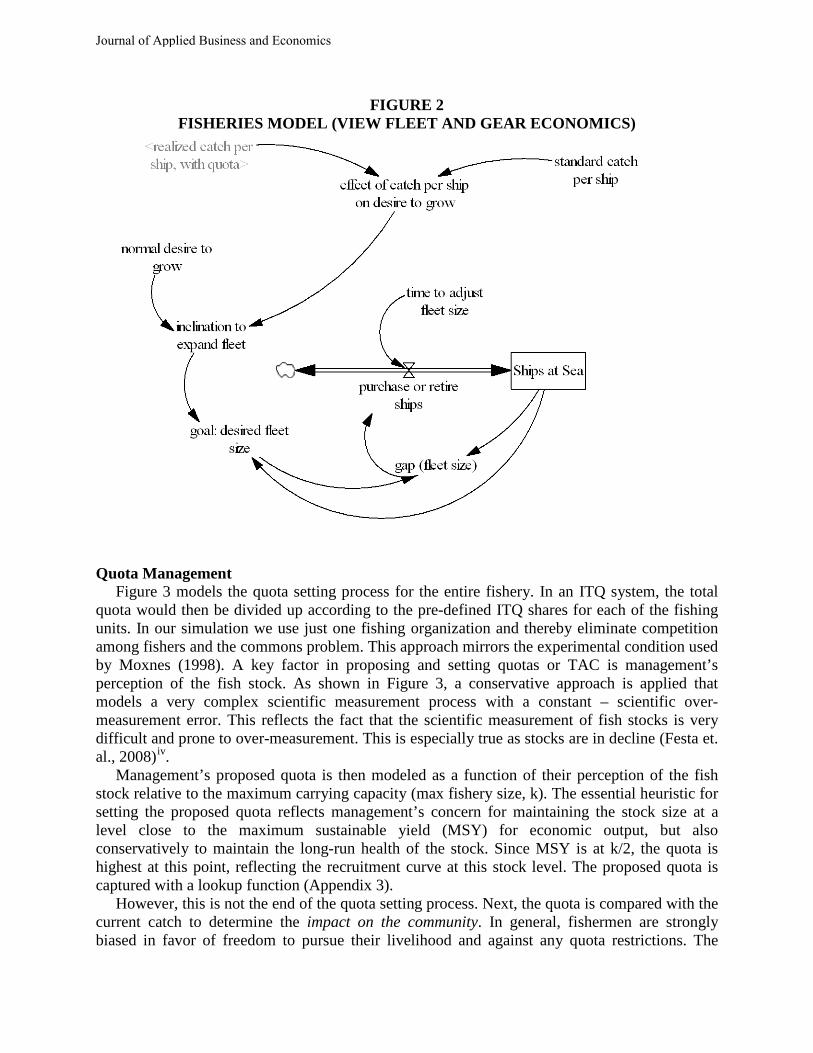
FIGURE 2 FISHERIES MODEL (VIEW FLEET AND GEAR ECONOMICS)
Quota Management Figure 3 models the quota setting process for the entire fishery. In an ITQ system, the total quota would then be divided up according to the pre-defined ITQ shares for each of the fishing units. In our simulation we use just one fishing organization and thereby eliminate competition among fishers and the commons problem. This approach mirrors the experimental condition used by Moxnes (1998). A key factor in proposing and setting quotas or TAC is management’s perception of the fish stock. As shown in Figure 3, a conservative approach is applied that models a very complex scientific measurement process with a constant – scientific over-measurement error. This reflects the fact that the scientific measurement of fish stocks is very difficult and prone to over-measurement. This is especially true as stocks are in decline (Festa et. al., 2008)iv
Management’s proposed quota is then modeled as a function of their perception of the fish stock relative to the maximum carrying capacity (max fishery size, k). The essential heuristic for setting the proposed quota reflects management’s concern for maintaining the stock size at a level close to the maximum sustainable yield (MSY) for economic output, but also conservatively to maintain the long-run health of the stock. Since MSY is at k/2, the quota is highest at this point, reflecting the recruitment curve at this stock level. The proposed quota is captured with a lookup function (Appendix 3).
.
However, this is not the end of the quota setting process. Next, the quota is compared with the current catch to determine the impact on the community. In general, fishermen are strongly biased in favor of freedom to pursue their livelihood and against any quota restrictions. The
Journal of Applied Business and Economics
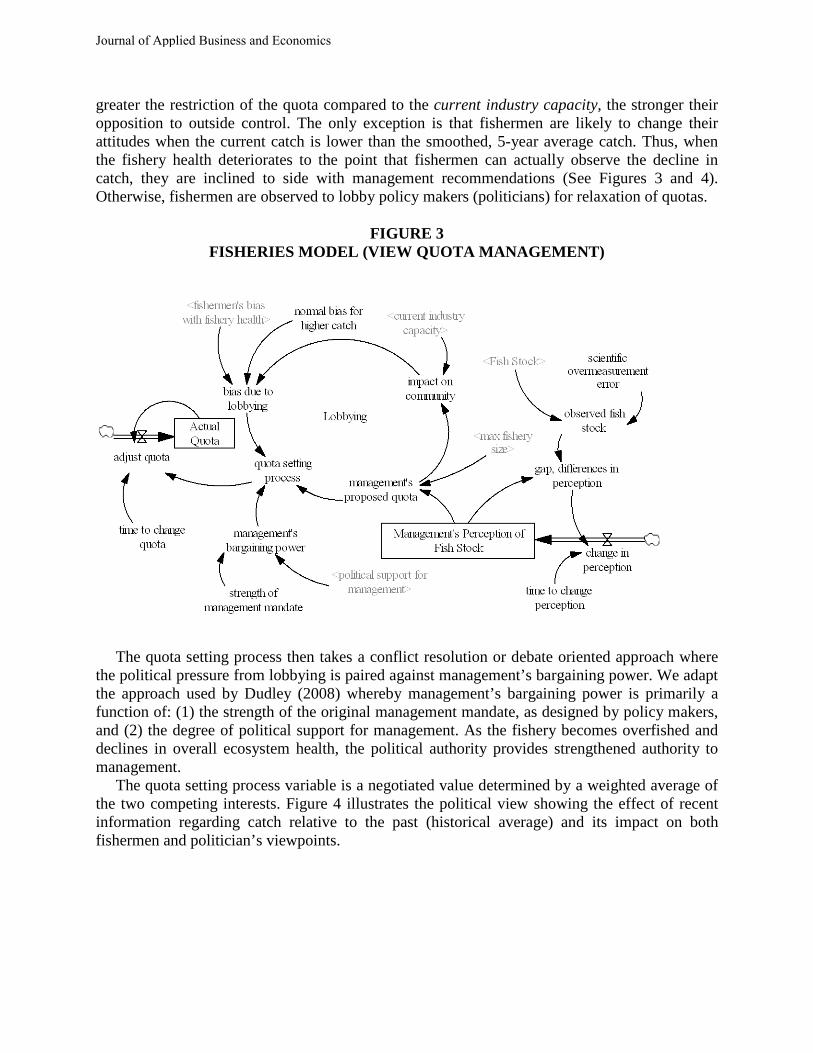
greater the restriction of the quota compared to the current industry capacity, the stronger their opposition to outside control. The only exception is that fishermen are likely to change their attitudes when the current catch is lower than the smoothed, 5-year average catch. Thus, when the fishery health deteriorates to the point that fishermen can actually observe the decline in catch, they are inclined to side with management recommendations (See Figures 3 and 4). Otherwise, fishermen are observed to lobby policy makers (politicians) for relaxation of quotas.
FIGURE 3 FISHERIES MODEL (VIEW QUOTA MANAGEMENT)
The quota setting process then takes a conflict resolution or debate oriented approach where the political pressure from lobbying is paired against management’s bargaining power. We adapt the approach used by Dudley (2008) whereby management’s bargaining power is primarily a function of: (1) the strength of the original management mandate, as designed by policy makers, and (2) the degree of political support for management. As the fishery becomes overfished and declines in overall ecosystem health, the political authority provides strengthened authority to management. The quota setting process variable is a negotiated value determined by a weighted average of the two competing interests. Figure 4 illustrates the political view showing the effect of recent information regarding catch relative to the past (historical average) and its impact on both fishermen and politician’s viewpoints.
Journal of Applied Business and Economics

FIGURE 4 FISHERIES MODEL (VIEW POLITICAL)
SIMULATION RESULTS Fisheries Model Outcomes: Base Case (No Lobbying, Politics or Quota setting) First, as a baseline comparison, we show the model results without interference from politics or quota setting (Figure 5). We follow the approach used by Morecroft (2007) where the fishery starts at a fleet size of 10 ships, 3370 fish, and we artificially keep the investment in ships (gear) at this level for 10 years of the simulation. At year 11 we step the desire to grow to 10% and examine the impacts given the stated assumptions and investment heuristics. Figure 5 shows the behavior over time graph for the important variables. In year 11 as the investment in ships increases, the catch rises at a rate that exceeds the births or recruitment. As inflows exceed outflows the stock goes into decline. At year 23 births or recruitment are at their maximum point and show the fisheries maximum sustainable yield. However, the catch is well above this rate and continues to climb with the continued investment in ships. In years 24 to 26 the fishery is past the tipping point and starts the dangerous decline. In year 28 the fishery has crashed completely and yet the investment heuristic continues to add capacity to the collapsed fishery (recall the time lag in Figure 2).
<catch>
avg catch
time to avg catch
gap, catch tohistorical avg
political support formanagement
thresold, catch/historicalcatch, fishery health
fishermen's bias withfishery health
Journal of Applied Business and Economics
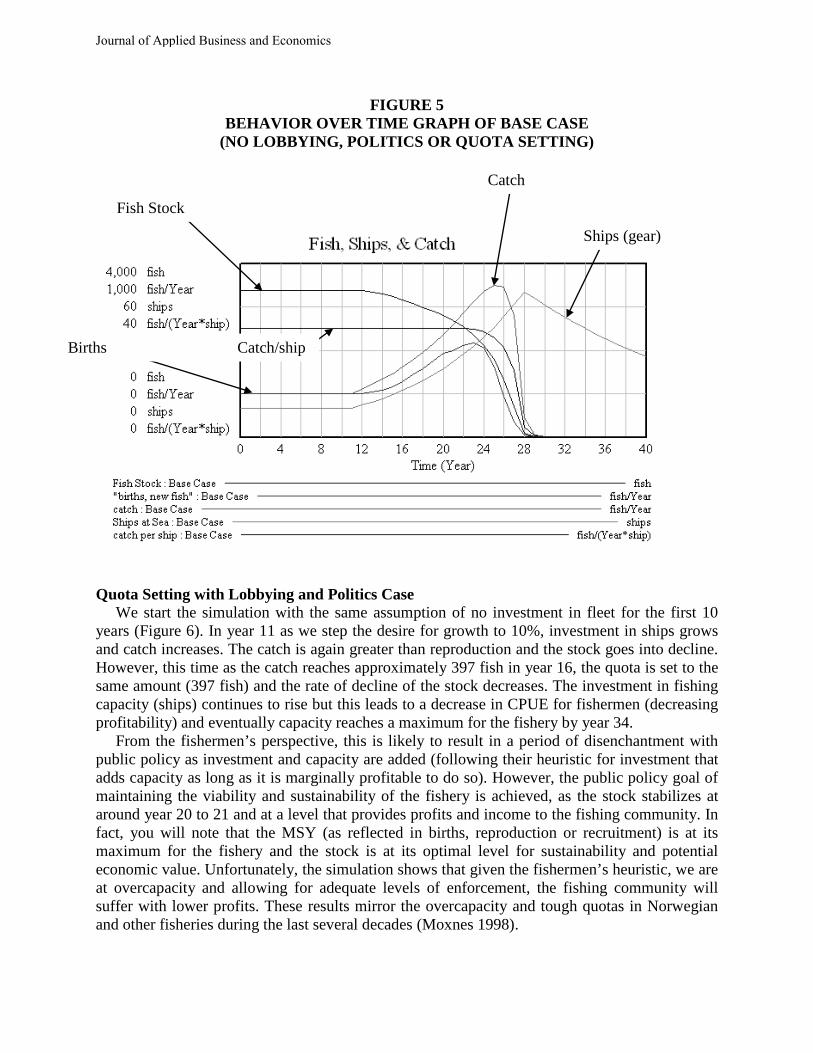
FIGURE 5 BEHAVIOR OVER TIME GRAPH OF BASE CASE
(NO LOBBYING, POLITICS OR QUOTA SETTING)
Quota Setting with Lobbying and Politics Case We start the simulation with the same assumption of no investment in fleet for the first 10 years (Figure 6). In year 11 as we step the desire for growth to 10%, investment in ships grows and catch increases. The catch is again greater than reproduction and the stock goes into decline. However, this time as the catch reaches approximately 397 fish in year 16, the quota is set to the same amount (397 fish) and the rate of decline of the stock decreases. The investment in fishing capacity (ships) continues to rise but this leads to a decrease in CPUE for fishermen (decreasing profitability) and eventually capacity reaches a maximum for the fishery by year 34. From the fishermen’s perspective, this is likely to result in a period of disenchantment with public policy as investment and capacity are added (following their heuristic for investment that adds capacity as long as it is marginally profitable to do so). However, the public policy goal of maintaining the viability and sustainability of the fishery is achieved, as the stock stabilizes at around year 20 to 21 and at a level that provides profits and income to the fishing community. In fact, you will note that the MSY (as reflected in births, reproduction or recruitment) is at its maximum for the fishery and the stock is at its optimal level for sustainability and potential economic value. Unfortunately, the simulation shows that given the fishermen’s heuristic, we are at overcapacity and allowing for adequate levels of enforcement, the fishing community will suffer with lower profits. These results mirror the overcapacity and tough quotas in Norwegian and other fisheries during the last several decades (Moxnes 1998).
Catch
Births Catch/ship
Ships (gear)
Fish Stock
Journal of Applied Business and Economics
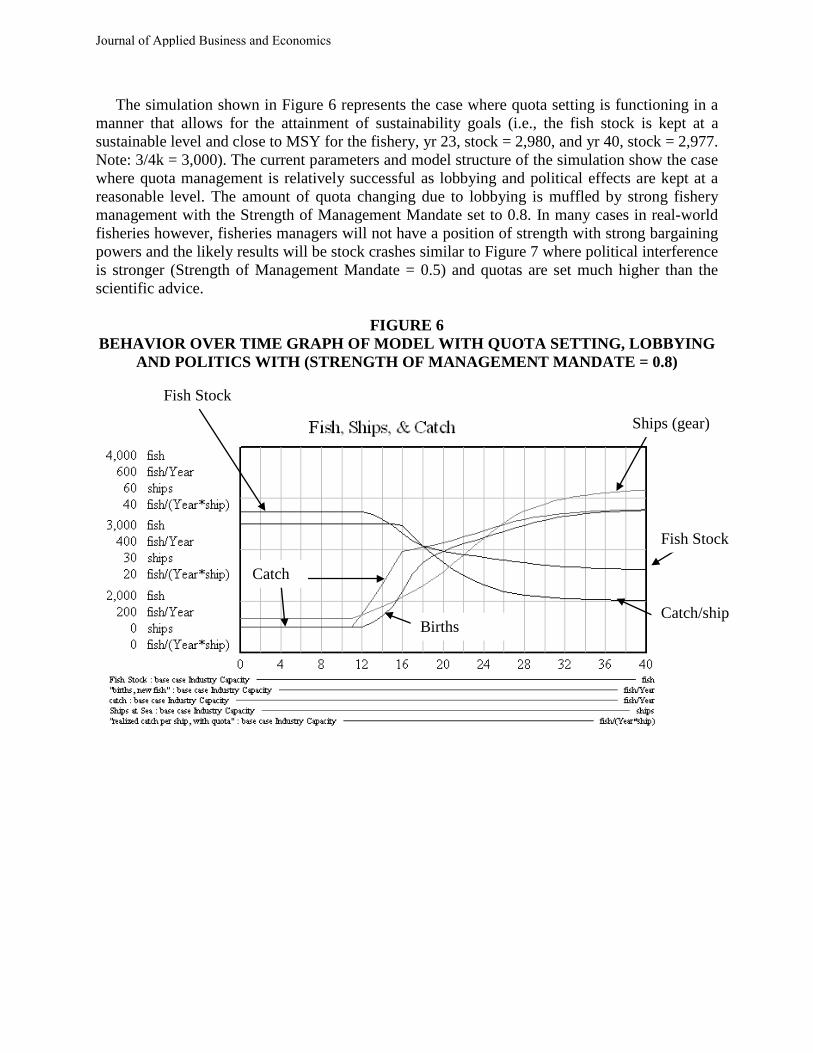
The simulation shown in Figure 6 represents the case where quota setting is functioning in a manner that allows for the attainment of sustainability goals (i.e., the fish stock is kept at a sustainable level and close to MSY for the fishery, yr 23, stock = 2,980, and yr 40, stock = 2,977. Note: 3/4k = 3,000). The current parameters and model structure of the simulation show the case where quota management is relatively successful as lobbying and political effects are kept at a reasonable level. The amount of quota changing due to lobbying is muffled by strong fishery management with the Strength of Management Mandate set to 0.8. In many cases in real-world fisheries however, fisheries managers will not have a position of strength with strong bargaining powers and the likely results will be stock crashes similar to Figure 7 where political interference is stronger (Strength of Management Mandate = 0.5) and quotas are set much higher than the scientific advice.
FIGURE 6 BEHAVIOR OVER TIME GRAPH OF MODEL WITH QUOTA SETTING, LOBBYING
AND POLITICS WITH (STRENGTH OF MANAGEMENT MANDATE = 0.8)
Fish Stock
Fish Stock
Catch/ship Births
Catch
Ships (gear)
Journal of Applied Business and Economics

FIGURE 7 BEHAVIOR OVER TIME GRAPH OF MODEL WITH QUOTA SETTING, LOBBYING
AND POLITICS WITH (STRENGTH OF MANAGEMENT MANDATE = 0.5)
DISCUSSION As shown above in the results section, the use of individual transferable quotas (ITQ) can be an effective means to manage fisheries for sustainability objectives. Individual transferable quotas are designed to provide virtual property rights to individual fishing groups or organizations. The ITQ restricts the total catch directly, thereby helping to manage for sustainability. Information sharing with fisheries managers is also improved since fishermen have incentives to manage the stock for the long-term because they will receive future revenue streams by virtue of ownership rights to the ITQ. Improved information flow among fishermen and fishery managers helps to ensure sound scientific advice on stock size and habitat quality. A primary drawback to ITQ programs (or any quota based management) however is political redress initiated by lobbying the political authority by fishermen and the local community. The larger system viewpoint encompasses the changes in the quota setting process by the political system. Another major drawback to ITQ programs is the long-run side effect of fishery consolidation. By design, ITQ programs restrict quantity (catch). If we consider that fish prices are largely set by macro or global forces and are uncontrollable, then we can see the causal forces at work. In order for fishermen to increase profits, they must become cost conscious and efficient in operations ((Price * Quantity) – expenses = profits). Since some fishing organizations will naturally be more efficient than others the less efficient fishermen will be bought out of the market.
Fish Stock
Births
Ships (gear)
Realized catch/ship
Fish Stock Catch
Journal of Applied Business and Economics
Co-Management Schemes and Improved Information Flow Researchers have recently investigated the use of co-management and other forms of Institutional Design (Imperial and Yandle 2005; Schreiber 2001, Ochieng 2008). Indeed, co-management of fisheries by fishing communities and management is essential in order for fishing communities to take responsibility for end results. Participation by local communities may help to achieve feelings of ownership. As active participation leads to increased levels of control and responsibility, fishermen and communities will gain increased feelings of psychological ownership. There are actually a number of good potential avenues to help implement co-management schemes. Cochrane (2000) for example, delineates a detailed management process whereby broad objectives are specified for each fishery along with high levels of participation by user groups. As part of the plan, high level operational goals are enacted in legislation. A key feature of this approach is to clearly and transparently state objectives, which are both measurable and attainable, and then to incorporate the strategy and measures into laws and regulations. SUMMARY AND CONCLUSIONS All potential solutions in fisheries management require good information flow among the stakeholders in order to provide feedback on stock levels and fishery health. The computer simulations in this paper demonstrate the effectiveness of ITQ programs in managing fisheries for long-run sustainability goals provided that political meddling via local community lobbying does not alter recommended quotas. Information flow and communication between fishermen and fishery managers is improved when ITQ programs are implemented because the ITQ provides for virtual ownership and fishermen have incentives to manage the resource for the long-run. Goals of fishery managers and fishermen thus coincide. Managerial Implications Given the demonstrated strengths and weaknesses of ITQ programs as shown in the preceding simulations, we recommend the following solutions for successfully managing fisheries: (1) the use of co-management where fishermen representatives serve on management councils for improved information flow between management and the community, (2) the use of web portals for information dissemination and education of the fishing community and the public. This will improve the situation of misperception of stock and flow dynamics and the overinvestment problem. In particular, web-based, decision support systems can be used to facilitate the status of fishery health and to provide support for the investment decision. Finally, compensation schemes for fishery managers should be adjusted to more clearly align the goals of managers with the fishing community. Goal alignment can help foster better team behavior (Garrity 2001), build trust, cooperation and improved information flow. Trust is improved when fishermen realize managers also have their short-term economic interests in mind when setting quotas, not just long run sustainability. Unfortunately, there are no “silver bullets” in fishery management or in similar cases of renewable resource management. The above recommendations rely on improved information, knowledge and decision making afforded through technology support. However, the true underlying problem is human overpopulation. Excess demand for fish fueled by world population growth and globalization has created a crisis situation. Real progress on managing
Journal of Applied Business and Economics
world fisheries and depleted resources must start with the underlying cause – world population management of humans. REFERENCES Alverson, D.L. (2002). Factors influencing the scope and quality of science and management decisions (The good, the bad and the ugly). Fish and Fisheries
, 3, 3-19.
Anderson, L.G. (1984). Uncertainty in the fishery management process. Marine Resource Economics
. 1(1), 77-87.
Anderson, L.G. (1987). Expansion of the fisheries management paradigm to include institutional structure and function. Transactions of the American Fisheries Society
. 116, 396-404.
Cochrane, K.L. (2000). Reconciling sustainability, economic efficiency and equity in fisheries: the one that got away? Fish and Fisheries
, 1, 3-21.
Copes, P. (1986). A critical review of the individual quota as a device in fisheries management. Land Economics.
62, 3, 278-291.
DeNoon, D. (2006). Salt-water fish extinction seen by 2048. CBS News, CBSNews.com
, November, 3rd.
Dean, C. (2006). Study sees ‘Global Collapse’ of fish species, November 3, The New York Times
.
Dudley, R. (2008). A basis for understanding fishery management dynamics. System Dynamics Review
, 24, 1, 1-29.
Esty, D.C. & Winston, A.S. (2006). Green to gold
. Yale University Press, New Haven, CT.
Festa, D., Regas, D. & Boomhower, J. (2008). Sharing the catch, conserving the fish. Issues in Science and Technology
. Winter, 75-84.
Garrity, E.J.(2001). Synthesizing User Centered and Designer Centered IS Development Approaches Using General Systems Theory. Information Systems Frontiers
, 3(1), 107-121.
Gordon, H.S. (1954). The economic theory of a common-property resource: The fishery. The Journal of Political Economy.
62, 2, 124-142.
Hardin, G. (1968). The tragedy of the commons. Science
, 162, 1243-1248.
Imperial, M.T. & Yandle, T. (2005). Taking institutions seriously: Using the IAD framework to analyze fisheries policy. Society and Natural Resources
, 18, 493-509.
Journal of Applied Business and Economics
Kura, Y., Revenga, C., Hoshino, E., & Mock, G. (2004). Fishing for answers: Making sense of the global fish crisis. Washington: World Resources Institute report
.
Morrison, J. (2005). How much is clean water worth? National Wildlife
, 43, 2, Feb-March, 24-28.
Morecroft, J. (2007). Strategic modeling and business dynamics: A feedback systems approach
. Wiley, Chichester, West Sussex, England.
Moxnes, E. (1998). Not only the tragedy of the commons: misperceptions of bioeconomics. Management Science,
44, 9, 1234-1248.
Moxnes, E. (2005). Policy sensitivity analysis: simple versus complex fishery models. System Dynamics Review,
21, 2, 123-145.
Ochieng, C.M.O. (2008). Comparative capitalism and sustainable development: Stakeholder capitalism and co-management in the Kenyan fisheries sub sector. Natural Resources Forum
, 32, 64-76.
Pierce, J.L., O’Driscoll, M.P. & Coghlin, A. (2004). Work environment structure and psychological ownership: The mediating effects of control. The Journal of Social Psychology,
144 (5), 507-534.
Roughgarden, J. & Smith, F. (1996). Why fisheries collapse and what to do about it. Proceedings National Academy of Science, Ecology
, 93, 5078-5083.
Sanchirico, J. & Newell, R. (2003). Catching market efficiencies: Quota-based fisheries management. Resources
, 8-11.
Schreiber, D.K. (2001). Co-management without involvement: the plight of fishing communities. Fish and Fisheries
, 2, 376-384.
Sterman, J. (2000). Business Dynamics: Systems thinking and modeling for a complex world
. Irwin/McGraw-Hill, Boston, MA.
Sterman, J. (1989). Modeling managerial behavior: Misperceptions of feedback in a dynamic decision making experiment. Management Science
, 33, 3, 321-339.
Sutinen, J. G., & Soboil, M. (2003). The Performance of Fisheries Management Systems and the Ecosystem Challenge. In M. Sinclair, & G. Valdimarsson (Eds.), Responsible Fisheries in the Marine Ecosystem,
(291-309). Oxford: CABI.
Walters, C.J. (1980). Systems principles in fisheries management. In Fisheries Management
, Lackey R.T., Nielsen, R.A. (eds.). Wiley: New York, New York; 167-183.
Journal of Applied Business and Economics
Worm, B., Barbier, E.B., Beaumont, N., Duffy, J.E., Folke, C., Halpern, B.S., Jackson, J.B.C., Lotze, H.K., Micheli, F., Palumbi, S.R., Sala, E., Selkoe, K.A., Stachowicz, J.J., & Watson, R. (2006). Impacts of biodiversity loss on ocean ecosystem services, Science
, 314, 5800, 787-790.
APPENDIX 1 REPRODUCTION RATE (RECRUITMENT)
Journal of Applied Business and Economics
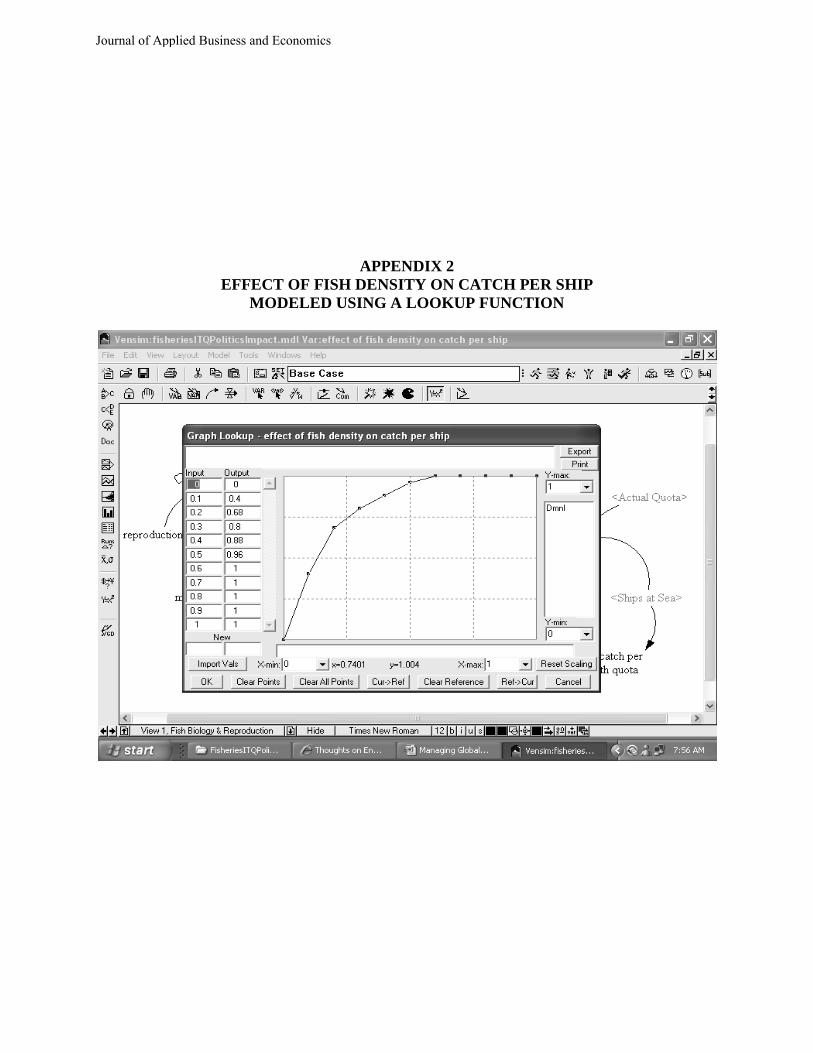
APPENDIX 2
EFFECT OF FISH DENSITY ON CATCH PER SHIP MODELED USING A LOOKUP FUNCTION
Journal of Applied Business and Economics
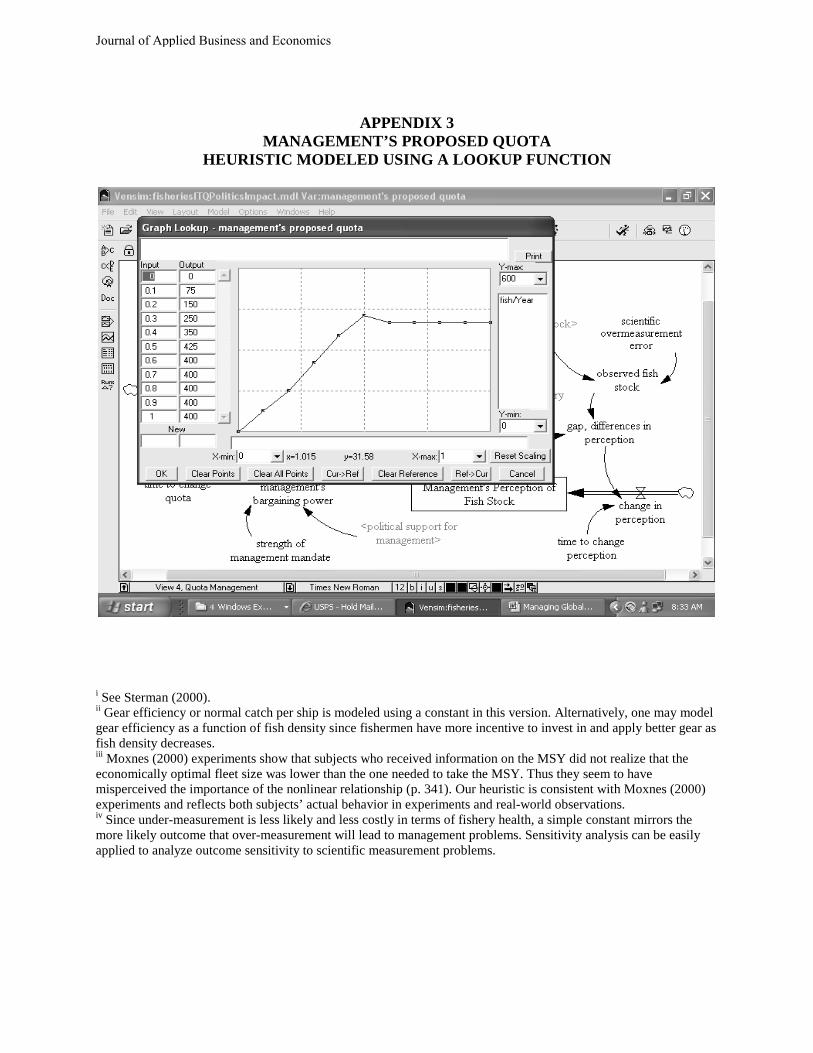
APPENDIX 3
MANAGEMENT’S PROPOSED QUOTA HEURISTIC MODELED USING A LOOKUP FUNCTION
i See Sterman (2000). ii Gear efficiency or normal catch per ship is modeled using a constant in this version. Alternatively, one may model gear efficiency as a function of fish density since fishermen have more incentive to invest in and apply better gear as fish density decreases. iii Moxnes (2000) experiments show that subjects who received information on the MSY did not realize that the economically optimal fleet size was lower than the one needed to take the MSY. Thus they seem to have misperceived the importance of the nonlinear relationship (p. 341). Our heuristic is consistent with Moxnes (2000) experiments and reflects both subjects’ actual behavior in experiments and real-world observations. iv Since under-measurement is less likely and less costly in terms of fishery health, a simple constant mirrors the more likely outcome that over-measurement will lead to management problems. Sensitivity analysis can be easily applied to analyze outcome sensitivity to scientific measurement problems.
Journal of Applied Business and Economics


![Environmental problems [autosaved]](https://img.pdfslide.net/doc/110x75/55ab5fd31a28ab651a8b46ed/environmental-problems-autosaved.jpg)