Embed Size (px)
Citation preview

- Master Recherche en Sciences Cognitives -
Université Paris Descartes - EHESS - ENS
Exploring the bouba/kiki effect: a behavioral and fMRI study
Nathan Peiffer-Smadja
Master 2 Thesis 2009-2010
Under the supervision of:
Pr. Laurent Cohen “Neuropsychology and Neuroimaging”
CRICM / CNRS UMR7225 / INSERM UMR_S975 / UPCM

ABSTRACT
Sound symbolism theory asserts that vocal sounds have a meaning independently of the words in which they occur. A striking example of this theory is the bouba/kiki effect which shows that non-sense words are non-randomly mapped onto unknown round or spiky shapes. While many studies have focused on the psychological reality of this phenomenon, only a few have tried to explain it. After showing that both vowels and consonants composing the pseudowords modulated the association with round or spiky shapes, we tried to assess the automaticity of this effect in speeded classification tasks. For the first time we found behavioral evidence that this effect could be due to cross-modal integration. We also report brain imaging results obtained during passive presentation of shapes, pseudowords or matching and mismatching pairs of shapes and pseudowords. We observed an increased activation for mismatching pairs of stimuli compared with matching stimuli in frontal cortices, which could reflect an incongruency effect. In addition, we found a difference of activation between matching and mismatching pairs correlated with a behavioral index of sensitivity to the effect in lateral occipital cortex. We discuss these results in the light of hypotheses concerning the bouba/kiki effect.
CONTENTS
I. Introduction 4 1. Historic of sound symbolism 4 2. The bouba/kiki effect 6 3. Hypotheses concerning the bouba/kiki effect 6 4. Goals of our study 8
II. Behavioral experiments 9 1. Material and methods 9 2. Explicit choice experiment 10 3. Implicit Association Test 16 4. Speeded classification experiment 20 5. Speeded double classification experiment 22
III. fMRI experiment 25 1. Objectives and hypotheses 25 2. Material and methods 25 3. Behavioral Results 29 4. Imaging Results 32 5. Imaging Discussion 37
IV. Conclusion 42 V. Bibliography 44 VI. Remerciements 48 VII. Annexes 49

I. Introduction
1. Historic of sound symbolism “The link existing between the signified and the signifier is arbitrary, or more simply (…) the linguistic sign is arbitrary. Thus the idea of ‘sister’ is not linked by any interior relationship with the series of sounds ‘s-i-st-e-r’ that corresponds to its signifier; it could quite as well be represented by any other signifier, which is proved by the differences between languages and the very existence of different languages.” When Saussure asserted in his “Lectures on general Linguistics” that the link between signified and signifier was arbitrary, he intended to put an end to an age-long debate over the conventional or the natural aspect of the linguistic sign. In his work “Cratylus” Plato presented a dialogue between Hermogenes, who held that “if one substituted one name for another, the latter would be as correct as the former” and Cratylus who asserted that “there was for each object a name that was its own and that belonged to it intrinsically, or by its nature”. Socrates concluded that, while admitting that in general the link between a thing and its name was arbitrary, there, nevertheless, were some noble words whose sound reflected their meaning. Since then, some psychologists have started calling into question, from an empirical point of view, the fully arbitrary nature of the link between signifier and signified, exploring the possibility that that certain sounds contain within themselves a certain meaning. The idea of a direct link between sound and meaning, known under the name of sound symbolism or phonetic symbolism, was, among others, upheld in the 19th century by Wilhelm von Humboldt. The definition of sound symbolism is not exactly the same among different authors, and this term may apply to many different phenomena. Hence, before reviewing experimental data existing on the subject, we will give a brief outline of the phenomena referred to as sound symbolism. Traditionally, phonetic symbolism comprehends all the occurrences wherein sounds produced by the human sound-producing organ express a meaning without using the system of language. The research dealing with phonetic symbolism takes on many forms according to the sounds studied, the experimental method applied or the meanings being investigated. First of all, we can define sound symbolism according to the kind of sound it deals with. Indeed, numerous studies refer to sound symbolism on very different levels, ranging from paragraphs to pure tones, with such intermediary stages as words or phonemes. Poetry, for example, uses many techniques whereby the sound is essential for the meaning: in his famous imitative alliteration, Racine wrote “Pour qui sont ces serpents qui sifflent sur vos têtes?” where the idea of snakes rests on the repetition of the sound “s”. Such an example would be considered considered as being on the fringes of sound symbolism. Onomatopoeia represent an example often cited to evidence the link between sound and sense (Nichols & Ohala, 1994). Saussure discussed this idea and considered that the differences between onomatopoeia from one language to another confirmed the arbitrariness of linguistic signs.

However, within a given language, it seems clear that the origin of onomatopoeia lies in the imitation of a sound produced by animals, thus creating a kind of sound symbolism. Beyond onomatopoeia, all languages use mimetic words, whose phonetic structure is analogous to the meaning the words convey: “zigzag” in French, “pop”, or “bang” in English. Some Asian languages even have categories of words which are recognized as “sound symbolic”. The Japanese, for example, make a difference between onomatopoeia (phonomimes), phenomimes and psychomimes (Nichols & Ohala, 1994). Phenomimes and psychomimes are words describing exterior phenomena or psychological states whose phonetic structure reflects their meaning. It remains that these words follow conventional rules that enable their users to link sound and sense.
Fig I.1: Examples of sound symbolic relations in japanese phenomimes.
Many studies dealing with phonetic symbolism focused on mere phonemes. The use of phonemes has many advantages, in particular they enable us to avoid the confusion between what is the result of a real phenomenon of sound symbolism and what is the result of a conventional link between an existing word and its meaning known beforehand (e.g. the word “ball” would be considered round independently of sound-symbolic associations). Indeed, actual words automatically refer to the meaning that is ascribed to them and it is difficult, in those conditions, to single out, a posteriori, the elements that seem to belong to sound symbolism, whereas, if we use mere, apparently meaningless, sounds, this risk factor is more easily eliminated. Numerous experimental methods have been used in order to prove the existence of a privileged link between sound and sense. One of the most often used is cross-language generalization. Such studies were replicated among subjects from different countries and with different native languages. Subjects are presented with pairs of antonyms belonging to languages unknown to them. They are asked to guess which of the two words refers to a given meaning, e.g. which word means “dark” and which one means “light” and manage to do it at rates exceeding chance (Koriat & Levy, 2004; Brown, Black, & Horowitz, 1955; Taylor & Taylor, 1962; Huang, Pratoomraj, & Johnson, 1969). It has been shown in two recent studies (Imai & Okada, 2008; Nygaard, Cook, & Namy, 2008) that such cross-language generalization could be used in word learning: English-speaking adults and children were better at learning Japanese words that matched their Japanese meaning (e.g “hayai” (fast) learned as “fast”) compared to Japanese words that matched their Japanese antonym meaning (e.g. “hayai” (fast) learned as “slow”). Another appealing evidence of sound symbolism has been recently made by a team that showed that English nouns and verbs possessed systematic differences in phonological properties that influenced on-line processing of sentences (e.g. noun-like nouns (based on phonology) were processed faster than verb-like nouns) (Farmer, Christiansen, & Monaghan, 2006). Although these observations bring evidence to the existence of a natural link between sound and sense, they do not provide an explanation of this link.

2. The bouba/kiki effect Köhler discovered another method to study phonetic symbolism: in the island of Tenerife he showed to subjects two novel shapes, one round and one spiky, and gave them the two non-sense words “baluma” (later renamed “maluma”) and “takete” to label them. He observed that a vast majority of English-speaking adults chose maluma for the round shape and takete for the spiky shape (Köhler, 1947). This experiment illustrates a form of sound symbolism in so far as it brings to light a reproducible link between linguistically meaningless sounds and geometrical shapes. Indeed, Other researchers have used these words and shapes and have found similar results (Holland & Wertheimer, 1964; Wertheimer, 1958) sometimes with subjects speaking totally unrelated languages (Davis, 1961). More recently, Ramachandran and Hubbard (Ramachandran & Hubbard, 2001) replicated this result and found that 95% of English-speaking adults associated the round shape with the pseudoword « bouba » and the spiky shape with « kiki ». Since this study, the phenomenon has often been called the “bouba/kiki effect”. This privileged mapping seems reliable as researchers found that 2.5-year-old English-speaking children and adults significantly associated pseudowords containing rounded vowels to round shape and unrounded vowels to spiky shapes (Maurer, Pathman, & Mondloch, 2006).
Figure I.2: Original drawings used in Köhler experiment.
3. Hypotheses concerning the bouba/kiki effect Köhler originally used the non-sense words “takete” and “baluma” in a written form. Thus, one of the hypotheses was that people associated shapes with pseudowords because of the geometrical resemblance between the letters and the shape. This explanation has been progressively dismissed as this effect has been found in many languages (Davis, 1961) and with spoken words (Maurer, Pathman, & Mondloch, 2006). Moreover, the existence of a bouba/kiki effect with pre-literate 2.5-year-old children cannot be explained by similarities between letters and shapes. Some researchers have tried to put forward other hypotheses to account for the bouba/kiki effect. Ramachandran and Hubbard proposed that we associate spiky shapes to “kiki” and round shapes to “bouba” because they mimic the articulatory movements we make when
pronouncing these words. We call this hypothesis the “articulatory hypothesis”. Such an explanation could be related to motor theories of speech perception. Speech perception and production are often separated in schematic neurological theories of language, taking place respectively in left superior temporal and inferior frontal lobes (the so-called Wernicke’s and Broca’s areas) (Wernicke, 1874; Damasio & Geschwind, 1984; Gernsbacher & Kaschak, 2003). However, many neurobiological and psycholinguistic theories of speech consider that speech perception and production could be strongly linked. For example, the motor theory of speech perception postulates that people perceive speech sounds by identifying the articulatory movements necessary to produce them (Liberman & Mattingly, 1985). The direct realist theory of speech perception also proposes a direct link between speech perception and production (Fowler, 1986). Imaging experiments have brought evidence for these theories, with activation of left inferior frontal cortex or motor and premotor cortex while passively listening to words (Wilson, Saygin, Sereno, & Iacoboni, 2004; Hauk, Johnsrude, & Pulvermüller, 2004). One crucial point of these theories has been addressed recently: the specificity of activation for heard speech components in premotor cortex. It has been shown that passive listening to phonemes [t] and [p] activated different precentral clusters, corresponding to the ones activated to pronounce them (tongue motor area for [t] and lips motor area for [p]) (Pulvermüller, Huss, Kherif, Moscoso del Prado Martin, Hauk, & Shtyrov, 2006). As the authors of this study note “this is evidence that information about specific articulatory and motor features of speech sounds is accessed in speech perception”. More recently, researchers reported behavioral evidence that specific speech production commands are automatically and involuntarily accessed during speech perception (Yuen, Davis, Brysbaert, & Rastle, 2010). They recorded electropalatography measures of subjects pronouncing syllables beginning by [k] or [s] while listening either to the same syllables or to syllables beginning with [t] and found that this perceived syllable could modify [k] or [s] production. Subjects’ electropalatography showed traces of [t] production added to [k] or [s] production, meaning that this modification was specific of the incongruent syllable used. Thus, it seems highly probable that when hearing “kiki” or “bouba”, specific articulatory information about these words are accessed. It remains to show how these articulatory movements could relate to visual information and linking to particular shapes. A beginning of explanation could be found in work showing link between mouth articulation gestures and hand movements (Rizzolatti & Arbib, 1998). In a set of studies, Gentilucci et al (Gentilucci, Stefanini, Roy, & Santunione, 2004; Gentilucci, Campione, Dalla Volta, & Bernardis, 2009) have found that when subjects observe or execute a grasping action on objects of different size, the size of the target objects influenced the articulation of syllables pronounced simultaneously. When observing the grasp of a big solid object (power grasp), people pronounced a “bigger” /da/ (as assessed by the size of the first formant) as when observing the grasp of a small object (precision grasp). They conclude that seeing a grasping movement could specifically activate hand articulatory areas which in turn may affect speech. If we think that shapes could be processed as graspable objects, we can imagine that specific hand articulatory information about visually presented shapes could enter in conflict with specific mouth articulatory information extracted from pseudowords. This hypothesis may seem far-fetched but predicts that the associations between “bouba” and round shapes could take place in motor or premotor cortex. Another theory would be that shapes and sounds are linked because of physical similarities. Indeed, we can think that the physical properties of large vs small or round vs spiky objects make them more prone to produce sounds close to “bouba” or “kiki”, based on the fact that in the real world, low-frequency sounds tend to come from larger and possibly softer objects, and vice-versa. Some studies found for example links between relative size of visual stimuli

and relative pitch of sounds and showed that modulating congruency along these two dimensions could influence multisensory integration (Spence, 2007). We think that the bouba/kiki effect could be an example of multisensory integration based on physical similarity. Spence et al attribute their results to “synaesthesic congruency” but we think that this term is deceiving as it blends synaesthesia whose correspondences between senses are often unexplained by physical similarity and their results which can find naïve physical explanations (e.g. big objects produce lower frequency). Whereas several factors have been identified as having a major impact on multisensory integration (such as spatial or temporal correspondence), the role of “semantic” or “higher-order” congruence is more vague and has mostly been studied with complex visual and auditory stimuli whose association has been clearly established (Laurienti, Kraft, Maldjian, Burdette, & Wallace, 2004; or see Doehrmann & Naumer, 2008 for a review). In many cases, theses associations can be considered arbitrary (Van Atteveldt, Formisano, Goebel, & Blomert, 2004) and studies using low-level visual and auditory features as a “semantic” link are sparse. What Spence calls “synaesthesic congruency” and what Doehrmann calls “weak degree of “semantic”” is the same thing and could represent a new kind of factor playing a role in multisensory integration, explained by physical similarity. Our hypothesis is that the bouba/kiki effect could be the result of a match between low-level features of both stimuli but we do not know if this match would take place directly between unisensory areas or if it is mediated by higher-order regions. It is possible that low-level physical features of auditory and visual stimuli are both linked to the same higher-order representation, thus creating a (in)congruency effect. As a recent study showed, even a low feature such as pitch can be reproducibly mapped along a variety of dimensions such as “light-dark”, “sparse-dense” or even “granddaughter-grandma” (Eitan & Timmers, 2010). On the other hand, many recent studies have shown direct links between early sensory regions and the field of multisensory integration has begun to pay more attention to effects that could take place in these areas (Ghazanfar & Schroeder, 2006; Lemus, Hernández, Luna, Zainos, & Romo, 2010). The two latter theories are not mutually exclusive; it could be that they both participate in this word-shape mapping and we can even imagine that articulatory information about pronounced word could increase a perceptual link between sound and shape because of physical features they share with both stimuli. Indeed, low-level features of shapes can be either matched to low-level features of sounds or to low-level features of articulatory movement, as there is a clear physical link between sounds and the movements used to pronounce them.
4. Goals of our study We chose to focus on the bouba/kiki effect for different reasons. Firstly, it seems to be intuitively powerful for a great majority of people, while there is no obvious way to account for this link between pseudowords and shapes. Furthermore, this phenomenon deals only with simple abstract shapes and meaningless pseudowords, which are not burdened, at least in part, with the problems caused by actual words. Using real words to analyze this effect seems fraught with difficulty, owing to the fact that they automatically refer to their meaning. Concomitantly, the use of abstract shapes makes it possible to focus on meaning while manipulating simple concepts, like those of shape or size. Last but not least, we think that explaining the bouba/kiki effect could open the way for explanations to a variety of phenomena attributed to sound symbolism. Indeed, we think that
some of the observations made by early researchers in the field could be explained either by links between sounds properties and other sensory modalities (mainly visual) or by links between speech perception, speech production and higher-order semantic processing. Understanding why non-sense words can be non-arbitrarily mapped to unknown visual objects could bring new arguments to a still active debate over the arbitrariness of the sign and the origins of language. Thus, the main goal of our study is to try to explain why people preferentially associate some non-sense words with some shapes, keeping in mind the major theories that could explain this effect. We consider the bouba/kiki effect as a form of crossmodal integration, either led by higher-order representations common to both stimuli, by articulatory links between speech production and hand movement or by shared low-level auditory and visual physical features. Consequently we think that one of the most promising approaches to disentangle these explanations could be to use brain imagery. Indeed, the three hypotheses do not predict the same pattern of brain activation during integration between non-sense words and shapes. Whereas it has been shown that semantic high-level crossmodal incongruency takes place mainly in frontal cortex, we hypothesize that the articulatory hypothesis would show activations in motor hand or mouth cortex and that direct linking between low-level features would show effects on early sensory areas. First, we decided to run an explicit choice experiment where subjects could freely associate shapes and pseudowords. This experiment allowed us to explore the mapping between pseudowords and shapes and to select stimuli that could be used in further experiments. Then, we tried to determine how those sound-shape correspondences could be best captured empirically, using a variety of explicit and implicit behavioral paradigms. Finally we moved to fMRI and tried to design experiments that could study audio-visual integration of our stimuli. II. Behavioral experiments
1. Material and methods
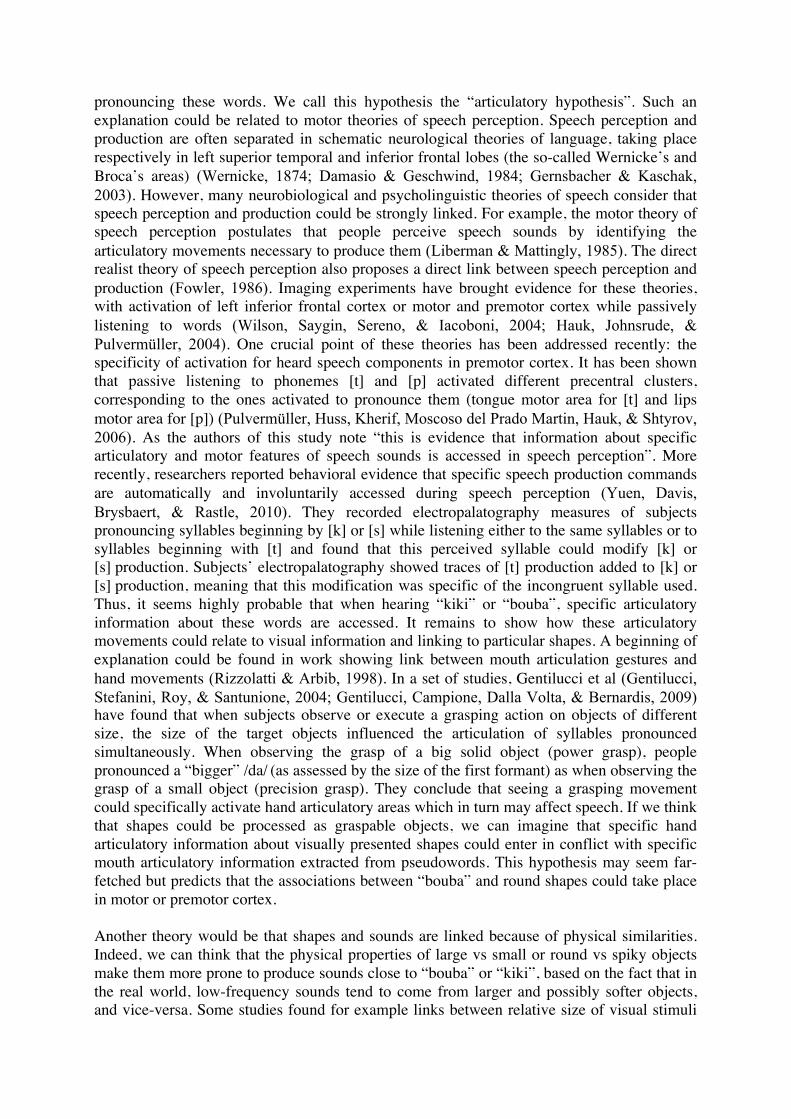
a. Shapes material We designed shapes using the curve and freeform tools in Microsoft PowerPoint. Two sets of shapes were created, one round, with curved boundaries, and one spiky, with sharp angles. For each shape we created a big and a small version. All the shapes were filled with the same light gray color on a black background. Within each group of size (big and small) we adjusted size with Matlab in order to have exactly the same luminance for each shape. Small shapes all fit in a rectangle of 80 x 60 pixels and big shapes in a rectangle of 250 x 190 pixels.
b. Pseudowords material Auditory stimuli were recorded in mono at 16-bits and 44.1 kHz sampling rate, using a Shure SM58 microphone and a Marantz PMD670 recorder, in a soundproof room. The auditory stimuli were composed of more than eighty pseudowords, all with a CVCV (consonant-vowel-consonant-vowel) phonological structure. These pseudowords can be divided in 6 groups depending on their type of vowels and consonants. Mean word duration differed depending on the component consonants and vowels. The choice of pseudowords used in each experiment will be described later.
c. Stimuli presentation Participants were seated in a room approximately 50 cm away from a screen displaying the centrally presented shape. Auditory stimuli were presented with a Sennheiser HD-448 headphone. Shapes were displayed in light gray on a black background on a flat screen at a resolution of 640 x 480; they occupied approximately 17.2 x 11.5 degrees of the visual field for big shapes and 10.3 x 6.9 degrees for small shapes. The experiments were designed using E-Prime 2.0 and the participants answered with an E-prime SRbox placed in front of the screen. The room remained silent during the experiment and the experimenter went out of the participants’ sight during the task.
d. Subjects Sixty-four right-handed native French speakers with normal hearing and normal or corrected-to-normal vision took part in the different experiments. Their handedness was assessed by Edinburgh Handedness Inventory (mean score: +69, standard deviation: 25). The mean age of the participants was 27 years (range 19 – 49 years); thirty-nine were women and twenty-five men. They all signed an informed consent form and received 10 Euros for their participation.
2. Explicit choice experiment
a. Aim The aim of this experiment was to confirm that some pseudowords were more likely to be linked to particular shapes and sizes. This has been shown in some studies (Sapir, 1929;
Fig II.1: Examples of spiky and round shapes with their two sizes.

Köhler, 1947), but often anecdotally. We also wanted to study the respective role of vowels and consonants in this preferential linkage, both probably playing an important role in phonetic symbolism (Klink, 2000). Moreover, we needed this experiment as a reference to select pseudowords for which we confirmed the association with spiky or round shapes or with big or small shapes. Indeed, we think that it is essential for our other experiments to choose pseudowords that we tested rather than relying on intuition, one of the flaws of previous studies.
b. Procedure In this experiment, subjects heard one pseudoword then saw two shapes, and had to choose which shape was the most adapted to the word they just heard. They had to push the right button to choose the right shape and the left to choose the left shape. They were explicitly told that there were no rules or “good answers” but that they had to answer intuitively. They had no time limit to answer.
Four groups of shapes could be presented: big round, small round, big spiky, small spiky and the subjects never had to choose between two shapes of the same group (e.g. two small spiky shapes). The pseudowords they heard could also be separated into four groups defined by their vowels and consonants. In order to maximize a potential effect, we chose vowels opposed in the front/back axis and in their roundedness, two dimensions that could play a role in shape and size choice. The front/back axis depends on the position of the tongue in the mouth, back vowels are pronounced with the tongue at the back of the mouth and front vowels with the tongue at the front. Vowels can be rounded or unrounded, meaning that the lips form a circle to pronounce it or not. We chose two of the most unrounded front vowels: [i] and [e] and two of the most rounded back vowels: [u] and [o]. Our hypothesis, based on the literature, was that pseudowords containing [u] and [o] vowels would be “bigger” (Sapir, 1929) and “rounder (Maurer, Pathman, & Mondloch, 2006; French, 1977) than pseudowords containing [i] and [e] vowels, which would be “smaller” and “more spiky”. To study the role of consonants, we chose to oppose voiced continuant consonants to voiceless stop consonants, thinking that these two groups were the most adequate to bias the choice of size and shape. The three unvoiced stop consonants were [p], [k] and [t], and the
Fig II.2.1: Procedure used in the explicit choice experiment. Subjects heard a pseudo-word and saw two shapes and had all their time to choose which shape they associated to this pseudo-word.

three voiced continuants were [l], [m] and [ʒ]. We hypothesized that [l], [m] and [ʒ] are “rounder” and “bigger” than [p], [k] and [t]. We chose two vowels and three consonants of each kind to minimize our chance of finding an idiosyncratic “single sound” effect, which could be due to multiple other factors than phonological properties of the sound such as letter form or semantic bias. Crossing these two factors, we had four types of pseudowords: voiced continuants with back rounded vowels (eg “loju”), voiced continuants with front unrounded vowels (eg “leji”), unvoiced stop consonants with back rounded vowels (eg “kopu”) and unvoiced stop consonants with front unrounded vowels (eg “kipe”). We hypothesized that the “loju” group would be associated to big and round shapes and the “kipe” group to small and spiky shapes but we did not know with what kind of shapes the two intermediate groups, “leji” and “kopu” groups, would be associated.
16 subjects participated in the experiment; two subjects were excluded because they did not perform the task correctly: one thought he had to choose rounded shapes for [o] and [u] sounds and one tried to choose according to intonation. To analyze the results, we entered mean percentage of round shape over spiky shape choice (and big size over small size choice) for each class of pseudowords in two way ANOVAs with two intra-subjects factors (vowel type and consonant type) and one random factor (subjects). The vowel factor had two levels: front and back, and the consonant factor: stop and continuant. In shape choice analysis we only took into account trials where the size of the two items were the same. In size choice analysis we only took into account trials where the shapes of the two items were the same,
c. Results
Fig II.2.2: Vowels used in the experiment. Two classes of vowels are separated: unrounded front vowels, [i] and [e], and rounded back vowels, [u] and [o].
Shape choice
0 %
25 %
50 %
75 %
100
%
"Keti"
"Toku"
"Lije"
"Lujo"Front vowels and unvoiced consonantsBack vowels and unvoiced consonantsFront vowels and voiced consonantsBack vowels and voiced consonants
Cho
ice
of ro
und
shap
e ov
er s
piky
sha
pe (%
)
0 %
25 %
50 %
75 %
100
%
Keti KipiKipe
KetePeke
Peki
TokuPokuToko
KotuPoko
Koto Lele MejeMeji
LeliLije Liji
Loju
JomoMujuJomu
Lojo MujoFront vowels and unvoiced consonantsBack vowels and unvoiced consonantsFront vowels and voiced consonantsBack vowels and voiced consonants
Cho
ice
of ro
und
shap
e ov
er s
piky
sha
pe (%
)
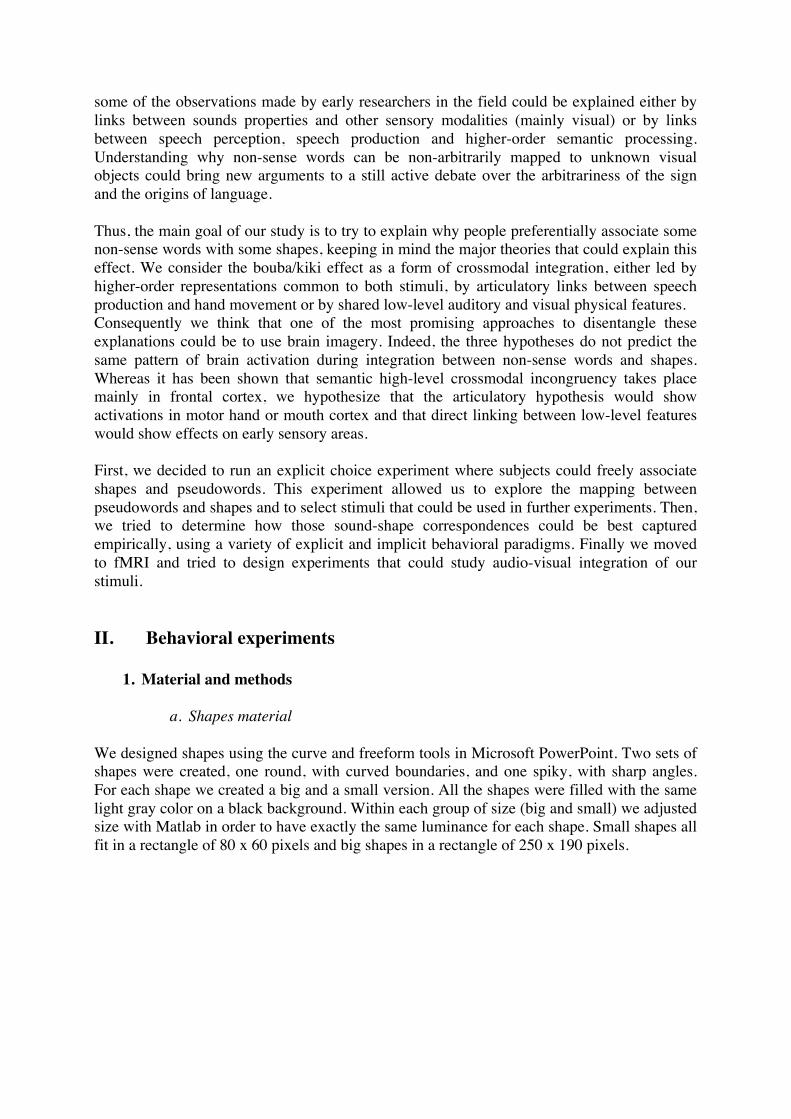
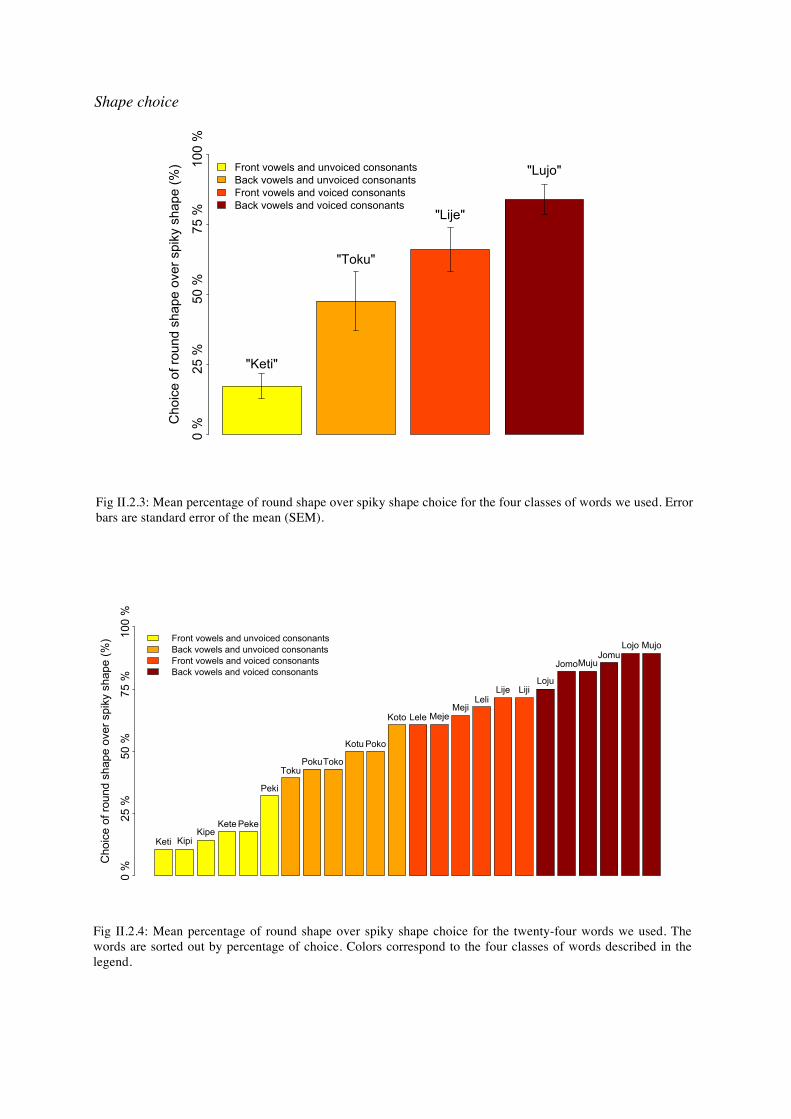
Fig II.2.3: Mean percentage of round shape over spiky shape choice for the four classes of words we used. Error bars are standard error of the mean (SEM).
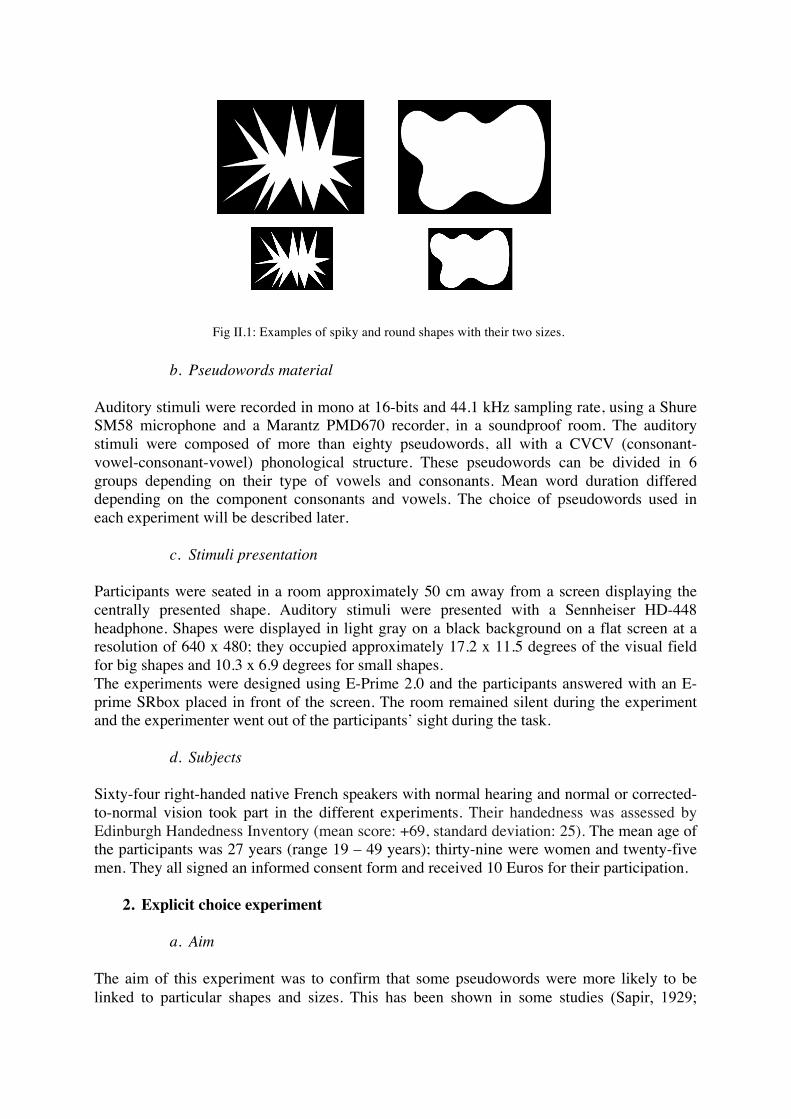
Fig II.2.4: Mean percentage of round shape over spiky shape choice for the twenty-four words we used. The words are sorted out by percentage of choice. Colors correspond to the four classes of words described in the legend.

We observed a main effect of vowels (F(1.13)=15.07, p<0.002) with back rounded vowels being associated to round shapes and front unrounded vowels to spiky shapes. We also observed a main effect of consonants (F(1.13)=15.77, p<0.002), voiced continuants being associated to round shapes and unvoiced stop consonants to spiky shapes. We did not find a significant interaction between vowels and consonants. These results confirmed our hypothesis, front unrounded vowels and stop consonants being linked to spiky shapes and back rounded vowels and continuant consonants to round shapes. Crossing these two factors showed us that pseudowords composed of continuant consonants and open unrounded vowels were considered rounder than pseudowords composed of stop consonants and back rounded vowels. Thus, in this experiment, the effect of consonant type was larger than the effect of vowel type on the choice of a round vs a spiky shape. In figure II.2.4 we plotted the percentage of round shapes over spiky shapes for every pseudoword we used. Pseudowords ranked perfectly according to their class, showing the robustness of this effect across items. Size choice
Fig II.2.5 : Mean percentage of big shape over small shape choice for the four classes of words used in the first version of the experiment. Error bars are SEM. We observed a main effect of vowels (F(1.13)=10.35, p<0.01) with back rounded vowels being associated to big shapes and front unrounded vowels to small shapes.
0 %
25 %
50 %
75 %
100
%
"Keti""Lije"
"Toku"
"Lujo"
Front vowels and unvoiced consonantsBack vowels and unvoiced consonantsFront vowels and voiced consonantsBack vowels and voiced consonants
Cho
ice
of b
ig s
hape
ove
r sm
all s
hape
(%)
We did not find an effect of consonants for size choice (F(1.13)=0.30, p=0.6) We did not find any interaction between vowels and consonants.
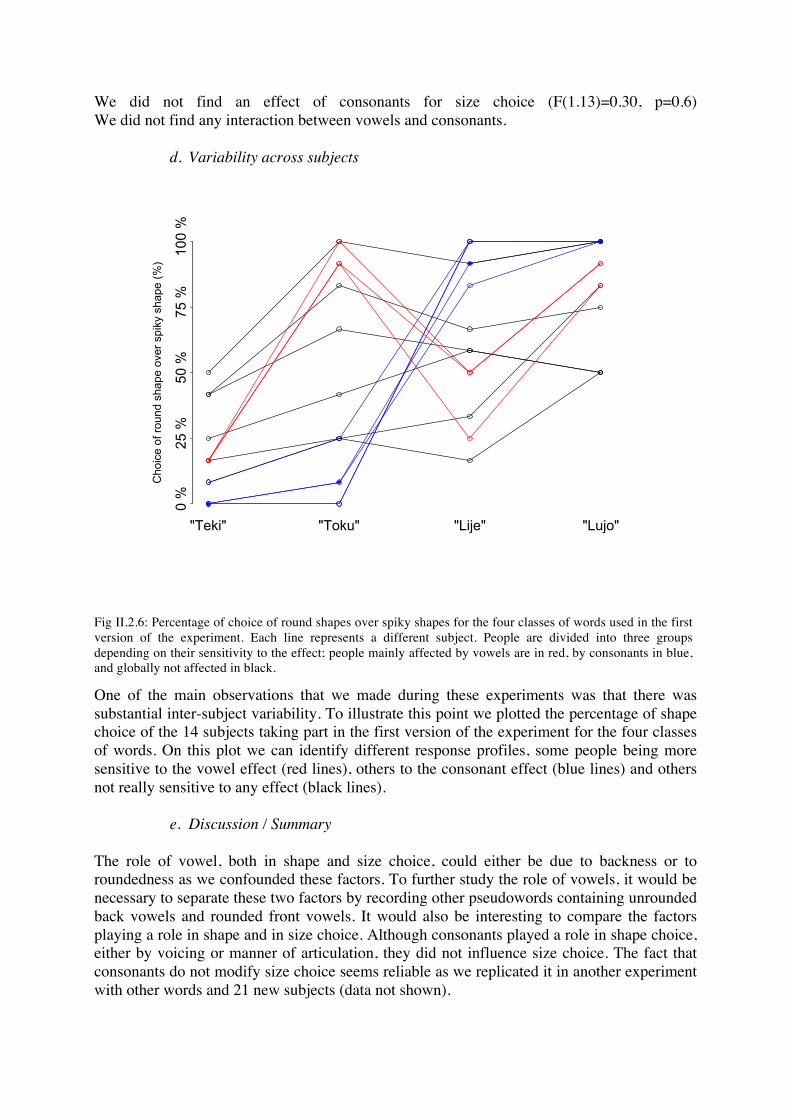
d. Variability across subjects
One of the main observations that we made during these experiments was that there was substantial inter-subject variability. To illustrate this point we plotted the percentage of shape choice of the 14 subjects taking part in the first version of the experiment for the four classes of words. On this plot we can identify different response profiles, some people being more sensitive to the vowel effect (red lines), others to the consonant effect (blue lines) and others not really sensitive to any effect (black lines).
e. Discussion / Summary The role of vowel, both in shape and size choice, could either be due to backness or to roundedness as we confounded these factors. To further study the role of vowels, it would be necessary to separate these two factors by recording other pseudowords containing unrounded back vowels and rounded front vowels. It would also be interesting to compare the factors playing a role in shape and in size choice. Although consonants played a role in shape choice, either by voicing or manner of articulation, they did not influence size choice. The fact that consonants do not modify size choice seems reliable as we replicated it in another experiment with other words and 21 new subjects (data not shown).
Cho
ice
of ro
und
shap
e ov
er s
piky
sha
pe (%
)
0 %
25 %
50 %
75 %
100
%
"Teki" "Toku" "Lije" "Lujo"
Fig II.2.6: Percentage of choice of round shapes over spiky shapes for the four classes of words used in the first version of the experiment. Each line represents a different subject. People are divided into three groups depending on their sensitivity to the effect; people mainly affected by vowels are in red, by consonants in blue, and globally not affected in black.

These results could be explained in the framework of the “articulatory” hypothesis, in which words are associated to shapes and sizes depending on the articulatory movement or the shape the mouth takes to pronounce them. Indeed, the vowels [u] and [o] are pronounced with our mouth forming a circle, thus opening the mouth more, whereas to make the sound [i] we have taut lips and the mouth almost closed. These two factors, the form of the mouth and its openness could respectively influence shape and size choice. For consonants the airflow and articulatory movement are totally different between stops and continuants. While continuant movement is rather soft and continuous evoking the soft contour of round shapes, stop consonants are produced by stopping the airflow and then releasing a burst of air evoking the sharp angles of spiky shapes. On the other hand, both continuant and stop consonants can be pronounced without modifying mouth openness, maybe explaining the lack of effect on size choice. Our results confirmed the work done on associations between pseudowords and size or shape and extended it. To our knowledge, this is the first study separating the role of vowels and consonants in the bouba/kiki effect. Last but not least, this experiment allowed us to select pseudowords that we could use in other paradigms knowing their degree of association with round or spiky shapes.
3. Implicit Association Test
a. Description We switched to another kind of experiment to look for a bouba/kiki effect without requiring subjects to make any explicit decision relative to sound-shape associations. We used the implicit association test (IAT) (Greenwald, McGhee, & Schwartz, 1998), a method which is widely used in social psychology to observe effects that are not found by explicit questioning, for example to assess racial prejudices which subjects would not overtly confess (Phelps, et al., 2000). The Implicit Association Test (IAT) provides a measure of the associations between two pairs of contrasted concepts (e.g. flower vs insect names and pleasant vs unpleasant words). Subjects have to categorize each stimulus into one of the four categories defined by the two pairs of concepts. In our experiment the two pairs of concepts were round shape-spiky shape and “o” pseudoword-“i” pseudoword. Subjects had to categorize words or shapes according to these categories. The critical trick of the IAT is that responses will be faster and more accurate when concepts that are strongly associated share the same behavioral response, e.g. if responses to insects and to unpleasant words should be produced using the same hand. Thus, this experiment allowed us to test, without requiring any explicit choice, the association between sounds and shapes. We chose to focus on shape dimension because it is the one showing the most powerful effect in the explicit choice task.
b. Procedure We followed the methodological advice of Greenwald and chose few items per category, picking those most representative of the concept (Nosek, Greenwald, & Banaji, 2003). We used 4 pseudowords from two classes we used previously: voiced continuants with two [o] vowels (e.g. “Lojo”) and unvoiced stops with two [i] vowels (e.g. “Kipi”). “Lojo”-like pseudowords were strongly associated to round shapes in the previous explicit choice experiment, whereas “Kipi”-like pseudowords were associated to spiky shapes. Eight big round and eight big spiky shapes were also chosen from the previous experiment.

Subjects used their right or left hand to categorize the stimuli and had all their time to answer. Following the “standard” IAT methodology (Nosek, Greenwald, & Banaji, 2003), the test was divided in 5 blocks: -Block 1: Shape classification: subjects had to classify shapes as round or spiky (25 trials), - Block 2: Word classification: subjects had to classify pseudowords as belonging to the “o” or to the “i” category (25 trials) - Block 3: Mixed classification: subjects either saw a shape or heard a pseudoword, and had to classify them following the same instructions as in Blocks 1 and 2 (65 trials). Such mixed blocks could be either “congruent” or “incongruent”, depending on whether associated sounds and shapes were to be answered with the same hand. In congruent blocks, one hand was used for round shapes and “o” words and the other hand for spiky shapes and “i” words. In incongruent blocks, one hand was used for round shapes and “i” words and the other for spiky shapes and “o” words. - Block 4: Inverted shape classification: subjects had again to classify only shapes, but with inverted instructions relative to Blocks 1 and 3, e.g. if round shapes were previously associated to a left hand response, they were now associated to the right hand. (45 trials) - Block 5: Mixed classification 2: same as Block 3, except that subjects had to classify shapes using the new instructions for which they were trained in Block 4 (65 trials) This procedure allowed us to collect data from every subject in both congruent and incongruent conditions. To avoid, even within subject, confounding the congruent/incongruent distinction with serial order, the 5 blocks were run twice in each subject. If in the first run of 5 blocks Block 3 was congruent and Block 5 incongruent, then in the second run Block 3 was incongruent and Block 5 congruent, and conversely. Half of the subjects received the CIIC sequence and the other half the ICCI sequence. Hands of response were also counterbalanced across subjects. Instructions appeared at the top of the screen before the beginning of each block and remained visible during the first 5 trials. Shape instructions appeared as two small shapes, one in each top corner; pseudoword instructions appeared as an “I” and an “O” one in each top corner. When the subjects made an error, they saw the word “error” and the instructions were again displayed for 1 second. 24 subjects participated in this experiment. Following the usual IAT procedure, we only analyzed “mixed classification” blocks, the other blocks being used only to familiarize subjects with the instructions. We entered median reaction times for correct responses in a two way ANOVA with two intra-subjects factors (congruency and modality (shapes or pseudowords)) and one random factor (subjects).

c. Results
Fig II.3.1: A. Median reactions times of correct trials to shapes and pseudowords trials in mixed classification congruent and incongruent blocks. Error bars are SEM. B. Same figure with mean error rates. We found a main effect of congruency, both on reaction times (F(1.23)=12.02, p=0.002) and error rates (F(1.23=10.782, p=0.003). We also found a main effect of modality on reaction times (F(1.23)=278.2, p<10-13) . Subjects were quicker to categorize shapes than pseudowords. The main effect of congruency shows that it is harder to categorize shapes and pseudowords when hands are associated to sounds and pseudowords which are not matching according to phonetic symbolism.
0200
400
600
800
1000
Congruent
Incongruent
Med
ian
reac
tion
time
(ms)
Shapes Pseudowords
01
23
45
6
Congruent
Incongruent
Mea
n er
ror r
ates
(%)
Shapes Pseudowords
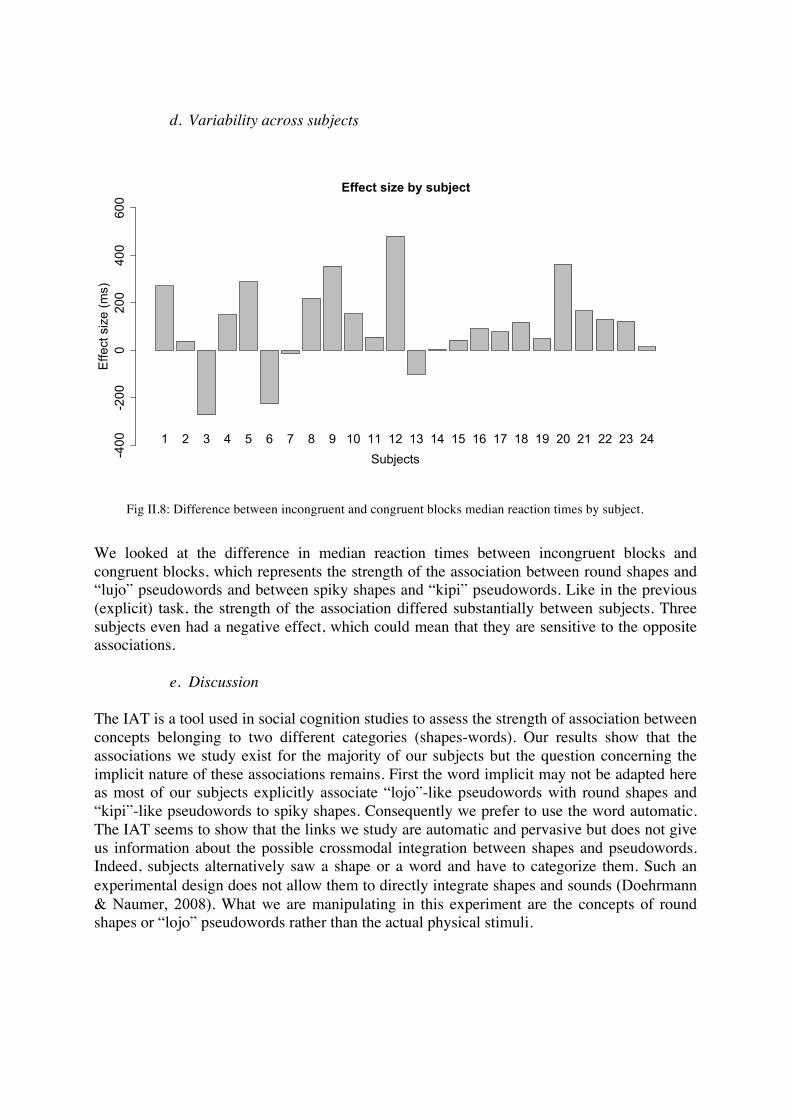
d. Variability across subjects
We looked at the difference in median reaction times between incongruent blocks and congruent blocks, which represents the strength of the association between round shapes and “lujo” pseudowords and between spiky shapes and “kipi” pseudowords. Like in the previous (explicit) task, the strength of the association differed substantially between subjects. Three subjects even had a negative effect, which could mean that they are sensitive to the opposite associations.
e. Discussion The IAT is a tool used in social cognition studies to assess the strength of association between concepts belonging to two different categories (shapes-words). Our results show that the associations we study exist for the majority of our subjects but the question concerning the implicit nature of these associations remains. First the word implicit may not be adapted here as most of our subjects explicitly associate “lojo”-like pseudowords with round shapes and “kipi”-like pseudowords to spiky shapes. Consequently we prefer to use the word automatic. The IAT seems to show that the links we study are automatic and pervasive but does not give us information about the possible crossmodal integration between shapes and pseudowords. Indeed, subjects alternatively saw a shape or a word and have to categorize them. Such an experimental design does not allow them to directly integrate shapes and sounds (Doehrmann & Naumer, 2008). What we are manipulating in this experiment are the concepts of round shapes or “lojo” pseudowords rather than the actual physical stimuli.
Effect size by subject
-400
-200
0200
400
600
Effe
ct s
ize
(ms)
1 2 3 4 5 6 7 8 9 10 11 12 13 14 15 16 17 18 19 20 21 22 23 24Subjects
Fig II.8: Difference between incongruent and congruent blocks median reaction times by subject.
4. Speeded classification experiment
a. Procedure In the first experiment, we observed a sound-shape matching effect, in a task explicitly involving both visual and auditory stimuli, and moreover requiring an explicit crossmodal matching decision. In the second experiment, the same effect prevailed, in a task also involving both visual and auditory stimuli, but with no explicit crossmodal matching decision required. Going one step further, we wondered whether the matching effect would still be present in a more automatic setting. Would the effect survive even when one modality is entirely irrelevant to the experimental task? We used a speeded categorization paradigm, in which participants had to classify pseudowords, while task-irrelevant shapes, round or spiky, were presented simultaneously. Subjects listened to C-V-C-V pseudowords and had to choose if they contained the vowel [i] or [o]. They had 2000 ms to respond by pushing the right or the left buttons. Pseudowords belonged to 4 different groups, composed of [i], [e], [o], [u] vowels and [p], [k], [t], [l], [m], [ʒ] consonants. The discriminating vowel, [i] or [o] was always placed at the second vowel position in our pseudowords and the shape appeared at the end of the first syllable. The first vowel was either [u] or [e] and the three first letters of the word did not allow subjects to predict the end, for example, “Ket” could be followed by either [o] or [i]. Consequently we had 4 classes of words: “Keti”-like pseudo words, “Muji”-like pseudo words, “Keto”-like pseudo words, “Lujo”-like pseudo words. Thus, subjects could not choose before hearing the whole word and seeing the shape. The association between sounds and buttons was counterbalanced across subjects. Sixteen subjects participated in the experiment. We chose these pseudowords because “Lujo”-like pseudo words and “Keti”-like pseudowords are the two most efficient classes to elicit a sound-symbolic effect in explicit tasks. The two other classes of pseudowords are only used to ensure that subjects could not respond as soon as they heard the first part of the word. Thus, we decided not to analyze these two classes of pseudowords, in which vowel effect and consonant effect act in opposite directions. However, as the task consisted in deciding whether the word contained “o” or “i”, it put an emphasis on these vowel and it is highly plausible that the association is made between the shape and these vowel. We chose to manipulate shape and not size because shape yielded the clearest effect in explicit tasks. Our hypothesis was that a matching shape, that is to say a shape linked to the pseudoword in the sense of the effect observed in explicit tasks, would decrease the reaction time and the error rate for the word and a mismatching shape would increase them (Noppeney, Josephs, Hocking, Price, & Friston, 2008; Doehrmann & Naumer, 2008). For example, according to our hypothesis, answering [o] to trials where subjects hear “lojo” and see a spiky shape would be longer and more difficult than the same trials with a round shape. To analyze our data, we entered mean reaction times to our two word groups of interest (“Lujo” and “Keti”) with each type of shape in a two way ANOVA with two intra-subjects factors: shape type and word type, and one random factor (subjects). We used mean and not median, as each answer was limited to only 2000 ms, preventing outliers effect.
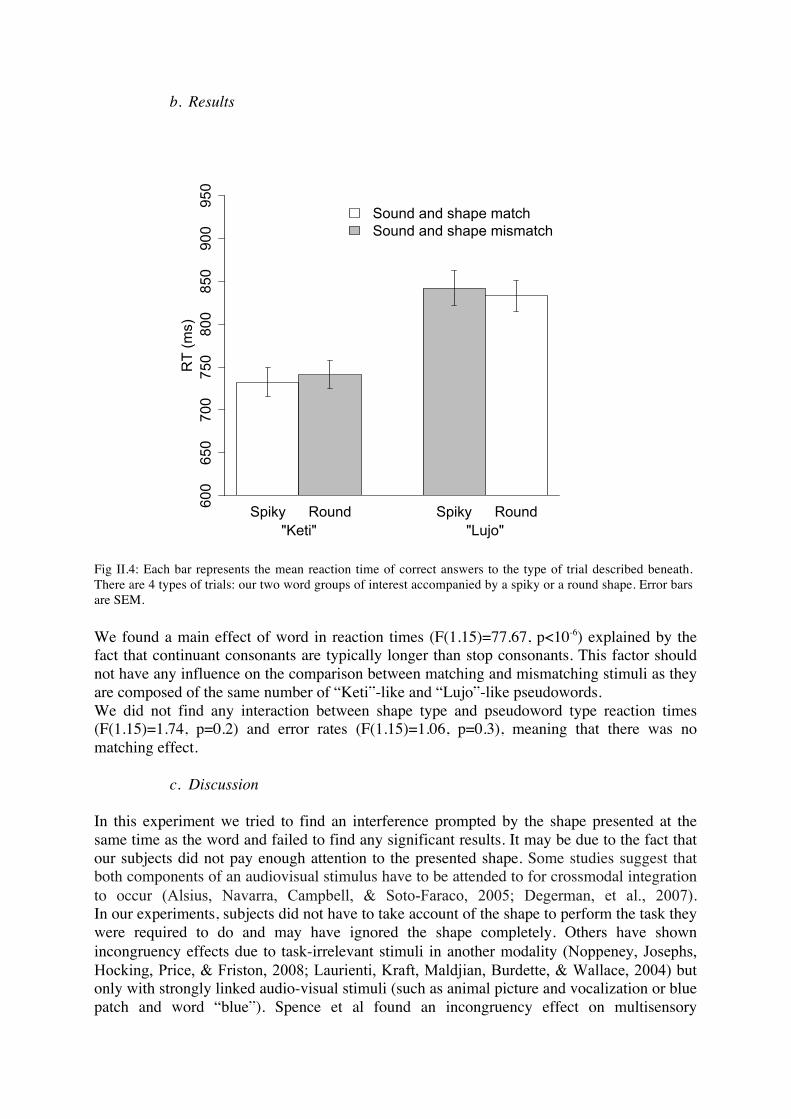
b. Results
We found a main effect of word in reaction times (F(1.15)=77.67, p<10-6) explained by the fact that continuant consonants are typically longer than stop consonants. This factor should not have any influence on the comparison between matching and mismatching stimuli as they are composed of the same number of “Keti”-like and “Lujo”-like pseudowords. We did not find any interaction between shape type and pseudoword type reaction times (F(1.15)=1.74, p=0.2) and error rates (F(1.15)=1.06, p=0.3), meaning that there was no matching effect.
c. Discussion In this experiment we tried to find an interference prompted by the shape presented at the same time as the word and failed to find any significant results. It may be due to the fact that our subjects did not pay enough attention to the presented shape. Some studies suggest that both components of an audiovisual stimulus have to be attended to for crossmodal integration to occur (Alsius, Navarra, Campbell, & Soto-Faraco, 2005; Degerman, et al., 2007). In our experiments, subjects did not have to take account of the shape to perform the task they were required to do and may have ignored the shape completely. Others have shown incongruency effects due to task-irrelevant stimuli in another modality (Noppeney, Josephs, Hocking, Price, & Friston, 2008; Laurienti, Kraft, Maldjian, Burdette, & Wallace, 2004) but only with strongly linked audio-visual stimuli (such as animal picture and vocalization or blue patch and word “blue”). Spence et al found an incongruency effect on multisensory
600
650
700
750
800
850
900
950
"Keti" "Lujo"Spiky Round Spiky Round
RT
(ms)
Sound and shape matchSound and shape mismatch
Fig II.4: Each bar represents the mean reaction time of correct answers to the type of trial described beneath. There are 4 types of trials: our two word groups of interest accompanied by a spiky or a round shape. Error bars are SEM.
integration with stimuli that only shared a “physical” link (auditory pitch and visual size) but they used a relative temporal order task, asking subjects which of the two stimuli appeared first. This design allowed them to make sure that subjects attended both visual and auditory stimulus. Thus, working with stimuli that share a rather subtle link, we thought that we had to find ways to force subjects to attend to the presented shape in order to find possible inconsistency effects.
5. Speeded double classification experiment
a. Procedure In this experiment, a word and a shape were presented simultaneously for 600 ms and subjects had to perform a task both on the word and on the shape. First, they had to classify the word based on the vowel it contained (“i” or “o”), and then they had to classify the shape (round or spiky). They used their left or right hand to classify the stimuli, thus, as in the IAT, one hand was associated to two responses, one for the shape and one for the word. Subjects had 2000 ms to classify the word and 2000 ms to classify the shape. There were two types of blocks: congruent, where one hand is associated to “o” and round shape and the other to “i” and spiky, and incongruent, where one hand is associated to “o” and spiky shape and the other to “i” and round. This design is almost similar to the IAT, except that you have the two types of stimuli and the two types of response at each trial (in the IAT, subjects saw either a shape or a word). The fact that the shape and the pseudoword are presented simultaneously permits us to study the integration between the two more closely. Indeed, it allows us to separate two effects: an effect due to the association between type of hand response and pair of stimuli that we call congruency effect and an effect simply due to the association between stimuli, that we call matching effect. As a result we could compare congruent versus incongruent blocks or matching versus mismatching stimuli. Note that we can find both matching and mismatching pairs of stimuli in each kind of block. 18 subjects participated to this experiment. Half of the subjects had a congruent block of 96 trials, then an incongruent of the same number of trials and the other half began by the incongruent block. Hands of response were randomized across subjects. We used unvoiced stops, voiced continuants, [o], [u], [i] and [e] vowels. As was the case in the second experiment, we did not want subjects to be able to determine if the word contained “o” or “i” as soon as the word began, so we only placed “o” and “i” vowels at the end of the words. The first vowel was either [u] or [e] and the three first letters of the word could not enable the subjects to predict the end, for example, “ket” could be followed by either [o] or [i]. Consequently we had 4 classes of words: “Keto”, “Luji”, “Keti”, “Lujo”. As we noted earlier, the last two classes are the easier to interpret, given that their two vowels and consonants are associated to the same kind of shape and so we focused on these. First, we hypothesized that subjects would be quicker and more accurate in congruent blocks, following the IAT congruency effect. We also hypothesized that they would be quicker to respond to matching pairs than to mismatching pairs, an effect we could not identify in standard IAT.

We wanted to analyze reaction times and error rates separately for word and shape responses. We used a two-way ANOVA with two intra-subjects factors (matching and congruency) and one random factor (subjects). This ANOVA was conducted for word and shape mean reaction times and for word and shape mean error rates. We used mean and not median, as each answer was limited to only 2000 ms, preventing outliers effect.
b. Results
Fig II.5: A. Mean reaction times to pseudowords. B. Mean reaction times to shapes. C. Mean error rates of pseudoword responses. D. Mean error rates of shape responses. We separated matching (Spiky+”Keti” or Round+”Lujo” and mismatching (Spiky+”Lujo” or Round+”Keti”) trials and the congruent (in white) and incongruent blocks (in grey). We also indicated the pair of responses associated to the type of trials, same hand meaning that subjects had to answer two times with the same hand and different hand that they had to alternate hands to answer correctly. Error bars are SEM. We found a significant effect of congruency for reaction times to pseudowords (F(1.17)=12.72, p=0.002) and for error rates to pseudowords(F(1.17)=4.69, p<0.05) and shapes (F(1.17)=12.34, p=0.003). It shows that subjects are quicker and more accurate in blocks where round shapes and “lujo”-like pseudowords and spiky shapes and “keti”-like pseudowords are associated to the same
Word Reaction Time
0200
400
600
800
1000
1200
1400
Rea
ctio
n tim
e (m
s)
CongruentIncongruent
Match Mismatch Match MismatchSame Hand Different Hand Different Hand Same Hand
Shape Reaction Time
0100
200
300
400
500
600
Rea
ctio
n tim
e (m
s)
CongruentIncongruent
Match Mismatch Match MismatchSame Hand Different Hand Different Hand Same Hand
Word Error Rates
05
1015
20E
rror
rate
s (%
)
CongruentIncongruent
Match Mismatch Match MismatchSame Hand Different Hand Different Hand Same Hand
Shape Error Rates
05
1015
20E
rror
rate
s (%
)
CongruentIncongruent
Match Mismatch Match MismatchSame Hand Different Hand Different Hand Same Hand
A B
C D
hand. This observation is valid for word and shape responses, and is reflected on reaction times and error rates. We observed a significant main effect for matching in pseudowords reaction times (F(1.17)=8.07, p=0.01) and error rates (F(1.17)=5.24, p=0.03). This shows that subjects are globally, that is to say considering the two types of blocks, quicker and more accurate to answer to matching stimuli than to mismatching stimuli. The interaction between matching and congruency for pseudowords reaction times (F(1.17)=6.75, p=0.02) was significant. This interaction reflects the fact that subjects are quicker to classify words accompanied by a matching shape in congruent blocks and pseudowords accompanied by a mismatching shape in incongruent blocks.
c. Discussion The congruency effect we found reminded us of the one found in the IAT. Subjects associate more easily to the same hand round shapes and “Lujo” pseudowords, but it does not mean that the two are perceptually linked. The matching effect that we observe is maybe more interesting. The fact that it is only present for word answer is not totally unexpected, as this is a more subtle effect than congruency and shape response is shorter and more homogenous across types of trials than word response. In fact, given the design of our experiment, it is likely that subjects directly decide for a pair of responses rather than answering to word and then recalling the shape. The fact that the mental effort takes place before giving the first answer could explain why shape reaction times are almost 4 times shorter than pseudowords reaction times. Before trying to explain this effect, we also have to take into account the interaction we found for word reaction times, which shows that people are better for matching stimuli in congruent blocks and mismatching stimuli in incongruent blocks. In fact, this interaction is confounded with hand effect: in congruent sessions matching stimuli entail two responses with the same hand, as mismatching stimuli do in incongruent sessions. Inversely, matching stimuli in incongruent sessions and mismatching stimuli in congruent sessions entail responses with different hands. The way we understand that is the following: globally, subjects are more quick and accurate for word response to matching stimuli, they are also quicker answering with the same hand than with different hands. In congruent blocks these two effects go in the same direction whereas in incongruent block they go against each other. Thus, graphically, the main effect of matching on word reaction time can be apprehended as mean RT(congruent mismatch - congruent match) - mean RT(incongruent match - incongruent mismatch) (± SEM) = 81.9 ms (±28.8). This measure is fully counterbalanced in term of shapes and pseudowords used, and shows that matching stimuli directly facilitated behavioral response. We think that this matching effect reflects a crossmodal integration of matching shapes and pseudowords. Indeed, interference effects shown by increased reaction times or error rates during audio-visual stimuli processing are often interpreted as a marker of multi-sensory integration (Doehrmann & Naumer, 2008). Such effects have been found with semantically linked audio-visual stimuli (Laurienti, Kraft, Maldjian, Burdette, & Wallace, 2004) or with physically linked audio-visual stimuli (Spence, 2007) but it is the first time that
they are observed with abstract sound symbolic links like the one associating round shapes to “lujo”-like pseudowords and spiky shapes to “kipi”-like pseudowords. This confirms that the combined presentation of audio-visual stimuli which are congruent even on a subtle level can significantly modulate perceptual decision processes and thereby behavioral performance, a conclusion already advanced by Doehrmann. III. fMRI experiment
1. Objectives and hypotheses Our behavioral studies allowed us to conclude that people explicitly and automatically associated round shapes to some pseudo words and spiky shapes to others. The factors we identified as important for this choice were vowel backness and roundedness and consonants’ manner of articulation and voicing. We showed that this association might take place at different levels, from the perceptual level for the matching effect to the conceptual level for the congruency effect. These results only gave us hypotheses to explain this sound symbolic phenomenon, and as we wanted to dissociate furthermore these explanations we conducted this fMRI study. Indeed, the areas in the brain where integration between shapes and pseudowords takes place could give us important insight into the kind of link implicated (Beauchamp, 2005). In the first experiment, subjects passively attended to unimodal stimuli (shapes or pseudo words), or to bimodal stimuli associating a shape and a pseudoword. Bimodal stimuli were either matching or mismatching, based on our previous experiments. This design allowed us to study automatic associations, as subjects were totally naïve concerning our goals and were performing a task independent from the actual stimuli, which we presented as the main objective of the study. As the behavioral experiments essentially showed no crossmodal matching effects when subjects did not actively attend to both stimuli, we also conducted a second experiment very close to the single trial IAT. The behavioral results of this experiment are presented but we do not show here the imaging results as we lacked time to analyze them.
2. Material and methods
a. Subjects
Eighteen native right-handed French speakers, 19 to 35 years old (9 men, mean age: 23 years) participated in the present fMRI study. None of the subjects had participated in the behavioral experiments and they had no history of neurological or psychiatric disease. Their vision was normal or corrected to normal. Their handedness was assessed by Edinburgh Handedness Inventory (mean score: +73, standard deviation: 19). The project was approved by the regional ethical committee and the subjects gave their written informed consent before the experiment. Each subject participated in two different experiments in the MRI for a total scanning duration of about 1 hour.

b. fMRI Acquisition parameters
We used a 3-Tesla MRI (Siemens Trio TIM) with a 12-channel head coil, and a gradient-echo planar imaging sequence sensitive to brain oxygen-level dependant (BOLD) contrast (40 contiguous axial slices, acquired using ascending interleaved sequence, 3 mm thickness; TR = 2400 ms; Flip angle = 90°, TE = 30 ms, in-plane resolution = 3 × 3 mm, matrix = 64 × 64). For each acquisition, the first 4 volumes were discarded to reach equilibrium. T1-weighted images were also acquired for anatomical localization. 301 functional volumes were acquired for the first experiment and 4 sessions of 141 functional volumes for the second experiment.
c. Experimental setup Auditory and visual stimuli were presented using E-Prime 2.0 (Psychology Software Tools) running on a Windows PC. Auditory stimuli were presented via high-fidelity stereo headphones (MR Confon) at approximately 80dB and visual stimuli were projected onto a translucid screen, 640 pixels wide (VGA mode), subtending 42.5 cm width and viewed through a mirror from a distance of 125 cm, for an overall angular size of 19.3 degrees. The subjects performed the behavioral task using a MR-compatible button device connected to the stimulation computer.
d. Passive experiment Material In this experiment, we used two classes of pseudowords picked from behavioral experiments: words with voiced continuant consonants [l], [m], [ʒ] and back vowels [u], [o] (e.g. “loju”) that are associated to round shapes in our behavioral experiments and words with unvoiced stop consonants [p], [k], [t] and front vowels [i], [e] (e.g. “kipe”) that are associated to spiky shapes. We chose these words because they were the ones showing the biggest effects in our behavioral experiments. We also picked 18 big spiky shapes and 18 big round shapes; the shapes were presented in light gray on black background. Procedure Subjects had to fixate the screen while 8 different types of blocks randomly followed one another: “lujo”-like pseudo words, “kipi”-like pseudo words, round shapes, spiky shapes, matching pairs of round shapes and “lujo”-like pseudo words, matching pairs of spiky shapes and “kipi”-like pseudo words, mismatching pairs of round shapes and “kipi”-like pseudo words, mismatching pairs of spiky shapes and “lujo”-like pseudo words. Each type of block included 10 trials, and was repeated 10 times with random stimuli during the whole experiment. One trial was composed of a central point for 100 ms and the stimuli for 600 ms. 20 resting blocks of the same duration as activation blocks were randomly interspersed in the experiment. Two types of distractors, a cross or a “bip” appeared randomly at a frequency of 1/20, replacing a stimulus. The subjects had to push a button with their right hand when they saw a cross or heard a “bip”. In the visual blocks, the distractor was always a cross, in the auditory blocks always a “bip”, and in mixed blocks either a cross or a “bip”. This allowed us to control subject’s concentration and attention. We did not tell subjects that we worked on sound-shape association and told them that they had to detect crosses and “bips” as quickly and accurately as possible.

e. Active experiment
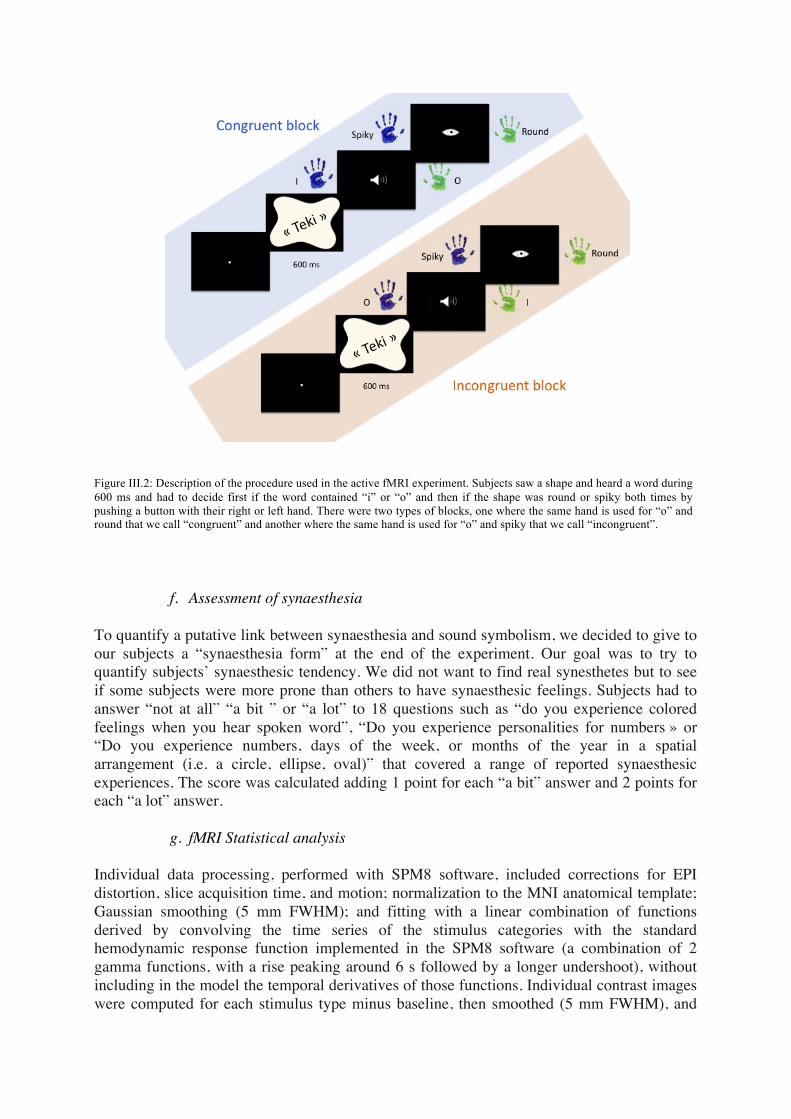
Material We used the same classes of words as in the passive experiment but only chose words containing at least one “o” or one “i”. The shapes were the same as in the passive experiment. Procedure This experiment was separated in 4 sessions, each session beginning by a short training. The training was composed of 10 trials and a session of 80 trials. Then the total number of trials, training excluded, was 320. At each trial subjects heard a pseudo word and saw a shape at the same time and had to classify the word and the shape. First, they had to decide if the word contained the sound “o” or “i” (hard or soft pseudo words), then they had to decide if the shape accompanying the word was round or spiky. To classify these two stimuli they had to use their right or left hand. The word response was prompted by a white loudspeaker on black background and the shape response by a white eye. The stimuli appeared for 600 ms and subjects had 1500 ms to give the word answer and then 1500 ms to give the shape answer. During training, subjects had all their time to answer. As soon as the stimuli disappeared the loudspeaker appeared and as soon as the first answer was given the eye prompting the shape response appeared. Between trials, subjects saw a central cross for a variable amount of time, depending on the time they took to answer (3 seconds - time to answer to word and shape). As such, trials all lasted the same time, whatever the rapidity of the subject, preventing them to answer too quickly to finish the test earlier. Resting trials where subjects only saw the white cross were disseminated in the blocks at a frequency of 1/5, their duration was the same as stimuli trials. The instructions changed across the sessions and we could separate congruent sessions, where subjects had to answer for round shape and soft pseudo words with the same hand, and incongruent sessions, where subjects had to answer for spiky shapes and soft pseudo words with the same hand. In each type of session, matching and mismatching pairs were presented. For example, if a subject saw a spiky shape and heard at the same time “lujo” he had to answer with different hands in a congruent session and with the same hand in an incongruent session. For half the subjects the order of the sessions was congruent-incongruent-incongruent-congruent (CIIC) and for the other half incongruent-congruent-congruent-incongruent (ICCI). The hands used for the sounds (e.g left: o, right: i) stayed the same during the whole experiment and the hands to answer for shapes were inversed between congruent and incongruent sessions. The hands used for “o” and “i” were randomized across subjects. We had consequently 4 groups of subjects: left hand for “o” and CIIC order of sessions, left hand for “o” and ICCI order of sessions, right hand for “o” and CIIC order for sessions, right hand for “o” and ICCI order for sessions.
f. Assessment of synaesthesia To quantify a putative link between synaesthesia and sound symbolism, we decided to give to our subjects a “synaesthesia form” at the end of the experiment. Our goal was to try to quantify subjects’ synaesthesic tendency. We did not want to find real synesthetes but to see if some subjects were more prone than others to have synaesthesic feelings. Subjects had to answer “not at all” “a bit ” or “a lot” to 18 questions such as “do you experience colored feelings when you hear spoken word”, “Do you experience personalities for numbers » or “Do you experience numbers, days of the week, or months of the year in a spatial arrangement (i.e. a circle, ellipse, oval)” that covered a range of reported synaesthesic experiences. The score was calculated adding 1 point for each “a bit” answer and 2 points for each “a lot” answer.
g. fMRI Statistical analysis Individual data processing, performed with SPM8 software, included corrections for EPI distortion, slice acquisition time, and motion; normalization to the MNI anatomical template; Gaussian smoothing (5 mm FWHM); and fitting with a linear combination of functions derived by convolving the time series of the stimulus categories with the standard hemodynamic response function implemented in the SPM8 software (a combination of 2 gamma functions, with a rise peaking around 6 s followed by a longer undershoot), without including in the model the temporal derivatives of those functions. Individual contrast images were computed for each stimulus type minus baseline, then smoothed (5 mm FWHM), and
Figure III.2: Description of the procedure used in the active fMRI experiment. Subjects saw a shape and heard a word during 600 ms and had to decide first if the word contained “i” or “o” and then if the shape was round or spiky both times by pushing a button with their right or left hand. There were two types of blocks, one where the same hand is used for “o” and round that we call “congruent” and another where the same hand is used for “o” and spiky that we call “incongruent”.

eventually entered in an ANOVA for random effect group analysis. Note that the histograms represent values of the very same smoothed contrast images at selected voxels, averaged across subjects. Unless stated otherwise we used a voxelwise threshold of p<0.001, with a threshold for cluster extent of p<0.05 corrected for multiple comparisons across the whole brain. We also entered individual images for contrasts of interest in models of linear regression with behavioral scores as regressors. These models show voxels whose activation in a given contrast is correlated across subjects with behavioral scores (e.g. voxels whose difference of activation between matching and mismatching stimuli is larger in subjects with higher synaesthesia score). Activation images are overlaid on the average of normalized structural T1 images. The coordinates we report are Montreal Neurological Institute (MNI) standard coordinates.
3. Behavioral Results
a. Synaesthesia Subjects had a mean score of synaesthesia (± standard deviation) of 5.9 (±4.3), the score ranging from 2 to 15. Subjects mostly reported associations between days of the weeks or months and spatial location, months or seasons and colors, music and colors or numbers and personalities. No subject reported being a synesthete.
b. Passive experiment The mean detection rate was 89% for crosses and 87% for “bips”. Mean global detection rate (± standard deviation) is 88% (±14%). All subjects had a global detection rate included in mean detection rate +-1.2 SD (71%-100%), excepted one who had a global detection rate of less than 50%. As we could not be sure that this subject correctly attended to the stimuli, we excluded him from fMRI analysis. We also excluded from fMRI analysis a subject who did not hear the pseudowords in this experiment due to a technical problem.
c. Active experiment
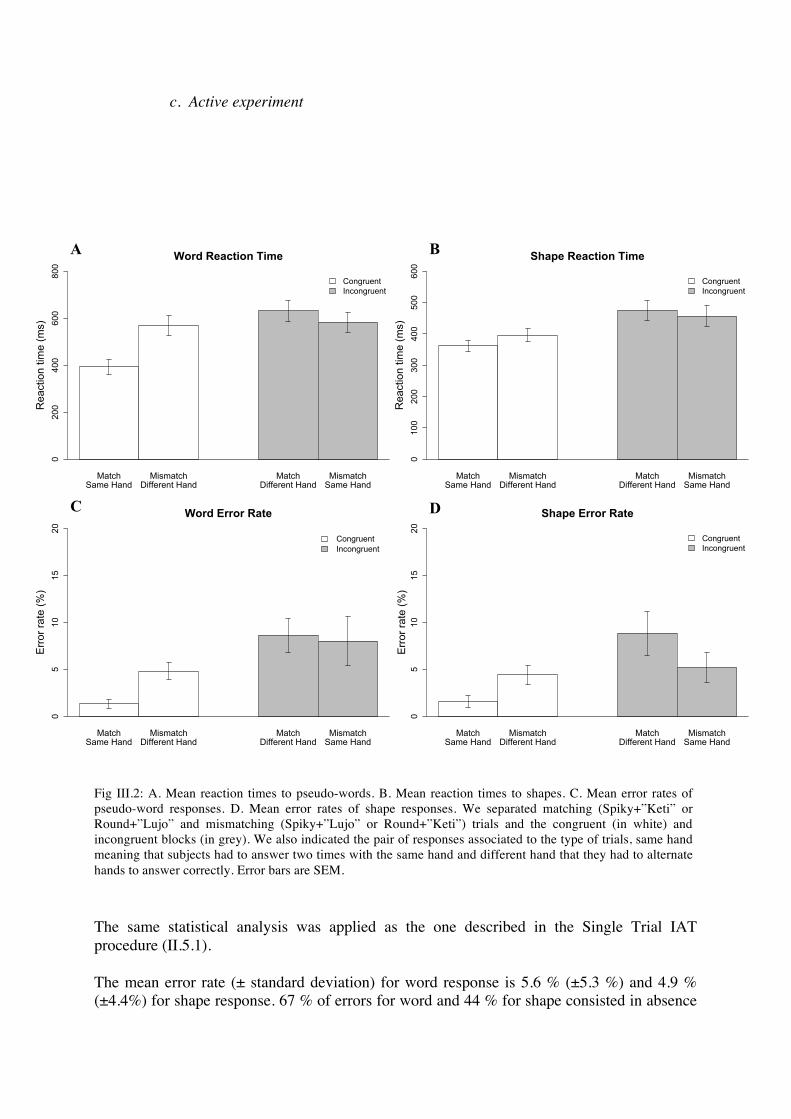
The same statistical analysis was applied as the one described in the Single Trial IAT procedure (II.5.1). The mean error rate (± standard deviation) for word response is 5.6 % (±5.3 %) and 4.9 % (±4.4%) for shape response. 67 % of errors for word and 44 % for shape consisted in absence
Fig III.2: A. Mean reaction times to pseudo-words. B. Mean reaction times to shapes. C. Mean error rates of pseudo-word responses. D. Mean error rates of shape responses. We separated matching (Spiky+”Keti” or Round+”Lujo” and mismatching (Spiky+”Lujo” or Round+”Keti”) trials and the congruent (in white) and incongruent blocks (in grey). We also indicated the pair of responses associated to the type of trials, same hand meaning that subjects had to answer two times with the same hand and different hand that they had to alternate hands to answer correctly. Error bars are SEM.
Word Reaction Time
0200
400
600
800
Rea
ctio
n tim
e (m
s)
CongruentIncongruent
Match Mismatch Match MismatchSame Hand Different Hand Different Hand Same Hand
Shape Reaction Time
0100
200
300
400
500
600
Rea
ctio
n tim
e (m
s)
CongruentIncongruent
Match Mismatch Match MismatchSame Hand Different Hand Different Hand Same Hand
Word Error Rate
05
1015
20E
rror
rate
(%)
CongruentIncongruent
Match Mismatch Match MismatchSame Hand Different Hand Different Hand Same Hand
Shape Error Rate
05
1015
20E
rror
rate
(%)
CongruentIncongruent
Match Mismatch Match MismatchSame Hand Different Hand Different Hand Same Hand
A B
C D

of response. The mean reaction time (± standard deviation) for correct word response is 532 ms (±152 ms) and 417 ms (±100 ms) for correct shape response. We found a main effect of congruency in all analyses: word response reaction time (F(1.17)=19.77, p=0.0004) and error rate (F(1.17)=8.45, p<0.01), shape response reaction time (F(1.17)=16.67, p<0.001) and error rate (F(1.17)=6.09, p=0.02). A main effect of matching was also observed for word reaction time (F(1.17)=41.39, p<0.00001) but not for shape reaction time or shape and word error rates. Finally, there was a significant interaction between matching and congruency in all analyses: word response reaction times (F(1.17)=23.37, p<0.0001) and error rates (F(1.17)=6.30, p=0.02), shape reaction times (F(1.17)=6.07, p=0.02) and error rates (F(1.17)=7.48, p=0.01). As in our behavioral experiments, we looked at inter-individual variability, knowing that people could be more or less sensitive to the sound-symbolic association between shapes and pseudowords. First, we plotted the size of the difference in reaction times and in error rates between congruent and incongruent blocks. This is calculated by subtracting the mean reaction time or error rate of all responses (word and shape) in congruent blocks to the same measure in incongruent blocks. As we can see, effect size differs a lot between subjects going from more than 350 ms to -100 ms for reaction times. We tested the correlation between these two measures; it was not significant (r2=0.07, p=0.27). Then, we calculated the difference in reaction times and in error rates between matching and mismatching trials. As for congruency, these two measures were not correlated (r2=0.05, p=0.38). A table of correlation showed us that the size of the difference between mismatching and matching stimuli was correlated to the size of the difference between incongruent and congruent blocks, both for reaction times (r2=0.35, p=0.01) and error rates (r2=0.32, p=0.01). We also observed that our synaesthesia score was significantly correlated to the difference between mismatching and matching stimuli as reflected by error rates (r2=0.37, p=0.008).
Figure III.3: A. Plot of the difference between mean reaction time in incongruent blocks minus mean reaction time in congruent blocks for each subject. B. Plot of the difference between mean error rates in incongruent blocks minus mean error rate in congruent blocks for each subject.
Congruency effect: reaction times
-100
0100
200
300
400
Effe
ct s
ize
(ms)
1 2 3 4 5 6 7 8 9 10 11 12 13 14 15 16 17 18Subjects
Congruency effect: error rates
-20
24
68
10E
ffect
siz
e (%
)
1 2 3 4 5 6 7 8 9 10 11 12 13 14 15 16 17 18Subjects
A B

From those behavioral scores we derived two regressors to be used for fMRI analysis. We chose to focus on the congruency effect, the most important and stable across experiments and analyzes. For reaction time, we took for each subject the congruency effect size and divided it by the subject’s mean reaction time. We obtained 18 numbers and calculated their mean, then we subtracted this mean to each number to center the score. For error rates, we subtracted the mean effect size from each subject’s effect size.
d. Discussion
Globally, we confirmed the effects we found in the behavioral experiment: main effect of congruency and matching and interaction matching:congruency. This interaction could simply be due to the difference between different hands and same hand answers. Correlations between measures showed that congruency and matching effects were significantly correlated both for reaction times and error rates. According to the interpretation we made of congruency and matching effect, one hypothesis would be that subjects that are the most sensitive to higher order associations are also the ones integrating at lower level round shapes and “lojo” pseudowords. We hypothesize that the absence of correlation between effects on error rates and reaction times could be the result of a trade-off between these two measures, some subjects for example taking more time to do fewer errors. The fact that subjects with higher synaesthesia score do more errors with mismatching stimuli than matching stimuli was unexpected even if it makes sense. If replicated this result could be an interesting element linking synaesthesic tendencies to sound symbolic links between shapes and pseudowords. It remains a question why it is only correlated to error rates and not reaction times differences.
4. Imaging Results
a. Activations Auditory stimuli activated the superior temporal gyrus and sulcus bilaterally (left: MNI -60 -28 6, Z>8; right: MNI 66 -20 2, Z>8). At a 0.01 voxelwise threshold, they also activated a bilateral precentral cluster but under clusterwise significance threshold (left: MNI -48 -4 50, Z=6.04; right: MNI 56 0 44, Z=5.67). The contrast “lujo”-like pseudowords minus “keti”-like pseudowords activated a left temporal cluster, in the superior temporal gyrus (left: MNI -50 -10 4, Z=6). The contrast of hard sounds minus soft sounds did not yield any significant activation. We think that this difference could be due to low-level differences between “lujo” and “keti” pseudowords. Visual stimuli activated the occipital cortex (left: MNI -10 -102 6, Z>8; right: 28 -92 16, Z>8), the ventral temporal posterior to about y=-35, and the posterior intraparietal cortex bilaterally, with an additional bilateral mid-intraparietal cluster (right: MNI 30 -54 52, Z=4.71; left: MNI -28 -56 58, Z=4.59). At a 0.01 voxelwise threshold, visual stimuli activated a bilateral precentral cluster but under clusterwise significance threshold (left: MNI -50 0 46, Z=3.35; right: MNI 48 4 32, Z=3.59). These clusters were slightly anterior to the ones activated by auditory stimuli. The contrast of round minus spiky shapes activated bilateral calcarine sulcus (left: MNI -8 -82 8, Z=5.95; right: MNI: 8 -76 12, Z=6.48). Conversely, spiky minus roundish shapes activated the bilateral occipital poles (left: MNI -12 -94 -8,
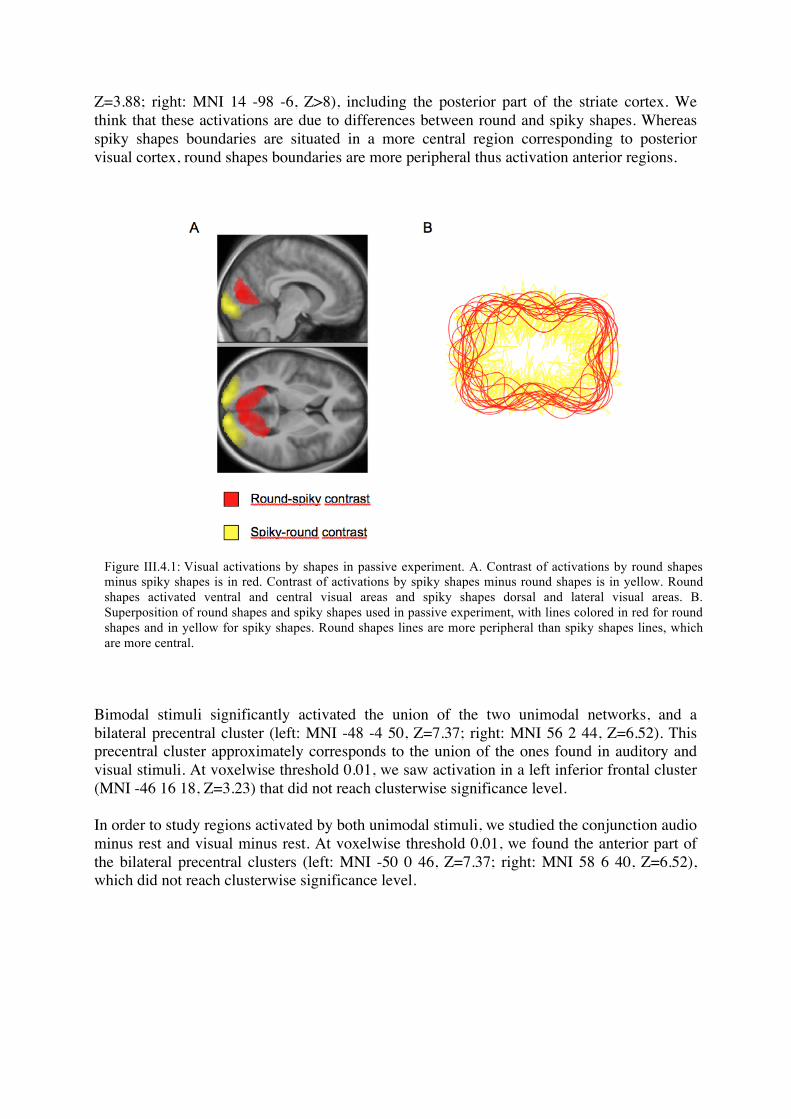
Z=3.88; right: MNI 14 -98 -6, Z>8), including the posterior part of the striate cortex. We think that these activations are due to differences between round and spiky shapes. Whereas spiky shapes boundaries are situated in a more central region corresponding to posterior visual cortex, round shapes boundaries are more peripheral thus activation anterior regions.
Bimodal stimuli significantly activated the union of the two unimodal networks, and a bilateral precentral cluster (left: MNI -48 -4 50, Z=7.37; right: MNI 56 2 44, Z=6.52). This precentral cluster approximately corresponds to the union of the ones found in auditory and visual stimuli. At voxelwise threshold 0.01, we saw activation in a left inferior frontal cluster (MNI -46 16 18, Z=3.23) that did not reach clusterwise significance level. In order to study regions activated by both unimodal stimuli, we studied the conjunction audio minus rest and visual minus rest. At voxelwise threshold 0.01, we found the anterior part of the bilateral precentral clusters (left: MNI -50 0 46, Z=7.37; right: MNI 58 6 40, Z=6.52), which did not reach clusterwise significance level.
Figure III.4.1: Visual activations by shapes in passive experiment. A. Contrast of activations by round shapes minus spiky shapes is in red. Contrast of activations by spiky shapes minus round shapes is in yellow. Round shapes activated ventral and central visual areas and spiky shapes dorsal and lateral visual areas. B. Superposition of round shapes and spiky shapes used in passive experiment, with lines colored in red for round shapes and in yellow for spiky shapes. Round shapes lines are more peripheral than spiky shapes lines, which are more central.
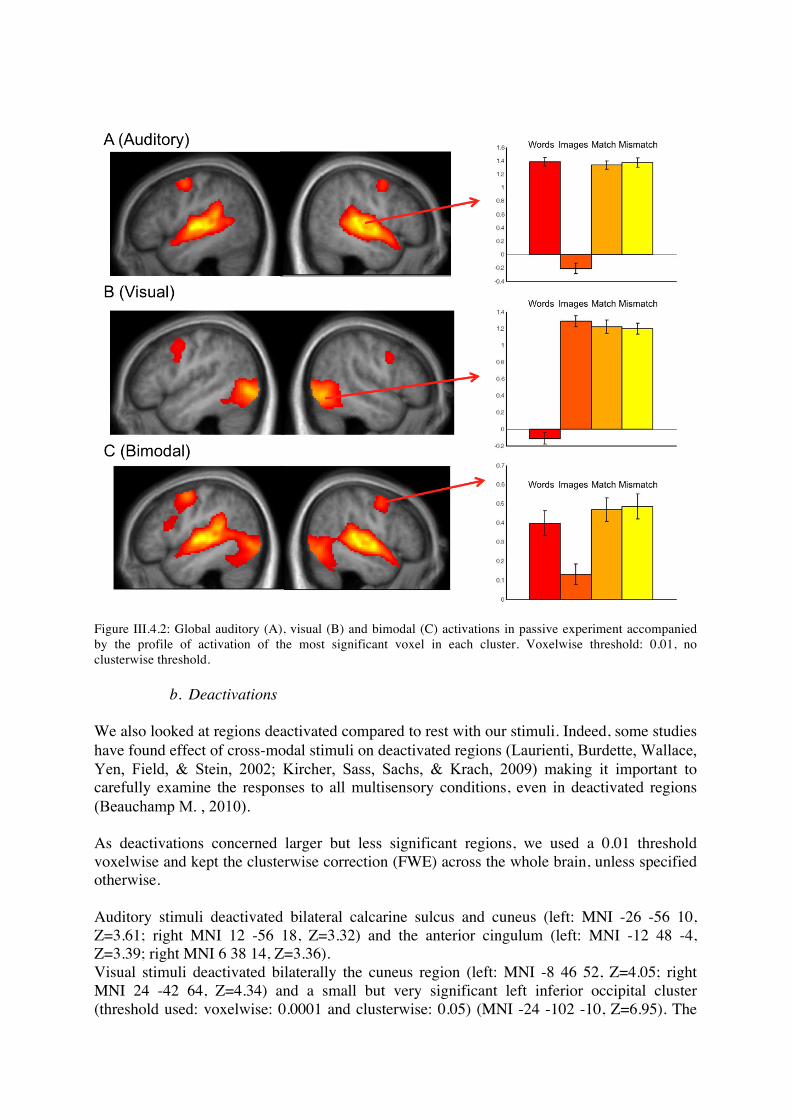
Figure III.4.2: Global auditory (A), visual (B) and bimodal (C) activations in passive experiment accompanied by the profile of activation of the most significant voxel in each cluster. Voxelwise threshold: 0.01, no clusterwise threshold.
b. Deactivations We also looked at regions deactivated compared to rest with our stimuli. Indeed, some studies have found effect of cross-modal stimuli on deactivated regions (Laurienti, Burdette, Wallace, Yen, Field, & Stein, 2002; Kircher, Sass, Sachs, & Krach, 2009) making it important to carefully examine the responses to all multisensory conditions, even in deactivated regions (Beauchamp M. , 2010). As deactivations concerned larger but less significant regions, we used a 0.01 threshold voxelwise and kept the clusterwise correction (FWE) across the whole brain, unless specified otherwise. Auditory stimuli deactivated bilateral calcarine sulcus and cuneus (left: MNI -26 -56 10, Z=3.61; right MNI 12 -56 18, Z=3.32) and the anterior cingulum (left: MNI -12 48 -4, Z=3.39; right MNI 6 38 14, Z=3.36). Visual stimuli deactivated bilaterally the cuneus region (left: MNI -8 46 52, Z=4.05; right MNI 24 -42 64, Z=4.34) and a small but very significant left inferior occipital cluster (threshold used: voxelwise: 0.0001 and clusterwise: 0.05) (MNI -24 -102 -10, Z=6.95). The

same region on the right side (MNI 28 -100 -6, Z=5.04) was also deactivated but is slightly under clusterwise statistical threshold. Bimodal stimuli deactivated the union of the two unimodal networks, except for regions deactivated in one condition and activated in the other (as calcarine sulcus). In order to study regions deactivated by both unimodal stimuli, we studied the conjunction rest minus audio and minus rest visual. Even at a low threshold, i.e voxelwise 0.02 each, we only found small non-significant clusters in bilateral cuneus and precuneus.
c. Cross-modal matching To find regions more activated in bimodal trials than in unimodal trials, we studied the conjunction of bimodal minus auditory and bimodal minus visual (AV > A AND AV > V). This statistical criterion is used by many researchers in multisensory integration (Beauchamp M. , 2010). We notably found a part of the left precentral cluster (MNI -50 2 48, Z=3.26). We also studied the conjunction of auditory minus bimodal and visual minus bimodal to search for regions more deactivated in bimodal trials than in unimodal trials, but did not find any significant clusters. We then contrasted mismatching minus matching bimodal stimuli. This showed bilateral frontal activations (left: MNI -42 44 22, Z=3.92; right MNI 34 56 28, Z=3.50). These activations bilaterally covered the lateral part of the inferior, middle and superior frontal gyri. Those were due to larger deactivations by matching than by mismatching stimuli. When comparing separately the two types of mismatching stimuli to matching stimuli we found the same prefrontal activations in addition to those resulting from the different stimuli in the two terms of the subtractions (eg spiky minus round activations, as seen earlier).
Figure III.4.3: Mismatch-match activations in frontal cortices accompanied by profile of activation in cluster most significant voxel.

The opposite contrasts yielded no significant activations. When comparing separately the two types of matching stimuli to mismatching stimuli we did not find any activations except for those resulting from the different stimuli in the two terms of the subtractions.
d. Linear regression The contrast of match minus mismatch was positively correlated with the behavioral congruency score, as measured during the active fMRI experiment, in the right temporo-occipital cortex (MNI 44 -78 0, Z=4.16). There was a symmetrical left hemispheric activation somewhat below the threshold for cluster extent (MNI -44 -86 -10, Z=4.27).
Fig III.4.4: Match-mismatch activations correlated to error rate congruency score. The figures on the right are plots of the difference of activation between matching and mismatching pairs of stimuli as a function of the difference in error rates between congruent and incongruent blocks. The numbers in the plots represent the subjects. r2 is the square of the correlation coefficient. We did not find activations correlated to the reaction time score. We observed significant mismatch-match activations correlated to synaesthesia score in the bilateral inferior postcentral gyri (left: MNI -32 -28 38, Z=4.26; right MNI 38 -22 34, Z=3.57) and inferior precentral gyri (left: MNI -36 -8 34, Z=3.39; right MNI 40 -6 34, Z=3.36).

5. Imaging Discussion
a. Bimodal precentral clusters
Fig III.4.5 : Mismatch-match activations correlated to synaesthesia index. The figures on the right are plots of the difference of activation between match and mismatch as a function of the synaesthesia index. The numbers in the plots represent the subjects. r2 is the square of the correlation coefficient.
Figure III.6: Bilateral precentral cluster in bimodal blocks accompanied by mean profile of activation of a 1000 voxel cube centered on the most significant voxel of the cluster.
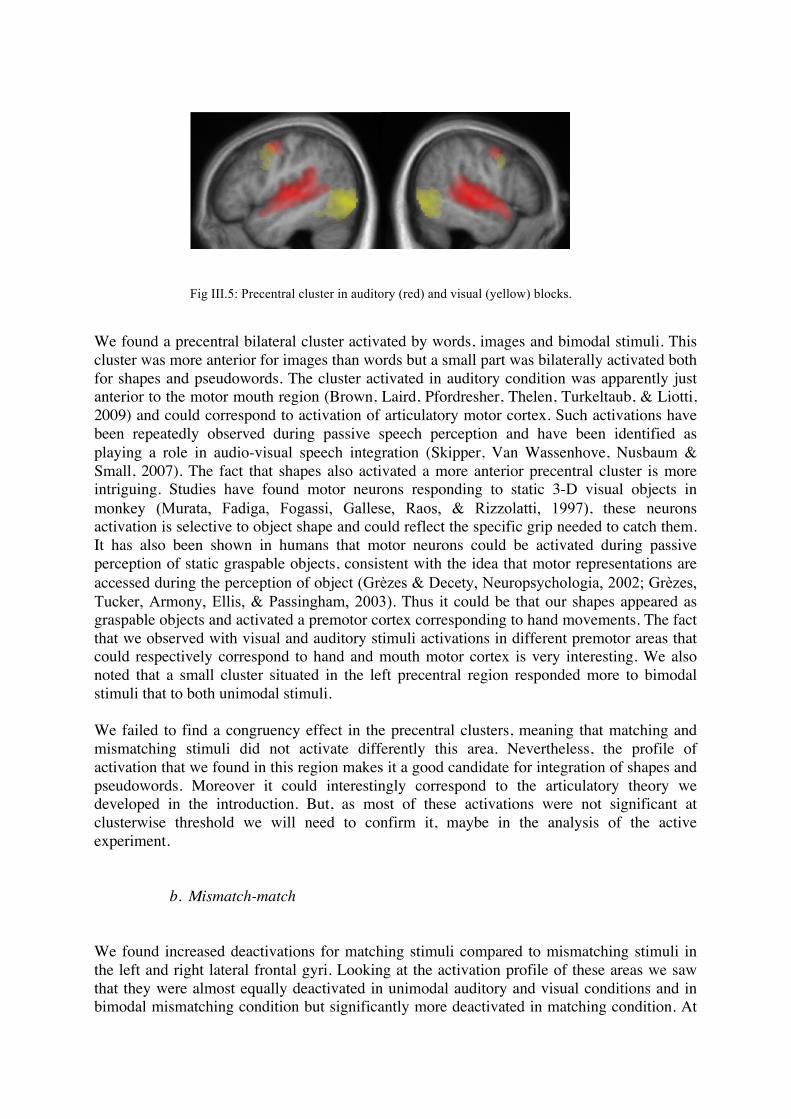
We found a precentral bilateral cluster activated by words, images and bimodal stimuli. This cluster was more anterior for images than words but a small part was bilaterally activated both for shapes and pseudowords. The cluster activated in auditory condition was apparently just anterior to the motor mouth region (Brown, Laird, Pfordresher, Thelen, Turkeltaub, & Liotti, 2009) and could correspond to activation of articulatory motor cortex. Such activations have been repeatedly observed during passive speech perception and have been identified as playing a role in audio-visual speech integration (Skipper, Van Wassenhove, Nusbaum & Small, 2007). The fact that shapes also activated a more anterior precentral cluster is more intriguing. Studies have found motor neurons responding to static 3-D visual objects in monkey (Murata, Fadiga, Fogassi, Gallese, Raos, & Rizzolatti, 1997), these neurons activation is selective to object shape and could reflect the specific grip needed to catch them. It has also been shown in humans that motor neurons could be activated during passive perception of static graspable objects, consistent with the idea that motor representations are accessed during the perception of object (Grèzes & Decety, Neuropsychologia, 2002; Grèzes, Tucker, Armony, Ellis, & Passingham, 2003). Thus it could be that our shapes appeared as graspable objects and activated a premotor cortex corresponding to hand movements. The fact that we observed with visual and auditory stimuli activations in different premotor areas that could respectively correspond to hand and mouth motor cortex is very interesting. We also noted that a small cluster situated in the left precentral region responded more to bimodal stimuli that to both unimodal stimuli. We failed to find a congruency effect in the precentral clusters, meaning that matching and mismatching stimuli did not activate differently this area. Nevertheless, the profile of activation that we found in this region makes it a good candidate for integration of shapes and pseudowords. Moreover it could interestingly correspond to the articulatory theory we developed in the introduction. But, as most of these activations were not significant at clusterwise threshold we will need to confirm it, maybe in the analysis of the active experiment.
b. Mismatch-match We found increased deactivations for matching stimuli compared to mismatching stimuli in the left and right lateral frontal gyri. Looking at the activation profile of these areas we saw that they were almost equally deactivated in unimodal auditory and visual conditions and in bimodal mismatching condition but significantly more deactivated in matching condition. At
Fig III.5: Precentral cluster in auditory (red) and visual (yellow) blocks.
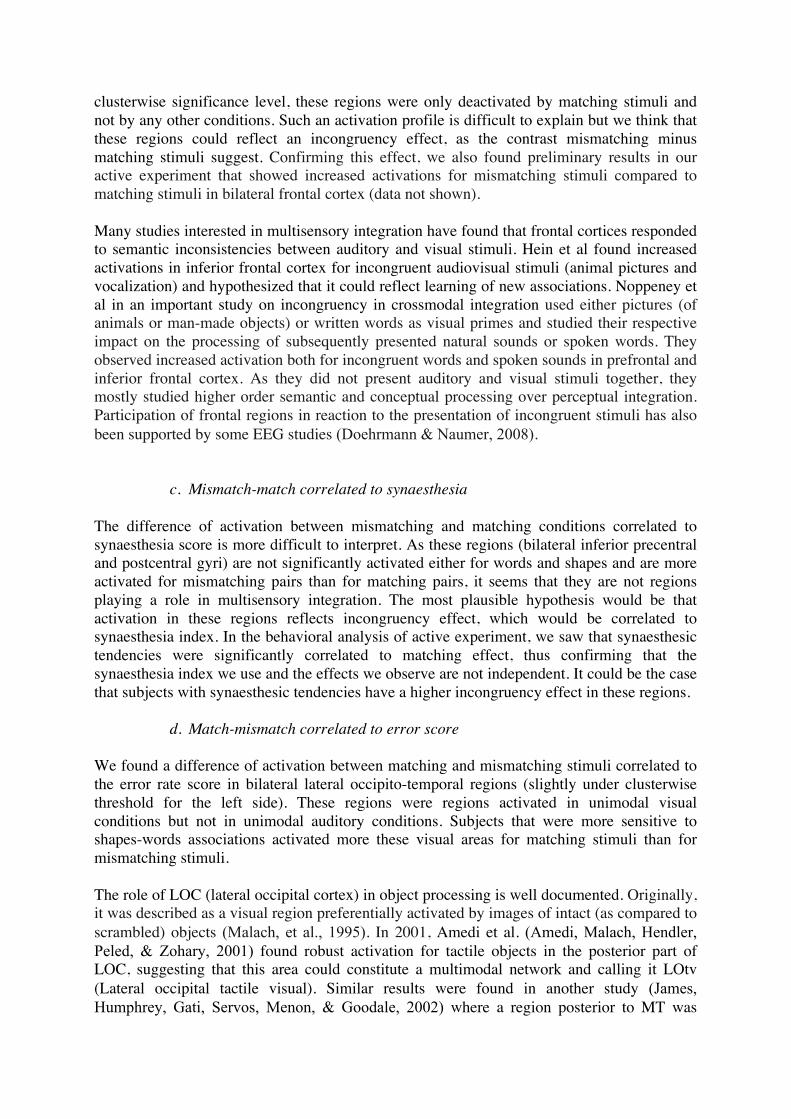
clusterwise significance level, these regions were only deactivated by matching stimuli and not by any other conditions. Such an activation profile is difficult to explain but we think that these regions could reflect an incongruency effect, as the contrast mismatching minus matching stimuli suggest. Confirming this effect, we also found preliminary results in our active experiment that showed increased activations for mismatching stimuli compared to matching stimuli in bilateral frontal cortex (data not shown). Many studies interested in multisensory integration have found that frontal cortices responded to semantic inconsistencies between auditory and visual stimuli. Hein et al found increased activations in inferior frontal cortex for incongruent audiovisual stimuli (animal pictures and vocalization) and hypothesized that it could reflect learning of new associations. Noppeney et al in an important study on incongruency in crossmodal integration used either pictures (of animals or man-made objects) or written words as visual primes and studied their respective impact on the processing of subsequently presented natural sounds or spoken words. They observed increased activation both for incongruent words and spoken sounds in prefrontal and inferior frontal cortex. As they did not present auditory and visual stimuli together, they mostly studied higher order semantic and conceptual processing over perceptual integration. Participation of frontal regions in reaction to the presentation of incongruent stimuli has also been supported by some EEG studies (Doehrmann & Naumer, 2008).
c. Mismatch-match correlated to synaesthesia The difference of activation between mismatching and matching conditions correlated to synaesthesia score is more difficult to interpret. As these regions (bilateral inferior precentral and postcentral gyri) are not significantly activated either for words and shapes and are more activated for mismatching pairs than for matching pairs, it seems that they are not regions playing a role in multisensory integration. The most plausible hypothesis would be that activation in these regions reflects incongruency effect, which would be correlated to synaesthesia index. In the behavioral analysis of active experiment, we saw that synaesthesic tendencies were significantly correlated to matching effect, thus confirming that the synaesthesia index we use and the effects we observe are not independent. It could be the case that subjects with synaesthesic tendencies have a higher incongruency effect in these regions.
d. Match-mismatch correlated to error score We found a difference of activation between matching and mismatching stimuli correlated to the error rate score in bilateral lateral occipito-temporal regions (slightly under clusterwise threshold for the left side). These regions were regions activated in unimodal visual conditions but not in unimodal auditory conditions. Subjects that were more sensitive to shapes-words associations activated more these visual areas for matching stimuli than for mismatching stimuli. The role of LOC (lateral occipital cortex) in object processing is well documented. Originally, it was described as a visual region preferentially activated by images of intact (as compared to scrambled) objects (Malach, et al., 1995). In 2001, Amedi et al. (Amedi, Malach, Hendler, Peled, & Zohary, 2001) found robust activation for tactile objects in the posterior part of LOC, suggesting that this area could constitute a multimodal network and calling it LOtv (Lateral occipital tactile visual). Similar results were found in another study (James, Humphrey, Gati, Servos, Menon, & Goodale, 2002) where a region posterior to MT was

activated by visual and tactile exploration of novel objects made of clay. Many others ( (Zhang, Weisser, Stilla, Prather, & Sathian, 2004) have found visuo-tactile activations in LOtv and the main hypothesis is that this region is engaged in processing higher-order shape representation accessible either by vision or touch. Evidence has been brought that these activations could not only be provoked by top-down mental imagery (Beauchamp M. , 2005). As in our study, it has been shown that LOtv is not activated by auditory stimuli (Naumer, et al., 2010; Amedi, Malach, Hendler, Peled, & Zohary, 2001) but some studies observed modulation by auditory stimuli in this region. First, Amedi, et al. used soundscapes created by a visual-auditory sensory substitution device (SSD) that converts visual shape information into an auditory stream via a specific algorithm (Amedi, et al., 2007). In this study, sighted and blind subjects who learned to associate these soundscapes to shapes activated LOtv when listening to them.Another recent study (Doehrmann, Weigelt, Altmann, Kaiser, & Naumer, 2010) found repetition enhancement in LOC for the same auditory animal vocalization (compared to different animal vocalization) presented with a congruent animal picture. They showed that “object-related visual cortex is able to discriminate auditory signals at least along the dimension of “same” versus “different”.Taken together, there is growing consensus that LOC is a ‘‘metamodal operator’’ (Lacey, Tal, Amedi, & Sathian, 2009; Amedi, von Kriegstein, van Atteveldt, Beauchamp, & Naumer, 2005) that processes shape information irrespective of the particular input modality. The fact that this region is strongly activated for our visual and bimodal conditions could mean that our subjects extracted tactile and shape information about our stimuli. This is not surprising as our visual stimuli are abstract round or spiky shapes whose geometrical representations are maybe easier to access than other visual objects. What is more surprising is that we found a matching effect in this area. Our hypothesis for this effect is the following: when subjects see one of our shapes, they extract some abstract properties of this shape (e.g. 3D structure) activating LOC. When this shape is accompanied by a matching auditory stimulus, the information seems to be congruent and subjects also extract properties of the shape activating LOC. On the contrary, when the shape is accompanied by a mismatching auditory stimulus, sensitive subjects are confronted to an incongruent situation (as reflected by frontal cortices activations we found) that could prevent the extraction of shape properties and result in a significant decrease of activation. The question remains if this conflict is due to top-down incongruency signals or direct links between unisensory regions. Studies have shown that direct links between auditory and visual cortices could exist without the need of specific multisensory regions (Kayser, 2010). If this region is extracting shape and 3D information about our visual stimuli, it is possible that they are considered as graspable objects, maybe linking this activation to premotor activations for shapes and to our “articulatory” hypothesis. This region should be analyzed in active experiment to look for such effects. This is the first time at our knowledge that (in)congruency effects are observed in LOC in fMRI and it would need to be further tested, for example, with congruent or incongruent visuo-tactile objects, which has never been done. Using EEG, Molholm et al. found a different response for congruent and incongruent audio-visual stimuli (animal picture and vocalization) taking place in right LOC (Molholm, Ritter, Javitt, & Foxe, 2004). They concluded that “behavioral multisensory object-recognition effect was due to auditory influences on visual information processing, and that this likely occurred at the feature level of representation”. This conclusion is very close to the hypothesis we make about our activations.
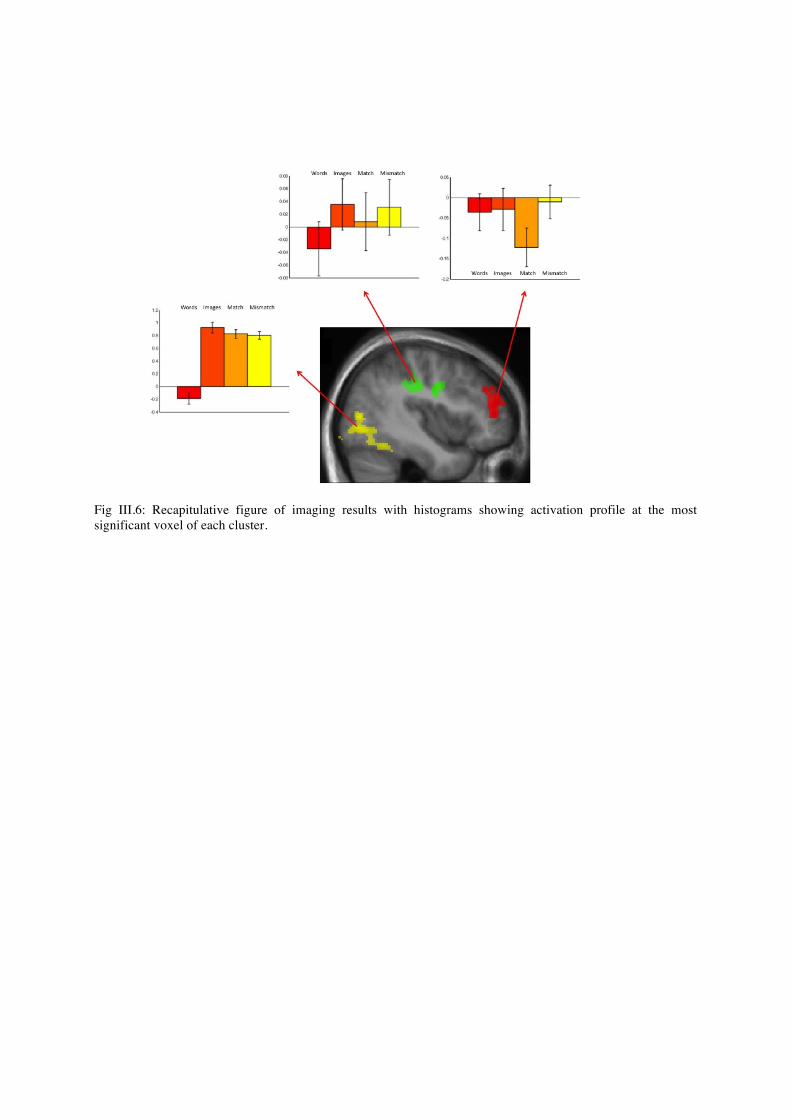
Fig III.6: Recapitulative figure of imaging results with histograms showing activation profile at the most significant voxel of each cluster.

IV. Conclusion The goal of our study was to explore the bouba/kiki effect. The fact that people associate “bouba” to round shapes and “kiki” to spiky shapes has been known for many years and replicated by many studies but its causes remain mostly unknown. First, we decided to confirm this effect with auditory and visual stimuli we designed. This was important for at least three reasons: first, a part of the evidence concerning the bouba/kiki effect was rather anecdotal and we decided to replicate it more systematically. Moreover we were curious to assess the respective role of vowels and consonants in this effect. Finally, as we wanted to conduct further experiments on this effect, we needed to select pseudowords and shapes whose associations had been assessed. This experiment confirmed that pseudowords were non-randomly mapped onto shapes and showed for the first time that both vowels and consonants modulated this effect. Then, we decided to check if these associations could affect subjects in tasks which did not need explicit choice. We tried a variety of methods and found evidence that matching pairs of pseudowords and shapes could be processed faster and more accurately than mismatching pairs. We interpreted this finding as the result of cross-modal integration between auditory and visual stimuli. We developed two major hypotheses that could account for cross-modal integration between pseudowords and shapes: the “articulatory” theory and the “low-features” theory. According to the “articulatory” theory this effect could be the consequence of links between speech perception and shape perception mediated by hand and mouth motor areas. The “low-features” theory asserts that shapes and pseudowords associations are driven by links existing in the real world such as the one between frequency and size. We decided to use brain imagery as a way to bring evidence for one of these theories. We thought that the “articulatory” hypothesis would show activations in motor and premotor cortex sensitive to matching whereas the “low-features” theory would predict activation in early sensory areas. We conducted two imaging experiments, one where subjects passively attended to pseudowords, shapes, matching or mismatching pairs of pseudowords and shapes and one where they had to perform a speeded double classification task on matching or mismatching pairs of stimuli. We only present here the results of the passive experiment. We found a significant difference of activation between mismatching and matching pairs in frontal cortices which could correspond to an incongruency effect. This result shows that subjects are sensitive to the bouba/kiki effect, even during passive perception but does not particularly support one of the two hypotheses. Indeed, frontal cortex activations probably represent conflict between higher-order representations that could result from “articulatory” or “low-features” information about stimuli. Although we found activations for shapes and pseudowords in slightly different parts of the motor and premotor cortex, they were below threshold and we did not find a different response to matching and mismatching pairs in this region. We also observed increased activation for matching stimuli correlated to a behavioral score reflecting the sensitivity to the effect in the active experiment. These activations were situated in a lateral occipital region that could correspond to an area identified as a metamodal operator processing shape information irrespective of the input modality. We are currently analyzing active experiment and we will pay particular attention to these two regions.

These results bring more questions than answers and do not really allow us to conclude between our theories. As one of the first studies on the bouba/kiki effect, we entered the subject in a rather exploratory fashion and had to find ways to study it. Much remains to be done on the subject and we think that behavioral experiments could help us disentangle explanations. Using for example soundless videos of articulated syllables or pure tone varying in frequency and amplitude with shapes would bring essential clues to what is going on when associating sound and shapes. Like Ramachandran and Hubbard, we are convinced that explanations to the bouba/kiki effect could bring important insight into theories about language and its origins.

V. Bibliography Alsius, A., Navarra, J., Campbell, R., & Soto-‐Faraco, S. (2005). Audiovisual integration of speech falters under high attention demands. Current Biology , 15, 839-‐843.
Amedi, A., Malach, R., Hendler, T., Peled, S., & Zohary, E. (2001). Visuo-‐haptic object-‐related activation in the ventral visual pathway. Nature neuroscience , 4 (3), 324-‐30.
Amedi, A., Stern, W., Camprodon, J., Bermpohl, F., Merabet, L., Rotman, S., et al. (2007). Shape conveyed by visual-‐to-‐auditory sensory substitution activates the lateral occipital complex. Nature neuroscience , 10 (6), 687-‐9.
Amedi, A., von Kriegstein, K., van Atteveldt, N., Beauchamp, M., & Naumer, M. (2005). Functional imaging of human crossmodal identification and object recognition. Experimental brain research Experimentelle Hirnforschung Expérimentation cérébrale , 166 (3-‐4), 559-‐71.
Beauchamp, M. (2005). See me, hear me, touch me: multisensory integration in lateral occipital-‐temporal cortex. Current opinion in neurobiology , 15 (2), 145-‐53.
Beauchamp, M. (2010, Mar 22). Statistical Criteria in fMRI Studies of Multisensory Integration. Neuroinformatics , 22.
Brown, R., Black, A., & Horowitz, A. (1955). Phonetic symbolism in natural languages. Journal of Abnormal and Social Psychology , 50, 388–393.
Brown, S., Laird, A., Pfordresher, P., Thelen, S., Turkeltaub, P., & Liotti, M. ( 2009). The somatotopy of speech: phonation and articulation in the human motor cortex. Brain and Cognition , 70, 31-‐41.
Damasio, A., & Geschwind, N. (1984). The neural basis of language. 7, 127–147.
Davis, R. (1961). The fitness of names to drawings: A cross-‐cultural study in Tanganyika. British Journal of Psychology , 52, 259–268.
Degerman, A., R. T., Pekkola, J., Autti, T., Jääskeläinen, I., Sams, M., et al. (2007). Human brain activity associated with audiovisual perception and attention. Neuroimage , 34, 1683-‐1691.
Doehrmann, O., & Naumer, M. (2008). Semantics and the multisensory brain: how meaning modulates processes of audio-‐visual integration. Brain Research , 1242, 136-‐50.
Doehrmann, O., Weigelt, S., Altmann, C., Kaiser, J., & Naumer, M. (2010). Audiovisual Functional Magnetic Resonance Imaging Adaptation Reveals Multisensory Integration Effects in Object-‐Related Sensory Cortices. Journal of Neuroscience , 30 (9), 3370-‐3379.
Eitan, Z., & Timmers, R. (2010). Beethoven’s last piano sonata and those who follow crocodiles: Cross-‐domain mappings of auditory pitch in a musical context. Cognition , 114 (3), 405-‐422.
Farmer, T., Christiansen, M., & Monaghan, P. (2006). Phonological typicality influences on-‐line sentence comprehension. Proceedings of the National Academy of Sciences of the United States of America , 103 (32), 12203-‐8.
Fowler, C. A. (1986). An event approach to the study of speech perception from a direct-‐realist perspective. Journal of phonetics , 14, 3-‐28.
French, P. (1977). Toward an explanation of phonetic symbolism. Word , 28, 305–322.
Gentilucci, M. (2003). Grasp observation influences speech production. European Journal of Neuroscience , 17, 179–184.
Gentilucci, M., Campione, G., Dalla Volta, R., & Bernardis, P. (2009). The observation of manual grasp actions affects the control of speech: A combined behavioral and Transcranial Magnetic Stimulation study. Neuropsychologia , 47 (14), 3190-‐3202.
Gentilucci, M., Stefanini, S., Roy, A. C., & Santunione, P. (2004). Action observation and speech production: Study on children and adults. Neuropsychologia , 42, 1554–1567.
Gernsbacher, M., & Kaschak, M. (2003). Neuroimaging studies of language production and comprehension. Annual review of psychology , 54, 91-‐114.
Ghazanfar, A., & Schroeder, C. (2006). Is neocortex essentially multisensory? Trends in Cognitive Sciences , 10, 278-‐285.
Greenwald, A., McGhee, D., & Schwartz, K. (1998). Measuring individual differences in implicit cognition: the implicit association test. Journal of Personality and Social Psychology , 74, 1464–1480.
Grèzes, J., & Decety, J. (2002). Does visual perception of object afford action? Evidence from a neuroimaging study. Neuropsychologia , 40 (2), 212-‐22.
Grèzes, J., Tucker, M., Armony, J., Ellis, R., & Passingham, R. (2003). Objects automatically potentiate action: an fMRI study of implicit processing. The European journal of neuroscience , 17 (12), 2735-‐40.
Hauk, O., Johnsrude, I., & Pulvermüller, F. (2004). Somatotopic representation of action words in human motor and premotor cortex. Neuron , 41, 301–307.
Holland, M., & Wertheimer, M. (1964). Some physiognomic aspects of naming, or maluma, and takete revisited. Perceptual and Motor Skills , 19, 111–117.
Huang, Y., Pratoomraj, S., & Johnson, R. (1969). Universal magnitude symbolism. Journal of Verbal Learning and Verbal Behavior , 8, 155–156.
Imai, M., & Okada, H. (2008, Oct 23). Sound Symbolism facilitates early verb learning. Cognition .
James, T., Humphrey, G., Gati, J., Servos, P., Menon, R., & Goodale, M. (2002). Haptic study of three-‐dimensional objects activates extrastriate visual areas. . Neuropsychologia , 40, 1706–1714.
Köhler, W. (1947). Gestalt psychology, an introduction to new concepts in modern psychology (éd. 2nd edition). New York: Liveright.
Kayser, C. (2010). The Multisensory Nature of Unisensory Cortices: A Puzzle Continued. Neuron , 67 (2), 178-‐180.
Kircher, T., Sass, K., Sachs, O., & Krach, S. (2009). Priming words with pictures: neural correlates of semantic associations in a cross-‐modal priming task using fMRI. Hum Brain Mapp , 4116-‐4128.
Klink, R. (2000). Creating brand names with meaning: the use of sound symbolism. Marketing Letters , 11, 5-‐20.
Koriat, A., & Levy, I. (2004, Dec 1). The Symbolic Implications of Vowels and of Their Orthographic Representations in Two Natural Languages. Journal of Psycholinguistic Research , 6.
Lacey, S., Tal, N., Amedi, A., & Sathian, K. (2009). A Putative Model of Multisensory Object Representation. Brain Topography , 21 (3-‐4), 269-‐274.
Laurienti, P., Burdette, J., Wallace, M., Yen, Y., Field, A., & Stein, B. (2002). Deactivation of sensory-‐specific cortex by cross-‐modal stimuli. Journal of Cognitive Neuroscience , 14, 420-‐429.
Laurienti, P., Kraft, R., Maldjian, J., Burdette, J., & Wallace, M. (2004). Semantic congruence is a critical factor in multisensory behavioral performance. Experimental brain research Experimentelle Hirnforschung Expérimentation cérébrale , 158 (4), 405-‐14.
Lemus, L., Hernández, A., Luna, R., Zainos, A., & Romo, R. (2010). Do sensory cortices process more than one sensory modality during perceptual judgments? Neuron , 67, 335-‐348.
Liberman, A., & Mattingly, I. (1985). The motor theory of speech perception revised. Cognition , 21 (1), 1-‐36.
Malach, R., Reppas, J., Benson, R., Kwong, K., Jiang, H., Kennedy, W., et al. (1995). Object-‐related activity revealed by functional magnetic resonance imaging in human occipital cortex. Proc Natl Acad Sci U S A , 92, 8135-‐8139.
Maurer, D., Pathman, T., & Mondloch, C. (2006, Apr 5). The shape of boubas : sound-‐shape correspondences in toddlers and adults. Developmental Science .
Molholm, S., Ritter, W., Javitt, D., & Foxe, J. (2004). Multisensory visual-‐auditory object recognition in humans: a high-‐density electrical mapping study. Cerebral cortex (New York, NY : 1991) , 14 (4), 452-‐65.
Murata, A., Fadiga, L., Fogassi, L., Gallese, V., Raos, V., & Rizzolatti, G. (1997). Object representation in the ventral premotor cortex (area F5) of the monkey. Journal of neurophysiology , 78 (4), 2226-‐30.
Naumer, M., Ratz, L., Yalachkov, Y., Polony, A., Doehrmann, O., Van De Ven, V., et al. (2010). Visuohaptic convergence in a corticocerebellar network. European Journal of Neuroscience , 31 (10), 1730-‐1736.
Nichols, J., & Ohala, J. Sound symbolism. New York: Cambridge University Press.
Noppeney, U., Josephs, O., Hocking, J., Price, C., & Friston, K. (2008). The effect of prior visual information on recognition of speech and sounds. Cerebral cortex (New York, NY : 1991) , 18 (3), 598-‐609.
Nosek, B., Greenwald, A., & Banaji, M. (2003). Understanding and Using the Implicit Association Test: II. Method Variables and Construct Validity. Journal of Personality and Social Psycholog , 85, 197-‐216.
Nygaard, L., Cook, A., & Namy, L. (2008, Jun 3). Sound Symbolism in Word Learning.
Phelps, E., O'Connor, K., Cunningham, W., Funayama, E., Gatenby, J., Gore, J., et al. (2000). Performance on indirect measures of race evaluation predicts amygdala activation. J. Cogn. Neurosci. , 12, 729-‐738.
Pulvermüller, F., Huss, M., Kherif, F., Moscoso del Prado Martin, F., Hauk, O., & Shtyrov, Y. (2006). Motor cortex maps articulatory features of speech sounds. Proceedings of the National Academy of Sciences of the United States of America , 103 (20), 7865-‐70.
Ramachandran, V., & Hubbard, E. (2001, Nov 28). Synaesthesia -‐ A Window into Perception, Thought and Language.
Rizzolatti, G., & Arbib, M. (1998). Language within our grasp. Trends in Neuroscience , 21, 188–194.
Sapir, E. (1929). A study in phonetic symbolism. Journal of Experimental Psychology , 12, 225–239.
Skipper, J.I, Van Wassenhove, V., Nusbaum, H.C, & Small, S.L. (2007). Hearing Lips and Seeing Voices: How Cortical Areas Supporting Speech Production Mediate Audiovisual Speech Perception. Cerebral Cortex, 17,2387-‐2399
Spence, C. (2007, Feb 15). Audiovisual multisensory integration. Acoust. Sci. & Tech. , 10.
Taylor, I., & Taylor, M. (1962). Phonetic symbolism in four unrelated languages. Canadian Journal of Psychology , 16, 344–356.
Van Atteveldt, N., Formisano, E., Goebel, R., & Blomert, L. (2004). Integration of letters and speech sounds in the human brain. Neuron , 43, 271-‐282.
Wernicke, C. (1874). Der Aphasische Symptomencomplex. Eine Psychologische Studie auf Anatomischer Basis. Breslau, Germany: Kohn und Weigert.

Wertheimer, M. (1958). The relation between the sound of a word and its meaning. The American Journal of Psychology , 71, 412–415.
Westermann, G., & Reck Miranda, E. (2004). A new model of sensorimotor coupling in the development of speech. Brain and Language , 89 (2), 393-‐400.
Wilson, S., Saygin, A., Sereno, M., & Iacoboni, M. (2004). Listening to speech activates motor areas involved in speech production. Nature neuroscience , 7 (7), 701-‐2.
Yuen, I., Davis, M., Brysbaert, M., & Rastle, K. (2010). Activation of articulatory information in speech perception. Proceedings of the National Academy of Sciences , 107 (2), 592-‐597.
Zhang, M., Weisser, V., Stilla, R., Prather, S., & Sathian, K. (2004). Multisensory cortical processing of object shape and its relation to mental imagery. Cogn Affect Behav Neurosci , 4, 251-‐259.

VI. Remerciements Je tiens à remercier les personnes qui m’ont aidé et soutenu pendant cette année passionnante: Le Professeur Laurent COHEN pour sa patience, sa disponibilité, ses conseils avisés et sa gentillesse qui ont fait de ce stage un véritable plaisir. Le Docteur Lionel NACCACHE également pour sa gentillesse et ses excellentes idées. Jean-Rémi KING pour son soutien, ses conseils et sa présence permanente à côté de moi. Gabriel GARCIA, Fabien VINCKIER et Emilie QIAO pour leurs présentations à l’Ecole de l’Inserm qui m’ont donné envie de faire un master de sciences cognitives. Les membres du laboratoire de Neuropsychologie et de Neuroimagerie et en particulier Marcin SZWED, Felipe PEGADO, Claire SERGENT, Frédéric FAUGERAS et Kimihiro NAKAMURA. Les membres du laboratoire Unicog, en particulier le Professeur Stanislas DEHAENE pour ses conseils, Christophe PALLIER pour ses éclaircissements techniques et Antoinette JOBERT qui a su faire preuve beaucoup de patience et de compétence pour la réservation des créneaux IRM. Toute l’équipe du Cogmaster pour cette formation très enrichissante. Toute l’équipe de l’Ecole de l’Inserm et en particulier le Professeur Jean-Claude CHOTTARD et le Professeur Philippe ASCHER pour leur soutien indéfectible. Ma famille pour leur présence et leur affection. Mes amis et mon colocataire pour leur soutien. Et enfin les nombreux sujets qui ont accepté de participer à mes expériences.
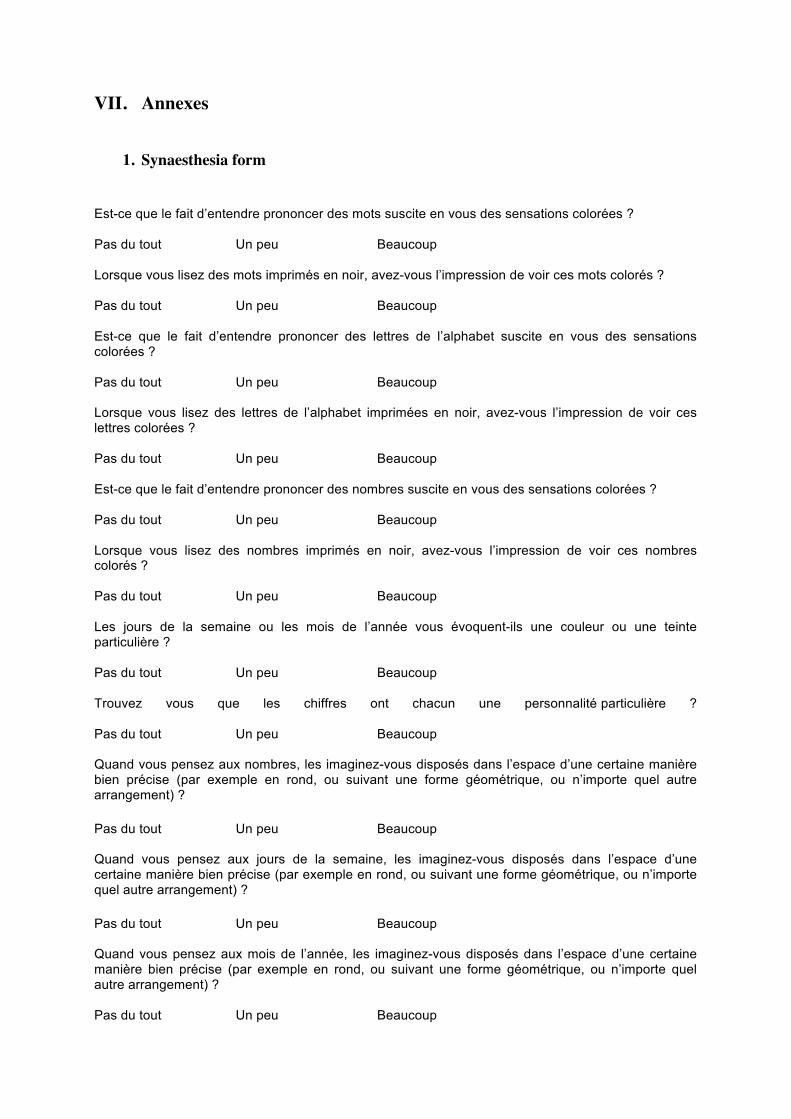
VII. Annexes
1. Synaesthesia form Est-ce que le fait d’entendre prononcer des mots suscite en vous des sensations colorées ? Pas du tout Un peu Beaucoup Lorsque vous lisez des mots imprimés en noir, avez-vous l’impression de voir ces mots colorés ? Pas du tout Un peu Beaucoup Est-ce que le fait d’entendre prononcer des lettres de l’alphabet suscite en vous des sensations colorées ? Pas du tout Un peu Beaucoup Lorsque vous lisez des lettres de l’alphabet imprimées en noir, avez-vous l’impression de voir ces lettres colorées ? Pas du tout Un peu Beaucoup Est-ce que le fait d’entendre prononcer des nombres suscite en vous des sensations colorées ? Pas du tout Un peu Beaucoup Lorsque vous lisez des nombres imprimés en noir, avez-vous l’impression de voir ces nombres colorés ? Pas du tout Un peu Beaucoup Les jours de la semaine ou les mois de l’année vous évoquent-ils une couleur ou une teinte particulière ? Pas du tout Un peu Beaucoup Trouvez vous que les chiffres ont chacun une personnalité particulière ? Pas du tout Un peu Beaucoup Quand vous pensez aux nombres, les imaginez-vous disposés dans l’espace d’une certaine manière bien précise (par exemple en rond, ou suivant une forme géométrique, ou n’importe quel autre arrangement) ? Pas du tout Un peu Beaucoup Quand vous pensez aux jours de la semaine, les imaginez-vous disposés dans l’espace d’une certaine manière bien précise (par exemple en rond, ou suivant une forme géométrique, ou n’importe quel autre arrangement) ? Pas du tout Un peu Beaucoup Quand vous pensez aux mois de l’année, les imaginez-vous disposés dans l’espace d’une certaine manière bien précise (par exemple en rond, ou suivant une forme géométrique, ou n’importe quel autre arrangement) ? Pas du tout Un peu Beaucoup
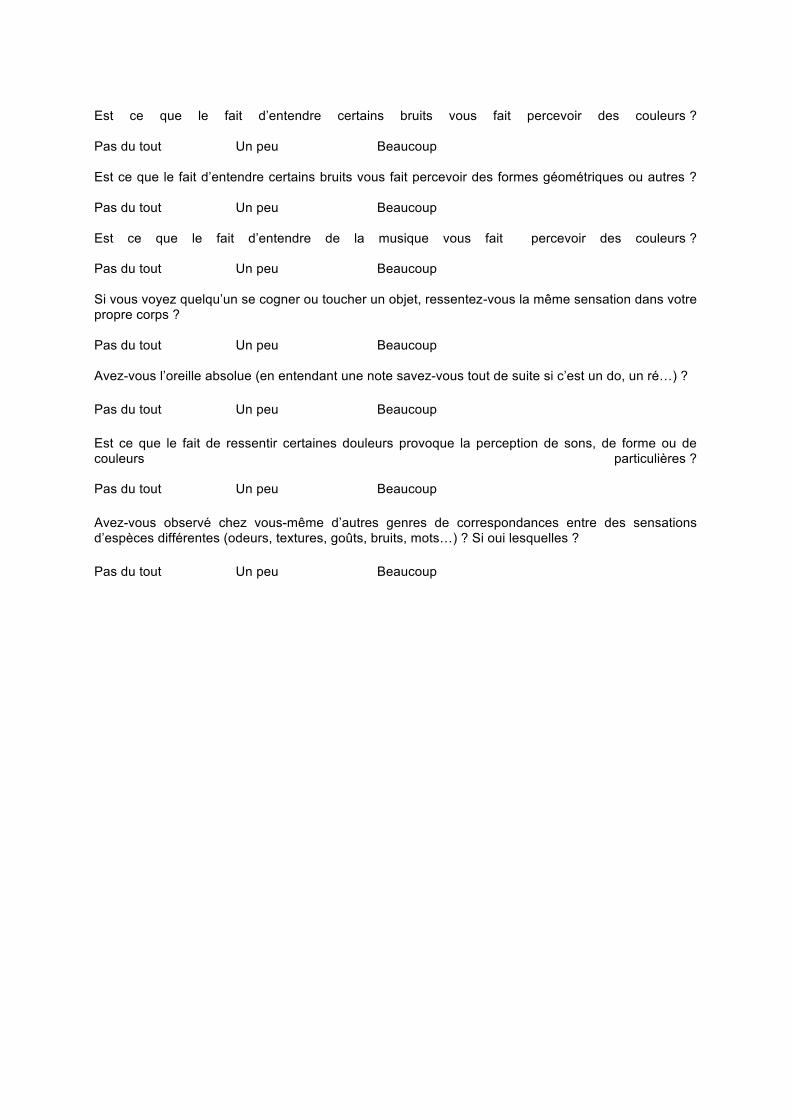
Est ce que le fait d’entendre certains bruits vous fait percevoir des couleurs ? Pas du tout Un peu Beaucoup Est ce que le fait d’entendre certains bruits vous fait percevoir des formes géométriques ou autres ? Pas du tout Un peu Beaucoup Est ce que le fait d’entendre de la musique vous fait percevoir des couleurs ? Pas du tout Un peu Beaucoup Si vous voyez quelqu’un se cogner ou toucher un objet, ressentez-vous la même sensation dans votre propre corps ? Pas du tout Un peu Beaucoup Avez-vous l’oreille absolue (en entendant une note savez-vous tout de suite si c’est un do, un ré…) ? Pas du tout Un peu Beaucoup Est ce que le fait de ressentir certaines douleurs provoque la perception de sons, de forme ou de couleurs particulières ? Pas du tout Un peu Beaucoup Avez-vous observé chez vous-même d’autres genres de correspondances entre des sensations d’espèces différentes (odeurs, textures, goûts, bruits, mots…) ? Si oui lesquelles ? Pas du tout Un peu Beaucoup