Embed Size (px)
Citation preview

Exploring the Geographical RelationsBetween Social Media and Flood Phenomenato Improve Situational Awareness
A Study About the River Elbe Flood in June 2013
Benjamin Herfort, João Porto de Albuquerque, Svend-Jonas Schelhornand Alexander Zipf
Abstract Recent research has shown that social media platforms like twitter canprovide relevant information to improve situation awareness during emergencies.Previous work is mostly concentrated on the classification and analysis of tweetsutilizing crowdsourcing or machine learning techniques. However, managing thehigh volume and velocity of social media messages still remains challenging. Inorder to enhance information extraction from social media, this chapter presents anew approach that relies upon the geographical relations between twitter data andflood phenomena. Our approach uses specific geographical features like hydrologicaldata and digital elevation models to prioritize crisis-relevant twitter messages. Weapply this approach to examine the River Elbe Flood in Germany in June 2013.The results show that our approach based on geographical relations can enhanceinformation extraction fromvolunteered geographic information, thus being valuablefor both crisis response and preventive flood monitoring.
Keywords Social media · Volunteered geographic information · Disastermanagement · Flood · Situation awareness · Emergency management
1 Introduction
Managing an emergency puts high demands on authorities and crisis managementorganizations. Collecting as much information as possible about the unfolding crisisand making sense of that information in a timely manner is critical to subsidise reliefefforts. One of the main challenges in emergency management is thus achieving
B. Herfort · J. P. de Albuquerque · S.-J. Schelhorn · A. ZipfChair of GIScience, Heidelberg University, Heidelberg, Germany
J. P. de Albuquerque (B)
Department of Computer Systems, ICMC, University of Sao Paulo, Sao Carlos, Brazile-mail: [email protected]
J. Huerta et al. (eds.), Connecting a Digital Europe Through Location and Place, 55Lecture Notes in Geoinformation and Cartography, DOI: 10.1007/978-3-319-03611-3_4,© Springer International Publishing Switzerland 2014
56 B. Herfort et al.
situation awareness, which can be defined as “the perception of elements in theenvironment within a volume of time and space, the comprehension of their meaning,and the projection of their status in the near future” (Endsley 1995).
Social media platforms like Twitter, Flicker or Instagram are growingly used bycrisis-affected individuals. Hence, they are used to share local knowledge that can bea vital source of crisis-relevant information. Although this topic has been a subjectof research in the recent years (Vieweg et al. 2010; Kongthon et al. 2012; Sakakiet al. 2010; Terpstra et al. 2012; Imran et al. 2013), the process of collecting andanalysing social media information has to be further improved and evaluated to offerbetter insights and information that really contributes to situation awareness.
Scientific research on crisis management and social media has concentrated onfiltering and classifying microblog posts, e.g. tweets, applying crowdsourcing (i.e.manual message classification by volunteers) (Gao et al. 2011; Rogstadius et al.2011; Lofi et al. 2012) or natural language processing and machine learning (Sakakiet al. 2010; Terpstra et al. 2012; Imran et al. 2013). Nevertheless, a crucial prob-lem remains unsolved. During a crisis, the volume and the velocity of posted tweetsare extremely high. Distinguishing messages that contain critical information fromoff-topic messages in an efficient and reliable way is the basic requirement forany feasible approach for dealing with the information overload. However, exist-ing approaches are only partially successful in this regard.
The use of existing and well-studied geographical models about natural hazardshold a non-exploited potential to tackle the open problem of handling social mediainformation during a crisis. In the end, this could lead to crisis-relevant and actionableinformation, thus contributing to situation awareness and better decision-making.There is initial work in this field (e.g. Triglav-Cekada and Radovan 2013), but thisis not as comprehensively studied as other approaches. This chapter thus seeks tocontribute with a new approach for leveraging existing geographical knowledge ofthe flood phenomena in order to improve the usefulness of VGI in crisismanagement.
In the pursuit of this goal, we apply a geographical approach to prioritize crisis-relevant information from social media. Our methodology is based on specific geo-graphical relations of flood phenomena, for example hydrological features and mod-els of terrain and affected areas. Furthermore, we conduct a case study for the RiverElbe Flood in Germany in June 2013 to validate our approach. Combining informa-tion from tweets, water level measurements and digital elevation models, we thusseek to answer the three research questions as follows.
• RQ1. Does the spatiotemporal distribution of flood-related tweets match the spa-tiotemporal distribution of the flood phenomenon?
• RQ2. Does the spatial distribution of flood-related tweets differ dependent on theircontent?
• RQ3. Is distance to flood phenomena a useful parameter to prioritize social mediamessages in order to improve situation awareness?
The remainder of this chapter is organized as follows. In Sect. 2, related workon social media and volunteered geographic information in the context of crisis
Exploring the Geographical Relations Between Social Media 57
management is presented. In Sect. 3 we present our research approach. Informationabout the case study and the different datasets we employed is given in Sect. 4. InSects. 5 and 6 we present the methodology and the results of our study. Finally,Sect. 7 concludes the chapter by discussing our findings and possibilities for futurework.
2 State of the Art
Social media is significantly influencing social interactions. Social media is a “dis-ruptive technology” (Hiltz and Plotnick 2013), especially because it provides analternative to traditional authoritative information from governmental institutionslike civil protection or mapping agencies (Goodchild and Glennon 2010). The abil-ity to communicate and share geographical data through simple, freely-available toolsthat can be quickly learnt without demanding professional or scientific backgroundis key to this development. This is described by the terms Neography, VolunteeredGeographic Information (VGI) and Crowdsourcing (Goodchild and Glennon 2010;Gao et al. 2011; Hudson-Smith et al. 2009).
Social media has also become a potentially useful tool during crises. Citizensadapted social media applications like social sites, document management, multime-dia sharing, microblogging and geo-location systems to suit their crisis managementneeds. Twitter, for instance, enables victims to quickly connect with the rest of theworld, and so can help to minimize the effects of catastrophes and supports disas-ter relief (Kaewkitipong et al. 2012). On the one hand, social media offers a newcommunication channel for government agencies to reach the media and informingaffected citizens (Chatfield and Brajawidagda 2013). Therefore, the pervasive useof social media causes significant implications for emergency management practiceand policy (Palen 2008).
Many studies have examined the way of extracting crisis-relevant informationfrom social media messages (e.g. Yin et al. 2012; MacEachren et al. 2011; Imranet al. 2013). In particular, scientific research focused on twitter messages, so calledtweets, using either crowdsourcing or machine learning techniques. Sakaki et al.(2010) investigated the real-time nature of twitter and were able to detect crisis-related twitter messages using a support vector machine (SVM). Kongthon et al.(2012) analysed twitter messages about the flood that affected Thailand in 2011,concluding that, due to its up-to-the-minute character, analysis and classification oftwitter messages can be useful in coordinating resources and efforts and in preparingand planning for disaster relief. Imran et al. (2013) tested an automatic method forfiltering crisis-relevant social media messages vis-à-vis a crowdsourcing approach,i.e. based on manual classification by volunteers. Their results show that machinelearning canbeutilized to extract structured information fromunstructured text-basedtwitter messages.
Vieweg et al. (2010) analysed twitter messages referring to the Red River Floodsin spring 2009. Graham et al. (2012) analysed the use of Twitter during the UK
58 B. Herfort et al.
floods in November 2012, by mapping geo-referenced tweets mentioning the words“flood” and visually checking whether the distribution of tweets corresponds torainfall data and official flood alerts. The authors conclude that the digital trails oftwitter messages are mostly matched to official data on floods and metereologicalprecipitation. Triglav-Cekada and Radovan (2013) gathered information about theNovember 2012 floods in Slovenia from VGI. Their research shows that volunteeredimage gathering is a comparable alternative to satellite imagery.
Furthermore, there are several studies that examine the use of social media as atool for improving situation awareness during crises (Yin et al. 2012). The so-called“crisis maps”, as exemplified by the Ushahidi platform (Okolloh 2009), are the mostrecent entrants to the social media field (Goolsby 2010). Meier (2012) compares thevalue that live crisis maps can provide for situation awareness with a bird’s-eye viewof an unfolding event. MacEachren et al. (2011) develop and implement tools forvisually-enabled information foraging and sense-making.
Most of the extant research is focused on analysing data from social media asa stand-alone information source, although situation awareness should arise fromthe combination of different data sources. Gao et al. (2011) state that scientific datacould augment VGI to provide more detailed insights on information requirementsand needs during a disaster. The integration and fusion with official and scientificdata sources could lead to progress in validating and verifying information gatheredfrom social media and thus improve the fitness-for-use of VGI as a source for crisisrelevant information. This is the direction pursued in the present study, which isapplied to the case of the floods in the river Elbe basin in Germany in 2013.
3 Research Approach
This chapter addresses the problem of enhancing the extraction of useful informationfrom VGI and social media for improving situation awareness during emergencies.In contrast to the approaches reviewed in the previous section, which resort to eithercrowdsourcing or machine learning, our approach is based on the geographical rela-tions between flood phenomena and social media messages.
Inspired by Tobler’s first law of geography (Tobler 1970), we assume that nearthings are more related than distant things. Regarding crisis events, this impliesthat the spatiotemporal characteristics of the catastrophe affect the spatiotemporalcharacteristics of VGI and social media messages. As such, our approach seeksto leverage existing knowledge about the spatiotemporal characteristics of floodphenomena to improve information extraction from social media. In doing this, thehypothesis posed here is that social media messages which are closer to the floodedareas are ‘more related’ to the unfolding event, thus being more useful for improvingsituation awareness.
Our approach explores the relations between spatial information from twittermes-sages and the knowledge about flood phenomena both from hydrology and official

Exploring the Geographical Relations Between Social Media 59
Fig. 1 Research approach
sensor data. The goal is to test our hypothesis that the distance to flood phenomenais a useful resource to prioritize messages for improving situation awareness.
Figure1 schematically depicts our approach. It is divided into three main com-ponents: (1) gathering information on flood phenomena, i.e. flood-affected regions;(2) gathering information from social media, i.e. georeferenced twitter messages; (3)analysing the geographical relations between the information on flood phenomena(1) and social media messages (2) to assess the usefulness of tweets.
In this chapter, this approach is applied to analyse the use of Twitter during theRiver Elbe flood in 2013.
4 Description of the Case Study and Datasets
This section provides a description of our case study followed by an explanation ofthe datasets we employed.

60 B. Herfort et al.
4.1 River Elbe Flood
In the period from 30thMay to 3rd June 2013 extreme heavy rain affected large partsof eastern and central Europe. The distribution of precipitation in the basin of therivers Elbe, Moldau and Saale reached values two to three times higher than that foran average June. This is equivalent to a centennial probability of occurrence. The soilwas already highly saturated at this time due to awet climate inMay 2013. Therefore,the heavy rain rapidly resulted in surface runoff causing the severe flood situation.The monthly average flow was three to four times higher than the longstandingaverage and in some places even higher than the higher value ever recorded.
The same finding follows from the examination of the water level data. Somegauging stations measured values that were never recorded before. For instance,at “Magdeburg-Strombrücke” the water level reached 7.46m. That is an increaseby more than 70cm compared to the former maximum. Another characteristic ofthe flood was the huge stretch of the flood wave. The alert phase 4 (the highest inGermany) that was announced by the government lasted for 6days along the riversElbe, Mulde, Elster and Neiße in Saxony and Saxony-Anhalt. This implies that dikesand dams were at risk of destruction for almost a whole week. The water levels ingeneral did not return to their normal state until 16th of June 2013 (SächsischesLandesamt für Umwelt and Landwirtschaft und Geologie 2013).
4.2 Datasets
The Twitter dataset contains of 60.524 geo-referenced short text messages (“tweets”)within the territory of Germany. Each message consists of 140 Unicode charactersat a maximum. Besides the actual text message string every tweet contains severaladditional fields representing metadata, such as a UTC time when the tweet wascreated, entities like hashtags (i.e. keywords preceded by #) and URLs, as well asan integer representation of the unique ID or information about the user who postedthe tweet. The geographic location of a tweet is described in the metadata field“coordinates”. The inner coordinates array is formatted as geoJSON.1
Users can geo-reference messages in Twitter either manually (e.g. by entering thename of a city in the field “location”) or automatically via a client application thataccess the coordinates of a GPS receiver. Unfortunately, only a small fraction (3 %is the estimated average) of tweets are currently georeferenced by users, and thisconsists of a limitation for analysis approaches based on the location like the currentstudy.
Twitter offers a number of Application Programming Interfaces (APIs), whichcan be used for automatically recovering data. For this study, we queried the Twitterstreaming API using the 1 % garden hose access, during the period from 08th June2013 1.30 pm to 10th June 2013 midnight, and collected every geo-referenced tweet
1 https://dev.twitter.com/docs/platform-objects/tweets
Exploring the Geographical Relations Between Social Media 61
within a bounding box covering Germany. Afterwards we further filtered tweets bytheir location and excluded those outside the territory of Germany.
In addition to the twitter dataset, we also gathered official water level data from54 monitoring stations along the rivers Elbe and Saale provided by the GermanFederal Waterways and Shipping Administration and the German Federal Institutefor Hydrology through the German online gauge system “Pegel Online” via webfeature service.2 In this manner, our second dataset includes information about thelocation of each measurement station, the current water level, the average floodwater level over a time period from 1st November 2000 to 31st October 2010, andthe highest water level ever recorded. The water level measurements were providedin a 15-minute resolution for the whole period analysed.
As a third dataset, we used HydroSHEDS drainage direction information derivedfrom elevation data of the Shuttle Radar Topography Mission (SRTM) at 3 arc-second resolution in order to compute hydrographical features of the river Elbe basin.This includes information about flow accumulation, stream network and catchmentboundaries (Lehner et al. 2008).
5 Methodology
This section describes the detailed methodology used in this chapter, by further elab-orating the procedures used to apply the approach described in Sect. 3 and schemat-ically depicted in Fig. 1. The next section explains the steps conducted in preparingthe datasets employed (Sect. 4.2), followed in Sect. 5.2 by the description of theanalytical procedures used.
5.1 Data Preparation
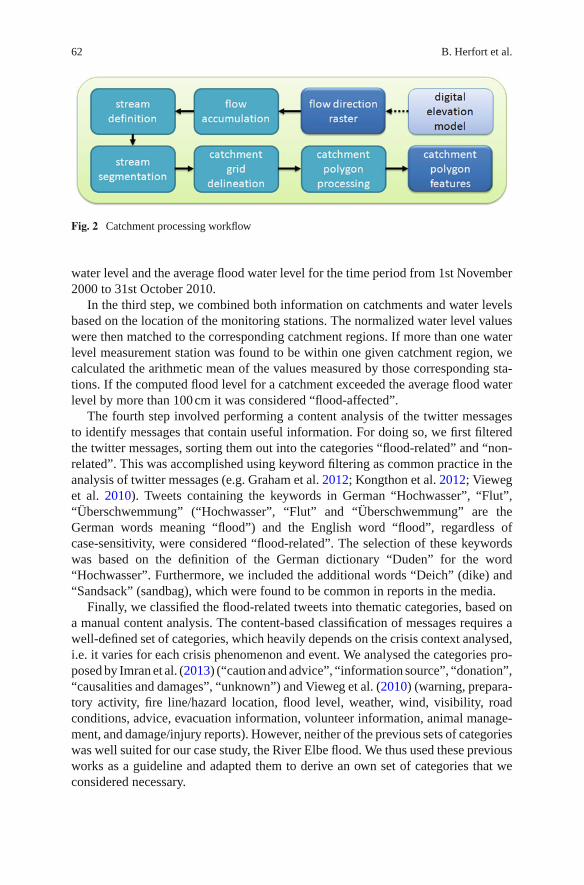
The first step of our data preparation consisted of defining the flood-affected regionsbased on the digital elevation model (for catchment areas) and on official data (riverwater levels). Starting with the HydroSHEDS flow direction raster, based on SRTMelevation data, we computed catchment polygon features for each location wheretwo streams flow together using the ArcHydro Toolset for ArcGIS. The detailedworkflow is shown in Fig. 2. This way of proceeding guarantees that any cell withina catchment drains into the same stream. Catchments therefore contain no more thanone stream by definition.
In the next step, we analysed the water level data collected from 54 water levelmeasurement stations along the rivers Elbe and Saale. To assess the severity of theflood at the gauge station, we computed the difference between the daily maximum
2 http://www.pegelonline.wsv.de/webservice/wfsAktuell
62 B. Herfort et al.
Fig. 2 Catchment processing workflow
water level and the average flood water level for the time period from 1st November2000 to 31st October 2010.
In the third step, we combined both information on catchments and water levelsbased on the location of the monitoring stations. The normalized water level valueswere then matched to the corresponding catchment regions. If more than one waterlevel measurement station was found to be within one given catchment region, wecalculated the arithmetic mean of the values measured by those corresponding sta-tions. If the computed flood level for a catchment exceeded the average flood waterlevel by more than 100cm it was considered “flood-affected”.
The fourth step involved performing a content analysis of the twitter messagesto identify messages that contain useful information. For doing so, we first filteredthe twitter messages, sorting them out into the categories “flood-related” and “non-related”. This was accomplished using keyword filtering as common practice in theanalysis of twitter messages (e.g. Graham et al. 2012; Kongthon et al. 2012; Vieweget al. 2010). Tweets containing the keywords in German “Hochwasser”, “Flut”,“Überschwemmung” (“Hochwasser”, “Flut” and “Überschwemmung” are theGerman words meaning “flood”) and the English word “flood”, regardless ofcase-sensitivity, were considered “flood-related”. The selection of these keywordswas based on the definition of the German dictionary “Duden” for the word“Hochwasser”. Furthermore, we included the additional words “Deich” (dike) and“Sandsack” (sandbag), which were found to be common in reports in the media.
Finally, we classified the flood-related tweets into thematic categories, based ona manual content analysis. The content-based classification of messages requires awell-defined set of categories, which heavily depends on the crisis context analysed,i.e. it varies for each crisis phenomenon and event. We analysed the categories pro-posed by Imran et al. (2013) (“caution and advice”, “information source”, “donation”,“causalities and damages”, “unknown”) and Vieweg et al. (2010) (warning, prepara-tory activity, fire line/hazard location, flood level, weather, wind, visibility, roadconditions, advice, evacuation information, volunteer information, animal manage-ment, and damage/injury reports). However, neither of the previous sets of categorieswas well suited for our case study, the River Elbe flood. We thus used these previousworks as a guideline and adapted them to derive an own set of categories that weconsidered necessary.

Exploring the Geographical Relations Between Social Media 63
Table 1 Thematic categories based on content analysis
Category Description
“Volunteer actions” Tweets related to flood combating(VA) Example: “Keine Ahnung, bin auf der Sandsackfüllstation in der
Listemannstr. #Magdeburg #Hochwasser”(“I have no clue. I’m at the sandbag filling point at Listemann-street.
#Magdeburg #flood”)“Media” (M) Tweets related to media coverage, politicians and political events
Example: “schaue mir das Hochwasser am Fernseher an. schrecklich.und dann gibt es auch noch Plünderer. unglaublich. #SpiegelTV”
(“Watching the flood on TV, horrible, there are even looters,unbelievable. ‘SpiegelTV”)
“Traffic conditions” Tweets related to road or rail traffic, traffic jams or other restraints(TC) Example: “Der #ice644 von Berlin nach Köln/Bonn soll übrigens
fahren—aktuell aber zehn Minuten Verspätung. #hochwasser”(“By the way, the ice644 will go from Berlin to Cologne/Bonn, current
delay 10min #flood”)“Flood level” (FL) Tweets related to hydrological or physical measurements, not only
quantitative (“719cm”) but also qualitative information (“waterlevel sinks”)
Example: “aktuelles Foto aus #Lostau: 08.30 Uhr Pegel MDStrombrücke: 719 cm #hochwasser http://t.co/uv3NkMMcIw”
(“Latest photos from #Lostau: 08.30 am water level MD Strombrücke719 cm #flood http://t.co/uv3NkMMcIw”)
“Other” (O) Tweets not related to any of the previous categoriesExample: “Ich wünsche den #Hochwasser betroffenen weiterhin alles
Gute, und trotz alledem allen einen schönen #Sonntag”(To all #flood-affected people: Let’s hope for the best. Despite all that,
have a nice #Sunday”)
Wegroupedflood-related twittermessages intofive categories: “volunteer actions”(VA), “media” (M), “traffic conditions” (TC), “flood level” (FL) and “other” (O).Table1 presents a detailed description of the categories and their characteristics.
5.2 Data Analysis Procedure
The analysis of our data was guided by our three research questions (see Sect. 1). Foranswering the first research question, we sought to determine whether the spatiotem-poral distribution of flood-related tweets matches the spatiotemporal distribution ofthe flood phenomenon. For doing this, we first generated a density map by executinga kernel density function using ArcGIS software, in order to allow a visual analy-sis of the spatial distribution of tweets for the time period analysed (8th–10th June2013). In the following step, we calculated the distance between each tweet and the
64 B. Herfort et al.
nearest flood-affected catchment. In order to test if flood-related tweets are closer tothe flooded areas than non-related tweets, we computed and compared the averagedistance of the two groups (flood-related tweets versus non-related tweets) using anindependent sample t-test.
For answering our second research question, i.e. whether the spatial distributionof flood-related tweets differ depending on their content, we again firstly performeda visual analysis by producing density maps using the kernel density function. Next,we calculated the average distance for each of the categories of Table1 and performeda post-hoc analysis (LSD) to test the mean distances depending on the categorizationfor statistical significance.
The final step of our study consisted of answering our third and overall researchquestion by assessing to what extend the distance of messages to flood phenomenais a useful parameter for prioritizing social media messages in order to improvesituation awareness. For doing this, we verified if the categories whose messages arecloser to flood-affected areas are more useful to improve situation awareness than thecategories with more distant messages. In this analysis, we considered social mediamessages that contain information which is not available through other sources asbeing more useful to improve situation awareness. As such, the criteria for definingthe usefulness of social media messages that we adopt consists of the capacity toenrich and complement other information sources.
6 Results
The results of our study are presented in the following sections. The next sectionprovides an exploratory description of the data collated, serving as a basis for thedetailed analysis based on our research questions (Sect. 5.2).
6.1 Data Description
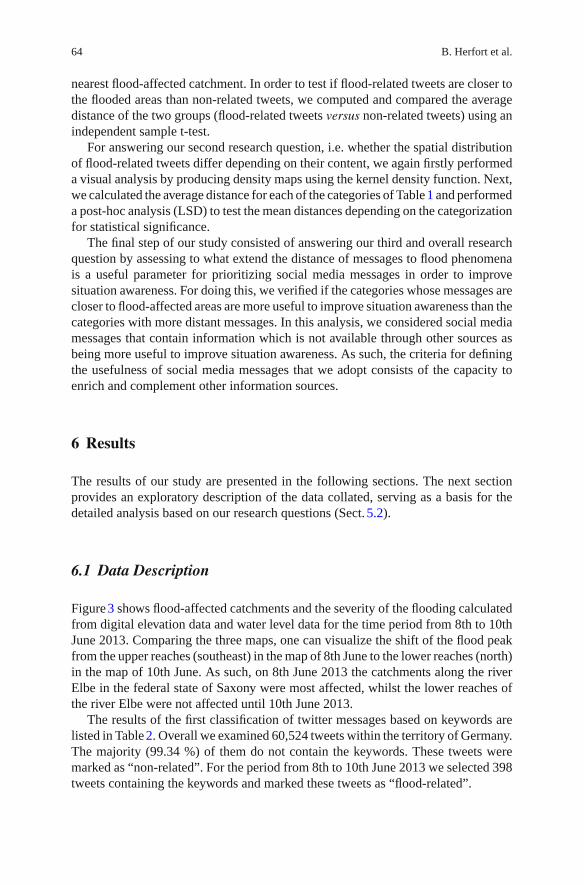
Figure3 shows flood-affected catchments and the severity of the flooding calculatedfrom digital elevation data and water level data for the time period from 8th to 10thJune 2013. Comparing the three maps, one can visualize the shift of the flood peakfrom the upper reaches (southeast) in the map of 8th June to the lower reaches (north)in the map of 10th June. As such, on 8th June 2013 the catchments along the riverElbe in the federal state of Saxony were most affected, whilst the lower reaches ofthe river Elbe were not affected until 10th June 2013.
The results of the first classification of twitter messages based on keywords arelisted in Table2. Overall we examined 60,524 tweets within the territory of Germany.The majority (99.34 %) of them do not contain the keywords. These tweets weremarked as “non-related”. For the period from 8th to 10th June 2013 we selected 398tweets containing the keywords and marked these tweets as “flood-related”.
Exploring the Geographical Relations Between Social Media 65
Fig. 3 Spatiotemporal distribution of flood-affected catchments based on official water levelinformation
Table 2 Classification of twitter messages using keyword-based filtering
Period 8th–10th June 2013 8th June 2013 9th June 2013 10th June 2013
# all tweets 60,524 (100 %) 14,286 (100 %) 23,093 (100 %) 23,145 (100 %)# flood-related tweets 398 (0.66 %) 75 (0.52 %) 197 (0.85 %) 126 (0.54 %)# non-related tweets 60,126 (99.34 %) 14,211 (99.55 %) 22,296 (99.15%) 23,019 (99.46 %)
Table 3 Classification of twitter messages based on content analysis
Period 8th–10th June 2013 8th June 2013 9th June 2013 10th June 2013
# all tweets 398 (100 %) 75 (100 %) 197 (100 %) 126 (100 %)# VA 113 (28.39 %) 24 (32.00 %) 59 (29.95 %) 30 (23.81 %)# M 57 (14.32 %) 8 (10.67 %) 30 (15.23 %) 19 (15.08 %)# TC 30 (7.53 %) 4 (5.33 %) 8 (4.06 %) 18 (14.29 %)# FL 32 (8.04 %) 5 (6.67 %) 15 (7.61 %) 12 (9.52 %)# O 126 (31.66 %) 34 (45.33 %) 85 (43.15 %) 47 (37.30 %)
Table3 shows the distribution of flood-related tweets based on content classifica-tion. More than a quarter (28.39 %) of all flood-related tweets contain informationreferring to volunteer actions, whereas flood-related tweets referring to media, trafficconditions or flood level reach a much less share. About 30 % of the flood-relatedtweets were classified as “other” and therefore do not contain any viable information.

66 B. Herfort et al.
Fig. 4 Spatial distribution of flood-related and non-related tweets
6.2 Analysis
The analysis of the results achieved is presented as follows by addressing each ofour three research questions in turn.
6.2.1 RQ1: Does the Spatiotemporal Distribution of Flood-Related TweetsMatch the Spatiotemporal Distribution of the Flood Phenomenon?
Firstly, we examined the spatial distribution of flood-related and non-related twittermessages to review whether they follow the spatiotemporal distribution of the floodphenomenon. Figure4 shows the density of tweets depending on keyword classifica-tion. Flood related tweets (on the left side) show peaks in the regions of Magdeburg,Berlin and Halle. Overall flood-related tweets appear only in a few parts of Ger-many. Non-related tweets (on the right side) concentrate in dense populated regions,e.g. urban areas like Berlin, Hamburg, Munich and the Ruhr area. The tweets coveralmost all of Germany, except for some regions in the federal states of Brandenburgand Mecklenburg-Hither Pomerania.
Comparing the spatial distribution of flood-related tweets to the spatial distributionof flood-affected catchments (see Figs. 3 and 4) one can notice similarities the firstlook. Not the location of all flood-related tweets, but at least of a considerable amountof them does correspond to the location of flood-affected catchments. To further
Exploring the Geographical Relations Between Social Media 67
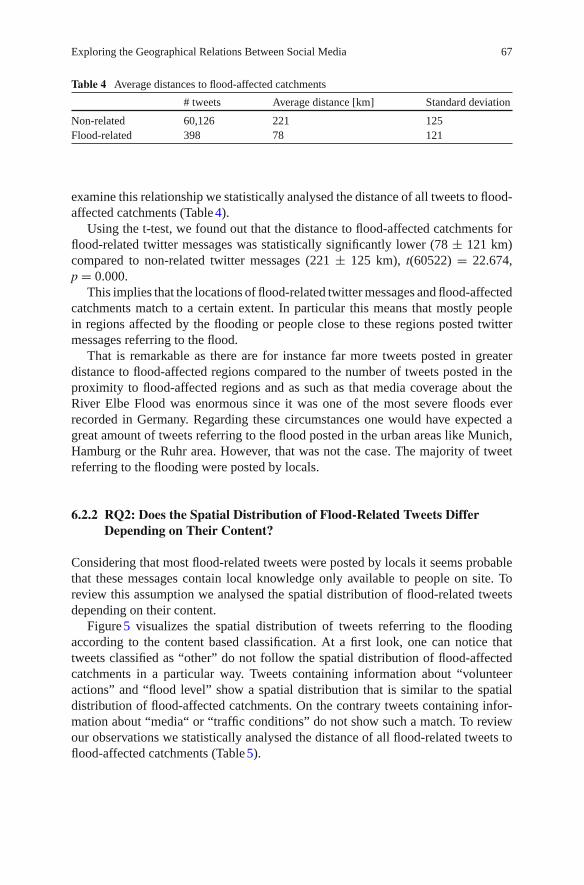
Table 4 Average distances to flood-affected catchments
# tweets Average distance [km] Standard deviation
Non-related 60,126 221 125Flood-related 398 78 121
examine this relationship we statistically analysed the distance of all tweets to flood-affected catchments (Table4).
Using the t-test, we found out that the distance to flood-affected catchments forflood-related twitter messages was statistically significantly lower (78 ± 121 km)compared to non-related twitter messages (221 ± 125 km), t(60522) = 22.674,p = 0.000.
This implies that the locations of flood-related twittermessages and flood-affectedcatchments match to a certain extent. In particular this means that mostly peoplein regions affected by the flooding or people close to these regions posted twittermessages referring to the flood.
That is remarkable as there are for instance far more tweets posted in greaterdistance to flood-affected regions compared to the number of tweets posted in theproximity to flood-affected regions and as such as that media coverage about theRiver Elbe Flood was enormous since it was one of the most severe floods everrecorded in Germany. Regarding these circumstances one would have expected agreat amount of tweets referring to the flood posted in the urban areas like Munich,Hamburg or the Ruhr area. However, that was not the case. The majority of tweetreferring to the flooding were posted by locals.
6.2.2 RQ2: Does the Spatial Distribution of Flood-Related Tweets DifferDepending on Their Content?
Considering that most flood-related tweets were posted by locals it seems probablethat these messages contain local knowledge only available to people on site. Toreview this assumption we analysed the spatial distribution of flood-related tweetsdepending on their content.
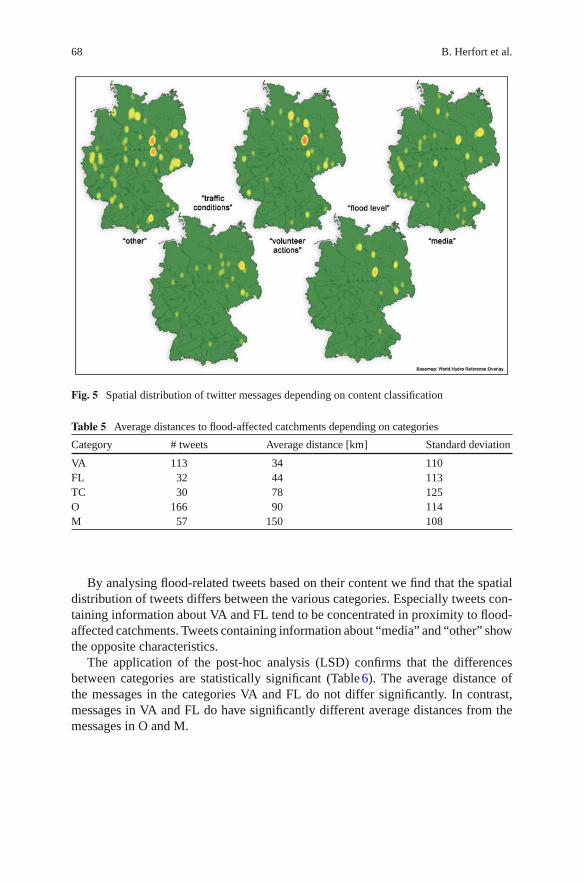
Figure5 visualizes the spatial distribution of tweets referring to the floodingaccording to the content based classification. At a first look, one can notice thattweets classified as “other” do not follow the spatial distribution of flood-affectedcatchments in a particular way. Tweets containing information about “volunteeractions” and “flood level” show a spatial distribution that is similar to the spatialdistribution of flood-affected catchments. On the contrary tweets containing infor-mation about “media“ or “traffic conditions” do not show such a match. To reviewour observations we statistically analysed the distance of all flood-related tweets toflood-affected catchments (Table5).
68 B. Herfort et al.
Fig. 5 Spatial distribution of twitter messages depending on content classification
Table 5 Average distances to flood-affected catchments depending on categories
Category # tweets Average distance [km] Standard deviation
VA 113 34 110FL 32 44 113TC 30 78 125O 166 90 114M 57 150 108
By analysing flood-related tweets based on their content we find that the spatialdistribution of tweets differs between the various categories. Especially tweets con-taining information about VA and FL tend to be concentrated in proximity to flood-affected catchments. Tweets containing information about “media” and “other” showthe opposite characteristics.
The application of the post-hoc analysis (LSD) confirms that the differencesbetween categories are statistically significant (Table6). The average distance ofthe messages in the categories VA and FL do not differ significantly. In contrast,messages in VA and FL do have significantly different average distances from themessages in O and M.
Exploring the Geographical Relations Between Social Media 69
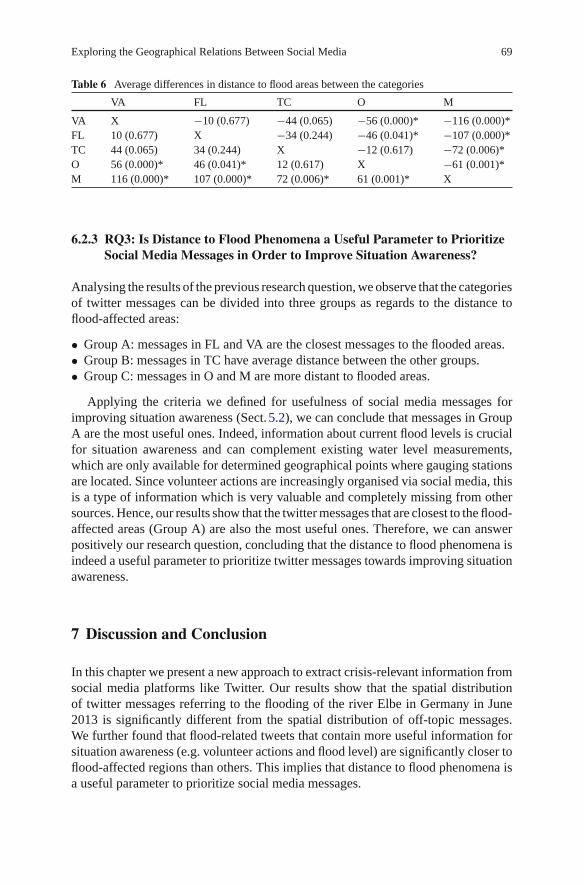
Table 6 Average differences in distance to flood areas between the categories
VA FL TC O M
VA X −10 (0.677) −44 (0.065) −56 (0.000)* −116 (0.000)*FL 10 (0.677) X −34 (0.244) −46 (0.041)* −107 (0.000)*TC 44 (0.065) 34 (0.244) X −12 (0.617) −72 (0.006)*O 56 (0.000)* 46 (0.041)* 12 (0.617) X −61 (0.001)*M 116 (0.000)* 107 (0.000)* 72 (0.006)* 61 (0.001)* X
6.2.3 RQ3: Is Distance to Flood Phenomena a Useful Parameter to PrioritizeSocial Media Messages in Order to Improve Situation Awareness?
Analysing the results of the previous research question,we observe that the categoriesof twitter messages can be divided into three groups as regards to the distance toflood-affected areas:
• Group A: messages in FL and VA are the closest messages to the flooded areas.• Group B: messages in TC have average distance between the other groups.• Group C: messages in O and M are more distant to flooded areas.
Applying the criteria we defined for usefulness of social media messages forimproving situation awareness (Sect. 5.2), we can conclude that messages in GroupA are the most useful ones. Indeed, information about current flood levels is crucialfor situation awareness and can complement existing water level measurements,which are only available for determined geographical points where gauging stationsare located. Since volunteer actions are increasingly organised via social media, thisis a type of information which is very valuable and completely missing from othersources. Hence, our results show that the twittermessages that are closest to the flood-affected areas (Group A) are also the most useful ones. Therefore, we can answerpositively our research question, concluding that the distance to flood phenomena isindeed a useful parameter to prioritize twitter messages towards improving situationawareness.
7 Discussion and Conclusion
In this chapter we present a new approach to extract crisis-relevant information fromsocial media platforms like Twitter. Our results show that the spatial distributionof twitter messages referring to the flooding of the river Elbe in Germany in June2013 is significantly different from the spatial distribution of off-topic messages.We further found that flood-related tweets that contain more useful information forsituation awareness (e.g. volunteer actions and flood level) are significantly closer toflood-affected regions than others. This implies that distance to flood phenomena isa useful parameter to prioritize social media messages.

70 B. Herfort et al.
This approach to leverage geographical relations to prioritize social media mes-sages can make a contribution for both research and practice. One potential use ofour approach is for enhancing other approaches to classification of social mediamessages. This could be accomplished by using the prioritization according to geo-graphical relations produced by our approach as weights in the algorithms of existingmachine learning techniques. Moreover, the proximity to disaster hotspots could beused for ranking messages to be processed by volunteers in crowdsourcing deploy-ments.
The generality of the results presented here should be investigated by applyingour approach in similar analyses of other flooding events. Future work should alsoconcentrate on refining the approach by including information from other socialmedia platforms (e.g. Instagram or Flickr). The integration of other official datasets,e.g. precipitation data or satellite images, is another avenue for future work towardsbetter understanding the relations between social media and crisis phenomena froma geographical perspective. Implementing more detailed hydrological models willadditionally extend the validity of our method regarding flood phenomena. Further-more, our results could be generalised by investigating the value of exploring geo-graphical relations for prioritizing social media messages in other disasters besidesfloods.
Acknowledgments The authors would like to thank Matthias Stork for the ideas and discussionson hydrological models, as well as the German Federal Waterways and Shipping Administrationand the German Federal Institute for Hydrology for providing the water level data. João Porto deAlbuquerque would like to express gratitude to FAPESP (grant 2012/18675-1) and CAPES (grant12065-13-7) for funding.
References
Chatfield AT, Brajawidagda U (2013) Twitter early tsunami warning system: a case study in Indone-sia’s natural disaster management. In: System sciences (HICSS), 2013 46th Hawaii internationalconference on (pp. 2050–2060). IEEE
Endsley MR (1995) Toward a theory of situation awareness in dynamic systems. Hum Factors37(1):32–64
Gao H, Barbier G, Goolsby R (2011) Harnessing the crowdsourcing power of social media fordisaster relief. Intell Syst IEEE 26(3):10–14
Goodchild MF, Glennon JA (2010) Crowdsourcing geographic information for disaster response:a research frontier. Int J Digital Earth 3(3):231–241
Goolsby R (2010) Social media as crisis platform: the future of community maps/crisis maps. ACMTrans Intell Syst Technol (TIST) 1(1):7
GrahamM, Poorthuis A, ZookM (2012) Digital trails of the UK floods—howwell do tweets matchobservations? The Guardian Datablog. http://www.guardian.co.uk/news/datablog/2012/nov/28/data-shadows-twitter-uk-floods-mapped. Accessed 20 June 2013
Hiltz SR, Plotnick L (2013) Dealing with information overload when using social media for emer-gency management: emerging solutions. In: Proceedings of the 10th international ISCRAM con-ference, pp 823–827
Hudson-Smith A, Crooks A, Gibin M, Milton R, Batty M (2009) NeoGeography and web 2.0:concepts, tools and applications. J Location Based Serv 3(2):118–145

Exploring the Geographical Relations Between Social Media 71
Imran M, Elbassuoni SM, Castillo C, Diaz F, Meier P (2013) Extracting information nuggets fromdisaster-related messages in social media. In: ISCRAM, Baden-Baden, Germany
Kaewkitipong L, Chen C, Ractham P (2012) Lessons learned from the use of social media incombating a crisis: a case study of 2011 thailand flooding disaster
Kongthon A, Haruechaiyasak C, Pailai J, Kongyoung S (2012) The role of Twitter during a naturaldisaster: case study of 2011 Thai flood. In: Technology management for emerging technologies(PICMET), 2012 proceedings of PICMET’12: 2227–2232
Lehner B, Verdin K, Jarvis A (2008) New global hydrography derived from spaceborne elevationdata. EOS, Trans Am Geophys Union 89(10):93–94
Lofi C, Selke J, BalkeWT (2012) Information extraction meets crowdsourcing: a promising couple.Datenbank-Spektrum 12(2):109–120
MacEachren AM, Robinson AC, Jaiswal A, Pezanowski S, Savelyev A, Blanford J, Mitra P (2011)Geo-twitter analytics: applications in crisismanagement. In: Proceedings of the 25th internationalcartographic conference, Paris, France
Meier P (2012) Crisis mapping in action: how open source software and global volunteer networksare changing the world, one map at a time. J Map Geogr Libr 8(2):89–100
Okolloh O (2009) Ushahidi or “testimony”: web 2.0 tools for crowdsourcing crisis information.Participatory Learn Action 59(1): 65–70
Palen L (2008) Online social media in crisis events. Educause Q 31(3):12Rogstadius J, KostakosV, Laredo J, VukovicM (2011) Towards real-time emergency response usingcrowd supported analysis of social media. In: Proceedings of CHI workshop on crowdsourcingand human computation, systems, studies and platforms
Sächsisches Landesamt für Umwelt, Landwirtschaft und Geologie (2013): GewässerkundlicherMonatsbericht mit vorläufiger Auswertung des Hochwassers Juni 2013. http://www.umwelt.sachsen.de/umwelt/wasser/707.htm. Accessed 1 September 2013
Sakaki T, Okazaki M, Matsuo Y (2010) Earthquake shakes Twitter users: real-time event detectionby social sensors. In: Proceedings of the 19th international conference on world wide web, pp851–860
Terpstra T, de Vries A, Stronkman R, Paradies GL (2012) Towards a realtime Twitter analysisduring crises for operational crisismanagement. In: Proceedings of the 9th international ISCRAMconference, Vancouver, Canada
Tobler WR (1970) A computer movie simulating urban growth in the Detroit region. Econ Geogr46:234–240
Triglav-Cekada M, Radovan D (2013) Using volunteered geographical information to map theNovember 2012 floods in Slovenia. Nat Hazards Earth Syst Sci Discuss 1(3):2859–2881
Vieweg S,HughesAL, StarbirdK, Palen L (2010)Microblogging during two natural hazards events:what twitter may contribute to situation awareness. In: Proceedings of the SIGCHI conferenceon human factors in computing systems, pp 1079–1088
Yin J, Lampert A, Cameron M, Robinson B, Power R (2012) Using social media to enhanceemergency situation awareness. IEEE Intell Syst 27(6):52–59


![OF ANIMALS BY THE GEOGRAPHICAL AND EXPLORING …€¦ · 1886]PROCEEDINGSOFUNITEDSTATESNATIONALMUSEUM.125 CATALOGUEOFANIMALSCOLLECTEDBYTHEGEOGRAPHICAL ANDEXPLORINGCOMMISSIONOPTHEREPUBLICOFMEXICO](https://img.pdfslide.net/doc/110x75/610c29b8c06ac77bd73ec762/of-animals-by-the-geographical-and-exploring-1886proceedingsofunitedstatesnationalmuseum125.jpg)