Embed Size (px)
Citation preview

1
Cahier de recherche 2017-06
Exploring the influence of executive management diversity on IT governance
Working paper
July 21, 2017
Sylvie Héroux*
Professor, Accounting Department
École des sciences de la gestion, Université du Québec à Montréal (ESG-UQAM)
P. O. Box 8888, Downtown postal station
Montreal, Quebec, Canada H3C 3P8
Tel.: (514) 987 3000, 0274#
Fax: (514) 987 6629
Anne Fortin
Professor, Accounting Department
École des sciences de la gestion, Université du Québec à Montréal (ESG-UQAM)
P. O. Box 8888, Downtown postal station
Montreal, Quebec, Canada H3C 3P8
Tel.: (514) 987 3000, 3987#
Fax: (514) 987 6629
* Corresponding author
We would like to acknowledge the financial support of the Canadian Academic Accounting Association
Research Grant Program and the Autorité des marchés financiers/Corporate Reporting Chair of ESG-
UQAM.
2
Exploring the influence of executive management diversity on IT governance
Abstract
As all organizations are attaching more and more strategic importance to information technology
(IT), IT governance has gained researchers’ interest. In fact, a large body of literature focuses on
firm-specific or executive management attributes such as leadership or commitment as
determinants of IT governance. However, it is still relevant to identify other factors influencing
IT governance. Since executive management demographics and demographic diversity have an
impact on strategic decisions, we explore the influence of executive management diversity on IT
governance. More specifically, based on upper echelon and diversity literatures, we propose that
the degree of use of IT governance mechanisms will differ according to executive management
diversity profile. Results suggest that IT governance for a high educational-high tenure diversity
profile differs significantly from that for a low industry-moderate tenure diversity profile and a
high industry-low tenure diversity profile. Furthermore, IT governance structures differ according
to executive management diversity profile more than IT governance processes and relational
mechanisms. This study extends the literature on IT governance antecedents.
Résumé
Comme les organisations accordent de plus en plus d’importance stratégique aux technologies de
l’information (TI), la gouvernance des TI a retenu l’attention des chercheurs. En fait, de
nombreux écrits mettent l’emphase sur les attributs spécifiques à l’organisation ou sur les
caractéristiques de la haute direction telles que le leadership de celle-ci ou son engagement
enevrs les TI comme déterminants de la gouvernance des TI. Il demeure toutefois pertinent
d’identifier d’autres facteurs influençant la gouvernance des TI. Considérant que les
caractéristiques démographiques et la diversité démographique de la haute direction ont un
impact sur les decisions stratégiques, nous explorons l’influence de la diversité de la haute
direction sur la gouvernance des TI. Plus spécifiquement, en nous appuyant sur la littérature
portant sur les échelons supérieurs et la diversité, nous proposons que le degré d’utilisation des
mécanismes de gouvernance des TI diffèrera selon le profil de diversité de la haute direction. Les
résultats suggèrent que la gouvernance des TI associée à un profil “high educational-high tenure
diversity” diffère significativement des profils “low industry-moderate tenure diversity” et “high
industry-low tenure”. De plus, les structures de gouvernance des TI établies par profil de diversité
de la haute direction différent plus que les processus ou les mécanismes relationnels de
gouvernance des TI. Cette étude s’ajoute à la littérature sur les antécédents de la gouvernance des
TI.

3
1 Introduction
Information technology (IT) governance is considered a sub-set of corporate governance
(Lunardi et al., 2014; Pereira & Mira da Silva, 2012; Webb, 2006). As an integral part of
corporate governance (De Haes & Van Grembergen, 2013; Mohamed & Gian Singh, 2012), IT
governance is the responsibility of the board of directors and the executive (ITGI, 2003). It helps
organizations manage risk from technology-related losses (Mohamed & Gian Singh, 2012) and
determine whether they are getting value from their IT investments (Weill and Ross, 2004, in
Bradley et al., 2012). Since organizations are increasingly relying on IT to enhance their business
performance (Scheeren et al., 2013; Wilkin & Chenhall, 2010), IT governance has become an
important strategic issue.
In other words, as a strategic choice, IT governance helps organizations manage IT
investments (Xue et al., 2008, in Bradley et al., 2012). Interest in IT governance is growing
(Heindrickson & Santos, Jr, 2014) as both public and private organizations are attaching more
and more strategic importance to IT. Furthermore, evaluating and improving IT governance has
become crucial since it allows organizations to monitor the effectiveness of their ITs (Pérez
Lorences & Garcia Avila, 2013). “Just as corporate governance has been driven by the imperative
to manage firms’ operations to more effectively meet shareholder expectations (…), so have
firms focused on ITG [IT governance] to achieve similar IT accountabilities” (Wilkin &
Chenhall, 2010, p. 108). In that context, it is relevant to examine factors that could influence IT
governance.
Prior research has generally stressed the strategic and growing importance of IT governance
in all organizations. More specifically, as the next section of this paper shows, a large body of IT
governance literature is directed towards firm-specific or executive management attributes such
as leadership or commitment as determinants of IT governance. However, it remains relevant to
pursue the identification of other factors impacting IT governance. Considering the abundant
literature on the influence of executive management demographics and demographic diversity on
strategic decisions, and the fact that, to our knowledge, no studies have been conducted on
executive management diversity as an antecedent of IT governance, the aim of this study is to
explore the degree of use of IT governance mechanisms across executive management
demographic diversity profiles.
Our study contributes to IT governance literature by providing new insights into antecedents
of IT governance. Based on our sample, we developed three demographic diversity profiles
showing that different “mixes” of executive management insights and knowledge gained through
education, experience from industry background and tenure can produce different outcomes in
terms of the degree of use of IT governance mechanisms. Organizations could determine which
of these profiles suits them best in light of their IT governance needs. A mix of high education
and high tenure diversity would seem to be favorable to the development of organizations
seeking to improve their IT governance.
The following sections present a literature review, the conceptual background and
propositions of the study, along with the research method. Results are then examined, followed
by a discussion and conclusion.

4
2 Literature review
A number of prior studies have investigated antecedents of IT governance. For instance, Xue
et al. (2008) analyze the following three categories of factors influencing IT governance:
characteristics of IT investments, external environment (competitive pressures, institutional
forces, external resources) and internal context (organizational centralization, IT function power).
Building on Brown and Grant (2005) and Xue et al. (2008), Pereira and Mira da Silva (2012)
summarize contingency factors of IT governance implementation, including organizational
culture, structure, strategy, size, industry, regional differences, maturity, ethical awareness in
corporate governance, and trust (to minimize governance failure).
Based on research published between 2000 and 2010, Mohamed and Gian Singh (2012)
identify five groups that serve as determinants of IT governance as follows: organizational
demographics (organization size and age); information intensity (IT intensity varies by industry);
organizational culture (set of assumptions, understandings, and implicit rules that govern day-to-
day behavior in the workplace); external environment characteristics (environmental uncertainty);
and IT function characteristics (size of IT budget or IT department, IT function maturity). In
addition to the antecedents of IT governance identified by Xue et al. (2008), Tallon et al. (2014)
highlight the following: context (project, stakeholder, global) and information systems (IS)
project phase; organizational structure; corporate governance economies of scope; IT absorptive
capability; historical operations; and environmental uncertainty. In brief, a large body of IT
governance literature addresses firm-specific determinants of IT governance. In light of
Buchwald et al. (2014), they can be labeled as internal or external organizational factors,
depending on whether their focus points are inside or outside the organization.
Other studies have examined group-specific antecedents of IT governance by highlighting the
strategic role of the executive management team.1 Results suggest that executive management
support influences IT-related strategic decisions such as IT adoption (Bruque-Camara et al.,
2004; Jeyaraj et al., 2006) and Internet adoption (Teo & Pian, 2003). Furthermore, a close
relationship between the CEO and the CIO is linked to stronger executive management support
for IT-enabled strategic initiatives (Wilkin & Chenhall, 2010) and more effective IT governance
(Wilson & Pollard, 2009). In fact, executive management support is important to achieve IT-
business alignment (Martin et al., 2005; Weill & Ross, 2004; Wilson & Pollard, 2009).
Moreover, executive management involvement in IT decision-making through an IT steering
committee or IT-related communication policies influences the effectiveness of IT governance
practices (Huang et al., 2010). Executive management involvement and support are the most
significant success factors of IT governance performance (Nfuka & Rusu, 2011). Executive
management commitment to IT investments and to IT’s role in organizational competitiveness
1 Prior studies refer to the group of individuals involved in strategic decision making at the upper echelons/highest
level of an organization as the “top management team” (e.g., Boerner et al., 2011; Carpenter et al., 2004; Hambrick
& Mason, 1984; Li, 2013; Simons et al., 1999; Wu et al., 2011), “senior management” (e.g., Nfuka & Rusu, 2011; Wilson & Pollard, 2009), the “board as a firm’s management team” (Midavaine et al., 2016), the “C-suite
management level (e.g., CEO, COO, CFO and CIO)” (Ali et al., 2013), and “top executives” (Li, 2013; Tallon,
2014). In this study, we use the expression “executive management” when we refer to the group of individuals that
includes the CEO, the CIO and other senior executives.
5
influences the strategic value of IT (Neirotti & Paolucci, 2007). What’s more, “the greater the top
management commitment, the greater the ITG success”2
(Buchwald et al., 2014, p. 140). Strong
and committed executive management leadership supports the evolution and application of IT
governance through clear organizational direction or strategies (Wilson & Pollard, 2009).
Overall, executive management involvement seems to contribute to IT governance effectiveness
(Ali et al., 2013). In view of these results, executive management appears to enhance IT
governance through its leadership, involvement/participation in, support, and commitment to IT-
related strategic choices. However, as pointed out by Bradley et al. (2012), the effectiveness of
executive management support and participation could be affected by the characteristics of the
executive management team (Carpenter et al., 2004; Hambrick & Mason, 1984).
Based on the upper echelon theory, organizations are viewed as reflections of their
executives’ cognitive bases, which are proxied by demographics such as age, gender, functional
background and tenure (Hambrick & Mason, 1984). Given this theoretical perspective, a large
number of studies analyze the influence of executive management demographics on various
topics such as business strategy (Goll et al., 2008), firm performance (Stone & Tudor, 2005), firm
growth (Colombelli, 2015), innovation (Balta et al., 2013), and value chain management (i.e., the
cumulative and variety of actions taken by a firm) (Agnihotri, 2014). Moreover, the impact of
executive management diversity/heterogeneity (demographic diversity) has been a topic of
interest in studies on firm performance (Awino, 2013; Boerner et al., 2011; Boone & Hendricks,
2009; Simons et al., 1999), innovation (Li, 2013) and strategic decisions (Miller et al., 1998;
Eisenhardt et al., 1997; Knight et al., 1999). In general, and as shown by Carpenter et al. (2004),
who present key results from about 30 empirical upper-echelon studies published from 1996 to
2004, there is abundant literature on executive management demographics and demographic
diversity.
In spite of this large body of literature, a limited number of studies investigate the influence of
executive management characteristics on IT governance in particular (e.g., executive
management’s knowledge of IT governance in Ali et al., 2013; and executive management’s
frames of reference in relation to IT in Bruque & Moyao, 2007, as indicated in Newby et al.,
2014). Furthermore, to our knowledge, no studies have as yet examined the influence of
executive management diversity on IT governance. This is the objective of this study.
3 Conceptual background and propositions
In this section, we first define IT governance and executive management diversity as our main
constructs. Based on upper echelon and diversity literatures, we then develop our research
propositions.
3.1 IT governance
2 Top management commitment refers to the “extent to which top management promotes the [IT governance]
activities by means of steering, communicating, providing resources, and advising,” while [IT governance] success is
defined as the “extent to which a clearly defined and transparent set of structures, processes, and standards exists that
is accepted throughout the organization and integrated into the daily work routines” (Buchwald et al., 2014, p. 143).

6
Based on research published between 1994 and 2010, a consensus definition of IT governance
is still lacking (Mohamed & Gian Singh, 2012; Pereira & Mira da Silva, 2012). However, while
many definitions of IT governance have been put forward (Simonsson & Johnson, 2005; Pereira
& Mira da Silva, 2012), the following is one of the most commonly used (Nufka & Rusu, 2011).
IT governance is the responsibility of the board of directors and executive management. It is
an integral part of enterprise governance and consists of the leadership and organisational
structures and processes that ensure that the organisation’s IT sustains and extends the
organisation’s strategies and objectives. (ITGI, 2003, p. 10)
In other words, IT governance “addresses the definition and implementation of processes,
structures and relational mechanisms in the organization that enable both business and IT people
to execute their responsibilities in support of business/IT alignment and the creation of business
value from IT-enabled investments” (De Haes & Van Grembergen, 2013, p. 61). This suggests
that IT governance is comprised of the following three dimensions: structures, processes and
relational mechanisms (Nufka & Rusu, 2011).
Structures are defined as formal positions, roles for IT-related decision-making (Bowen, et
al., 2007; Peterson, 2004) and committees and councils (Peterson, 2004). Processes, which refer
to strategic IT decision making/monitoring (Peterson, 2004), emphasize the implementation of IT
management techniques and procedures (Bowen et al., 2007). The structures and processes “tend
to be mandatory, tangible, and often implemented in a top-down manner” (Peterson 2004, p. 15).
They are complemented by relational mechanisms that involve IT leadership and other
mechanisms such as partnerships and informal meetings between business and IT executives, job
rotation and cross training between IT staff and business people (De Haes & Van Grembergen,
2009).
3.2 Executive management diversity
Pelled (1996) proposes that different types of demographic diversity variables are represented
within a group. More specifically, she describes two approaches that have been used to study
demographic diversity:
One approach has been to treat it broadly, making statements about heterogeneity or
homogeneity in general, rather than about a particular type (e.g., age diversity). (…) The
second approach has been to treat each demographic diversity variable as a distinct
theoretical construct based on the argument that different types of diversity may produce
different outcomes. (Pelled, 1996, p. 618)
Based on this second approach, on the one hand, Pelled (1996) classifies group tenure,
organizational tenure and education and functional backgrounds as highly (and similarly) job-
related since they are “directly shaping task perspectives and technical skills” (p. 619). On the
other, she considers age, gender and race as low in job-relatedness since they do not shape these
perspectives and skills as directly as tenure and education and functional backgrounds.
In the same vein, Midavaine et al. (2016) examine the influence of two types of management
team diversity on R&D investment: information-based diversity (education and tenure) and

7
personal-based diversity (age, gender). Information-based diversity refers to cognitive abilities;
that is, to attributes reflecting managers’ ability to select and process relevant information
(Midavaine et al., 2016).
In this study, we explore whether different types of executive management diversity are
associated with the various categories of IT governance mechanisms, as well as with specific
mechanisms. Drawing on Pelled (1996) and Midavaine et al. (2016), we take the approach that
different types of diversity can produce different outcomes. We focus on job-related/information-
based demographic diversity variables since some dimensions of diversity such as age and gender
are less relevant to strategic decision-making than experience and tenure (Simons et al., 1999).
More specifically, we examine diversity in terms of educational background, functional
background, industry background and tenure.
Educational background consists of the various disciplines in which an executive has
studied (e.g., accounting, business, law, engineering, arts and humanities). Functional
background encompasses all the categories in which an executive has functional experience (e.g.,
finance/accounting, production/operations, information systems/IT), while industry background
reflects all the categories in which each executive has industry experience (e.g., manufacturing,
telecommunications/IT/media). Executive management tenure is defined as the number of years
each executive has served on the executive team.
3.3 Influence of executive management diversity on IT governance
In this section, we suggest that sharing a diversity of cognitive bases, proxied by knowledge
and insights gained through education, as well as experience from functional and industry
backgrounds and tenure, could influence IT governance.
Positive outcomes can derive from heterogeneous groups since diversity makes it possible to
build on insights from individuals (Surowiecki, 2005, in Tallon, 2014). For instance, diversity of
executive management increases its ability to handle strategic change (Hambrick & Mason,
1984), can help this team generate alternative solutions (Bantel & Jackson, 1989), and has often
been considered a key driver of innovation (Qian et al., 2013).
However, since heterogeneous groups do not fully share cognitive models that could facilitate
a common understanding of situations they face, conflicts may arise. Yet decision-making
conflict at senior levels is essential for effective strategic choice (Eisenhardt et al., 1997). Thus,
despite potential conflicts between executives, diversity can broaden executive management’s
range of viewpoints, which is beneficial since executives are frequently confronted with
ambiguous, extremely uncertain and high-stake situations (Eisenhardt et al., 1997). In other
words, even though executive management diversity may spark conflicts and disagreements, it
encourages these executives to consider a wider range of solutions to problems. Accordingly, in
terms of IT-related strategic decision making, considering the whole body of opinion across all
executives in the same organization may be more useful (Tallon, 2014). Even if all executives are
not in complete agreement, it is crucial that they reach a consensus on the perceived value of IT
(Tallon, 2014).
8
Executive management’s knowledge of its business and an understanding of IT issues are
important to achieve IT-business alignment (Wilson & Pollard, 2009). More specifically,
executive management with an adequate base of prior IT governance knowledge is more
qualified to lead and control IT governance, and better at aligning business and IT (Ali et al.,
2013). In this study, we assume that executive management’s prior relevant knowledge of IT
governance structures, processes and relational mechanisms could be built on executive
management diversity in terms of educational, functional or industry backgrounds and tenure.
With their specific educational backgrounds (Karanja & Zaveri, 2012), skills (i.e., the ability
to execute IT leadership and successfully deliver strategic IT projects) (Blaskovich & Mintchik,
2011) and managerial capabilities (Heart et al., 2010), IT executives/CIOs can help develop
executive management’s IT governance knowledge since these managers interact with non-IT
executives. This suggests that functional as well as educational diversity is important in building
an executive management team with IT governance knowledge. For example, an appropriate mix
of business and IT executives can be beneficial to organizations as it contributes to strategic
alignment, a balanced IT investment portfolio and close coordination of business and IT (Bowen
et al., 2007).
Long tenure can enhance executives’ knowledge of what a firm is able to do, while shorter
tenure may help determine what an organization should do (Midavaine et al., 2016). Moreover, as
the key members of executive management (Taniman & O’Shannassy, 2015), long-tenured CEOs
may have little interest in implementing organizational changes because they are more committed
to implementing their own view when running the organization (Barker & Mueller, 2002). As a
result, “by combining the experience and knowledge of the company that long tenured executive
management team members have with new knowledge and fresh insights lesser tenured
individuals may bring to the organization, new knowledge may emerge” (MacCurtain et al.,
2010, p. 224). Accordingly, in the context of our study, IT governance-related decisions could
benefit from executive management tenure diversity. New executives, whether they come from
inside or outside the organization, could bring new ideas about the implementation of IT
governance mechanisms.
In addition, in stable industries, throughput-function experience (e.g., accounting, process
engineering, production) is positively associated with profitability (Hambrick & Mason, 1984).
However, in turbulent industries, it is output function experience (e.g., such as product R&D,
marketing, sales) that is associated with profitability (Hambrick & Mason, 1984). For instance,
firm performance declined steadily across CEOs’ tenures in the computer industry, as their
paradigms grew obsolete more quickly than they could learn (Henderson et al., 2006).
These results suggest that interactions between tenure or functional background and industry
background can produce different outcomes in terms of performance. In this study, it is
reasonable to assume that executives with a dynamic industry background such as
telecommunications/IT/media may have a different perspective than those with experience, for
example, in the stable food industry when assessing the importance and urgency of implementing
IT governance mechanisms in their organization. Therefore, executive management diversity in
industry background may influence IT governance-related decisions in terms of structures,
processes and relational mechanisms to put in place.
9
In short, greater executive management diversity can make the implementation of IT
governance structures, processes and relational mechanisms more difficult since executives can
have various sources of cognitive bias that could lead to different or conflicting opinions about IT
business value. However, organizations benefit from various executives’ insights to enhance IT
governance mechanisms. More specifically, organizations that need to implement a set of IT
governance mechanisms to ensure their IT-business alignment could draw upon diverse executive
management knowledge and experience gained through educational, functional and industry
backgrounds and tenure.
Bringing together these insights from both upper echelon and diversity literatures, and based
on the assumption that different types of diversity can produce different outcomes (Pelled, 1996;
Midavaine et al., 2016), we refer to “executive management diversity profiles” as various
possible combinations of these types of diversity. We thus expect that the degree of use of IT
governance mechanisms will differ according to executive management diversity profile. This
leads us to explore the following propositions:
Proposition 1: The degree of use of IT governance mechanisms will differ according to
executive management diversity profile.
More specifically:
Proposition 2: The degree of use of specific IT governance mechanisms will differ
according to executive management diversity profile.
4 Research method
We used a mail survey to collect data on IT governance since it relates to internal
organizational matters. The questionnaire was sent to the senior executives/officers in charge of
IT (Vice-president [VP] IT, CIO, Manager or Director in charge of technology, or Chief
Technology Officer) in a sample of Canadian organizations. We obtained contact information for
target organizations from the 2014 Financial Post 500 database and occasionally from corporate
websites. When the name of the executive in charge of IT was not available, we sent the survey
to the President/CEO requesting that the questionnaire be completed by the top manager with an
overview or sufficient knowledge of the organization’s IT governance and IT strategic issues.
The questionnaire included questions about IT governance mechanisms and IT intensity.
Questions relevant to the description of the respondents and their organizations were also
included (number of employees in the organization and the IT function, respondents’ number of
years of professional experience, their position and educational background). The questions were
selected/adapted from existing instruments and the questionnaire was pretested by three IT
executives/directors. The English version was translated into French as some targeted participants
were French speaking. Both versions of the questionnaire, which took approximately 30 minutes
to complete, were revised by two academics and a translator.3 We obtained ethics approval from
the institution’s Research Ethics Committee.
3 The questionnaire included questions on other matters not relevant to this study.

10
The information on executive management diversity was obtained from Boardex, using the
annual information form and corporate websites as complements. Since the questionnaires were
assigned a tracking number, we were able to match the responses to the respondents’
organization. Data on assets, revenues, net income and market capitalization were obtained from
Compustat or from organizations’ financial statements posted on their website or on SEDAR, the
electronic system for the official filing of documents by public companies across Canada.
4.1 Target population and survey implementation
To identify our initial target population of Canadian publicly traded and for-profit para-
governmental organizations, we used the 2014 Financial Post 500 database, which contains
information on Canada’s Top 800 private and public organizations. Private companies in this
database were not selected since executive management diversity data is not available from
public sources. The final target population was comprised of 362 organizations (after excluding
organizations with all their business outside Canada, Canadian subsidiaries of foreign companies
with IT governance outside Canada, holdings, closed-end funds, etc.).
The survey administration procedures, which were implemented between April and July
2015, included pre-notice by email, an original mailing followed by a reminder card, and a
second mailing to non-respondents (Dillman, 2000). These procedures were followed up by
phone contacts or voice messages to targeted respondents or administrative assistants, and finally
by a third mailing to non-respondents. Along with the questionnaire, the mailing included a cover
letter assuring respondents of the confidentiality of their responses and a self-addressed postage-
paid envelope.
4.2 Sample
A total of 67 usable questionnaires were received, for an 18.5% response rate,4 which is
higher than or comparable to that of other survey studies among senior executives/officers in
charge of IT (e.g., Chun et al., 2014: 13.9%; Lunardi et al., 2017: 22.3%; Rivard et al., 2006:
13.7%; Yeh et al., 2012: 19.1%). Since information on executive management diversity was not
available from public sources for three for-profit para-governmental organizations, the sample
size is 64.
The sample organizations’ characteristics are set out in Table 1, Panels A and B. Almost 80%
of the sample was comprised of listed firms; the remainder were for-profit para-governmental
organizations. All the organizations were fairly large and, on average, profitable (Panel A). The
industries most represented in the sample are Financial Services/Insurance, Oil & Gas/Energy
and Retail/Wholesale (Panel B). Table 1, Panels C and D, presents respondents’ characteristics.
On average, respondents had about six years of experience in their current position, more than 10
years within their organization, and 29 years in total (Panel C). Almost all respondents (over
92%) held a position directly related to IT, while more than 75% had an educational background
in IT (Panel D).
4 Email correspondence with some of the targeted respondents provided motives for non-responses. Some pointed to
an organizational policy prohibiting answering questionnaires. Others mentioned lack of time to fill out the
questionnaire.

11
Insert Table 1 about here
To lessen the concern for non-response bias, we performed analyses of variance comparing
the group of respondents that answered the first mailing with the group that responded to later
mailings (the latter being used as a proxy for the non-respondents). No significant differences
were noted in the responses pertaining to IT governance constructs or the number of employees
in total and in the IT function. Neither were any differences observed in terms of the
organizations’ assets, revenue, net income and market value. Thus, overall, the non-response bias
does not seem to be a concern in this sample.
4.3 Measurements
4.3.1 IT governance
IT governance structures were measured using 27 items from De Haes and Van Grembergen
(2009), Weill and Ross (2005), Ali and Green (2007), Parent and Reich (2009), and Bowen et al.
(2007).5 We also included Yes/No questions to assess the presence of various committees and
roles, such as the IT steering committee or the officer in charge of IT security, compliance and/or
risk. IT governance processes were measured using 28 items from De Haes and Van Grembergen
(2009), Weill and Ross (2005), and Bowen et al. (2007). IT governance relational mechanisms
were measured using 21 items from Kearns and Lederer (2003) and De Haes and Van
Grembergen (2009). As in Héroux and Fortin (2013, 2014), composite indexes were used to
obtain an overall measure of IT governance structures, processes, relational mechanisms and
overall IT governance (average of 28, 28, 21, and 76 items respectively). The items are presented
in the tables set out in the results section. For all IT governance questions, the respondents were
asked to indicate the degree to which they agreed with the item as it applied to their organization
(strongly disagree = 1, strongly agree = 7). In light of Buchwald et al. (2014), our overall
measure of IT governance captures the “extent to which a clearly defined and transparent set of
structures, processes, and standards exists that is accepted throughout the organization and
integrated into the daily work routines” (p. 143).
4.3.2 Executive management diversity
Similarly to Talke et al. (2010) and Boerner et al. (2011), we used Blau’s (1977) formula6 to
compute executive management diversity in terms of educational, functional and industry
backgrounds. We measured executive management tenure diversity based on Allison’s (1978)
coefficient of variation7 (standard deviation/mean of the number of years each executive has been
a member of the executive team). Educational background categories encompassed business
administration, accounting, engineering, sciences, arts and humanities, law, and others.
5 IT governance structures would normally include board-level structures (De Haes & Van Grembergen, 2009).
However, we exclude these structures since we focus on IT governance mechanisms that can be influenced by
executive management. 6 Blau’s (1977, p. 9) formula is 1 - [∑xi
2/(∑xi)
2], where xi is the number of persons in each group, and the sum is
taken over all groups. The closer the result of the calculation is to 1, the greater the heterogeneity. 7 Since the coefficient of variation is a scale invariant measure, it is more appropriate than standard deviation or
variance for interval scaled variables (Allison, 1978, in Boerner et al., 2011, p. 335).

12
Functional background categories consisted of finance/accounting, marketing, human resources,
production/operations, research/development, information systems/IT, legal/general counsel,
management, politics, communications/investor relations, strategy/development, and others.
Industry background categories included financial services/insurance, manufacturing, mining, oil
& gas, retail/wholesale, telecommunications/IT/media, services, utilities, education, and
government. Higher scores in terms of educational, functional and industry backgrounds and
tenure were considered to indicate greater executive management diversity.
4.3.3 Other contextual variables
IT governance could be associated with IT intensity. For example, Parent and Reich (2009)
point out that the most strategically offensive firms are the most IT intensive, whereas firms that
use IT mainly for support purposes are the least IT intensive. Héroux and Fortin (2014) show that
the degree of use of IT governance mechanisms is higher in firms in moderately and highly
offensive IT mode than in firms in highly defensive IT mode. Five items derived from Brown and
Magill (1994) were used to measure IT intensity. Respondents were asked to indicate the degree
to which their organization’s main operations are dependent on IT for the following five strategic
choices: introducing new products; creating product differentiation; establishing competitive
advantage; improving market access; and avoiding competitive disadvantage (not dependent = 1,
totally dependent = 7).
IT governance may differ according to organization size. Firms with more revenues, assets
and employees may tend to allocate more financial and human resources to the implementation of
an effective IT governance system than smaller firms. In fact, many small and medium-sized
firms have small internal IT groups (Huang et al., 2010) and fewer mature IT governance
mechanisms than larger units (Thong, 1999). We measured size through the natural logarithm of
total assets to normalize the distribution (Hair et al., 1998).
The industry environment moderates the relationship between executive management
demographic characteristics and business strategy (Goll et al., 2008). Depending on the degree of
managerial discretion allowed executive management in particular industries (Goll et al., 2008),
industry sector could influence the design of IT governance, which is an element of the
operationalization of business strategy. Organizations were classified into four industry groups
(Financial services and Insurance; Manufacturing and Utilities; Oil & Gas/Energy and Mining;
Services, Amusement, Retail/Wholesale and Telecommunications/Media organizations) to
determine whether the clusters differed by industry.
4.3.4 Descriptive statistics
Descriptive statistics are presented in Table 2. For the 64 organizations overall, IT governance
(mean = 4.35) is moderate, with processes and relational mechanisms moderately high
(mean=4.64 and 4.53 respectively) and structures moderate (mean = 3.92) (Panel A).8 IT
governance structures are thus less developed than processes and relational mechanisms.
8 Results around the mean are characterized as moderate (between 3.5 and 4.49). Mean results of 4.5 to 5.49 are
characterized as moderate-high, high when 5.5 to 5.99, and as very high when 6.0 and above. Mean results of 2.5 to
3.49 are characterized as low. Means below 2.5 are considered very low.

13
Furthermore, these organizations are moderately IT intensive (mean = 4.18). Some organizations
are quite large since the maximum value for Lnassets is more than twice the standard deviation.
Table 2, Panel B provides an overview of IT governance structures. In 89% of the sample
organizations, a senior executive/officer holds the IT governance function and 68% of these
officers are members of the executive committee. Almost all organizations have an IT officer or
manager responsible for IT security, compliance and/or risk (94%). More than half have an IT
steering committee at the executive level (59%) and close to three-quarters have an IT project
steering committee (72%). An IT security steering committee (41%) and an IT architecture
steering committee (34%) are the least used structures.
Insert Table 2 about here
Descriptive statistics on the demographic diversity characteristics are set out in
Table 2, Panel C. With a value close to 1, functional diversity is the highest form of diversity,
followed by educational diversity and then industry diversity. With the highest standard
deviation, tenure diversity is expected to vary significantly between organizations.
4.4 Data analysis according to executive management demographic diversity profiles
We used cluster analysis to classify the sample organizations into executive management
diversity profiles. The main purpose of a cluster analysis “is to group objects based on the
characteristics they possess […] so that each object is very similar to others in the cluster with
respect to some predetermined criterion” (Hair et al., 1998, p. 473). The criteria used to
empirically classify our data are the four demographic diversity variables. The potential number
of groups was determined from a visual examination of dendrograms for a hierarchical cluster
analysis using Ward’s method. First, classification into three or four groups seemed to be
appropriate. However, since one of the four groups was comprised of only eight organizations,
three groups were determined as the optimal number of groups to be retained. Second, the
analysis of agglomeration coefficients for hierarchical analysis confirmed that three groups led to
a substantial increase in the value of agglomeration coefficients. The organizations were then
classified into their respective groups in accordance with the correspondence table generated by
the cluster analysis.
Descriptive data for the four diversity variables (mean values) are provided by group in the
Appendix. ANOVAs indicate a significant difference between the mean educational and tenure
diversity of Group 3 and that of Groups 1 and 2. Educational and tenure diversity are highest for
Group 3 and thus characterize this group. ANOVAs show a significant difference between the
mean industry and tenure diversity of Groups 1 and 2. Posting the highest industry diversity and
lowest tenure diversity, Group 2 is thus characterized by these two attributes. Group 1 has the
lowest mean for industry diversity and values close to the overall mean for educational and tenure
diversity. However, Group 1’s mean tenure diversity is significantly different from that of Groups
2 and 3. We will therefore characterize Group 1 using the attributes of low industry diversity and
moderate tenure. Since the ANOVA results for functional diversity indicate no significant
differences between groups, this attribute is not used to characterize the groups.
ANOVAs were then used to assess whether the degree of use of IT governance mechanisms
(overall, structures, processes and relational mechanisms) differed across executive management

14
diversity profiles (Proposition 1). Between-group differences were also assessed in terms of
contextual variables (IT intensity and size). Cross-tabulation and Chi2 were used to determine
whether industry membership differed between groups.
ANOVAs were also used to determine whether the degree of use of specific IT governance
mechanisms (structures, processes, relational mechanisms) differed across executive management
diversity profiles (Proposition 2).
5 Results
This exploratory study seeks evidence about the relationships between executive management
diversity profiles and IT governance. In this section, we document the level of use of IT
governance mechanisms by executive management diversity profiles and analyze between-group
differences (Proposition 1). We then analyze specific IT governance mechanisms used under the
different executive management diversity profiles (Proposition 2).
5.1 Use of IT governance mechanisms according to executive management diversity profile
(P1)
Descriptive data for IT governance (mean values) are provided for the executive management
diversity profiles (groups, hereafter Gr) in Table 3. ANOVAs indicate a significant difference
between the mean of IT governance for the high educational-high tenure diversity profile (Gr3)
and that of the low industry-moderate tenure diversity profile (Gr1) and the high industry-low
tenure diversity profile (Gr2). In terms of structures, the only significant difference noted is
between the high industry-low tenure profile (Gr2) and the high educational-high tenure diversity
profile (Gr3). The former has a low mean for structures (3.17) while the latter has a moderate-
high mean (4.66). However, for processes and relational mechanisms, a significant difference is
observed between the low industry-moderate tenure diversity profile (Gr1) and the high
educational-high tenure diversity profile (Gr3). The mean values for the latter profile (Gr3) are
moderate-high, and moderate for the former (Gr1). These results provide evidence supporting
Proposition 1; that is, that the degree of use of IT governance mechanisms differs according to
executive management diversity profile.
Insert Table 3 about here
For other contextual variables, we find that IT intensity differs significantly between the high
industry-low tenure diversity profile (Gr2) and the high educational-high tenure diversity profile
(Gr3), the latter group having the highest mean (4.79) and the former having the lowest (3.47). In
terms of size, we observe a significant difference between the low industry-moderate tenure
diversity profile (Gr1) and the high educational-high and tenure diversity profile (Gr3), which has
the largest organizations. The cross-tabulation of organizations’ industry and profiles (groups)
indicates no significant difference between groups according to industry membership.
5.2 Use of specific IT governance mechanisms according to executive management diversity
profile (P2)

15
In the following sections, we examine the significant differences between the means of the
specific IT governance structures, processes and relational mechanisms to determine which are
specific to a particular executive management diversity profile (i.e., used to different degrees
depending on the diversity profile). We also indicate which IT governance structures, processes
and relational mechanisms are used to a similar degree irrespective of the diversity profile.
5.2.1 IT governance structures
Table 4 shows several significant differences in respect of specific IT governance structures
between the low industry-moderate tenure diversity profile (Gr1) and the high educational-high
tenure diversity profile (Gr3). All these differences are in favor of the latter (Gr3), that is, the
means are higher for this group. Moreover, these favorable differences all pertain to the IT
steering committee, which is more involved in formulating the organization’s IT
strategies/policies, coordinating IT practices, providing leadership in deriving benefits from IT,
and promoting IT strategic flexibility to meet the changing needs of the organization’s internal
and external environment.
Insert Table 4 about here
We also note many significant differences in specific IT governance structures between the
high industry-low tenure diversity profile (Gr2) and the high educational-high tenure diversity
profile (Gr3), favoring the latter (Table 4). Gr2 organizations posted a lower level in relation to
the following responsibilities and composition of the IT strategy committee: determining business
priorities in IT investments; providing strategic direction to IT projects; making IT investment
decisions based on business needs; promoting IT strategic flexibility to meet the changing needs
of the organization’s internal and external environment; having business representatives with
extensive IT knowledge; having representatives from all major areas of the organization; and
having the most appropriate representatives from each area. Also observed are significant
differences between Gr2 and Gr3 for specific mechanisms pertaining to the IT security and IT
architecture steering committees. Gr2 has very low means for the composition of both
committees with business and IT people, as well as a low focus on IT-related risks and security
issues.
Few significant differences are evident in terms of specific IT governance structures between
the low industry-moderate tenure diversity profile (Gr1) and the high industry-low tenure
diversity profile (Gr2) (Table 4). In comparison to Gr1, Gr2 has fewer business representatives
with extensive IT knowledge and fewer representatives from all major areas of the organization
on the IT steering committee. The composition of the IT security and IT architecture steering
committees also differs, with Gr2 having a lower mean for the mix of business and IT people.
Table 4 also suggests that certain IT governance structures are used (or not extensively used)
in all executive management diversity profiles. We can thus assume that these structures are used
to similar degrees across diversity profiles. For example, in all three profiles, a senior executive
(or officer) is often in charge of IT governance and in many cases this officer is an executive
committee member. The responsibilities of the officer or manager in charge of IT security,
compliance and/or risk are similar and can be situated at a moderate-high level in most cases, as
can the characteristics of the IT project steering committee.

16
5.2.2 IT governance processes
Table 5 presents specific IT governance processes. Only a few differences can be seen
between the means for the specific processes, and all but one are between the high educational-
high tenure diversity profile (Gr3) and the low industry-moderate tenure diversity profile (Gr1).
The differences are in favor of Gr3, which uses most of these processes at a high or very high
level, in comparison to Gr1, which uses most of them at a moderate level. The specific processes
are as follows: a formal planning process is used to update the IT strategy; the COSO (Committee
of Sponsoring Organizations) or ERM (Enterprise Risk management) framework for internal
control is used to govern IT; regular self-assessments or independent assurance activities on IT
governance and control are performed; the organization regularly engages outside agencies to test
its security systems or to conduct security audits; a prioritization process for IT investments and
projects in which business and IT are involved is in place (e. g. business cases, return on
investment); and IT strategies and policies define objectives and expectations, such as
accountability and responsibility. The only difference between the high educational-high tenure
diversity profile (Gr3) and the high industry-low tenure diversity profile (Gr2) is the moderate-
high use by Gr3 of an IT governance and control framework (such as CobiT) to govern IT, in
contrast to low use by Gr2.
Insert Table 5 about here
The most notable IT governance processes that are used to a moderate-high or higher level in
all executive management diversity profiles are: the use of a formal planning process to define
the IT strategy; the use of IT budgets to control and report on IT activities/investments; and the
use of many IT project related mechanisms (namely, the use of explicit criteria, both qualitative
and quantitative, to help evaluate IT projects, as well as a cost-benefit analysis, the full
identification of cost data and all foreseeable risks, the explicit specification of expected
timeframes for development and implementation of IT projects, the evaluation of their
organizational impacts, the assessment of the availability of human resources, the use of project
management methodology, and the accessibility of IT strategies and policies to all employees
impacted by IT projects).
5.2.3 IT governance relational mechanisms
In Table 6, which sets outs specific relational mechanisms, significant differences between
profiles are noted for only two. Senior business and IT management act as partners to a greater
extent in the high educational-high tenure diversity profile (Gr3) than in the low industry-
moderate tenure diversity profile (Gr1) or in the high industry-low tenure diversity profile (Gr2).
In comparison to the latter, the CEO in the high educational-high tenure diversity profile (Gr3) is
more inclined to consider IT spending as strategic investments than as expenses to be controlled.
Insert Table 6 about here
The following IT governance relational mechanisms are used to a moderate-high or higher
level in all executive management diversity profiles: the senior executive/officer in charge of IT
articulates a vision for IT’s role in the organization and ensures that this vision is clearly
17
understood by managers throughout the organization; senior business and IT management
informally discuss the organization’s activities and IT’s role; and the IT executive or senior
manager regularly attends business planning meetings, contributes to the formulation of business
goals, has regular informal contacts with executive management, has easy access to the CEO and
frequent contacts with him/her. However, most relational mechanisms pertaining to the CEO are
used moderately or less by all diversity profiles.
In all, the above results provide some support for Proposition 2 since the degree of use of
certain IT governance structures, processes and relational capabilities differs according to
executive management diversity profile. A wider variation is noted in the degree to which IT
governance structures are used than in the degree of use of IT governance processes or relational
mechanisms. More specifically, IT governance structures differ according to executive
management diversity profile more than IT governance processes or relational mechanisms.
Those structures that differ according to executive management diversity profile are mainly tied
to the role and/or composition of the IT steering committee, the IT security steering committee
and the IT architecture steering committee.
Table 7 provides an overview of the degree of use of IT governance structures, processes and
relational and specific mechanisms for which significant differences are observed between
demographic diversity profiles, as well as other attributes. For specific structures, rather than
focusing on the individual questions within structures, the table presents structures (based on the
means of their related questions in Table 4) irrespective of whether there are significant
differences between profiles. Table 7 was developed by characterizing the means set out in
Tables 3 to 6 using the scale presented in footnote number 8.
Insert Table 7 about here
6 Discussion
The objective of this study was to explore the relationship between the degree of use of IT
governance mechanisms (structures, processes, relational mechanisms) and executive
management diversity profiles (based on functional, industry and educational backgrounds and
tenure). Our results suggest that IT governance for the high educational-high tenure diversity
profile differs significantly from that for the low industry-moderate tenure diversity profile and
the high industry-low tenure diversity profile. Furthermore, IT governance structures differ by
executive management diversity profile more than IT governance processes or relational
mechanisms. These findings support Pelled (1996) as they suggest that different types of
diversity produce different outcomes. However, it appears that diversity in executive
management experience gained from functional background does not distinguish profiles from
each other. In other words, diversity in functional background is similar between firms. This
appears to be plausible since it is common to find executives with many different functional
backgrounds (IT and non-IT) in medium-large firms’ executive management.
On the whole, in large firms with moderate-high IT intensity, high diversity in educational
background and tenure among executive management appears to be a “good mix” for greater use
of IT governance structures, processes and relational mechanisms. This suggests that diversity in
the disciplines in which executives have studied, combined with differences in executives’

18
tenure, could help build IT governance knowledge and enhance IT governance mechanisms as a
whole. It is plausible to assume that these large-IT intensive firms are particularly confronted
with uncertain situations as IT is constantly evolving. The high diversity in their executive
management could lead to conflicts and disagreements. However, as suggested by Eisenhardt et
al. (1997), diversity can broaden executive management’s range of viewpoints. Despite potential
conflict between executives, these firms seem to overcome IT governance-related conflicts and
disagreements resulting from diversity. In fact, as suggested by (Tallon, 2014), even if all
executives may not be in complete agreement, it becomes crucial for these firms to reach a
consensus in terms of IT-related strategic decision making. The greater degree of use of IT
governance mechanisms appears to be an example of such consensus.
In medium-large organizations that are less IT-intensive (i.e., with low or moderate IT
intensity), two executive management demographic diversity profiles emerge from our data: high
industry-low tenure and low industry-moderate tenure. Organizations from both profiles use IT
governance to a lesser extent than large IT-intensive firms with a high education-high tenure
profile. This tendency could be because there is less need in these firms to develop IT governance
mechanisms compared to larger firms with moderate-high IT intensity.
More specifically, when executive management is characterized by high industry-low tenure
diversity, some IT governance structures seem to be used to a lesser extent and some IT
governance processes appear to be more developed than when it is characterized by low industry-
moderate tenure. In fact, diversity in tenure seems to enhance IT governance structures, while
diversity in industry background appears to increase the use of IT governance processes. In short,
in medium-large organizations that are less IT-intensive (i.e., with low or moderate IT intensity),
when the dominant diversity attribute is industry background (high industry), we found more
developed IT governance processes. In contrast, there is a greater use of some IT governance
structures when tenure diversity is the dominant attribute (moderate tenure). Having executive
management with less diverse tenure could limit the extent and types of discussions that would
lead to the use of more sophisticated IT governance structures such as IT project or IT security
steering committees. Furthermore, executive management with greater diversity in industry
background could have executives that “push for” the development of specific IT governance
processes, such as a formal planning process to update IT strategy and hiring outside agencies to
test the organization’s security systems or conduct security audits.
7 Conclusion, research avenues and limitations
In this exploratory study, we tried to capture different facets of diversity in a “diversity
profile” as we explored their impact on a set of IT governance mechanisms. Our empirical results
provide insights into the potential influence of different mixes of demographic diversity in
executive management on the use of IT governance mechanisms. Organizations could determine
which of these profiles suits them best in light of their IT governance needs. A mix of high
education and high tenure diversity would seem to be favorable to the development of
organizations seeking to improve their IT governance. Overall, our results could make
organizations more aware of the influence of executive management diversity and provide them
with new ideas in terms of IT governance structures, processes and relational mechanisms.
Based on the upper echelon theory and related literature on executive management
19
demographics and demographic diversity, this study extends IT governance literature. More
specifically, it complements results from prior studies on group-specific antecedents of IT
governance. It also adds to literature on the consequences of diversity in an IT context. Results
suggest that different types of executive management diversity “produce” different IT governance
mechanisms. To enhance our understanding of how this happens, future research based on
interviews with executives could be relevant. Since executive management can change over time,
diversity is expected to change as well. Therefore, it could also be relevant to examine the impact
of a change in diversity on IT governance over time.
Executive management diversity can lead to both consensus and conflict. Future research
could investigate whether different types of diversity engender more (or less) consensus or
conflict. Studies could also examine whether consensus/conflict acts as a mediating or
moderating variable between types of demographic diversity and IT governance mechanisms.
As with any study, this paper has some limitations. Given the exploratory nature of the study,
the small sample size was acceptable. However, a larger sample in future research would support
the generalizability of the findings. Since the data on IT governance were obtained through the
administration of questionnaires, the usual limitations pertaining to surveys apply. Notably, a
social desirability bias may have prompted participants to overstate their answers on the response
scales. The assessment of demographic characteristics was dependent on the information
available from Boardex and public sources that may not have been exhaustive.
References
Agnihotri, A. (2014). The role of the upper echelon in the value chain management.
Competitiveness Review, 24(3), 240-255.
Ali, S., & Green, P. (2007). IT governance mechanisms in public sector organizations: An
Australian context. Journal of Global Information Management, 15(4), 41-63.
Ali, S., Green, P., & Robb, A. (2013). Measuring top management’s IT governance knowledge
absorptive capacity. Journal of Information Systems, 27(1), 137-155.
Allison, P. (1978). Measures of inequality. American Sociological Review, 43(6): 865-880.
Awino, Z. B. (2013). Top management team diversity, quality decisions and organizational
performance in the service industry. Journal of Management and Strategy, 4(1), 113-123.
Balta, M. E., Woods, A., & Dickson, K. (2013). Strategic decision-making processes as a
mediator of the effect of board characteristics on company innovation: A study of publicly-
listed firms in Greece. International Journal of Management, 30(1), 311-328.
Bantel, K., & Jackson, S. (1989). Top management and innovations in banking: Does the
composition of the top team make a difference? Strategic Management Journal, 10 (summer),
107-124.
Barker III, V. L., (2002) Mueller, G. C. (2002). CEO characteristics and firm R&D spending.
Management Science, 48(6), 782-801.
Blaskovich, J., & Mintchik, N. (2011). Accounting executives and IT outsourcing
recommendations: An experimental study on the effect of CIO skills and institutional
isomorphism. Journal of Information Technology, 26(2), 139-152.
Blau, P. M. (1977). Inequality and heterogeneity: a primitive theory of social structure. Collier
Macmillan Publishers, London.

20
Boerner, S., Linkohr, M., & Kiefer, S. (2011). Top management team diversity: Positive in the
short run, but negative in the long run? Team Performance Management, 17(7/8), 328-353.
Boone, C., & Hendriks, W. (2009). Top management team diversity and firm performance:
Moderators of functional-background and locus-of-control diversity. Management Science,
55(2), 165-180.
Bowen, P. L., Cheung, M-Y. D., & Rohde, F. H. (2007). Enhancing IT governance practices: A
model and case study of an organization’s efforts. International Journal of Accounting
Information Systems, 8, 191-221.
Bradley, R., Byrd, T. A., Pridmore, J. L., Trasher, E., Pratt, R. ME., & Mbarika, V. WA. (2012).
An empirical examination of antecedents and consequences of IT governance in US hospitals.
Journal of Information Technology, 27, 156-177.
Brown, A. E., & Grant, G. G. (2005). Framing the frameworks: a review of IT governance
research. Communications of the Association for Information Systems, 15, 696-712.
Brown, C. V., & Magill, S. L. (1994). Alignment of the IS functions with the enterprise: Toward
a model of antecedents. MIS Quarterly, 14(4), 371-404.
Bruque, S., & Moyano, J. (2007). Organizational determinants of information technology
adoption and implementation in SMEs: The case of family and cooperative firms.
Technovation, 27(5), 241-253.
Bruque-Camara, S., Vargas-Sanchez, A, & Hernandez-Ortiz, M. J. (2004). Organizational
determinants of IT adoption in the pharmaceutical distribution sector. European Journal of
Information Systems, 13(2), 133-146.
Bushwald, A., Urbach, N., & Ahlemann, F. (2014). Business value through controlled IT:
Toward an integrated model of IT governance success and its impact. Journal of Information
Technology, 29, 128-147.
Carpenter, M. A., Geletkanycz, M. A., & Sanders, W. G. (2004). Upper echelons research
revisited: Antecedents, elements, and consequences of top management composition. Journal
of Management, 30(6), 749-778.
Chun, M. W. S., Griffy-Brown, C., & Koeppel, H. (2014). The new normal: Fundamental shifts
for 21th century organizations and for the CIOs who lead them. Journal of Applied Business
and Economics, 16(5), 27-49.
Colombelli, A. (2015). Top management team characteristics and firm growth. International
Journal of Entrepreneurial Behavior & Research, 21(1), 107-127.
De Haes, S., & Van Grembergen, W. (2009). An exploratory study into IT governance
implementation and its impact on business / IT alignment. Information Systems Management,
26(2), 123-137.
De Haes, S., & Van Grembergen, W. (2013). Improving enterprise governance of IT in a major
airline: A teaching case. Journal of Information Technology Teaching Cases, 3, 60-69.
Dillman, D. A. (2000). Mail and Internet Surveys– The Tailored Design Method, 2nd edition.
New York, John Wiley and Sons.
Eisenhardt, K. M., Kahwajy, J. L., & Bourgeois III, L. J. (1997). Conflict and strategic choice:
How top management teams disagree. California Management Review, 39(2), 42-62.
Finkelstein, S., and Hambrick, D. C. (1990). Top management team tenure and organizational
outcomes: The moderating role of managerial discretion. Administrative Science Quarterly,
35(3), 484-503.
Goll, I., Brown Johnson, N., & Rasheed, A. A. (2008). Top management team demographic
characteristics, business strategy, and firm performance in the US airline industry.
Management Decision, 46(2), 201-222.

21
Hair, J. F., Anderson, R. E., Tatham, R. L., & Black, W. C. (1999). Multivariate Data Analysis,
Fifth Edition. Upper Saddle River, NJ: Prentice Hall.
Hambrick, D.C. and Finkelstein, S. (1987). Managerial discretion: A bridge between polar views
of organizational outcomes. Research in Organizational Behavior, 9, 369-406.
Hambrick, D., & Mason, P. (1984). Upper echelon: The organization as a reflection of its top
managers. Academy of Management Review, 9(1), 193-206.
Heart, T., Maoz, H, & Pliskin, N. (2010). From governance to adaptability: The mediating effect
of IT executives’ managerial capabilities. Information Systems Management, 27(1), 42-60.
Henderson, A. D., Miller, D., & Hambrick, D. C. (2006). How quickly do CEOs become
obsolete? Industry dynamism, CEO tenure, and company performance. Strategic Management
Journal, 27(5), 447-460.
Hendrickson, G., & Santos, C. D. Jr. (2014). Information technology governance in public
organizations: How perceived effectiveness relates to three classical mechanisms. Journal of
Information Systems and Technology Management, 11(2), 297-326.
Héroux, S., & Fortin, A. (2014). Exploring IT dependence and IT governance. Information
Systems Management, 31(2), 143-166.
Héroux, S., & Fortin, A. (2013). The internal audit function in information technology
governance: A holistic perspective. Journal of Information Systems, 27(1), 189-217.
Huang, R., Zmud, R. W., & Price, R. L. (2010). Influencing the effect of IT governance practices
through steering committees and communication policies. European Journal of Information
Systems, 19(3), 288-302.
ITGI (IT Governance Institute). (2003). Board Briefing on IT Governance, Second Edition.
Rolling Meadows, Illinois: IT Governance Institute. Retrieved April 20 2016 from
Information Systems Audit and Control Association (ISACA) Website:
http://www.isaca.org/restricted/Documents/26904_Board_Briefing_final.pdf.
Jeyaraj, A., Rottman, J. W., & Lacity, M. C. (2006). A review of the predictors, linkages, and
biases in IT innovation adoption research. Journal of Information technology, 21(1), 1-23.
Karanja, E., & Zaveri, J. (2012). IT leaders: Who are they and where do they come from? Journal
of Information Systems Education, 23(2), 143-163.
Kearns, G., & Lederer, A. L. (2003). A resource-based view of strategic IT-alignment: How
knowledge sharing creates competitive advantage. Decision Sciences, 34(1), 1-29.
Knight, D., Pearce, C. L., Smith, K. G., Olian, J. D., Sims, H. P., Smith, K. A., & Flood, P.
(1999). Top management team diversity, group process, and strategic consensus. Strategic
Management Journal, 20(5), 445-465.
Li, C-R. (2013). How top management team diversity fosters organizational ambidexterity – The
role of social capital among top executives. Journal of Organizational Change Management,
26(5), 874-896.
Lunardi, G. L., Becker, J. L., Maçada, A. C. G., & Dolci, P. C. (2014). The impact of adopting IT
governance on financial performance: An empirical analysis among Brazilian firms.
International Journal of Accounting Information Systems, 15(1), 66-81.
Lunardi, G. L., Maçada, A. C. G., Becker, J. L., & Van Grembergen, W. (2017). Antecedents of
IT governance effectiveness: An empirical examination in Brazilian firms. Journal of
Information Systems, 31(1), 41-57.
MacCurtain, S., Flood, P. C., Ramamoorthy, N., West, M. A. & Dawson, J. F. (2010). The top
management team, reflexivity, knowledge sharing and new product performance: A study of
the Irish software industry. Creativity and Innovation Management, 19(3): 219-232.

22
Martin, N., Gregor, S., & Hart, D. N. (2005). The social dimensions of business and IS/IT
alignment: Case studies of six public-sector organizations. Australian Accounting Review,
15(3), 28-38.
Midavaine, J., Dolfsma, W., & Aalbers, R. (2016). Board diversity and R&D investment.
Management Decision, 54(3), 558-569.
Miller, C. C., Burke, L. M., & Glick, W. H. (1998). Cognitive diversity along upper-echelon
executives: Implications for strategic decision processes. Strategic Management Journal,
19(1), 39-58.
Mohamed, N., & Gian Singh, J. K. (2012). A conceptual framework for information technology
governance effectiveness in private organizations. Information Management & Computer
Security, 20(2), 88-106.
Neirotti, P., & Paolucci, E. (2007). Assessing the strategic value of Information Technology: An
analysis on the insurance sector. Information & Management, 44, 568–582.
Newby, M., Nguyen, T. H., & Waring, T. S. (2014). Understanding customer relationship
management technology adoption in small and medium-sized enterprises. Journal of
Enterprise Information Management, 27(5), 541-580.
Nfuka, E. N., & Rusu, L. (2011). The effect of critical success factors on IT governance
performance. Industrial Management & Data Systems, 111(9), 1418-1448.
Parent, M., & Reich, B. H. (2009). Governing information technology risk. California
Management Review, 51(3), 134-152.
Pelled, L. H. (1996). Demographic diversity, conflict, and work group outcomes: An intervening
process theory. Organization Science, 7, 615–631.
Pereira, R., & Mira da Silva, M. (2012). Designing a new integrated IT governance and IT
management framework based on both scientific and practitioner viewpoint. International
Journal of Enterprise Information Systems, 8(4), 1-43.
Pérez Lorences, P., & L. F. Garcia Avila. (2013). The evaluation and improvement of IT
governance. Journal of Information Systems and Technology Management, 10(2), 219-234.
Peterson, R. (2004). Crafting information technology governance. Information Systems
Management, 21(4), 7-22.
Qian, C., Cao, Q and Takeuchi, R. (2013). Top management team functional diversity and
organizational innovation in China: The moderating effects of environment. Strategic
Management Journal, 34(1), 11-120.
Rivard, S., Raymond, L., & Verreault, D. (2006). Resource-based view and competitive strategy:
An integrated model of the contribution of information technology to firm performance.
Journal of Strategic Information Systems, 15, 29-50.
Scheeren, A. W., Fontes-Filho, J. R., & Tavares. E. (2013). Impacts of a relationship model of
informational technology governance: An analysis of managerial perceptions in Brazil.
Journal of Information Systems of Technology and Management, 10(3), 621-642.
Simons, T., Hope Pelled, L., & Smith, K. A. (1999). Making use of difference: diversity, debate,
and decision comprehensiveness in top management teams. Academy of Management
Journal, 42(6), 662-673.
Simonsson, M., Johnson, P., & Ekstedt, M. (2010). The effect of IT governance maturity on IT
governance performance. Information Systems Management, 27, 1024.
Stone, W. S., & Tudor, T. R. (2005). The effects of functional background experience, industry
experience, generic executive management experience on perceived environmental
uncertainty and firm performance. Advances in Competitiveness Research, 13(1), 1-8.
Surowiecki, J. (2005). The Wisdom of Crowds. New York, NY: Random House.

23
Talke, K., Salomo, S., & Rost, K. (2010). How top management team diversity affects
innovativeness and performance via the strategic choice to focus on innovation fields.
Research Policy, 39(7), 907-918.
Tallon, P., Ramirez, R. V., & Short, J. E. (2014). The information artefact in IT governance:
Toward a theory of information governance. Journal of Management Information Systems,
30(3), 141-177.
Tallon, P. (2014). Do you see what I see? The search for consensus among executives’
perceptions of IT business value. European Journal of Information Systems, 23, 306-325.
Taniman, C. A., & O’Shannassy, T. F. (2015). Exploring the influence of chief executive officer
professional development and work context on organisation performance: A multi-theoretic
perspective. Journal of Management & Organization, 21(5), 675-694.
Teo, T. SH. & Pian, Y. (2003). A contingency perspective on Internet adoption and competitive
advantage. European Journal of Information Systems, 12(2), 78-92.
Van Grembergen, W. & De Haes, S. (2009). Enterprise governance of information technology –
Achieving strategic alignment and value. New York, NY: Springer Science + Business
Media.
Webb, P., Pollard, C., & Ridley, G. (2006). Attempting to define IT governance: Wisdom or
folly? Proceedings of the 39th Hawaii International Conference on System Sciences, IEEE
Publishing, 1-10.
Weill, P., & Ross, J. W. (2004). IT Governance: How top performers manage IT decision rights
for superior results. Boston, MA: Harvard Business School Press.
Weill, P., & Ross, J. W. (2005). A matrixed approach to designing IT governance. MIT Sloan
Management Review, 46(2), 26-34.
Wilkin, C. L., & Chenhall, R. H. (2010). A review of IT governance: A taxonomy to inform
accounting information systems. Journal of Information Systems, 24(2), 107-146.
Wilson, P., & Pollard, C. (2009). Exploring IT governance in theory and practice in a large multi-
national organization in Australia. Information Systems Management, 26, 98-109.
Wu, Y., Wei, Z, & Liang, Q. (2011). Top management team diversity and strategic change. The
moderating effects of pay imparity and organization slack. Journal of Organizational Change
Management, 24(3), 267-281.
Xue, Y., Liang, H., & Boulton, W. R. (2008). Information technology governance in information
technology decision processes: The impact of investment characteristics, external
environment, and internal context. MIS Quarterly, 32(1), 67-96.
Yeh, C-H., Lee, G-G., and Pai, J-C. (2012). How information system capability affects e-business
information technology strategy implementation. Business Process Management Journal,
18(2), 197-218.

24
APPENDIX
Analysis of group differences – demographic diversity characteristics Variables Means Statistics Mean pairs
with significant differencesb, c
Gr1
n=35
Gr2
n=11
Gr3
n=18
F or Welcha, c
Educational diversity 0.72 0.70 0.79 4.304** Gr1-3**; Gr2-3**
Functional diversity 0.80 0.77 0.82 2.436 -
Industry diversity 0.62 0.72 0.69 3.206** Gr1-2*
Tenure diversity 0.57 0.29 0.86 79.105*** Gr1-2***; Gr1-3***; Gr2-3***
a If the variance is equal among groups according to the Levene Test, we examine the F Statistic; if not, we examine the Welch
Statistic. b Multiple comparisons between groups according to the Tukey HSD Test, if variance is equal among groups; if not, we examine
Dunnett’s T3 Test. c *p≤0.10; **p≤0.05; *** p≤0.01.
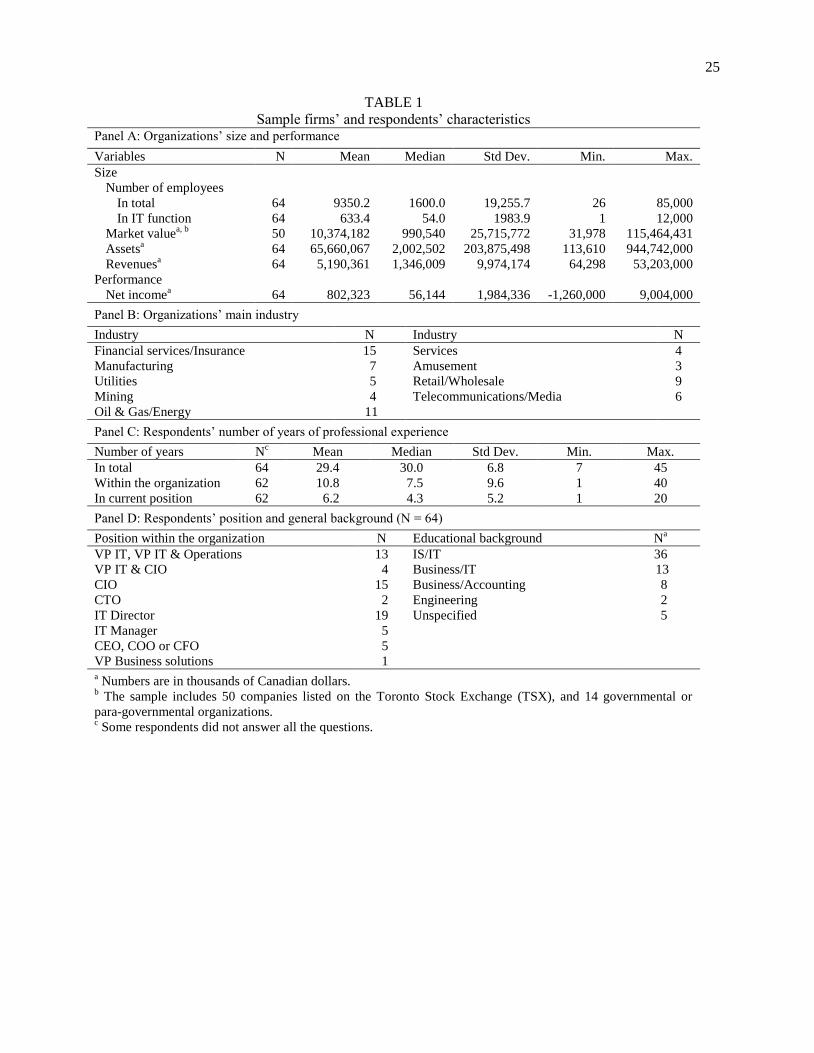
25
TABLE 1
Sample firms’ and respondents’ characteristics
Panel A: Organizations’ size and performance
Variables N
Mean Median Std Dev. Min. Max.
Size
Number of employees
In total
In IT function
64
64
9350.2
633.4
1600.0
54.0
19,255.7
1983.9
26
1
85,000
12,000
Market valuea, b
50 10,374,182 990,540 25,715,772 31,978 115,464,431
Assetsa
64 65,660,067 2,002,502 203,875,498 113,610 944,742,000
Revenuesa
64 5,190,361 1,346,009 9,974,174 64,298 53,203,000
Performance
Net incomea
64 802,323 56,144 1,984,336 -1,260,000 9,004,000
Panel B: Organizations’ main industry
Industry N Industry N
Financial services/Insurance 15 Services 4
Manufacturing 7 Amusement 3
Utilities 5 Retail/Wholesale 9
Mining 4 Telecommunications/Media 6
Oil & Gas/Energy 11
Panel C: Respondents’ number of years of professional experience
Number of years Nc
Mean Median Std Dev. Min. Max.
In total
Within the organization
In current position
64
62
62
29.4
10.8
6.2
30.0
7.5
4.3
6.8
9.6
5.2
7
1
1
45
40
20
Panel D: Respondents’ position and general background (N = 64)
Position within the organization N Educational background
Na
VP IT, VP IT & Operations 13 IS/IT 36
VP IT & CIO 4 Business/IT 13
CIO 15 Business/Accounting 8
CTO 2 Engineering 2
IT Director 19 Unspecified 5
IT Manager 5
CEO, COO or CFO 5
VP Business solutions 1 a Numbers are in thousands of Canadian dollars.
b The sample includes 50 companies listed on the Toronto Stock Exchange (TSX), and 14 governmental or
para-governmental organizations.
c Some respondents did not answer all the questions.
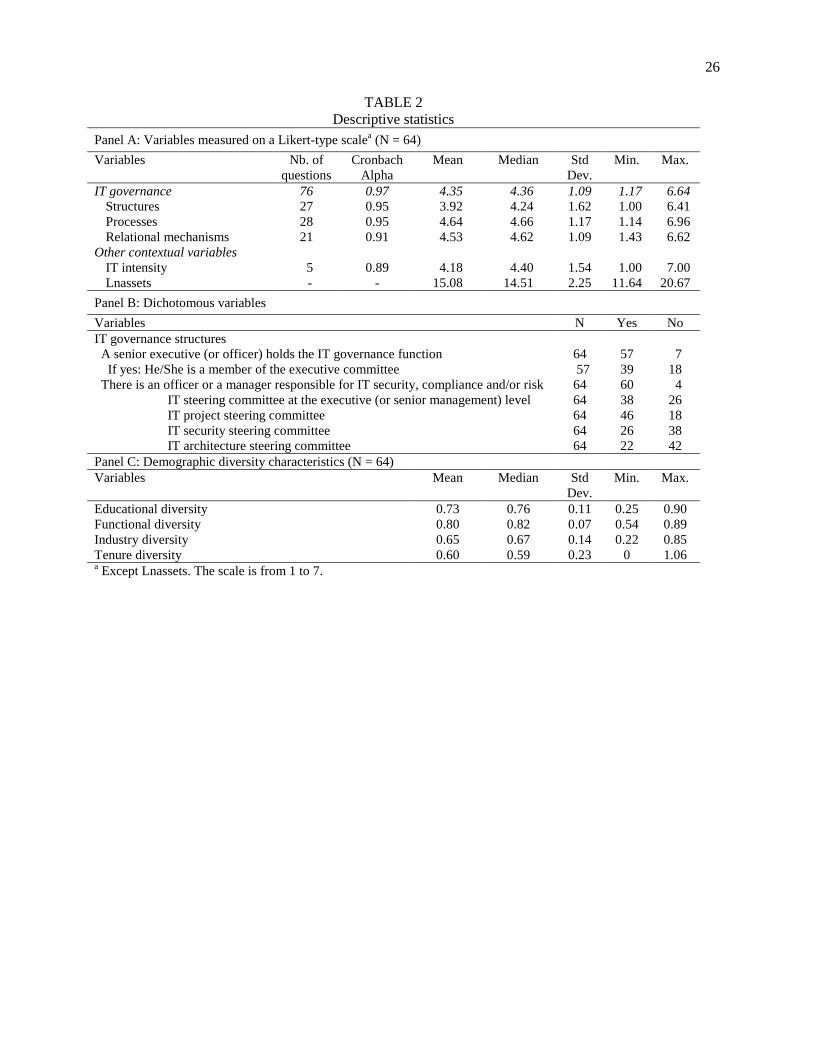
26
TABLE 2
Descriptive statistics
Panel A: Variables measured on a Likert-type scalea (N = 64)
Variables
Nb. of
questions
Cronbach
Alpha
Mean Median Std
Dev.
Min. Max.
IT governance 76 0.97 4.35 4.36 1.09 1.17 6.64
Structures 27 0.95 3.92 4.24 1.62 1.00 6.41
Processes 28 0.95 4.64 4.66 1.17 1.14 6.96
Relational mechanisms 21 0.91 4.53 4.62 1.09 1.43 6.62
Other contextual variables
IT intensity 5 0.89 4.18 4.40 1.54 1.00 7.00
Lnassets - - 15.08 14.51 2.25 11.64 20.67
Panel B: Dichotomous variables
Variables N
Yes No
IT governance structures
A senior executive (or officer) holds the IT governance function
If yes: He/She is a member of the executive committee
64
57
57
39
7
18
There is an officer or a manager responsible for IT security, compliance and/or risk 64 60 4
IT steering committee at the executive (or senior management) level 64 38 26
IT project steering committee 64 46 18
IT security steering committee 64 26 38
IT architecture steering committee 64 22 42
Panel C: Demographic diversity characteristics (N = 64)
Variables
Mean Median Std
Dev.
Min. Max.
Educational diversity 0.73 0.76 0.11 0.25 0.90
Functional diversity 0.80 0.82 0.07 0.54 0.89
Industry diversity 0.65 0.67 0.14 0.22 0.85
Tenure diversity 0.60 0.59 0.23 0 1.06 a Except Lnassets. The scale is from 1 to 7.

27
TABLE 3
Analyses of between-group differences – IT governance and other contextual variables
Demographic diversity groups according to cluster analysis Variables
a
Meansb
Statistics Group pairs with
significant differencesc, d
Gr1
n=35
Gr2
n=11
Gr3
n=18
F or Welchc, d
IT governance 4.17 4.02 4.93 3.84** Gr1-3**; Gr2-3*
Structures 3.78 3.17 4.66 3.50** Gr2-3**
Processes 4.39 4.65 5.12 2.43* Gr1-3*
Relational mechanisms 4.36 4.27 5.01 5.73* Gr1-3*
Other contextual variablese
IT intensity 4.09 3.47 4.79 4.48** Gr2-3**
Lnassets 14.60 14.87 16.13 3.01* Gr1-3**
a Variables measured on a Likert-type scale from 1 to 7, except for Lnassets.
b Gr1=Low industry-moderate tenure diversity; Gr2=High industry-low tenure diversity; Gr3=High educational-high
tenure diversity. c If the variance is equal among groups according to the Levene Test, we examine the F Statistic; if not, we examine
the Welch Statistic. For multiple comparisons between groups, we use the Tukey HSD Test if variance is equal
among groups; if not, we examine Dunnett’s T3 Test. d **p≤0.05; *p≤0.10.
e When classifying organizations into four industries (Financial services and Insurance; Manufacturing and Utilities;
Oil&Gas/Energy and Mining; and Services, Amusement, Retail/Wholesale and Telecommunications/Media
organizations, n = 15, 12, 15, 22 respectively), a cross tabulation of organizations’ industry and cluster groups
indicates no significant difference between groups according to industry membership.

28
TABLE 4
Analysis of demographic diversity group differences – IT governance structures Variablesa Meansb Statistics Mean pairs
with significant differencesd, e
Gr1
n=35
Gr2
n=11
Gr3
n=18
F or Welchc, e
1. There is a senior executive (or
officer) who is in charge of IT
governance.
2. The senior executive (or officer)
in charge of IT governance is a
full member of the executive
committee.
6.14
4.77
6.45
4.82
6.67
4.33
0.473
0.146
---
---
3. An officer or manager responsible
for IT security, compliance and/or
risk:
a) is responsible for developing and
testing privacy and security
policies.
b) has sufficient authority to enforce
privacy and security policies.
c) is responsible for assessing IT
risks (e.g., impact on the business
continuity).
d) is responsible for managing
changes resulting from IT
projects.
Mean 3a to 3d
5.29
4.54
5.12
4.83
5.08
5.45
5.09
4.36
5.27
5.45
6.00
5.50
4.80
4.78
5.65
0.872
1.764
0.188
0.827
1.790
---
---
---
---
---
4. An IT steering committee at an
executive (or senior management)
level:
a) meets at least four times a year.
b) formulates the IT strategies/
policies of the organization.
c) is involved in implementing the
IT strategies/policies.
d) is responsible for determining
business priorities in IT
investments.
e) provides strategic direction to IT
projects.
f) coordinates IT practices.
g) provides leadership in deriving
benefits from IT.
h) actively participates in the
organization’s IT decision-
making processes.
i) understands the business and the
IT objectives.
j) makes IT investment decisions
based on business needs.
k) promotes IT strategic flexibility to
meet the changing needs of the
organization’s internal and
external environment.
l) has business representatives with
extensive IT knowledge.
m) has IT representatives with
extensive business knowledge.
n) has representatives from all major
areas of the organization.
o) has the most appropriate
representatives from each area.
Mean 4a to 4o
4.29
3.06
3.40
4.11
3.57
2.40
2.86
3.29
3.69
3.83
3.11
2.66
3.57
3.74
3.71
3.42
3.00
2.91
3.00
2.36
2.45
2.18
2.82
2.91
2.82
2.45
2.64
1.45
2.73
1.82
2.27
2.52
5.33
4.61
4.72
4.83
4.94
3.78
4.33
4.78
4.83
5.17
4.72
3.28
4.33
4.61
4.72
4.60
2.644*
2.075
3.536**
2.813*
2.533*
2.591*
2.352
3.773**
3.454**
3.233**
2.498
2.519**
6.192***
1.696
6.580***
3.843**
---
Gr1-3*
---
Gr2-3**
Gr2-3**
Gr1-3*
Gr1-3*
---
---
Gr2-3**
Gr1-3*; Gr2-3*
Gr1-2**; Gr2-3**
---
Gr1-2**; Gr2-3***
Gr2-3**
Gr2-3**
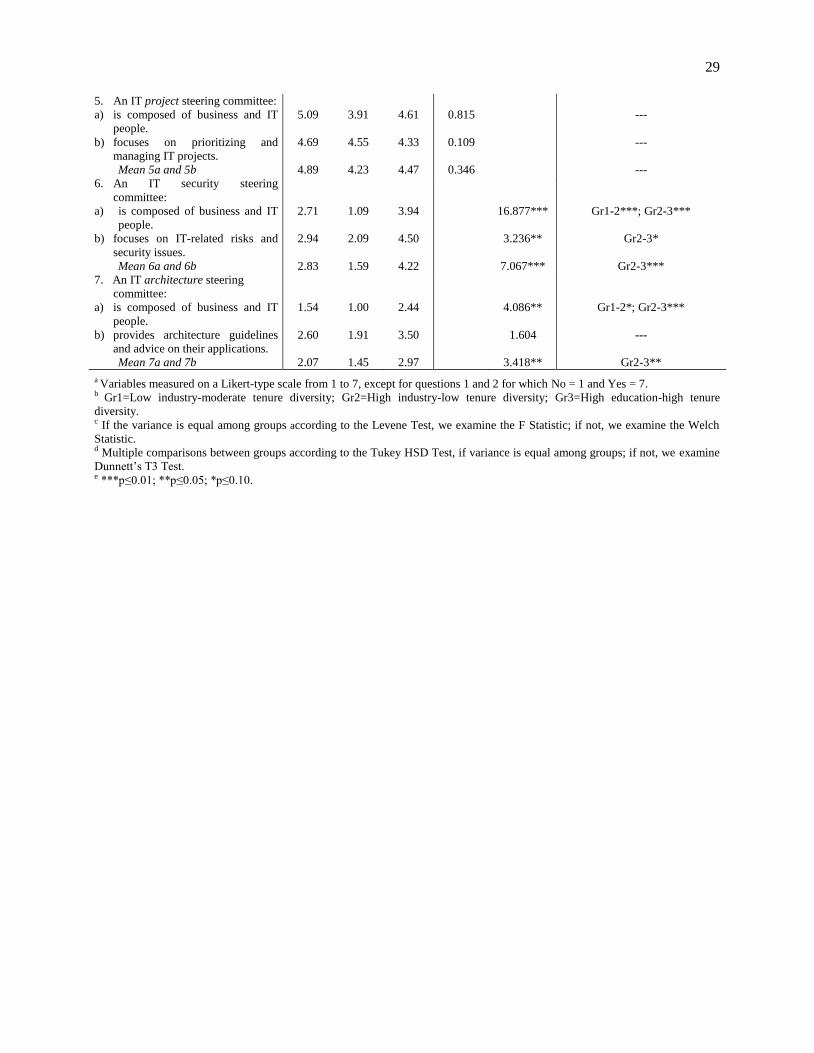
29
5. An IT project steering committee:
a) is composed of business and IT
people.
b) focuses on prioritizing and
managing IT projects.
Mean 5a and 5b
5.09
4.69
4.89
3.91
4.55
4.23
4.61
4.33
4.47
0.815
0.109
0.346
---
---
---
6. An IT security steering
committee:
a) is composed of business and IT
people.
b) focuses on IT-related risks and
security issues.
Mean 6a and 6b
2.71
2.94
2.83
1.09
2.09
1.59
3.94
4.50
4.22
16.877***
3.236**
7.067***
Gr1-2***; Gr2-3***
Gr2-3*
Gr2-3***
7. An IT architecture steering
committee:
a) is composed of business and IT
people.
b) provides architecture guidelines
and advice on their applications.
Mean 7a and 7b
1.54
2.60
2.07
1.00
1.91
1.45
2.44
3.50
2.97
4.086**
1.604
3.418**
Gr1-2*; Gr2-3***
---
Gr2-3**
a Variables measured on a Likert-type scale from 1 to 7, except for questions 1 and 2 for which No = 1 and Yes = 7. b Gr1=Low industry-moderate tenure diversity; Gr2=High industry-low tenure diversity; Gr3=High education-high tenure
diversity. c If the variance is equal among groups according to the Levene Test, we examine the F Statistic; if not, we examine the Welch
Statistic. d Multiple comparisons between groups according to the Tukey HSD Test, if variance is equal among groups; if not, we examine
Dunnett’s T3 Test. e ***p≤0.01; **p≤0.05; *p≤0.10.

30
TABLE 5
Analysis of demographic diversity group differences – IT governance processes Variablesa Meansb Statistics Mean pairs
with significant differencesd, e
Gr1
n=35
Gr2
n=11
Gr3
n=18
F or Welchc, e
GENERAL
1. A formal planning process is used
to define the IT strategy.
2. A formal planning process is used
to update the IT strategy.
3. IT budgets are used to control and
report on IT activities/investments.
4. There are IT performance
measures (e.g. organization
contribution, user orientation,
operational excellence or future
orientation).
5. Methodologies are used to charge
back IT costs to business units.
6. There are formal agreements
between business and IT
departments about IT development
projects or IT operations.
7. An IT governance and control
framework (such as COBIT) is used
to govern IT.
8. The COSO (Committee of
Sponsoring Organizations) or
ERM (Enterprise Risk
Management) framework for
internal control is used to govern
IT.
9. There are regular self-assessments
or independent assurance activities
on IT governance and control.
10. The organization regularly engages
outside agencies to test its security
systems or to conduct security
audits.
4.55
4.38
5.12
3.72
3.23
3.72
3.63
2.83
3.83
4.38
4.91
4.82
5.36
4.55
3.36
3.91
3.18
3.36
4.45
5.09
5.61
5.50
6.00
4.78
3.83
4.72
4.89
4.50
5.67
6.00
2.152
2.402*
2.099
2.029
0.344
1.201
2.927*
3.712**
5.958***
5.377***
---
Gr1-3*
---
---
---
---
Gr2-3*
Gr1-3**
Gr1-3***
Gr1-3***

31
EVALUATION, SELECTION AND
MANAGEMENT OF IT PROJECTS
11. There is a prioritization process for
IT investments and projects in
which business and IT are
involved (e.g. business cases,
return on investment).
12. Explicit criteria are used to help
evaluate IT projects.
13. Both qualitative and quantitative
criteria are used to evaluate IT
projects.
14. A cost/benefit analysis is used to
evaluate IT projects.
15. Project cost data are fully
identified (direct, indirect,
ongoing).
16. IT investment benefits are
identified using quantitative and/or
qualitative data that relate directly
to business strategies and
performance improvement
(tracking IT business value).
17. The expected timeframes for
development and implementation
are explicitly specified.
18. All foreseeable risks are identified.
19. The organizational impacts of IT
projects are evaluated.
20. The availability of personnel
resources relative to IT projects is
assessed.
21. Project management methodology
is used to manage IT projects.
22. Processes are used to monitor the
planned business benefits during
and after implementation of the IT
investments/projects.
5.18
4.73
5.10
4.58
4.90
4.73
5.21
4.73
4.90
4.93
5.67
3.70
5.55
4.82
5.18
5.45
5.18
4.00
5.64
5.27
5.18
5.00
5.36
3.82
6.17
5.08
5.67
5.28
5.61
4.39
5.72
5.17
5.17
5.44
6.39
3.72
0.733
0.812
1.778
3.882**
0.297
1.748
1.153
0.904
0.904
0.299
1.035
0.020
Gr1-3**
---
---
---
---
---
---
---
---
---
---
---
IT STRATEGIES AND POLICIES:
23. are clearly written so that
employees impacted by IT projects
can understand them.
24. provide these employees with
extensive guidance on how to
manage IT projects.
25. define objectives and expectations,
such as accountability and
responsibility.
26. are communicated to all employees
impacted by IT projects (portals or
other information services
sources).
27. are accessible to all employees
impacted by IT projects.
28. are updated following feedback
from employees.
4.35
4.04
4.07
4.04
4.58
4.12
4.55
4.45
4.45
4.73
4.64
3.82
4.44
4.94
5.11
4.67
4.67
4.33
0.054
1.288
0.017
0.346
2.061
3.938**
---
---
Gr1-3**
---
---
---
a Variables measured on a Likert-type scale from 1 to 7. b Gr1=Low industry-moderate tenure diversity; Gr2=High industry-low tenure diversity; Gr3=High education-high tenure diversity. c, If the variance is equal among groups according to the Levene Test, we examine the F Statistic; if not, we examine the Welch Statistic. d Multiple comparisons between groups according to the Tukey HSD Test, if variance is equal among groups; if not, we examine Dunnett’s T3 Test. e ***p≤0.01; **p≤0.05; *p≤0.10.

32
TABLE 6
Analysis of demographic diversity group differences – IT governance relational mechanisms Variablesa Meansb Statistics Mean pairs with significant
differencesd
(**p≤0.05) Gr1
n=35
Gr2
n=11
Gr3
n=18
F or Welchc
(***p≤0.01; *p≤0.10)
1. The senior executive/officer in charge
of IT articulates a vision for IT’s role
in the organization.
2. The senior executive/officer in charge
of IT ensures that the vision for IT’s
role is clearly understood by managers
throughout the organization.
3. Business / administrative managers act
as in-between business and IT.
4. Senior business and IT management
act as “partners.”
5. Senior business and IT management
informally discuss the organization’s
activities and IT’s role.
6. There is job rotation (IT staff working
in the business units and business
people working in IT).
7. Business and IT people are physically
located close to each other.
8. Business people are trained in IT or IT
people are trained in business.
9. Systems such as Intranet are used to
share and distribute knowledge about
the IT governance framework,
responsibilities, tasks, etc.
10. Internal corporate communication
regularly addresses general IT issues.
11. There are campaigns explaining the
need for IT governance to business and
IT people.
5.43
4.91
3.90
4.96
5.39
1.99
4.83
3.53
4.26
3.91
2.74
5.36
4.91
3.82
4.82
5.45
2.09
4.36
3.82
4.18
3.82
2.73
5.78
5.56
4.61
5.89
5.61
2.61
5.17
3.89
5.44
4.17
3.72
0.366
1.313
0.904
0.202
1.138
0.733
0.359
2.274
0.167
2.002
5.669***
---
---
---
Gr1-3**; Gr2-3**
---
---
---
---
---
---
---
THE IT EXECUTIVE OR SENIOR MANAGER:
12 regularly attends business planning
meetings.
13 contributes to the formulation of
business goals.
14 has regular informal contacts with
executive management.
15 has easy access to the CEO.
16 has frequent contacts with the CEO.
5.03
4.77
5.86
5.66
5.06
5.09
4.64
5.82
5.55
5.18
5.89
5.61
6.33
6.11
6.00
1.073
1.150
0.742
0.420
1.414
---
---
---
---
---
THE CEO:
17 plays an important role in the IT
steering committee.
18 becomes knowledgeable about
competitors' use of IT.
19 has frequent informal contacts with IT
management.
20 becomes knowledgeable about IT
opportunities within the firm.
21 regards spending on IT as strategic
investments rather than expenses to be
controlled.
3.31
3.29
4.40
3.94
4.40
3.36
3.09
4.09
3.91
3.55
3.83
4.22
4.61
4.78
5.33
0.203
1.080
3.097*
0.311
1.475
---
---
---
---
Gr2-3**
a Variables measured on a Likert-type scale from 1 to 7. b Gr1=Low industry-moderate tenure diversity; Gr2=High industry-low tenure diversity; Gr3=High education-high tenure
diversity. c If the variance is equal among groups according to the Levene Test, we examine the F Statistic; if not, we examine the Welch
Statistic. d Multiple comparisons between groups according to the Tukey HSD Test, if variance is equal among groups; if not, we examine
Dunnett’s T3 Test.

33
TABLE 7
Overview - Degree of use of IT governance mechanisms and other attributes according to demographic diversity profiles DEMOGRAPHIC DIVERSITY PROFILES
ATTRIBUTES LOW INDUSTRY-
MODERATE TENURE
HIGH INDUSTRY-
LOW TENURE
HIGH EDUCATION-
HIGH TENURE
Degree of use of IT governance mechanisms
Structures
Processes
Relational mechanisms
Overall
Specific structures:
Officer/manager responsible for IT security, compliance and/or risk
IT steering committee at an executive/senior management level
IT project steering committee
IT security steering committee
IT architecture steering committee
Specific processes:
A formal planning process is used to update the IT strategy.
An IT governance and control framework (such as CobiT) is used to govern IT.
The COSO (Committee of Sponsoring Organizations) or ERM (Enterprise Risk
Management) framework for internal control is used to govern IT.
There are regular self-assessments or independent assurance activities on IT
governance and control.
Outside agencies are regularly hired to test the organization’s security systems or
to conduct security audits.
There is a prioritization process for IT investments and projects in which business
and IT are involved (e.g. business cases, return on investment).
IT strategies and policies define objectives and expectations, such as
accountability and responsibility.
Specific relational mechanisms:
Senior business and IT management act as “partners.”
The CEO regards spending on IT as strategic investments rather than expenses to
be controlled.
Moderate
Moderate
Moderate
Moderate
Moderate-High
Low
Moderate-High
Low
Very low
Moderate
Moderate
Low
Moderate
Moderate
Moderate-High
Moderate
Moderate-High
Moderate
Low
Moderate-High
Moderate
Moderate
Moderate-High
Low
Moderate
Very low
Very low
Moderate-High
Low
Low
Moderate
Moderate-High
High
Moderate
Moderate-High
Moderate
Moderate-High
Moderate-High
Moderate-High
Moderate-High
High
Moderate-High
Moderate
Moderate
Low
High
Moderate-High
Moderate-High
High
Very high
Very high
Moderate-High
High
Moderate-High
Other attributes
IT intensity
Moderate
Low
Moderate-High
Size (Lnassets) Medium-Large Medium-Large Large