Embed Size (px)
Citation preview
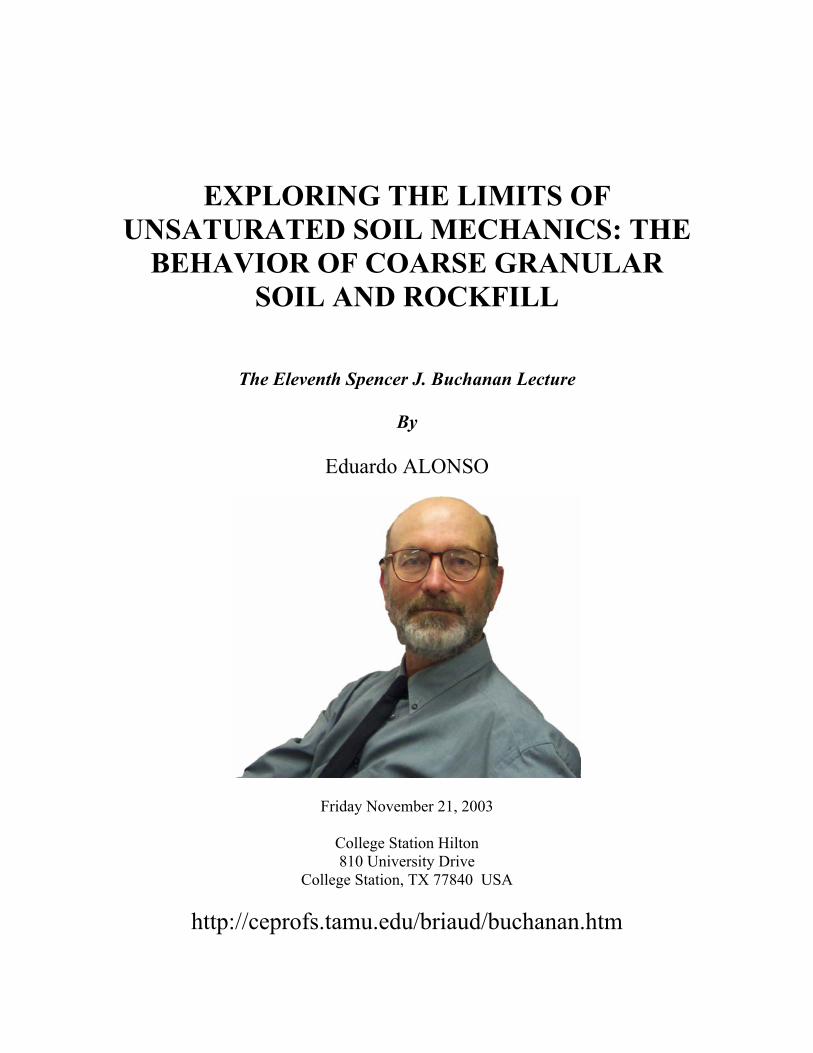
EXPLORING THE LIMITS OF UNSATURATED SOIL MECHANICS: THE
BEHAVIOR OF COARSE GRANULAR SOIL AND ROCKFILL
The Eleventh Spencer J. Buchanan Lecture
By
Eduardo ALONSO
Friday November 21, 2003
College Station Hilton 810 University Drive
College Station, TX 77840 USA
http://ceprofs.tamu.edu/briaud/buchanan.htm
2
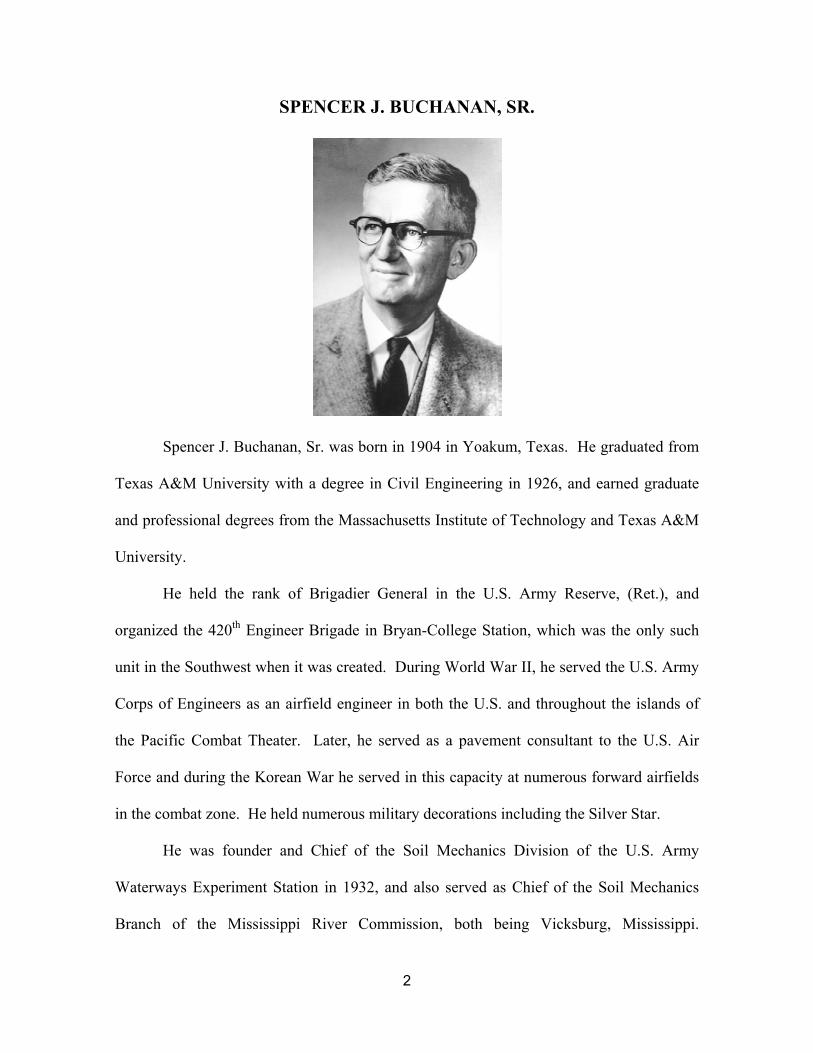
SPENCER J. BUCHANAN, SR.
Spencer J. Buchanan, Sr. was born in 1904 in Yoakum, Texas. He graduated from
Texas A&M University with a degree in Civil Engineering in 1926, and earned graduate
and professional degrees from the Massachusetts Institute of Technology and Texas A&M
University.
He held the rank of Brigadier General in the U.S. Army Reserve, (Ret.), and
organized the 420th Engineer Brigade in Bryan-College Station, which was the only such
unit in the Southwest when it was created. During World War II, he served the U.S. Army
Corps of Engineers as an airfield engineer in both the U.S. and throughout the islands of
the Pacific Combat Theater. Later, he served as a pavement consultant to the U.S. Air
Force and during the Korean War he served in this capacity at numerous forward airfields
in the combat zone. He held numerous military decorations including the Silver Star.
He was founder and Chief of the Soil Mechanics Division of the U.S. Army
Waterways Experiment Station in 1932, and also served as Chief of the Soil Mechanics
Branch of the Mississippi River Commission, both being Vicksburg, Mississippi.
3
Professor Buchanan also founded the Soil Mechanics Division of the Department
of Civil Engineering at Texas A&M University in 1946. He held the title of Distinguished
Professor of Soil Mechanics and Foundation Engineering in that department. He retired
from that position in 1969 and was named professor Emeritus. In 1982, he received the
College of Engineering Alumni Honor Award from Texas A&M University.
He was the founder and president of Spencer J. Buchanan & Associates, Inc.,
Consulting Engineers, and Soil Mechanics Incorporated in Bryan, Texas. These firms
were involved in numerous major international projects, including twenty-five RAF-USAF
airfields in England. They also conducted Air Force funded evaluation of all U.S. Air
Training Command airfields in this country. His firm also did foundation investigations
for downtown expressway systems in Milwaukee, Wisconsin, St. Paul, Minnesota; Lake
Charles, Louisiana; Dayton, Ohio, and on Interstate Highways across Louisiana. Mr.
Buchanan did consulting work for the Exxon Corporation, Dow Chemical Company,
Conoco, Monsanto, and others.
Professor Buchanan was active in the Bryan Rotary Club, Sigma Alpha Epsilon
Fraternity, Tau Beta Pi, Phi Kappa Phi, Chi Epsilon, served as faculty advisor to the
Student Chapter of the American Society of Civil Engineers, and was a Fellow of the
Society of American Military Engineers. In 1979 he received the award for Outstanding
Service from the American Society of Civil Engineers.
Professor Buchanan was a participant in every International Conference on Soil
Mechanics and Foundation Engineering since 1936. He served as a general chairman of
the International Research and Engineering Conferences on Expansive Clay Soils at Texas
A&M University, which were held in 1965 and 1969.

4
Spencer J. Buchanan, Sr., was considered a world leader in geotechnical
engineering, a Distinguished Texas A&M Professor, and one of the founders of the Bryan
Boy’s Club. He died on February 4, 1982, at the age of 78, in a Houston hospital after an
illness, which lasted several months.
5
The Spencer J. Buchanan ’26 Chair in Civil Engineering
The College of Engineering and the Department of Civil Engineering gratefully
recognize the generosity of the following individuals, corporations, foundations, and
organizations for their part in helping to establish the Spencer J. Buchanan ’26
Professorship in Civil Engineering. Created in 1992 to honor a world leader in soil
mechanics and foundation engineering, as well as a distinguished Texas A&M University
professor, the Buchanan Professorship supports a wide range of enriched educational
activities in civil and geotechnical engineering. In 2002, this professorship became the
Spencer J. Buchanan ’26 Chair in Civil Engineering.
Founding Donor
C. Darrow Hooper ‘53
Benefactors ($5,000+) ETTL Engineering and Consulting Inc. Douglas E. Flatt ‘53 Patrons ($1,000 - $4,999) Dionel E. Aviles ‘53 Aviles Engineering Corporation Willy F. Bohlmann, Jr. ‘50 Mark W. Buchanan The Dow Chemical Company Foundation Wayne A. Dunlap ‘52 Br. Gen. John C.B. Elliott Perry G. Hector ‘54 James D. Murff ‘70 Donald E. Ray ‘68 Spencer Buchanan Associates, Inc. L. Anthony Wolfskill ‘53 Fellows ($500 - $999) John R. Birdwell ‘53 Joe L. Cooper ‘56

6
Harvey J. Haas ‘59 Conrad S. Hinshaw ‘39 O’Malley & Clay, Inc. Robert S. Patton ‘61 R.R. & Shirley Bryan Alton T. Tyler ‘44 Members ($100 - $499) Adams Consulting Engineers, Inc. Demetrios A. Armenakis ‘58 Eli F. Baker ‘47 B.E. Beecroft ‘51 Fred J. Benson ‘36 G.R. Birdwell Corporation, Inc. Craig C. Brown ‘75 Donald N. Brown ‘43 Ronald C. Catchings ‘65 Ralph W. Clement ‘57 Coastal Bend Engineering Association John W. Cooper III ‘46 George W. Cox ‘35 Murray A. Crutcher ‘74 Dodd Geotechnical Engineering Donald D. Dunlap ‘58 Edmond L. Faust ‘47 David T. Finley ‘82 Charles B. Foster, Jr. ‘38 Benjamin D. Franklin ‘57 Thomas E. Frazier ‘77 William F. Gibson ‘59 Cosmo F. Guido ‘44 Joe G. Hanover ‘40 John L. Hermon ‘63 William and Mary Holland W. Ronald Hudson ‘54 W.R. Hudson Engineering Homer A. Hunter ‘25 Iyllis Lee Hutchin Mr. & Mrs. Walter J. Hutchin ‘47 Mary Kay Jackson ‘83 Hubert O. Johnson, Jr. ‘41 Lt. Col. William T. Johnson, Jr. ‘50 Homer C. Keeter, Jr. ‘47 Richard W. Kistner ‘65 Charles M. Kitchell, Jr. ‘51

7
Mr. & Mrs. Donald Klinzing Andrew & Bobbie Layman Mr. & Mrs. W.A. Leaterhman, Jr. F. Lane Lynch ‘60 Charles McGinnis ‘49 Jes D. McIver ‘51 Charles B. McKerall, Jr. ‘50 Morrison-Knudsen Co.,Inc. Jack R. Nickel ‘68 Roy E. Olson Nicholas Paraska ‘47 Daniel E. Pickett ‘63 Pickett-Jacobs Consultants, Inc. Richard C. Pierce ‘51 Robert J. Province ‘60 David B. Richardson ‘76 David E. Roberts ‘61 Walter E. Ruff ‘46 Weldon Jerrell Sartor ‘58 Charles S. Skillman, Jr. ‘52 Soil Drilling Services Louis L. Stuart, Jr. ‘52 Ronald G. Tolson, Jr. ‘60 Hershel G. Truelove ‘52 Mr. & Mrs. Thurman Wathen Ronald D. Wells ‘70 Andrew L. Williams, Jr. ‘50 Dr. & Mrs. James T.P. Yao Associates ($25 - $99) Mr. & Mrs. John Paul Abbott Charles A. Arnold ‘55 Bayshore Surveying Instrument Co. Carl F. Braunig, Jr. ‘45 Mrs. E.D. Brewster Norman J. Brown ‘ 49 Mr. & Mrs. Stewart E. Brown Robert P. Broussard John Buxton ‘55 Caldwell Jewelers Lawrence & Margaret Cecil Howard T. Chang ‘42 Mrs. Lucille Hearon Chipley Caroline R. Crompton

8
Mr. & Mrs. Joseph R. Compton Harry & Josephine Coyle Robert J. Creel ‘53 Robert E. Crosser ‘49 O Dexter Dabbs Guy & Mary Bell Davis Robert & Stephanie Donaho Mr. Charles A. Drabek Stanley A. Duitscher ‘55 Mr. & Mrs. Nelson D. Durst George H. Ewing ‘46 Edmond & Virginia Faust First City National Bank of Bryan Neil E. Fisher ‘75 Peter C. Forster ‘63 Mr. & Mrs. Albert R. Frankson Maj. Gen Guy & Margaret Goddard John E. Goin ‘68 Mr. & Mrs. Dick B. Granger Howard J. Guba ‘63 James & Doris Hannigan Scott W. Holman III ‘80 Lee R. Howard ‘52 Mrs. Jack Howell Col. Robert & Carolyn Hughes William V. Jacobs ‘73 Ronald S. Jary ‘65 Mr. Shoudong Jian ‘01 Richard & Earlene G. Jones Stanley R. Kelley ‘47 Elmer E. Kilgore ‘54 Kenneth W. Kindle ‘57 Tom B. King Walter A. Klein ‘60 Kenneth W. Korb ‘67 Dr. & Mrs. George W. Kunze Larry K. Laengrich ‘86 Monroe A. Landry ‘50 Lawrence & Margaret Laurion Mr. & Mrs. Charles A Lawler Mrs. John M. Lawrence, Jr. Jack & Lucille Newby Lockwood, Andrews, & Newman, Inc. Robert & Marilyn Lytton Linwood E. Lufkin ‘63 W.T. McDonald

9
James & Maria McPhail Mr. & Mrs. Clifford A. Miller Minann, Inc. Mr. & Mrs. J. Louis Odle Leo Odom Mr. & Mrs. Bookman Peters Charles W. Pressley, Jr. ‘47 Mr. & Mrs. D.T. Rainey Maj. Gen. & Mrs. Andy Rollins and J. Jack Rollins Mr. & Mrs. J.D. Rollins, Jr. Mr. & Mrs. John M. Rollins Allen D. Rooke, Jr. ‘46 Paul D. Rushing ‘60 S.K. Engineering Schrickel, Rollins & Associates, Inc. William & Mildred H. Shull Milbourn L. Smith Southwestern Laboratories Mr. & Mrs. Homer C. Spear Robert F. Stiles ‘79 Mr. & Mrs. Robert L. Thiele, Jr. W.J. & Mary Lea Turnbull Mr. & Mrs. John R. Tushek Edward Varlea ‘88 Constance H. Wakefield Troy & Marion Wakefield Mr. & Mrs. Allister M. Waldrop Kenneth C. Walker ‘78 Robert R. Werner ‘57 William M. Wolf, Jr. ‘65 John S. Yankey III ‘66 H.T. Youens, Sr. William K. Zickler ‘83 Ronald P. Zunker ‘62 Every effort was made to ensure the accuracy of this list. If you feel there is an error, please contact the Engineering Development Office at 979-845-5113. A pledge card is enclosed on the last page for potential contributions.

10
Spencer J. Buchanan Lecture Series
1993
Ralph B. Peck “The Coming of Age of Soil Mechanics: 1920 - 1970”
1994 G. Geoffrey Meyerhof “Evolution of Safety Factors and Geotechnical Limit State Design”
1995 James K. Mitchell “The Role of Soil Mechanics in Environmental Geotechnics”
1996 Delwyn G. Fredlund “The Emergence of Unsaturated Soil Mechanics”
1997 T. William Lambe “The Selection of Soil Strength for a Stability Analysis”
1998 John B. Burland “The Enigma of the Leaning Tower of Pisa”
1999 J. Michael Duncan “Factors of Safety and Reliability in Geotechnical Engineering”
2000 Harry G. Poulos “Foundation Settlement Analysis – Practice Versus Research”
2001 Robert D. Holtz “Geosynthetics for Soil Reinforcement
2002 Arnold Aronowitz “World Trade Center: Construction, Destruction, and Reconstruction”
2003 Eduardo Alonso
“Exploring the Limits of Unsaturated Soil Mechanics: the Behavior of Coarse Granular Soil and Rockfill”
The text of the lectures and a videotape of the presentations are available by contacting:
You may also visit the website http://ceprofs.tamu.edu/briaud/buchanan.htm
Dr. Jean-Louis Briaud Spencer J. Buchanan ’26 Chair Professor
Department of Civil Engineering Texas A&M University
College Station, TX 77843-3136, USA Tel: 979-845-3795 Fax: 979-845-6554
e-mail: [email protected]

11
AGENDA
The Eleventh Spencer J. Buchanan Lecture Friday November 21, 2003
College Station Hilton
2:00 p.m. Welcome by Jean-Louis Briaud
2:05 p.m. Introduction by Paul Roschke
2:10 p.m. Introduction of Lymon Reese by Charles Aubeny
2:15 p.m. “Unique Applications for the Design of Piles under Lateral Loading” Special Lecture by Lymon Reese
3:15 p.m. Discussion
3:25 p.m. Introduction of Eduardo Alonso by Jean-Louis Briaud
3:30 p.m. “Exploring the Limits of Unsaturated Soil Mechanics: the Behavior of Coarse Granular Soil and Rockfill”
2003 Buchanan Lecture by Eduardo Alonso 4:30 p.m. Discussion with Darrow Hooper
4:40 p.m. Closure with Phillip Buchanan
5:00 p.m. Photos followed by a reception at the home of Jean-Louis and Janet Briaud.
12
Professor Eduardo ALONSO
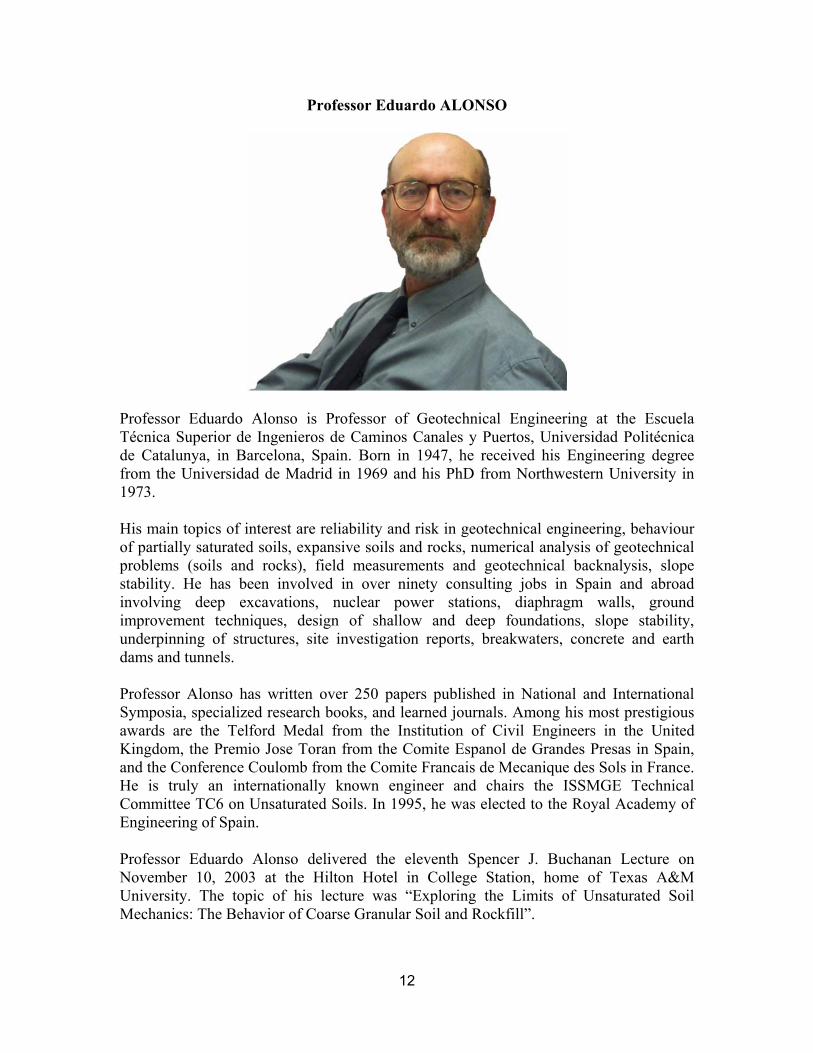
Professor Eduardo Alonso is Professor of Geotechnical Engineering at the Escuela Técnica Superior de Ingenieros de Caminos Canales y Puertos, Universidad Politécnica de Catalunya, in Barcelona, Spain. Born in 1947, he received his Engineering degree from the Universidad de Madrid in 1969 and his PhD from Northwestern University in 1973. His main topics of interest are reliability and risk in geotechnical engineering, behaviour of partially saturated soils, expansive soils and rocks, numerical analysis of geotechnical problems (soils and rocks), field measurements and geotechnical backnalysis, slope stability. He has been involved in over ninety consulting jobs in Spain and abroad involving deep excavations, nuclear power stations, diaphragm walls, ground improvement techniques, design of shallow and deep foundations, slope stability, underpinning of structures, site investigation reports, breakwaters, concrete and earth dams and tunnels. Professor Alonso has written over 250 papers published in National and International Symposia, specialized research books, and learned journals. Among his most prestigious awards are the Telford Medal from the Institution of Civil Engineers in the United Kingdom, the Premio Jose Toran from the Comite Espanol de Grandes Presas in Spain, and the Conference Coulomb from the Comite Francais de Mecanique des Sols in France. He is truly an internationally known engineer and chairs the ISSMGE Technical Committee TC6 on Unsaturated Soils. In 1995, he was elected to the Royal Academy of Engineering of Spain. Professor Eduardo Alonso delivered the eleventh Spencer J. Buchanan Lecture on November 10, 2003 at the Hilton Hotel in College Station, home of Texas A&M University. The topic of his lecture was “Exploring the Limits of Unsaturated Soil Mechanics: The Behavior of Coarse Granular Soil and Rockfill”.
13
EXPLORING THE LIMITS OF UNSATURATED SOIL MECHANICS: THE BEHAVIOUR OF COARSE GRANULAR SOIL AND ROCKFILL
E.E. Alonso
Department of Geotechnical Engineering and Geosciences
Universitat Politècnica de Catalunya
Gran Capitán s/n, Módulo D-2
Barcelona 08034
SPAIN
Tel: 34 93 4016866, Fax: 34 93 4017251, e-mail: [email protected]
Date paper written: November 1st 2003

14
EXPLORING THE LIMITS OF UNSATURATED SOIL MECHANICS: THE BEHAVIOUR OF COARSE GRANULAR SOIL AND ROCKFILL
− Eduardo Alonso
Department of Geotechnical Engineering, UPC, Barcelona (Spain)
1 INTRODUCTION
A large variety of engineering situations require, for a proper understanding of underlying basic
mechanisms of soil deformation, the contribution of unsaturated soil mechanics. A common and
distinctive feature of situations involving unsaturated soils is that the triggering mechanism for soil
deformation and, eventually, soil failure, is the environmentally induced change in water content.
These external actions result in change degrees of saturation or, at least, in the generation of
negative pore water pressure. A useful preliminary ordering of the kind of problems, which may
have their origin in environmentally-controlled changes in water content, may be based on the
classical classification of soils. Consider the following set of real cases, ordered in view of the
plasticity and grain size distribution of the soil involved:
High plasticity expansive barriers for waste isolation. A frequently proposed scheme for radioactive
waste disposal in Europe and Japan is to isolate the nuclear canisters by means of rings of
compacted and initially unsaturated bentonite. The canister space is filled with highly
expansive blocks of compacted bentonite, which will swell as water percolating from the host
rock hydrates the clay. Very high swelling pressures (6-7 MPa), essentially controlled by the
initial porosity of the bentonite, are expected in this case. A description of the kind of
phenomena present in this case and the procedure to simulate the behaviour of these highly
impervious and highly swelling barriers may be found in Gens et al (1998). Swelling and
shrinkage is dominated by the hydration phenomena of clay particles and clay aggregates
Foundations on natural expansive medium to high plasticity clays. This is a classical example,
which has received considerable attention over decades in different geographical areas
characterised by arid climates (which explain the strong relative humidity changes in the
exposed foundation soils) and high plasticity clays (Nelson and Miller, 1992). The series of
International Conferences on Expansive Soils and, in recent times, the International
Conferences on Unsaturated Soils (Paris, 1995; Beijing, 1998; Recife, 2002) offer real cases,
experimental and theoretical research. Although swelling is the dominant feature, a joint
collapse –swelling behaviour may be expected in some cases. A discussion of this dual
behaviour is given in Alonso, Gens and Hight (1987). The microstructure of unsaturated
clays offers a physical explanation for the observed behaviour. Swelling/shrinkage is
15
associated with clay aggregates but capillary phenomena control the “large scale”
geometrical arrangements of clay aggregates and coarser particles (Gens and Alonso,
1992). These soils have typically a bi-modal distribution of pore sizes.
Embankments in low to medium plasticity silts and sandy clays. It is well known that the expected
volume change of these materials upon wetting will be controlled by the initial density and
water content. As a rough approximation for compacted soils, densities and water contents
below the Normal Proctor Optimum mark the beginning of the risk of collapse in practice.
Densities at the Modified Proctor Optimum and above may lead to swelling. The behaviour of
embankments after construction offer a very good source of field data. As in the previous
case the particular soil microstructure and the dominant clay minerals explain the role of
suction.
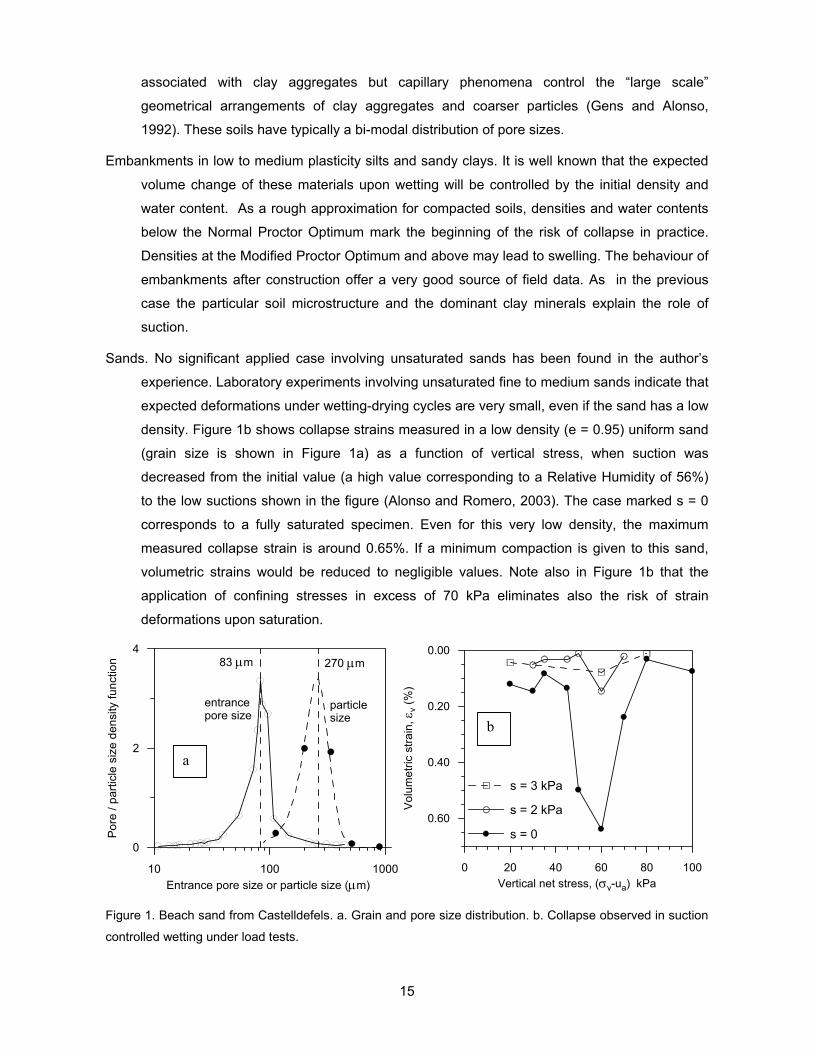
Sands. No significant applied case involving unsaturated sands has been found in the author’s
experience. Laboratory experiments involving unsaturated fine to medium sands indicate that
expected deformations under wetting-drying cycles are very small, even if the sand has a low
density. Figure 1b shows collapse strains measured in a low density (e = 0.95) uniform sand
(grain size is shown in Figure 1a) as a function of vertical stress, when suction was
decreased from the initial value (a high value corresponding to a Relative Humidity of 56%)
to the low suctions shown in the figure (Alonso and Romero, 2003). The case marked s = 0
corresponds to a fully saturated specimen. Even for this very low density, the maximum
measured collapse strain is around 0.65%. If a minimum compaction is given to this sand,
volumetric strains would be reduced to negligible values. Note also in Figure 1b that the
application of confining stresses in excess of 70 kPa eliminates also the risk of strain
deformations upon saturation.
Figure 1. Beach sand from Castelldefels. a. Grain and pore size distribution. b. Collapse observed in suction
controlled wetting under load tests.
10 100 1000Entrance pore size or particle size (µm)
0
2
4
Pore
/ pa
rticl
e si
ze d
ensi
ty fu
nctio
n 83 µm 270 µm
entrancepore size
particlesize
0 20 40 60 80 100Vertical net stress, (σv-ua) kPa
0.00
0.20
0.40
0.60
Vol
umet
ric s
train
, εv (
%)
s = 3 kPa
s = 2 kPa
s = 0
a
b
16
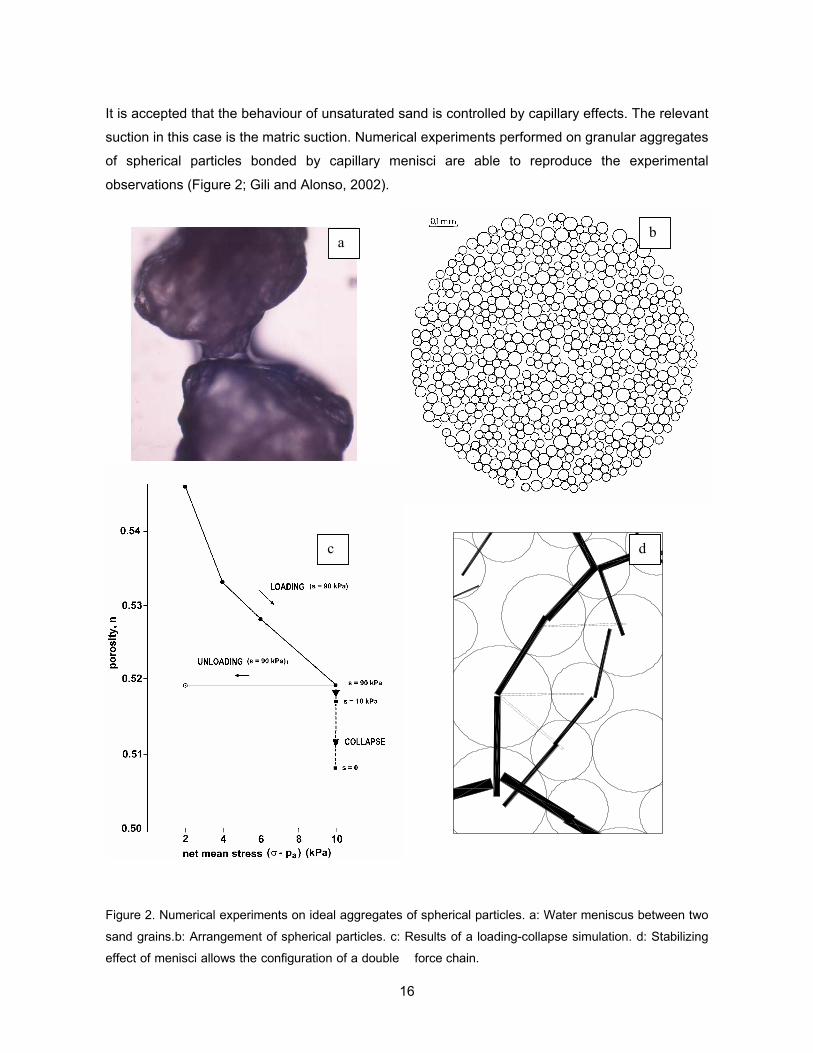
It is accepted that the behaviour of unsaturated sand is controlled by capillary effects. The relevant
suction in this case is the matric suction. Numerical experiments performed on granular aggregates
of spherical particles bonded by capillary menisci are able to reproduce the experimental
observations (Figure 2; Gili and Alonso, 2002).
Figure 2. Numerical experiments on ideal aggregates of spherical particles. a: Water meniscus between two
sand grains.b: Arrangement of spherical particles. c: Results of a loading-collapse simulation. d: Stabilizing
effect of menisci allows the configuration of a double force chain.
a b
c d
17
It was shown that the menisci at the grain-to-grain contacts help to maintain stables the force
chains that develop in the loaded granular structure. This effect may be described as an internal
tensioning, which adds stability and prevents buckling of loaded chains. When suction is reduced
some force chains are destroyed and a rearrangement of the soil structure takes place. This is the
nature of wetting induced collapse.
The above experimental results and numerical simulations refer to fine sands and silts. When the
size of the particles increase it is difficult to explain collapse on the basis of this mechanism
because the intensity of the capillary forces become very small if compared with intergranular
forces resulting from self weight and external loading. Yet, the field experience shows that rockfill
dams and rockfill embankments experience significant settlements when they are wetted. The
purpose of this paper is to explore these phenomena, to provide a physical explanation to
experimental observations and to present a suitable model, which may be used to simulate the
observed behaviour of rockfill embankments.
2 VOLUMETRIC DEFORMATIONS OF ROCKFILL
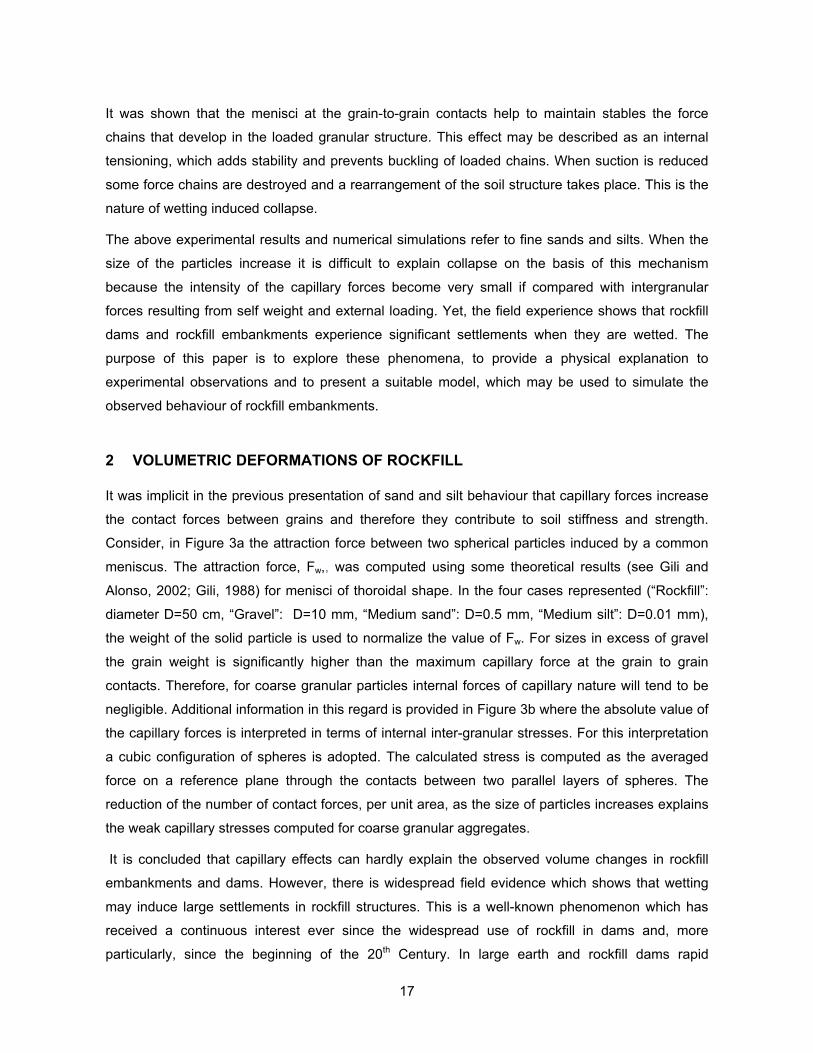
It was implicit in the previous presentation of sand and silt behaviour that capillary forces increase
the contact forces between grains and therefore they contribute to soil stiffness and strength.
Consider, in Figure 3a the attraction force between two spherical particles induced by a common
meniscus. The attraction force, Fw,, was computed using some theoretical results (see Gili and
Alonso, 2002; Gili, 1988) for menisci of thoroidal shape. In the four cases represented (“Rockfill”:
diameter D=50 cm, “Gravel”: D=10 mm, “Medium sand”: D=0.5 mm, “Medium silt”: D=0.01 mm),
the weight of the solid particle is used to normalize the value of Fw. For sizes in excess of gravel
the grain weight is significantly higher than the maximum capillary force at the grain to grain
contacts. Therefore, for coarse granular particles internal forces of capillary nature will tend to be
negligible. Additional information in this regard is provided in Figure 3b where the absolute value of
the capillary forces is interpreted in terms of internal inter-granular stresses. For this interpretation
a cubic configuration of spheres is adopted. The calculated stress is computed as the averaged
force on a reference plane through the contacts between two parallel layers of spheres. The
reduction of the number of contact forces, per unit area, as the size of particles increases explains
the weak capillary stresses computed for coarse granular aggregates.
It is concluded that capillary effects can hardly explain the observed volume changes in rockfill
embankments and dams. However, there is widespread field evidence which shows that wetting
may induce large settlements in rockfill structures. This is a well-known phenomenon which has
received a continuous interest ever since the widespread use of rockfill in dams and, more
particularly, since the beginning of the 20th Century. In large earth and rockfill dams rapid
18
“collapse” settlements have been associated with water impoundment. It was also soon realized
that wet compaction reduced notably collapse settlements as well as the rate of settlement
development in time (Sherard and Cooke, 1987).
The first impoundment leads usually to the maximum collapse settlements. However, strong
rainfalls may also contribute to significant volumetric deformations during the early life of dams.
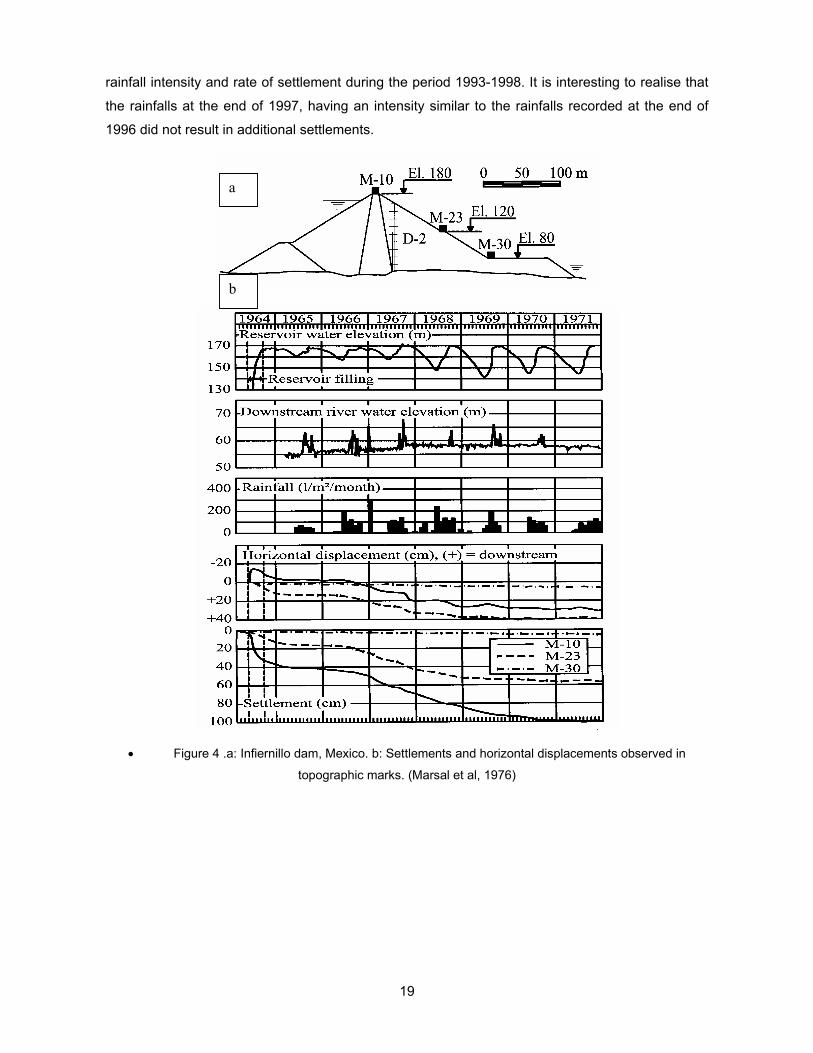
Figure 4 shows a representative cross section of El Infiernillo dam in Mexico and the records of
vertical and horizontal movements measured at some surface marks (Marsal, 1973; Marsal et al,
1976). The dam has a central clay core and large conglomerate and diorite rockfill shells which
were dumped in place without watering. The deformation record for Mark M-10 shows the collapse
of the upstream shell during the first impoundment in 1964. After a period of 18 months (Jan 1965
to July 1966) in which the rate of deformation decreased steadily, a rapid increase of settlements
and horizontal deformations is observed in Marks M-10 and M-21. This increased rate of
deformation is visible until the end of 1968 and it corresponds to a period of heavier rainfall which
started in 1966.
b
a
• Figure 3. Simple capillary model for spheres in contact. a: Normalized attraction force between two
spheres. b: Capillary stresses for a cubic arrangement
Unlike dam shells, embankments for roads and railways are rarely flooded. But they are exposed
to rainfall and therefore one should expect a similar behaviour to the observations in El Infiernillo
(and, in fact, in most rockfill dams). Soriano and Sánchez (1999) have described the behaviour
after construction of several shale and schist embankments belonging to the high speed railway
line linking Madrid and Sevilla in Spain. One of the cases described which corresponds to a 40m
high rockfill embankment is illustrated in Figure 5. There is a clear correlation in this case between
19
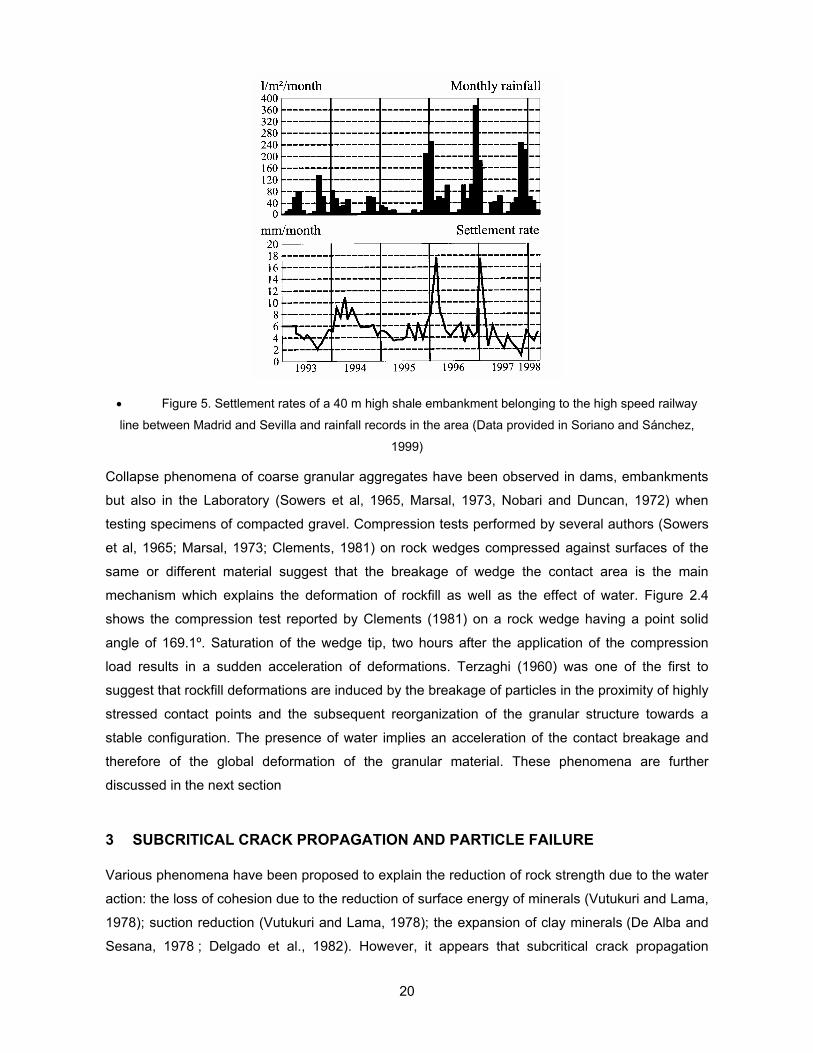
rainfall intensity and rate of settlement during the period 1993-1998. It is interesting to realise that
the rainfalls at the end of 1997, having an intensity similar to the rainfalls recorded at the end of
1996 did not result in additional settlements.
• Figure 4 .a: Infiernillo dam, Mexico. b: Settlements and horizontal displacements observed in
topographic marks. (Marsal et al, 1976)
a
b
20
• Figure 5. Settlement rates of a 40 m high shale embankment belonging to the high speed railway
line between Madrid and Sevilla and rainfall records in the area (Data provided in Soriano and Sánchez,
1999)
Collapse phenomena of coarse granular aggregates have been observed in dams, embankments
but also in the Laboratory (Sowers et al, 1965, Marsal, 1973, Nobari and Duncan, 1972) when
testing specimens of compacted gravel. Compression tests performed by several authors (Sowers
et al, 1965; Marsal, 1973; Clements, 1981) on rock wedges compressed against surfaces of the
same or different material suggest that the breakage of wedge the contact area is the main
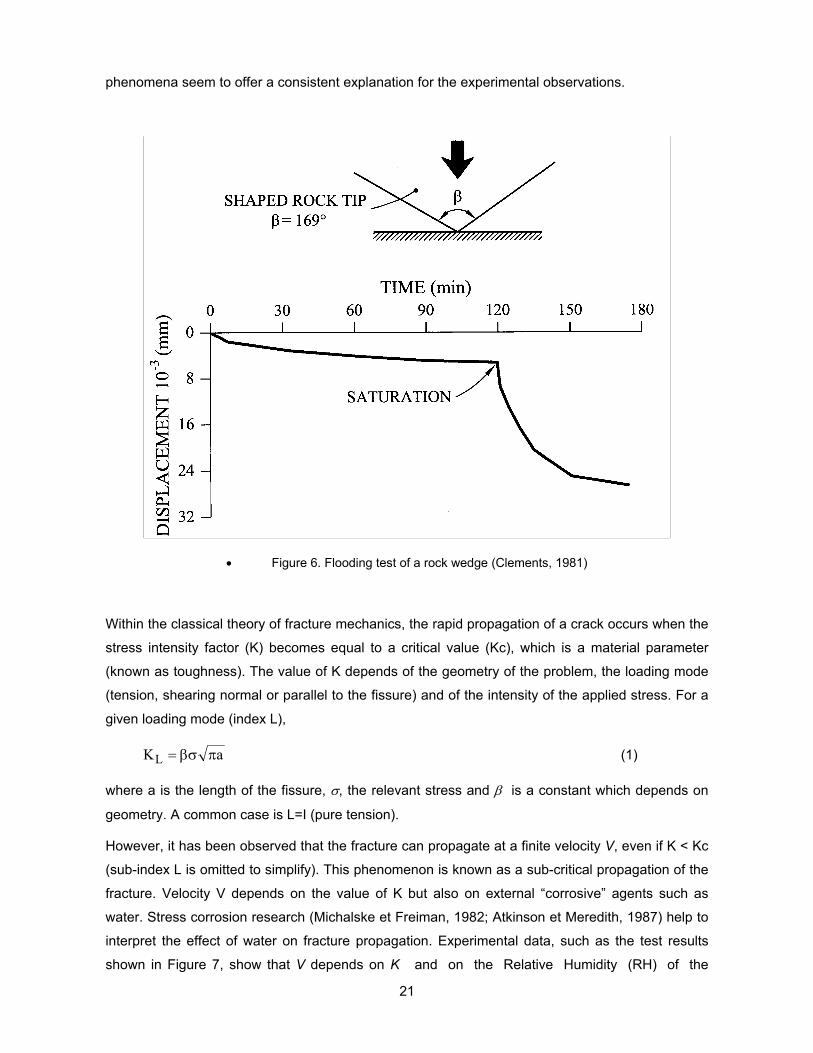
mechanism which explains the deformation of rockfill as well as the effect of water. Figure 2.4
shows the compression test reported by Clements (1981) on a rock wedge having a point solid
angle of 169.1º. Saturation of the wedge tip, two hours after the application of the compression
load results in a sudden acceleration of deformations. Terzaghi (1960) was one of the first to
suggest that rockfill deformations are induced by the breakage of particles in the proximity of highly
stressed contact points and the subsequent reorganization of the granular structure towards a
stable configuration. The presence of water implies an acceleration of the contact breakage and
therefore of the global deformation of the granular material. These phenomena are further
discussed in the next section
3 SUBCRITICAL CRACK PROPAGATION AND PARTICLE FAILURE
Various phenomena have been proposed to explain the reduction of rock strength due to the water
action: the loss of cohesion due to the reduction of surface energy of minerals (Vutukuri and Lama,
1978); suction reduction (Vutukuri and Lama, 1978); the expansion of clay minerals (De Alba and
Sesana, 1978 ; Delgado et al., 1982). However, it appears that subcritical crack propagation
21
phenomena seem to offer a consistent explanation for the experimental observations.
• Figure 6. Flooding test of a rock wedge (Clements, 1981)
Within the classical theory of fracture mechanics, the rapid propagation of a crack occurs when the
stress intensity factor (K) becomes equal to a critical value (Kc), which is a material parameter
(known as toughness). The value of K depends of the geometry of the problem, the loading mode
(tension, shearing normal or parallel to the fissure) and of the intensity of the applied stress. For a
given loading mode (index L),
aKL πβσ= (1)
where a is the length of the fissure, σ, the relevant stress and β is a constant which depends on
geometry. A common case is L=I (pure tension).
However, it has been observed that the fracture can propagate at a finite velocity V, even if K < Kc
(sub-index L is omitted to simplify). This phenomenon is known as a sub-critical propagation of the
fracture. Velocity V depends on the value of K but also on external “corrosive” agents such as
water. Stress corrosion research (Michalske et Freiman, 1982; Atkinson et Meredith, 1987) help to
interpret the effect of water on fracture propagation. Experimental data, such as the test results
shown in Figure 7, show that V depends on K and on the Relative Humidity (RH) of the
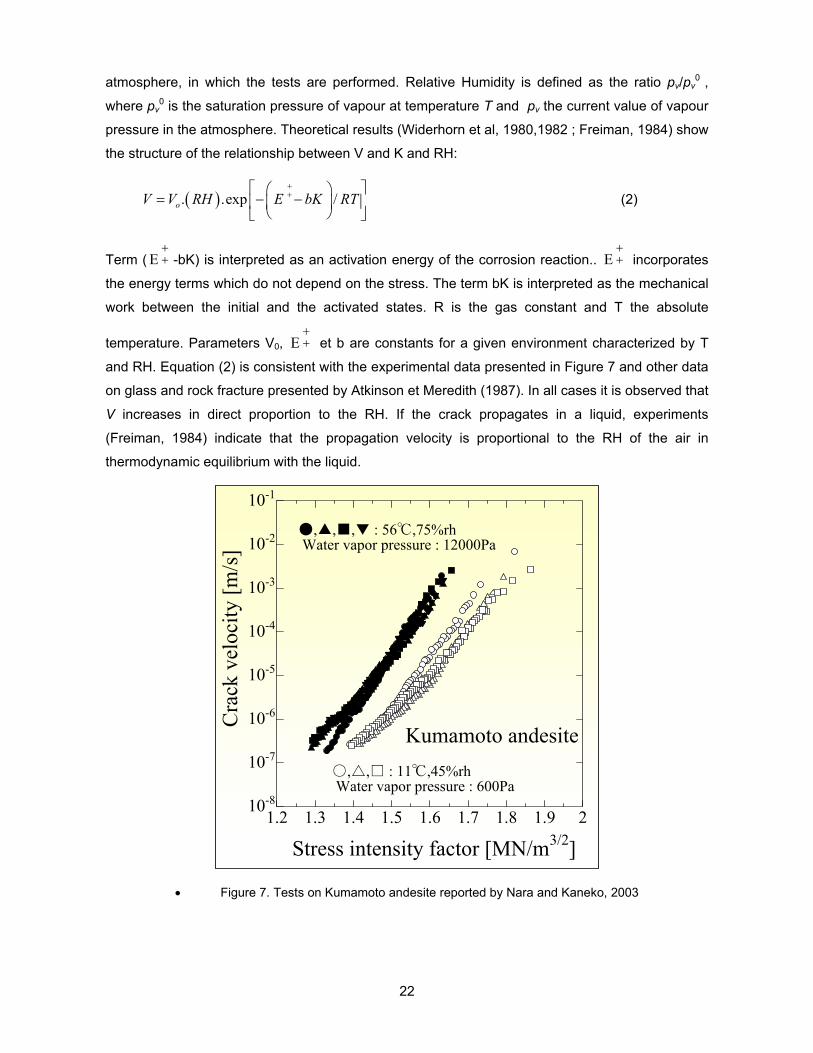
22
atmosphere, in which the tests are performed. Relative Humidity is defined as the ratio pv/pv0 ,
where pv0 is the saturation pressure of vapour at temperature T and pv the current value of vapour
pressure in the atmosphere. Theoretical results (Widerhorn et al, 1980,1982 ; Freiman, 1984) show
the structure of the relationship between V and K and RH:
( ). .exp /oV V RH E bK RT++
= − −
(2)
Term (++E -bK) is interpreted as an activation energy of the corrosion reaction..
++E incorporates
the energy terms which do not depend on the stress. The term bK is interpreted as the mechanical
work between the initial and the activated states. R is the gas constant and T the absolute
temperature. Parameters V0, ++E et b are constants for a given environment characterized by T
and RH. Equation (2) is consistent with the experimental data presented in Figure 7 and other data
on glass and rock fracture presented by Atkinson et Meredith (1987). In all cases it is observed that
V increases in direct proportion to the RH. If the crack propagates in a liquid, experiments
(Freiman, 1984) indicate that the propagation velocity is proportional to the RH of the air in
thermodynamic equilibrium with the liquid.
1.2 1.3 1.4 1.5 1.6 1.7 1.8 1.9 210-8
10-7
10-6
10-5
10-4
10-3
10-2
10-1
Stress intensity factor [MN/m3/2]
Cra
ck v
eloc
ity [m
/s]
●,▲,■,▼ : 56℃,75%rh Water vapor pressure : 12000Pa
○,△,□ : 11℃,45%rh Water vapor pressure : 600Pa
Kumamoto andesite
• Figure 7. Tests on Kumamoto andesite reported by Nara and Kaneko, 2003
23
K0 Kc
Region IIRegion I Region III
Cra
ck p
ropa
gatio
n ve
loci
ty, V
(Log
scal
e)
Stress intensity factor, K
100%
RH or liq
uid w
ater
Dry
env
ironm
ent (
vacu
um)
min(K )0
Incr. RH
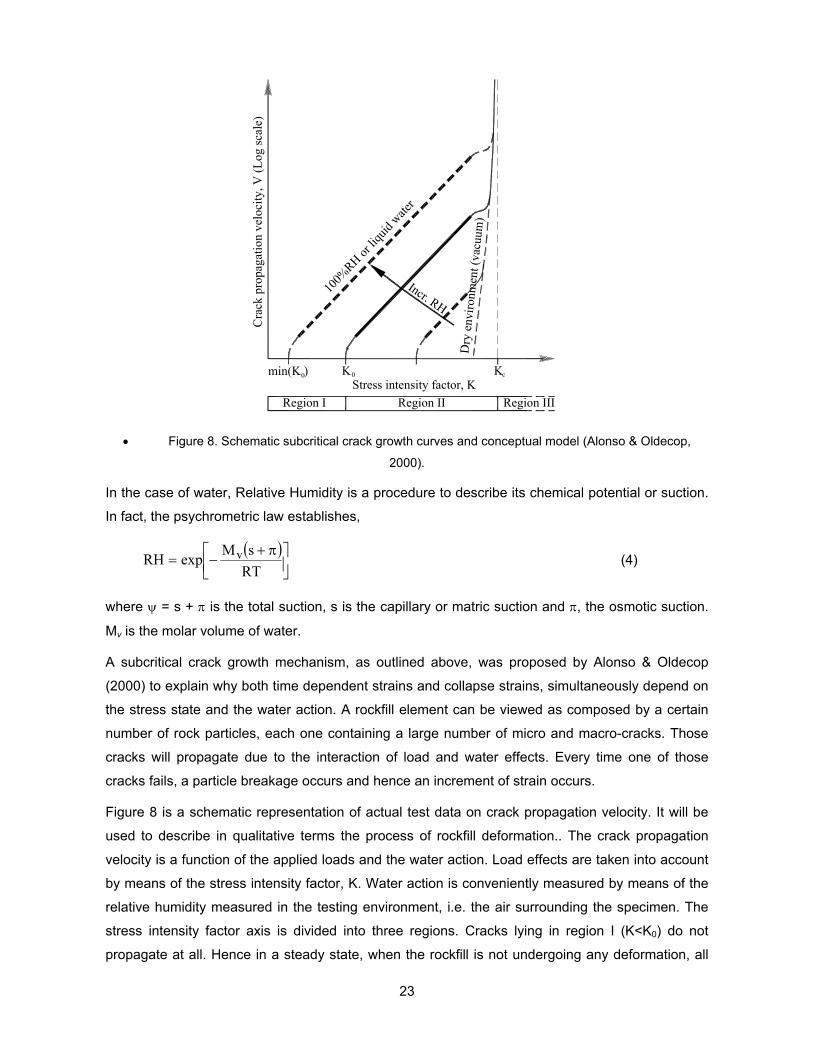
• Figure 8. Schematic subcritical crack growth curves and conceptual model (Alonso & Oldecop,
2000).
In the case of water, Relative Humidity is a procedure to describe its chemical potential or suction.
In fact, the psychrometric law establishes,
( )
π+−=
RTsMexpRH v (4)
where ψ = s + π is the total suction, s is the capillary or matric suction and π, the osmotic suction.
Mv is the molar volume of water.
A subcritical crack growth mechanism, as outlined above, was proposed by Alonso & Oldecop
(2000) to explain why both time dependent strains and collapse strains, simultaneously depend on
the stress state and the water action. A rockfill element can be viewed as composed by a certain
number of rock particles, each one containing a large number of micro and macro-cracks. Those
cracks will propagate due to the interaction of load and water effects. Every time one of those
cracks fails, a particle breakage occurs and hence an increment of strain occurs.
Figure 8 is a schematic representation of actual test data on crack propagation velocity. It will be
used to describe in qualitative terms the process of rockfill deformation.. The crack propagation
velocity is a function of the applied loads and the water action. Load effects are taken into account
by means of the stress intensity factor, K. Water action is conveniently measured by means of the
relative humidity measured in the testing environment, i.e. the air surrounding the specimen. The
stress intensity factor axis is divided into three regions. Cracks lying in region I (K<K0) do not
propagate at all. Hence in a steady state, when the rockfill is not undergoing any deformation, all
24
cracks contained in the rockfill particles lie in region I. If a load increment is then applied, the K
values will move along the K axis. This process will be controlled by the particle geometry, the
particular position of each crack and the crack length. Some cracks will fall in region III where the
stress intensity factor is greater than the fracture toughness, Kc. Those cracks will fail
instantaneously producing the rockfill instantaneous component of strain, as observed in
experiments. Other cracks will fall in region II and will grow, with a finite value of the propagation
velocity, until they fail. These cracks determine the rockfill time–dependent component of strain.
If the relative humidity is increased, Figure 8 shows that cracks lying in region II will increase their
propagation velocity. Moreover, some cracks from region I will move towards region II, due to the
reduction in the limit value K0 as the relative humidity increases. This will produce an additional
increment of strain, which is not related to an increment in load, i.e. a collapse deformation.
The proposed conceptual model explains the characteristic behaviour of rockfill and its
dependence on loads and water action. According to this model one may conclude that the key
parameter which controls the influence of water in the mechanical behaviour of rockfill is the
relative humidity measured in the air surrounding the rock particles (provided the gas phase is in
thermodynamical equilibrium with the rock particles). The idea was then to perform tests on gravel-
like material with relative humidity control.
4 TESTS ON GRAVELS WITH RELATIVE HUMIDITY CONTROL
4.1 Oedometer Tests
Previous considerations led to the idea that performing rockfill mechanical tests under controlled
variable moisture conditions would provide information of water action on rockfill compressibility
from a new perspective. The RH control technique was first used in geotechnical testing, in
unsaturated soils research (Esteban, 1990; Bernier et al, 1997; Delage et al, 1998; Yahia.-Aissa,
1999; Villar, 1999; Romero, 1999; Romero et al, 1999, 2001). In order to apply the technique to
rockfill materials, some difficulties should be overcome.
This technique is based on the following physico-chemical principle: if a liquid (i.e., water contained
in a soil or rock pore) is allowed to reach equilibrium with its vapour, the partial pressure of vapour,
pv, is related to the matric suction, s, by equation (4)
The sum (s+π) in equation 4 is called the “total suction”, ψ. Eq. 4 implies that, the control of total
suction in any specimen kept in a closed system, can be achieved by controlling the RH in the
environment surrounding the specimen, provided that enough time is allowed for the system to
reach equilibrium. In this technique, water transport is entirely transported through the gas phase,
either by advection or by molecular diffusion of water vapour. Therefore, this procedure is also
known as the “vapour equilibrium technique”.
25
RH control on the specimen environment can be achieved by introducing a chemical solution within
the testing system. The solution is kept in a separate vessel, avoiding direct contact with the
specimen but only with the system gas phase. Therefore the RH in the gas phase depends on the
temperature, the chemical composition of the solute and the solution concentration. By changing
the last two factors, the RH in the testing environment is controlled.
Different test setups are used in a relative humidity control technique. The simplest one consists of
enclosing the specimen and the solution in a leak-proof container and allowing time for the system
to reach equilibrium. This type of test setup was used for the retention curve assessment of soils
and rocks (Romero, 1999; Romero et al, 1999, 2001) and also in oedometer tests on soils (
Esteban, 1990). Its fundamental drawback is that equilibration periods are rather long, since all
water transfer between solution and specimen has to occur by molecular diffusion. However, this
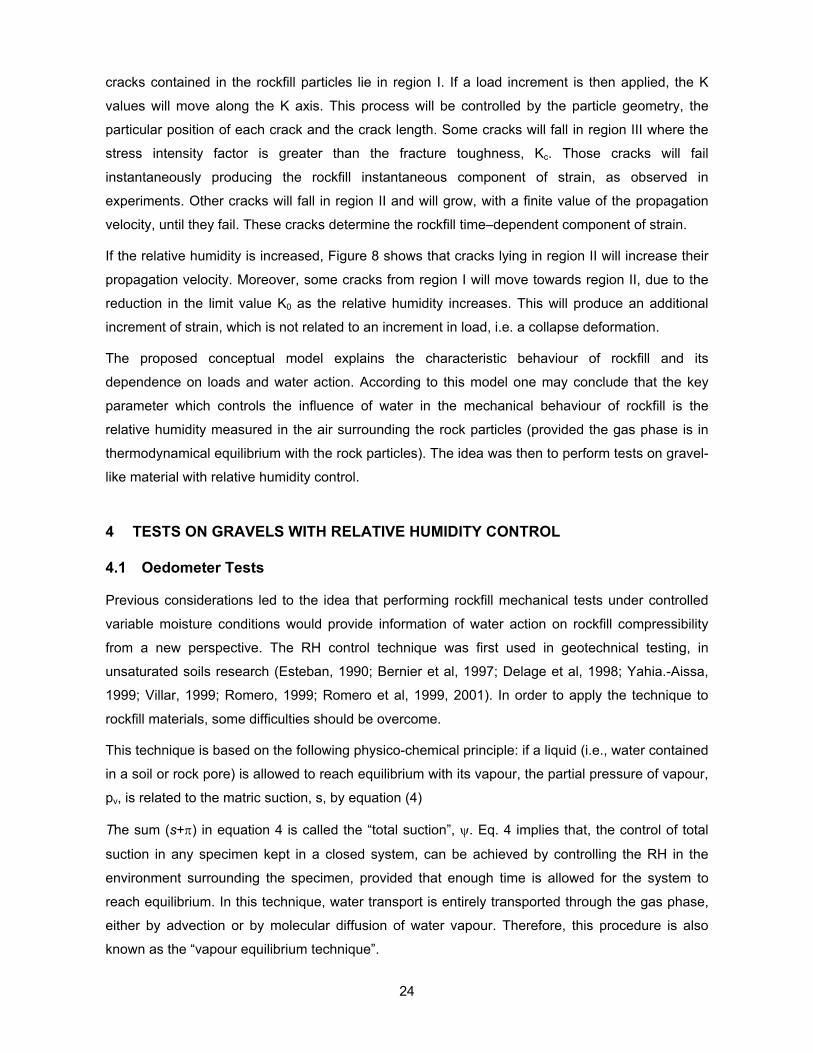
technique was used in the present experimental work for the determination of the retention curve of
the tested rock, a slate of Cambric origin, extracted from the Pancrudo River outcrop (Aragón,
Spain). The retention curve can be plotted either as suction vs. water content or RH vs. water
content, as in Figure 9. In the high RH range (>99%), in which the vapour equilibrium technique
becomes inaccurate, the data for the retention curve were obtained by axis translation and
tensiometer techniques. The retention curve of the tested rock shows hysteresis effects, a typical
behaviour of most porous materials.
An alternative procedure to overcome the problem of long equilibration periods associated with the
vapour equilibrium technique is to induce airflow between the solution and the specimen. In this
way, water vapour is transported by advection, which is a more efficient transport mechanism than
the sole diffusion. In rockfill testing, this procedure can be used with an additional benefit: due to
the pressure of large rockfill voids, a relatively large air flow can be passed through the specimen,
making water transfer more efficient and hence reducing testing delays.
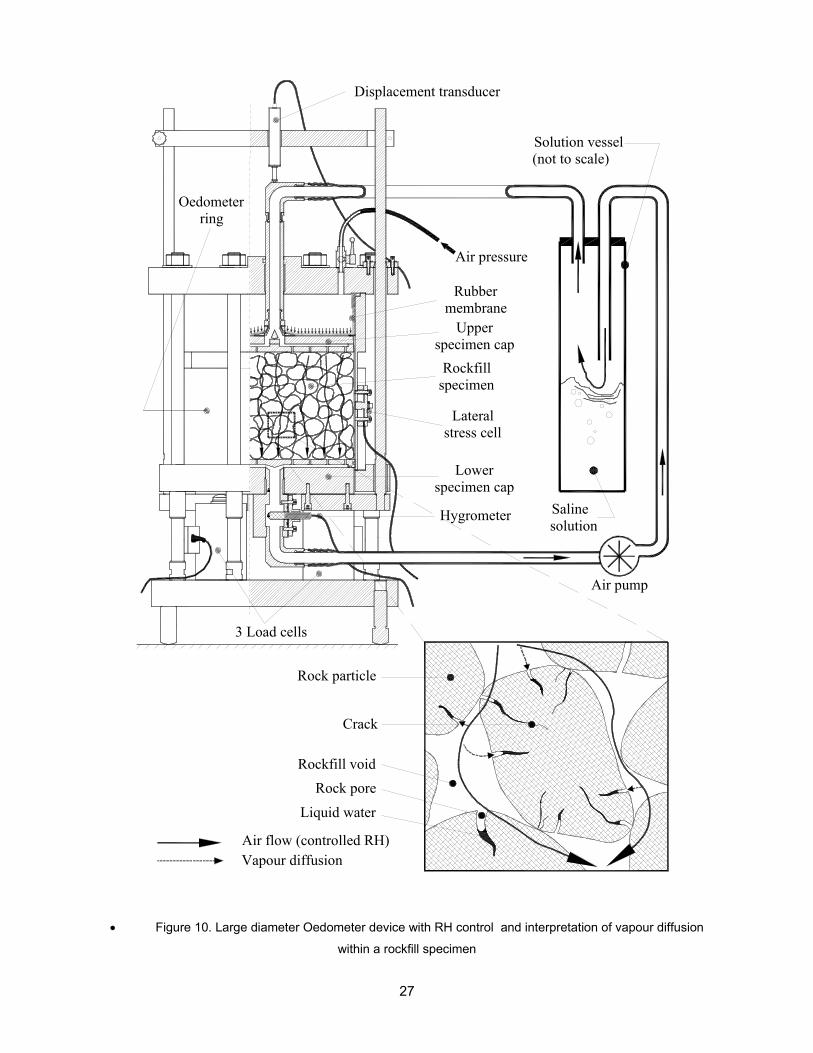
A series of one–dimensional compression test with RH control was performed on specimens of
Cambric quartzitic shale (Pancrudo shale). The test setup is shown in Figure 10. A 300 mm
diameter oedometer in which the RH of the specimen could be controlled was designed and built.
Vertical load was applied by means of air pressure. Vertical load was also measured at the bottom
platten by means of three load cells. In this way, friction stresses along the ring wall could be
determined. Devices for lateral stress and lateral friction measurement were also incorporated into
the oedometer. Airflow was produced in a closed-loop circuit by an electric membrane pump. The
air passes through a vessel containing the saline solution and then flows through the rockfill
specimen. RH in the airflow is controlled by means of the chemical composition and concentration
of the saline solution. A capacitive hygrometer was installed at the specimen outlet in order to get a
continuous reading of RH evolution.
26
If the whole system (i.e., specimen + solution vessel + tubing) is leak-proof, the water mass
introduced into the specimen during a step of a wetting path (or the mass extracted from the
specimen during a drying step) can be measured by successive weightings of the solution vessel.
0
20
40
60
80
100
0 0.5 1 1.5 2 2.5
Water content, w (%)
Rel
ativ
e hu
mid
ity, R
H(%
)
Drying path
Wetting path
Fitted limiting curves
• Figure 9. Retention curve for the tested shale rock
Figures 11a and 11b show the paths followed by some of the tests performed (in a vertical stress –
total suction space) and the stress-strain behaviour measured in the compacted crushed Pancrudo
shale, 40mm in maximum particle size. Each test started in an air-dry condition, which means an
initial total suction value close to 100 MPa. The vertical stress was increased in steps, allowing the
specimen to deform for at least 1000 minutes under constant stress. Since no steady condition
was attained at any load step (in a strain-log(t) type of plot), the strain values used for the stress-
strain graphs (Figure 11b) were conventionally defined as the measurement recorded 1000
minutes after the application of the load increment. Total suction changes under constant vertical
stress were induced by means of the relative humidity control system both in wetting and drying
senses.
27
Rockfill specimen
Lateralstress cell
3 Load cells
Hygrometer
Lowerspecimen cap
Upperspecimen cap
Oedometerring
Rubber membrane
Air pressure
Displacement transducer
Liquid water
Rock poreRockfill void
Crack
Rock particle
Air flow (controlled RH)Vapour diffusion
Air pump
Salinesolution
Solution vessel(not to scale)
• Figure 10. Large diameter Oedometer device with RH control and interpretation of vapour diffusion
within a rockfill specimen
28
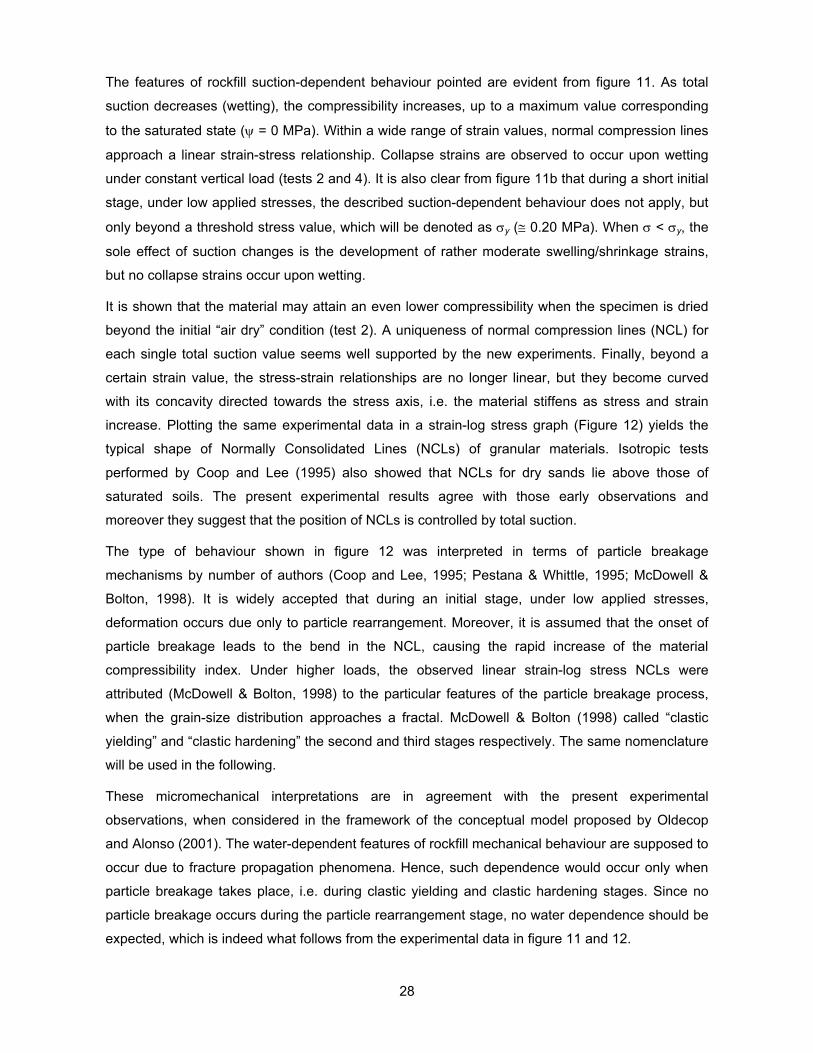
The features of rockfill suction-dependent behaviour pointed are evident from figure 11. As total
suction decreases (wetting), the compressibility increases, up to a maximum value corresponding
to the saturated state (ψ = 0 MPa). Within a wide range of strain values, normal compression lines
approach a linear strain-stress relationship. Collapse strains are observed to occur upon wetting
under constant vertical load (tests 2 and 4). It is also clear from figure 11b that during a short initial
stage, under low applied stresses, the described suction-dependent behaviour does not apply, but
only beyond a threshold stress value, which will be denoted as σy (≅ 0.20 MPa). When σ < σy, the
sole effect of suction changes is the development of rather moderate swelling/shrinkage strains,
but no collapse strains occur upon wetting.
It is shown that the material may attain an even lower compressibility when the specimen is dried
beyond the initial “air dry” condition (test 2). A uniqueness of normal compression lines (NCL) for
each single total suction value seems well supported by the new experiments. Finally, beyond a
certain strain value, the stress-strain relationships are no longer linear, but they become curved
with its concavity directed towards the stress axis, i.e. the material stiffens as stress and strain
increase. Plotting the same experimental data in a strain-log stress graph (Figure 12) yields the
typical shape of Normally Consolidated Lines (NCLs) of granular materials. Isotropic tests
performed by Coop and Lee (1995) also showed that NCLs for dry sands lie above those of
saturated soils. The present experimental results agree with those early observations and
moreover they suggest that the position of NCLs is controlled by total suction.
The type of behaviour shown in figure 12 was interpreted in terms of particle breakage
mechanisms by number of authors (Coop and Lee, 1995; Pestana & Whittle, 1995; McDowell &
Bolton, 1998). It is widely accepted that during an initial stage, under low applied stresses,
deformation occurs due only to particle rearrangement. Moreover, it is assumed that the onset of
particle breakage leads to the bend in the NCL, causing the rapid increase of the material
compressibility index. Under higher loads, the observed linear strain-log stress NCLs were
attributed (McDowell & Bolton, 1998) to the particular features of the particle breakage process,
when the grain-size distribution approaches a fractal. McDowell & Bolton (1998) called “clastic
yielding” and “clastic hardening” the second and third stages respectively. The same nomenclature
will be used in the following.
These micromechanical interpretations are in agreement with the present experimental
observations, when considered in the framework of the conceptual model proposed by Oldecop
and Alonso (2001). The water-dependent features of rockfill mechanical behaviour are supposed to
occur due to fracture propagation phenomena. Hence, such dependence would occur only when
particle breakage takes place, i.e. during clastic yielding and clastic hardening stages. Since no
particle breakage occurs during the particle rearrangement stage, no water dependence should be
expected, which is indeed what follows from the experimental data in figure 11 and 12.

29
ψ = 0 MPa
ψ = 97 MPa
ψ = 5.7 MPa
ψ = 255MPa
-1
0
1
2
3
4
5
6
7
8
9
10
11
12
13
0 0.5 1 1.5 2 2.5 3
Def
orm
ació
n ve
rtica
l, ε [%
]
Test 1Test 2Test 3Test 4Constitutive model
3
1
• Figure 11. a: Loading paths in the stress – suction space, followed in the experiments. b: Vertical
stress vs. measured vertical strain. Square-enclosed numbers indicate the point of flooding of the
corresponding specimen. Constitutive model results obtained for stress-suction paths corresponding to tests
3 and 4.
0.01
0.1
1
10
100
1000
0 0.5 1 1.5 2 2.5 3Vertical stress, σ [MPa]
ψ +
pat
m [M
Pa]
Final unloading path
a
b
30
ψ = 0 M
Pa
ψ = 5.7 M
Pa
ψ = 97 M
Paψ
= 255 MPa
-1
0
1
2
3
4
5
6
7
8
9
10
11
12
13
0.1 1 10
Vertical stress [MPa]
Ver
tical
stra
in, ε
[%]
Test 1
Test 2
Test 3
Test 4
Constitutive model
3
• Figure 12. Experimental results: vertical stress (log scale) vs. measured vertical strain. Square-
enclosed numbers indicate the point of flooding of the corresponding specimen. Model predictions for an
extended stress range are also given
4.2 Triaxial Tests
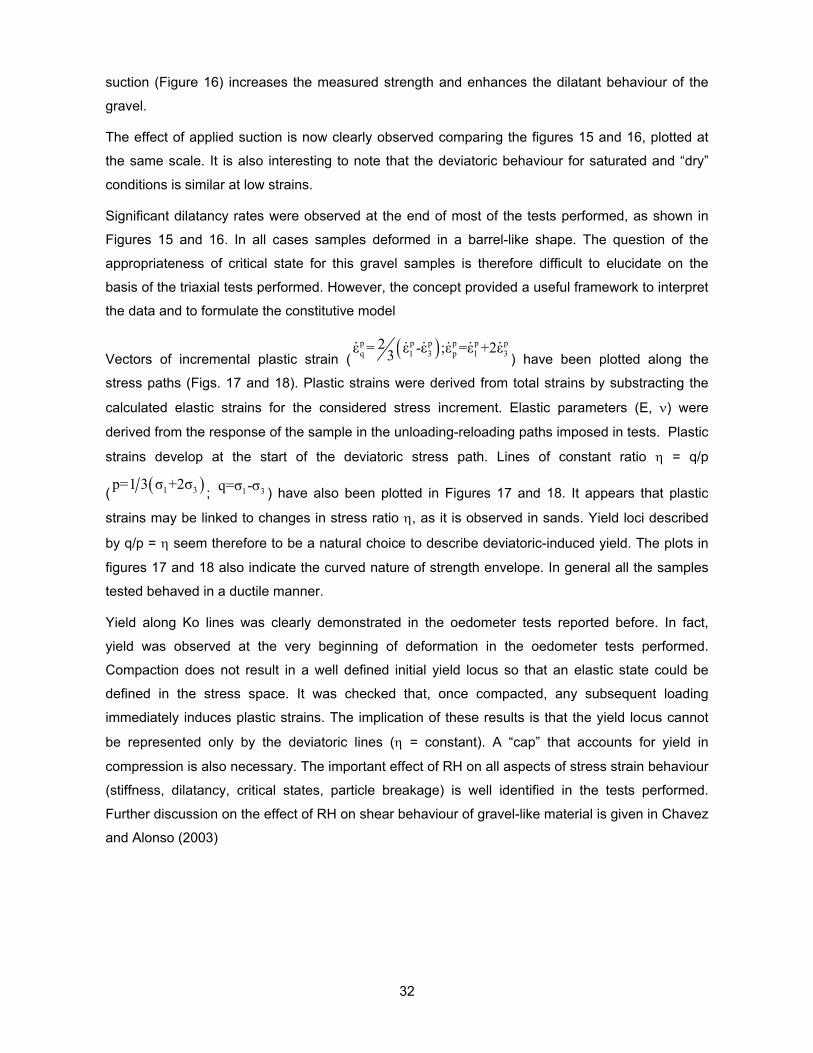
The behaviour in shear was investigated by a new triaxial apparatus, which may test samples up to
25 cm in diameter and 50 cm in height under suction controlled conditions. Figure 13 shows a
schematic layout of the system.
The cell has a double-walled chamber to allow for a direct measurement of sample volume
changes. For redundancy, horizontal strains could also be measured by means of specially
developed sensors for diameter changes. Vertical load on the sample and axial displacements are
also recorded by means of a load cell and LVDTs located inside the cell. The LVDTs measure the
displacement of the upper polished stainless steel loading plate in direct contact with the sample.
No bedding errors associated with the penetration of grains into membranes or the compressibility
of lubricating grease, reported in other cases (Dendani et al, 1988), are expected here because of
the direct contact of the steel plattens and the sample.
31
Total suction is controlled by means of a closed loop circuit, which induces a vapour flow through
the sample. Air relative humidity is imposed by circulating the flowing air through acid or salt
solutions at a predetermined concentration. Suction changes are induced by changing the solute
concentration. In the tests reported here on “dry” samples the low relative humidity was controlled
with a solution of Sodium hydroxide, Na (OH)2 . RH was also measured by means of a hygrometer
sensor located in the air circuit. Therefore two independent indications of the imposed RH are
available. Errors in the determination of RH, due to the precision of both techniques is similar : 1%
to 2% of the measured value (Oldecop, 2000). In terms of suction, the error is high (20%-30%) for
the low suction range (3 to 10 MPa and smaller (2% - 3%) for a high suction range (100-300MPa).
However, mechanical effects induced by suction on granular aggregates tend to depend on the
logarithm of suction and therefore a limited mechanical effect of the error in the determination of
RH should be expected.
The system has a number of additional features, which have been indicated in figure 13. Confining
stresses as high as 2.5 MPa can be applied to samples. The vertical stress may reach a maximum
value of 18.5 MPa.
Two test series are reported here to illustrate the behaviour of the gravel. The first series was
performed under fully saturated conditions. Once compacted, samples were confined under 0.1,
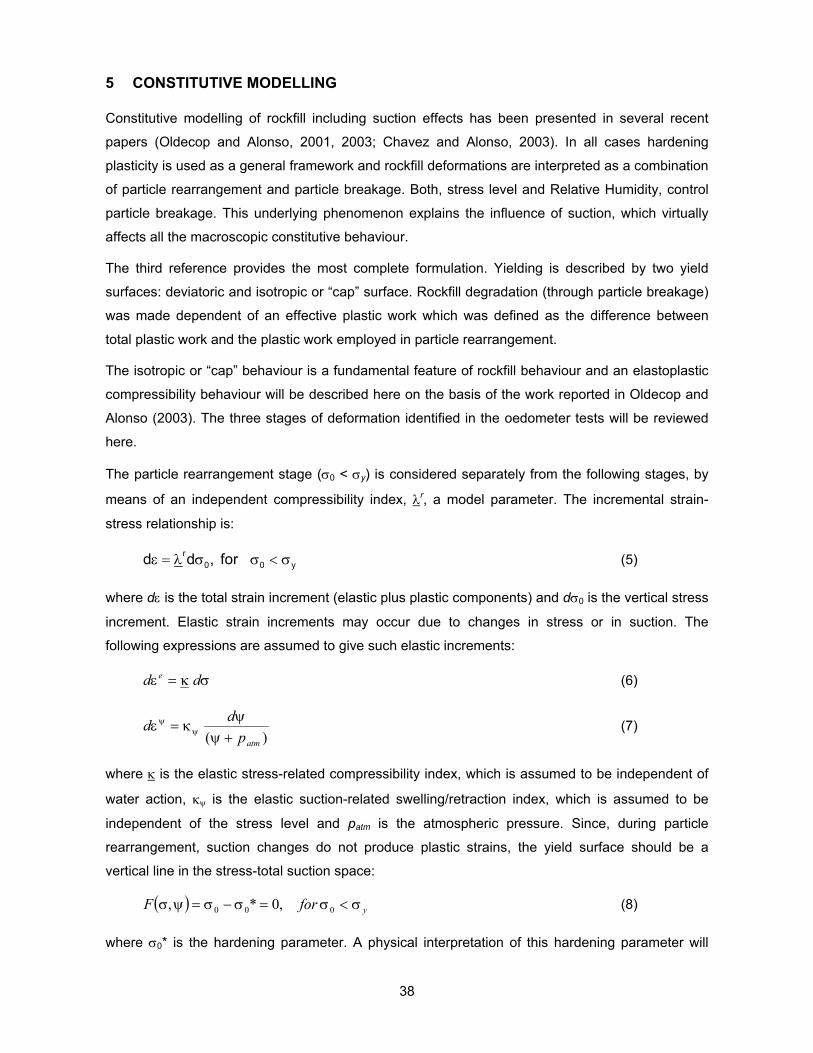
0.3, 0.5 and 0.8 MPa and then sheared under constant lateral stress, σ3. (Figure 17). In a second
series, samples compacted in a similar manner were maintained at a constant low relative humidity
(RH = 36%, equivalent to a total suction s = 142 MPa). Similar stress paths were then applied to
the dry samples (Figure 18). Tests on saturated samples are named S1, S3, S5 and S8. The
number refers to the intensity of the confining stress. In a similar manner, the three tests performed
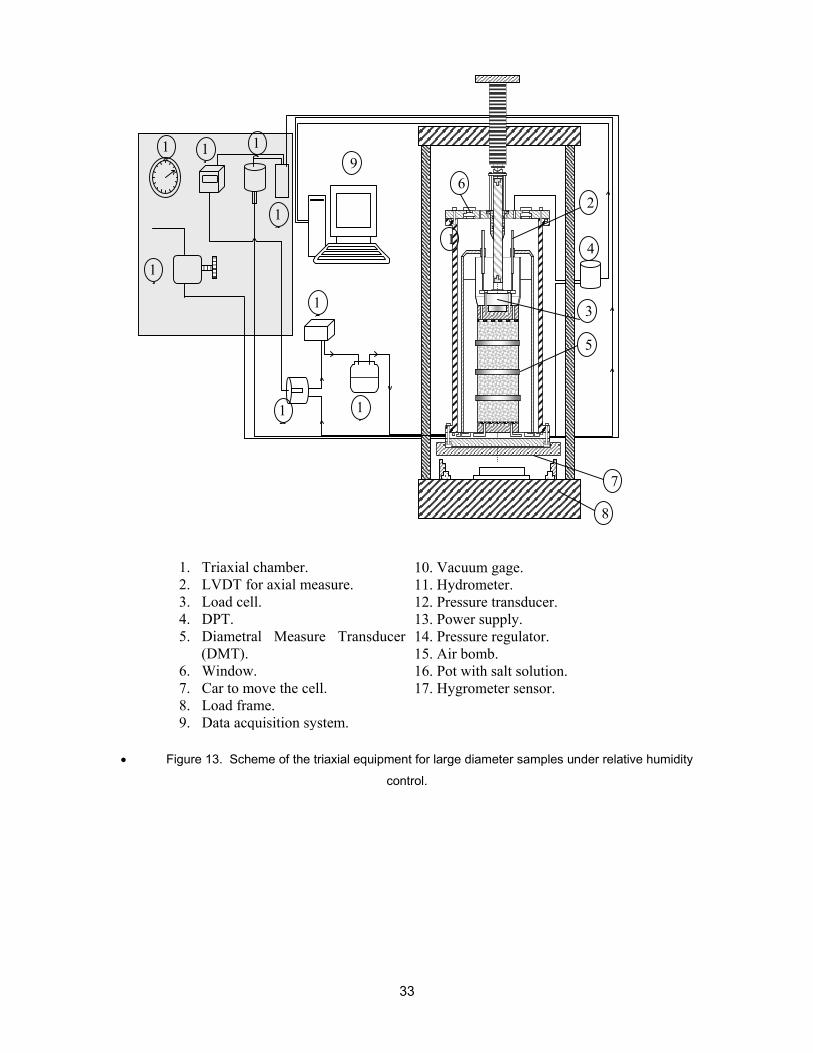
on “dry” samples are marked as D1, D3, D5 and D8. Grain size distributions were measured for the
following states: original material, after compaction, and after the performance of the triaxial tests.
They are indicated in Figure 14a and 14b for saturated and “dry” conditions respectively. The
application of a dry environment (RH=36%) reduces markedly the particle breakage induced by the
stress application
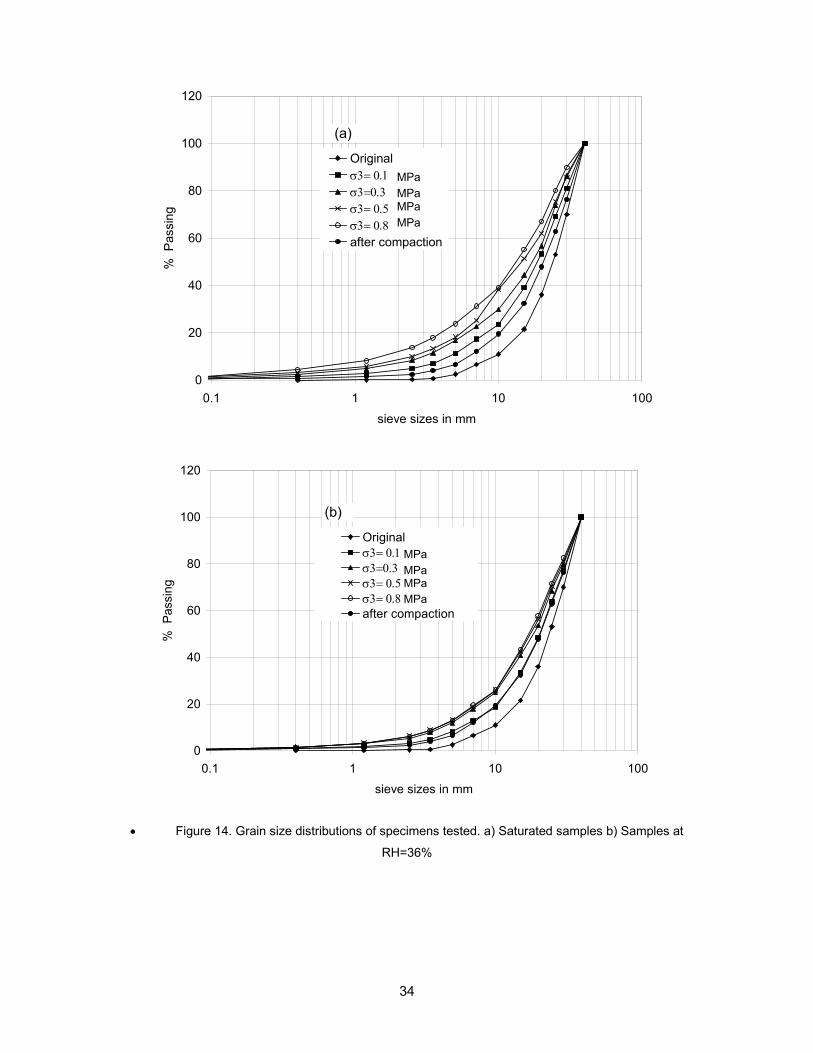
Measured deviatoric (q = σ1 - σ3) vs. axial strain (ε1) response and volumetric deformations vs.
axial strain are plotted in Figure 15 for the saturated samples. Unloading-reloading cycles were
imposed at some strain levels to estimate the elastic stiffness of the material. Samples were taken
to large deformations in an attempt to approximate critical state conditions.
The saturated sample tested under σ3 = 0.1 MPa (figure 15) shows a marked dilatant behaviour
from the beginning of the test. The application of higher confining loads delays the development of
dilatancy to higher vertical strains (7 % for σ3 = 0.3 MPa; 12 % for σ3 = 0.5 MPa). The sample
tested under σ3 =0.8 MPa shows a compressive behaviour along the test. The application of
32
suction (Figure 16) increases the measured strength and enhances the dilatant behaviour of the
gravel.
The effect of applied suction is now clearly observed comparing the figures 15 and 16, plotted at
the same scale. It is also interesting to note that the deviatoric behaviour for saturated and “dry”
conditions is similar at low strains.
Significant dilatancy rates were observed at the end of most of the tests performed, as shown in
Figures 15 and 16. In all cases samples deformed in a barrel-like shape. The question of the
appropriateness of critical state for this gravel samples is therefore difficult to elucidate on the
basis of the triaxial tests performed. However, the concept provided a useful framework to interpret
the data and to formulate the constitutive model
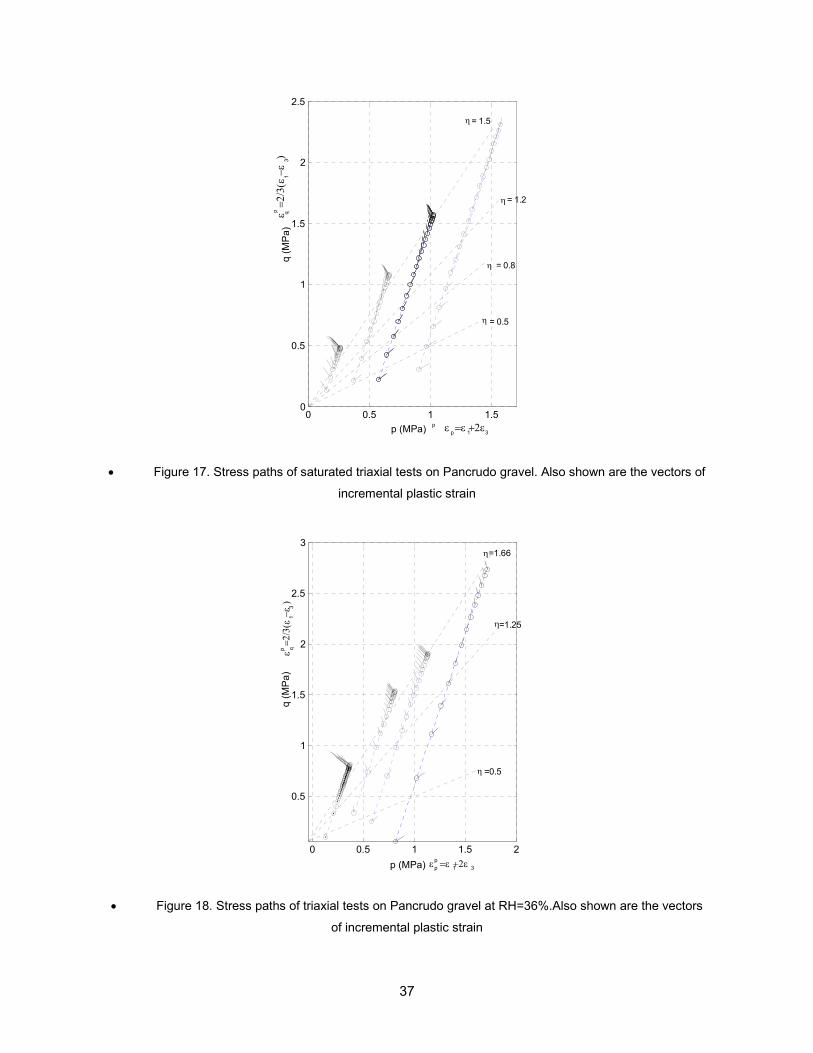
Vectors of incremental plastic strain (( )p p p p p p
q 1 3 p 1 32ε = ε -ε ;ε =ε +2ε3 ) have been plotted along the
stress paths (Figs. 17 and 18). Plastic strains were derived from total strains by substracting the
calculated elastic strains for the considered stress increment. Elastic parameters (E, ν) were
derived from the response of the sample in the unloading-reloading paths imposed in tests. Plastic
strains develop at the start of the deviatoric stress path. Lines of constant ratio η = q/p
( ( )1 3p=1 3 σ +2σ ; 1 3q=σ -σ ) have also been plotted in Figures 17 and 18. It appears that plastic
strains may be linked to changes in stress ratio η, as it is observed in sands. Yield loci described
by q/p = η seem therefore to be a natural choice to describe deviatoric-induced yield. The plots in
figures 17 and 18 also indicate the curved nature of strength envelope. In general all the samples
tested behaved in a ductile manner.
Yield along Ko lines was clearly demonstrated in the oedometer tests reported before. In fact,
yield was observed at the very beginning of deformation in the oedometer tests performed.
Compaction does not result in a well defined initial yield locus so that an elastic state could be
defined in the stress space. It was checked that, once compacted, any subsequent loading
immediately induces plastic strains. The implication of these results is that the yield locus cannot
be represented only by the deviatoric lines (η = constant). A “cap” that accounts for yield in
compression is also necessary. The important effect of RH on all aspects of stress strain behaviour
(stiffness, dilatancy, critical states, particle breakage) is well identified in the tests performed.
Further discussion on the effect of RH on shear behaviour of gravel-like material is given in Chavez
and Alonso (2003)
33
• Figure 13. Scheme of the triaxial equipment for large diameter samples under relative humidity
control.
1
2
3
4
5
6
7 8
910
11
12
13
14
15
16
17
1. Triaxial chamber. 2. LVDT for axial measure. 3. Load cell. 4. DPT. 5. Diametral Measure Transducer
(DMT). 6. Window. 7. Car to move the cell. 8. Load frame. 9. Data acquisition system.
10. Vacuum gage. 11. Hydrometer. 12. Pressure transducer. 13. Power supply. 14. Pressure regulator. 15. Air bomb. 16. Pot with salt solution. 17. Hygrometer sensor.
34
0
20
40
60
80
100
120
0.1 1 10 100sieve sizes in mm
% P
assi
ngOriginalσ3= 0.1σ3=0.3σ3= 0.5σ3= 0.8after compaction
MPaMPaMPaMPa
(a)
0
20
40
60
80
100
120
0.1 1 10 100
sieve sizes in mm
% P
assi
ng
Originalσ3= 0.1σ3=0.3σ3= 0.5σ3= 0.8after compaction
MPaMPaMPaMPa
(b)
• Figure 14. Grain size distributions of specimens tested. a) Saturated samples b) Samples at
RH=36%
35
0 5 10 15 20 25
ε1(%)
0
1
2
3
q (M
Pa)
0 5 10 15 20 25
10
5
0
-5
-10
-15
-20
ε v(%
)
σ30.1 MPa0.3 MPa0.5 MPa0.8 MPa
• Figure 15. Results of saturated triaxial compression tests on Pancrudo gravel

36
0 5 10 15 20 25
ε1(%)
0
1
2
3
q ( M
Pa)
0 5 10 15 20 25
10
5
0
-5
-10
-15
-20
ε v(%
)
σ30.1 MPa0.3 MPa0.5 MPa0.8 MPa
membrane rupture
• Figure 16. Results of triaxial compression tests on Pancrudo gravel at a RH=36%
37
0 0.5 1 1.50
0.5
1
1.5
2
2.5
p (MPa)
q (M
Pa)
η = 0.8
ε =ε +2ε p p 1 3
q
1
3
ε =
2/3(
ε −ε
)
p
η
η
η
= 1.2
= 1.5
= 0.5
• Figure 17. Stress paths of saturated triaxial tests on Pancrudo gravel. Also shown are the vectors of
incremental plastic strain
0 0.5 1 1.5 2
0.5
1
1.5
2
2.5
3
p (MPa)
q (M
Pa)
p 1 3 ε =ε +2ε p
ε =
2/3(
ε −ε
) p q
1
3
η =1.25
η =0.5
η =1.66
• Figure 18. Stress paths of triaxial tests on Pancrudo gravel at RH=36%.Also shown are the vectors
of incremental plastic strain
38
5 CONSTITUTIVE MODELLING
Constitutive modelling of rockfill including suction effects has been presented in several recent
papers (Oldecop and Alonso, 2001, 2003; Chavez and Alonso, 2003). In all cases hardening
plasticity is used as a general framework and rockfill deformations are interpreted as a combination
of particle rearrangement and particle breakage. Both, stress level and Relative Humidity, control
particle breakage. This underlying phenomenon explains the influence of suction, which virtually
affects all the macroscopic constitutive behaviour.
The third reference provides the most complete formulation. Yielding is described by two yield
surfaces: deviatoric and isotropic or “cap” surface. Rockfill degradation (through particle breakage)
was made dependent of an effective plastic work which was defined as the difference between
total plastic work and the plastic work employed in particle rearrangement.
The isotropic or “cap” behaviour is a fundamental feature of rockfill behaviour and an elastoplastic
compressibility behaviour will be described here on the basis of the work reported in Oldecop and
Alonso (2003). The three stages of deformation identified in the oedometer tests will be reviewed
here.
The particle rearrangement stage (σ0 < σy) is considered separately from the following stages, by
means of an independent compressibility index, λr, a model parameter. The incremental strain-
stress relationship is:
r0 0 yd d , forε = λ σ σ < σ (5)
where dε is the total strain increment (elastic plus plastic components) and dσ0 is the vertical stress
increment. Elastic strain increments may occur due to changes in stress or in suction. The
following expressions are assumed to give such elastic increments:
σκ=ε dd e (6)
)( atmpdd+ψ
ψκ=ε ψ
ψ (7)
where κ is the elastic stress-related compressibility index, which is assumed to be independent of
water action, κψ is the elastic suction-related swelling/retraction index, which is assumed to be
independent of the stress level and patm is the atmospheric pressure. Since, during particle
rearrangement, suction changes do not produce plastic strains, the yield surface should be a
vertical line in the stress-total suction space:
( ) yforF σ<σ=σ−σ=ψσ 000 ,0*, (8)
where σ0* is the hardening parameter. A physical interpretation of this hardening parameter will
39
arise from the model formulation. The hardening rule becomes:
κ−λε
=σ r
pdd *0 , for σ0* < σy (9)
During the clastic yielding stage (σ0* > σy) the compressibility index, λ should be a function of
suction (Figure 10):
( ) 0σψλ=ε dd (10)
The experimental data suggests the following expression for λ(ψ):
+ψα−λ=ψλ ψ
atm
atmp
pLn0)( (11a)
and
( ) iλ≥ψλ (11b)
where λ0, λi, y αψ are model parameters. λ0 is the maximum compressibility index corresponding to
the saturated material (ψ = 0). λi has the meaning of a minimum compressibility index. Oldecop &
Alonso (2001) hypothesised that a minimum value for the compressibility index would be attained
by extreme drying (i.e. under a very high suction), calling it the very dry state. Such a very dry state
could not be reached in the experimental program reported before, although a high suction value
was imposed to specimen 2 (ψ = 255 MPa). However, from a practical point of view, the very dry
state can be conventionally defined as a high enough suction value, so as to ensure that it will not
be exceeded during the loading path considered in the analysis.
The expression for the yield surface and the hardening rule in clastic yielding can be derived as
shown by Oldecop & Alonso (2001):
( ) ( )[ ] ( )[ ] ( ) 0*, 00 =κ−λσ−λ−ψλσ−κ−ψλσ=ψσ iiyF (12)
κ−λε
=σ i
pdd *0 , for σy < σ0* < σ0ch (13)
where σ0ch will be defined immediately.
The experimental data (figures 11 and 12) suggest that the initiation of the clastic hardening stage
is marked by a unique value of plastic strain. This is to be expected since the type of mechanical
behaviour is determined by the actual configuration of the granular structure and the plastic
(volumetric) strain can be considered as a parameter measuring that configuration. Defining a
threshold strain value is equivalent to defining a threshold value for the hardening parameter, σ0*,
in view of eq. (13). Hence, an additional parameter is introduced, σ0ch, defined as the value of the
40
hardening parameter which marks the onset of clastic hardening. In order to extend the model into
the clastic hardening stage, the yield surface is kept the same as in clastic yielding (eq. 12) while
the following hardening rule is proposed:
κ−λε
σ−σ
σ−σ=σ i
p
ych
y dd0
00
** , for σ0* > σ0
ch (14)
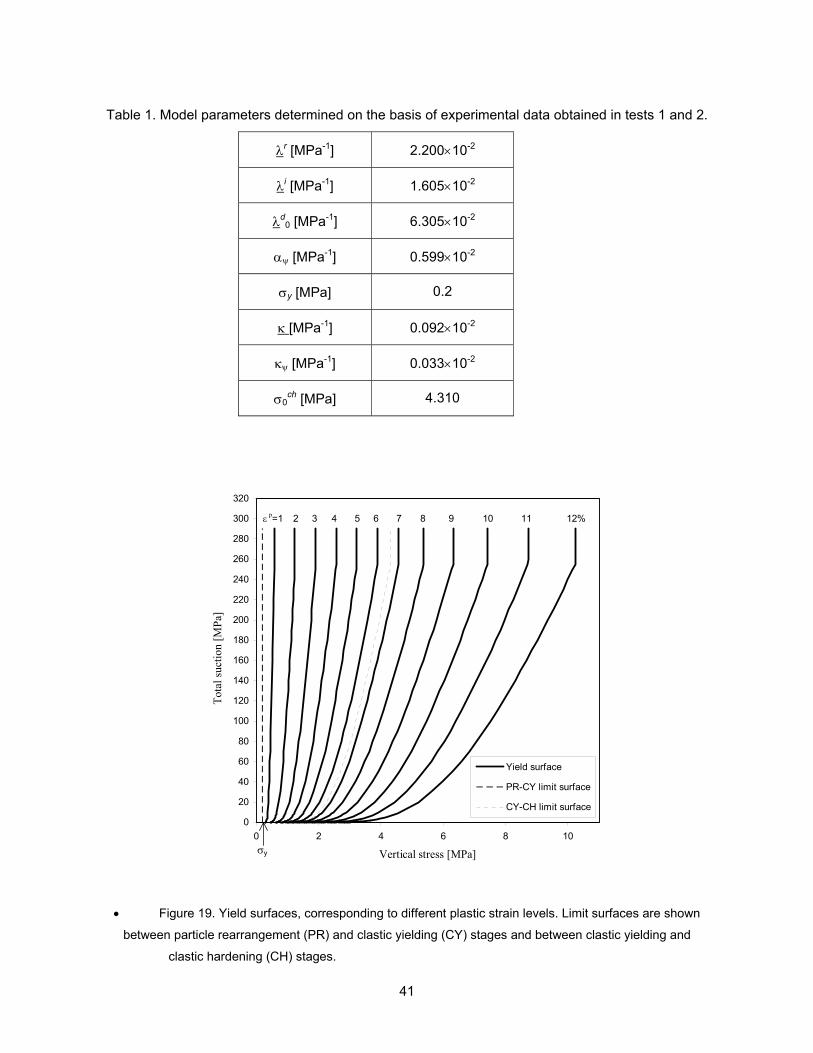
The shape of the yield surface in the stress suction space is shown in figure 19, for different values
of plastic vertical strain.
A complete set of model parameters is determined on the basis of tests 1 and 2. The very dry state
is conventionally defined as the first loading condition of specimen 2 after drying to ψvd = 255 MPa.
The adjustment of linear functions to the normal compression lines in the clastic yielding stage, for
the very dry state (test 2) and the saturated state (test 1), respectively, yields the minimum
compressibility index, λi, and the maximum compressibility index, λ0. The first loading steps provide
the data for the determination of the compressibility index for the particle rearrangement stage, λr.
The elastic unloading/reloading compressibility index, κ, is computed on the basis of the data
obtained during unloading paths. The parameter αψ, measuring the variation of the normal
compressibility index with suction, is determined by means of equation (11a) for ψ = ψvd (then λ (ψ)
= λi ).
The suction related swelling/retraction index is determined on the basis of the heave strain
measured in test 1 upon specimen flooding, taking into account equation (7) and the values ψad =
97 MPa , ∆εexpansion = 0.23% (see fig. 11).
Finally, the threshold value for the hardening parameter marking the onset of the clastic hardening
stage, σ0ch, is derived from the yield surface equation (eq 12). This is done by introducing in eq. 12
the stress-suction values at the point where the stress-strain relationship departs from the straight
line and using the previously computed parameters (λi, λ0, κ, αψ and σy). For test 1, as can be seen
in figure 11, the transition point is attained at σ = 1.20 MPa and ψ = 0 MPa.
The computed model parameters are summarised in table 1. Once model parameters were
identified, tests 3 and 4 were simulated and compared with observed behaviour (Figures 11b and
12). The agreement is very good.
One of the striking features of the rockfill behaviour is its formal similarity with the behaviour of
unsaturated soils of medium to low plasticity and relatively loose structure as described, for
instance, in Alonso et al (1987, 1990). Yield surfaces plotted in Figure 19 play formally the same
role and have similar shapes to the “Loading-Collapse” (LC) yield curves proposed for unsaturated
soils. Yet, the underlying mechanisms and the role of suction are totally different in both cases. A
comparison of soil and rockfill behaviour will be presented later.
41
Table 1. Model parameters determined on the basis of experimental data obtained in tests 1 and 2.
λr [MPa-1] 2.200×10⁻²
λi [MPa-1] 1.605×10⁻²
λd0 [MPa-1] 6.305×10⁻²
αψ [MPa-1] 0.599×10⁻²
σy [MPa] 0.2
κ [MPa-1] 0.092×10⁻²
κψ [MPa-1] 0.033×10⁻²
σ0ch [MPa] 4.310
0
20
40
60
80
100
120
140
160
180
200
220
240
260
280
300
320
0 2 4 6 8 10
Vertical stress [MPa]
Tota
l suc
tion
[MPa
]
Yield surface
PR-CY limit surface
CY-CH limit surface
ε p=1
σy
2 3 4 5 6 7 8 9 10 11 12%
• Figure 19. Yield surfaces, corresponding to different plastic strain levels. Limit surfaces are shown
between particle rearrangement (PR) and clastic yielding (CY) stages and between clastic yielding and
clastic hardening (CH) stages.

42
6 MODELLING ROCKFILL EMBANKMENTS AND DAMS
The very high permeability of a rock fill makes it extremely unlikely in practice a condition of
saturated flow. In a zoned earth and rockfill dam the upstream shoulder becomes inundated when
the water reservoir level is increased. The downstream shoulder is, however, typically subjected to
rainfall infiltration (and evapotranspiration) from and towards the atmosphere.
Similar hydraulic boundary conditions are expected in rockfill embankments used in highway or
railway construction. The large open voids of the rockfill remain therefore essentially filled with air
and water vapor during the lifetime of these structures. As illustrated in Figure 20, liquid water flow
is likely to develop as a film transport mechanism around the large rock blocks. If the rock blocks
are not fully saturated water may also penetrate into the particles through the connected porosity
and also along cracks. Especially relevant for the purposes of rockfill deformation are the cracks
which develop at the particle contacts.
A simplified framework for this complex transport mechanism could be established by postulating
two energy states of the rockfill water: the energy associated to the state of the water in open voids
and the water energy inside the rock blocks. The first one will control the flow of free water. This
free water will be retained by capillary actions at the grain-to-grain contacts and also by rock
surface effects. The fundamental mechanisms of water transfer under these circumstances have
been discussed, for instance, in Gili and Alonso (2002). In the present work a generalized Darcy
type of equation for unsaturated material will be used, instead. It is a simple formulation in which
the rate of water transfer is controlled by the bulk degree of saturation through a relative
permeability term.
• Figure 20. Scheme to show water transfer in a rockfill.
43
The local loss of water towards (or from) the rock blocks will be made equivalent to a sink (source)
term, which depends on the difference of water energy (or total suction) in the open voids and the
rock matrix (s and sm respectively; see Figure 20). A simple linear formulation for this sink term is
therefore:
( )mwm
ssdt
dwq −α′ρ−=−= (15)
where q is the flow rate interchanged between the open voids and the rock particles; wm is the
mass of microstructural water (water in the rock particles) and α’ is a phenomenological transfer
coefficient. If φm is the porosity of the rock particles, the rate of change of the microstructural mass
of water may be also defined as:
( )dt
dS1
dtdw m
lm
mφφ−ρ=
(16)
where Slm is the microstructral degree of saturation and φ is the bulk (or macrostructural) porosity
of the rockfill. Water retention properties are also required to complete the formulation. They were
determined for the Cambric slate tested under oedometer and triaxial conditions . The following
expression may, for instance, define the matrix degree of saturation of the rock particles:
( )omml p/sexpS −= (17)
where po is a reference suction (model parameter).
The coupled flow-deformation problem of the rockfill may be defined through the equations of
water mass balance and mechanical equilibrium.
The water mass balance reads
( ) ( ) qfSSt
wwg
wlg
wgl
wl ==+⋅+φθ+φθ
∂∂ jj∇
(18)
In this expression, φ is the rockfill porosity, θlw and θgw are the masses of water per unit volume of
liquid and gas respectively; Sg = 1 – Sl and jlw and jgw are the flow rates (both diffusive and
advective of water in liquid and gas phases. The term fw describes the external supply of water
and, in our case it will be represented by the local sink term q as given in equation (18).
The stress equilibrium may be expressed in terms of total stress components, σ, and body forces,
b, as:
0=+ bσ⋅∇ (19)
Internal capillary stress components are assumed to be negligible and therefore formulations used
44
for unsaturated soils (Alonso et al. 1988) are not required here.
The set of equations (15), (18) and (19) may be solved provided a number of constitutive relations
and equilibrium restrictions are included (Olivella et al. 1994, 1996). For the open void structure of
the rockfill the following information must be provided: the generalized Darcy’s law for liquid flow
transfer, a Fick’s law for vapour diffusion transfer and a water retention relationship between bulk
degree of saturation and water suction. The local flow (sink/source term) requires the specification
of a water retention relationship (such as equation (17)) and the local transfer coefficient α´
(equation (15)).
Rock particles do not deform in the model developed. Rockfill deformation, including particle
breakage, is represented by the overall macroscopic constitutive equations described before. They
may be conveniently described as:
( )( )mep sd oddD εεσ −= (20)
where Dep is the elastoplastic constitutive matrix and dεo are the strains associated with changes in
the particles water content or, its equivalent, the microstructural suction sm. Expressions for Dep and
dεo(sm) may be derived on the basis of the constitutive relations presented before.
The formulation outlined above has been implemented into an existing numerical tool for thermo-
hydro-mechanical analysis of unsaturated/saturated porous media (CODE_BRIGHT). Details of the
theoretical basis and numerical formulation of this code may be found in Olivella et al. (1994,
1996). Macrostructural suction is selected as the independent suction variable. At every time
increment, sm may be determined locally through equations (15) and (16).
The capabilities of this formulation were investigated in a simulation of the behaviour of the 40m
high shale embankment (Figure 5). No tests were available on the shaly material of this rockfill
embankment but a comprehensive testing program was available in a similar material: the
Pancrudo shale gravel which has been reported in Chapter 4 of this paper. Therefore, it was
decided to simulate the behaviour of a 40m high “column” (the problem was made 1-D for
simplicity) of the Pancrudo material subjected to the actual rainfall record measured “in situ” during
the period (1993-1997) (Figure 21). Mechanical parameters for the mechanical model have been
given in table 1. Water retention properties, permeability and transfer coefficients were derived
from the analysis of the oedometer tests performed. The computed settlement rates are plotted in
Figure 22 against the actual recorded values. The computed response tend to be faster than the
actual measurements but the calculated values reproduce well the effect of rainfall peaks on the
velocity of embankment settlement. The total settlement (Figure 23) is underestimated although
this is not a very significant result in this case since no tests on the actual embankment material
were available. An additional factor in this regard is the fact that no true time effects were
introduced into the analysis. Time effects are only a consequence of the evolution of rainfall. Note
45
also that the high rain intensity at the end of 1996 does not produce a significant increase in
settlement rates. The model reproduces well this change in trend. The explanation for this
qualitative change is given in Figure 24. At the end of the simulation period the relative humidity
prevailing in pores and rock particles of the embankment has increased substantially (suction has
decreased steadily) and most of the collapse potential has disappeared. Within the framework of
the model developed, the yield curves (shown in Figure 19) have moved towards the right,
“pushed” by the stress-decreasing suction increasing the elastic domain. Further wetting is no
longer capable of inducing volumetric deformations.
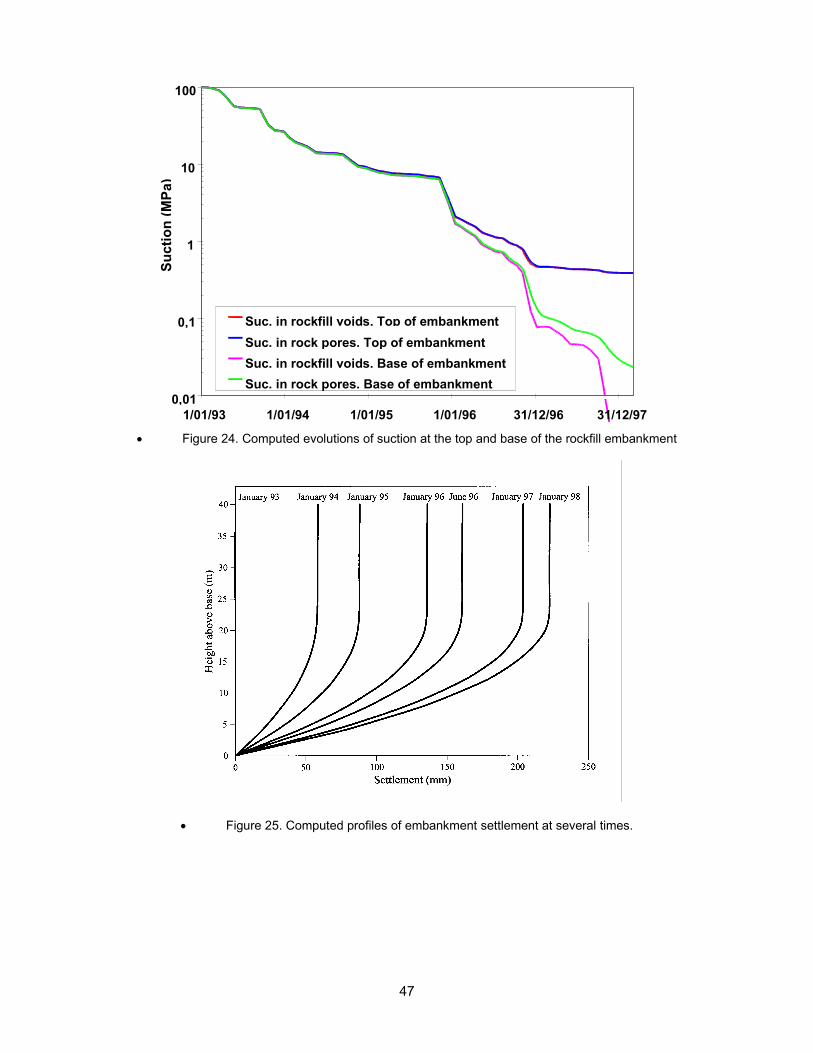
A final interesting aspect of the analysis is shown in Figure 25 were the computed settlement
profiles are plotted for several dates. Settlements develop in the lower part of the embankment but
not in the upper part. This is a consequence of the threshold effect incorporated into the model
through the parameter σy . For vertical stresses below σy , no collapse effects are induced. This is
a consequence of the underlying fracture propagation model which is not active below a given
toughness. Within the framework developed σy defines an embankment thickness were no water –
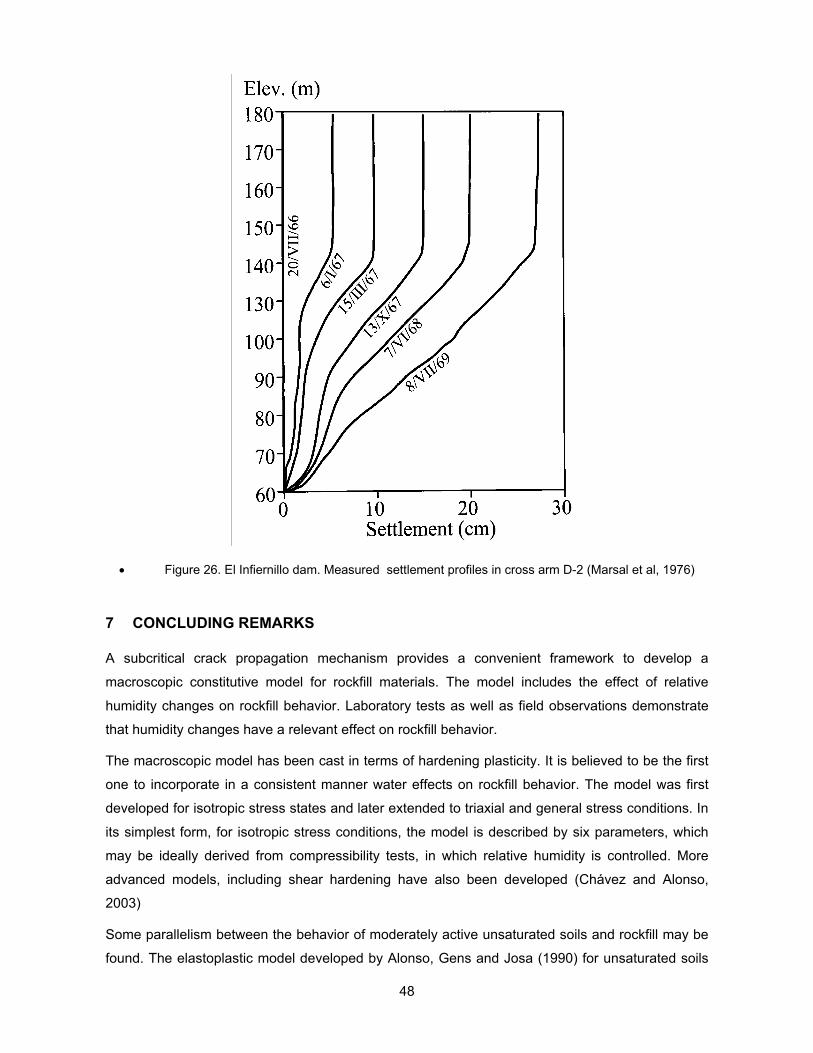
induced collapse is to be expected. The embankment had no extensometers installed and no
comparison with field measurements is possible in this case but Figure 26 shows the settlement
records measured in cross-arm D-2 of El Infiernillo dam (the position is shown in Figure 4). No
deformations were essentially recorded in the upper parts of the dam, a behaviour which is
consistent with the proposed ideas.
0
50
100
150
200
250
300
350
400
1/01/93 1/01/94 1/01/95 1/01/96 31/12/96 31/12/97
Rai
n (l/
mon
th)
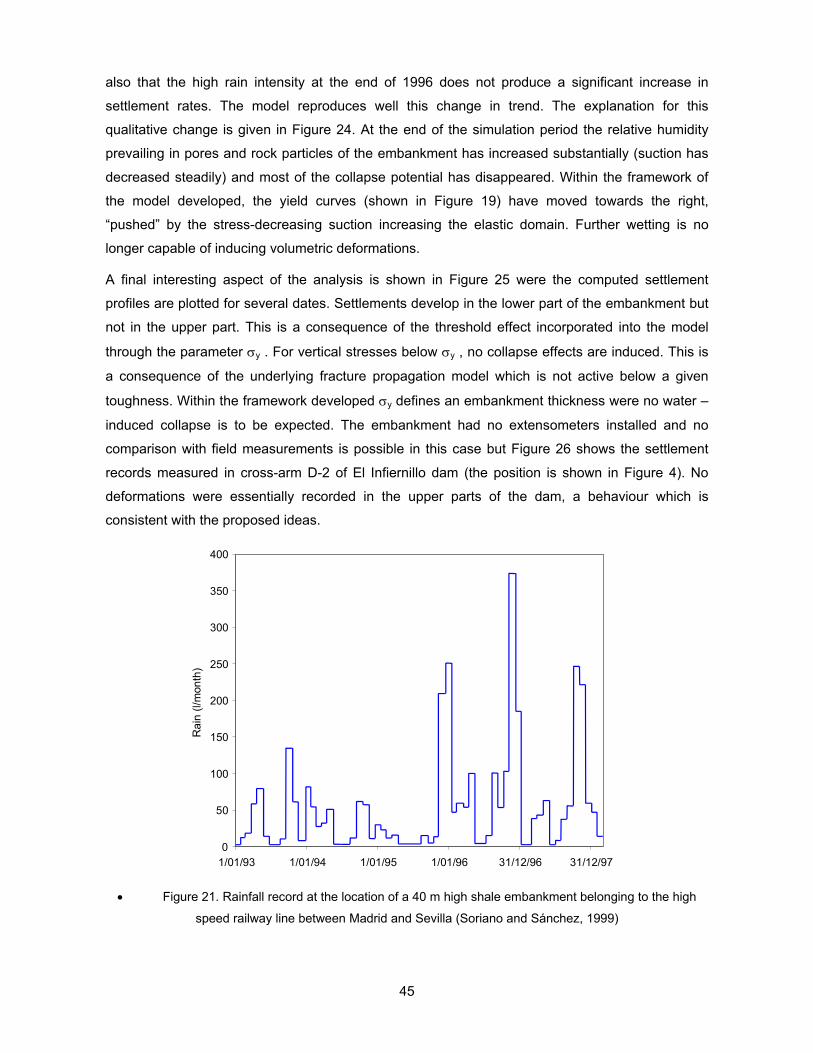
• Figure 21. Rainfall record at the location of a 40 m high shale embankment belonging to the high
speed railway line between Madrid and Sevilla (Soriano and Sánchez, 1999)

46
0
2
4
6
8
10
12
14
16
18
20
1/01/93 1/01/94 1/01/95 1/01/96 31/12/96 31/12/97
Settl
emen
tvel
ocity
(mm
/mes
)
AVE records (Soriano& Sánchez, 1999)CODE_BRIGHT Model
• Figure 22. Comparison of measured and computed settlement rates of a 40 m high shale
embankment.
0
50
100
150
200
250
300
350
1/01/93 1/01/94 1/01/95 1/01/96 31/12/96 31/12/97
Settl
emen
t (m
m)
AVE records (Soriano & Sánchez, 1999)4 meters above base12 meters above base40 meters above base (top of embankment)
• Figure 23. Measured total settlements and computed values at some elevations within the
embankment
47
0,01
0,1
1
10
100
1/01/93 1/01/94 1/01/95 1/01/96 31/12/96 31/12/97
Suct
ion
(MPa
)
Suc. in rockfill voids. Top of embankmentSuc. in rock pores. Top of embankmentSuc. in rockfill voids. Base of embankmentSuc. in rock pores. Base of embankment
• Figure 24. Computed evolutions of suction at the top and base of the rockfill embankment
• Figure 25. Computed profiles of embankment settlement at several times.
48
• Figure 26. El Infiernillo dam. Measured settlement profiles in cross arm D-2 (Marsal et al, 1976)
7 CONCLUDING REMARKS
A subcritical crack propagation mechanism provides a convenient framework to develop a
macroscopic constitutive model for rockfill materials. The model includes the effect of relative
humidity changes on rockfill behavior. Laboratory tests as well as field observations demonstrate
that humidity changes have a relevant effect on rockfill behavior.
The macroscopic model has been cast in terms of hardening plasticity. It is believed to be the first
one to incorporate in a consistent manner water effects on rockfill behavior. The model was first
developed for isotropic stress states and later extended to triaxial and general stress conditions. In
its simplest form, for isotropic stress conditions, the model is described by six parameters, which
may be ideally derived from compressibility tests, in which relative humidity is controlled. More
advanced models, including shear hardening have also been developed (Chávez and Alonso,
2003)
Some parallelism between the behavior of moderately active unsaturated soils and rockfill may be
found. The elastoplastic model developed by Alonso, Gens and Josa (1990) for unsaturated soils

49
has also formal similarities with the model presented here. However, major differences remain and
they have been collected in table 2 to underline the fundamental differences between rockfill and
unsaturated soil behavior.
Table 2. Comparison between unsaturated soil and rockfill behavior.
Unsaturated rockfill Unsaturated soil
Collapse is associated with particle breakage and a subsequent rearrangement of struc-
ture
Collapse is associated with particle rearrangement
Particle toughness is a fundamental property Particle strength does not affect overall behaviour
The effect of suction is to control particle breakage velocity
The effect of suction is to “prestress” soil structure
Particle toughness is included in the model through a single parameter (confining stress,
py)
For p<py no time delayed deformations exist (no collapse)
There is no equivalent parameter
TOTAL suction controls water induced effects
MATRIC suction controls water induced effects
Time delayed deformations (and hence collapse) is inhibited for very dry states
There is no equivalent concept
Yield stress for the very dry state is conveniently chosen as a hardening
parameter
Yield stress of the saturated soil is conveniently chosen as the hardening
parameter
Elastoplastic strains (instantaneous and delayed) are linearly related to confining
stress for the relevant range of stresses in practice
Elastoplastic stains are linearly related to log (confining stress)
In a compacted material yield starts at zero stress
A compacted material is characterized by an initial yield locus
A further development to the mechanical model comes from the consideration of water transfer
mechanisms in rockfill materials. Since wetting or drying the rock particles has a very distinct effect
on overall behavior, a procedure to model the local water interchanges has been set out. Particle
breakage has been related to the suction or water energy prevailing inside rock particles. The
coupled flow-deformation model presented provides a comprehensive tool for the analysis of
rockfill structures subjected to environmental changes as well as mechanical loading. Comparison
of model calculations and some field observations show encouraging similarities.

50
8 REFERENCES
Alonso, E.E., Gens, A. & Hight D.W. (1987). Special Problem Soils. General Report. Eur. Conf. On
Soil Mech. And Found. Engng. Dublin.
Alonso, E.E., F. Batlle, A. Gens & A. Lloret (1988). Consolidation analysis of partially saturated
soils. Application to earthdam construction. Proceedings of the 6th Int. Conf. on Num. Meth. in
Geomech. Innsbruck: 1303-1308.
Alonso, E.E., A. Gens & A. Josa (1990). A constitutive model for partially saturated soils.
Géotechnique. 40: 405-430.
Alonso, E.E. & L.A. Oldecop (2000). Fundamentals of rockfill collapse. 1st Asian Conference on
Unsat. Soils. Singapore.
Alonso, E.E. and Romero, E. (2003) Collapse behaviour of sand. Proc. Of the 2nd Asian
Conference on Unsaturated Soils. Osaka, Japan, 325-334.
Atkinson, B. K. & Meredith, P. G. (1987). The theory of subcritical crack growth with applications to
minerals and rocks. Fracture Mechanics of Rock, B. K. Atkinson, ed. London: Academic Press Inc.,
111-166.
Bernier, F., Volckaert, G., Alonso, E. and Villar, M. (1997), “Suction controlled experiments on
Boom Clay,” Engineering Geology, Vol. 47, pp. 325-338.
Chávez and Alonso, E.E. (2003) A constitutive model for crushed granular aggregates which
includes suction effects. Soils and Foundations, Vol. 43, No. 4, 215-228.
Clements, R. P. (1981). The deformation of rockfill: inter-particle behaviour, bulk properties and
behaviour in dams.Ph.D. Thesis, Faculty of Engineering, King´s College, London University.
Coop, M.R. & I.K. Lee (1995) The influence of pore water on the mechanics of granular soils. Proc.
11th ECSMFE, Copenhagen. Vol.1, 1.63-1.72.
De Alba, E. & Sesana, F. (1978). The influence of expansive minerals on basalt behaviour. Proc.
Int. Congress Engng Geology, Madrid: 107-116.
Delage, P., Howat M. D. and Cui, Y. J. (1998). “The relationship between suction and swelling
properties in a heavily compacted unsaturated clay,” Engineering Geology, Vol. 50, pp. 31-48.
Delgado, J., Veiga Pinto, A. & Maranha das Neves, E. (1982). Rock index properties for prediction
of rockfill behaviour. Memoria no. 581, Laboratório Nacional de Engenharia Civil, Lisbon.
Dendani, H., Flavigny, E. and Fry, J.J. (1988). “Triaxial Test for Embankment Dams: Interpretation
and Validity”. Advanced Triaxial Testing of Soil and Rock, ASTM STP 977, Robert T. Donaghe,
Ronald C. Chaney and Marshall L. Silver, Eds., American Society for Testing Materials,
Philadelphia, 486-500.
51
Esteban, F. (1990), Caracterización de la expansividad de una roca evaporítica. Identificación de
los mecanismos de hinchamient, Ph. D. Thesis, Universidad de Cantabria, Santander.
Freiman, S.W. (1984). Effects of chemical environment s on slow crack growth in glasses and
ceramics. J. Geophysical Research, 89 (B6): 4072-4076.
Gens, A. García Molina, A.J, Olivella, S., Alonso, E.E., and Huertas, F. (1998). Analysis of a full
scale in situ test simulating repository conditions. International Journal for Numerical and Analytical
Methods in Geomechanics, 22: 515-548
Gens, A. and Alonso, E.E. (1992) A framework for the behaviour of unsaturated expansive clays.
Can. Geot. J. 29, 1013-1032.
Gili, J. (1988). Modelo microestructural para medios granulares no saturados. Tesis Doctoral.
Barcelona: UPC.
Gili, J. and Alonso, E.E. (2002) Microstructural deformation mechanisms of unsaturated granular
soils. Int. Jnl. for Num. And Anal. Meth. In Geomech., 26, 433-468
Marsal, R. J. (1973). Mechanical properties of rockfill. Embankment Dam Engineering. Casagrande
Volume. Hirschfeld, R. C. & Poulos, S. J., eds. John Wiley & Sons.
Marsal, R.J., Arellano, L.R.Guzmásn, M.A. & Adame, H. (1976). El Infernillo. Behaviour of dams
built in Mexico. Mexico: Instituto de Ingeniería, UNAM.
McDowell, G.R. and M.D. Bolton (1998). On the micromechanics of crushable aggregates.
Géotechnique 48, No. 5, 667-679
Michalske, T.A. & Freiman, S.W. (1982). A molecular interpretation of stress corrosion in silica.
Nature, 295: 511-512.
Nara, Y. and Kaneko, K. (2003) The dependence of subcritical crack growth in rocks on water
vapour pressure. Proc. Of the Int. Conf. On coupled T-H-M-C Processes in Geo-systems:
Fundamentals, Modelling, Experiments and Applications. (GeoProc 2003) Part 1:526-531.
Stockholm, Sweden.
Nelson, J.D. and Miller, D.J. (1992) Expansive soils. Problems and Practice in Foundation and
Pavement Engineering. Wiley
Nobari, E. S. & Duncan, J. M. (1972). Effect of reservoir filling on stresses and movements in earth
and rockfill dams. Department of Civil Engineering, Report No. TE-72-1, University of California.
Oldecop, L. (2000). “Compresibilidad de escolleras. Influencia de la humedad”. PhD. Thesis. UPC.
Oldecop, L. and Alonso EE (2001). ”A model for rockfill compressibility”. Géotechnique 51(2), pp.
127-140.
Oldecop, L.A. and Alonso, E.E. (2003), “Suction effects on rockfill compressibility” Géotechnique,
52
Vol. 53, pp. 289-292.
Olivella, S., J. Carrera, A. Gens & E.E. Alonso (1994). Nonisothermal multiphase flow of brine and
gas through saline media. Transport in Porous Media. 15:271-293.
Olivella, S., A. Gens & A. Josa (1996). Numerical formulation for a simulator (CODE_BRIGHT) for
the coupled analysis of saline media. Engineering Computations. 13, 7: 87-112.
Pestana J.M.and A.J.Whittle (1995) Compression model for cohesionless soils. Géotechnique, 45,
No. 4, 611-631.
Romero, E., (1999), “Thermo-hydro-mechanical behaviour of unsaturated Boom Clay: an
experimental study,” Ph. D. Thesis, Universitat Politècnica de Catalunya, Barcelona.
Romero, E., Gens, A. and Lloret, A., (1999), “Water permeability, water retention and
microstructure of unsaturated compacted Boom Clay,” Engineering Geology, Vol. 54, pp. 117-127.
Romero, E., Gens, A. and Lloret, A. (2001) “Laboratory testing of unsaturated soils under
simultaneous suction and temperature control”. Proc. 15th ICSMGE, Istanbul, vol 1, 619-622.
Sherard, J.L. & Cooke, J.B. (1987). Concrete-face rockfill dam: I. Assessment. J. Of Geotech.
Engng. ASCE, 113 (10): 1096-1112.
Soriano, A. & Sánchez, F. J. 1999 Settlements of railroad high embankments. Proc. XII European
Conf. on Soil Mech. and Geotech. Eng., Netherlands.
Sowers, G. F., Williams, R. C. & Wallace, T. S. (1965). Compressibility of broken rock and
settlement of rockfills. Proc. 6th ICSMFE, 2, Montreal: 561-565.
Terzaghi, K. (1960). Discussion on salt springs and lower bear river dams. Trans. ASCE, 125 (2):
139-148.
Villar, M. (1999), “Investigation of the behaviour of bentonite by means of suction-controlled
oedometer tests,” Engineering Geology, Vol. 54, pp. 67-73.
Vutukuri, V. S., Lama, R. D. y Saluja, S. S. (1974). Handbook on Mechanical Properties of Rocks,
Vol. 1, Trans Tech Publications, Claustahl.
Wiederhorn, S. M., Fuller, E. R. and Thomson, R. (1980), “Micro-mechanisms of crack growth in
ceramics and glasses in corrosive environments,” Met. Sci., Vol. 14, pp. 450-458.
Wiederhorn, S. M., Freiman, S.W., Fuller, E.R. & Simmons, C.J. (1982). Effects of water and other
dielectrics on crack growth. J. Mater. Sci., 17: 3460.
Yahia.-Aissa, M. (1999), “Comportement hydromécanique d’une argile gonflante fortement
compactée,” Ph. D. Thesis, École Nationale des Ponts et Chaussées, Paris.

53


![[Terzaghi] Unsaturated Soil Mechanics (2007)](https://img.pdfslide.net/doc/110x75/545096f2b1af9f4c648b4d35/terzaghi-unsaturated-soil-mechanics-2007.jpg)