Embed Size (px)
Citation preview
S E R V I N G C A N A D I A N S
Research and Statistics DivisionExploring the Link between Crime andSocio-Economic Status in Ottawa andSaskatoon: A Small-Area GeographicalAnalysis

Exploring the Link between Crime and Socio-Economic Status in Ottawa and Saskatoon: A Small-Area Geographical Analysis Peter Kitchen, Ph.D. Department of Justice Canada Research and Statistics Division Methodological Series
rr06-6e The views expressed in this report are those of the author and do not necessarily represent the views of the Department of Justice Canada.
Research and Statistics Division

Research and Statistics Division / Department of Justice Canada | i
Table of Contents
Executive Summary ....................................................................................................................... iii 1. Introduction.............................................................................................................................. 6 2. Social and Geographic Aspects of Crime: A Review of Theory and Literature ..................... 8 3. The Social Geographies of Ottawa and Saskatoon and Overall Trends in Crime................. 13 4. Sources of Data...................................................................................................................... 22
Study # 1 - Ottawa Dissemination Areas.......................................................................... 22 Study # 2 - Saskatoon Neighbourhoods............................................................................ 23 Study # 3 – A Comparison of Neighbourhoods in Ottawa and Saskatoon....................... 25
5. Methods Of Analysis ............................................................................................................. 32 Section 5.1- Plan of Analysis............................................................................................ 32 Section 5.2 - Statistical and Geographic Methods of Analysis......................................... 32
Descriptive Statistics............................................................................................ 32 Transformation of Variables................................................................................ 32 Principal Components Analysis........................................................................... 33 Multiple Regression ............................................................................................. 33 Cartographic and GIS Analysis ........................................................................... 34 Spatial Autocorrelation........................................................................................ 35
6. Study # 1 Findings: Dissemination Areas of Ottawa............................................................. 36 Section 6.1 – Descriptive Statistics................................................................................... 36 Section 6.2 – Principal Components Analysis.................................................................. 37 Section 6.3 – Multiple Regression .................................................................................... 37 Section 6.4 – Cartographic and GIS Analysis: Examining Spatial Patterns of
Crime and Disadvantage ...................................................................................... 39 High Crime Areas (HCAs) ................................................................................... 39 Disadvantaged Areas ........................................................................................... 40 The Intersection of High Crime and Disadvantaged Areas ................................. 41
Section 6.5 - Discussion.................................................................................................... 42 7. Study # 2 Findings: Neighbourhoods of Saskatoon .............................................................. 58
Section 7.1 – Descriptive Statistics................................................................................... 58 Section 7.2 - Principal Components Analysis................................................................... 58 Section 7.3 - Multiple Regression Analysis...................................................................... 59 Section 7.4 - Mapping and GIS Analysis: Identifying Spatial Patterns of Crime
and Neighbourhood Characteristics ..................................................................... 60 Section 7.5 - Spatial Autocorrelation................................................................................ 64 Section 7.6 - Characteristics of High Crime Areas........................................................... 65 Section 7.7 - Summary of Findings and Policy Issues for Saskatoon .............................. 66
Exploring the Link between Crime and Socio-Economic Status in Ottawa and Saskatoon: A Small-Area Geographical Analysis
ii | Research and Statistics Division / Department of Justice Canada
8. Study # 3 Findings: A Comparison of Neighbourhoods in Ottawa and Saskatoon............... 82
Section 8.1 - Principal Components Analysis................................................................... 82 Section 8.2 - Multiple Regression Analysis...................................................................... 83 Section 8.3 - Geographic Patterns of Crime in Ottawa and Saskatoon’s
Neighbourhoods ................................................................................................... 84 Section 8.4 - Discussion.................................................................................................... 85
9. Summary................................................................................................................................ 94 10. References.............................................................................................................................. 96
Research and Statistics Division / Department of Justice Canada | iii
Executive Summary
n recent decades, considerable research has been devoted to examining issues related to crime
and demography/social status at the inter-urban level in Canada. This ‘macro’ research
usually involves the collection and analysis of criminal offence and socio-economic data for
municipalities or Census Metropolitan Areas (CMAs). Research in urban geography and other
disciplines has demonstrated that extensive spatial variability exists within Canadian urban
centres with respect to social status and it is clear that crime is not distributed evenly across a
city. The three studies presented in this publication adopt a ‘micro’ approach by using Ottawa
and Saskatoon as case studies to examine the relationship between crime and socio-economic
status at the intra-urban level and, in the process, a model for small area crime analysis in
Canada is developed.
Study # 1 of Ottawa examined 2001 criminal offence data obtained from the Ottawa Police
Service and socio-economic indicators drawn from the 2001 Census aggregated at the level of
the dissemination area (DA). The DA is the smallest geographic area for which census data are
available and is comprised of several city blocks. A total of 32 variables (6 crime and 26 socio-
economic) in 1187 DAs in Ottawa were analyzed by way of multivariate statistical techniques
including principal components analysis and multiple regression. In addition, geographic
information systems software (ArcGIS) was used to produce a series of maps displaying the
distribution of high crime areas in Ottawa and the spatial relationship between these areas and
disadvantaged communities.
The study found that overall in Ottawa there is a weak statistical association between crime and
socio-economic status and that there are no clear social ‘predictors’ of crime at the level of the
DA. The mapping of crime variables displayed that “High Crime Areas” (HCAs) are largely
contained to the built up urban core with very few HCAs evident in outlying and rural areas. The
GIS analysis revealed that there is a moderate geographic relationship between crime and socio-
economic status in the city, with 40% of socially disadvantaged DAs also being HCAs. When
specific areas were examined more closely, a number of important characteristics did emerge
I
Exploring the Link between Crime and Socio-Economic Status in Ottawa and Saskatoon: A Small-Area Geographical Analysis
iv | Research and Statistics Division / Department of Justice Canada
from the study. For example, HCAs were found to have above average levels of low-income,
single people, and rented dwellings. In addition, the study identified a number of “Hot-Spots” in
the city (a combination of high crime and social disadvantage) and these areas were found to
have higher rates of violent crime and substantially larger proportions of recent immigrants,
visible minorities and residents living in apartment buildings.
With respect to crime prevention strategies in Ottawa, it is apparent that attention should focus
on enforcement and social upgrading in disadvantaged communities with high rates of crime and
programs should be designed to reflect the social characteristics and meet the needs of the
residents living in these areas. At the same time, continued attention should be directed at
reducing criminal opportunity in other locations such as residential suburbs, commercial areas
and public spaces.
Study # 2 investigated the relationship between crime, socio-economic status and segregation in
Saskatoon and established several “predictors” of crime. The study examined 2003 crime
statistics, 2001 Census variables and development/planning indicators in Saskatoon’s 55
residential neighbourhoods. A total of 31 neighbourhood variables were analyzed by statistical
techniques including principal components analysis, multiple regression and spatial
autocorrelation. A series of maps showing the distribution of crime and neighbourhood
characteristics were produced with ArcGIS.
The study found that there is a strong relationship between crime and socio-economic status in
Saskatoon’s neighbourhoods. Aboriginal people, lone-parents and low-income families were
identified as particularly vulnerable segments of the population with respect to violent and major
property crimes. The mapping of crime variables revealed a solid clustering of High Crime Areas
(HCAs) on the west side of the South Saskatchewan River, particularly in the inner city. This
was especially evident for violent HCAs. By comparison, minor property and drug offences
displayed a more dispersed pattern. While a majority of Aboriginal and low-income people live
on the west side of the city, segregation is not a prominent feature of Saskatoon’s urban social
geography. HCAs were found to have higher proportions of singles and people who have
Research and Statistics Division / Department of Justice Canada | v
recently moved, significantly lower levels of educational attainment, poorer quality and older
housing and higher unemployment.
From a policy perspective, the study reviewed a number of initiatives undertaken by the City of
Saskatoon and the Saskatoon Police Service to improve quality of life and deal with increasing
crime in inner city neighbourhoods. Based on the results of the statistical and geographic
analysis, the study recommended that additional policy efforts should focus on four related areas:
(1) housing quality and affordability, (2) education and training, (3) youth programs and services
and (4) Aboriginal violence. In addition, it was proposed that the federal government expand its
Urban Aboriginal Strategy (UAS) and continue to work in collaboration with the Province of
Saskatchewan and the City of Saskatoon to provide affordable stable housing and education and
training options especially for young inner city Aboriginals. The goal should be to improve the
quality of life of residents living in these communities thereby reducing levels of victimization
and contact with the justice system.
Study # 3 involved the re-aggregation of the Ottawa dissemination area data from Study # 1 to
match the larger boundaries of the city’s 50 neighbourhoods. The crime and socio-economic data
were then re-analyzed at this level of geography and compared to the findings of the Saskatoon
neighbourhood analysis (Study # 2). The study found that a change in geography does have an
impact on the statistical relationship between crime and socio-economic status. Several
indicators were found to have a significant effect on crime levels in Ottawa’s neighbourhoods
including higher proportions of single people and youth not attending school as well as lower
average household incomes. The mapping of crime variables indicated a fairly dispersed pattern
of High Crime Areas (HCAs) within Ottawa’s urban core and a visible presence in several of the
city’s western suburban neighbourhoods.
Exploring the Link between Crime and Socio-Economic Status in Ottawa and Saskatoon: A Small-Area Geographical Analysis
6 | Research and Statistics Division / Department of Justice Canada
1. Introduction
n Canada, very little research has been devoted to exploring the geographic relationship
between the incidence of crime and socio-economic status at the intra-urban level. While
there is undoubtedly strong interest by criminologists, urban geographers and others in
investigating these links, research has been hindered by the fact that crime data are difficult to
obtain for small geographic areas such as the neighbourhood or city block. Several police
services across Canada are developing mechanisms to make small area data available. By
comparison, in recent years, researchers in the United States and the United Kingdom have
benefited from greater access to crime data and, as a result, are increasingly integrating this
information with census and other population based data at smaller levels of geography.
This publication has two principal objectives. The first is to contribute to the Canadian literature
in urban social geography and criminology by using Ottawa and Saskatoon as case studies to
explore the geographic relationship between crime and socio-economic status in the two cities.
The second objective is to develop a research model for small area crime analysis in Canada that
will contribute to a better comprehension of the social and economic circumstances associated
with crime at the intra-urban level and assist in the formulation of policies for crime prevention
and social upgrading.
The Canadian Centre for Justice Statistics (CCJS) releases crime data on an annual basis reported
by individual police departments across Canada aggregated according to the Uniform Crime
Reporting Survey (UCR). The data are available at a number of geographic levels including the
Census Metropolitan Area (CMA) and the Census Sub-Division (CSD). Several municipal police
services in Canada make monthly and annual crime statistics available for their patrol areas.
While these data are useful in examining general trends, the geographic areas represented are
quite large and given the extensive socio-spatial variability that exists in Canadian cities, there is
also a need to study patterns and relationships within urban areas at a smaller scale.
I
Research and Statistics Division / Department of Justice Canada | 7
It is important to point out that the offence data for both Ottawa and Saskatoon obtained for this
research consists only of the location and type of crime committed but does not include the
address or any other characteristics of the offender. Some offending clearly occurs in or near the
residence of the offender (such as domestic assault or minor property) and is, therefore,
meaningfully understood by population and household characteristics of the surrounding small
area (such as a neighbourhood). Other types of offending, such as break and enter, occur in or
near the residence or workplace of the victim but not the residence of the offender indicating that
knowledge of the local area may be relevant from the perspective of the target. Yet other
offences, such as assaults, occur in public areas such as bar and entertainment districts, shopping
areas and workplaces that bring together populations from many residential parts of the city. In
these cases, there is clearly no direct relationship between the characteristics of local residents
and offending patterns in the area.
This publication presents the results of three studies on crime and neighbourhood characteristics.
Study # 1 examines crime and socio-economic status in Ottawa at the level of the dissemination
area (DA), the smallest geographic unit for which census data is available. The working
hypothesis for Study # 1 is that there is a positive relationship between crime and disadvantaged
communities in Ottawa.
Study # 2 employs data for neighbourhoods in Saskatoon (geographic units significantly larger
than DAs) to examine the relationship between crime, socio-economic status and segregation in
the city. Specifically, the study addresses the following research question: What are the
predominant social and environmental characteristics that have an impact on crime in
Saskatoon’s neighbourhoods and how can the identification of suitable predictors of crime lead
to public policy initiatives aimed at alleviating community crime and reducing levels of
victimization?
Finally, Study # 3 re-aggregates Ottawa’s DA level data to match the boundaries of the city’s
neighbourhoods. This new dataset is then re-analyzed and compared directly to the findings of
the Saskatoon neighbourhood study, allowing a more meaningful comparison of the two cities.
The effect of a change in the level of geography on the relationship between crime and
neighbourhood characteristics is examined and discussed.
Exploring the Link between Crime and Socio-Economic Status in Ottawa and Saskatoon: A Small-Area Geographical Analysis
8 | Research and Statistics Division / Department of Justice Canada
2. Social and Geographic Aspects of Crime: A Review of Theory and Literature
esearch in criminology reveals that certain social characteristics are linked with a greater
likelihood of involvement in criminal activity. As Sacco and Kennedy (2002, p.39)
explain, it has been well documented that most offenders tend to be young, disadvantaged males.
In fact, in Canada in 1999, 86 percent of all adult offenders and 75 percent of all youth offenders
(aged 12 to 17) were males. Social and economic disadvantage has been found to be strongly
associated with crime, particularly the most serious offences including assault, robbery and
homicide. Data collected on offenders shows that they tend to be unemployed or employed in
low-paying, unskilled jobs. There is also an association between offenders and minority groups,
particularly African-Americans in the United States and Aboriginal people in Canada (Short,
1997, p. 26; Sacco and Kennedy 2002, p. 40).
The social characteristics of victims of crime are similar to those of offenders. According to the
1999 General Social Survey (GSS), young people in Canada between the ages of 15 and 24
experienced the highest rates of violent and property crimes. The GSS also found that rates of
personal victimization were highest in urban areas and among single people and those living in
households with low incomes (below $30,000). In his study of Canada’s 24 largest cities, Mata
(2003) found that higher rates of crime were linked to the presence of groups at risk including
Aboriginals, women and lone parents. However, with respect to certain property related crimes
such as break and enter, auto-theft and vandalism, studies have shown that rates of victimization
in Canada are greater for households with higher incomes (Sacco and Kennedy 2002, p. 48).
The study of the social characteristics of offenders and victims can be extended into a critical
examination of the role of place in influencing criminal activity. Research has been conducted on
the social and economic factors contributing to the level and type of crime experienced in a
community. The geography of crime with its emphasis on mapping and spatial analysis has
emerged in recent years as a growing area of research. However, ‘cartographic criminology’ has
a long history. For example, in the 19th century, community leaders and government officials in
R
Research and Statistics Division / Department of Justice Canada | 9
Europe and North America produced maps to demonstrate that patterns of crime were spread
unevenly across cities and regions (Herbert 1989, p.1).
In the 1920s and 1930s, ecological theory (also referred to as the Chicago School of
Criminology) was developed by Robert Park and Ernest Burgess. It postulates that crime will
always display an uneven geographical distribution and that this variation is the result of the
interrelationship between humans (or groups of humans) and their surroundings. As Schmalleger
and Volk (2001, p. 201) explain, ecological theory emphasizes the demographic and geographic
attributes of groups and views “the social disorganization that characterizes delinquency areas as
a major cause of criminality and of victimization”. Using Chicago as a model, Park and Burgess
found that criminal activity was associated with what they referred to as “zones in transition”
located around the city centre (Winterdyk 2000, p. 216).
As supporters of the ecology approach, Clifford Shaw and Henry McKay (1942), advanced
social disorganization theory in their study of communities with high levels of crime. Again,
using Chicago as a case study, they observed that crime rates were unevenly distributed
throughout the city in a non-random manner and that communities closest to the city centre were
those with the highest rates. These neighbourhoods were found to be areas in transition, having
low socio-economic status, high numbers of ethnic/racial minorities and high residential mobility
(Wilcox, Land, Hunt 2003, p.28). Shaw and McKay concluded that the high levels of crime were
not a function of the personal attributes of the groups living in the neighbourhoods but rather
argued that “the structural factors of poverty, high heterogeneity, and high mobility created
‘social disorganization’, and it was community-level social disorganization that was presumed to
cause crime” (Wilcox, Land, Hunt 2003, p.28). Furthermore, Short (1997, pp.50-51) argues that
research (primarily in the United States) has found that in broad terms, other factors often
combine with poverty to produce high rates of violent crime such as family structure and
community change. In the mid 1990s, there was a revival of Shaw and McKay’s approach in the
form of the “New Chicago School” which adopted computerized mapping and spatial analysis
techniques, particularly through the use of Geographic Information Systems (GIS) (Ainsworth
2001, p. 85).
Exploring the Link between Crime and Socio-Economic Status in Ottawa and Saskatoon: A Small-Area Geographical Analysis
10 | Research and Statistics Division / Department of Justice Canada
Working within the framework of the ecology of crime, American criminologist Rodney Stark
(1987) asks how neighbourhoods can remain areas of high crime and deviance despite a
complete turnover of their populations. He concludes that there must be something about places
that sustains crime. Stark developed a theory of deviant neighbourhoods and proposes that there
are five characteristics, or essential factors, that distinguish high crime areas:
1. high population density,
2. poverty,
3. mixed use of buildings for residential and commercial purposes,
4. transience, and
5. dilapidation.
Stark (1987, pp.895-904) proposes thirty propositions to form a theory of dangerous places and
to explain the ecology of crime. They include the following:
1. The higher the density, the greater the association between those most and least
disposed to crime.
2. The greater the density, the higher the level of moral cynicism.
3. Where homes are more crowded, there will be a greater tendency to congregate
outside the home in places where there are opportunities to deviate.
4. Where homes are crowded, there will be less supervision of children.
5. A reduced level of supervision results in poor school achievement, with a
consequent reduction in stakes in conformity.
6. Poor, dense neighbourhoods tend to be mixed-use neighbourhoods.
7. Mixed-use offers increased opportunity for congregating outside the home in
places conducive to deviance.
8. Poor, dense, mixed-use neighbourhoods have high transience rates.
The ecological approach has been criticized for its over-emphasis on place while overlooking the
individual. As Schmalleger and Volk (2001, p. 204) explain, by focusing on the role that social
institutions and social disorganization play in criminal activity, ecological approaches do not
Research and Statistics Division / Department of Justice Canada | 11
adequately account for the influence of “individual psychology, distinctive biology, or personal
choice on criminal activity”. Another criticism is that rates of neighbourhood crime can be
influenced to some degree by police decision-making where active enforcement in a particular
community creates the perception of higher levels of criminal activity than actually exist. Many
crimes occur in neighbourhoods that are not characterized by social disorganization. Crimes
related to violence, property and drugs routinely occur in affluent communities and other parts of
the city (Schmalleger and Volk 2001, p. 205). Furthermore, Felson (2002, pp.62-63) contends
that rates of residential burglary are higher in lower density cities and suburban communities
where physical layout and design features offer greater opportunity.
Another broad theoretical tradition, which addresses some of the criticisms of the ecological
approach, is the concept of criminal opportunity. It is assumed that opportunity is the necessary
condition for crime and that the growing number of consumer goods in stores and homes and the
sharp rise in personal affluence has provided increasing opportunities for criminal activity.
Closely associated with this concept is the routine activities theory of crime, in which
demographic or social class factors contribute to particular activity routines that merge three
prerequisites for crime: 1) the presence of a motivated offender (such as an unemployed
teenager), 2) a suitable target (such as a home containing goods which could be easily resold)
and, 3) the absence of a capable guardian (homeowner, watchful neighbour, friend or relative)
(Clarke and Felson, 1993, p.9; Knox 1995, p.256; Hackler 2000, p.169). As Wilcox, Land and
Hunt (2003, p.22) describe, the routine activities approach “stems from rational choice
assumptions and emphasizes the circumstances under which crime is most likely”. While a small
number of offenders may choose targets far from their home, the large majority will “stake-out”
local areas with which they are familiar when searching for a suitable target. Offenders tend to
operate in areas that they have come to know, possibly while engaging in non-criminal activities
(Ainsworth 2001, p.86).
With growing affluence and changing lifestyles, people are spending less time in home-based
routine activities and more time outside of the home in activities that increase their risk of being
victims (i.e. in bars and other public places). At the same time, their unguarded residences are
more likely to be targets of crime, particularly in suburban areas, which usually do not have as
many neighbours who are relatives or close acquaintances and who are effective guardians of
Exploring the Link between Crime and Socio-Economic Status in Ottawa and Saskatoon: A Small-Area Geographical Analysis
12 | Research and Statistics Division / Department of Justice Canada
their property (Hackler 2000, p.170). Another factor is the proliferation of easily transportable
wealth, such as computers, digital cameras and DVD players, putting homes (and in many cases
individuals) possessing such valuables at a greater risk of being victimized. As Felson (2002,
p.35) expresses, the items most sought after by offenders are “concealable, removable, available,
valuable, enjoyable, and disposable”.
Within the context of the geography of crime, a number of recent studies in North America and
Europe have employed data and mapping techniques to explore the relationship between crime
and socio-economic status at the intra-urban level. For example, research in Canada has shown
that crime is not evenly distributed within cities and there are significant differences in the levels
and types of crime experienced between cities. Cities in Western Canada generally have higher
rates of crime than those in Central and Atlantic Canada. In a study conducted by the Canadian
Centre for Justice Statistics, Fitzgerald, Wisener and Savoie (2004) examined the neighbourhood
characteristics and distribution of crime in Winnipeg. They analyzed police reported crime data
from the 2001 Incident-Based Uniform Crime Reporting Survey (UCR2) as well as the 2001
Census and City of Winnipeg land-use data. The study revealed that crime in Winnipeg in 2001
was concentrated in the city centre and that were significant differences in the characteristics of
high and low crime neighbourhoods. High crime areas were found to have lower socio-economic
status, less residential stability, higher population densities and certain land use patterns that may
increase opportunity for crime in the city.
Ley and Smith (2000) examined the association between crime and social deprivation in Toronto
and Vancouver. They secured disaggregated crime data for 207 patrol areas from the Metro
Toronto Police and found high crime areas in and around the central city that when mapped
corresponded closely with the most deprived neighbourhoods. A similar situation existed in
Vancouver with areas of high deprivation intersecting with high levels of reported crime.
Massimo, Haining and Signoretta (2001) employed a GIS-based spatial analysis to model high-
intensity crime areas (HIAs) in a sample of large cities in England. They integrated census data
into their model and found that HIAs are characterized by populations that are deprived, live at
high density and experience higher levels of population turnover. Bowers and Hirschfield (1999)
used GIS to explore relations between crime and the distribution of different types of

Research and Statistics Division / Department of Justice Canada | 13
disadvantaged, middle income and affluent residential neighbourhoods in Merseyside in north-
west England. The study demonstrated how a GIS can be used to build up a complex, multi-level
picture of relations between victim and offence locations.
3. The Social Geographies of Ottawa and Saskatoon and Overall Trends in Crime
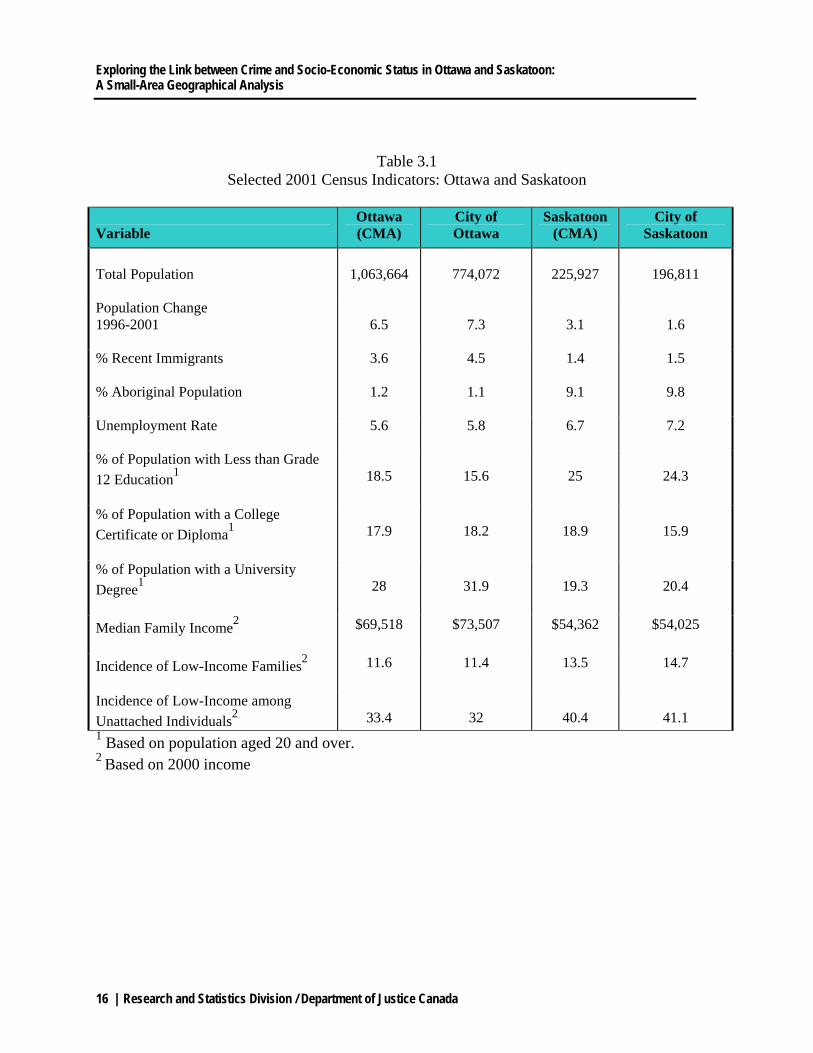
able 3.1 provides a list of selected socio-economic characteristics of Ottawa and Saskatoon
from the 2001 Census. The data is shown for the Census Metropolitan Area (CMA) and the
central city of each. In this report, the term “central city” is used to refer to the largest
municipality within each CMA – the City of Ottawa and the City of Saskatoon. As can be seen,
in terms of population, the Ottawa CMA is more than 4 times the size of the Saskatoon CMA
while Ottawa’s central city population (comprising the City of Ottawa and excluding the
Gatineau portion of the CMA) is almost four times the size of Saskatoon’s central city.
Population growth between 1996 and 2001 was significantly higher in Ottawa’s CMA and
central city as was the arrival of new immigrants over the same period. Saskatoon, particularly
it’s central city, experienced low growth between 1996 and 2001 and saw only a small number of
new immigrants coming to the city.
A distinguishing feature of many cities in western Canada is that they have higher proportions of
Aboriginal residents than those in Central and Atlantic Canada. According to the 2001 Census,
20,275 Aboriginal people live in the Saskatoon CMA giving it the highest rate among all mid-to-
large sized urban areas in Canada (9.1%). Nearly 10% of the central city population is
Aboriginal. A large number of the city’s Aboriginals live in and around the core neighbourhoods,
particularly on the west side of the South Saskatchewan River and overall, they suffer from
significantly higher levels of socio-economic disadvantage. By comparison, Ottawa has a smaller
Aboriginal population totalling 13,500 or just over 1% of its CMA and central city populations.
Both Ottawa and Saskatoon have relatively strong economies with job growth evident in
professional service occupations such as education, management, administration and science.
However, as can be seen in Table 3.1, Saskatoon’s CMA and central city unemployment rates
are slightly higher. (The unemployment rate among Saskatoon’s Aboriginal population is 22%
T
Exploring the Link between Crime and Socio-Economic Status in Ottawa and Saskatoon: A Small-Area Geographical Analysis
14 | Research and Statistics Division / Department of Justice Canada
and among North American Indian males it is 33%). Both cities have generally well-educated
residents, although Ottawa’s level of educational attainment is higher. More than 80% of the
city’s population aged 20 and over has at least a high school diploma compared to 75% in
Saskatoon. And, while the proportion that has a college certificate or diploma is comparable
between the two cities, a significantly higher percentage of Ottawa residents have acquired a
university degree. The gap between the two cities can be explained, in part, to the fact that
Aboriginals in Saskatoon, on average, have lower levels of education then non-Aboriginals.
Table 3.1 also reveals that there is a significant difference in income levels between the two
cities with the Ottawa CMA having a median family income of nearly $70,000 compared to just
under $55,000 in the Saskatoon CMA. Even more telling is a difference of nearly $20,000 in the
median family incomes in the two central cities. It should be noted, however, that the cost of
living is higher in Ottawa, particularly as related to housing prices. Furthermore, the table shows
that a slightly lager proportion of families and a substantially greater percentage of unattached
individuals in Saskatoon are living in low-income. The poorer socio-economic condition of
Aboriginal people in Saskatoon is a factor in the income gap between the two cities. For
example, according to the 2001 Census, the average income in Saskatoon is $28,045 while for
Aboriginals it is $17,667 and for North American Indians $14,513.
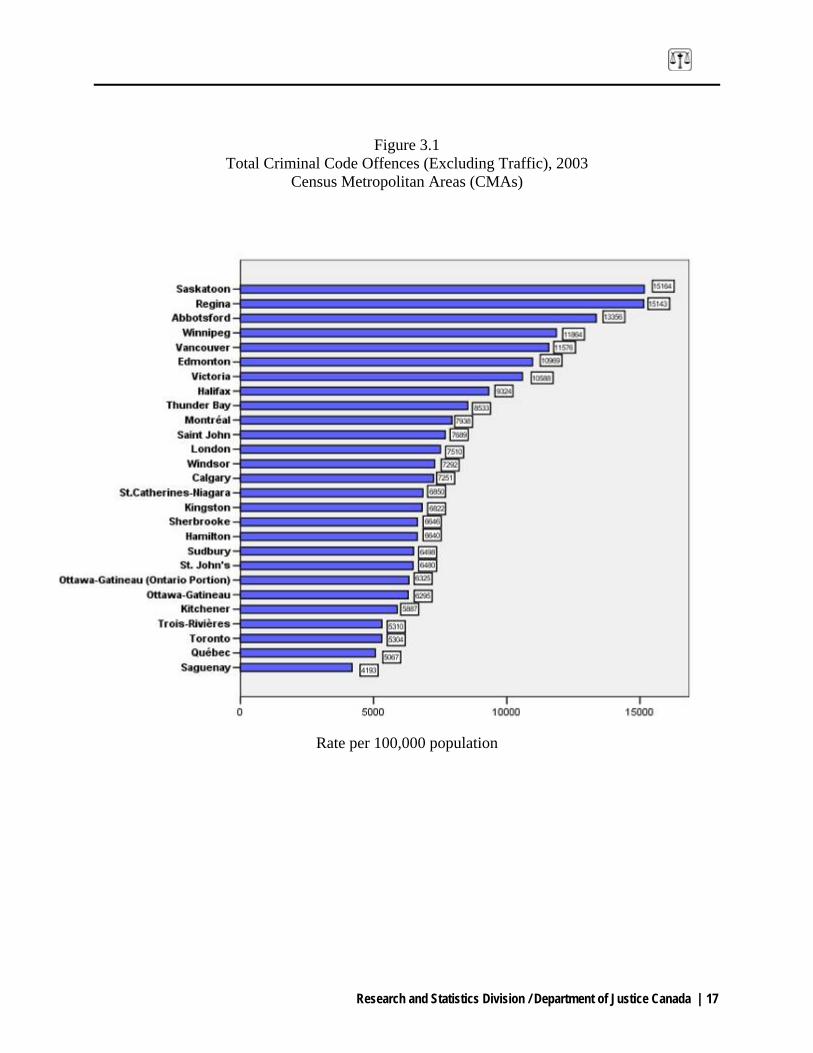
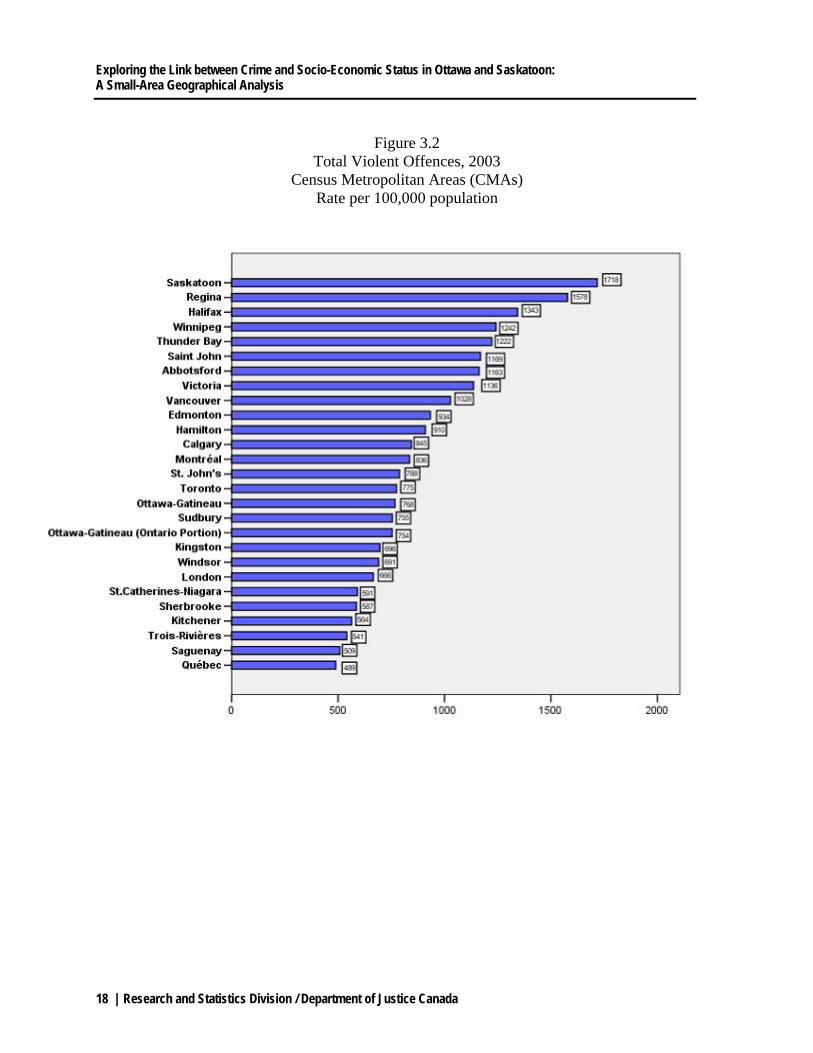
As shown in Figures 3.1 and 3.2, in 2003, Saskatoon had the highest crime rate among all CMAs
in Canada (15,164 per 100,000 population) as well as the highest violent crime rate (1,718 per
100,000 population). By comparison, the Ottawa CMA (Ontario portion) had one of the lowest
overall crime rates (6,325 per 100,000 population) and violent crime rates (754 per 100,000
population). Furthermore, Figure 3.3 reveals that Saskatoon had the second highest rate of
property crime among all CMAs (after Regina) while Ottawa had one of the lowest.
Table 3.2 provides a detailed look at selected crime statistics in Ottawa and Saskatoon in 2001,
2002 and 2003. The table makes it apparent that Saskatoon has an acute crime problem. For a
city with a population of about 225,000 it has recorded very high numbers of total criminal
code incidents during the 3-year period. In fact, when comparing the data between the two
Research and Statistics Division / Department of Justice Canada | 15
cities, Saskatoon has higher rates of crime in every category and for each offence type in 2001,
2002 and 2003.
In addition to Saskatoon having an overall crime rate more than double that of Ottawa, there are
a number of other trends that can be drawn from the data in Table 3.2. As seen, an important
feature of crime in Saskatoon is the prevalence of violent offences, particularly assault and
robbery. In 2003, the city recorded 3,351 total assaults and 739 robberies, large numbers
considering the size Saskatoon’s population. The rate of assaults (1,388 per 100,000 population)
was more than twice that of Ottawa’s and the rate of robberies (306 per 100,000 population)
more than three times. It is clear that Saskatoon also has a significant problem with ‘break and
entering’ offences. In 2003, the city registered 5,028 of these crimes (both residential and
commercial) compared to 5,749 in Ottawa, a city with more than three times the population size.
Furthermore, in 2003, the rate of offences involving ‘theft under $5000’ was more than twice
that of Ottawa’s. While it may be viewed as a relatively minor issue, both Ottawa and Saskatoon
have witnessed increases in offences related to property damage, largely incidents of vandalism
committed primarily by youth. These crimes labeled as ‘mischief under $5000’ were again more
prevalent in Saskatoon, which in 2003 recorded a rate almost three times that of Ottawa. Figure
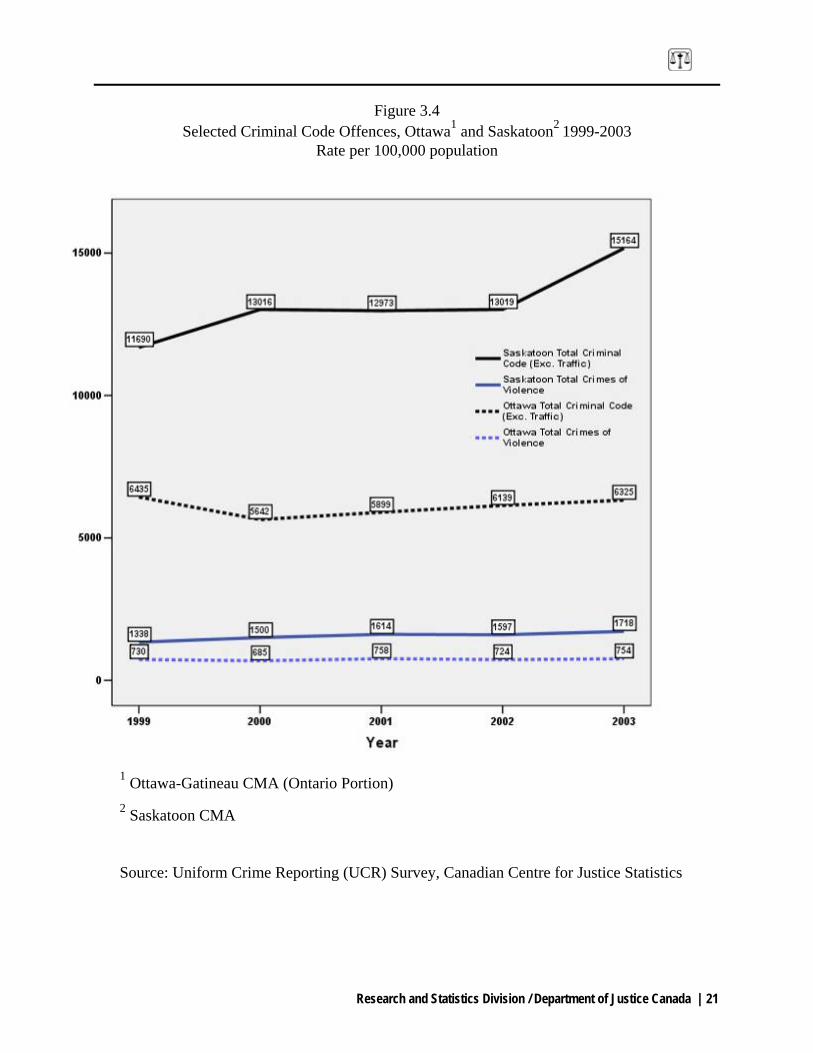
3.4 is a graph showing changes in crime rates in Ottawa and Saskatoon between 1999 and 2003.
As shown, there was a relatively steep increase of 30% in Saskatoon’s total crime rate between
1999 and 2003 with a particularly sharp rise between 2002 and 2003. By comparison, Ottawa’s
crime rate was generally flat but did fall slightly between 1999 and 2003. The graph also
displays changes in the violent crime rate in the two cities and indicates that while Saskatoon
recorded steady increases over the five-year period, particularly between 2002 and 2003,
Ottawa’s rates were more or less stable.
Exploring the Link between Crime and Socio-Economic Status in Ottawa and Saskatoon: A Small-Area Geographical Analysis
16 | Research and Statistics Division / Department of Justice Canada
Table 3.1 Selected 2001 Census Indicators: Ottawa and Saskatoon
Variable
Ottawa (CMA)
City of Ottawa
Saskatoon (CMA)
City of Saskatoon
Total Population
1,063,664
774,072
225,927
196,811
Population Change 1996-2001
6.5
7.3
3.1
1.6
% Recent Immigrants
3.6 4.5 1.4 1.5
% Aboriginal Population
1.2 1.1 9.1 9.8
Unemployment Rate
5.6 5.8 6.7 7.2
% of Population with Less than Grade 12 Education1
18.5
15.6
25
24.3
% of Population with a College Certificate or Diploma1
17.9
18.2
18.9
15.9
% of Population with a University Degree1
28
31.9
19.3
20.4
Median Family Income2
$69,518 $73,507 $54,362 $54,025
Incidence of Low-Income Families2
11.6 11.4 13.5 14.7
Incidence of Low-Income among Unattached Individuals2
33.4
32
40.4
41.1
1 Based on population aged 20 and over. 2 Based on 2000 income
Research and Statistics Division / Department of Justice Canada | 17
Figure 3.1 Total Criminal Code Offences (Excluding Traffic), 2003
Census Metropolitan Areas (CMAs)
Rate per 100,000 population
Exploring the Link between Crime and Socio-Economic Status in Ottawa and Saskatoon: A Small-Area Geographical Analysis
18 | Research and Statistics Division / Department of Justice Canada
Figure 3.2
Total Violent Offences, 2003 Census Metropolitan Areas (CMAs)
Rate per 100,000 population

Research and Statistics Division / Department of Justice Canada | 19
Figure 3.3
Total Property Offences, 2003 Census Metropolitan Areas (CMAs)
Rate per 100,000 population

Exploring the Link between Crime and Socio-Economic Status in Ottawa and Saskatoon: A Small-Area Geographical Analysis
20 | Research and Statistics Division / Department of Justice Canada
Table 3.2
Selected Crime Statistics: Ottawa and Saskatoon Ottawa-Gatineau CMA (Ontario Portion)
Actual Incidents Rate per 100,000 population
2001 2002 2003 2001 2002 2003 Total Criminal Code Incidents and Federal Statute Incidents (Exc. Traffic).
50,049
52,762
54,820
5,899
6,139
6,325 Total Crimes of Violence 6,431 6,288 6,540 758 724 754 Assault (total) 5,485 5,331 5,583 646 620 644 Robbery 883 788 865 104 91 100 Total Property Crimes 28,565 30,636 31,229 3,366 3,564 3,603 Break & Entering 5,217 5,346 5,749 615 622 663 Theft – Motor Vehicle 4,158 4,125 3,481 490 480 401 Theft under $5000 15,579 17,244 17,737 1,836 2,006 2,046 Total - Other Criminal Code 15,053 15,898 17,051 1,774 1,849 1,967 Mischief Under $5000 (property damage)
6,638
6,974
7,390
782
811
852
Total – Federal Statutes 1,557 1,785 1,369 183 207 158 Drugs 1,401 1,642 1,154 165 191 133
Saskatoon CMA Actual Incidents Rate per 100,000 population
2001 2002 2003 2001 2002 2003 Total Criminal Code Incidents and Federal Statute Incidents (Exc. Traffic)
30,845
31,097
37,596
12,972
13,018
15,164 Total Crimes of Violence 3,838 3,815 4,146 1,614 1,597 1,718 Assault (total) 3,270 3,245 3,351 1,375 1,358 1,388 Robbery 529 522 739 222 218 306 Total Property Crimes 15,255 15,215 19,250 6,416 6,369 7,974 Break & Entering 4,160 3,938 5,028 1,749 1,648 2,082 Theft – Motor Vehicle 1,309 1,271 1,795 550 532 743 Theft under $5000 7,816 8,117 10,311 3,287 3,398 4,271 Total - Other Criminal Code 11,752 12,067 13,209 4,942 5,051 5,472 Mischief Under $5000 (property damage)
4,418
4,132
5,139
1,858
1,729
2,128
Total – Federal Statutes 917 1,111 991 386 465 410 Drugs 673 721 678 283 301 281
Research and Statistics Division / Department of Justice Canada | 21
Figure 3.4 Selected Criminal Code Offences, Ottawa1 and Saskatoon2 1999-2003
Rate per 100,000 population
1 Ottawa-Gatineau CMA (Ontario Portion) 2 Saskatoon CMA
Source: Uniform Crime Reporting (UCR) Survey, Canadian Centre for Justice Statistics
Exploring the Link between Crime and Socio-Economic Status in Ottawa and Saskatoon: A Small-Area Geographical Analysis
22 | Research and Statistics Division / Department of Justice Canada
4. Sources of Data
Study # 1 - Ottawa Dissemination Areas
wo types of data were collected and analyzed: criminal offence data obtained from the
Ottawa Police Service (OPS) for 2001 and socio-economic data drawn from Statistics
Canada’s 2001 Census. Both the crime and census data were aggregated at the level of the
dissemination area (DA). Dissemination areas were defined by Statistics Canada for the 2001
census and are small areas composed of one or more neighbouring city blocks, with a population
of 400 to 700 persons. They are the smallest standard geographic areas for which all census data
are disseminated. In 2001, there were approximately 1,200 DAs in Ottawa. Their small size
makes them ideal for the geographic analysis of intra-urban patterns of criminal activity and
socio-economic status.
Each criminal offence in 2001 was referenced to a geographic coordinate (longitude and latitude)
by the OPS, recorded according to offence type (i.e. assault, break and enter, etc) and stored as a
separate data point. For this project, the OPS supplied the point data aggregated to match the
boundaries of Ottawa DAs, allowing the criminal offence data to be compared directly with
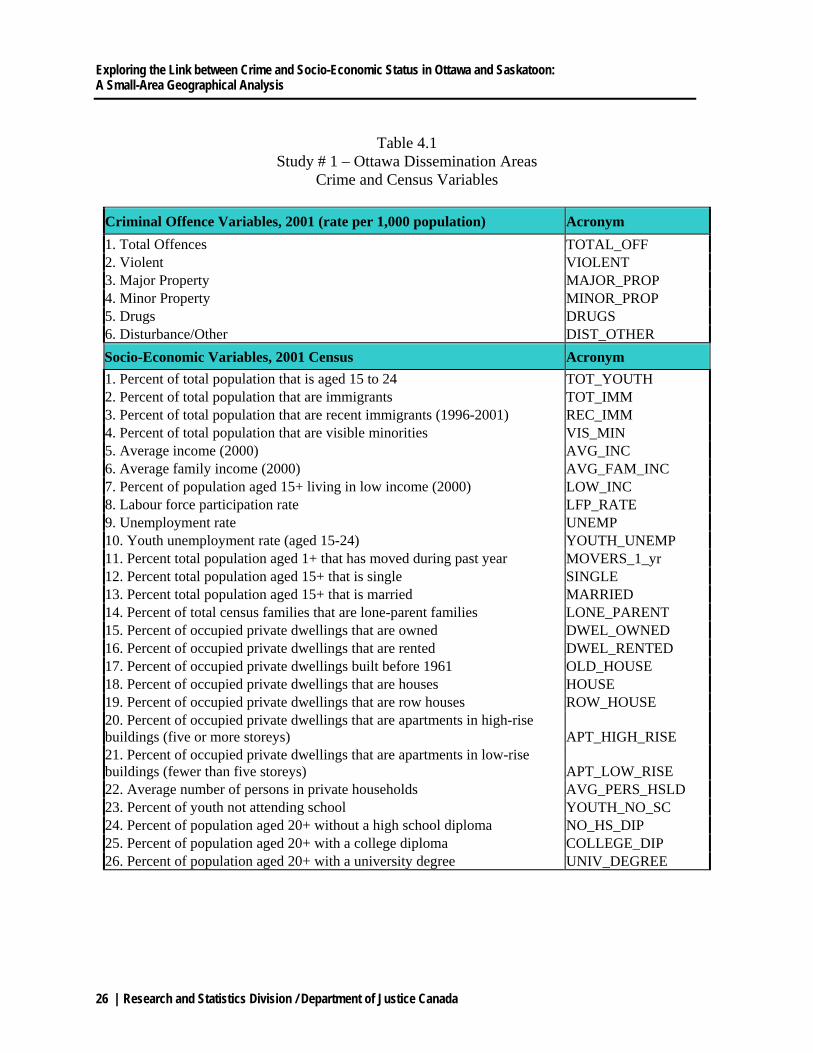
census information. As shown in Table 4.1, the crime data were grouped into 6 principal offence
types: “Total Offences”, “Violent”, “Major Property”, “Minor Property”, “Drugs” and
“Disturbance/Other”. The breakdown of types of offences in each group is listed in Table 4.2.
The table shows that a total of 44,559 offences were included for analysis in the study. (Several
offences, including traffic violations and certain federal statutes, were omitted). Minor property
crimes accounted for more than half (54%) of all offences reported to police in Ottawa in 2001
with ‘theft under $5000’ being the most common incident within this category. Major property
crimes represented 20% percent of the total with ‘auto theft’ the most prevalent. There were
almost 7,000 violent offences in the city (16% of the total) with ‘assault’ comprising nearly two-
thirds (63%) of the incidents in this group. The remaining offences were related to drugs (2% of
the total) and ‘disturbance/other’ (8%). It is important to emphasize again that the crime data
refers only to the location where the incident occurred but not the address of the offender,
T
Research and Statistics Division / Department of Justice Canada | 23
meaning that a high crime level in a neighbourhood, for instance, is not necessarily a reflection
of the actions of the people residing there.
Table 4.1 displays the 26 socio-economic census variables used in the study. The objective was
to establish a concise set of indicators, which reflect the socio-economic status and levels of
disadvantage in Ottawa’s communities. From the list, it is clear that unemployment, labour force
participation, low income and low educational attainment are direct measures of disadvantage
and have been used frequently in studies of urban social differentiation in North America and
Europe. The recent immigrant, visible minority and lone-parent variables are not direct measures
but are included because of the numerous problems that are associated with these groups in
Canada including lower incomes, higher unemployment rates and subsequent dependency on
social transfers. The three youth-related variables were included to highlight the potential
problems related to crime and disadvantage in those communities with higher levels of young
people who are unemployed and/or not attending school. Within the context of criminological
theory, particularly social disorganization (Shaw and McKay) and the theory of deviant
neighbourhoods (Stark), a number of mobility and housing related census variables were
employed in the study including family status (single and married), residents who have moved
during the past year, dwellings that are owned and rented, the age of housing, the type of
dwelling (houses, row houses, apartments) and household density.
As shown in Table 4.1, the crime variables were calculated to reflect their rate per 1,000
population in each DA. A database was constructed consisting of 32 variables (6 criminal
offences and 26 census indicators) for each of the 1187 DAs in Ottawa. (DAs with missing or
suppressed census data were excluded from the study).
Study # 2 - Saskatoon Neighbourhoods
The Planning Branch of the City of Saskatoon has defined neighbourhood boundaries, which are
displayed in Figure 7.1. The map highlights the nine communities designated as ‘core
neighbourhoods’, seven of which are located on the west side of the South Saskatchewan River
and include the Central Business District (CBD). Periodically, the Planning Branch publishes a
report titled “Neighbourhood Profiles” in which detailed census, planning, real estate, school
Exploring the Link between Crime and Socio-Economic Status in Ottawa and Saskatoon: A Small-Area Geographical Analysis
24 | Research and Statistics Division / Department of Justice Canada
board and vehicle data is compiled for each of the city’s neighbourhoods. The most recent
edition (2003) was obtained for this study, which included data from the 2001 Census. In
addition, 2003 criminal offence data was acquired from the Planning Unit of the Saskatoon
Police Service (SPS). The SPS collects crime data by quadrant and fits this data to meet
approximately the boundaries of each neighbourhood in the city. As a result, there may be some
overlap of incidents into adjacent neighbourhoods. For this study, the crime, census and
development/ planning data were compiled for 55 residential neighbourhoods. Due to low
population numbers or missing values, industrial neighbourhoods were not included in
the research.
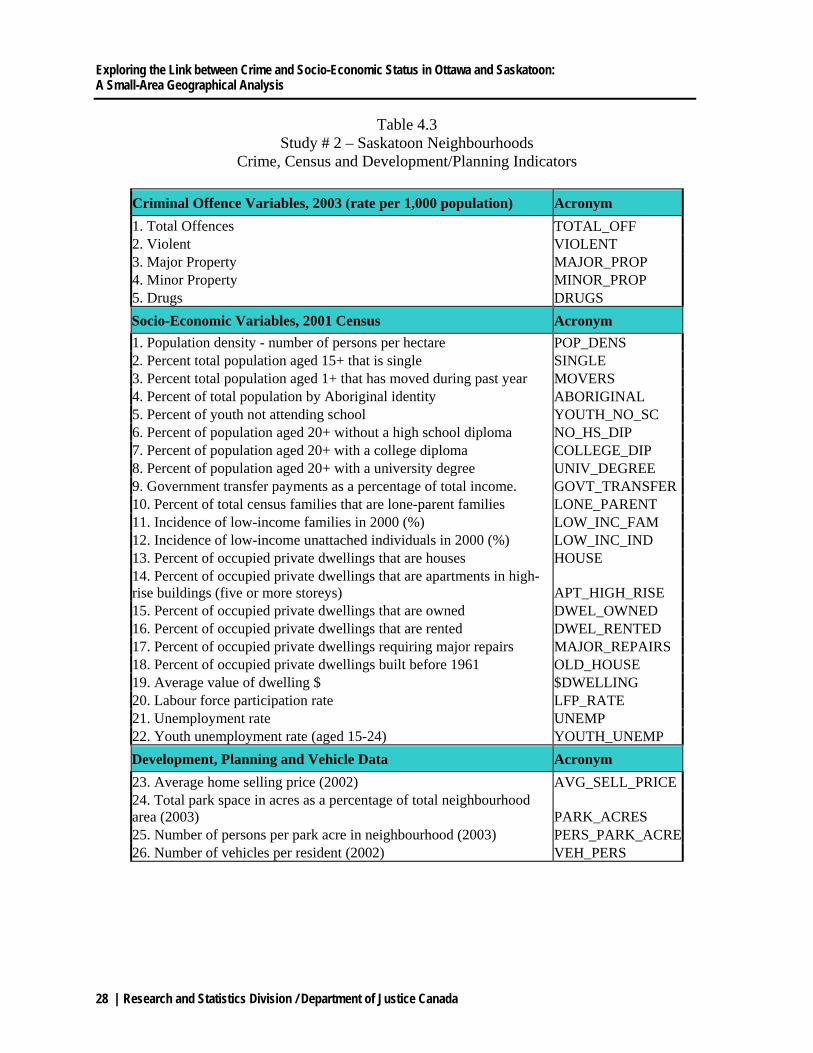
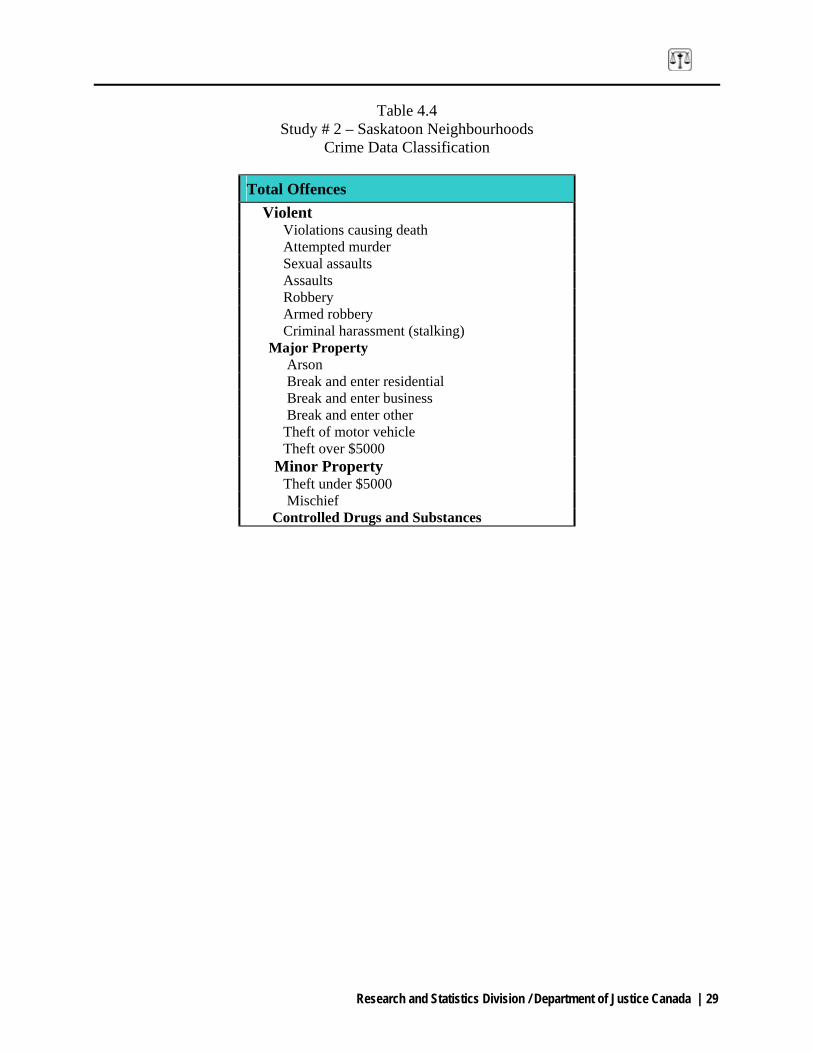
Table 4.3 lists the 31 variables used in the study assembled into three categories. The crime
variables were grouped into 5 main offence types: Total Offences, Violent, Major Property,
Minor Property and Drugs. The sub-offences in each of these categories are listed in Table 4.4.
Table 4.3 also shows the 22 socio-economic census variables used in the study. Many have been
employed in previous studies of crime and socio-economic status including population density,
educational attainment, low-income, unemployment, lone-parent families, recent immigrants and
housing characteristics. Saskatoon has a large and relatively disadvantaged Aboriginal
population and since this group has been identified as ‘at risk’ with respect to crime (La Prairie
2000, Sacco and Kennedy, 2002; Mata, 2003) the decision was made to include this variable in
the study. Finally, the third category is “Development, Planning and Vehicle Data” and includes
variables denoting average home selling price, park space and vehicle use.
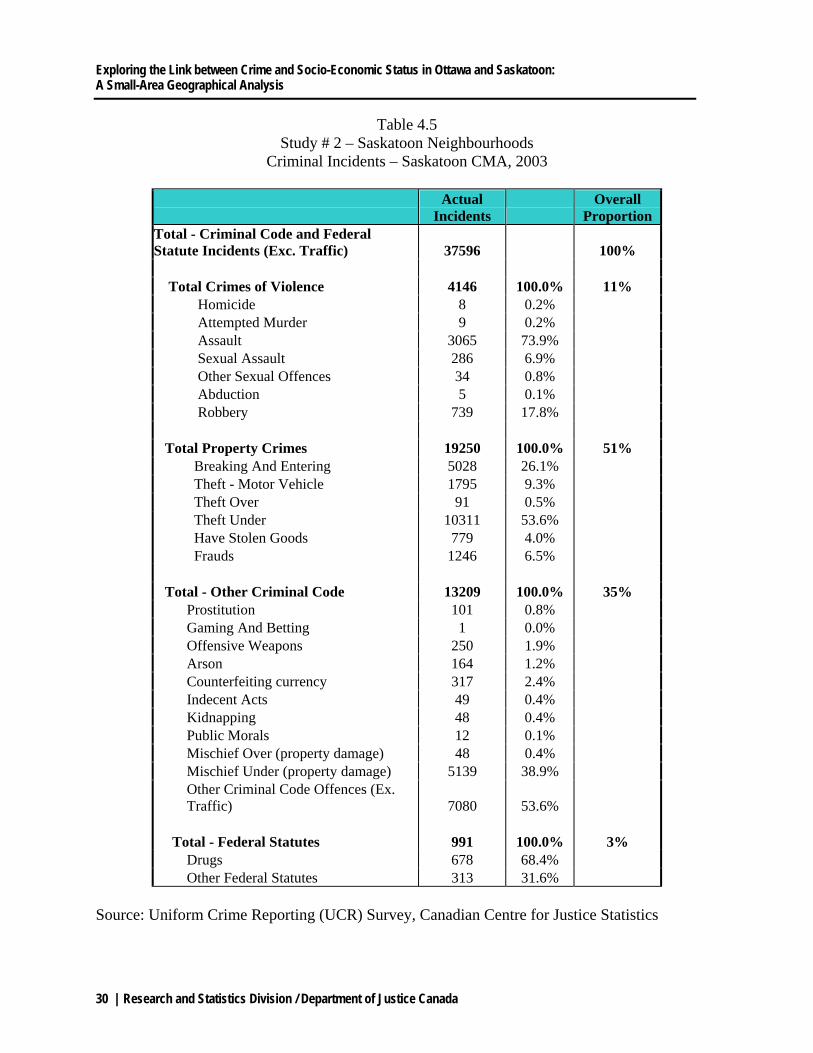
Table 4.5 shows a breakdown of types of criminal incidents in the Saskatoon CMA in 2003 as
collected and presented by the Canadian Centre for Justice Statistics in their Uniform Crime
Reporting (UCR) Survey. It shows that there were a total of 37,596 incidents in the urban area.
Property crimes accounted for more than half (51%) of all incidents reported to police in
Saskatoon in 2003 with ‘theft under $5000’ being the most common within this category. ‘Break
and Enters’ are clearly a problem in the city with 5,028 incidents reported, comprising about
26% of all property crimes. There were over 4,100 violent offences in Saskatoon (11% of the

Research and Statistics Division / Department of Justice Canada | 25
total) with ‘assault’ comprising nearly three-quarters (74%) of the incidents in this group. The
remaining incidents were related to ‘Other Criminal Code Incidents’ (35% of the total) with
‘Mischief – property damage’ being the most prevalent within this category. Finally, ‘Federal
Statutes’, comprised mostly of drug offences, accounted for just 3% of all incidents.
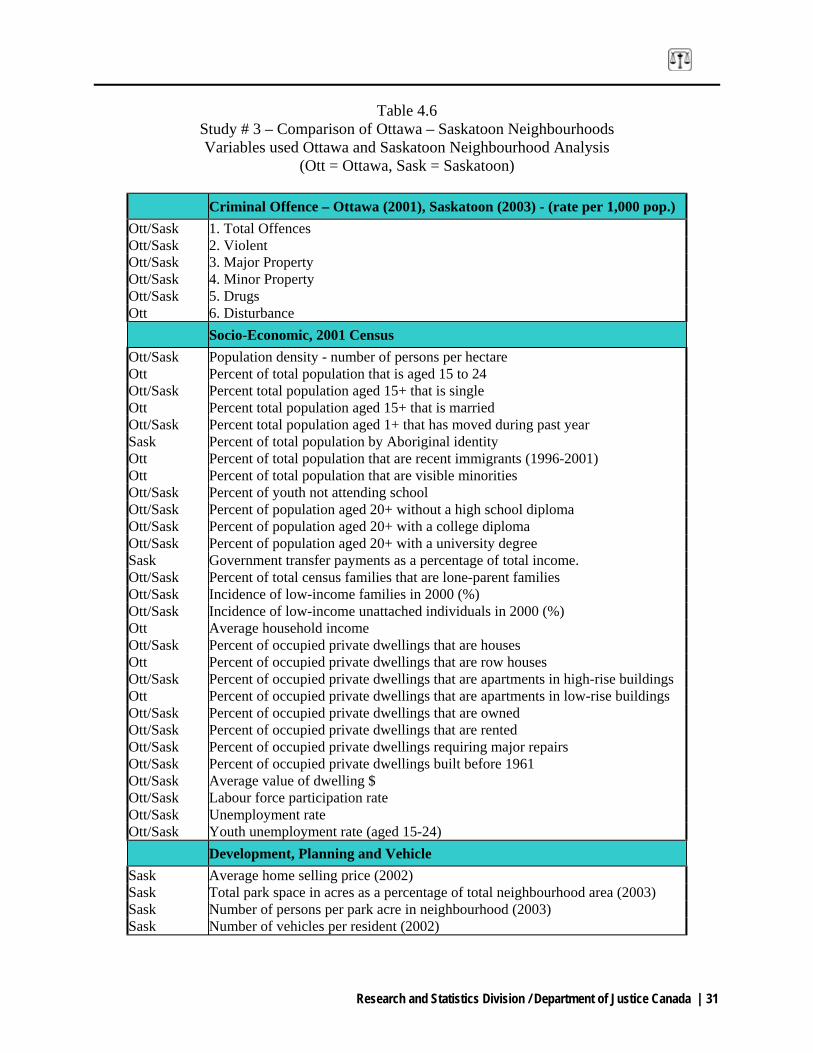
Study # 3 – A Comparison of Neighbourhoods in Ottawa and Saskatoon
As stated, one of the objectives of Study # 3 is to re-aggregate the dissemination area data used
in the first Ottawa study to match the boundaries of the city’s 50 neighbourhoods and compare
these to Saskatoon’s neighbourhoods. Table 4.6 lists the variables used in the analysis for the
two cities at the neighbourhood level. As seen, the majority of the crime variables and many of
the census variables were employed for both cities. A number of other variables were used for
analysis in just one of the cities to reflect their unique characteristics. For example, two variables
relating to immigration were included in the Ottawa analysis because immigration plays a greater
role in the social geography of the city than it does in Saskatoon. Similarly, a variable measuring
Aboriginal identity was included in the Saskatoon analysis as the city has a much larger number
of these residents.
Exploring the Link between Crime and Socio-Economic Status in Ottawa and Saskatoon: A Small-Area Geographical Analysis
26 | Research and Statistics Division / Department of Justice Canada
Table 4.1
Study # 1 – Ottawa Dissemination Areas Crime and Census Variables
Criminal Offence Variables, 2001 (rate per 1,000 population) Acronym 1. Total Offences TOTAL_OFF 2. Violent VIOLENT 3. Major Property MAJOR_PROP 4. Minor Property MINOR_PROP 5. Drugs DRUGS 6. Disturbance/Other DIST_OTHER Socio-Economic Variables, 2001 Census Acronym 1. Percent of total population that is aged 15 to 24 TOT_YOUTH 2. Percent of total population that are immigrants TOT_IMM 3. Percent of total population that are recent immigrants (1996-2001) REC_IMM 4. Percent of total population that are visible minorities VIS_MIN 5. Average income (2000) AVG_INC 6. Average family income (2000) AVG_FAM_INC 7. Percent of population aged 15+ living in low income (2000) LOW_INC 8. Labour force participation rate LFP_RATE 9. Unemployment rate UNEMP 10. Youth unemployment rate (aged 15-24) YOUTH_UNEMP 11. Percent total population aged 1+ that has moved during past year MOVERS_1_yr 12. Percent total population aged 15+ that is single SINGLE 13. Percent total population aged 15+ that is married MARRIED 14. Percent of total census families that are lone-parent families LONE_PARENT 15. Percent of occupied private dwellings that are owned DWEL_OWNED 16. Percent of occupied private dwellings that are rented DWEL_RENTED 17. Percent of occupied private dwellings built before 1961 OLD_HOUSE 18. Percent of occupied private dwellings that are houses HOUSE 19. Percent of occupied private dwellings that are row houses ROW_HOUSE 20. Percent of occupied private dwellings that are apartments in high-rise buildings (five or more storeys) APT_HIGH_RISE 21. Percent of occupied private dwellings that are apartments in low-rise buildings (fewer than five storeys) APT_LOW_RISE 22. Average number of persons in private households AVG_PERS_HSLD 23. Percent of youth not attending school YOUTH_NO_SC 24. Percent of population aged 20+ without a high school diploma NO_HS_DIP 25. Percent of population aged 20+ with a college diploma COLLEGE_DIP 26. Percent of population aged 20+ with a university degree UNIV_DEGREE

Research and Statistics Division / Department of Justice Canada | 27
Table 4.2 Study # 1 – Ottawa Dissemination Areas
Total Offences by Major Crime Groups, 2001*
Total Offences Overall Proportion
Criminal Offences 44559 100%
Violent – Total 6946 100% 16% Abduction 95 1% Assault 4358 63% Assault – Sexual 243 3% Homicide 19 0% Robbery 810 12% Harass - Stalking 228 3% Threats 1193 17%
Major Property – Total 9008 100% 20% Arson 162 2% B&E Commercial 1430 16% B&E Residential 3116 35% Theft over $5000 723 8% Auto Theft 3577 40%
Minor Property – Total 23856 100% 54% Fraud 2202 9% Counterfeit 343 1% Theft from vehicle 3535 15% Theft Under $5000 11093 46% Mischief 6393 27% Possession 290 1%
Drugs – Total 1099 100% 2% Drugs Possession 956 87% Drugs Trafficking 99 9% Drugs - Other 44 4%
Disturbance/Other Total 3650 100% 8% Disturbance 109 3% Harass – Other 1162 32% Indecent Act 172 5% Threats - Other 1404 38% Weapons 141 4% Prostitution 127 3% Escape Custody 83 2% Firearms 129 4% Unlawfully at Large 132 4% Obstruct Justice 84 2% Resist Arrest 107 3%
* Traffic offences and certain federal statute offences were excluded from the study.
Exploring the Link between Crime and Socio-Economic Status in Ottawa and Saskatoon: A Small-Area Geographical Analysis
28 | Research and Statistics Division / Department of Justice Canada
Table 4.3 Study # 2 – Saskatoon Neighbourhoods
Crime, Census and Development/Planning Indicators
Criminal Offence Variables, 2003 (rate per 1,000 population) Acronym 1. Total Offences TOTAL_OFF 2. Violent VIOLENT 3. Major Property MAJOR_PROP 4. Minor Property MINOR_PROP 5. Drugs DRUGS Socio-Economic Variables, 2001 Census Acronym 1. Population density - number of persons per hectare POP_DENS 2. Percent total population aged 15+ that is single SINGLE 3. Percent total population aged 1+ that has moved during past year MOVERS 4. Percent of total population by Aboriginal identity ABORIGINAL 5. Percent of youth not attending school YOUTH_NO_SC 6. Percent of population aged 20+ without a high school diploma NO_HS_DIP 7. Percent of population aged 20+ with a college diploma COLLEGE_DIP 8. Percent of population aged 20+ with a university degree UNIV_DEGREE 9. Government transfer payments as a percentage of total income. GOVT_TRANSFER10. Percent of total census families that are lone-parent families LONE_PARENT 11. Incidence of low-income families in 2000 (%) LOW_INC_FAM 12. Incidence of low-income unattached individuals in 2000 (%) LOW_INC_IND 13. Percent of occupied private dwellings that are houses HOUSE 14. Percent of occupied private dwellings that are apartments in high-rise buildings (five or more storeys) APT_HIGH_RISE 15. Percent of occupied private dwellings that are owned DWEL_OWNED 16. Percent of occupied private dwellings that are rented DWEL_RENTED 17. Percent of occupied private dwellings requiring major repairs MAJOR_REPAIRS 18. Percent of occupied private dwellings built before 1961 OLD_HOUSE 19. Average value of dwelling $ $DWELLING 20. Labour force participation rate LFP_RATE 21. Unemployment rate UNEMP 22. Youth unemployment rate (aged 15-24) YOUTH_UNEMP Development, Planning and Vehicle Data Acronym 23. Average home selling price (2002) AVG_SELL_PRICE24. Total park space in acres as a percentage of total neighbourhood area (2003) PARK_ACRES 25. Number of persons per park acre in neighbourhood (2003) PERS_PARK_ACRE26. Number of vehicles per resident (2002) VEH_PERS
Research and Statistics Division / Department of Justice Canada | 29
Table 4.4 Study # 2 – Saskatoon Neighbourhoods
Crime Data Classification
Total Offences Violent Violations causing death Attempted murder Sexual assaults Assaults Robbery Armed robbery Criminal harassment (stalking) Major Property Arson Break and enter residential Break and enter business Break and enter other Theft of motor vehicle Theft over $5000 Minor Property Theft under $5000 Mischief Controlled Drugs and Substances
Exploring the Link between Crime and Socio-Economic Status in Ottawa and Saskatoon: A Small-Area Geographical Analysis
30 | Research and Statistics Division / Department of Justice Canada
Table 4.5 Study # 2 – Saskatoon Neighbourhoods
Criminal Incidents – Saskatoon CMA, 2003
Actual
Incidents Overall
Proportion Total - Criminal Code and Federal Statute Incidents (Exc. Traffic) 37596 100% Total Crimes of Violence 4146 100.0% 11% Homicide 8 0.2% Attempted Murder 9 0.2% Assault 3065 73.9% Sexual Assault 286 6.9% Other Sexual Offences 34 0.8% Abduction 5 0.1% Robbery 739 17.8% Total Property Crimes 19250 100.0% 51% Breaking And Entering 5028 26.1% Theft - Motor Vehicle 1795 9.3% Theft Over 91 0.5% Theft Under 10311 53.6% Have Stolen Goods 779 4.0% Frauds 1246 6.5% Total - Other Criminal Code 13209 100.0% 35% Prostitution 101 0.8% Gaming And Betting 1 0.0% Offensive Weapons 250 1.9% Arson 164 1.2% Counterfeiting currency 317 2.4% Indecent Acts 49 0.4% Kidnapping 48 0.4% Public Morals 12 0.1% Mischief Over (property damage) 48 0.4% Mischief Under (property damage) 5139 38.9% Other Criminal Code Offences (Ex. Traffic) 7080 53.6% Total - Federal Statutes 991 100.0% 3% Drugs 678 68.4% Other Federal Statutes 313 31.6%
Source: Uniform Crime Reporting (UCR) Survey, Canadian Centre for Justice Statistics
Research and Statistics Division / Department of Justice Canada | 31
Table 4.6 Study # 3 – Comparison of Ottawa – Saskatoon Neighbourhoods Variables used Ottawa and Saskatoon Neighbourhood Analysis
(Ott = Ottawa, Sask = Saskatoon)
Criminal Offence – Ottawa (2001), Saskatoon (2003) - (rate per 1,000 pop.) Ott/Sask 1. Total Offences Ott/Sask 2. Violent Ott/Sask 3. Major Property Ott/Sask 4. Minor Property Ott/Sask 5. Drugs Ott 6. Disturbance Socio-Economic, 2001 Census Ott/Sask Population density - number of persons per hectare Ott Percent of total population that is aged 15 to 24 Ott/Sask Percent total population aged 15+ that is single Ott Percent total population aged 15+ that is married Ott/Sask Percent total population aged 1+ that has moved during past year Sask Percent of total population by Aboriginal identity Ott Percent of total population that are recent immigrants (1996-2001) Ott Percent of total population that are visible minorities Ott/Sask Percent of youth not attending school Ott/Sask Percent of population aged 20+ without a high school diploma Ott/Sask Percent of population aged 20+ with a college diploma Ott/Sask Percent of population aged 20+ with a university degree Sask Government transfer payments as a percentage of total income. Ott/Sask Percent of total census families that are lone-parent families Ott/Sask Incidence of low-income families in 2000 (%) Ott/Sask Incidence of low-income unattached individuals in 2000 (%) Ott Average household income Ott/Sask Percent of occupied private dwellings that are houses Ott Percent of occupied private dwellings that are row houses Ott/Sask Percent of occupied private dwellings that are apartments in high-rise buildings Ott Percent of occupied private dwellings that are apartments in low-rise buildings Ott/Sask Percent of occupied private dwellings that are owned Ott/Sask Percent of occupied private dwellings that are rented Ott/Sask Percent of occupied private dwellings requiring major repairs Ott/Sask Percent of occupied private dwellings built before 1961 Ott/Sask Average value of dwelling $ Ott/Sask Labour force participation rate Ott/Sask Unemployment rate Ott/Sask Youth unemployment rate (aged 15-24) Development, Planning and Vehicle Sask Average home selling price (2002) Sask Total park space in acres as a percentage of total neighbourhood area (2003) Sask Number of persons per park acre in neighbourhood (2003) Sask Number of vehicles per resident (2002)
Exploring the Link between Crime and Socio-Economic Status in Ottawa and Saskatoon: A Small-Area Geographical Analysis
32 | Research and Statistics Division / Department of Justice Canada
5. Methods of Analysis
Section 5.1- Plan of Analysis
his publication is based on three separate studies and, as a result, the methods used in the
analysis are slightly different. They represent a progressive calibration of techniques of
statistical and geographic analysis. Study #1 of Ottawa is based on data for the smallest areal
units available—dissemination areas (DAs). Study # 2 of Saskatoon is based on data for
neighbourhoods. While the methods used in the Ottawa study were again employed, the
geographic analysis was expanded to include spatial autocorrelation. In Study # 3, Ottawa’s DAs
are re-aggregated to match the boundaries of the city’s neighbourhoods, and the findings of this
analysis are compared directly to those of Saskatoon at the neighbourhood level.
Section 5.2 - Statistical and Geographic Methods of Analysis
Descriptive Statistics
In all three studies, the crime variables were calculated as a rate per 1,000 population related to
the geographic unit of analysis (DAs or neighbourhoods). All of the census and socio-economic
variables in the three studies were calculated at the ratio scale with the exception of variables
relating to average income and value of dwelling, which were left at the interval scale.
Descriptive statistics were calculated for each dataset to determine the minimum, maximum,
mean, standard deviation and coefficient of variation of each variable.
Transformation of Variables
For the purposes of statistical analysis and to meet the basic assumptions and constraints of the
general linear model, each of the crime and socio-economic variables employed in the three
studies were transformed into a Z-score for each geographic unit of analysis (the DA or
neighbourhood).
T
Research and Statistics Division / Department of Justice Canada | 33
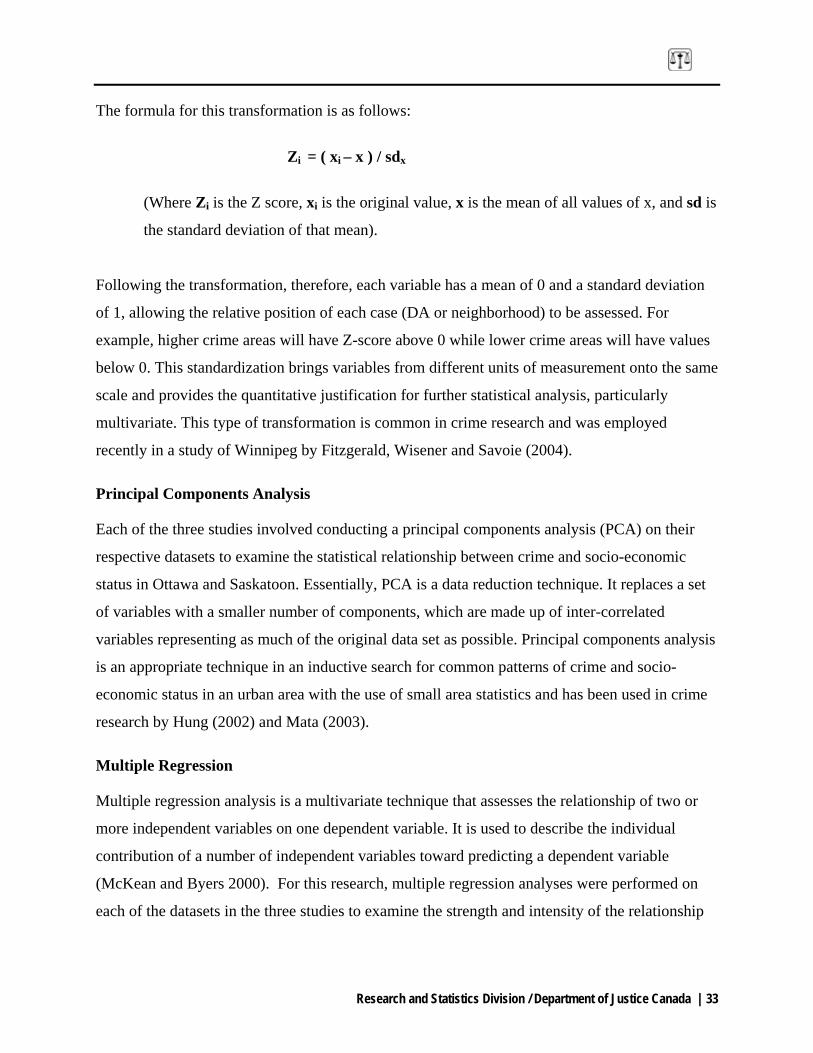
The formula for this transformation is as follows:
Zi = ( xi – x ) / sdx
(Where Zi is the Z score, xi is the original value, x is the mean of all values of x, and sd is
the standard deviation of that mean).
Following the transformation, therefore, each variable has a mean of 0 and a standard deviation
of 1, allowing the relative position of each case (DA or neighborhood) to be assessed. For
example, higher crime areas will have Z-score above 0 while lower crime areas will have values
below 0. This standardization brings variables from different units of measurement onto the same
scale and provides the quantitative justification for further statistical analysis, particularly
multivariate. This type of transformation is common in crime research and was employed
recently in a study of Winnipeg by Fitzgerald, Wisener and Savoie (2004).
Principal Components Analysis
Each of the three studies involved conducting a principal components analysis (PCA) on their
respective datasets to examine the statistical relationship between crime and socio-economic
status in Ottawa and Saskatoon. Essentially, PCA is a data reduction technique. It replaces a set
of variables with a smaller number of components, which are made up of inter-correlated
variables representing as much of the original data set as possible. Principal components analysis
is an appropriate technique in an inductive search for common patterns of crime and socio-
economic status in an urban area with the use of small area statistics and has been used in crime
research by Hung (2002) and Mata (2003).
Multiple Regression
Multiple regression analysis is a multivariate technique that assesses the relationship of two or
more independent variables on one dependent variable. It is used to describe the individual
contribution of a number of independent variables toward predicting a dependent variable
(McKean and Byers 2000). For this research, multiple regression analyses were performed on
each of the datasets in the three studies to examine the strength and intensity of the relationship
Exploring the Link between Crime and Socio-Economic Status in Ottawa and Saskatoon: A Small-Area Geographical Analysis
34 | Research and Statistics Division / Department of Justice Canada
between crime (the dependent variable) and socio-economic conditions (the independent
variables) and to identify significant “predictors” of crime in Ottawa and Saskatoon.
Standard multiple regression and step-wise multiple regression models were tested for each of
the crime variables used in the studies (including total crime, violent, major property, minor
property and drug offences).
Cartographic and GIS Analysis
For each of the three studies, a series of maps were produced to illustrate the geographic
distribution of crime in Ottawa and Saskatoon and to examine the spatial relationship between
crime and certain socio-economic conditions in both cities. ArcGIS (ESRI, www.esri.com) was
the software used in this research. In Study # 1, the Ottawa Police Service (OPS) provided 2001
crime data for the city’s 1187 dissemination areas. This data, along with 2001 census data, was
then joined to Statistics Canada’s digital cartographic file for Ottawa. In Study # 2, a digital
cartographic file showing Saskatoon’s 55 residential neighbourhood was obtained from the
Planning Unit of the City of Saskatoon. This geographic data was then matched with 2003 crime,
2001 census and additional planning/development data for the city. In Study # 3, a digital
cartographic file displaying Ottawa’s 50 residential neighbourhoods was acquired from the
Planning Department of the City of Ottawa. As stated above, the crime and census data from
Study # 1 was re-aggregated to match these neighbourhood boundaries.
Choropleth maps were produced in each of the three studies. This type of map is used when the
quantity in the geographical division is represented by the colour or shade of the area symbol
placed in the enumeration unit – in this case, the DA or neighbourhood. As Dent (2000, p. 5)
explains, several assumptions are made when choropleth maps are used. First, it is assumed that
that the quantity being mapped is uniform in the enumeration area. Second, it is assumed that
densities, rates or ratios are more important than absolute values. Because enumeration areas
vary in size, symbolizing absolute values with shaded area symbols can lead to misinterpretation.
Since all of the crime and socio-economic data employed in the three studies is aggregated to
match geographic boundaries, it was determined that choropleth mapping was the most
appropriate. The mapping classification is based on intervals of crime intensity. In Study # 1,
high crime areas in Ottawa’s DAs were mapped according to three categories – elevated, high

Research and Statistics Division / Department of Justice Canada | 35
and highest – in relation to their Z-values. In Studies # 2 and # 3, crime rates per 1,000
population in Ottawa and Saskatoon’s neighbourhoods are mapped according to five categories
ranging from lowest to highest rates of crime per 1,000 population.
Spatial Autocorrelation
Spatial autocorrelation was employed for the Saskatoon study only (Study # 3). It is apparent that
while statistical techniques such as multiple regression and principal component analysis are
effective in crime research they are non-spatial by design. And, while mapping is appropriate in
illustrating geographic patterns of crime and socio-economic status, visualization in itself, is not
an explicitly spatial approach. As a result, the technique of spatial autocorrelation was used in
the Saskatoon study to directly determine the presence of spatial pattern in the mapped variables
due to geographic proximity. As Johnston et al (2000, p.775) explain:
The most common form of spatial auto-correlation is where similar values for
a variable tend to cluster together in adjacent observation units, so that on
average across the map the values for neighbours are more similar than would
occur if the allocation of values to observation-units were the result of a
purely random mechanism.
In other words, spatial autocorrelation is used to determine clusters of strong association in the
variables and is employed in this study to gauge the level of geographic concentration of crime in
Saskatoon and the spatial relationship between crime and neighbourhood characteristics.
The software CrimeStat developed by Levine & Associates (2002) was used to calculate
Moran’s “I”, one of the most commonly used spatial autocorrelation indicators. Moran’s I
(Moran, 1950) is also one of the oldest spatial statistics and is applied to zones or points, which
have continuous variables associated with them (intensities). It is calculated as follows:
Exploring the Link between Crime and Socio-Economic Status in Ottawa and Saskatoon: A Small-Area Geographical Analysis
36 | Research and Statistics Division / Department of Justice Canada
where N is the number of cases, Xi is the variable value at a specified location, i, Xj is the
variable value at another location, j, 0 is the mean of the variable and Wij is a distance weight
applied to the comparison between location i and location j. The statistic is interpreted much like
a correlation coefficient with values near +1 indicating a strong spatial pattern (high values
located close to one another and low values located close to one another) and values near –1
indicating strong negative spatial autocorrelation. The significance of Moran’s I is calculated
as follows:
where I is the empirical value calculated from a sample, E (I) is the theoretical mean of a random
distribution and SE(I) is the theoretical standard deviation of E(I).
CrimeStat uses point locations to calculate spatial autocorrelation statistics. The data entry for
the program requires X and Y values in the form of a projected coordinate system. Therefore,
ArcGIS was used to compute the X and Y coordinates (not longitude and latitude) for the
centroid of each of the 55 residential neighbourhoods in Saskatoon. To calculate Moran’s I,
CrimeStat also requires that intensity values be associated with each point. In this case, the
intensity values were the Z-scores (not to be confused with the Z value of significance) for the
five crime and 3 selected socio-economic variables in the 55 neighbourhoods.
6. Study # 1 Findings: Dissemination Areas of Ottawa
Section 6.1 – Descriptive Statistics
able 6.1 shows the descriptive statistics for the 6 crime and 26 census variables used in the
analysis. The table indicates that all 6 crime variables have high coefficients of variation
(the standard deviation divided by the mean) indicating significant dispersion of individual
values around the mean. In particular, minor property and drug offences have values that
T
Research and Statistics Division / Department of Justice Canada | 37
fluctuate greatly among the 1187 DAs examined in Ottawa, pointing to substantial geographic
disparity within Ottawa. Similarly, several of the census variables also have high coefficients of
variation including those denoting recent immigrants, people living in low income, youth
unemployment and apartment high-rises suggesting a significant geographic disparity of
disadvantaged residents in the city.
Section 6.2 – Principal Components Analysis
As Table 6.2 shows, the analysis produced an 8-component solution, accounting for 78.5% of the
total variance in the dataset. An examination of the component loadings in Table 6.3 reveals that
the 5 crime variables (violent, major and minor property, drugs and disturbance/other) are highly
inter-correlated with one-another (Component 2) but are not significantly associated with any of
the 26 socio-economic variables. The other components identify a number of dimensions of
socio-economic status in Ottawa, including “mobility and housing” (Component 1), “income and
education” (Component 3), “immigrants and visible minorities” (Component 4) and “youth and
unemployment” (Component 7). As can be seen in Table 6.3, none of these dimensions (by way
of component loadings) is significantly related to any of the 5 crime variables, suggesting that,
overall, there is a weak association between crime and socio-economic status in Ottawa at the
intra-urban scale – at least with the use of data at the DA level. These findings essentially
confirm the output from the correlation matrix (31 variables x 31 variables) which displayed
relatively low correlation coefficients between the crime and socio-economic variables, in the
range of r = -0.35 to r = 0.35.
Section 6.3 – Multiple Regression
Table 6.4 shows the results of the regression analysis between each of the 6 crime variables and
6 selected census variables characterizing disadvantage. An effort was made to select
independent variables that were not highly correlated with one another but, nevertheless,
demonstrate a range of factors associated with disadvantaged communities (youth, recent
immigrants, low-income, mobility, apartment high-rises and low education). The table
demonstrates that in Ottawa there appears to be a rather weak statistical association between
crime and factors related to socio-economic disadvantage with low multiple correlation
Exploring the Link between Crime and Socio-Economic Status in Ottawa and Saskatoon: A Small-Area Geographical Analysis
38 | Research and Statistics Division / Department of Justice Canada
coefficients{R} and coefficients of multiple determination {R2}. In fact, each crime variable has
an R2 below 0.11, clearly demonstrating that the 6 socio-economic variables, when taken
together, are not strong predictors of increased levels of crime. In other words, no more than
11% of the variation in any of the crime indicators can be explained by the socio-economic
variables at the level of the DA.
Despite the overall weak relationship, however, several of the independent variables, when
examined individually, had significant beta coefficients (transformed partial regression
coefficients) at the 95% confidence level (p<0.05). The recent immigrant variable recorded
significant negative betas on 5 of the 6 crime variables pointing to an inverse relationship
between the two indicators - the higher the level of crime in an area the fewer recent immigrants
living there. Table 6.4 also indicates that people living in low-income (LOW_INC) and
residential mobility (MOVERS_1_yr) were the best predictors of crime. In fact, mobility was
the only socio-economic indicator to record significant betas on all of the crime variables.
Interestingly, the presence of young people (TOT_YOUTH) was not a significant
predictor of crime.
The 1187 DAs in Ottawa were ranked from highest to lowest according to their Z-scores on the
variable “Total Offences” with the top quintile (20%) of DAs being identified as “High Crime
Areas” (n=237). A second multiple regression was performed on the data for these areas. Table
6.5 shows the results and demonstrates that in Ottawa’s High Crime Areas (HCAs) there appears
to be a weak statistical association between crime and factors related to socio-economic
disadvantage with low values of R and R2 for each of the six crime variables. Furthermore, only
one independent variable, mobility (MOVERS_1_yr), had significant betas on the crime
indicators related to violence and drugs. A third multiple regression analysis was performed on
the data set. This time, the 1187 DAs were ranked from highest to lowest according to their Z-
scores on the variable “Low-Income” with the top quintile (20%) of DAs being identified as
“Disadvantaged Areas” (n= 237). Table 6.6 shows the results of the analysis and again reveals a
weak overall association in these areas between crime and factors related to disadvantage.
Research and Statistics Division / Department of Justice Canada | 39
Section 6.4 – Cartographic and GIS Analysis: Examining Spatial Patterns of Crime and Disadvantage
High Crime Areas (HCAs)
Figure 6.1 is a map illustrating the location of ‘High-Crime Areas’ (HCAs) with respect to total
offences in 2001. The map inset clearly illustrates that these areas are concentrated within the
built-up central core and suburbs of Ottawa, with very few HCAs visible in the outer and rural
parts of the city. (Two HCAs are present in the southwest corner of Cumberland and another in
the southeast portion of Goulbourn). However, the enlarged section of the map shows a dispersed
pattern of HCAs at the three levels (elevated, high and highest) within the urban core, including
sections of the inner city and a prominent visibility of large DAs (in terms of area) in suburban
locations. Compared to central Ottawa, these suburban locations have lower residential densities
and larger spaces devoted to commercial activity and industrial parks.
There are several clusters of DAs at the “highest” crime level (above 1 SD) in downtown Ottawa
(the Central Business District and ‘Market’ area), the east-central part of the city (Vanier,
Overbrook and Ottawa North-East) and several communities west of downtown including
Carlington. An examination of the raw data reveals that the higher crime rates in these areas are
attributable to large numbers of incidents relating to minor property offences (particularly ‘theft
under $5000’ and ‘theft from vehicle’) and to a lesser extent to major property offences (most
notably ‘residential break and enter’ and ‘auto-theft’). In addition, the downtown HCAs
(including the Market) have a much higher than average number of violent offences, particularly
‘threats’ and ‘assault’. The map also highlights what appears to be ‘corridors’ of HCAs adjacent
to major transportation routes such as Highways 417 and 17 (east-west) and Highway 16 (north-
south) indicating a spatial relationship between crime and mobility/accessibility. These
‘corridors’ contain some of the city’s highest residential densities and significant commercial
activity, including several of the city’s largest shopping centres such as Place d’Orleans, St.
Laurent, Pinecrest and Bayshore.
Figures 6.2 to 6.5 consist of a series of maps displaying the geographic distribution of HCAs
according to four offence types: “Violent”, “Major Property”, “Minor Property”, and “Drugs”.
Exploring the Link between Crime and Socio-Economic Status in Ottawa and Saskatoon: A Small-Area Geographical Analysis
40 | Research and Statistics Division / Department of Justice Canada
“Violent” HCAs (Figure 6.2) are somewhat more concentrated within the central core of Ottawa
(with the exception of several DAs in the rural portion of Cumberland) and are particularly
noticeable in the inner city (Center Town and the Market) as well as in Vanier/Overbrook and
parts of Ottawa North-East. While the large majority of “Major Property” HCAs are located
within the central core of the city, Figure 6.3 reveals a more dispersed pattern with several HCAs
also visible in suburban and rural communities, where rates of residential and commercial break
and enters tend to be higher. Figure 6.4 shows that “Minor Property” HCAs have a more
compact distribution, particularly in the inner city and along transportation corridors where
higher densities and the concentration of commercial activity likely present greater opportunities
for offences such as theft. Figure 6.5 illustrates that HCAs associated with drug offences are the
most dispersed geographically in Ottawa with a number of these areas visible in the rural parts of
the city. Drug crimes, however, accounted for only 2% of all offences in Ottawa in 2001
(Table 4.2).
Disadvantaged Areas
Figure 6.6 consists of a map showing the geographic distribution of disadvantaged DAs in
Ottawa according to their Z-scores on the variable ‘Low-Income’. In light of the serious socio-
economic problems associated with people living in low-income, including higher
unemployment, lower rates of labour force participation and educational attainment and greater
dependency on social assistance, it was felt that this variable would be the most appropriate
composite measure of disadvantage. Similar to the crime classification, the Z-scores for low-
income were ranked from highest to lowest with the top quintile (20%) of DAs being identified
as “disadvantaged” (n=237). The map clearly displays a very tight spatial concentration of
disadvantage at all levels (‘elevated’, ‘high’ and ‘severe’) within Ottawa’s central core,
particularly the inner city neighbourhoods of Dalhousie, Centre Town, Sandy Hill and Lower
Town as well as a large cluster (including DAs at a ‘severe’ level of disadvantage) in the
east- central portion of the city, comprising the communities of Vanier, Overbrook and
Ottawa North-East.
Other pockets of disadvantaged DAs are present in the south central part of the city including
several neighbourhoods in Riverview, Alta-Vista and Hunt Club and in west central Ottawa and
Research and Statistics Division / Department of Justice Canada | 41
Carlington. Further west, similar conditions are present in several DAs in Pinecrest/Queensway,
Nepean North and Bells Corners. It is also evident that across the city, individual areas of
‘severe’ disadvantage are in most cases bordered by areas of ‘elevated’ and ‘high’ disadvantage.
All of these areas are characterized by significantly lower family and household incomes, higher
rates of unemployment, lower levels of educational attainment and higher proportions of recent
immigrants, visible minorities, lone-parent families and people who are single.
The Intersection of High Crime and Disadvantaged Areas
The “intersection” operation in ArcGIS was used to create a series of maps showing the location
of DAs in Ottawa that are both disadvantaged and have a high crime rate. Figure 6.7 is a map
displaying the intersection of HCAs (by total offences) and disadvantaged areas in the city. In
total, 98 of the 1187 DAs (8% of the total and 41% of HCAs) were found be to experiencing
both conditions. Geographically, these “Hot-Spots” are clustered tightly in Ottawa’s inner core
(Dalhousie, Centre Town, Sandy Hill, and Lower Town), as well as large sections of Vanier,
Overbrook and Ottawa North-East. The map also reveals several small, isolated “Hot-Spots”
within suburban communities surrounding the core including Riverview, Alta-Vista, Hunt
Club, Pinecrest/Queensway and Nepean North. Figure 6.8 illustrates the intersection of HCAs
(by violent offences) and disadvantaged areas and reveals a very similar spatial distribution.
In this case, 103 DAs (9% of the total and 43% of HCAs) were found to be both violent
and disadvantaged.
Table 6.7 provides a summary of criminal offence and socio-economic conditions in the four
main spatial groupings presented thus far in the report:
1. High Crime Areas (n=237)
2. Disadvantaged Areas (n=237)
3. “Hot-Spots” A – Intersection of Total Offence HCAs/Disadvantage (n=98)
4. “Hot-Spots” B – Intersection of Violent Offence HCAs/Disadvantage (n=103).
It lists the mean Z-scores on the 6 crime variables and 23 selected census indicators for the DAs
in the four groups. Scores higher than 0 indicate conditions above the citywide average while
Exploring the Link between Crime and Socio-Economic Status in Ottawa and Saskatoon: A Small-Area Geographical Analysis
42 | Research and Statistics Division / Department of Justice Canada
scores less than 0 signify conditions below the citywide average. It is important to note that the
figures in this table do not necessarily imply cause and effect between crime and socio-economic
status but rather present a general picture of conditions in these areas.
The table reveals that HCAs, on average, have higher proportions of people living in low income
(0.671) as well as singles (0.831) and have more rented dwellings (0.673) and apartment low
rises (0.599). In addition, they have larger proportions of residents who have not finished high-
school (0.589). “Disadvantaged Areas”, on the other hand, have only slightly higher than average
rates of total criminal offences (0.279) but moderately higher rates of violent crimes (0.495).
Table 6.7 also shows that the “Hot-Spots” (A & B) are characterized by significantly higher
proportions of recent immigrants (0.841, 0.822), visible minorities (0.978, 1.039), residents who
had moved during the past year (0.850, 0.749), low rise apartments (0.938, 0.907) and
substantially higher rates of residents without a high-school diploma (1.042, 1.174). With respect
to the incidence of crime, the “Hot-Spots” had markedly higher rates of violent offences
(1.284, 1.310).
Section 6.5 - Discussion
Ottawa is a relatively safe city with a low crime rate. Overall, it has an affluent population and a
strong economy; but serious social problems persist in a number of disadvantaged communities.
In 2001, minor property crimes were the most prevalent offences, accounting for 54% of the
total. Two minor property-related crimes - ‘theft under $5000’ and ‘mischief’ together accounted
for 40% of all offences. Violent crimes accounted for 16% of total offences in 2001.
The study found that there is a weak statistical association in Ottawa between crime and socio-
economic disadvantage. The results of the analysis (principal components analysis and multiple
regression) revealed that, overall, there are no clear social ‘predictors’ of crime in the city at the
level of the dissemination area (DA). For example, when examining the city as a whole, DAs
with higher proportions of youth, unemployed people, recent immigrants, visible minorities,
renters or high-school dropouts are not more likely to be areas with higher crime rates.

Research and Statistics Division / Department of Justice Canada | 43
The mapping of crime variables was effective in discerning geographic patterns of criminal
activity in the city. In 2001, “High Crime Areas” (HCAs) were largely contained to the built-up
urban core of Ottawa (including the suburbs) with very few HCAs evident in outlying and rural
areas. While this was also the case with ‘violent’ and ‘minor property’ offences, the maps
showed that ‘major property’ and ‘drug’ offences had a more dispersed pattern with several
HCAs located in suburban and rural communities. The GIS analysis found that there was a
moderate geographic relationship between crime and socio-economic status in the city, with 40%
of disadvantaged DAs also being HCAs. Places where these two conditions intersected were
labeled as “Hot-Spots” and represented just 8% of all DAs in the city. These “Hot-Spots” were
found primarily in inner city communities but several were also visible in suburban
neighbourhoods with low-income subsidized housing projects.
While the relationship between crime and socio-economic status was found to be tenuous at the
citywide level, a number of characteristics did emerge when specific areas were examined more
closely. HCAs, for example, exhibited certain conditions consistent with the ecological approach
to criminology and social disorganization theory, most notably above average levels of low-
income and transient residents. In addition, the “Hot-Spots” were found to have higher rates of
violent crime and significantly larger proportions of recent immigrants, visible minorities and
residents living in apartment buildings.
The concept of criminal opportunity is clearly applicable to the situation in Ottawa as the
majority (60%) of HCAs in the city are not socially disadvantaged. Suitable targets for crime are
found in areas where commercial, institutional and recreational activities are located, such as
shopping centres, offices, transit-way stations, warehouses and recreational spaces. In addition,
unguarded homes in suburban communities are targeted for their valuable and easily
transportable goods. Furthermore, routine activities theory helps to explain the high rates
of violent crime evident in areas with a concentration of bars and restaurants such as in
Ottawa’s Market district.
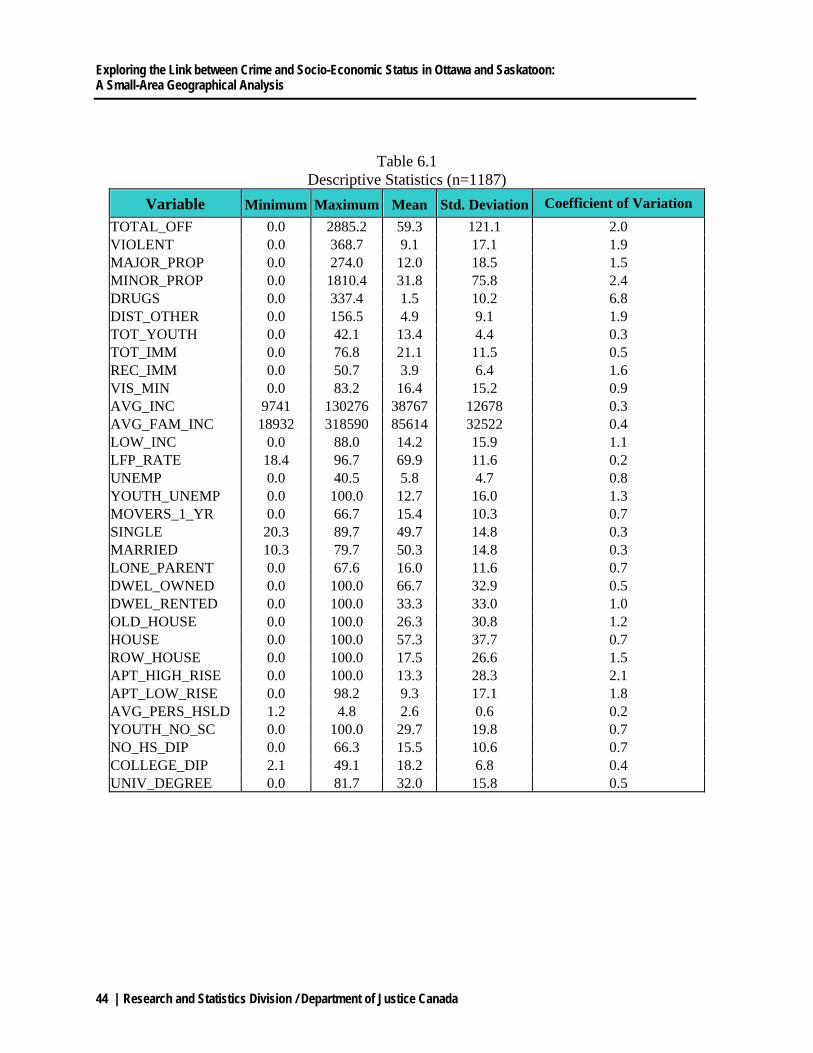
Exploring the Link between Crime and Socio-Economic Status in Ottawa and Saskatoon: A Small-Area Geographical Analysis
44 | Research and Statistics Division / Department of Justice Canada
Table 6.1 Descriptive Statistics (n=1187)
Variable Minimum Maximum Mean Std. Deviation Coefficient of Variation TOTAL_OFF 0.0 2885.2 59.3 121.1 2.0 VIOLENT 0.0 368.7 9.1 17.1 1.9 MAJOR_PROP 0.0 274.0 12.0 18.5 1.5 MINOR_PROP 0.0 1810.4 31.8 75.8 2.4 DRUGS 0.0 337.4 1.5 10.2 6.8 DIST_OTHER 0.0 156.5 4.9 9.1 1.9 TOT_YOUTH 0.0 42.1 13.4 4.4 0.3 TOT_IMM 0.0 76.8 21.1 11.5 0.5 REC_IMM 0.0 50.7 3.9 6.4 1.6 VIS_MIN 0.0 83.2 16.4 15.2 0.9 AVG_INC 9741 130276 38767 12678 0.3 AVG_FAM_INC 18932 318590 85614 32522 0.4 LOW_INC 0.0 88.0 14.2 15.9 1.1 LFP_RATE 18.4 96.7 69.9 11.6 0.2 UNEMP 0.0 40.5 5.8 4.7 0.8 YOUTH_UNEMP 0.0 100.0 12.7 16.0 1.3 MOVERS_1_YR 0.0 66.7 15.4 10.3 0.7 SINGLE 20.3 89.7 49.7 14.8 0.3 MARRIED 10.3 79.7 50.3 14.8 0.3 LONE_PARENT 0.0 67.6 16.0 11.6 0.7 DWEL_OWNED 0.0 100.0 66.7 32.9 0.5 DWEL_RENTED 0.0 100.0 33.3 33.0 1.0 OLD_HOUSE 0.0 100.0 26.3 30.8 1.2 HOUSE 0.0 100.0 57.3 37.7 0.7 ROW_HOUSE 0.0 100.0 17.5 26.6 1.5 APT_HIGH_RISE 0.0 100.0 13.3 28.3 2.1 APT_LOW_RISE 0.0 98.2 9.3 17.1 1.8 AVG_PERS_HSLD 1.2 4.8 2.6 0.6 0.2 YOUTH_NO_SC 0.0 100.0 29.7 19.8 0.7 NO_HS_DIP 0.0 66.3 15.5 10.6 0.7 COLLEGE_DIP 2.1 49.1 18.2 6.8 0.4 UNIV_DEGREE 0.0 81.7 32.0 15.8 0.5

Research and Statistics Division / Department of Justice Canada | 45
Table 6.2 Explanatory Power of the Principal Components
Component Eigenvalue % Total Variance Cumulative % 1 9.8 31.6 31.6 2 3.8 12.3 43.9 3 2.7 8.8 52.7 4 2.3 7.6 60.2 5 2.0 6.3 66.5 6 1.5 4.7 71.3 7 1.2 3.7 75.0 8 1.1 3.5 78.5
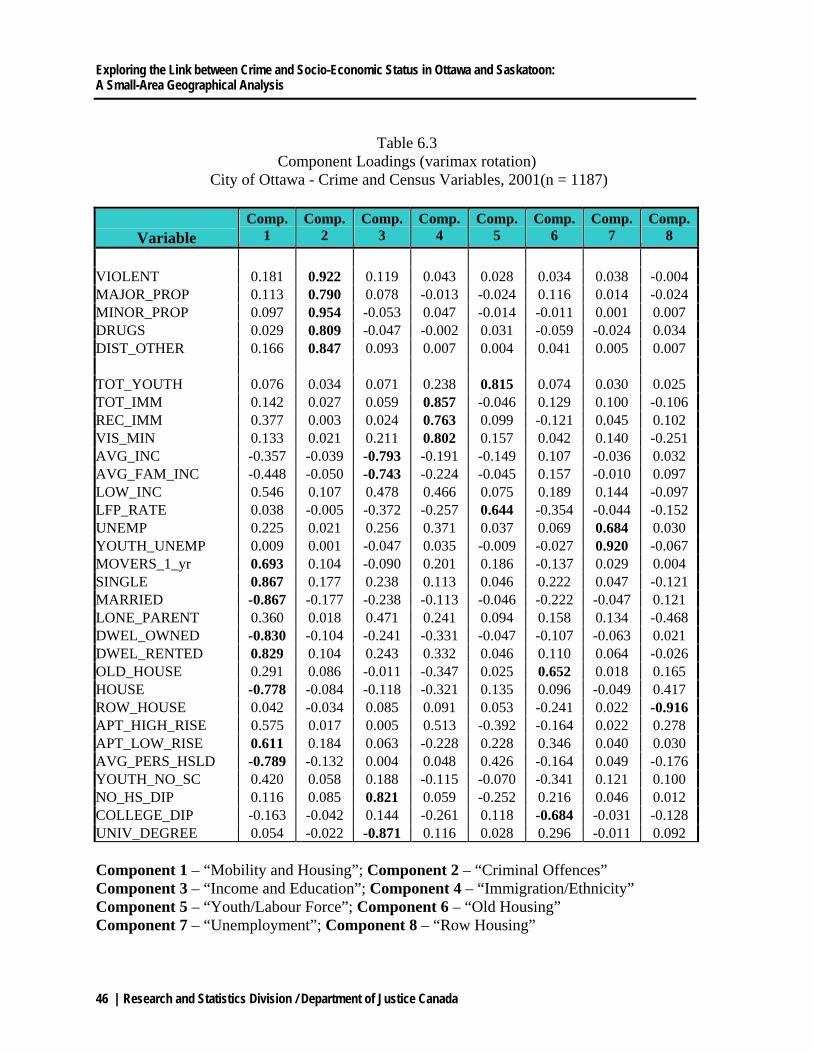
Exploring the Link between Crime and Socio-Economic Status in Ottawa and Saskatoon: A Small-Area Geographical Analysis
46 | Research and Statistics Division / Department of Justice Canada
Table 6.3
Component Loadings (varimax rotation) City of Ottawa - Crime and Census Variables, 2001(n = 1187)
Variable Comp.
1 Comp.
2 Comp.
3 Comp.
4 Comp.
5 Comp.
6 Comp.
7 Comp.
8 VIOLENT 0.181 0.922 0.119 0.043 0.028 0.034 0.038 -0.004 MAJOR_PROP 0.113 0.790 0.078 -0.013 -0.024 0.116 0.014 -0.024 MINOR_PROP 0.097 0.954 -0.053 0.047 -0.014 -0.011 0.001 0.007 DRUGS 0.029 0.809 -0.047 -0.002 0.031 -0.059 -0.024 0.034 DIST_OTHER 0.166 0.847 0.093 0.007 0.004 0.041 0.005 0.007 TOT_YOUTH 0.076 0.034 0.071 0.238 0.815 0.074 0.030 0.025 TOT_IMM 0.142 0.027 0.059 0.857 -0.046 0.129 0.100 -0.106 REC_IMM 0.377 0.003 0.024 0.763 0.099 -0.121 0.045 0.102 VIS_MIN 0.133 0.021 0.211 0.802 0.157 0.042 0.140 -0.251 AVG_INC -0.357 -0.039 -0.793 -0.191 -0.149 0.107 -0.036 0.032 AVG_FAM_INC -0.448 -0.050 -0.743 -0.224 -0.045 0.157 -0.010 0.097 LOW_INC 0.546 0.107 0.478 0.466 0.075 0.189 0.144 -0.097 LFP_RATE 0.038 -0.005 -0.372 -0.257 0.644 -0.354 -0.044 -0.152 UNEMP 0.225 0.021 0.256 0.371 0.037 0.069 0.684 0.030 YOUTH_UNEMP 0.009 0.001 -0.047 0.035 -0.009 -0.027 0.920 -0.067 MOVERS_1_yr 0.693 0.104 -0.090 0.201 0.186 -0.137 0.029 0.004 SINGLE 0.867 0.177 0.238 0.113 0.046 0.222 0.047 -0.121 MARRIED -0.867 -0.177 -0.238 -0.113 -0.046 -0.222 -0.047 0.121 LONE_PARENT 0.360 0.018 0.471 0.241 0.094 0.158 0.134 -0.468 DWEL_OWNED -0.830 -0.104 -0.241 -0.331 -0.047 -0.107 -0.063 0.021 DWEL_RENTED 0.829 0.104 0.243 0.332 0.046 0.110 0.064 -0.026 OLD_HOUSE 0.291 0.086 -0.011 -0.347 0.025 0.652 0.018 0.165 HOUSE -0.778 -0.084 -0.118 -0.321 0.135 0.096 -0.049 0.417 ROW_HOUSE 0.042 -0.034 0.085 0.091 0.053 -0.241 0.022 -0.916 APT_HIGH_RISE 0.575 0.017 0.005 0.513 -0.392 -0.164 0.022 0.278 APT_LOW_RISE 0.611 0.184 0.063 -0.228 0.228 0.346 0.040 0.030 AVG_PERS_HSLD -0.789 -0.132 0.004 0.048 0.426 -0.164 0.049 -0.176 YOUTH_NO_SC 0.420 0.058 0.188 -0.115 -0.070 -0.341 0.121 0.100 NO_HS_DIP 0.116 0.085 0.821 0.059 -0.252 0.216 0.046 0.012 COLLEGE_DIP -0.163 -0.042 0.144 -0.261 0.118 -0.684 -0.031 -0.128 UNIV_DEGREE 0.054 -0.022 -0.871 0.116 0.028 0.296 -0.011 0.092 Component 1 – “Mobility and Housing”; Component 2 – “Criminal Offences” Component 3 – “Income and Education”; Component 4 – “Immigration/Ethnicity” Component 5 – “Youth/Labour Force”; Component 6 – “Old Housing” Component 7 – “Unemployment”; Component 8 – “Row Housing”
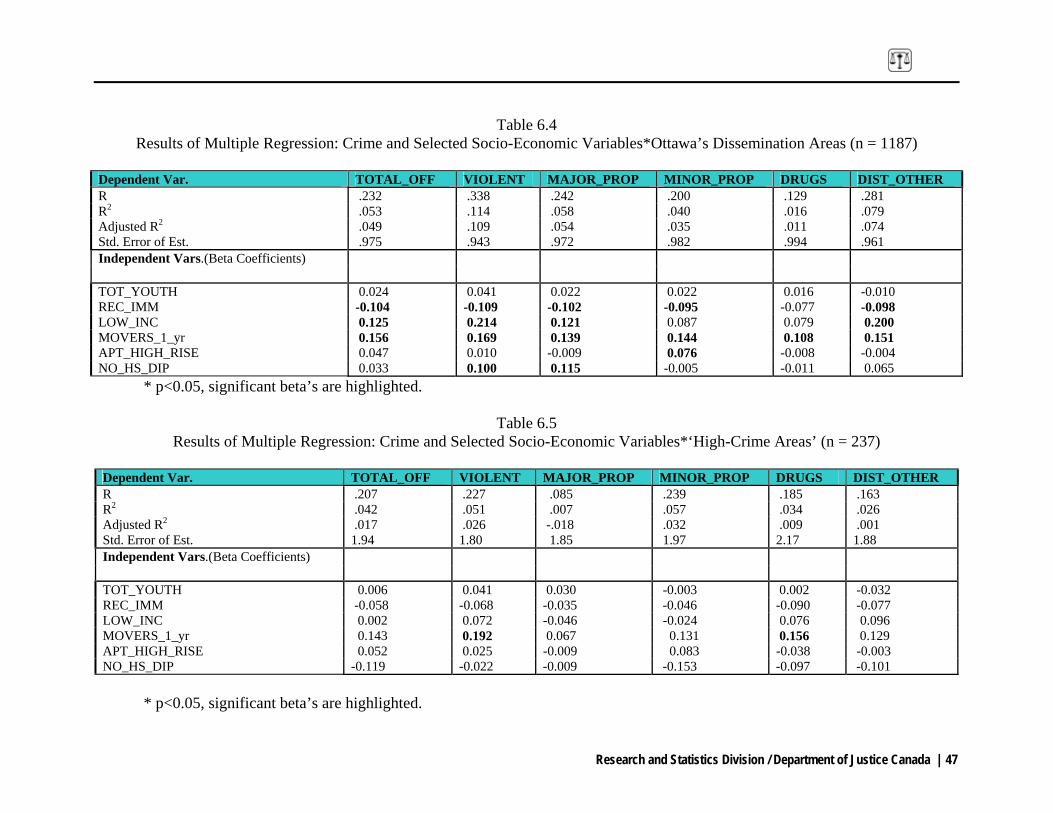
Research and Statistics Division / Department of Justice Canada | 47
Table 6.4
Results of Multiple Regression: Crime and Selected Socio-Economic Variables*Ottawa’s Dissemination Areas (n = 1187)
Dependent Var. TOTAL_OFF VIOLENT MAJOR_PROP MINOR_PROP DRUGS DIST_OTHER R .232 .338 .242 .200 .129 .281 R2 .053 .114 .058 .040 .016 .079 Adjusted R2 .049 .109 .054 .035 .011 .074 Std. Error of Est. .975 .943 .972 .982 .994 .961
Independent Vars.(Beta Coefficients)
TOT_YOUTH 0.024 0.041 0.022 0.022 0.016 -0.010 REC_IMM -0.104 -0.109 -0.102 -0.095 -0.077 -0.098 LOW_INC 0.125 0.214 0.121 0.087 0.079 0.200 MOVERS_1_yr 0.156 0.169 0.139 0.144 0.108 0.151 APT_HIGH_RISE 0.047 0.010 -0.009 0.076 -0.008 -0.004 NO_HS_DIP 0.033 0.100 0.115 -0.005 -0.011 0.065
* p<0.05, significant beta’s are highlighted.
Table 6.5 Results of Multiple Regression: Crime and Selected Socio-Economic Variables*‘High-Crime Areas’ (n = 237)
Dependent Var. TOTAL_OFF VIOLENT MAJOR_PROP MINOR_PROP DRUGS DIST_OTHER R .207 .227 .085 .239 .185 .163 R2 .042 .051 .007 .057 .034 .026 Adjusted R2 .017 .026 -.018 .032 .009 .001 Std. Error of Est. 1.94 1.80 1.85 1.97 2.17 1.88
Independent Vars.(Beta Coefficients)
TOT_YOUTH 0.006 0.041 0.030 -0.003 0.002 -0.032 REC_IMM -0.058 -0.068 -0.035 -0.046 -0.090 -0.077 LOW_INC 0.002 0.072 -0.046 -0.024 0.076 0.096 MOVERS_1_yr 0.143 0.192 0.067 0.131 0.156 0.129 APT_HIGH_RISE 0.052 0.025 -0.009 0.083 -0.038 -0.003 NO_HS_DIP -0.119 -0.022 -0.009 -0.153 -0.097 -0.101
* p<0.05, significant beta’s are highlighted.

Exploring the Link between Crime and Socio-Economic Status in Ottawa and Saskatoon: A Small-Area Geographical Analysis
48 | Research and Statistics Division / Department of Justice Canada
Table 6.6
Results of Multiple Regression: Crime and Selected Socio-Economic Variables* ‘Disadvantaged Areas’ (n = 237)
Dependent Var. TOTAL_OFF VIOLENT MAJOR_PROP MINOR_PROP DRUGS DIST_OTHER R .140 .231 .134 .149 .248 .228 R2 .019 .053 .018 .022 .061 .052 Adjusted R2 -.005 .028 -.007 -.003 .037 .027 Std. Error of Est. 1.15 1.19 1.48 1.11 .444 1.33
Independent Vars. (Beta Coefficients) TOT_YOUTH 0.076 0.075 0.094 0.081 0.117 -0.076 REC_IMM -0.123 -0.156 -0.095 -0.099 -0.148 -0.175 LOW_INC 0.017 0.065 -0.032 -0.001 0.060 0.136 MOVERS_1_yr 0.094 0.187 0.005 0.068 0.165 0.208 APT_HIGH_RISE 0.058 0.029 -0.020 0.093 0.017 0.002 NO_HS_DIP 0.004 0.139 0.010 -0.039 0.175 0.000
* p<0.05, significant beta’s are highlighted.
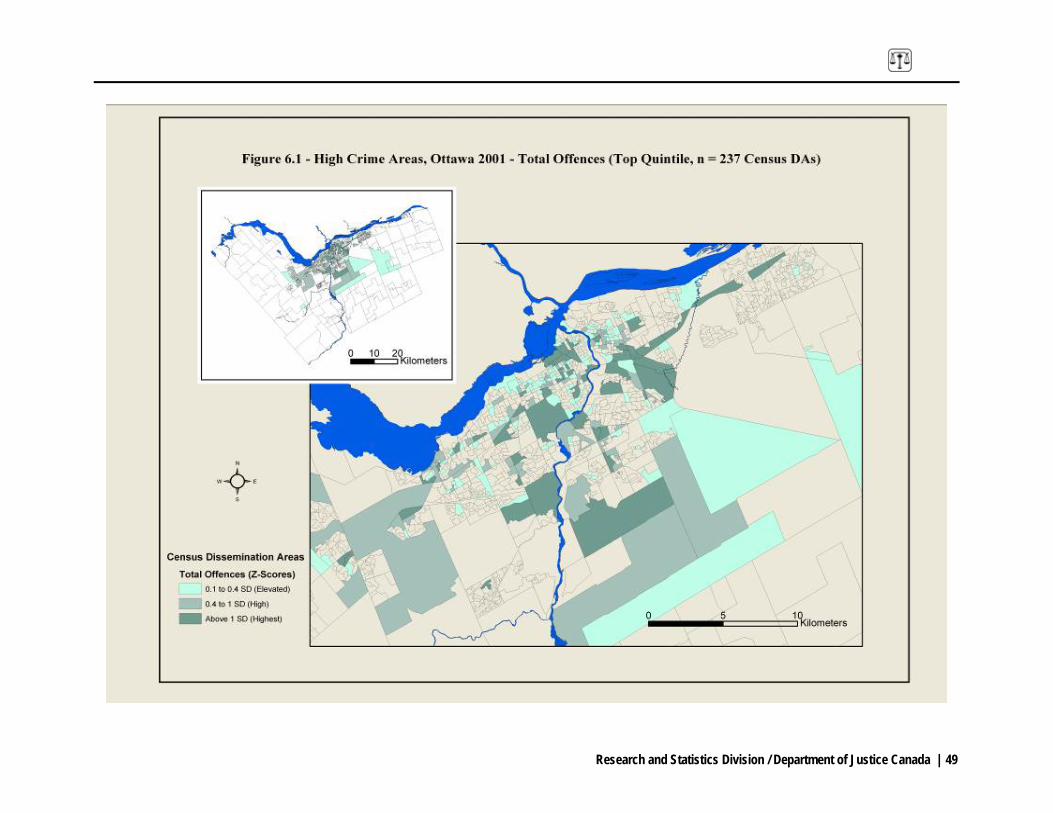
Research and Statistics Division / Department of Justice Canada | 49
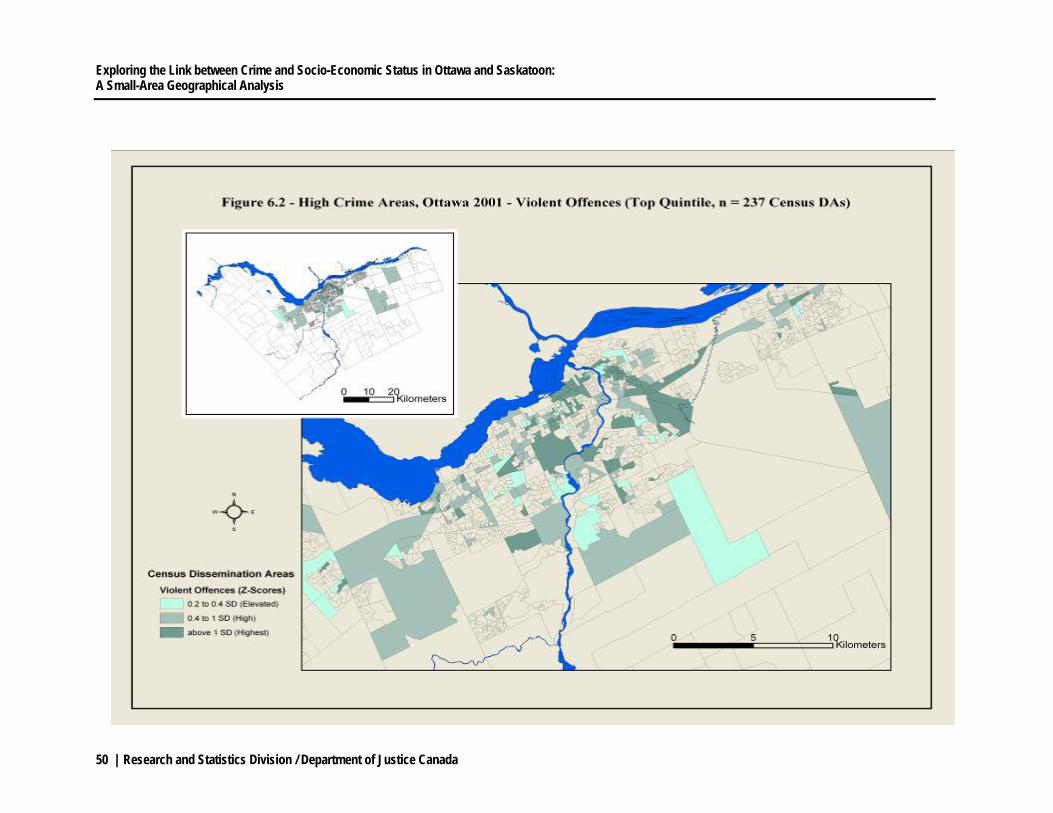
Exploring the Link between Crime and Socio-Economic Status in Ottawa and Saskatoon: A Small-Area Geographical Analysis
50 | Research and Statistics Division / Department of Justice Canada
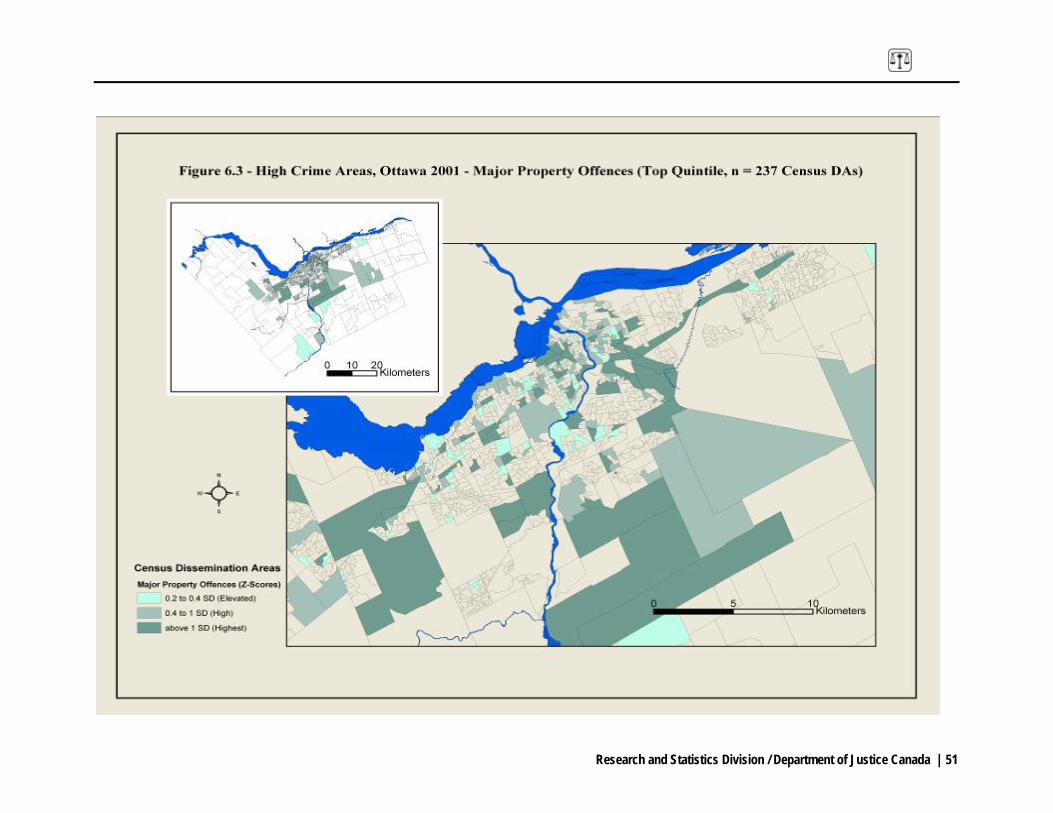
Research and Statistics Division / Department of Justice Canada | 51
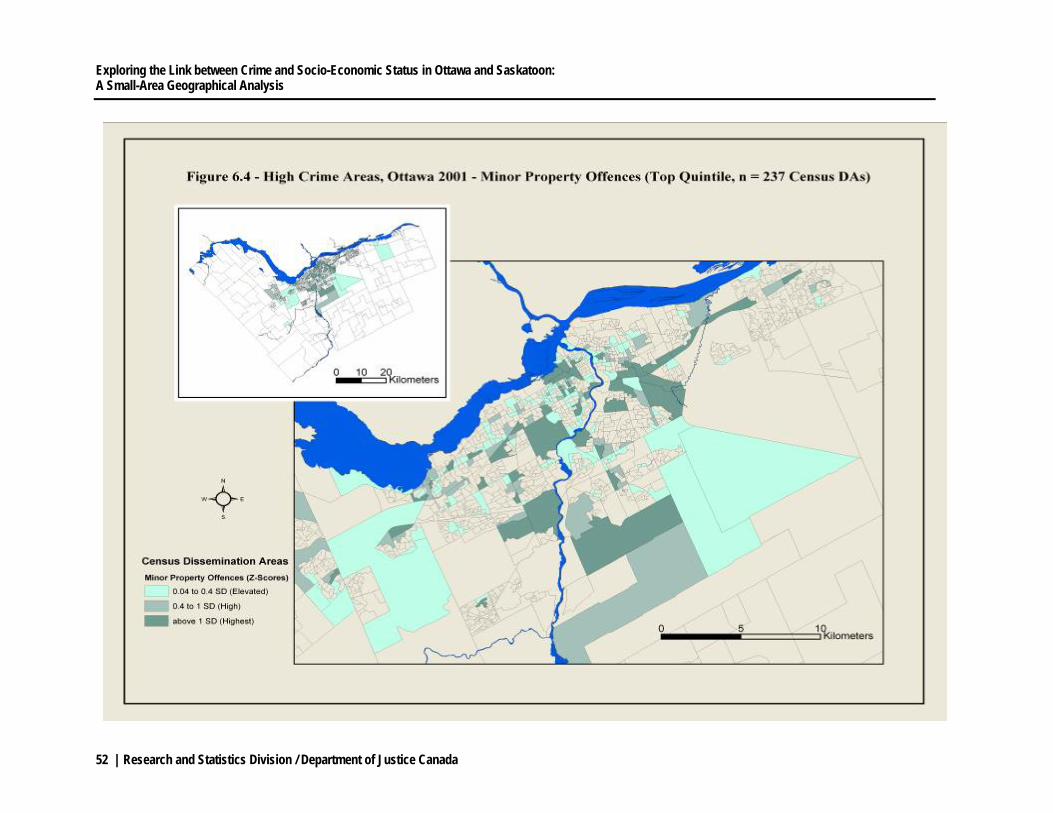
Exploring the Link between Crime and Socio-Economic Status in Ottawa and Saskatoon: A Small-Area Geographical Analysis
52 | Research and Statistics Division / Department of Justice Canada
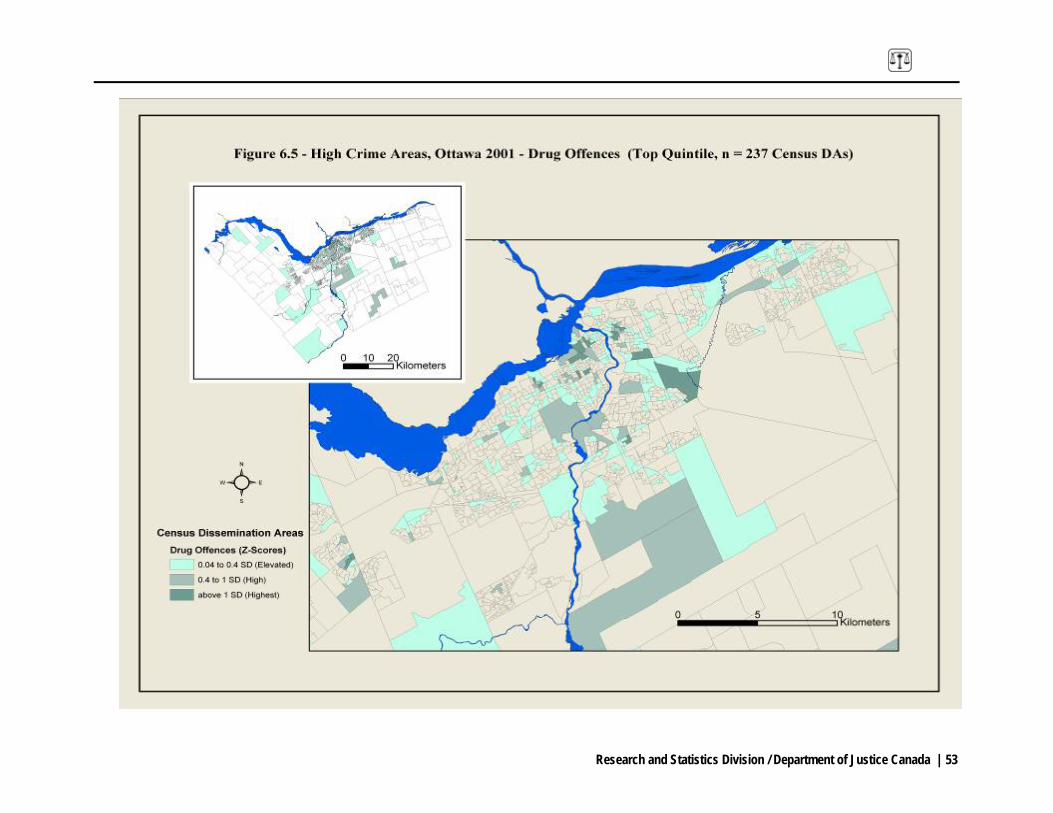
Research and Statistics Division / Department of Justice Canada | 53
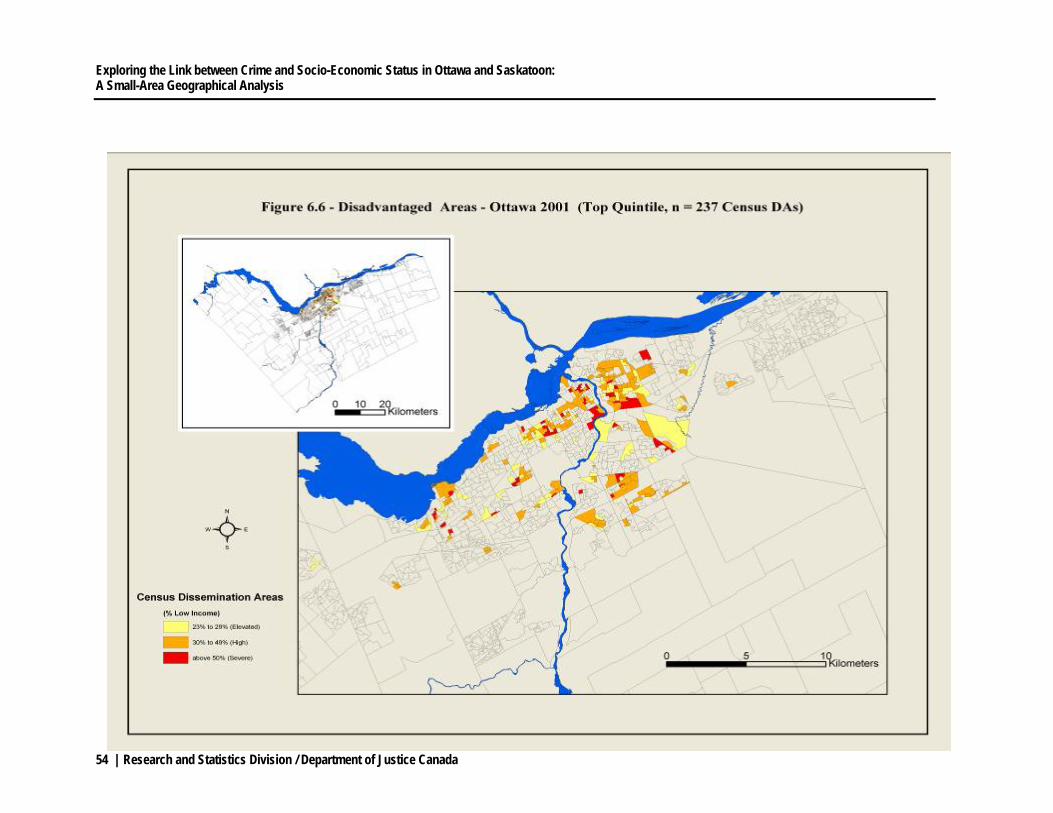
Exploring the Link between Crime and Socio-Economic Status in Ottawa and Saskatoon: A Small-Area Geographical Analysis
54 | Research and Statistics Division / Department of Justice Canada
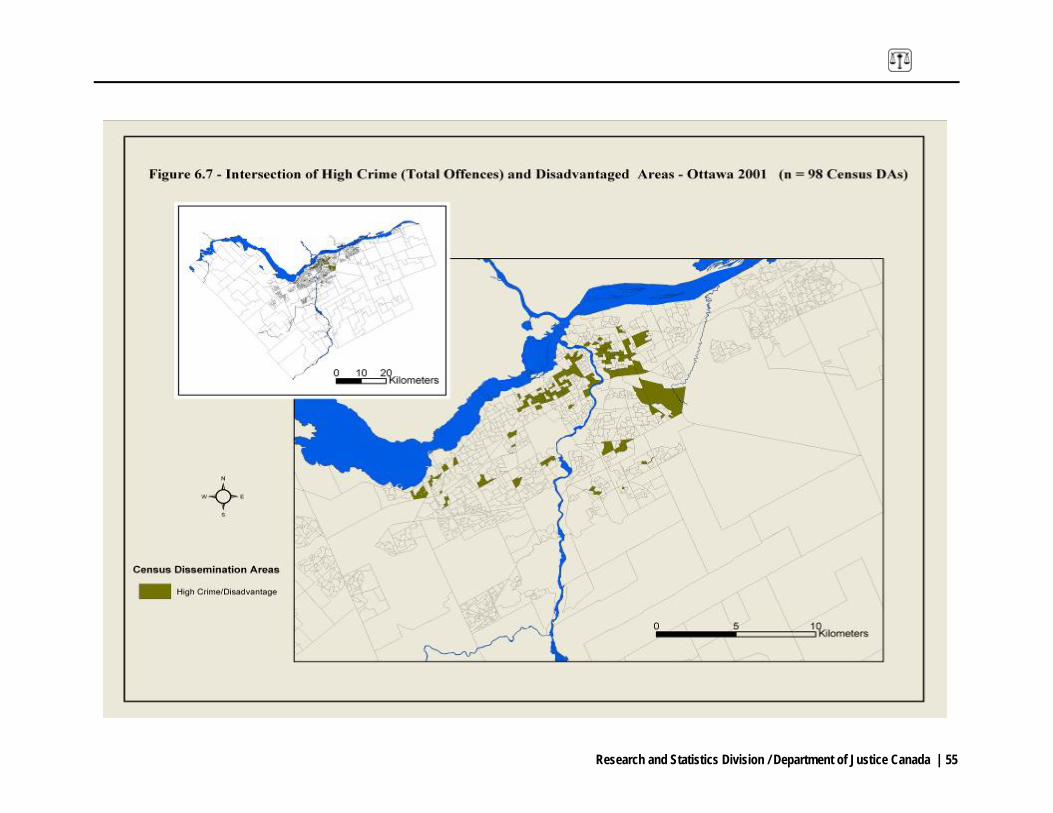
Research and Statistics Division / Department of Justice Canada | 55
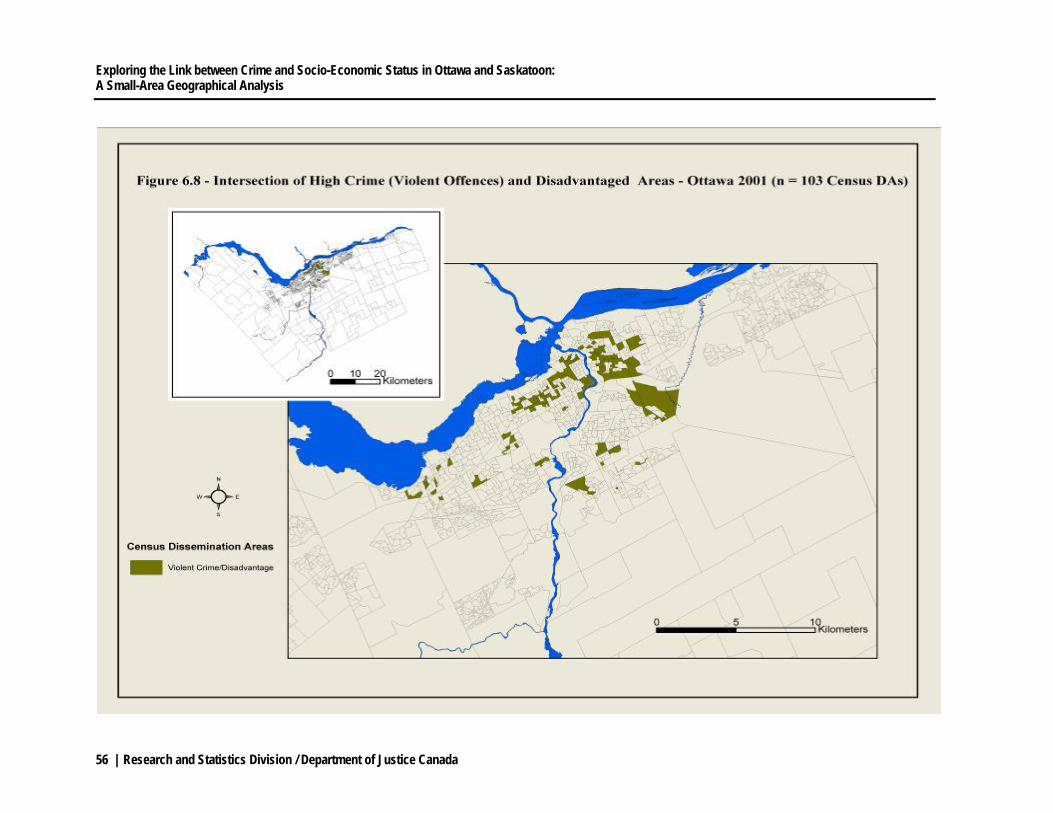
Exploring the Link between Crime and Socio-Economic Status in Ottawa and Saskatoon: A Small-Area Geographical Analysis
56 | Research and Statistics Division / Department of Justice Canada
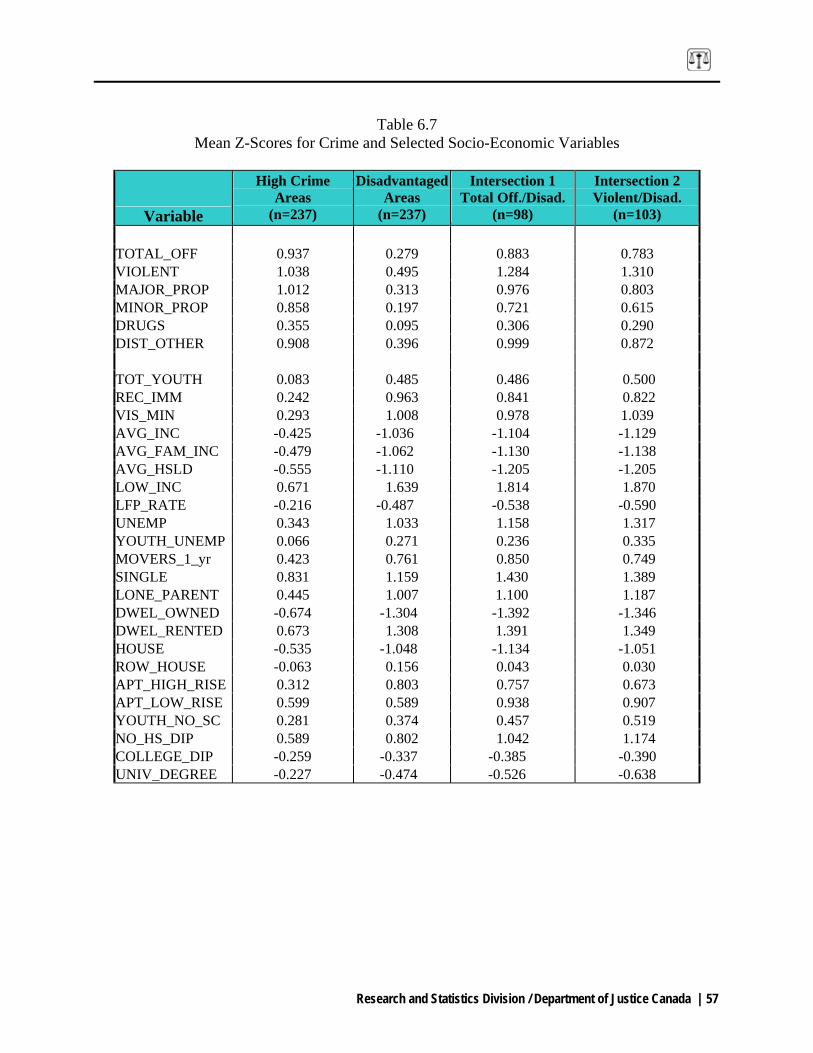
Research and Statistics Division / Department of Justice Canada | 57
Table 6.7
Mean Z-Scores for Crime and Selected Socio-Economic Variables
Variable
High Crime Areas
(n=237)
DisadvantagedAreas
(n=237)
Intersection 1 Total Off./Disad.
(n=98)
Intersection 2 Violent/Disad.
(n=103) TOTAL_OFF 0.937 0.279 0.883 0.783 VIOLENT 1.038 0.495 1.284 1.310 MAJOR_PROP 1.012 0.313 0.976 0.803 MINOR_PROP 0.858 0.197 0.721 0.615 DRUGS 0.355 0.095 0.306 0.290 DIST_OTHER 0.908 0.396 0.999 0.872 TOT_YOUTH 0.083 0.485 0.486 0.500 REC_IMM 0.242 0.963 0.841 0.822 VIS_MIN 0.293 1.008 0.978 1.039 AVG_INC -0.425 -1.036 -1.104 -1.129 AVG_FAM_INC -0.479 -1.062 -1.130 -1.138 AVG_HSLD -0.555 -1.110 -1.205 -1.205 LOW_INC 0.671 1.639 1.814 1.870 LFP_RATE -0.216 -0.487 -0.538 -0.590 UNEMP 0.343 1.033 1.158 1.317 YOUTH_UNEMP 0.066 0.271 0.236 0.335 MOVERS_1_yr 0.423 0.761 0.850 0.749 SINGLE 0.831 1.159 1.430 1.389 LONE_PARENT 0.445 1.007 1.100 1.187 DWEL_OWNED -0.674 -1.304 -1.392 -1.346 DWEL_RENTED 0.673 1.308 1.391 1.349 HOUSE -0.535 -1.048 -1.134 -1.051 ROW_HOUSE -0.063 0.156 0.043 0.030 APT_HIGH_RISE 0.312 0.803 0.757 0.673 APT_LOW_RISE 0.599 0.589 0.938 0.907 YOUTH_NO_SC 0.281 0.374 0.457 0.519 NO_HS_DIP 0.589 0.802 1.042 1.174 COLLEGE_DIP -0.259 -0.337 -0.385 -0.390 UNIV_DEGREE -0.227 -0.474 -0.526 -0.638
Exploring the Link between Crime and Socio-Economic Status in Ottawa and Saskatoon: A Small-Area Geographical Analysis
58 | Research and Statistics Division / Department of Justice Canada
7. Study # 2 Findings: Neighbourhoods of Saskatoon
Section 7.1 – Descriptive Statistics
able 7.1 displays the descriptive statistics for the 31 variables used in the study. The five
crime variables were calculated as a rate per 1,000 population in each of Saskatoon’s 55
residential neighbourhoods, a standard procedure in crime analysis. The remaining 26 census and
development/planning variables were calculated at the ratio scale with the exception of two,
average value of dwelling ($DWELLING) and average selling price of a dwelling
(AVG_SELL_PRICE) which were left at the interval scale. The table shows that several of the
variables, including those related to crime, have high coefficients of variation (the standard
deviation divided by the mean) indicating greater dispersion of individual values around the
mean. In particular, violent offences and drug offences have values that fluctuate widely among
the 55 neighbourhoods, suggesting significant geographic disparity within Saskatoon. As very
few of the 31 variables have “approximate” normal distributions coupled with the fact that they
originate from different sources (police data, census indicators, development/planning
information) each of the 31 variables was transformed into a Z-score for every neighbourhood in
the dataset (55).
Section 7.2 - Principal Components Analysis
Table 7.2 shows that the PCA produced a 6-component solution, accounting for more than 84%
of the total variance in the dataset, a large proportion indicating a significant degree of inter-
correlation amongst the variables. Component 1 alone accounts for just under 47% of the total
variance. An examination of the component loadings in Table 7.3 reveals that there is a positive
association between crime (particularly violent and major property crimes) and socio-economic
disadvantage in Saskatoon (Component 1). The characteristics of disadvantaged neighbourhoods
are marked by high loadings on variables relating to mobility (SINGLE, MOVERS),
ethnicity/family (ABORIGINAL, LONE_PARENT), education (NO_HS_DIP), income
(GOVT_TRANSFER, LOW_INC_FAM), housing (DWEL_RENTED, MAJOR_REPAIRS) and
labour force activity (UNEMP, YOUTH_UNEMP). A closer scrutiny of the table reveals that 3
T
Research and Statistics Division / Department of Justice Canada | 59
variables on Component 1 have high loadings above 0.9 (ABORIGINAL, LONE_PARENT and
LOW_INC_FAM) pointing to the presence of a particularly vulnerable group of people in
Saskatoon with respect to both social deprivation and crime, namely Aboriginal single mothers
living in low-income. Component 2 isolates the incidence of minor property and drugs offences
in neighbourhoods with apartment high-rises and lower labour force participation. The remaining
components identify several dimensions of socio-economic status and land-use characteristics in
the city, including “park space” (Component 3), “housing value and education” (Component 4),
and “density and old housing” (Component 5).
Section 7.3 - Multiple Regression Analysis
A step-wise multiple regression was performed on the Saskatoon neighbourhood dataset. Table
7.4 shows the results of the regression analysis between each of the 5 crime variables and a
selection of neighbourhood indicators. When using SPSS for Windows for this procedure, tests
were run to measure the level of multicollinearity among the independent variables. Each
independent variable in the 5 regression models had tolerance values close to 0.1 and variance
inflation factors (VIF) well below the rule-of-thumb value of 5 (Rogerson 2001, p.136). In fact,
all were below 2 indicating low multicollinearity thus strengthening the predictive value of the
regression models.
The table clearly demonstrates that there is a strong association between crime and
neighbourhood characteristics in Saskatoon with each of the crime variables recording fairly high
coefficients of multiple determination (R2) and adjusted R2. Regression model # 1 shows that
four independent variables, ‘youth not at school’ (YOUTH_NO_SC), ‘population that is single’
(SINGLE), ‘level of social assistance’ (GOVT_TRANSFER) and ‘apartment high-rises’
(APT_HIGH_RISE), when taken together, account for nearly 70% (adjusted R2 = .666) of the
variation of total crime in Saskatoon’s 55 residential neighbourhoods. The variable
GOVT_TRANSFER recorded the highest beta coefficient (.339) among the four independent
variables indicating that the level of social assistance in a community (in the form of residents
who require welfare and other benefits as a major source of their income) can be considered as a
significant predictor of crime. As can be expected, the need for social assistance is clearly
Exploring the Link between Crime and Socio-Economic Status in Ottawa and Saskatoon: A Small-Area Geographical Analysis
60 | Research and Statistics Division / Department of Justice Canada
associated with socio-economic disadvantage and is related to factors such as low-income,
unemployment, lower educational attainment, and rented housing.
Regression model # 2 points very clearly and directly to a troublesome association between
violent crime and Aboriginal people in Saskatoon. The two independent variables explain more
than 70% (adjusted R2 = .715) of the variation in violent crime in the city’s neighbourhoods with
ABORIGINAL standing out as the key predictor recording a beta coefficient of .651. As seen in
Table 4.5 above, assaults accounted for about 75% of violent crimes in Saskatoon in 2003.
These results suggest that it is primarily Aboriginal people who are at risk of being victims of
physical violence.
Regression model # 3 reveals that the most significant predictors of major property crime in
Saskatoon are average home selling price (AVG_SELL_PRICE); people who have recently
moved (MOVERS) and the presence of older homes (OLD_HOUSE). In other words, older
neighbourhoods with low real-estate values appear to be vulnerable to major property offences
particularly residential break and enter and motor vehicle theft. Regression model # 4, which
measures minor property crime, has a slightly smaller adjusted R2 value of .596 and identifies
apartment high-rises (APT_HIGH_RISE), youth who are not at school (YOUTH_NO_SC) and
dwellings that are rented (DWEL_RENTED) as the most important predictors. Offences related
to minor theft (under $5000) and mischief are especially prevalent in neighbourhoods with these
characteristics. Finally, drug offences in Saskatoon (Regression model # 5) appear to be
influenced by the presence of apartment high-rises (APT_HIGH_RISE), low-income families
(LOW_INC_FAM) and youth who are not at school (YOUTH_NO_SC). It should be noted,
however, that drug offences accounted for less than 2% of all incidents in Saskatoon in 2003
(Table 4.5).
Section 7.4 - Mapping and GIS Analysis: Identifying Spatial Patterns of Crime and Neighbourhood Characteristics
ArcGIS was used to create a series of maps displaying the geographic distribution of criminal
offences and selected neighbourhood characteristics in the City of Saskatoon. A classification
Research and Statistics Division / Department of Justice Canada | 61
scheme was devised to rank neighbourhoods according to their crime rates per 1,000 population:
1. Lowest, 2. Low, 3. Moderate, 4. High and 5. Highest.
For example, as can be seen in Figure 7.2, the classification for ‘Total Offences’ is as follows
with the numbers in parentheses denoting the crime rate: 1. Lowest (0-35); 2. Low (35-100);
Moderate (100-200); High (200-300) and Highest (300-600). For the purposes of this study,
High Crime Areas (HCAs) are defined as any neighbourhood that is placed in the ‘High’ or
‘Highest’ categories. This classification scheme was adjusted to correspond with the crime rates
for each of the four remaining offence types.
The map in Figure 7.2 shows that there is a noticeable presence of ‘Moderate’ and HCAs in the
south and central sections of Saskatoon, particularly on the west side of the South Saskatchewan
River. In fact, all of the HCAs are located there and most are clustered in and around the inner
city including the 4 with the ‘Highest’ crime rates in 2003 – the Central Business District (546),
Pleasant Hill (450), Kelsey-Woodlawn (374) and Riversdale (347). These 4 neighbourhoods are
adjacent or very close to several other HCAs including Caswell Hill (296), King George (243),
Westmount (234), and Mayfair (209). The two remaining HCAs are Confederation Park (227)
located on the western edge of Saskatoon and the Airport Business Area (281) situated in the
northwestern section of the city. While there is clearly a presence of elevated crime rates in the
western part of the city, Figure 7.2 also reveals an interesting pattern of neighbourhoods with
‘Moderate’ crime rates adjacent to 8th Street, a major commercial thoroughfare on the east side
of the South Saskatchewan River, pointing to a possible geographical association between crime
and mobility/accessibility. These neighbourhoods include Nutana (150), Buena Vista (120),
Varsity View (121), Grosvenor Park (147), Greystone Heights (104) and Brevoort Park (162).
Figure 7.3 is a map illustrating the distribution of violent offences in Saskatoon and it is
immediately apparent that these crimes are far more concentrated in the west side of the city with
all HCAs and all but 3 ‘Moderate’ crime areas located there. Similar to total offences, there is a
noticeably tight clustering of HCAs in and around the inner city including the 3 neighbourhoods
with the highest violent crime rates – Pleasant Hill (131), Riversdale (105) and the Central
Business District (85). Adjacent to these are other violent HCAs including King George (43),

Exploring the Link between Crime and Socio-Economic Status in Ottawa and Saskatoon: A Small-Area Geographical Analysis
62 | Research and Statistics Division / Department of Justice Canada
Meadowgreen (35), Mont Royal (36), Westmount (46) Caswell Hill (41); further to the west,
Confederation Suburban Centre (36) and Confederation Park (38) and just to the north, Kelsey-
Woodlawn (58) and the Airport Business Area (54).
‘Major Property’ offences (Figure 7.4) display a similar pattern as ‘Total Offences’ with a cluster
of HCAs visible in and around the core area and ‘Moderate’ and ‘Low’ crime areas evident in
the southeast portion of Saskatoon. While ‘Minor Property’ offences (Figure 7.5) have a
somewhat more dispersed pattern, all the HCAs are again located in the west side of the city.
However, compared to ‘Major Property’ offences, a number of suburban residential
neighbourhoods have slightly higher rates of minor property crimes including several in the
southeast (Wildwood, Lakeview, Lakeridge and Briarwood), in the northeast (Sutherland, Forest
Grove, Erindale, Arbor Creek, and Silverspring) and just to the northwest of the South
Saskatchewan River (River Heights, Lawson Heights and Silverwood Heights). Finally, while
‘Drugs’ accounted for less than 2% of all offences in 2003, these crimes display a similarly
dispersed pattern (Figure 7.6).
Figure 7.8 is a map showing the geographic distribution of low-income families in Saskatoon.
Due to the serious socio-economic problems related to families living in low-income, including
higher unemployment, lower educational attainment and greater dependency on social assistance,
it is appropriate to use this census indicator as composite measure of disadvantage. For the
objectives of this study, a ‘disadvantaged’ area is defined as any neighbourhood having more
than 20% of its families living in low-income. The map indicates that a socio-economic divide
does exist in Saskatoon with 13 of the 16 ‘disadvantaged’ neighbourhoods located in a relatively
tight cluster in the west side of the city, particularly in and surrounding the core area. Several of
these neighbourhoods have strikingly high rates of low-income families including the Airport
Business Area (62.5%), Confederation Suburban Centre (57%), Pleasant Hill (57%) and
Riversdale (51%). Other ‘disadvantaged’ neighbourhoods on the west side of the river include
King George (34%), Holiday Park (21%), Meadowgreen (35%), Westmount (37%), Caswell Hill
(26%), Kelsey-Woodlawn (29%), Mayfair (26%), Massey Place (27%) and Confederation Park
(21%). While the east side of the river is generally more prosperous, there are 3 suburban
neighbourhoods that can be classified as ‘disadvantaged’- Grosvenor Park (20%), Nutana
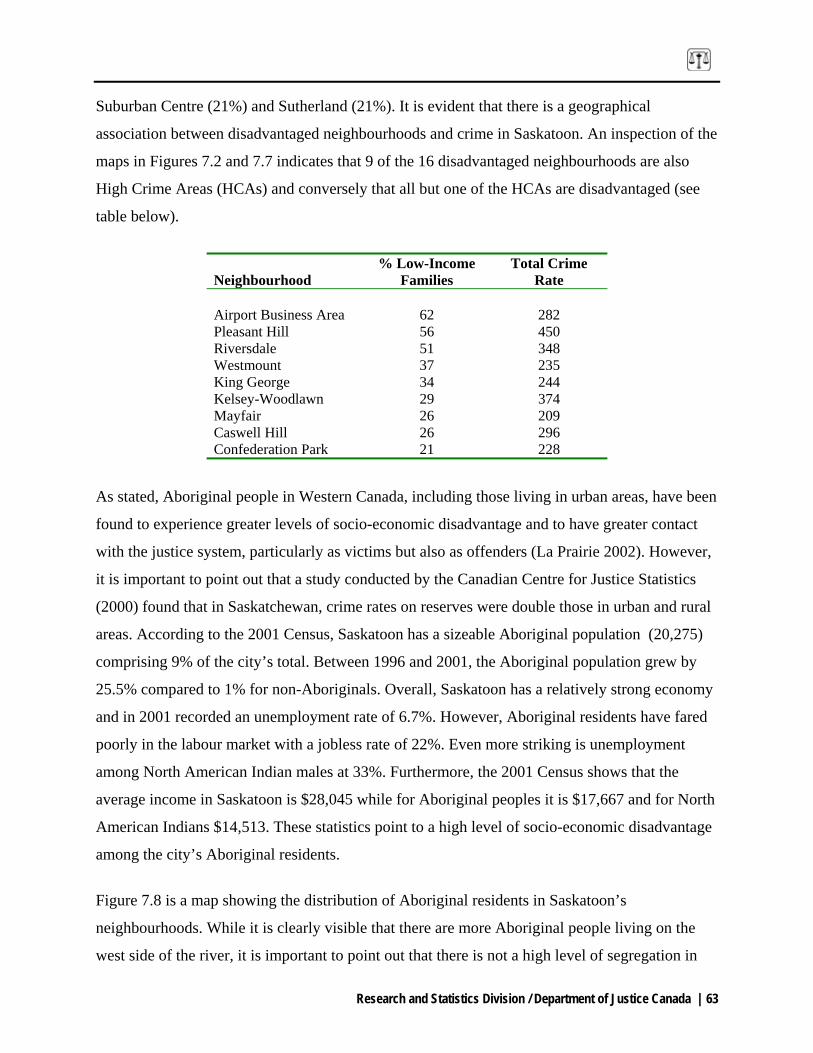
Research and Statistics Division / Department of Justice Canada | 63
Suburban Centre (21%) and Sutherland (21%). It is evident that there is a geographical
association between disadvantaged neighbourhoods and crime in Saskatoon. An inspection of the
maps in Figures 7.2 and 7.7 indicates that 9 of the 16 disadvantaged neighbourhoods are also
High Crime Areas (HCAs) and conversely that all but one of the HCAs are disadvantaged (see
table below).
Neighbourhood
% Low-Income Families
Total Crime Rate
Airport Business Area 62 282 Pleasant Hill 56 450 Riversdale 51 348 Westmount 37 235 King George 34 244 Kelsey-Woodlawn 29 374 Mayfair 26 209 Caswell Hill 26 296 Confederation Park 21 228
As stated, Aboriginal people in Western Canada, including those living in urban areas, have been
found to experience greater levels of socio-economic disadvantage and to have greater contact
with the justice system, particularly as victims but also as offenders (La Prairie 2002). However,
it is important to point out that a study conducted by the Canadian Centre for Justice Statistics
(2000) found that in Saskatchewan, crime rates on reserves were double those in urban and rural
areas. According to the 2001 Census, Saskatoon has a sizeable Aboriginal population (20,275)
comprising 9% of the city’s total. Between 1996 and 2001, the Aboriginal population grew by
25.5% compared to 1% for non-Aboriginals. Overall, Saskatoon has a relatively strong economy
and in 2001 recorded an unemployment rate of 6.7%. However, Aboriginal residents have fared
poorly in the labour market with a jobless rate of 22%. Even more striking is unemployment
among North American Indian males at 33%. Furthermore, the 2001 Census shows that the
average income in Saskatoon is $28,045 while for Aboriginal peoples it is $17,667 and for North
American Indians $14,513. These statistics point to a high level of socio-economic disadvantage
among the city’s Aboriginal residents.
Figure 7.8 is a map showing the distribution of Aboriginal residents in Saskatoon’s
neighbourhoods. While it is clearly visible that there are more Aboriginal people living on the
west side of the river, it is important to point out that there is not a high level of segregation in

Exploring the Link between Crime and Socio-Economic Status in Ottawa and Saskatoon: A Small-Area Geographical Analysis
64 | Research and Statistics Division / Department of Justice Canada
the city. A reasonable measure of ethnic segregation is when more than 30% of a
neighbourhood’s population is made up of one particular group of people sharing an identifiable
characteristic such as race or ancestry. As can be seen Figure 7.8, only 3 neighbourhoods have
more than 30% Aboriginal residents - Pleasant Hill (48%), Riversdale (43.5%) and
Confederation Suburban Centre (37%). In addition to these, just 6 other neighbourhoods have
20% or more Aboriginal residents – Meadowgreen (28%), Airport Business Area (27%),
Westmount (23%), Caswell Hill (25.5%), Massey Place (21%) and Mayfair (20%). It is clear,
then, that the majority of residents in all of Saskatoon’s neighbourhoods are non-Aboriginal
suggesting that issues of victimization, crime and socio-economic status impact a much wider
segment of city’s population. However, the regression analysis (Table 7.4) indicates that there is
a strong relationship between Aboriginal people and violent crime in Saskatoon. An examination
of the maps in Figures 7.3 and 7.8 reveals that 7 of the 9 neighbourhoods with Aboriginal
populations greater than 20% are also violent High Crime Areas (see table below).
Neighbourhood % Aboriginal Violent Crime Rate Pleasant Hill 48.4 131 Riversdale 43.5 105 Confederation SC 37.4 36 Meadowgreen 28.0 35.5 Airport Business Area 26.7 54 Westmount 22.8 46 Caswell Hill 21.5 41.5
The two exceptions are Mayfair, located just north of the city’s core, which is a ‘Moderate’
violent crime area and Massey Place, just west of the core, which is a ‘Low’ violent crime area.
Section 7.5 - Spatial Autocorrelation
Table 7.5 shows that each of the 5 crime variables has a calculated Moran’s I value greater than
0 and a significant Z value (at the 99% confidence interval) indicating positive spatial
autocorrelation. The most spatially concentrated crimes in Saskatoon are major property offences
(I = 0.188, Z = 7.90) followed by violent offences (I = 0.125, Z = 5.49) and total offences (an
aggregate variable) (I = 0.118, Z = 5.20) meaning that neighbourhoods with high rates of crime
tend to be located close to other neighbourhoods with high rates of crime. The least spatially
concentrated or most dispersed crimes are minor property offences (I =0.065, Z=3.21) and drug
Research and Statistics Division / Department of Justice Canada | 65
offences (I=0.064, Z=3.15). The table also indicates that low-income families (I=0.112, Z=4.99)
and Aboriginal residents (I=0.185, Z=7.78) are also geographically highly concentrated in
Saskatoon compared to the distribution of the population as a whole (I=0.011, Z=1.13).
Moran’s I was re-calculated for each variable using the ‘adjustment for small distances’ option in
CrimeStat, in which the distance weights between two locations Wij can never be greater than 1
mile. This ensures that “I” won’t be excessively large for neighbourhoods (as represented by
points) that are close together or adjacent. As shown in Table 7.5, while the adjusted Moran’s I
values are smaller than the original values, the first three crime variables (total, violent and major
property) are positively and significantly spatially autocorrelated as are low-income families and
Aboriginal residents.
Section 7.6 - Characteristics of High Crime Areas
Table 7.6 shows the mean values for each variable used in the study according to three
groupings:
1. All residential neighbourhoods (n=55).
2. High Crime Areas, total offences (n=10).
3. High Crime Areas, violent offences (n=12).
The table reveals that there are considerable socio-economic disparities between HCAs and
overall conditions in Saskatoon’s neighbourhoods. HCAs have, on average, much higher
proportions of single people, people who have recently moved, Aboriginal residents and youth
who are not attending school. Low educational attainment is an important problem in HCAs with
an average of more than 40% of residents aged 20 and over having not finished high school
compared to the overall average of about 27%. Furthermore, the proportion of residents with
university degrees is less than half that of the overall average. In addition, HCAs have residents
who are far more dependent on government transfers and are more likely to be living in low-
income. The rate of low-income families is more than double that of the neighbourhood average.
Table 7.6 also indicates that there are noticeable disparities in housing conditions with HCAs
having substantially larger proportions of renters as well as old housing and dwellings needing
major repairs. The average value of dwellings and average home selling price are also markedly
Exploring the Link between Crime and Socio-Economic Status in Ottawa and Saskatoon: A Small-Area Geographical Analysis
66 | Research and Statistics Division / Department of Justice Canada
lower in these areas. Finally, employment conditions are poorer in HCAs as evidenced by much
lower rates of participation and significantly higher levels of unemployment. These socio-
economic problems are particularly acute in the five HCAs listed in Table 7.7 all of which are
located on the west side of the South Saskatchewan River in and around core area.
Section 7.7 - Summary of Findings and Policy Issues for Saskatoon
In 2003, Saskatoon had the highest crime rate among all Census Metropolitan Areas
(CMAs) in Canada. It also had the highest rate of violent crimes and the second highest
rate of property crimes.
Between 1999 and 2003, there was a steady increase in Saskatoon’s crime rate with a
particularly sharp rise of 16% between 2002 and 2003. Violent and property crimes rates
also grew.
In 2003, just over 50% of all crimes were property related with ‘theft under $5,000’ and
‘break and entering’ accounting for 80% of all the incidents in this category. Violent
offences represented 11% of all crimes in Saskatoon, with ‘assault’ (75%) being the most
frequent. Vandalism is also a problem in the city with 5,139 incidents recorded in 2003
within the offence type ‘Mischief under $5,000 (property damage)’.
The statistical analysis found that there is a relationship between crime and certain socio-
economic characteristics in Saskatoon’s 55 residential neighbourhoods. For instance, the
principal components analysis (PCA) indicated that there is a strong association between
violent and major property offences and vulnerable segments of the population, most
notably Aboriginal people, lone-parents and low-income families.
The multiple regression analysis confirmed the findings of the PCA and established
several predictors of crime. The overall crime rate in a neighbourhood was found to be
significantly influenced by youth not at school, single residents and residents relying on
government transfers.
The regression analysis also indicated a strong relationship between violent crime and
Aboriginal residents in Saskatoon suggesting that this group is more likely to be victims
of these crimes, particularly in certain inner city neighbourhoods.
The mapping of crime variables revealed a visible clustering of High Crime Areas
(HCAs) in the west side of the city, particularly in the core area. This was especially
Research and Statistics Division / Department of Justice Canada | 67
evident for violent HCAs. By comparison, minor property and drug offences displayed a
more dispersed pattern.
There was a similar geographic clustering of low-income families and Aboriginal
residents in and surrounding the core area.
While more Aboriginal and low-income people live in the west side of the city, ethnic
segregation is not a prominent feature of Saskatoon’s urban social geography. There are
only 3 neighbourhoods where Aboriginal residents comprise more than 30% of the total
population and none have more than 50%, suggesting that issues of crime and
victimization effect a wider segment of the population in HCAs.
There is a geographic association between HCAs and neighbourhoods with higher
proportions of low-income families and Aboriginal residents.
HCAs were also found to have higher proportions of single people and residents who
have recently moved, significantly lower levels of educational attainment, poorer quality
and older housing and higher unemployment.
The principal findings of this study can contribute to a number of broad policy initiatives aimed
at crime prevention, social upgrading and community development. It is apparent that
Saskatoon’s high crime rate is due, in large part, to a high concentration of crime in several
neighbourhoods including the Central Business District (CBD), Pleasant Hill, Riversdale,
Caswell Hill and King George. The majority of crime in the CBD is related to minor property
offences, particularly theft. This is due to the fact that downtown area presents ample criminal
opportunity as it contains significant retail activity and office space. Most CBDs in Canada have
higher crime rates for this reason. Therefore, crime prevention strategies should be adopted
where police work in collaboration with the downtown business community to reduce theft and
other minor property offences by enhancing security and surveillance methods. The Saskatoon
Police Service currently has a ‘Business Security Program’.
In other HCAs, particularly the inner city neighbourhoods listed above, policy efforts should
focus on social development in four related areas: 1. housing quality and affordability, 2.
education and training, 3. youth programs and services and 4. Aboriginal violence. The City of
Saskatoon has initiated several Local Area Plans (LAPs), which involve community consultation
to evaluate neighbourhood issues and develop policies to guide future growth and improve
Exploring the Link between Crime and Socio-Economic Status in Ottawa and Saskatoon: A Small-Area Geographical Analysis
68 | Research and Statistics Division / Department of Justice Canada
quality of life. For example, the Pleasant Hill LAP was completed in 2002 and identified a
number of persistent problems in the neighbourhood such as a deteriorating infrastructure, poor
housing quality, poverty and increasing crime. Several recommendations were made including
investment in infrastructure and road maintenance, zoning changes to encourage commercial and
residential development, limiting the number of pawn shops, conducting a community Safety
Audit and upgrading park, recreation and heritage facilities (City of Saskatoon 2002). LAPs have
been completed for other inner city neighbourhoods including Caswell Hill and King George and
several more are either currently underway (Riversdale) or planned for the near future (City Park
and Westmount).
In addition to the LAPs, the City of Saskatoon has developed a series of housing policies.
Although the city does not own housing or manage housing programs, it is promoting affordable
housing options and is partnering with organizations, including several in the private sector, to
restore older housing units needing repair particularly in the inner city. An adequate supply of
good quality affordable housing is at the cornerstone of creating stable neighbourhoods.
With respect to community-based initiatives, the police and the city have opened several youth
drop-in centres, including one planned for Pleasant Hill and have initiated programs aimed at
discouraging youth participation in gangs. According to the Criminal Intelligence Service
Saskatchewan (2005) gangs, particularly Aboriginal gangs are a growing and serious problem in
Saskatoon as they are involved in violence, drug dealing, recruitment and intimidation and have
injected fear into inner city neighbourhoods. Efforts should to be stepped up in these
communities to provide alternatives for youth at risk of becoming involved in gangs. For
example, the work done in LAPs can be used as a catalyst for expanding youth services and
programs particularly related to parks, recreation, arts, culture and education.
However effective these programs may be in reducing levels of crime and improving quality of
life, it is clear that the City of Saskatoon needs greater assistance from higher levels of
government, particularly at the federal level. An important feature of Saskatoon, like other cities
in Western Canada, is the large in-migration of Aboriginal people from reserves and rural areas.
In most cases, the migration from reserves means Registered Indians are no longer under the
Research and Statistics Division / Department of Justice Canada | 69
jurisdiction of the federal government and the provision of social services to them becomes the
responsibility of provincial and municipal governments. As stated, research by La Prairie (2002)
indicates that certain cities, including Saskatoon, are high contributors to Aboriginal over-
representation in the justice system. The federal government should expand its Urban Aboriginal
Strategy (UAS) to provide additional financial assistance and to work in collaboration with the
Province of Saskatchewan and the City of Saskatoon to upgrade the supply of affordable housing
and to improve education and training options especially for young inner city Aboriginals. The
UAS was introduced in 1998 and is currently involved in pilot projects in several cities including
Saskatoon. With all three levels of government acting in cooperation the goal should be to
improve the standard of living of Aboriginals and Non-Aboriginals living in disadvantaged
neighbourhoods and over time to reduce levels of violence and contact with the justice system.
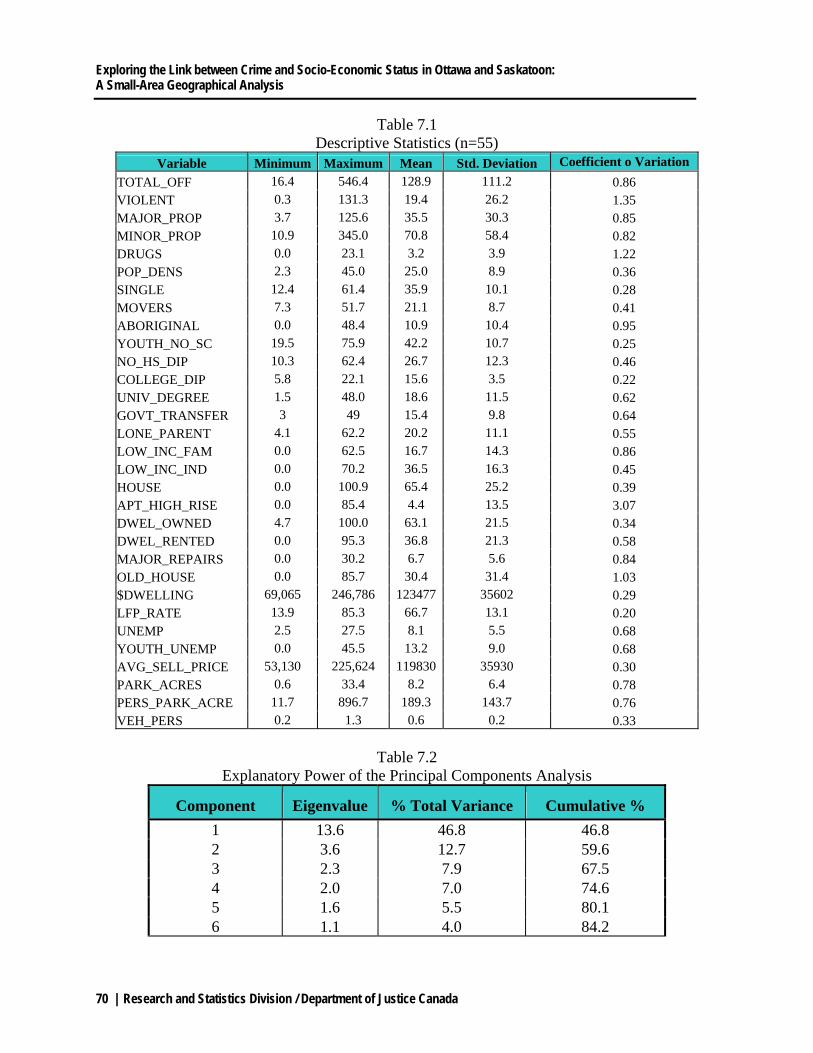
Exploring the Link between Crime and Socio-Economic Status in Ottawa and Saskatoon: A Small-Area Geographical Analysis
70 | Research and Statistics Division / Department of Justice Canada
Table 7.1 Descriptive Statistics (n=55)
Variable Minimum Maximum Mean Std. Deviation Coefficient o Variation TOTAL_OFF 16.4 546.4 128.9 111.2 0.86 VIOLENT 0.3 131.3 19.4 26.2 1.35 MAJOR_PROP 3.7 125.6 35.5 30.3 0.85 MINOR_PROP 10.9 345.0 70.8 58.4 0.82 DRUGS 0.0 23.1 3.2 3.9 1.22 POP_DENS 2.3 45.0 25.0 8.9 0.36 SINGLE 12.4 61.4 35.9 10.1 0.28 MOVERS 7.3 51.7 21.1 8.7 0.41 ABORIGINAL 0.0 48.4 10.9 10.4 0.95 YOUTH_NO_SC 19.5 75.9 42.2 10.7 0.25 NO_HS_DIP 10.3 62.4 26.7 12.3 0.46 COLLEGE_DIP 5.8 22.1 15.6 3.5 0.22 UNIV_DEGREE 1.5 48.0 18.6 11.5 0.62 GOVT_TRANSFER 3 49 15.4 9.8 0.64 LONE_PARENT 4.1 62.2 20.2 11.1 0.55 LOW_INC_FAM 0.0 62.5 16.7 14.3 0.86 LOW_INC_IND 0.0 70.2 36.5 16.3 0.45 HOUSE 0.0 100.9 65.4 25.2 0.39 APT_HIGH_RISE 0.0 85.4 4.4 13.5 3.07 DWEL_OWNED 4.7 100.0 63.1 21.5 0.34 DWEL_RENTED 0.0 95.3 36.8 21.3 0.58 MAJOR_REPAIRS 0.0 30.2 6.7 5.6 0.84 OLD_HOUSE 0.0 85.7 30.4 31.4 1.03 $DWELLING 69,065 246,786 123477 35602 0.29 LFP_RATE 13.9 85.3 66.7 13.1 0.20 UNEMP 2.5 27.5 8.1 5.5 0.68 YOUTH_UNEMP 0.0 45.5 13.2 9.0 0.68 AVG_SELL_PRICE 53,130 225,624 119830 35930 0.30 PARK_ACRES 0.6 33.4 8.2 6.4 0.78 PERS_PARK_ACRE 11.7 896.7 189.3 143.7 0.76 VEH_PERS 0.2 1.3 0.6 0.2 0.33
Table 7.2
Explanatory Power of the Principal Components Analysis
Component Eigenvalue % Total Variance Cumulative % 1 13.6 46.8 46.8 2 3.6 12.7 59.6 3 2.3 7.9 67.5 4 2.0 7.0 74.6 5 1.6 5.5 80.1 6 1.1 4.0 84.2
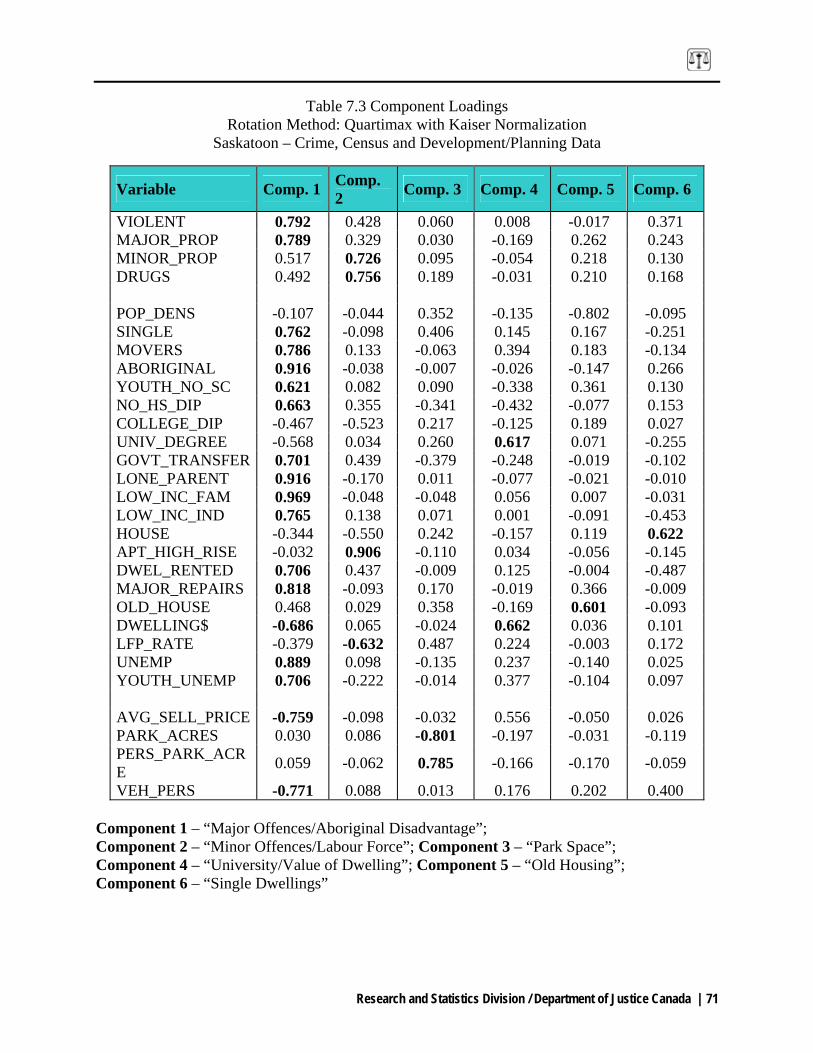
Research and Statistics Division / Department of Justice Canada | 71
Table 7.3 Component Loadings Rotation Method: Quartimax with Kaiser Normalization
Saskatoon – Crime, Census and Development/Planning Data
Variable Comp. 1 Comp. 2 Comp. 3 Comp. 4 Comp. 5 Comp. 6
VIOLENT 0.792 0.428 0.060 0.008 -0.017 0.371 MAJOR_PROP 0.789 0.329 0.030 -0.169 0.262 0.243 MINOR_PROP 0.517 0.726 0.095 -0.054 0.218 0.130 DRUGS 0.492 0.756 0.189 -0.031 0.210 0.168 POP_DENS -0.107 -0.044 0.352 -0.135 -0.802 -0.095 SINGLE 0.762 -0.098 0.406 0.145 0.167 -0.251 MOVERS 0.786 0.133 -0.063 0.394 0.183 -0.134 ABORIGINAL 0.916 -0.038 -0.007 -0.026 -0.147 0.266 YOUTH_NO_SC 0.621 0.082 0.090 -0.338 0.361 0.130 NO_HS_DIP 0.663 0.355 -0.341 -0.432 -0.077 0.153 COLLEGE_DIP -0.467 -0.523 0.217 -0.125 0.189 0.027 UNIV_DEGREE -0.568 0.034 0.260 0.617 0.071 -0.255 GOVT_TRANSFER 0.701 0.439 -0.379 -0.248 -0.019 -0.102 LONE_PARENT 0.916 -0.170 0.011 -0.077 -0.021 -0.010 LOW_INC_FAM 0.969 -0.048 -0.048 0.056 0.007 -0.031 LOW_INC_IND 0.765 0.138 0.071 0.001 -0.091 -0.453 HOUSE -0.344 -0.550 0.242 -0.157 0.119 0.622 APT_HIGH_RISE -0.032 0.906 -0.110 0.034 -0.056 -0.145 DWEL_RENTED 0.706 0.437 -0.009 0.125 -0.004 -0.487 MAJOR_REPAIRS 0.818 -0.093 0.170 -0.019 0.366 -0.009 OLD_HOUSE 0.468 0.029 0.358 -0.169 0.601 -0.093 DWELLING$ -0.686 0.065 -0.024 0.662 0.036 0.101 LFP_RATE -0.379 -0.632 0.487 0.224 -0.003 0.172 UNEMP 0.889 0.098 -0.135 0.237 -0.140 0.025 YOUTH_UNEMP 0.706 -0.222 -0.014 0.377 -0.104 0.097 AVG_SELL_PRICE -0.759 -0.098 -0.032 0.556 -0.050 0.026 PARK_ACRES 0.030 0.086 -0.801 -0.197 -0.031 -0.119 PERS_PARK_ACRE 0.059 -0.062 0.785 -0.166 -0.170 -0.059
VEH_PERS -0.771 0.088 0.013 0.176 0.202 0.400 Component 1 – “Major Offences/Aboriginal Disadvantage”; Component 2 – “Minor Offences/Labour Force”; Component 3 – “Park Space”; Component 4 – “University/Value of Dwelling”; Component 5 – “Old Housing”; Component 6 – “Single Dwellings”

Exploring the Link between Crime and Socio-Economic Status in Ottawa and Saskatoon: A Small-Area Geographical Analysis
72 | Research and Statistics Division / Department of Justice Canada
Table 7.4 Results of Multiple Regression – Saskatoon Neighbourhoods (n=55)*
Regression # 1 Regression # 2 Dependent Variable
Total Offences
Dependent Variable
Violent Offences
R R2 Adjusted R2
.831
.690
.666
R R2 Adjusted R2
.852
.726
.715 Independent Variables (beta coefficients)
Independent Variables (beta coefficients)
YOUTH_NO_SC SINGLE GOVT_TRANSFER APT_HIGH_RISE
.284
.302
.339
.327
ABORIGINAL GOVT_TRANSFER
.651
.284
Regression # 3 Regression # 4 Dependent Variable
Major Property Offences
Dependent Variable
Minor Property Offences
R R2 Adjusted R2
.843
.710
.693
R R2 Adjusted R2
.786
.618
.596 Independent Variables (beta coefficients)
Independent Variables (beta coefficients)
AVG_SELL_PRICE MOVERS OLD_HOUSE
-.521 .345 .180
APT_HIGH_RISE YOUTH_NO_SC DWEL_RENTED
.448
.399
.251 Regression # 5 Dependent Variable
Drug Offences
R R2 Adjusted R2
.830
.688
.670 Independent Variables (beta coefficients)
APT_HIGH_RISE LOW_INC_FAM YOUTH_NO_SC
.637
.308
.291
* p<0.01, all beta coefficients are significant at the 99% confidence level.
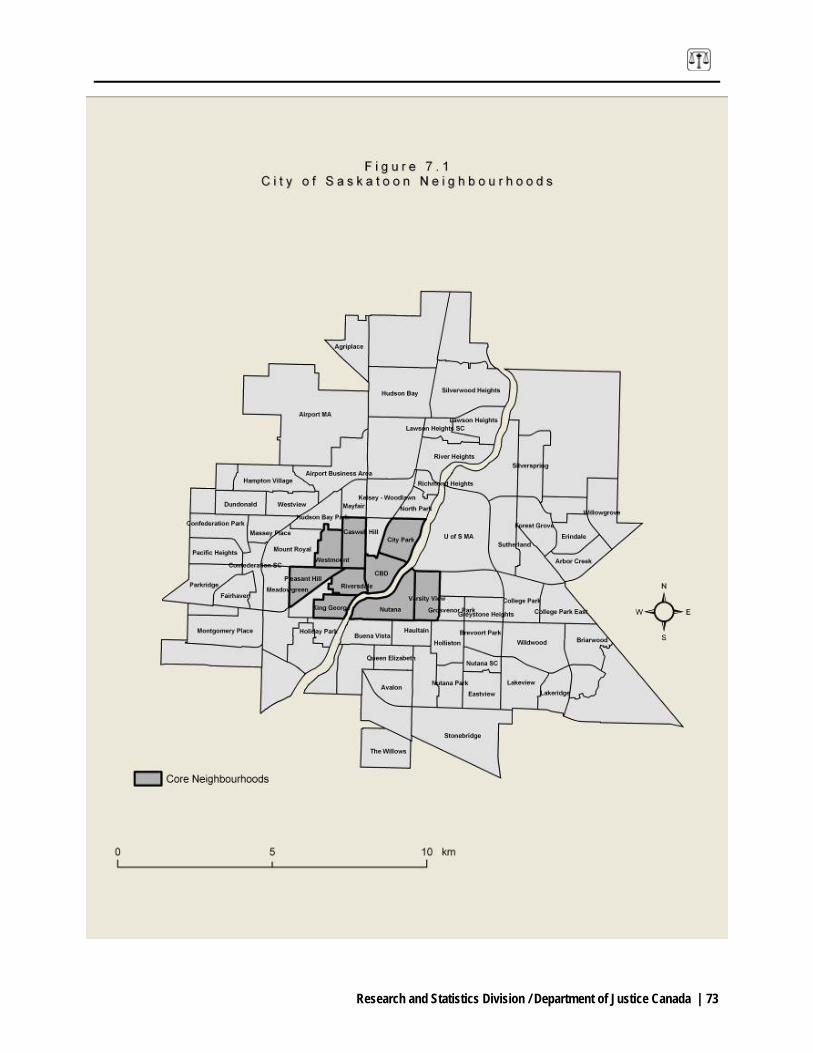
Research and Statistics Division / Department of Justice Canada | 73
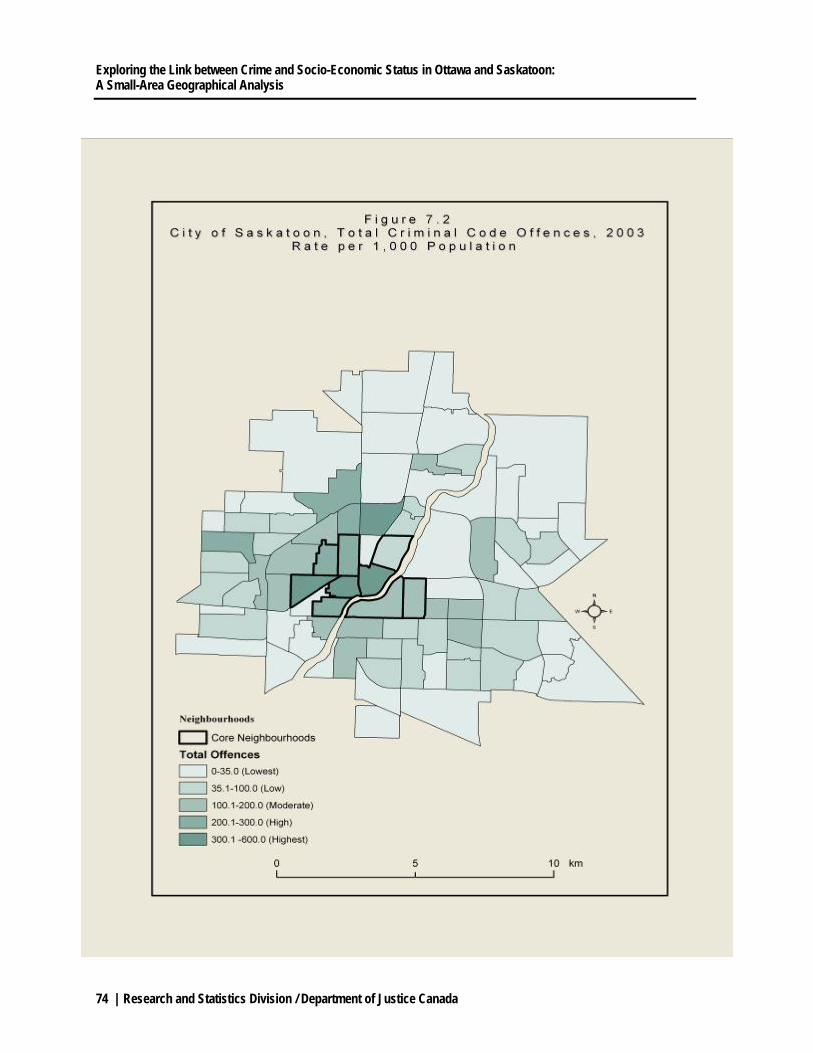
Exploring the Link between Crime and Socio-Economic Status in Ottawa and Saskatoon: A Small-Area Geographical Analysis
74 | Research and Statistics Division / Department of Justice Canada

Research and Statistics Division / Department of Justice Canada | 75
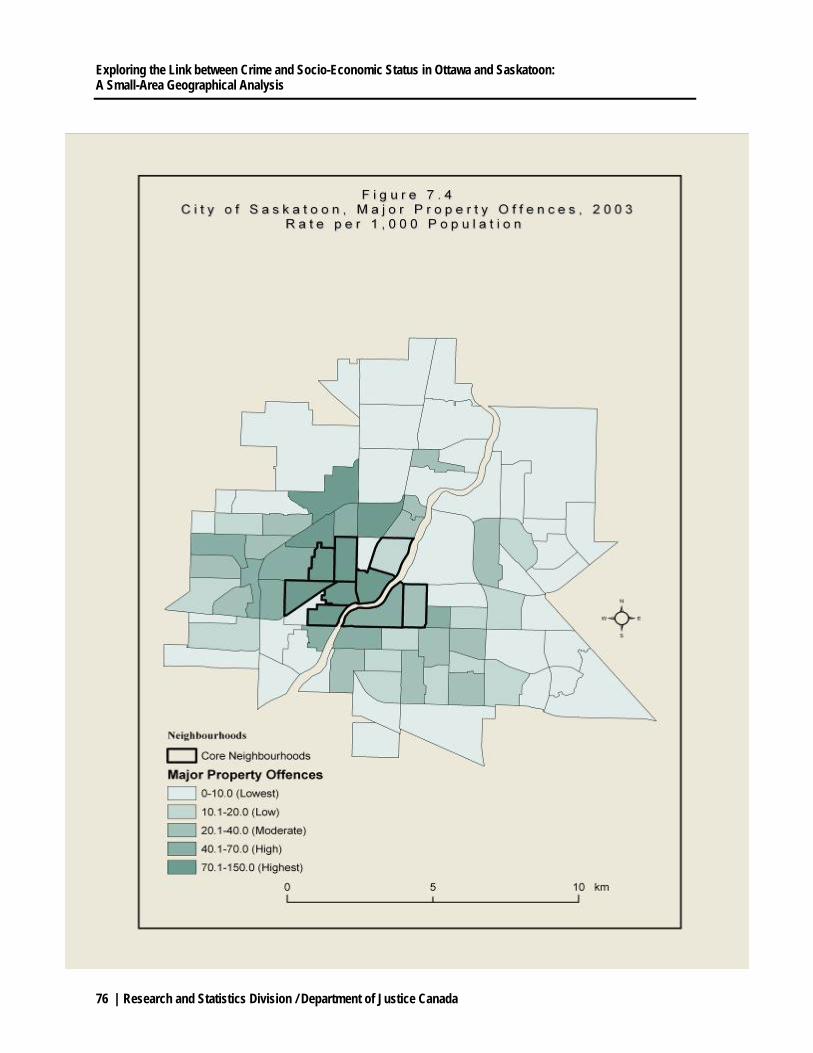
Exploring the Link between Crime and Socio-Economic Status in Ottawa and Saskatoon: A Small-Area Geographical Analysis
76 | Research and Statistics Division / Department of Justice Canada
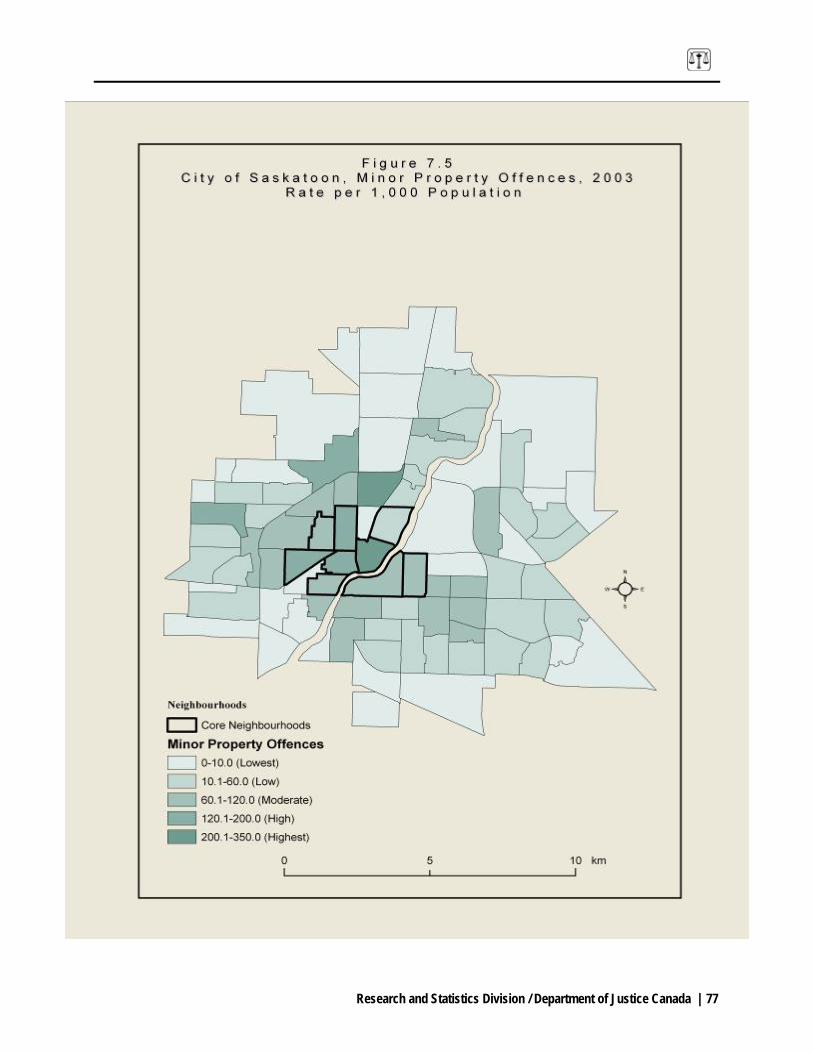
Research and Statistics Division / Department of Justice Canada | 77
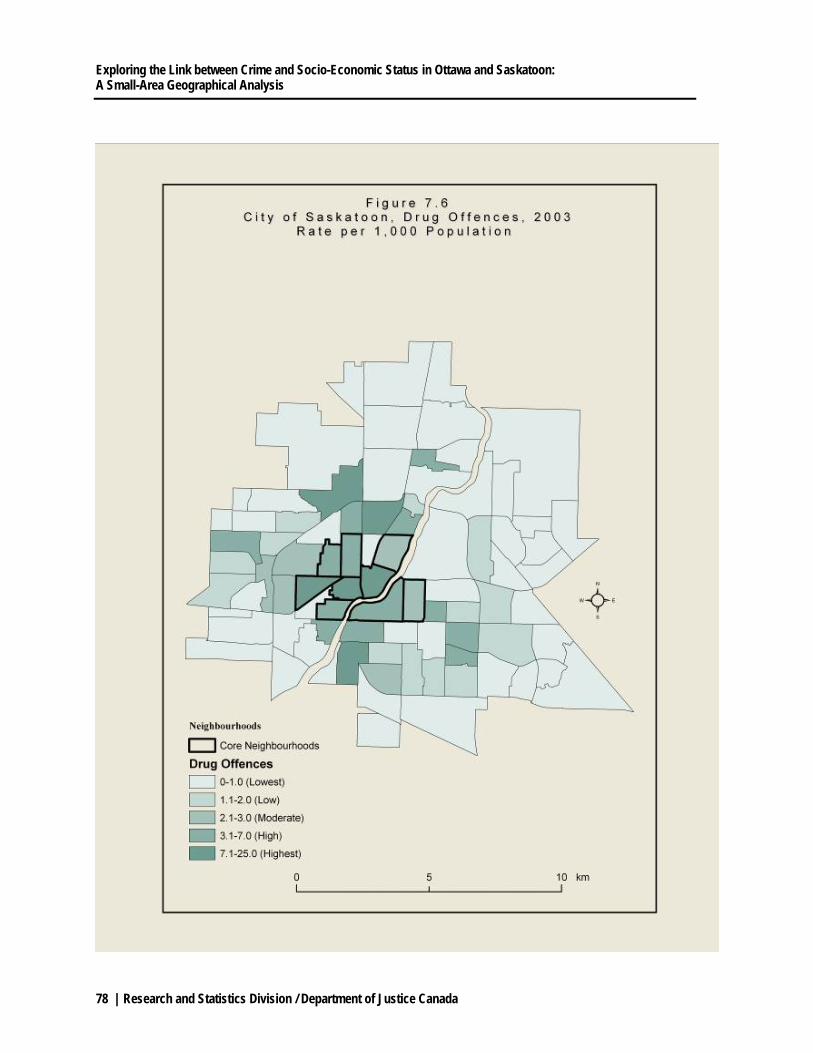
Exploring the Link between Crime and Socio-Economic Status in Ottawa and Saskatoon: A Small-Area Geographical Analysis
78 | Research and Statistics Division / Department of Justice Canada
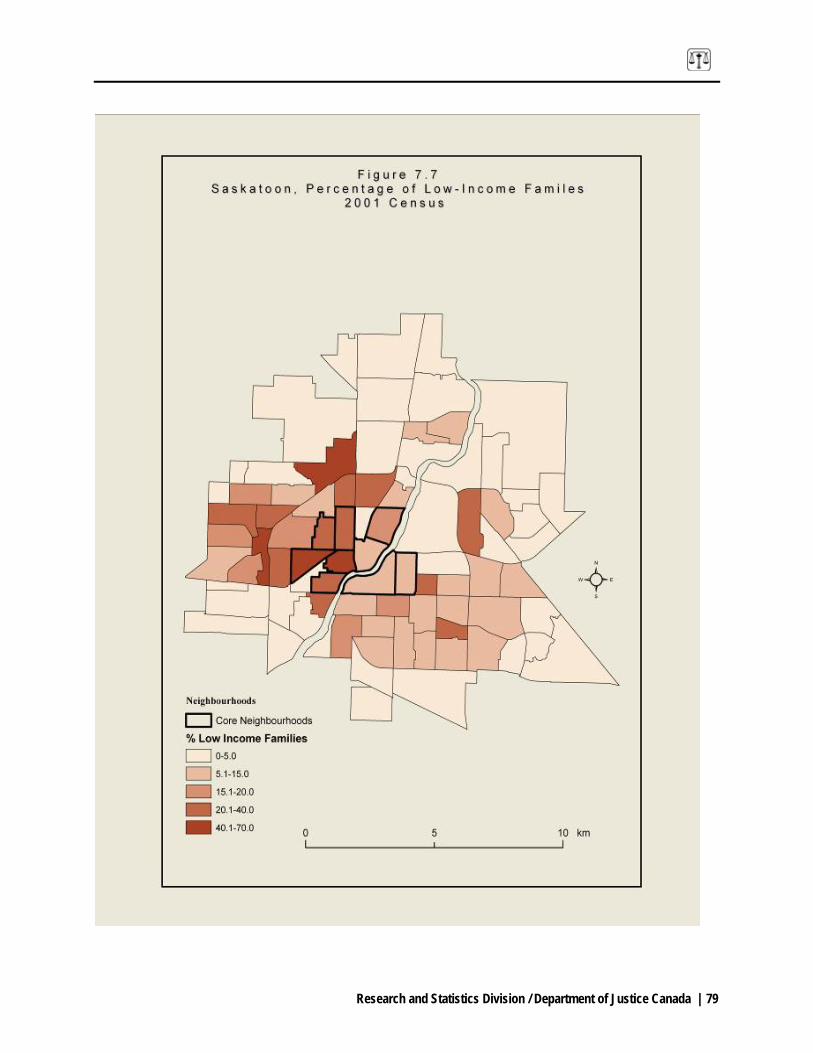
Research and Statistics Division / Department of Justice Canada | 79

Exploring the Link between Crime and Socio-Economic Status in Ottawa and Saskatoon: A Small-Area Geographical Analysis
80 | Research and Statistics Division / Department of Justice Canada
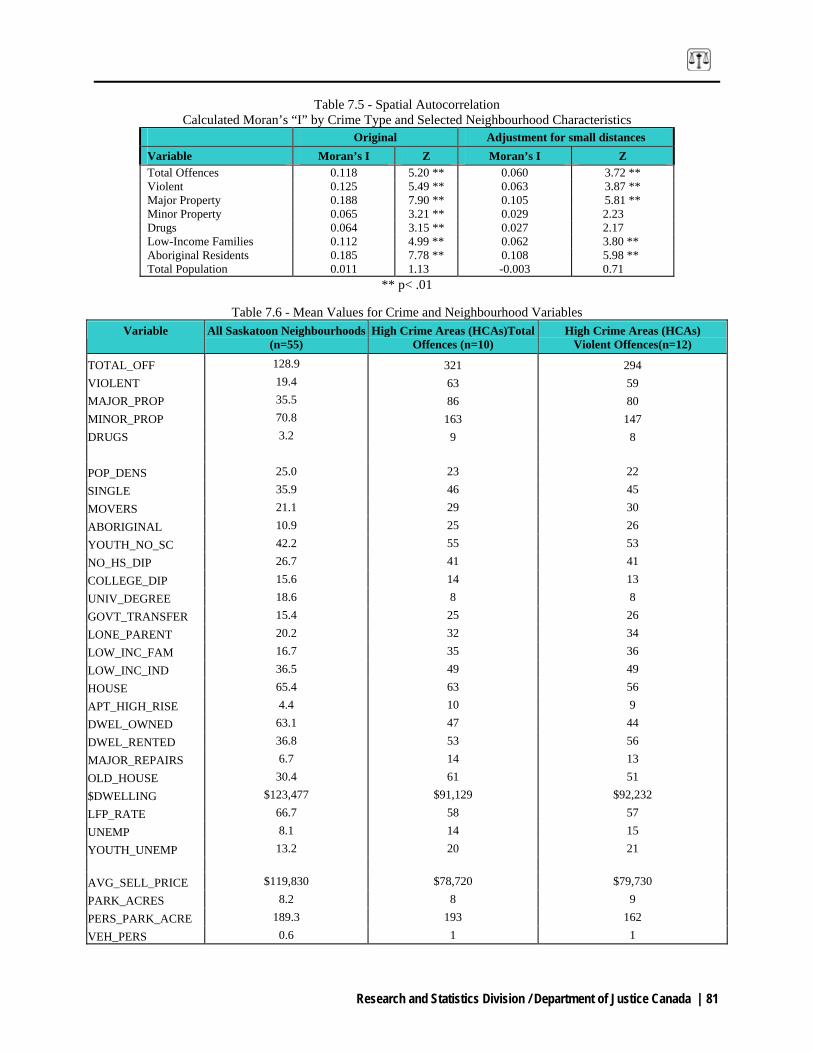
Research and Statistics Division / Department of Justice Canada | 81
Table 7.5 - Spatial Autocorrelation Calculated Moran’s “I” by Crime Type and Selected Neighbourhood Characteristics
Original Adjustment for small distances Variable Moran’s I Z Moran’s I Z Total Offences 0.118 5.20 ** 0.060 3.72 ** Violent 0.125 5.49 ** 0.063 3.87 ** Major Property 0.188 7.90 ** 0.105 5.81 ** Minor Property 0.065 3.21 ** 0.029 2.23 Drugs 0.064 3.15 ** 0.027 2.17 Low-Income Families 0.112 4.99 ** 0.062 3.80 ** Aboriginal Residents 0.185 7.78 ** 0.108 5.98 ** Total Population 0.011 1.13 -0.003 0.71
** p< .01
Table 7.6 - Mean Values for Crime and Neighbourhood Variables Variable All Saskatoon Neighbourhoods
(n=55) High Crime Areas (HCAs)Total
Offences (n=10) High Crime Areas (HCAs)
Violent Offences(n=12)
TOTAL_OFF 128.9 321 294 VIOLENT 19.4 63 59 MAJOR_PROP 35.5 86 80 MINOR_PROP 70.8 163 147 DRUGS 3.2 9 8 POP_DENS 25.0 23 22 SINGLE 35.9 46 45 MOVERS 21.1 29 30 ABORIGINAL 10.9 25 26 YOUTH_NO_SC 42.2 55 53 NO_HS_DIP 26.7 41 41 COLLEGE_DIP 15.6 14 13 UNIV_DEGREE 18.6 8 8 GOVT_TRANSFER 15.4 25 26 LONE_PARENT 20.2 32 34 LOW_INC_FAM 16.7 35 36 LOW_INC_IND 36.5 49 49 HOUSE 65.4 63 56 APT_HIGH_RISE 4.4 10 9 DWEL_OWNED 63.1 47 44 DWEL_RENTED 36.8 53 56 MAJOR_REPAIRS 6.7 14 13 OLD_HOUSE 30.4 61 51 $DWELLING $123,477 $91,129 $92,232 LFP_RATE 66.7 58 57 UNEMP 8.1 14 15 YOUTH_UNEMP 13.2 20 21 AVG_SELL_PRICE $119,830 $78,720 $79,730 PARK_ACRES 8.2 8 9 PERS_PARK_ACRE 189.3 193 162 VEH_PERS 0.6 1 1
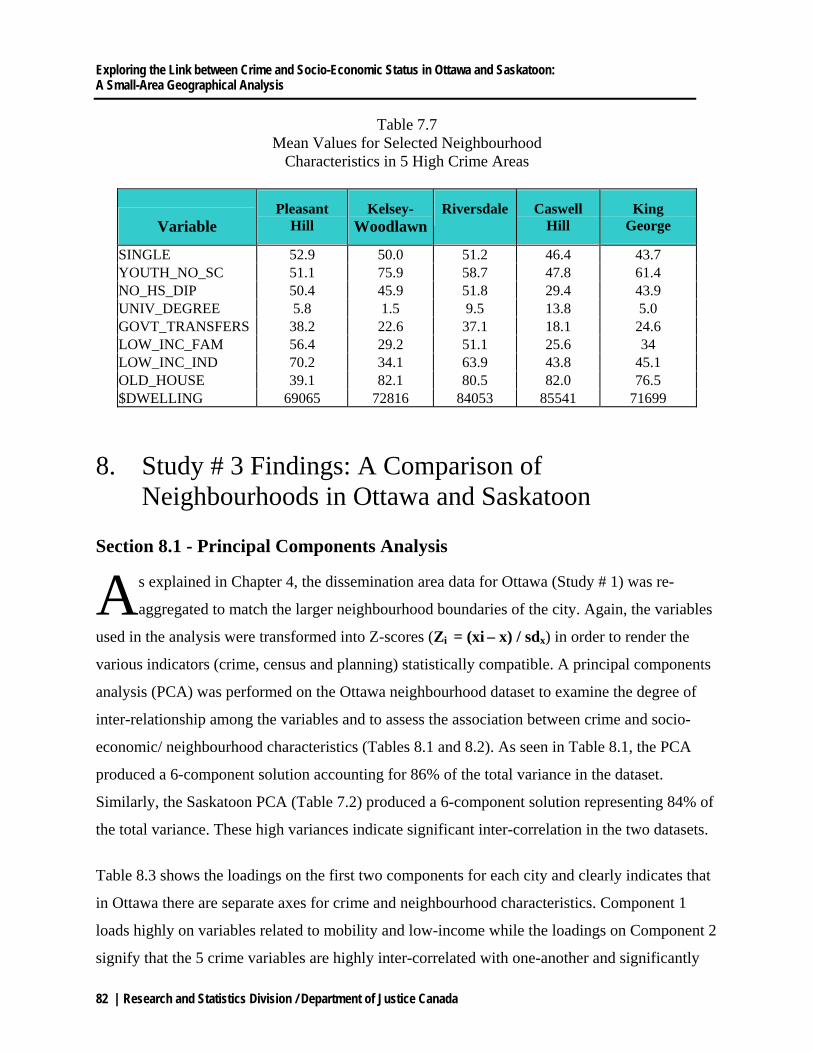
Exploring the Link between Crime and Socio-Economic Status in Ottawa and Saskatoon: A Small-Area Geographical Analysis
82 | Research and Statistics Division / Department of Justice Canada
Table 7.7 Mean Values for Selected Neighbourhood
Characteristics in 5 High Crime Areas
Variable Pleasant
Hill Kelsey-
WoodlawnRiversdale Caswell
Hill King
George
SINGLE 52.9 50.0 51.2 46.4 43.7 YOUTH_NO_SC 51.1 75.9 58.7 47.8 61.4 NO_HS_DIP 50.4 45.9 51.8 29.4 43.9 UNIV_DEGREE 5.8 1.5 9.5 13.8 5.0 GOVT_TRANSFERS 38.2 22.6 37.1 18.1 24.6 LOW_INC_FAM 56.4 29.2 51.1 25.6 34 LOW_INC_IND 70.2 34.1 63.9 43.8 45.1 OLD_HOUSE 39.1 82.1 80.5 82.0 76.5 $DWELLING 69065 72816 84053 85541 71699
8. Study # 3 Findings: A Comparison of Neighbourhoods in Ottawa and Saskatoon
Section 8.1 - Principal Components Analysis
s explained in Chapter 4, the dissemination area data for Ottawa (Study # 1) was re-
aggregated to match the larger neighbourhood boundaries of the city. Again, the variables
used in the analysis were transformed into Z-scores (Zi = (xi – x) / sdx) in order to render the
various indicators (crime, census and planning) statistically compatible. A principal components
analysis (PCA) was performed on the Ottawa neighbourhood dataset to examine the degree of
inter-relationship among the variables and to assess the association between crime and socio-
economic/ neighbourhood characteristics (Tables 8.1 and 8.2). As seen in Table 8.1, the PCA
produced a 6-component solution accounting for 86% of the total variance in the dataset.
Similarly, the Saskatoon PCA (Table 7.2) produced a 6-component solution representing 84% of
the total variance. These high variances indicate significant inter-correlation in the two datasets.
Table 8.3 shows the loadings on the first two components for each city and clearly indicates that
in Ottawa there are separate axes for crime and neighbourhood characteristics. Component 1
loads highly on variables related to mobility and low-income while the loadings on Component 2
signify that the 5 crime variables are highly inter-correlated with one-another and significantly
A
Research and Statistics Division / Department of Justice Canada | 83
associated with only one of the 26 socio-economic variables - youth not attending school.
However, Table 8.3 reveals that in Saskatoon there is a strong association between crime and
neighbourhood characteristics. Component 1 loads highly and positively on violent and major
property crimes and a number of socio-economic dimensions most notably Aboriginal residents,
lone-parent families and low-income families. Component 2 highlights the association between
minor property and drug offences in neighbourhoods with high-rise apartments and low rates of
labour force participation.
Section 8.2 - Multiple Regression Analysis
A series of stepwise multiple regression analyses were performed on the Ottawa and Saskatoon
datasets to examine the strength and intensity of the relationship between crime (the dependent
variable) and socio-economic conditions (the independent variables). With respect to Ottawa’s
neighbourhooods (n=50), Table 8.4 provides a summary of the results by showing the
coefficients of multiple determination (R2) and the significant independent variables for each
regression model. It reveals several differences in the relationship between crime and socio-
economic conditions in the two cities. In Ottawa, at the neighbourhood level, there is a moderate
statistical association between the two dimensions with the crime variables having R2 values
ranging from a low of 0.269 for drug offences to a high of 0.638 for major property offences.
Several of the independent variables have significant beta coefficients. Most notably, the
variables ‘youth not attending school’ and ‘single’ appear to be the best predictors of overall
rates of crime as well as certain types of offences. The table shows that ‘youth not attending
school’ is a significant independent variable for each of the 6 crime variables and is the only
significant predictor of violent crime. In addition, the variable ‘average household income’ is a
significant predictor of crime related to total offences, major property offences and
disturbance/other offences.
By comparison, Table 8.5 shows that in Saskatoon there is a stronger association between crime
and socio-economic conditions with each of the 5 regression analyses yielding relatively high R2
values (ranging from a low of 0.618 for minor property offences to a high of 0.726 for violent
offences). The variable measuring government transfers, which reflects the level of social
assistance received by residents, was found to be the most important predictor of overall crime in

Exploring the Link between Crime and Socio-Economic Status in Ottawa and Saskatoon: A Small-Area Geographical Analysis
84 | Research and Statistics Division / Department of Justice Canada
the city’s neighbourhoods. Similar to the situation in Ottawa, the regression models for
Saskatoon reveal that the variable denoting ‘youth not attending school’ is a significant predictor
of overall crime as well as minor property and drug offences. However, as indicated in Study # 2,
perhaps the most troubling finding to emerge from the Saskatoon analysis is the strong
association between violent crime and Aboriginal people. The high R2 value (.726) and the high
beta coefficient in the model suggest that Aboriginal people are most likely to be the victims in
neighbourhoods with high rates of violent crime.
Section 8.3 - Geographic Patterns of Crime in Ottawa and Saskatoon’s Neighbourhoods
ArcGIS was used to produce a series of maps showing the spatial distribution of crime and
neighbourhood characteristics in Ottawa. As displayed in Figures 8.1 and 8.2, High Crime Areas
(HCAs) are concentrated within the built-up central core and suburbs, with no HCAs visible in
the outer and rural parts of the city. (HCAs are defined as neighbourhoods with crime rates in the
‘High’ and ‘Highest’ categories on the maps). However, it is also apparent that within the urban
core, there is a fairly dispersed pattern of HCAs. The four communities with the ‘Highest’ crime
rates (above 100 offences per 1,000 population) are the inner city neighbourhoods of Centre
Town, Lower Town and Overbrook as well as Clementine located just west of Alta Vista. A
number of neighbourhoods with ‘High’ crime rates are located within and immediately
surrounding the inner city, including Vanier, Riverview/Hawthorne, Carleton Heights, Ottawa
West and Dalhousie. Figure 8.1 also reveals a band of suburban neighbourhoods in the western
part of the city with ‘High’ crime rates including Glencairn, Nepean West, Nepean North, Bells
Corners and Pinecrest/Queensway. Figure 8.2 shows that violent HCAs in the city have a similar
geographic pattern. The three neighbourhoods with the ‘Highest’ rates of violent offences are in
the inner city – Vanier, Lower Town and Centre Town. HCAs in Ottawa exhibit certain socio-
economic characteristics. Table 8.6 indicates that they have significantly higher population
densities, greater proportions of visible minorities, single people, renters, residents living in high
and low-rise apartments and people living in low-income.
As seen in Study # 2 of Saskatoon, HCAs are clustered in the core area. They are particularly
visible in the inner city on the west side of the South Saskatchewan River and also correspond
Research and Statistics Division / Department of Justice Canada | 85
with socio-economically disadvantaged neighbourhoods. A distinguishing geographic feature of
Saskatoon is a tight clustering of violent HCAs all located in the west side of the city with most
having high proportions of Aboriginal residents, including Pleasant Hill, Riversdale,
Confederation Suburban Centre and Meadowgreen. However, as was emphasized in the
Saskatoon study, only three of the city’s neighbourhoods have Aboriginal populations greater
than 30% and none have more than 50%. This fact suggests that ethnic segregation is not a major
feature of Saskatoon and that issues of crime and victimization effect a wider segment of the
city’s population. Several of the neighbourhood characteristics of HCAs are similar to those
found in Ottawa including larger proportions of singles, renters and low-income residents. One
important difference, however, is the presence of older and lower quality housing in Saskatoon’s
HCAs, particularly those in the inner city.
Section 8.4 - Discussion
This study provided a brief comparison of crime and neighbourhood characteristics in Ottawa
and Saskatoon. It found that Saskatoon has a substantially higher rate of crime than Ottawa and,
overall, has a higher incidence of socio-economic disadvantage. The initial Ottawa analysis
(Study # 1) employed data at the level of the dissemination area and found that there is a weak
association between crime and socio-economic status in the city. The re-analysis of the data at
the neighbourhood level in Ottawa demonstrated that a change in geography does have an impact
on the statistical ‘strength’ of this relationship. Several indicators were found to have a
significant effect on crime levels in the city’s neighbourhoods including higher proportions of
single people and youth not attending school as well as lower average household incomes.
The geographic analysis showed a fairly dispersed pattern of High Crime Areas (HCAs) within
Ottawa’s urban core including a noticeable presence in several of the city’s western
suburban neighbourhoods.
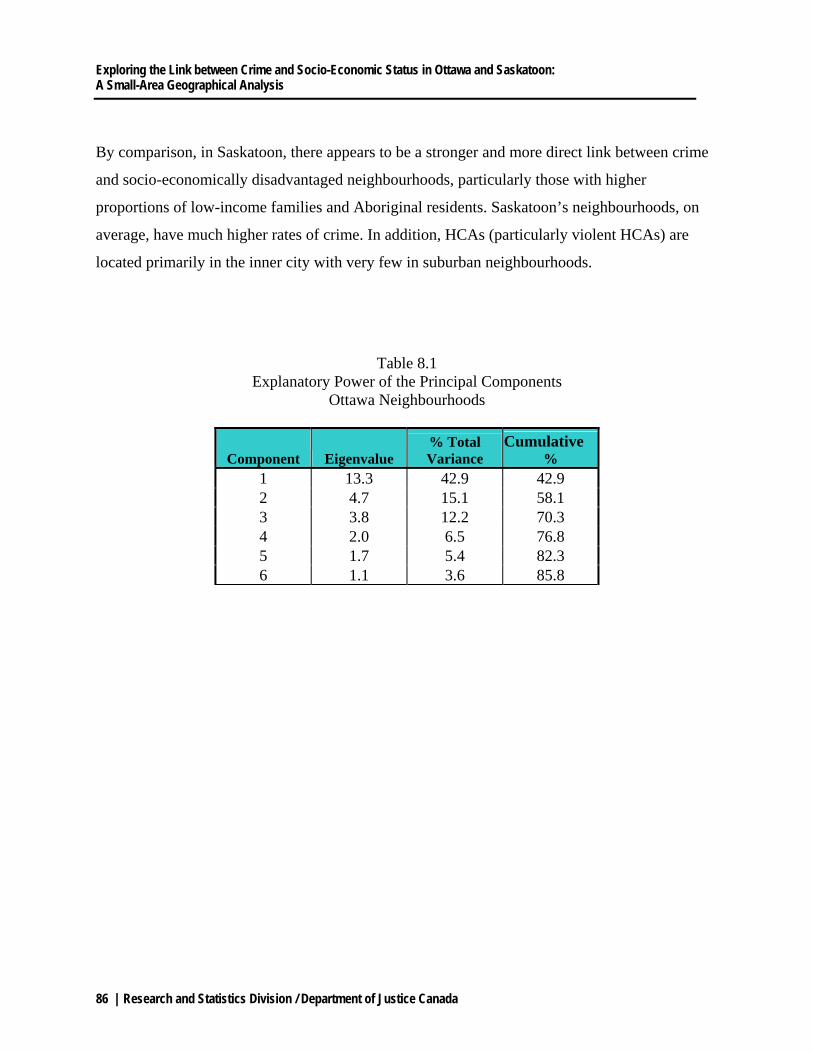
Exploring the Link between Crime and Socio-Economic Status in Ottawa and Saskatoon: A Small-Area Geographical Analysis
86 | Research and Statistics Division / Department of Justice Canada
By comparison, in Saskatoon, there appears to be a stronger and more direct link between crime
and socio-economically disadvantaged neighbourhoods, particularly those with higher
proportions of low-income families and Aboriginal residents. Saskatoon’s neighbourhoods, on
average, have much higher rates of crime. In addition, HCAs (particularly violent HCAs) are
located primarily in the inner city with very few in suburban neighbourhoods.
Table 8.1 Explanatory Power of the Principal Components
Ottawa Neighbourhoods
Component Eigenvalue % Total Variance
Cumulative %
1 13.3 42.9 42.9 2 4.7 15.1 58.1 3 3.8 12.2 70.3 4 2.0 6.5 76.8 5 1.7 5.4 82.3 6 1.1 3.6 85.8
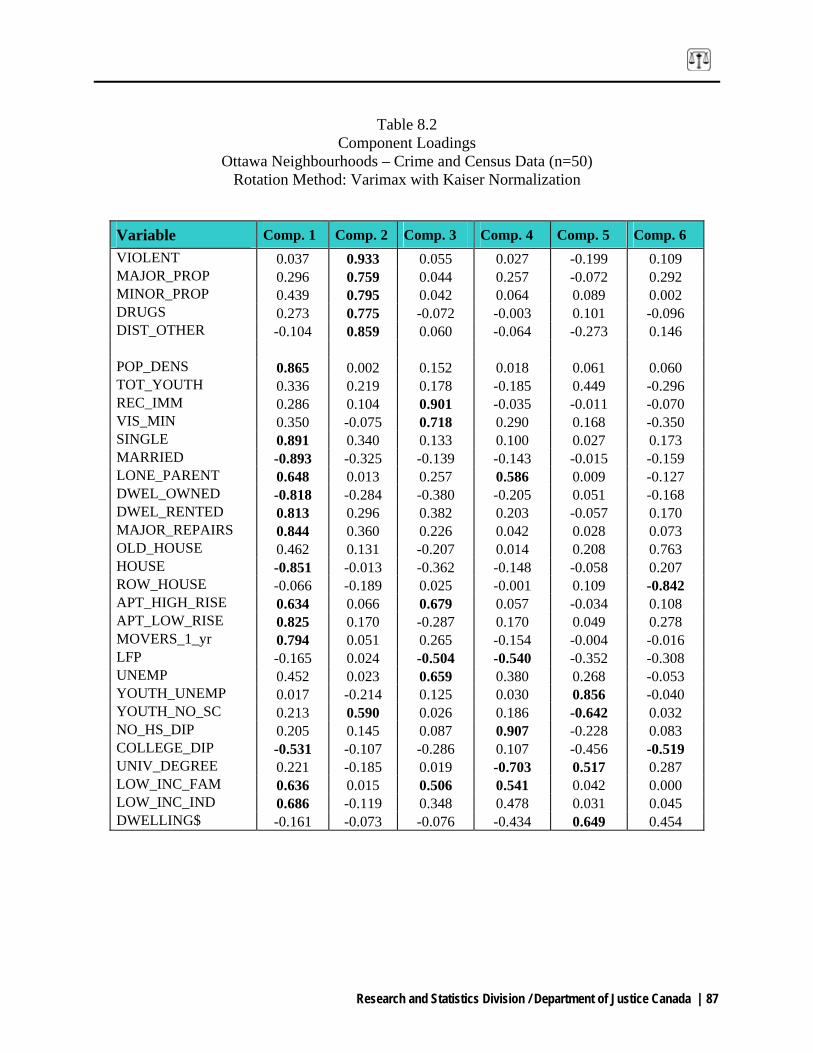
Research and Statistics Division / Department of Justice Canada | 87
Table 8.2
Component Loadings Ottawa Neighbourhoods – Crime and Census Data (n=50)
Rotation Method: Varimax with Kaiser Normalization
Variable Comp. 1 Comp. 2 Comp. 3 Comp. 4 Comp. 5 Comp. 6 VIOLENT 0.037 0.933 0.055 0.027 -0.199 0.109 MAJOR_PROP 0.296 0.759 0.044 0.257 -0.072 0.292 MINOR_PROP 0.439 0.795 0.042 0.064 0.089 0.002 DRUGS 0.273 0.775 -0.072 -0.003 0.101 -0.096 DIST_OTHER -0.104 0.859 0.060 -0.064 -0.273 0.146 POP_DENS 0.865 0.002 0.152 0.018 0.061 0.060 TOT_YOUTH 0.336 0.219 0.178 -0.185 0.449 -0.296 REC_IMM 0.286 0.104 0.901 -0.035 -0.011 -0.070 VIS_MIN 0.350 -0.075 0.718 0.290 0.168 -0.350 SINGLE 0.891 0.340 0.133 0.100 0.027 0.173 MARRIED -0.893 -0.325 -0.139 -0.143 -0.015 -0.159 LONE_PARENT 0.648 0.013 0.257 0.586 0.009 -0.127 DWEL_OWNED -0.818 -0.284 -0.380 -0.205 0.051 -0.168 DWEL_RENTED 0.813 0.296 0.382 0.203 -0.057 0.170 MAJOR_REPAIRS 0.844 0.360 0.226 0.042 0.028 0.073 OLD_HOUSE 0.462 0.131 -0.207 0.014 0.208 0.763 HOUSE -0.851 -0.013 -0.362 -0.148 -0.058 0.207 ROW_HOUSE -0.066 -0.189 0.025 -0.001 0.109 -0.842 APT_HIGH_RISE 0.634 0.066 0.679 0.057 -0.034 0.108 APT_LOW_RISE 0.825 0.170 -0.287 0.170 0.049 0.278 MOVERS_1_yr 0.794 0.051 0.265 -0.154 -0.004 -0.016 LFP -0.165 0.024 -0.504 -0.540 -0.352 -0.308 UNEMP 0.452 0.023 0.659 0.380 0.268 -0.053 YOUTH_UNEMP 0.017 -0.214 0.125 0.030 0.856 -0.040 YOUTH_NO_SC 0.213 0.590 0.026 0.186 -0.642 0.032 NO_HS_DIP 0.205 0.145 0.087 0.907 -0.228 0.083 COLLEGE_DIP -0.531 -0.107 -0.286 0.107 -0.456 -0.519 UNIV_DEGREE 0.221 -0.185 0.019 -0.703 0.517 0.287 LOW_INC_FAM 0.636 0.015 0.506 0.541 0.042 0.000 LOW_INC_IND 0.686 -0.119 0.348 0.478 0.031 0.045 DWELLING$ -0.161 -0.073 -0.076 -0.434 0.649 0.454
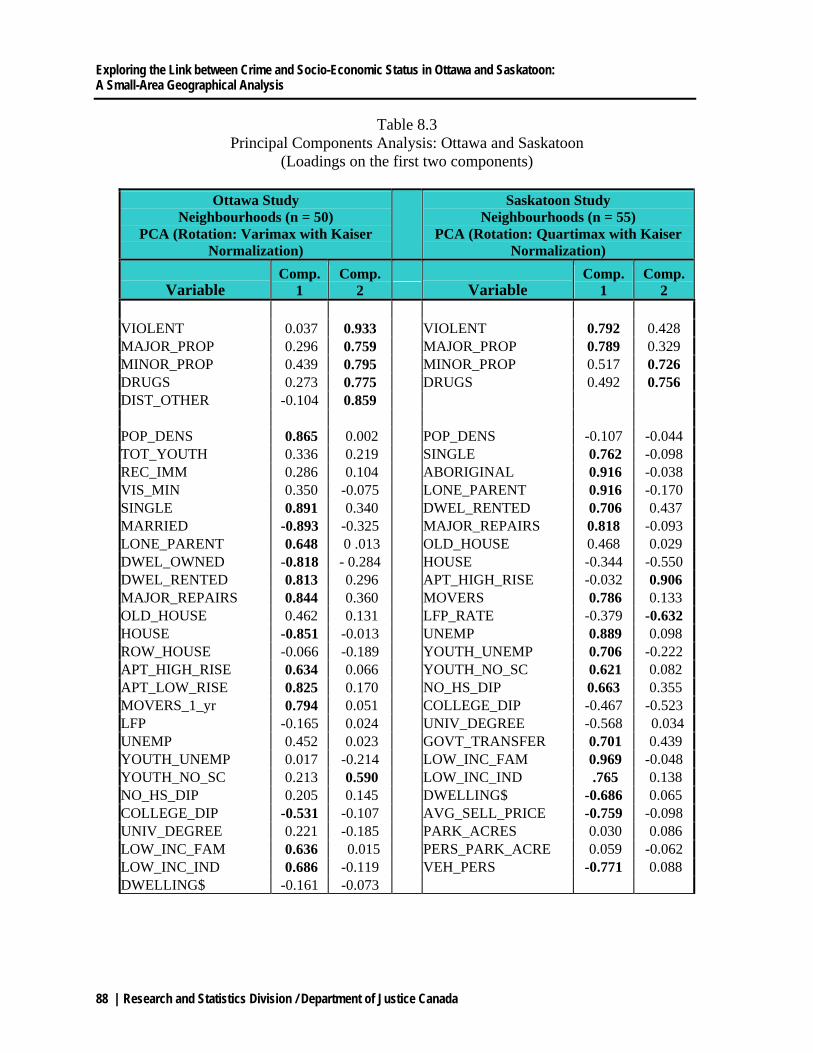
Exploring the Link between Crime and Socio-Economic Status in Ottawa and Saskatoon: A Small-Area Geographical Analysis
88 | Research and Statistics Division / Department of Justice Canada
Table 8.3 Principal Components Analysis: Ottawa and Saskatoon
(Loadings on the first two components)
Ottawa Study Neighbourhoods (n = 50)
PCA (Rotation: Varimax with Kaiser Normalization)
Saskatoon Study Neighbourhoods (n = 55)
PCA (Rotation: Quartimax with Kaiser Normalization)
Variable Comp.
1 Comp.
2 Variable Comp.
1 Comp.
2 VIOLENT 0.037 0.933 VIOLENT 0.792 0.428 MAJOR_PROP 0.296 0.759 MAJOR_PROP 0.789 0.329 MINOR_PROP 0.439 0.795 MINOR_PROP 0.517 0.726 DRUGS 0.273 0.775 DRUGS 0.492 0.756 DIST_OTHER -0.104 0.859 POP_DENS 0.865 0.002 POP_DENS -0.107 -0.044 TOT_YOUTH 0.336 0.219 SINGLE 0.762 -0.098 REC_IMM 0.286 0.104 ABORIGINAL 0.916 -0.038 VIS_MIN 0.350 -0.075 LONE_PARENT 0.916 -0.170 SINGLE 0.891 0.340 DWEL_RENTED 0.706 0.437 MARRIED -0.893 -0.325 MAJOR_REPAIRS 0.818 -0.093 LONE_PARENT 0.648 0 .013 OLD_HOUSE 0.468 0.029 DWEL_OWNED -0.818 - 0.284 HOUSE -0.344 -0.550 DWEL_RENTED 0.813 0.296 APT_HIGH_RISE -0.032 0.906 MAJOR_REPAIRS 0.844 0.360 MOVERS 0.786 0.133 OLD_HOUSE 0.462 0.131 LFP_RATE -0.379 -0.632 HOUSE -0.851 -0.013 UNEMP 0.889 0.098 ROW_HOUSE -0.066 -0.189 YOUTH_UNEMP 0.706 -0.222 APT_HIGH_RISE 0.634 0.066 YOUTH_NO_SC 0.621 0.082 APT_LOW_RISE 0.825 0.170 NO_HS_DIP 0.663 0.355 MOVERS_1_yr 0.794 0.051 COLLEGE_DIP -0.467 -0.523 LFP -0.165 0.024 UNIV_DEGREE -0.568 0.034 UNEMP 0.452 0.023 GOVT_TRANSFER 0.701 0.439 YOUTH_UNEMP 0.017 -0.214 LOW_INC_FAM 0.969 -0.048 YOUTH_NO_SC 0.213 0.590 LOW_INC_IND .765 0.138 NO_HS_DIP 0.205 0.145 DWELLING$ -0.686 0.065 COLLEGE_DIP -0.531 -0.107 AVG_SELL_PRICE -0.759 -0.098 UNIV_DEGREE 0.221 -0.185 PARK_ACRES 0.030 0.086 LOW_INC_FAM 0.636 0.015 PERS_PARK_ACRE 0.059 -0.062 LOW_INC_IND 0.686 -0.119 VEH_PERS -0.771 0.088 DWELLING$ -0.161 -0.073

Research and Statistics Division / Department of Justice Canada | 89
Table 8.4 Results of Multiple Regression – Ottawa Neighbourhoods (n=50)*
Regression # 1 Regression # 2 Dependent Variable
Total Offences
Dependent Variable
Violent Offences
R R2 Adjusted R2
0.783 0.613 0.588
R R2 Adjusted R2
0.704 0.495 0.484
Independent Variables (beta coefficients)
Independent Variables (beta coefficients)
YOUTH_NO_SC SINGLE AVG_HSLD_INC
0.669 0.562 0.406
YOUTH_NO_SC 0.704
Regression # 3 Regression # 4 Dependent Variable
Major Property Offences
Dependent Variable
Minor Property Offences
R R2 Adjusted R2
0.799 0.638 0.606
R R2 Adjusted R2
0.707 0.500 0.478
Independent Variables (beta coefficients)
Independent Variables (beta coefficients)
SINGLE YOUTH_NO_SC AVG_HSLD_INC NO_HS_DIP
0.688 0.453 0.570 0.371
SINGLE YOUTH_NO_SC
0.569 0.252
Regression # 5 Regression # 6
Dependent Variable
Drug Offences
Dependent Variable
Disturbance/ Other Offences
R R2 Adjusted R2
0.519 0.269 2.238
R R2 Adjusted R2
0.721 0.519 0.499
Independent Variables (beta coefficients)
Independent Variables (beta coefficients)
SINGLE YOUTH_NO_SC
0.325 0.297
YOUTH_NO_SC AVG_HSLD_INC
0.851 0.320
* p<0.01, all beta coefficients are significant at the 99% confidence level.
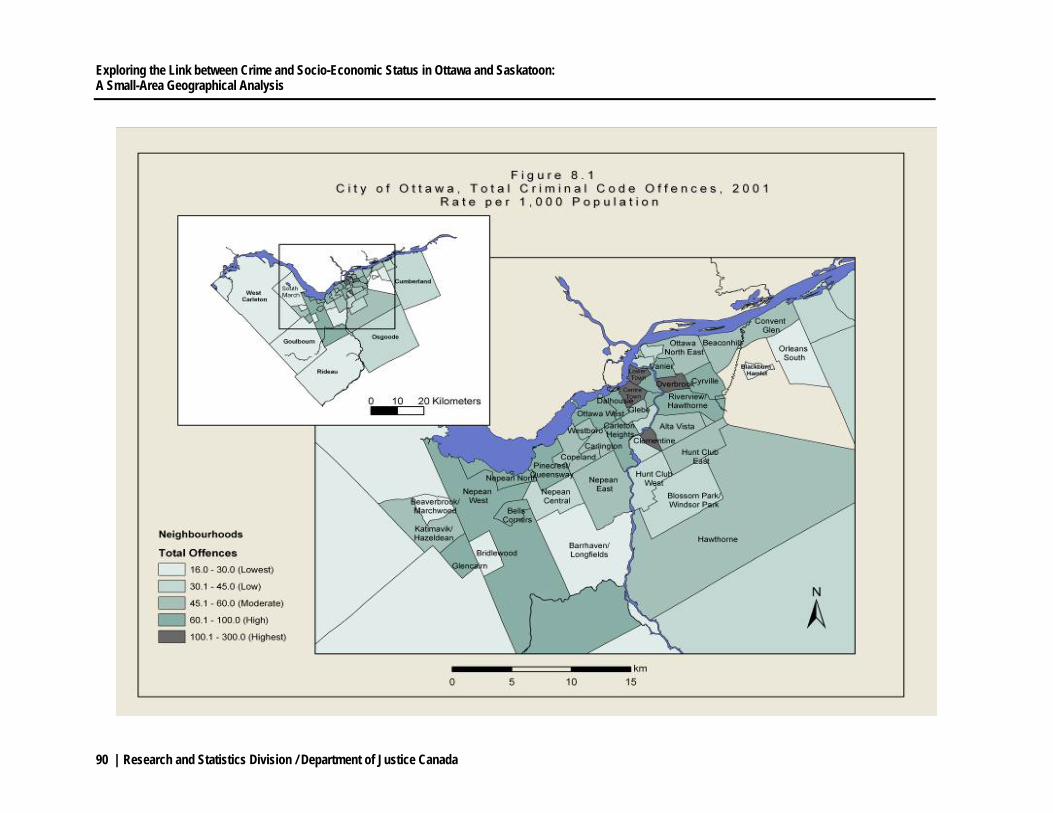
Exploring the Link between Crime and Socio-Economic Status in Ottawa and Saskatoon: A Small-Area Geographical Analysis
90 | Research and Statistics Division / Department of Justice Canada
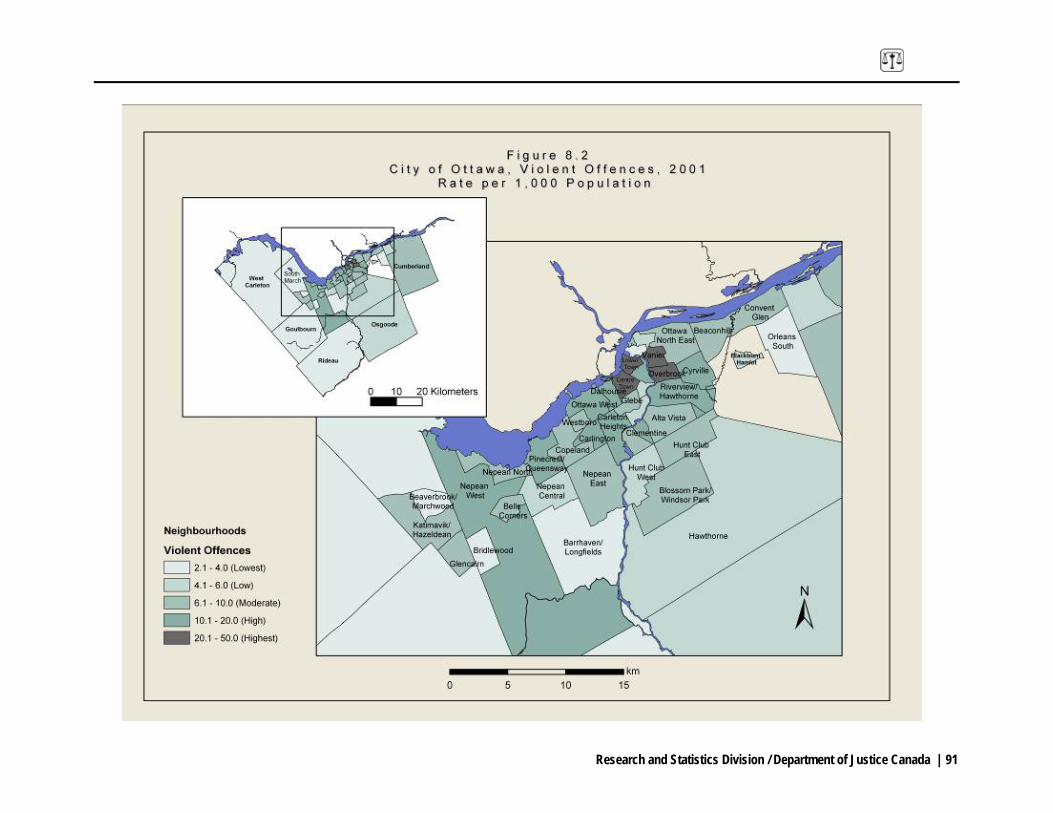
Research and Statistics Division / Department of Justice Canada | 91
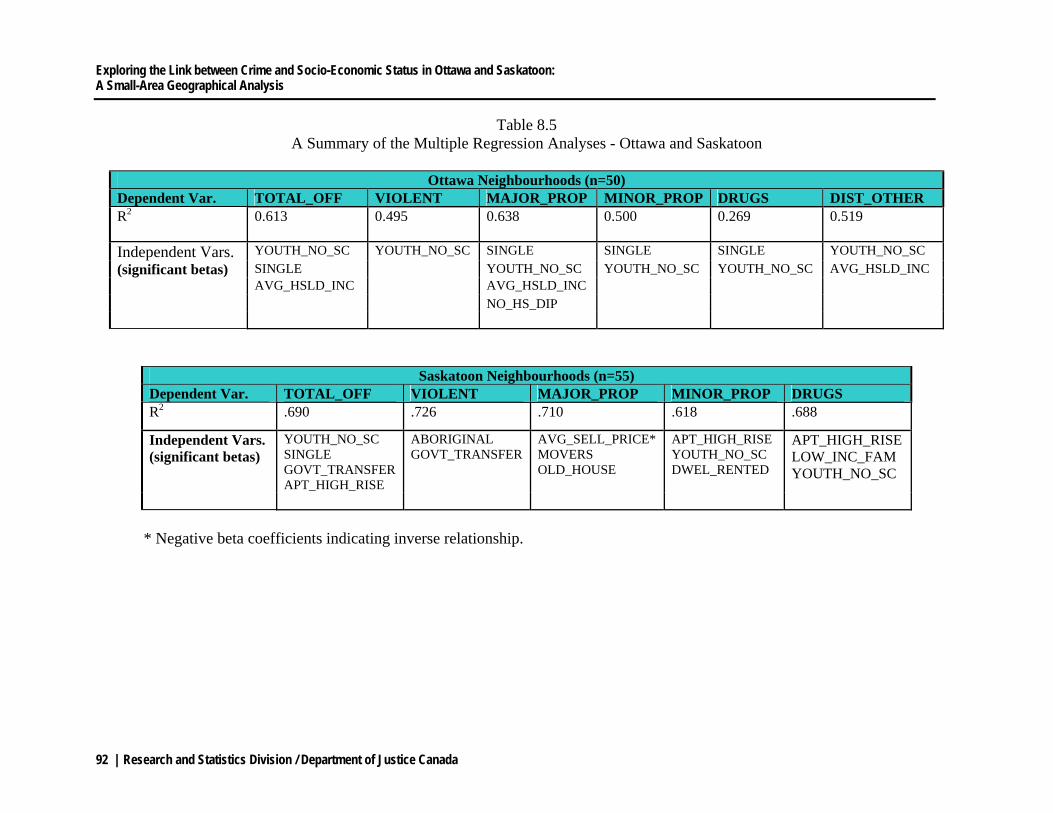
Exploring the Link between Crime and Socio-Economic Status in Ottawa and Saskatoon: A Small-Area Geographical Analysis
92 | Research and Statistics Division / Department of Justice Canada
Table 8.5 A Summary of the Multiple Regression Analyses - Ottawa and Saskatoon
Ottawa Neighbourhoods (n=50)
Dependent Var. TOTAL_OFF VIOLENT MAJOR_PROP MINOR_PROP DRUGS DIST_OTHER R2 0.613
0.495
0.638
0.500
0.269
0.519
Independent Vars. YOUTH_NO_SC YOUTH_NO_SC SINGLE SINGLE SINGLE YOUTH_NO_SC (significant betas) SINGLE YOUTH_NO_SC YOUTH_NO_SC YOUTH_NO_SC AVG_HSLD_INC AVG_HSLD_INC AVG_HSLD_INC NO_HS_DIP
Saskatoon Neighbourhoods (n=55) Dependent Var. TOTAL_OFF VIOLENT MAJOR_PROP MINOR_PROP DRUGS R2 .690 .726 .710 .618 .688
Independent Vars. (significant betas)
YOUTH_NO_SC SINGLE GOVT_TRANSFER APT_HIGH_RISE
ABORIGINAL GOVT_TRANSFER
AVG_SELL_PRICE* MOVERS OLD_HOUSE
APT_HIGH_RISE YOUTH_NO_SC DWEL_RENTED
APT_HIGH_RISE LOW_INC_FAM YOUTH_NO_SC
* Negative beta coefficients indicating inverse relationship.

Research and Statistics Division / Department of Justice Canada | 93
Table 8.6 Mean Values for Crime and Neighbourhood Variables - Ottawa
Variable All Ottawa
Neighbourhoods(n=50)
High Crime Areas (HCAs)
Total Offences (n=17)
High Crime Areas (HCAs)
Violent Offences (n=15)
TOTAL_OFF 66.5 98.4 101.3 VIOLENT 11.3 15.3 17.0 MAJOR_PROP 12.8 18.0 18.8 MINOR_PROP 34.0 54.5 53.8 DRUGS 1.8 3.2 3.5 DIST_OTHER 6.7 7.4 8.1 POP_DENS 24.4 34.9 39.4 TOT_YOUTH 13.4 14.4 14.2 REC_IMM 4.8 6.5 6.4 VIS_MIN 17.1 22.2 24.0 SINGLE 47.2 56.4 58.5 MARRIED 49.3 39.8 37.3 LONE_PARENT 15.9 19.0 21.0 DWEL_OWNED 62.8 44.0 38.8 DWEL_RENTED 37.2 55.9 61.2 MAJOR_REPAIRS 6.9 8.0 8.8 OLD_HOUSE 26.3 31.7 36.1 HOUSE 53.7 36.7 32.8 ROW_HOUSE 16.8 13.9 11.6 APT_HIGH_RISE 17.8 30.3 33.5 APT_LOW_RISE 9.3 15.1 17.9 MOVERS_1_yr 16.5 19.9 20.2 LFP_RATE 69.6 67.3 65.0 UNEMP 5.8 7.2 7.7 YOUTH_UNEMP 12.8 13.1 13.2 YOUTH_NO_SC 30.2 33.3 33.5 NO_HS_DIP 15.3 18.7 21.1 COLLEGE_DIP 17.7 16.5 15.7 UNIV_DEGREE 32.7 30.7 29.0 LOW_INC_FAM 11.4 17.2 20.9 LOW_INC_IND 26.5 34.1 38.7 AVG_HSLD_INC 81,581 65,284 59,948 $DWELLING 209,097 198,130 193,280
Exploring the Link between Crime and Socio-Economic Status in Ottawa and Saskatoon: A Small-Area Geographical Analysis
94 | Research and Statistics Division / Department of Justice Canada
9. Summary
his publication presents the findings of three studies that examined crime and
neighbourhood characteristics in Ottawa and Saskatoon. The studies reveal that there are
marked differences in the level and nature of crime in the two cities. Saskatoon has one of the
highest crime rates in Canada and there are several clear predictors of crime in its
neighbourhoods. By comparison, Ottawa has one of the lowest crime rates and, overall, there is a
weaker association between crime and socio-economic status. However, with respect to
geographic patterns, high crime areas in both cities are found largely in the inner and central city.
The methodologies developed in the three studies can be employed as a guide for further
research into the geography of crime in other Canadian cities. Of particular interest would be a
comparison of patterns and trends in cities with varying social and economic conditions and
different population profiles. For example, large cities in Western Canada, such as Edmonton
and Vancouver, have higher crime rates and a notable presence of disadvantaged residents such
as Aboriginal peoples. Also, further research could focus more specifically on certain types of
offences. For example, the geographic distribution of violent crimes could be analyzed in
relation to the location of public places such as commercial areas, parks and transit-way stations.
At the same time, crime prevention policies can be studied in an effort to make these public
places safer for vulnerable groups such as youth, seniors and women.
It is apparent that the Canadian urban system is characterized by important regional variations
and thus the geography of crime can also be expected to vary considerably not only within cities
but between cities as well. A fuller accounting of these differences is needed in order to develop
appropriate strategies for crime prevention and social upgrading that deal specifically with local
circumstances. For example, study # 2 of Saskatoon found a strong link between the incidence of
violent crime and the presence of Aboriginal peoples in certain inner city neighbourhoods. The
study proposed a number of strategies to deal with this issue, including improving social
T
Research and Statistics Division / Department of Justice Canada | 95
services, education and housing opportunities for Saskatoon’s Aboriginal residents. As the
literature in Canadian criminology has demonstrated there are numerous other examples of
individual and local conditions influencing crime.
Finally, from a methodological perspective, more research needs to be conducted on how the
level of geography used in the analysis affects the relationship between crime and socio-
economic conditions. The research in this publication found that a change in the unit of
geography used in the analysis of Ottawa (dissemination areas and neighbourhoods) did have an
important effect on the findings. Data could be attained for additional cities for geographic units
including DAs, census tracts and neighbourhoods to conduct further tests on the effects of
geographic aggregation on crime trends.
Exploring the Link between Crime and Socio-Economic Status in Ottawa and Saskatoon: A Small-Area Geographical Analysis
96 | Research and Statistics Division / Department of Justice Canada
10. References
Ainsworth, P.B. (2001). Offender Profiling and Crime Analysis. Cullompton, Devon, Willan Publishing. Bowers, K. and Hirschfield, A. (1999). Exploring links between crime and disadvantage in north-west England: an analysis using geographical information systems. In International Journal of Geographical Information Science, vol. 13, no. 2: 159-184. Brantingham, P.J., Mu, S. and Verma, A. (1995). Patterns in Canadian Criminology. In M.A. Jackson and C.T. Griffiths (eds.), Canadian Criminology. Toronto, Harcourt-Brace. Canadian Centre for Justice Statistics (2000). Police-Reported Aboriginal Crime in Saskatchewan. Statistics Canada. City of Saskatoon (2002). Pleasant Hill Local Area Plan Final Report. Community Services Department, City Planning Branch. City of Saskatoon (2003). Neighbourhood Profiles. 7th Edition. City Planning Branch. Clarke, R.V. and Felson, M. (1993). Routine Activity and Rational Choice. In R.V. Clarke and M. Felson (eds.), Routine Activity and Rational Choice. Advances in Criminological Theory, vol. 5. New Brunswick, NJ, Transaction Publishers. Craglia, M., Haining, R.and Signoretta, P. (2001). Modelling High-intensity Crime Areas in English Cities. In Urban Studies, vol. 38, no. 11: 1921-1941. Craglia, M., Haining, R. and Wiles, P. (2000). A Comparative Evaluation of Approaches to Urban Crime Pattern Analysis In Urban Studies, vol. 37, no. 4: 711-729. Criminal Intelligence Service Saskatchewan (2005). 2005 Intelligence Trends: Aboriginal-Based Gangs in Saskatchewan. vol. 1, no. 1. Dent, B. (2000). Brief History of Crime Mapping. In L.S. Turnball, E.H. Hendrix and B.D. Dent (eds.), Atlas of Crime. Mapping the Criminal Landscape. Phoenix Arizona, Oryx Press. Felson, M. (2002). Crime and Everyday Life. Thousand Oaks, Sage Publications. Fitzgerald, R., Wisener, M. and Savoie, J. (2004). Neighbourhood Characteristics and the Distribution of Crime in Winnipeg. Crime and Justice Research Paper Series. Canadian Centre for Justice Statistics. Ottawa. Cat. no. 85-561-MIE- No. 4. Hackler, J.C. (2000). Canadian Criminology. Scarborough Ontario, Prentice-Hall Canada.
Research and Statistics Division / Department of Justice Canada | 97
Herbert, D.T. (1989). Crime and Place: An Introduction. In D.J. Evans and D.T. Herbert (eds.), The Geography of Crime. London and New York, Routledge. Hung, K. (2002). Patterns of Crime in Canadian Cities: A Multivariate Statistical Analysis. Research and Statistical Division Methodological Series. Department of Justice Canada. Johnston, R.J., Gregory, D., Pratt, G. and Watts, M. (2000). The Dictionary of Human Geography. Oxford, Blackwell Publishers Inc. Knox, P. (1995). Urban Social Geography. Essex, England. Logman Group Limited. La Prairie, C. (2002). Aboriginal over-representation in the criminal justice system: A tale of nine cities. In Canadian Journal of Criminology. April. Levine, N. and Associates. (2002). CrimeStat II – A Spatial Statistics Program for the Analysis of Crime Incident Locations. Washington, D.C., The National Institute of Justice. Ley, D. and Smith, H. (2000). Relations between Deprivation and Immigrant Groups in Large Canadian Cities. In Urban Studies, vol. 37, no. 1: 37-62. Mata, F. (2003). Crime and Population Domains in Canada’s Largest Cities. Presentation prepared for the National Crime Prevention Council and the Research and Statistics Division, Department of Justice Canada. McKean, J. and Byers, B. (2000). Data Analysis for Criminal Justice and Criminology. Boston, Allyn and Bacon. Moran, P.A.P. (1950). Notes on continuous stochastic phenomena. In Biometrika. 37:17-23. Rogerson, P.A. (2001). Statistical Methods for Geography. London, Sage Publications. Sacco, V.F. and Kennedy, L.W. (2002). The Criminal Event. Toronto, Nelson Thompson Learning. Schmalleger, F. and Volk, R. (2001). Canadian Criminology Today. Toronto, Prentice-Hall Canada. Shaw, C.R. and McKay, H.D. (1942). Juvenile Delinquency and Urban Areas. Chicago, University of Chicago Press. Short, J.F. (1997). Poverty, Ethnicity, and Violent Crime. Boulder, Colorado, Westview Press. Stark, R. (1987). Deviant Places: A Theory of the Ecology of Crime. In Criminology 25: 893-909.
Exploring the Link between Crime and Socio-Economic Status in Ottawa and Saskatoon: A Small-Area Geographical Analysis
98 | Research and Statistics Division / Department of Justice Canada
Wilcox, P., Land, K.C., and Hunt, S.A. (2003). Criminal Circumstance. New York, Aldine dee Gruyter. Winterdyk, J.A. (2000). Canadian Criminology. Scarborough Ontario, Prentice-Hall Canada. Wong, C. (1997). Crime risk in neighbourhoods: the use of insurance data to analyse changing spatial forms. In Area, vol. 29, no. 3: 228-240.