Embed Size (px)
Citation preview
Exploring the Link between Performance Information Use and
Organizational Performance: A Contingency Approach
Forthcoming in Public Performance & Management Review
Alexander Kroll
Assistant Professor of Public Administration
Florida International University
Abstract
This article contributes to a still relatively small body of empirical literature on the
relationship between performance management on organizational performance. In particular,
it will focus on the effects of performance information use for managerial and oversight
purposes. It uses a contingency perspective, arguing that the effect of data use on performance
is dependent on other contextual factors. On the one hand, the article finds support for this
claim, showing that the impact of managerial information use on performance is stronger if
organizations have adopted a prospecting strategy, whereas this effect tends to vanish for
reactors. On the other hand, the article finds that the relationship between a principal’s data
use for oversight purposes and the agent’s performance is not contingent on whether the
principal is perceived as a monitor or trusted partner. Implications for theory and practice are
discussed.
1
Introduction
Performance management is on the rise. Worldwide an increasing number of public
administrations on the local, state, and federal level are adopting performance measurement
practices (Bouckaert & Halligan, 2008; Pollitt & Bouckaert, 2011). These include defining
efficiency, effectiveness, quality goals and indicators as well as collecting, analyzing, and
reporting performance information that allows comparisons over time and with other entities.
The idea behind this approach is that performance measurement will make deficits more
transparent and that an active management of how to close target-performance gaps will
make organizational improvements more likely (Hatry, 2006; Moynihan, 2008; Van Dooren,
Bouckaert, and Halligan, 2010).
Though there is a vast literature on output and outcome oriented reforms and the
adoption of performance management systems, we know surprisingly little about their actual
effects. This led Boyne (2010, p. 217) to conclude that “despite the vast literature that has
emerged on performance indicators and performance management, few researchers have
sought to test the links between these activities and organizational performance.” There are a
handful of very recent studies (all of them appeared after 2010) which explicitly examined
the relationship between performance management and organizational effectiveness and
which found mixed results (Hvidman & Andersen, 2013; Nielsen, 2014; Poister, Pasha, &
Edwards, 2013; Sun & Van Ryzin, 2013; Walker, Damanpour, & Devece, 2011).
One commonality of prior research is that it has mainly focused on the effects of
performance measurement. However, there is a growing stream of research putting forward
the argument that it is not measurement per se that matters, but whether the reported
performance data are incorporated in decision-making. Though these studies focused on data
use as the dependent variable, none of them tested the implicitly made assumption that using
2
performance information actually leads to organizational improvements (Ho, 2006; Kroll &
Vogel, 2013; Melkers & Willoughby, 2005; Moynihan & Pandey, 2010; Taylor, 2011; Van
Dooren & Van de Walle, 2008). In this respect, Bryson (2012, p. 106) points out that
“authors have explored what leads to performance information use, but not the connections
between use and actual performance.”
This article aims at bridging these literatures by addressing the following question:
Does performance information use for managerial and accountability purposes have an effect
on organizational performance, and is this effect contingent on other organizational factors?
The article will contribute to the literature by separating the factors “performance
measurement” and “information use by decision-makers” and studying their impact on
organizational effectiveness.
The utilization of a contingency approach makes this paper unique as it proposes that
the effectiveness of performance data use by the managers of an organization is dependent on
that organization’s strategy. Data use will have stronger performance effects if an
organization focuses on prospecting and, thus, strive for innovation and change. In this case,
performance data will be particularly useful because indicators can help operationalizing
change and empirical data will help evaluating its success. A different contingency is
expected for reacting organizations which aim to be responsive to changing preferences of
key stakeholders. Here, the positive impact of performance information is supposed to
vanish, because formal performance management practices might be too rigid, bureaucratic,
and backwards oriented for organizations which need to be flexible in order to reroute
quickly in a dynamic environment.
The second proposition this article puts forward is not related to the data use by an
organization’s managers but to the data use by the oversight body which holds that
3
organization accountable. The argument is that a principal’s information use has a positive
effect on the agent’s performance, but I expect different effects dependent on whether the
oversight body has the role of a monitor compared to as a trusted partner.
To test these arguments, the article will use data from a survey of museum managers in
Germany, Austria, and Switzerland.1 It will be a valuable addition to findings mainly drawn
from the field of education and schools, and its findings will be transferable to other
principal-agent settings outside of a government hierarchy, including the steering of quasi-
autonomous agencies and similarly professionalized nonprofit organizations. The article
proceeds by sketching a contingency model of performance management. An explanation of
the data and methods will be followed by a presentation and discussion of the results before
drawing major conclusions at the end.
A Contingency Model of Performance Management
This section will develop a model of how performance management can affect
organizational effectiveness. As the article’s title indicates, it will to a good extent be
explorative. My model will be based on the conceptualization of public organizations as
entities that are autonomous but partially accountable to oversight bodies in principle-agent
relationships. This is why performance information can be used within organizations for
managerial purposes as well as by oversight bodies to hold agents accountable. This section
will begin by looking into the effects and contingencies of internal managerial use, followed
by a theorization of external use for the purpose of accountability.
1 The data for this study were collected in a collaboration between the Department of Public and Nonprofit
Management at the University of Potsdam (Germany) and Syncwork AG.

4
Managerial Data Use and Performance
Organizational performance is a complex phenomenon that can be influenced by a
number of variables. This is why we could question if organizations’ top-level managers have
any kind of critical impact. There is qualitative (Ban, 1995; Behn, 1994) and quantitative
(Meier & O’Toole, 2009; O’Toole & Meier, 2011) evidence that they do. Meier and O’Toole
(2009) reported that top-level managers can account for about 20% of the variation of the
output and outcome performance of U.S. school districts. Good public management seems to
make a difference. The following paragraphs will review the evidence for the impact of
performance management practices, particularly the use of data by public managers.
The idea behind performance management, if we put it simply, is to generate data about
the work of public organizations and to use them to improve decision-making. These
efficiency and effectiveness data are collected based on ex-ante defined indicators which
were chosen to measure the achievement of set goals. Data collection and reporting routines
follow this systematic logic. They are supposed to foster communication about goals, and
they generate aggregated and time-series target-performance evaluations. Systematically
produced performance data can improve and enrich the informational basis for public
managers and therefore might lead to better-informed, more accurate decisions (for a
conceptual discussion, see Behn, 2012; Hatry, 2006; Van Dooren et al., 2010).
Though most studies included in this review are in agreement with the mechanism
described above as to how performance management can foster organizational enhancements,
they present conflicting empirical evidence regarding the significance of the performance-
management effect. Put differently, after controlling for alternative impact factors, some
studies found that performance management has an impact, whereas others reported that this
effect vanishes, or that there are even negative side-effects that need to be considered. Boyne
5
and Chen (2007) have studied target systems in English local education authorities and found
a positive effect on performance. Examining variation across time, they have concluded that
authorities with targets performed better than those without them and better than themselves
in the pre-target period. A similar effect was found by Sun and Van Ryzin (2013) who
examined a sample of New York public schools. They discovered that performance
measurement practices helped schools to increase the number of students who met the set
standards and the number of the lowest third of the students making progress. More positive
evidence comes from a study of the U.S. public transit industry which found that the adoption
of performance measurement increases ridership and productivity (Poister et al., 2013). A
study by Walker et al. (2011), which has examined performance effects in English local
government, corroborated such a positive impact, suggesting that performance measurement
is an important mediator of other exogenous variables.
However, there are also conflicting empirical results. In a longitudinal study of public
and private schools in Denmark, Hvidman and Andersen (2013) have examined differences
in student test scores between adopters and non-adopters of performance measurement as
well as differences before and after the adoption. They found that performance measurement
only has a positive effect for private schools and argue that this is due to differences in
incentives, capacity, and goal clarity between both sectors. This null finding is in line with
what Moynihan (2008) concluded while studying the Correction Administration in the U.S. –
Performance measurement is probably less important to performance than many other
organizational factors. But there is even evidence for a negative performance effect. Based on
different case studies, Hood (2012) pointed out that target and ranking systems can harm
public service performance due to ratchet and threshold effects as well as output distortions.
Similarly, Boyne and Gould-Williams (2003) reported that, studying local authorities in

6
Wales, target setting was found to have a negative impact on several performance
dimensions.
Thus far, there seem to be conflicting research findings on the effect under
investigation. Considering that performance management is the sum of planning and
measurement on the one hand (= adoption) and data use on the other (= implementation), it is
interesting that studies which found no or a negative effect mostly focused on the adoption
part, whereas most of the positive findings were based on measures that incorporated at least
one or two items of actual data use (Poister et al., 2013; Sun & Van Ryzin, 2013; Walker et
al., 2011). This seems to be a vague indication that the variable “performance information
use” might play a critical role in discriminating positive effects from other findings. More
evidence for this hypothesis comes from the following two studies. Walker and Boyne (2006)
have shown that the adoption of information systems and target regimes is not sufficient to
enhance organizational performance, as long as managers have not taken ownership of targets
and indicators. Hanushek and Raymond (2005) have analyzed longitudinal data of schools in
the U.S. and similarly concluded that accountability systems only have an impact, when
managerial consequences are attached to performance reports.
Drawing on this empirical literature, we can infer that there is mixed evidence on the
effect of performance measurement. However, this evidence seems to become less
ambiguous, when we do not hypothesize the effect of performance measurement but of data
use. Using performance information for managerial purposes is likely to be linked to
performance improvements more closely than planning, measuring, or analyzing which seem
to be necessary but not sufficient conditions of performance improvements.
H1: Managerial data use has a positive effect on organizational performance.
7
The Moderating Role of Strategy
Studies which were able to explain differences in organizational performance have
suggested that the effect of performance measurement is contingent on several factors. The
study by Hvidman and Andersen (2013), mentioned above, has argued that the effect of
measurement is dependent on the existence of certain organizational properties, and it found
support for the importance of structural differences between public and private sector
organizations. Other studies further specified such a contingency hypothesis. Nielsen (2014),
who used data from Danish schools, argued that the relationship of measurement and
performance is moderated by the authority that is given to managers. Only when they have
discretion over human resources in their departments, will they be able to change structures
and processes in ways significant enough to improve organizational performance.
The assumption that the success of performance measurement is dependent on several
organizational or managerial contingencies seems to be similarly relevant for the case of
performance information use. Bryson (2012, p. 106) was probably the first who speculated
about one important contextual factor, when he asked: “Should we expect strategy to make a
difference in performance information use?” There is reason to believe that it does, and that
performance data have a different impact when public organizations pursue different
strategies.
A straightforward way to distinguish different strategic stances is to focus on three
types of organizations – prospectors, defenders, and reactors (Miles & Snow, 1978, for a
review of applications to the public sector, see Boyne & Walker, 2004, 2010). Prospecting
describes organizations which actively seek to improve their services through the
implementation of innovations and change. Defenders, in contrast, aim for stability and try to
deliver their core services efficiently and reliably. Reactors do not pursue an internally
8
developed strategy but are very much receptive to signals from their environment and to
preferences of important stakeholders. Though these strategies are not completely mutually
exclusive, organizations tend to follow one of these approaches more distinctively than the
others (Boyne & Walker, 2004). Empirical research has shown that prospectors and defenders
can be positively associated with organizational performance, whereas reactors were found to
be less successful (e.g., Andrews et al., 2005, 2009; Andrews, Boyne, & Walker, 2006a;
Boyne & Walker, 2010). However, there are also indications that these effects are contingent
on factors, such as organizational centralization or environmental stability (Meier et al., 2007;
Meier & O’Toole, 2009).
Performance information might be particularly helpful to organizations which pursue
prospecting strategies. Prospectors systematically plan and implement change, and
performance management systems are known to be useful for this purpose. They require the
analysis of the status quo, the formulation of goals, the identification of indicators to measure
goal achievement, and the collection and evaluation of performance information (Hatry,
2006; Van Dooren et al., 2010). We also know that public organizations which strive for
innovation value performance data a great deal, because these data highlight problems and
provide feedback on how well change projects are going (Johansson & Siverbo, 2009;
Moynihan & Pandey, 2010). Prospectors search for new approaches for doing old things, and
performance management allows systematic trial-and-error learning (Moynihan, 2008). The
long-term tracking of results makes it possible to try out different strategies on how to
improve outcomes and to sort out which way is the most effective. Prior research has shown
that prospectors (in the public sector) are successful when their organizations are highly
centralized and their environments largely stable because in such settings managerial
decisions can be made more efficiently (due to less transaction costs) and planning becomes
easier (since many variables become constants) (Meier & O’Toole, 2009). Such settings also
9
seem to be ideal for the implementation of performance management practices. Centralization
ensures that performance indicators are integrated and related to an organization’s strategic
plan, and stable environments make it is easier to develop accurate logic models about
program causalities. This I why I hypothesize that using performance information and
prospecting strategies are a good fit.
Performance information can be similarly important for defenders, but the reasoning is
different here. In practice, a large amount of performance data is on efficiency and internal
processes (Boyne, 2002). Performance measurement has even been criticized for being too
narrow and organization-centered (Wichowsky & Moynihan, 2008). Defenders benefit from
collecting internal information, as this will be useful for them to implement their strategy of
optimizing core services and improving on their strengths.
This is different for reactors, because such a strategy seems to be at odds with the
performance management logic. To be successful at reacting, predefining goals and tracking
their achievement is counterproductive. Reactors need to remain flexible, when they make
operational decisions, so they can scan their environment for relevant signals and revise
action plans quickly when stakeholder preferences change. Though these organizations also
seek for feedback information, it is unlikely that they will find this in “historical” information
systems (Mintzberg, 1973). Instead, they might be interested in “nonroutine feedback” (Kroll,
2013a), which is most likely to be verbal, ad-hoc, and often not actively pursued but
passively received. In other words, getting relevant information through networking could be
more important for reactors than analyzing quantitative data from benchmarking or
scorecards. This is why the effect of performance information use on performance should be
significantly weaker for reacting organizations.
H2: The effect of managerial data use on performance increases when organizations
pursue a prospecting strategy.

10
H3: The effect of managerial data use on performance increases when organizations
pursue a defending strategy.
H4: The effect of managerial data use on performance decreases when organizations
pursue a reacting strategy.
Data Use by Oversight Bodies and the Role of Trust and Monitoring
Performance information is not only used by managers but also by stakeholders, such
as politicians, citizens, or interest groups (Van Dooren & Van de Walle, 2008). This section
will focus on the organization-external use by oversight bodies for the purpose of
accountability. Prior research has argued that just the production of performance reports can
already increase the accountability of public organizations because this “keeps public
servants honest” (Pollitt, 2006, p. 49). However, accountability will further increase if
oversight bodies do not only file their agents’ performance reports but actually use them for
controlling purposes (Van Dooren et al., 2010). Performance data can help principals track
how agents do, and they can serve as a basis for well-informed interventions. For example,
one great challenge for oversight bodies is to determine whether agents perform as well as
possible or whether there is still potential for improvement. Here, performance information is
useful for creating points of reference: How has the agent been doing over the past five years,
and how does the agent perform compared with benchmark organizations (Hatry, 2006)?
Hence, I assume that agents will perform well if oversight bodies pay serious attention to
their performance data.
Using a contingency perspective, we could expect this effect to vary based on the
existence of other factors. One critical variable that might be able to moderate the effect of
data use is the nature of the relationship between principal and agent, usually modeled using
either agency or stewardship theory (Van Slyke, 2007). Agency theory assumes information
11
asymmetries and therefore opportunistic behavior on the part of the agents. To correct this,
principals need to set up hard contracts and strict monitoring mechanisms (Eisenhardt, 1989;
Jensen & Meckling, 1996). Stewardship theory, in contrast, assumes that principals and
agents share collective goals, and that the latter are motivated by higher values and intrinsic
rewards. The relationship between principals and agents is therefore determined by trust and
reputation (Davis, Schoorman, & Donaldson, 1997).
Applying these theoretical lenses, we would expect performance data to be more
critical where an oversight body takes on the role of a monitor. To avoid moral hazard on the
part of a self-interested agent, oversight bodies can use performance information to tightly
monitor goal achievement and intervene quickly when problems arise (Merchant & Van der
Stede, 2007). This might be different where the relationship between principal and agent can
be characterized as an equal partnership determined by trust and collective goals. Though
oversight bodies will still be responsible for controlling their agents, they might make use of
different mechanisms, and formal performing reports are likely to play a minor role. Instead,
principals will affect agents’ behavior through “belief systems” (Simons, 1995) and “clan
control” (Ouchi, 1979), where an informal information system “grows up as a natural by-
product of social interaction” (Ouchi, 1979, 839).
H5: External data use by oversight bodies has a positive effect on performance.
H6: The effect of external data use on performance increases when the oversight body
takes on the role of a monitor.
H7: The effect of external data use on performance decreases when the oversight body
takes on the role of a trusted partner.
12
Data and Methods
Sample
The data for this study are taken from a survey of museum managers from Germany,
Austria, and the German-speaking part of Switzerland which was conducted in 2011. The
population consisted of all museums in cities with more than 50,000 inhabitants – except for
the museums of local history and galleries. The questionnaire was not addressed to the
museum directors but the chief administrative officers, because the latter are in charge of all
internal management issues, except marketing-related questions. The population of interest
included 397 chief administrative officers, and the response rate reached a level of 45%. Not
all of these respondents could be considered for the statistical analysis because of missing
data (list-wise deletion was applied). Due to differences in country size, there are more
museums in Germany than in Austria or Switzerland, which is why the vast majority of
responses (more than 80%) in the sample is from German museums. Most museums are in
public ownership (80%) and are therefore held directly accountable by public oversight
bodies on the federal, state, or local level. The other 20% are either in mixed or private
ownership.
The surveyed population is an interesting sample for many reasons. First of all, most
research in this area has been based on data from schools and students. Using a different
setting will help separate the idiosyncrasies of one policy field, such as education, from
findings which can be better generalized for a theory of performance management. Secondly,
this sample will offer insights about the role of performance information in principal-agent
relationships outside of a government hierarchy. Considering that steering nonprofit
organizations, agencies, and quasi-autonomous non-governmental organizations
(QUANGOS) has become a hot topic (Van Slyke, 2007; Verhoest et al., 2011), the museum
13
case seems to become even more interesting. Thirdly, the sample consists of data from three
European countries which differ in terms of administrative culture, rules, and governance
arrangements. That is, effects that hold across all three countries are likely to have good
external validity.
This paragraph will briefly provide some context about the management of museums in
Germany, Austria, and Switzerland. Due to budget constraints during the past couple of
years, it has become more and more difficult for museums in all three countries to acquire
public money. To avoid budget reductions, museums needed to increase their funding coming
from donations and sponsoring and show that they have been using their funds efficiently and
effectively. In particular, the attempt to make results transparent led to the adoption of
performance measurement. Important metrics include the number of newly acquired art
objects, number of restorations, quality and quantity of the portfolio, number of special
exhibitions, or the quality of educational services (Proeller et al., 2012). With regard to the
differences among countries, Switzerland is known to be an early adopter of performance-
management practices, compared to the other two countries – though there is also a good
amount of variation among the sixteen German states.
Measures and Controls
All measures can be found in the appendix, but the more complex ones will be
explained here. Organizational performance was measured based on perceptual items (for
similar approaches, see Brewer, 2005; Brewer & Selden, 2000; Moynihan & Pandey, 2005;
Pandey & Moynihan, 2006). Though perceptual measures are usually associated with the
problem of subjectivity, they are not necessarily inferior to archival indicators (Andrews,
Boyne, & Walker, 2006b). Advantages of a manager-based perceptual measure of

14
performance are that “it relies on the views of those who know the agency best, and does not
extrapolate organizational performance from highly specified programmatic measures or rely
on one set of stakeholder perspectives to extrapolate organizational performance” (Pandey &
Moynihan, 2006, p. 137). Another advantage of rather abstract, subjective measures is that
they are more inclusive: They are better able to pick up on performance changes that are
difficult to capture by very specific, quantitative indicators and are thus less cognitively
biased towards targeted areas at the expense of non-targeted ones.
The museum managers were asked to rate the success of their museum regarding the
four dimensions collecting, preserving, researching, and exhibiting on a 5-point Likert scale.2
These dimensions were chosen because they were established by the International Council of
Museums (ICOM) as important performance dimensions, and most museum managers are
familiar with them. The scales’ endpoints were labeled “1 = improvement potential is great”
and “5 = improvement potential is fully exhausted”. Thereby, labels like “very poor versus
very good performance” or “completely ineffective versus completely effective” which have
strong normative connotations and might trigger a social-desirability bias were avoided. This
procedure resulted in a fairly good statistical variation of all performance dimensions. All
means scatter around the middle category of three (2.70 – 3.50), and the standard deviations
of all performance variables seem to be not essentially different from those of other variables
measured on a 5-point scale.3
2 For more details, please see the appendix. 3 This measure could be biased due to the fact that some managers might be more reflective and self-critical than
others. To test whether variation in perceived organizational performance can be explained by differences in
respondent characteristics, the following regression model was presented to the reviewers. Performance was
regressed on four available individual variables: risk aversion, educational background in business, business-
related additional qualifications, and work experience. The analysis showed that these individual-level variables
explained 0% (Adj. R2) of the variance in performance. Though this does not prove that there cannot be any
respondent-related bias in the subjective measure of performance, it at least indicates that we can expect this
bias to be small rather than large.
15
[Table 1]
To construct an overall measure of organizational performance, I used a factor score
that accounts for all four performance dimensions (eigenvalue: 2.12; explained variance:
53%). Its Cronbach’s alpha of 0.62 indicates that all items are only moderately correlated,
which makes sense if we consider that improvements in one performance dimension do not
automatically lead to improvements in other dimensions but could even be achieved at the
expense of each other. The factor score takes each item’s uniqueness into account and weighs
them according to the loadings reported in the appendix.4
There are different means by which to measure performance information use. Previous
studies found different purposeful data uses to be highly correlated, indicating that it is
possible to reflect this behavior by just using single items (de Lancer Julnes & Holzer, 2001;
Moynihan & Pandey, 2010). The broadest form of data use is to consider this information
when making decisions. Following this understanding, taking performance information into
account but deciding not to act on it is still considered data use. Such a “performance-
informed decision-making” (OECD, 2007, p. 21; Pollitt, 2006) is based on the assumption
that performance reports are only one management source among others and are not likely to
contain all decision-relevant information. Thus, managers should consider these data, but we
cannot expect that they guide every single of their decisions (Kroll, 2013a). To measure
whether museum directors and managers as well as their oversight bodies use performance
data to inform their decisions, the survey respondents were asked how they assess the
demand for performance data by these different actors. The results of a factor analysis in the
4 We can see there that the first three items reflect the shared latent factor quite well, whereas the fourth one has
been weighed much lower. This can be explained by the fact that most museums ranked their own “exhibiting”
performance relatively high, which is why this item is only partly useful to distinguish between good and bad
performers.
16
appendix show that internal data use by managers and directors on the one hand and data use
by oversight bodies on the other are statistically different from each other. The strategic
stances were measured using three single items adapted from Andrews, Boyne, and Walker
(2006). To capture different control mechanisms, the museum managers were asked to
evaluate the role of their oversight body.
To robustly test the proposed hypotheses, I will control for a number of variables which
were found to be relevant in prior research (Boyne et al., 2006; O’Toole & Meier, 2011;
Walker, Boyne, & Brewer, 2010). In order to separate the effect of managerial data use from
a broader measure of performance management, I will control for the sophistication of the
measurement system. Further controls are the adoption of several “modern” management
tools, the existence of support resources as well as differences in size (see appendix). To
account for broader cultural differences, I will include a widely used item from Zammuto and
Krakower’s (1991) scale, which has proven to discriminate well between more and less
innovative organizations (Kroll, 2013a; Moynihan & Pandey, 2005). The variables “support
resources” and “organization size” both were included as ordinal measures to avoid
information loss and multicollinearity. However, the results in table 2 would not change if we
included all variable categories as dummies. All interaction terms were generated as the
multiplied scores of the mean-centered individual variables.
Estimations
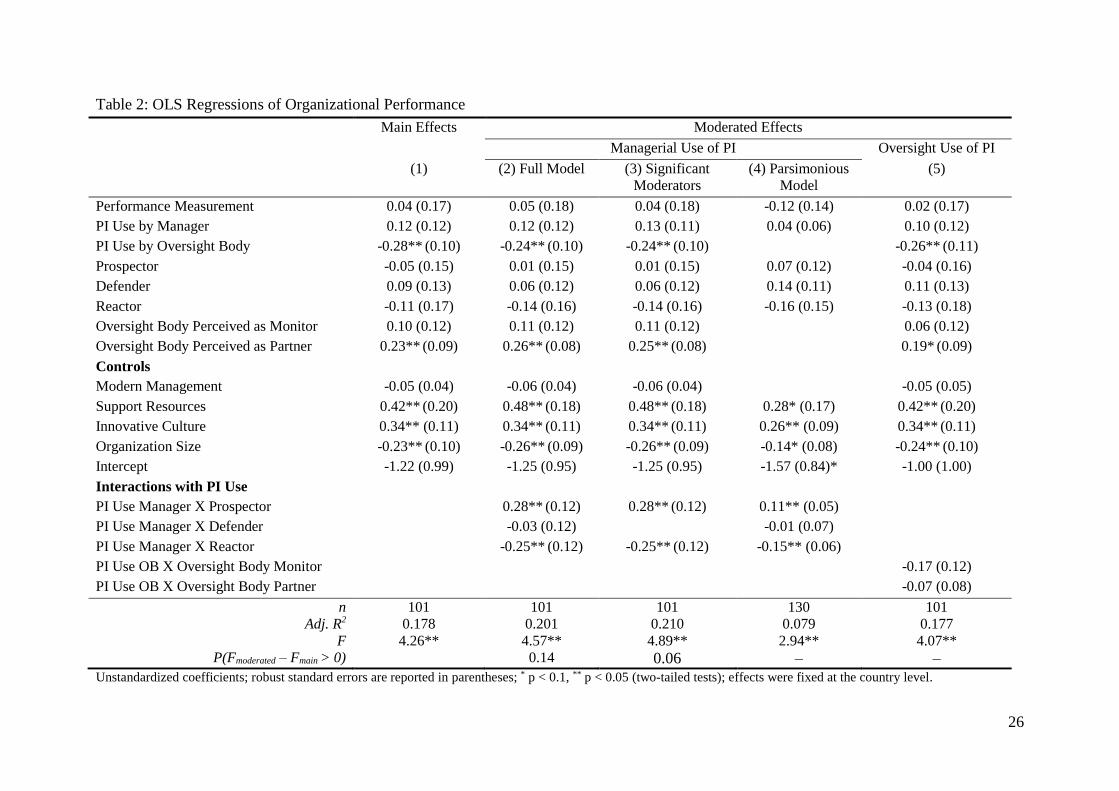
All models in table 2 are based on ordinary least square regressions. The first model
shows the results of the main effects, while the others provide the findings of the moderated
effects models, beginning with managerial data use which is followed by oversight use. The
moderated effects can be interpreted as follows. For each one-unit increase in the moderator,
17
the slope relating performance information use to organizational performance
increases/decreases by the reported coefficient, while holding all other variables constant
(Whisman & McClelland, 2005).
Since it is possible (and quite realistic) that museums engaging in prospecting also
engage, at least to some extent, in defending or reacting (the correlations of these variables
are 0.21, 0.27, and 0.44, see table 1), the effect of one strategy can only be properly tested,
while controlling for those of the other two. This is also true when testing these variables’
interaction effects, meaning that we always need to simultaneously include all related
interaction terms in our regression equation, if we want to get proper estimates for each
individual moderation (Jaccard & Turrisi, 2003). The same applies to the two variables which
measure perceptions of the oversight body; they are not mutually exclusive and thus need to
be statistically controlled. Effects were fixed at the country level but turned out to be
insignificant. This indicates that the results hold across all three countries.
One concern with models which are based on moderate samples sizes is that they might
not have enough statistical power to detect effects of smaller magnitudes to be significant and
thus are prone to so-called type-II errors. This is because standard errors are in part a function
of the number of observations and increase with smaller samples. To avoid dismissing effects
as irrelevant, just because they have not reached a significance level of 0.05 in a small
sample, the article will make use of a more relaxed threshold of 0.1 (which is appropriate as it
still corresponds to a 5% chance of being wrong when using a one-tailed test).
18
Results and Discussion
Table 2 displays the results of the analysis. Hypothesis 1 cannot be supported.
Museums where managers have reported intense use of performance information do not
perform better than others. Across all models managerial use as well as the variable
performance measurement have no significant effects. This is interesting, as it does not lend
support to the argument that data use is more closely linked to good performance than data
production. At the same time, this null finding is not entirely surprising when taking the
mixed results for the effect of performance measurement seriously, which I summarized in
the literature review. Though I do not want to overstate this null result, I think we can
cautiously suggest that measuring performance and making use of the reported data for
managerial purposes is not sufficient to explain differences between better and worse
performing museums.
The next three hypotheses deal with the contingencies of this effect when taking
different strategic stances into account, and they are tested in model 2. Hypothesis 2 can be
confirmed. The second model shows that the effect of managerial data use on performance
significantly increases when organizations pursue a prospecting strategy. In technical terms,
this means that with each one-unit increase in prospecting, the effect of managerial data use
on performance will increase by 0.28. This gets even more interesting when we consider that
such an interaction does not hold for defending organizations, which is why hypothesis 3
cannot be validated. Both findings together seem to indicate that to be successful,
performance management requires to be paired with a strategy that emphasizes a new vision,
better outcomes for clients or, simply put, substantial change. It is less successful when only
used to cut costs or to optimize existing processes without challenging the assumptions
behind established activities.
19
Hypothesis 4 finds support – museums pursuing a reacting strategy are significantly
less likely to be successful when their managers engage in performance management
practices. This is, again, evidence for the importance of including contingency factors when
studying complex control regimes, such as performance management. Rational planning,
measuring, and data using activities seem to be harmful to organizations when these have to
be receptive to fast changing input by multiple stakeholders. In these cases, formalized
performance management routines might be too inflexible and thus counterproductive.
Model 3 and 4 provide further specifications in order to test the robustness of these
results. Model 3 indicates that the model fit (difference in F values) improves significantly
(p<0.1) if we add the prospector and reactor interaction terms, while neglecting the defender
variable which did not provide clear results. Model 4 is based on a more parsimonious
regression equation. In order to conserve observations and minimize the number of missing
values, it only focuses on managerial data use and includes those controls which turned out to
be significant in prior models. It provides evidence that the moderating effects of prospecting
and reacting are still significant, even for this larger sample of museums.5
[Table 2]
5 Examining the marginal effects plots (not displayed but shown to the reviewers) for the interactions reveals
some additional information. Levels of prospecting do not only increase the effect of data use on performance,
the marginal effect actually changes its sign. For low levels of prospecting (2 on a 5-point Likert scale), the
effect of data use on performance is significant negative, whereas for high levels (5 on a 5-point Likert scale)
this effect is significant positive. A significant amount of museums (about 40%) scored either 2 or 5 on this
scale. This is a little different for the moderating effect of reacting. Though we can be certain that a reacting
strategy decreases the effect of data use on performance, this effect’s change in direction is not significant. That
is, when the level of reacting increases from 1 to 2 or from 2 to 3 (on a 5-point Likert scale), the slope relating
data use to performance decreases significantly but remains positive (this is relevant for about 55% of the
museums). When the reactor score increases from 3 to 4 and from 4 to 5, the average marginal effect of data use
decreases further and becomes negative, but its confidence interval includes zero.

20
Turning to hypothesis 5, we get a surprising result. Contrary to what was expected, the
relationship between data use by the oversight body and the museums’ performance is
significantly negative across all models. This could mean that more intense information use
on the part of the principals makes the agents perform worse, but the following reading seems
to be more plausible. Looking at this relationship from a reversed perspective, we could
conclude that when museums perform poorly, oversight bodies will increase their
performance data use and control the museums more tightly. Though such control behavior
has already been reported elsewhere (Jensen & Meckling, 1992; Merchant & Van der Stede,
2007), an interesting finding is that public administration actively uses performance
information for that matter and does not limit itself to more established mechanisms, such as
steering through rules and standards, personnel controls, the re-allocation of decision rights,
or belief systems and values (Simons, 1995). This is particularly noteworthy when we
consider that this result holds across three continental European countries, where
performance management is not as common as it is in the Anglo-American world.
Hypotheses 6 and 7 do not hold – the relationship between performance and data use by
oversight bodies is not significantly moderated by the nature of this relationship (see model
5). Though this disconfirms some of the theoretical ideas presented earlier in this article, it
still offers relevant empirical insights. Performance information is not more relevant for
monitoring purposes as it is in trust-based partnerships. Some studies have even suggested
that the positive effects of the “soft” use of these data for trial-and-error learning can only
occur when there is an open dialogue between equal partners (Moynihan, 2008; Van Dooren,
2011). Though my results do not provide clear support for the moderating role of either type
of principal-agent relationship, it is noteworthy that museums generally perform significantly
better when their oversight body is perceived as a partner compared to as a monitor (this
refers to the direct effects of both variables and holds across all models).
21
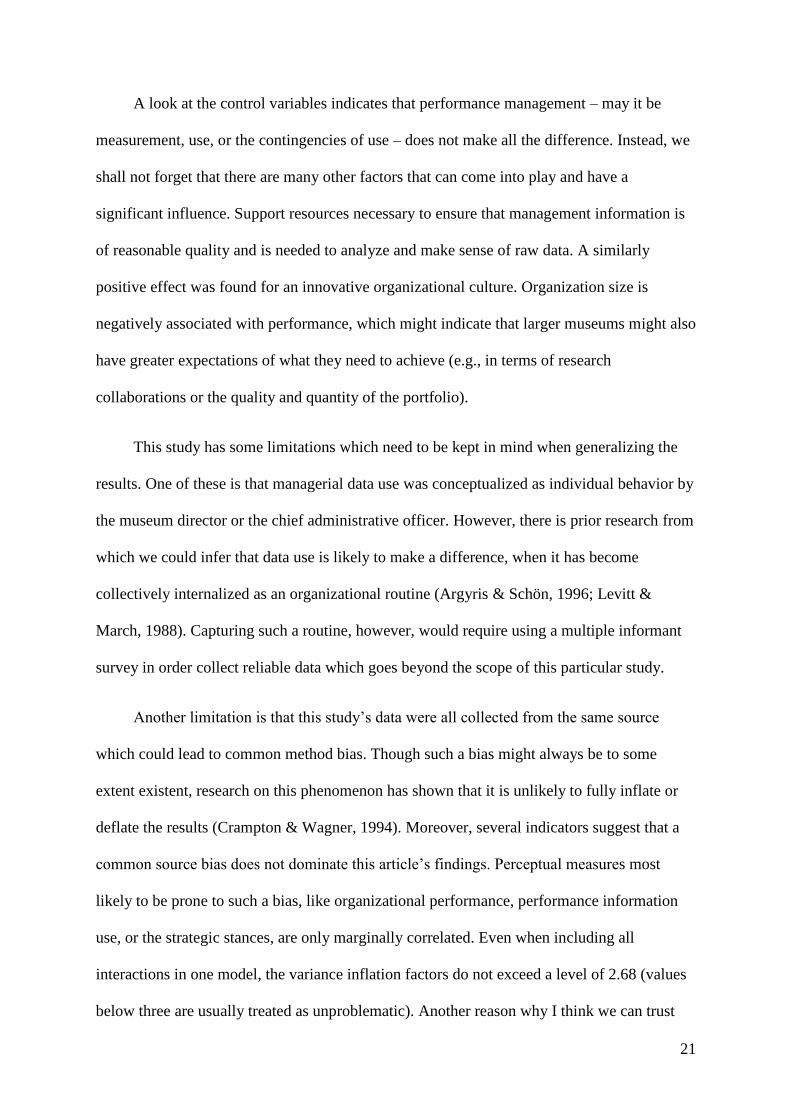
A look at the control variables indicates that performance management – may it be
measurement, use, or the contingencies of use – does not make all the difference. Instead, we
shall not forget that there are many other factors that can come into play and have a
significant influence. Support resources necessary to ensure that management information is
of reasonable quality and is needed to analyze and make sense of raw data. A similarly
positive effect was found for an innovative organizational culture. Organization size is
negatively associated with performance, which might indicate that larger museums might also
have greater expectations of what they need to achieve (e.g., in terms of research
collaborations or the quality and quantity of the portfolio).
This study has some limitations which need to be kept in mind when generalizing the
results. One of these is that managerial data use was conceptualized as individual behavior by
the museum director or the chief administrative officer. However, there is prior research from
which we could infer that data use is likely to make a difference, when it has become
collectively internalized as an organizational routine (Argyris & Schön, 1996; Levitt &
March, 1988). Capturing such a routine, however, would require using a multiple informant
survey in order collect reliable data which goes beyond the scope of this particular study.
Another limitation is that this study’s data were all collected from the same source
which could lead to common method bias. Though such a bias might always be to some
extent existent, research on this phenomenon has shown that it is unlikely to fully inflate or
deflate the results (Crampton & Wagner, 1994). Moreover, several indicators suggest that a
common source bias does not dominate this article’s findings. Perceptual measures most
likely to be prone to such a bias, like organizational performance, performance information
use, or the strategic stances, are only marginally correlated. Even when including all
interactions in one model, the variance inflation factors do not exceed a level of 2.68 (values
below three are usually treated as unproblematic). Another reason why I think we can trust
22
the statistical analysis I presented in this article is that we do not have to reject the OLS
assumptions about normality (p=0.90) and homogeneity (p=0.59, IM-test).
Conclusion
This article has explored the relationship between performance management and
organizational performance, and it thereby contributes to a growing literature on one of the
most relevant but still least understood causalities in this area. It has been novel as it
separated the effect of data use (implementation) from data collection (adoption) and
theorized how managers and oversight bodies use performance information. It has also
provided empirical data from three European countries on the management of museums, from
which we can draw lessons for principal-agent relationships between public administration
and other service providers which are similarly autonomous and professionalized. The article
used a theoretical perspective that is based on the assumption that managing public
organizations is complex, and that causalities are highly dependent on context. It found that a
performance effect of managerial data use is contingent on the strategy organizations pursue,
meaning that this effect increases for prospectors and decreases for reactors.
In a broader sense, this article contributes to an ongoing performance management
debate as it provides empirical evidence against a one-size-fits-all logic. Though others have
argued before that the success of performance management is likely to differ among
organizations, this article further qualifies such a hypothesis. It might be true that every
organization’s idiosyncrasies matter, but in order to move towards generalizable theories, it
seems to be promising to develop and test contingency hypotheses which are supposed to
hold for more than one organization. This article showed that strategy matters and that the
effectiveness of performance information use is contingent on an organizations strategic

23
stance. One purpose of the article is to encourage research on other contingency factors, such
as environmental turbulences, organizational structure, or resource dependencies.
There are some conclusions for the practice of public management. Performance
management seems to be particularly effective, when public organizations have chosen a
strategy striving for change. Adopting and implementing these systems is more likely to pay
off, when they are used to track the achievement of innovative, stretching, and meaningful
goals. They will be less effective if only used as a new way to manage old objectives, without
using this tool as an opportunity to question established assumptions and routines. The results
further indicate that performance management can harm the success of reacting strategies.
This does not mean that reactors do not need performance data, but they might need a
different type of feedback. Kroll (2013a) explains that “nonroutine performance information”
is more timely and richer than “routine management data” and thus might be appealing to
decision-makers who act in a dynamic, pluralistic environment. Simons (1995) emphasizes
the importance of “interactive control systems” which are less static than hierarchical
planning-and-monitoring-based systems and rather aim for dialogue and learning, while
involving organizational members from several hierarchical levels.
Overall, this article suggests the following to practitioners. First, managers have to
determine what their strategy is and which type of information they will need to implement
and evaluate it. Then, they will need to decide whether performance management is able to
provide the needed information, or to what extent standardized measurement, analysis, and
reporting practices have to be adapted in order to serve the specific needs of their
organization. In cases where organizations are not free to decide whether they will collect
performance data, measurement is most likely to have positive performance effects, when
organizations are able to find ways how to make externally initiated systems usable for
internal management purposes (Kroll, 2013b; Moynihan, 2008).
24
The article also pointed out that we need more research on performance information use
in principal-agent relationships. Data utilization for managerial purposes has received most of
the attention thus far, but we could probably think of at least as many relevant examples
where performance information is mainly used by stakeholders to hold public organizations
and their managers accountable. The fact that the article’s findings regarding the relationship
between principal and agent as a contingency of a performance management system’s
effectiveness were inconclusive should encourage research on this issue rather than end it.
Sorting out which of the two variables, a principal’s performance information use and an
agent’s performance, is exogenous or endogenous particularly calls for longitudinal research
which would include panel data analyses but also case studies. After all, studying the
effectiveness of performance data use means to examine the purposes of internal management
as well as external accountability, and prior research has rather focused on the former and
neglected the latter.
25
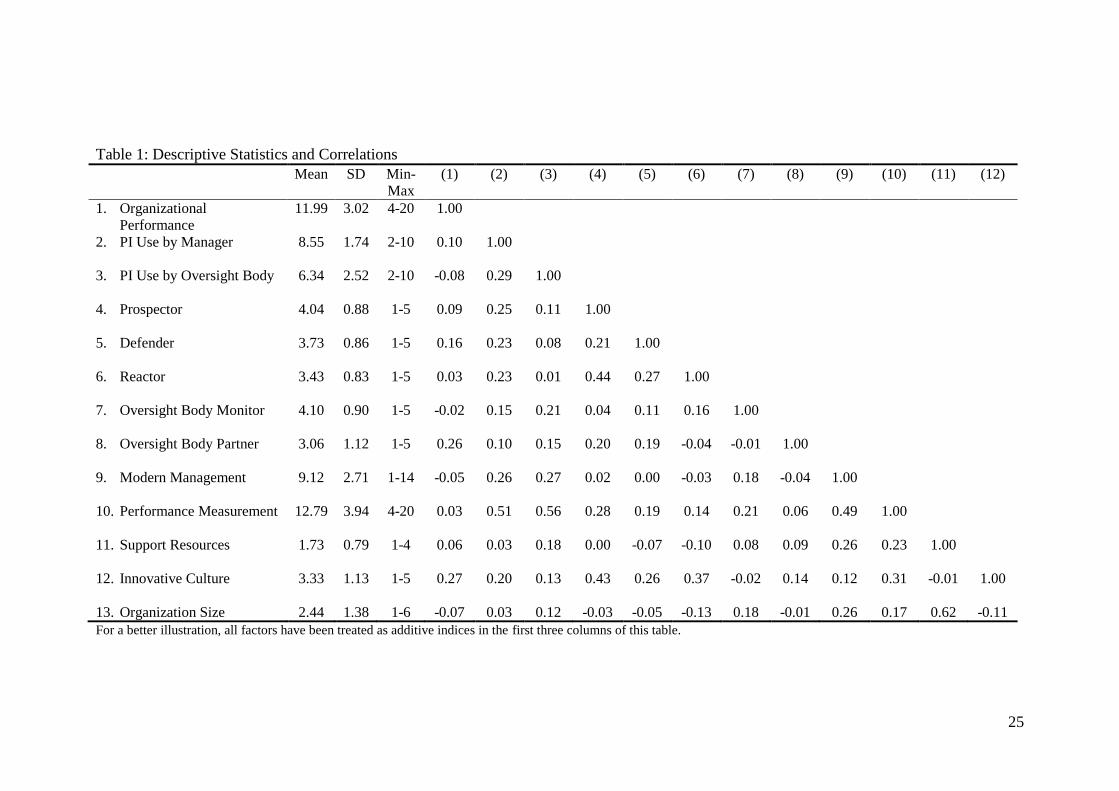
Table 1: Descriptive Statistics and Correlations
Mean SD Min-
Max
(1) (2) (3) (4) (5) (6) (7) (8) (9) (10) (11) (12)
1. Organizational
Performance
11.99 3.02 4-20 1.00
2. PI Use by Manager
8.55 1.74 2-10 0.10 1.00
3. PI Use by Oversight Body
6.34 2.52 2-10 -0.08 0.29 1.00
4. Prospector
4.04 0.88 1-5 0.09 0.25 0.11 1.00
5. Defender
3.73 0.86 1-5 0.16 0.23 0.08 0.21 1.00
6. Reactor
3.43 0.83 1-5 0.03 0.23 0.01 0.44 0.27 1.00
7. Oversight Body Monitor
4.10 0.90 1-5 -0.02 0.15 0.21 0.04 0.11 0.16 1.00
8. Oversight Body Partner
3.06 1.12 1-5 0.26 0.10 0.15 0.20 0.19 -0.04 -0.01 1.00
9. Modern Management
9.12 2.71 1-14 -0.05 0.26 0.27 0.02 0.00 -0.03 0.18 -0.04 1.00
10. Performance Measurement
12.79 3.94 4-20 0.03 0.51 0.56 0.28 0.19 0.14 0.21 0.06 0.49 1.00
11. Support Resources
1.73 0.79 1-4 0.06 0.03 0.18 0.00 -0.07 -0.10 0.08 0.09 0.26 0.23 1.00
12. Innovative Culture
3.33 1.13 1-5 0.27 0.20 0.13 0.43 0.26 0.37 -0.02 0.14 0.12 0.31 -0.01 1.00
13. Organization Size 2.44 1.38 1-6 -0.07 0.03 0.12 -0.03 -0.05 -0.13 0.18 -0.01 0.26 0.17 0.62 -0.11
For a better illustration, all factors have been treated as additive indices in the first three columns of this table.
26
Table 2: OLS Regressions of Organizational Performance
Main Effects Moderated Effects
Managerial Use of PI Oversight Use of PI
(1) (2) Full Model (3) Significant
Moderators
(4) Parsimonious
Model
(5)
Performance Measurement 0.04 (0.17) 0.05 (0.18) 0.04 (0.18) -0.12 (0.14) 0.02 (0.17)
PI Use by Manager 0.12 (0.12) 0.12 (0.12) 0.13 (0.11) 0.04 (0.06) 0.10 (0.12)
PI Use by Oversight Body -0.28** (0.10) -0.24** (0.10) -0.24** (0.10) -0.26** (0.11)
Prospector -0.05 (0.15) 0.01 (0.15) 0.01 (0.15) 0.07 (0.12) -0.04 (0.16)
Defender 0.09 (0.13) 0.06 (0.12) 0.06 (0.12) 0.14 (0.11) 0.11 (0.13)
Reactor -0.11 (0.17) -0.14 (0.16) -0.14 (0.16) -0.16 (0.15) -0.13 (0.18)
Oversight Body Perceived as Monitor 0.10 (0.12) 0.11 (0.12) 0.11 (0.12) 0.06 (0.12)
Oversight Body Perceived as Partner 0.23** (0.09) 0.26** (0.08) 0.25** (0.08) 0.19* (0.09)
Controls
Modern Management -0.05 (0.04) -0.06 (0.04) -0.06 (0.04) -0.05 (0.05)
Support Resources 0.42** (0.20) 0.48** (0.18) 0.48** (0.18) 0.28* (0.17) 0.42** (0.20)
Innovative Culture 0.34** (0.11) 0.34** (0.11) 0.34** (0.11) 0.26** (0.09) 0.34** (0.11)
Organization Size -0.23** (0.10) -0.26** (0.09) -0.26** (0.09) -0.14* (0.08) -0.24** (0.10)
Intercept -1.22 (0.99) -1.25 (0.95) -1.25 (0.95) -1.57 (0.84)* -1.00 (1.00)
Interactions with PI Use
PI Use Manager X Prospector 0.28** (0.12) 0.28** (0.12) 0.11** (0.05)
PI Use Manager X Defender -0.03 (0.12) -0.01 (0.07)
PI Use Manager X Reactor -0.25** (0.12) -0.25** (0.12) -0.15** (0.06)
PI Use OB X Oversight Body Monitor -0.17 (0.12)
PI Use OB X Oversight Body Partner -0.07 (0.08)
n 101 101 101 130 101
Adj. R2 0.178 0.201 0.210 0.079 0.177
F 4.26** 4.57** 4.89** 2.94** 4.07**
P(Fmoderated – Fmain > 0) 0.14 0.06 – –
Unstandardized coefficients; robust standard errors are reported in parentheses; * p < 0.1, ** p < 0.05 (two-tailed tests); effects were fixed at the country level.

27
Appendix: Measures
Variable Operationalizations
Organizational
Performance
(factor)
How successful do you think your museum is? Is there potential for
improvement?
Collecting (e.g. number of newly acquired art objects, stringency of
collection conception)
Preserving (e.g. number of restorations, quality and quantity of the
portfolio)
Researching (e.g. number of scientific publications, participation in
research projects)
Exhibiting and knowledge transfer (e.g. number of special exhibitions,
quality of educational services)
(1 = improvement potential is great, 5 = improvement potential is fully
exhausted)
Loadings
0.717
0.765
0.715
0.521
Performance
Measurement
(factor)
To what extent are the following types of performance data measured,
analyzed, and reported in your museum?
Cost accounting data
Information on target-performance evaluations
Output data
Data from visitor surveys
(1 = not at all; 5 = a great deal)
Loadings
0.678
0.806
0.768
0.650
Performance
Information Use by
Managers (M) and
Oversight Body
(OB)
(factors)
To what extent do the following actors demand performance
information?
M
OB
Museum Director
External Oversight Body
Internal Oversight Body
Chief Administrative Officer of the Museum
(1 = not at all; 5 = entirely)
0.937
0.066
-0.055
0.851
0.094
0.852
0.901
0.123
Strategic Stances We have focused on change and have tried to evolve. (Prospector)
We have concentrated on our strengths. (Defender)
We have reacted to the demands of our environment and adapted to them. (Reactor)
(1 = not at all; 5 = entirely)
Perception of
Oversight Body
We perceive our oversight body as a …
partner
monitor
(1 = not at all; 5 = entirely)
Modern
Management
(formative index)
Has your museum adopted the following instruments?
accrual accounting, cost accounting, internal budgeting, human capital accounting,
external target agreements, benchmarking with other museums, performance indicators,
Balance Scorecard, internal target agreements, reorganization of organizational structure
or processes, mission statement, strategic planning, action planning, strategic analysis
instruments (SWOT, portfolio, stakeholder, or scenario analysis)
(0 = no, 1 = yes)
Support Resources How many people work as management support staff in your museum?
1 = <2, 2 = 3-5, 3 = 6-10, 4 = >10
Innovative Culture Our museum is dynamic and entrepreneurial. People are willing to stick their necks out
and take risks.
(1 = not at all; 5 = entirely)
Public Ownership Who owns your museum? 1 = the public, 0 = others
Organization Size How many people work for your museum?
1 < 20, 2 = 20-50, 3 = 51-100, 4 = 101-150, 5 = 151-200, 6 = >200
28
References
Andrews, R., Boyne, G., Meier, K., O’Toole, L., & Walker, R. (2005). Representative
bureaucracy, organizational strategy and public service performance: An empirical
analysis of English local government. Journal of Public Administration Research and
Theory, 15(3), 489–504.
Andrews, R. Boyne, G., & Walker, R. (2006a). Strategy content and organizational
performance: An empirical analysis. Public Administration Review, 66(1), 52–63.
_______. (2006b). Subjective and objective measures of organizational performance: An
empirical exploration. In G. Boyne, K. Meier, L. O’Toole, & R. Walker (Eds.), Public
service performance: Perspectives on measurement and management (14–34).
Cambridge: Cambridge Univ. Press.
Andrews, R., Boyne, G., Law, J., & Walker, R. (2009). Strategy formulation, strategy content
and performance. Public Management Review, 11(1), 1–22.
Argyris, C., & Schön, D. (1996). Organizational learning: Theory, method, and practice.
Reading, Mass.: Addison-Wesley Pub.
Ban, C. (1995). How do public managers manage? Bureaucratic constraints, organizational
culture, and the potential for reform. San Francisco: Jossey-Bass.
Behn, R. (1994). Leadership counts: Lessons for public managers from the Massachusetts
welfare, training and employment program. Cambridge, Mass.: Harvard Univ. Press.
_______. (2012). Motivating and steering with comparative data: How the bar chart and “the
list” might help to steer social integration. International Public Management Review,
13(1), 21–37.
Bouckaert, G., & Halligan, J. (2008). Managing performance: International comparisons.
London: Routledge.
Boyne, G. (2002). Concepts and indicators of local authority performance: An evaluation of
the statutory frameworks in England and Wales. Public Money & Management, 22(2),
17–24.
_______. 2010. Performance management: Does it work? In R. Walker, G. Boyne, & G.
Brewer (Eds.), Public management and performance: Research directions (207–226).
New York: Cambridge University Press.
Boyne, G., & Chen, A. (2007). Performance targets and public service improvement. Journal
of Public Administration Research & Theory, 17(3), 455–477.
Boyne, G., & Gould-Williams, J. (2003). Planning and performance in public organizations:
An empirical analysis. Public Management Review, 5(1), 115–132.
Boyne, G., Meier, K., O'Toole, L., & Walker, R. (Eds.). (2006). Public service performance:
Perspectives on measurement and management. Cambridge: Cambridge Univ. Press.
Boyne, G., & Walker, R. (2004). Strategy content and public service organizations. Journal of
Public Administration Research and Theory, 14(2), 231–252.
_______. (2010). Strategic management and public service performance: The way ahead.
Public Administration Review, 70(s1), s185–92.
Brewer, G. (2005). In the eye of the storm: Frontline supervisors and federal agency
performance. Journal of Public Administration Research and Theory, 15(4), 505–527.
29
Bryson, J. (2012). Commentary: Performance information use and accountability. Public
Administration Review, 72(s1), 105–107.
Crampton, S., & Wagner, J. (1994). Percept-percept inflation in microorganizational research:
An investigation of prevalence and effect. Journal of Applied Psychology, 79(1), 67–76.
Davis, J., Schoorman, D., & Donaldson, L. (1997). Toward a stewardship theory of
management. Academy of Management Review, 22(1), 20–47.
de Lancer Julnes, P., & Holzer, M. (2001). Promoting the utilization of performance measures
in public organizations: An empirical study of factors affecting adoption and
implementation. Public Administration Review, 61(6), 693–708.
Eisenhardt, K. (1989). Agency theory: An assessment and review. Academy of Management
Review, 14(1), 57–74.
Hanushek, E., & Margaret, R. (2005). Does school accountability lead to improved student
performance? Journal of Policy Analysis and Management, 24(2), 297–327.
Hatry, H. (2006). Performance measurement: Getting results. Washington, D.C: Urban
Institute Press.
Ho, A. (2006). Accounting for the value of performance measurement from the perspective of
Midwestern mayors. Journal of Public Administration Research and Theory, 16(2),
217–237.
Hood, C. (2012). Public management by numbers as a performance-enhancing drug: Two
hypotheses. Public Administration Review, 72(s1), 85–S92.
Hvidman, U., & Andersen, S.C. (2013). The impact of performance management in public
and private organizations. Forthcoming in Journal of Public Administration Research
and Theory, doi:10.1093/jopart/mut019.
Jaccard, J., & Turrisi, R. (2003). Interaction Effects in Multiple Regression. Thousand Oaks,
CA: Sage.
Jensen, M., & Meckling, W. (1992). Specific and general knowledge, and organizational
structure. In L. Werin, & H. Wijkander (Eds.).Contract economics (251–274). Oxford:
Blackwell.
_______. 1996. Theory of the firm: Managerial behavior, agency costs, and ownership
structure. In P. Buckley, & J. Michie (Eds.). Firms, organizations, and contracts: A
reader in industrial organization (103–167). Oxford, NY: Oxford Univ. Press.
Johansson, T., & Siverbo, S. (2009). Explaining the utilization of relative performance
evaluation in local government: A multi-theoretical study using data from Sweden.
Financial Accountability & Management, 25(2), 197–224.
Kroll, A. (2013a). The other type of performance information: Nonroutine feedback, its
relevance and use. Public Administration Review, 73(2), 265–276.
_______. (2013b). Explaining the use of performance information by public managers: A
planned-behavior approach. Forthcoming in the American Review of Public
Administration, doi: 10.1177/0275074013486180.
Kroll, A., & Vogel, D. (2013). The PSM-leadership fit: A model of performance information
use. Forthcoming in Public Administration, doi: 10.1111/padm.12014.
Levitt, B., & March, J. (1988). Organizational learning. Annual Review of Sociology, 14, 319–
338.
30
Meier, K., & O’Toole, L. (2009). The proverbs of new public management: Lessons from an
evidence-based research agenda. The American Review of Public Administration, 39(1),
4–22.
Meier, K., O’Toole, L., Boyne, G., & Walker, R. (2007). Strategic management and the
performance of public organizations: Testing venerable ideas against recent theories.
Journal of Public Administration Research and Theory, 17(3), 357–377.
Melkers, J., & Willoughby, K. (2005). Models of performance-measurement use in local
governments. Public Administration Review, 65(2), 180–190.
Merchant, K., & Van der Stede, W. (2007). Management Control systems: Performance
measurement, evaluation and incentives. Upper Saddle River, NJ: Prentice Hall.
Miles, R., & Snow, C. (1978). Organizational Strategy, Structure, and Process. New York:
McGraw-Hill.
Mintzberg, H. (1975). The manager’s job: Folklore and fact. Harvard Business Review, 53(4),
49–61.
Moynihan, D. (2008). The dynamics of performance management: Constructing information
and reform. Washington, D.C: Georgetown Univ. Press.
Moynihan, D., & Pandey, S. (2005). Testing how management matters in an era of
government by performance management. Journal of Public Administration Research &
Theory, 15(3), 421–439.
_______. (2010). The big question for performance management: Why do managers use
performance information? Journal of Public Administration Research and Theory,
20(4), 849–866.
Nielsen, P. (2014). Performance management, managerial authority, and public service
performance. Journal of Public Administration Research and Theory, 24 (2), 431–458.
OECD [Organization for Economic Co-operation and Development]. 2007. Performance
budgeting in OECD countries. Paris: OECD.
O’Toole, L., & Meier, K. (2011). Public management: Organizations, governance, and
performance. Cambridge: Cambridge Univ. Press.
Ouchi, W. (1979). A conceptual framework for the design of organizational control
mechanisms. Management Science, 25(9), 833–848.
Pandey, S., & Moynihan, D. (2006). Bureaucratic red tape and organizational performance:
Testing the moderating role of culture and political support.” In G. Boyne, K. Meier, L.
O’Toole, & R. Walker (Eds.), Public service performance: Perspectives on
measurement and management (130–151). Cambridge: Cambridge Univ. Press.
Poister, T., Pasha, O., & Edwards, L. (2013). Does performance management lead to better
outcomes? Evidence from the U.S. public transit industry. Public Administration
Review, 73(4), 625–636.
Pollitt, C. (2006). Performance information for democracy: The missing link? Evaluation,
12(1), 38–55.
Pollitt, C., & Bouckaert, G. (2011). Public management reform: A comparative analysis.
Oxford: Oxford Univ. Press.

31
Proeller, I., Andersen, C., Hartz, N., Hengel, M., Kroll, A., Krause T., & Vogel, D. (2012).
Modernes Museumsmanagement: Ergebnisse einer Umfrage in Deutschland, Österreich
und der Schweiz. Berlin: Syncwork AG.
Simons, R. (1995). Levers of control: How managers use innovative control systems to drive
strategic renewal. Boston, MA: Harvard Business School Press.
Sun, R., & Van Ryzin, G. (2013). Are performance management practices associated with
better public outcomes? Empirical evidence from New York public schools.
Forthcoming in the American Review of Public Administration, doi:
10.1177/0275074012468058.
Taylor, J. (2011). Factors influencing the use of performance information for decision making
in Australian state agencies. Public Administration, 89(4), 1316–1334.
Van Dooren, W. (2011). Better performance management: Some single- and double-loop
strategies. Public Performance & Management Review, 34(3), 420–433.
Van Dooren, W., Bouckaert, G., & Halligan, J. (2010). Performance management in the
public sector. London: Routledge.
Van Dooren, W., & Van de Walle, S. (Eds). (2008). Performance information in the public
sector. How it is used. Hampshire: Palgrave Macmillan.
Van Slyke, D. (2007). Agents or stewards: Using theory to understand the government-
nonprofit social service contracting relationship. Journal of Public Administration
Research and Theory, 17(2), 157-187.
Verhoest, K., van Thiel, S., Bouckaert, G., & Lægreid, P. (2011). Governing public agencies
in the 21st century: International lessons and policy recommendations. Leuven: COST
Office.
Walker, R., & Boyne, G. (2006). Public management reform and organizational performance:
An empirical assessment of the U.K. Labour Government’s public service improvement
strategy. Journal of Policy Analysis and Management, 25(2), 371–393.
Walker, R., Boyne, G., & Brewer, G. (Eds.). (2010). Public management and performance:
Research directions. New York: Cambridge University Press.
Walker, R., Damanpour, F., & Devece, C. (2011). Management innovation and organizational
performance: The mediating effect of performance management. Journal of Public
Administration Research and Theory, 21(2), 367–386.
Wichowsky, A., & Moynihan, D. (2008). Measuring how administration shapes citizenship: A
policy feedback perspective on performance management. Public Administration
Review, 68(5), 908–920.
Whisman, M., McClelland, G. (2005). Designing, testing, and interpreting interactions and
moderator effects in family research. Journal of Family Psychology, 19(1), 111–120.
Zammuto, R., & Krakower, J. (1991). Quantitative and qualitative studies of organizational
culture. Research in Organizational Change and Development, 5, 83–114.
32
Bio
Alexander Kroll is Assistant Professor of Public Administration at Florida International
University. His research interest is in studying organizational effectiveness, employee
behavior, and particularly the roles of performance information, strategy, leadership, and
motivation. His research has been published (or is forthcoming) in journals, including the
International Public Management Journal, American Review of Public Administration, and
Public Administration Review.