Embed Size (px)
Citation preview
IZA DP No. 2015
Exploring the Nature of Loss Aversion
Eric J. JohnsonSimon GächterAndreas Herrmann
DI
SC
US
SI
ON
PA
PE
R S
ER
IE
S
Forschungsinstitutzur Zukunft der ArbeitInstitute for the Studyof Labor
March 2006
Exploring the Nature of Loss Aversion
Eric J. Johnson
Columbia University
Simon Gächter University of Nottingham, CESifo
and IZA Bonn
Andreas Herrmann University of St. Gallen
Discussion Paper No. 2015 March 2006
IZA
P.O. Box 7240 53072 Bonn
Germany
Phone: +49-228-3894-0 Fax: +49-228-3894-180
Email: [email protected]
Any opinions expressed here are those of the author(s) and not those of the institute. Research disseminated by IZA may include views on policy, but the institute itself takes no institutional policy positions. The Institute for the Study of Labor (IZA) in Bonn is a local and virtual international research center and a place of communication between science, politics and business. IZA is an independent nonprofit company supported by Deutsche Post World Net. The center is associated with the University of Bonn and offers a stimulating research environment through its research networks, research support, and visitors and doctoral programs. IZA engages in (i) original and internationally competitive research in all fields of labor economics, (ii) development of policy concepts, and (iii) dissemination of research results and concepts to the interested public. IZA Discussion Papers often represent preliminary work and are circulated to encourage discussion. Citation of such a paper should account for its provisional character. A revised version may be available directly from the author.
IZA Discussion Paper No. 2015 March 2006
ABSTRACT
Exploring the Nature of Loss Aversion*
Loss aversion, the fact that losses have a greater impact than gains, is a fundamental property of behavioral accounts of choice. In this paper, we suggest four possible characterizations of the relative impact of losses and gains: (1) It could be a constant, such as the much cited value of 2, as in losses have twice the impact of gains. (2) It could be a systematic individual difference, with some individuals more or less loss aversion, (3) it could be a property of the attribute, or (4) a property of the different processes used to construct selling and buying prices. We examine the behavior of a large sample of auto buyers using an experiment which allows us to measure loss aversion, at the individual level for several different attributes. A set of hierarchical linear models shows that to understand loss aversion, one must consider the process used to construct prices. Interestingly, we show that knowledge of the attribute lowers loss aversion and that age and attribute importance increases loss aversion. JEL Classification: C90, M31, D11 Keywords: loss aversion, consumer choice, reference-dependent preferences Corresponding author: Simon Gächter School of Economics Sir Clive Granger Building University Park Nottingham NG7 2RD United Kingdom Email: [email protected]
* The authors would like to thank Larry DeCarlo and Jim Corter of Teachers College at Columbia University for advice on the analysis of this data. This research has been supported by NSF Grant SES-0352062 to the first author.
Exploring the Nature of Loss Aversion 3
Introduction
Imagine you were shopping for a new car, and had your eye on a model with
safety features such as a front and side airbags for all passengers and integrated safety
bars in the door. However, you now see a car that is identical in every respect, but
without the airbags and safety bars. How much cheaper would this second car need to be
for you to choose the less safe car? Now imagine you had instead, tentatively chosen a
car without these safety features and were offered a choice between keeping your original
choice and an amount of cash or getting the safer car. How much cash would you want
to stay with the car you had chosen?
Standard economic theory and common sense suggest that the amount of money
that you would demand in each case should be identical. The two situations have
identical outcomes; the only difference is how they are framed. In the first scenario, you
are giving up safety for cash; in the second scenario, you are choosing between amounts
of cash and added safety. However, we suspect the reader shares the intuition that the
amount required in each case would differ, and that we would demand more money to
give up the additional safety features than we would be willing to pay for them.
This contrast in value, between a selling price and the economically equivalent
choice, is one of the better documented departures from the standard economic analysis.
It originates in observations of gaps between buying and selling prices in studies of the
value of non-market goods, and in experimental demonstrations of an endowment effect.
In these studies people who are randomly assigned possession of a simple commonplace
Exploring the Nature of Loss Aversion 4
good, such as a pen, mug or keychain, value it about twice as much as those who were
not given the object, but given the opportunity to purchase it.
Why are these asymmetries in value important? First, they contradict an
important principle used in applications of economic theory, the Coase Theorem.
Simply stated, the Coase Theorem says that value is independent of initial assignment, so
that as long as the opportunity to trade exists, goods will end up with those who value
them the most. This has been an important rationale in the regulation of air pollution, the
allocation of stocks in antitrust regulation, and in use of defaults in public policy. For
consumer choice, these asymmetries have pervasive implications, suggesting that
elasticities for product attributes will differ for increases and decreases from current
levels, and that there will be less trading and more loyalty than would be suggested by a
standard value maximization model.
In marketing, most examination of these asymmetries has focused on pricing and
concentrated on demonstrations of the impact of reference prices upon choice. However,
such effects should not be limited to price alone, and have been demonstrated for many
attributes, suggesting that understanding the nature and origin of this kind of state
dependence is essential for explaining and predicting consumer choice.
The most frequent explanation for these differences is loss aversion, the
observation that losses from a reference point have a greater impact upon choices than the
equivalent sized gain from the same reference point. This is usually modeled by adding
a multiplier, λi , for each attribute, Xi, which is applied to deviations below the reference
point, increasing their impact. Following Tversky and Kahneman (1991), we write:
Ri(xi)= ui(xi) – ui(ri) if xi ≥ ri and Ri = λi(u(xi) – u(ri)) if xi < ri .
Exploring the Nature of Loss Aversion 5
Despite its broad impact, we know less, perhaps, than we might like about the
nature of loss aversion and how it might vary across people, attributes and measures. In
this paper, we discuss possible characterizations of loss aversion and examine a large
survey of consumers for evidence which might help us understand the nature of loss
aversion.
Characterizing Loss Aversion
Is Loss Aversion Constant?
While it is clearly an oversimplification, a useful baseline model would be to
suggest that loss aversion is a constant, across people and attributes. However, such a
view does appear in textbooks, for example Hastie and Dawes (2001, p. 216) write:
“Losses hurt more than gains satisfy; most empirical estimates conclude that losses are
about twice as painful as gains are pleasurable.” And “The coefficient λ indexes the
difference in slopes of the positive and negative arms of the value function. A typical
estimate of λ is 2.25, indicating that losses are approximately twice as painful and gains
are pleasurable (p. 294).”
Is Loss Aversion a Trait?
An alternative characterization of loss aversion would be that it might be a stable
individual difference, much like a personality trait, that exists across attributes. By
analogy to risk aversion, we might characterize individuals as more or less loss averse.
While the extant data suggest that risk attitude does differ across domains, there is little
evidence examining loss aversion. However, this characterization of loss aversion would

Exploring the Nature of Loss Aversion 6
seem to have a clear prediction, that loss aversion should be correlated across attributes:
One who is loss averse for money should be loss averse for other attributes such as the
fuel consumption of a car. This could be quite useful in applications. For example, Fehr
and Goette (2002) use an individual difference measure of loss aversion to predict how
long bicycle messengers will work, once a target wage has been reached. Thus, a person-
specific measure of individual loss aversion across attributes λj might be a useful
predictor of individual behavior.
Is Loss Aversion a Characteristic of an Attribute?
The use of a subscripted λi in Tversky and Kahneman’s reference dependence
model (1991) suggests that loss aversion might vary systematically across attributes.
Empirically, there is evidence of large differences in the degree of loss aversion
associated with different attributes. Sayman and Oncular (2005), in a meta-analysis of
the ratio between buying and selling prices, report a range from 1 (equality) to over 100.
Their meta-analysis identifies attributes which help determine the level of loss aversion:
goods related to health, the environment, or trade in goods not legitimately bought or
sold. Another line of reasoning is suggested by Dhar and Wertenbroch (2000), who
argue that hedonic attributes possess more loss aversion than do utilitarian attributes.
Similarly, Heath et al. (2000) argue that loss aversion for quality attributes is greater than
that for price, a result supported as well by Hardie, Johnson and Fader (1993). Finally,
Tversky and Kahneman speculate that loss aversion is a function of attribute importance.
Loss aversion as an attribute characteristic has an appealing simplicity. The
technology exists for estimation both in scanner (Hardie et al. 1993; Putler 1992) and
survey data (Fehr and Goette 2002), and if loss aversion is largely determined by the
Exploring the Nature of Loss Aversion 7
nature of the attribute, the use of a representative loss averse consumer in analytic
modeling is much simplified. Clear support for an attribute based view of loss aversion
would come from data showing that the variability in λ across attributes is large, relative
to individual differences in λ.
Is Loss Aversion the Result of a Process?
A fourth alternative is that loss aversion reflects neither a characteristic of the
person nor attribute, but reflects the process used to construct judgments of value. In this
view, loss aversion is not as much an inherent parameter of preferences, but a robust
outcome of the way values are constructed (Fischer et al. 1999; Fischhoff 1991; Payne et
al. 1992; Slovic 1995). Work in characterizing the processes that generate loss averse
preferences is just beginning, but there seem to be two candidates, one based on the
interplay between memory and value construction, the other based on the role of affect in
value construction.
Building on work that suggest that loss aversion and difference in buying and
selling prices shift the focus of decision makers (Birnbaum and Stegner 1979; Carmon
and Ariely 2000), Johnson, Häubl and Kienan (2005) propose a query theory account of
the endowment effect. The basic idea is that the request for valuation, for example a
selling price, is decomposed into two queries: Why the trade should be made, and why
the trade should not be made. A second assumption is that these queries are executed
sequentially, but in different orders for sellers and choosers. Finally, Johnson et al. argue
that retrieval of the first category interferes with retrieval from the second category,
resulting in a richer representation for the first category and the resulting differences in
value. Evidence for this is provided in a series of experiments which shows that (1) the
Exploring the Nature of Loss Aversion 8
buyers and chooser do generate aspects of the trade in the hypothesized manner; (2)
changing the query order generates changes in what is generated, and hence the
subsequent value for the good, inducing an endowment effect without endowment; and
(3) changing the query order can eliminate the endowment effect.
Because this account is memory-based, it can leverage the existing literature
describing interference and inhibition to make several predictions (Weber and Johnson
2004). In particular, since the mechanism described by Johnson et al. is related to
interference in part list cuing and inhibitory mechanisms in retrieval induced forgetting
(Anderson et al. 1994; Anderson and Neely 1996; Perfect et al. 2002), variables which
affect interference may affect the degree of loss aversion.
Past research suggests that two types of variables seem particularly relevant. The
first is the degree to which knowledge is well structured. For example, one may possess
many facts about a domain, but they may be structured in a well-organized hierarchy.
Because experts’ knowledge is better organized and less prone to interference (Alba and
Hutchinson 1987), we expect knowledge of the attributes to lead to decreases in
interference and accompanying decreases in loss aversion. A good example of this
principle is demonstrated in research on the “fan effect” (Anderson 1974), in which
learning a larger set of facts about a particular category typically increases the amount of
time it takes to verify later on whether any one fact is true of the category (Anderson,
1974; (Anderson and Reder 1999; Lewis and Anderson 1976). These effects are reduced,
however, when the facts which one learns are organized into subcategories (McCloskey
and Bigler 1980) – a type of organization that is particularly likely when an individual
has expert knowledge in a given domain (Chase and Ericsson 1981).
Exploring the Nature of Loss Aversion 9
A second variable known to affect the degree of interference is age. Increases
in interference are well documented for older adults, and it has even been argued that
many deficits in memory that accompany aging are due in fact to increases in
interference. In particular, research has shown that older adults relative to younger adults
show greater inability to avoid interference on short-term memory and Stroop tasks
(Hedden & Park, 2001; Spieler, Balota, & Faust, 1996); to engage in directed forgetting
(Zacks et al. 1996) and to ignore irrelevant information on reading tasks (Connelly et al.
1991). Not surprisingly, then, research has also shown a tendency for older adults to be
more susceptible than younger adults to part-set cuing effects. In one particularly
rigorous set of studies, Marsh, Dolan, Balota, and Roediger (2004) produced part-set
cuing effects in older adults that did not occur in younger adults: Just 1 cue in a 9-item
set was sufficient to induce a part-set cuing effect in the older age group. Because we
believe that interference plays an important part in generating loss aversion, we would
expect increases interference with age to produce increases in loss aversion.
A second stream of research examining the origins of loss aversion focuses on the
feelings of sellers and choosers. Reported affect concerning ownership predicts, in part,
differences in the valuations (Peters et al. 2003), and it has been demonstrated that
different types of induced negative affect can increase or reverse the endowment effect
(Lerner et al. 2004). Camerer (2005) has speculated that fear may underlie the
endowment effect. To maximize sample size, external validity, and number of variables
we examine, we used a large market research survey. We will not focus on affect-based
explanations of the endowment effect in this research because of the difficulty of
Exploring the Nature of Loss Aversion 10
conducting either affect manipulations or using sensitive measures of affect in a survey
setting.
Is Loss Aversion Real?
Finally, several skeptical economists have recently called into question the
robustness of loss aversion. One stream of research has suggested that loss aversion is
limited to those inexperienced with markets. For example, List (2003; 2004) examines
gaps between selling and buying for inexperienced and experienced traders of sports
memorabilia and argues that loss aversion disappears when experienced traders are
buyers and sellers. In addition, he presents evidence that loss aversion is reduced across
rounds of a laboratory repeated market. Even less skeptical economists propose effects
of experience, suggesting that loss aversion is limited to less experienced subjects—see
the field studies of New York taxi drivers (Camerer et al. 1997) and real estate markets
(Genesove and Mayer 2001). However, more research seems necessary, since Haigh and
List (2005) provide experimental evidence that experienced options traders show more
loss aversion than students do.
A more serious critique is provided by Plott and Zeiler (2005), who argue that
loss aversion is a result of miscomprehension of the experimental situation by
respondents and who demonstrate that, with significant instruction and experience, gaps
in evaluation between sellers and choosers disappear. One critique of this work is that
the levels of instruction are extraordinary and unlikely to appear in real world settings.
A stronger criticism is that this work suffers from demand effects, since the intent of the
experimenter may be obvious to respondents. Despite the large number of field studies
demonstrating loss aversion (Camerer 2000), there seems to be some value in examining

Exploring the Nature of Loss Aversion 11
the existence of loss aversion in experienced consumers. In addition, to the extent that
miscomprehension is a factor in loss aversion, we might want to examine the effects of
education or variables which might minimize miscomprehension.
The Data
Overview
We will explore these issues by asking a series of questions about the size and
nature of the coefficient of loss aversion λij, for various attributes, i, and consumer, j,
characteristics. We used a survey of 360 people conducted by personal interviews by a
professional market research company. These consumers had recently purchased a mid-
sized family sedan. They participated in two interviews, held several weeks apart, in
return for 50€. All were German-speaking and resided in one of thirty cities in Austria,
Germany and Switzerland.
Using data like this has several advantages: All consumers are familiar with the
product and have just made a substantial purchase in the product class, and the use of
non-student subjects provides substantial variance on many of the independent variables
of interest. At the same time, there are constraints and limitations: We are limited to
pencil and paper instruments, and some results, particularly the intercorrelation between
demographic variables, may not be typical of other populations and samples.
Experimental Design and Questionnaire
All substantive experimental factors were varied within subjects. They included
our main concern a 2 (selling vs. choosing) by 4 (attribute) factorial which elicited
Exploring the Nature of Loss Aversion 12
indifference prices. The questions closely paralleled the situation we presented at the
beginning of this paper. Our goal was to estimate λ both within attributes and
individuals. We did this by asking both choice and selling questions, counterbalancing
for order. To make these as independent as possible, we positioned these questions some
distance apart in the questionnaire, but also tested for any possible order effects.
Appendix 1 provides an English translation of the relevant sections of the questionnaire.
Order and Level Controls
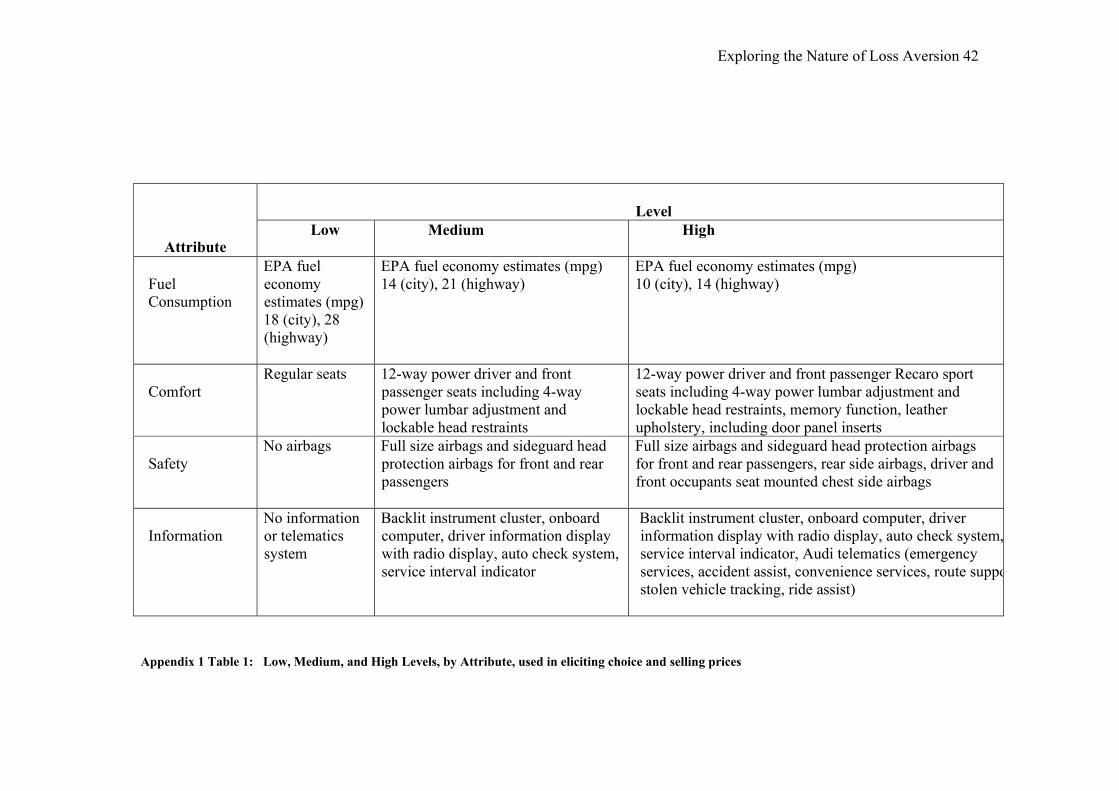
To assess the generality of our estimates, we collected them using three different
levels of each attribute as shown in the appendix.1 We did this because any simple
comparison of Selling and Choice prices reflects both loss aversion and possible
diminishing sensitivity of the attribute (see Köbberling and Wakker 2005 for a
discussion). By comparing the aggregate estimates of λ across the three possible
comparisons, we can examine the robustness of our results.
Other Measures
Respondents were asked for buying and selling prices for a small replica of the
car that they had purchased using a strategy method. This replica usually retailed for 15
€. These transactions were actually carried out at the end of the session. We also asked
respondents to indicate which of the following set of lotteries they would play, fashioned
after the gambles used by Fehr and Goette (2002), and these were played out at the end of
the session as well. These lottery choices arguably measure loss aversion. For detailed
analysis of these measures from the larger set of respondents see Gächter, Herrmann and
Johnson (2005).
Exploring the Nature of Loss Aversion 13
Preliminary Data Analysis
We present our results using a mix of descriptive statistics for clarity, but also
using a random coefficient model to provide a nested structure for the major hypotheses
test. Intuitively, this can be seen as a test of a series of more complex models, starting
with the simplest of all possible regressions, using only a constant, and then introducing
random effects representing subject differences, attribute differences, and various
predictor variables which we hope both predict loss aversion and potentially diminish
individual and attribute differences.
Results
Is Loss Aversion a Constant?
While the idea of loss aversion as a constant is clearly greatly simplified, it does
serve as a baseline for subsequent tests. The overall mean estimated λ in this sample is
1.85, and a simple regression model, estimating just this constant, serves as a baseline as
shown in the first row of Appendix 2, Table 1.
Is Loss Aversion a Trait?
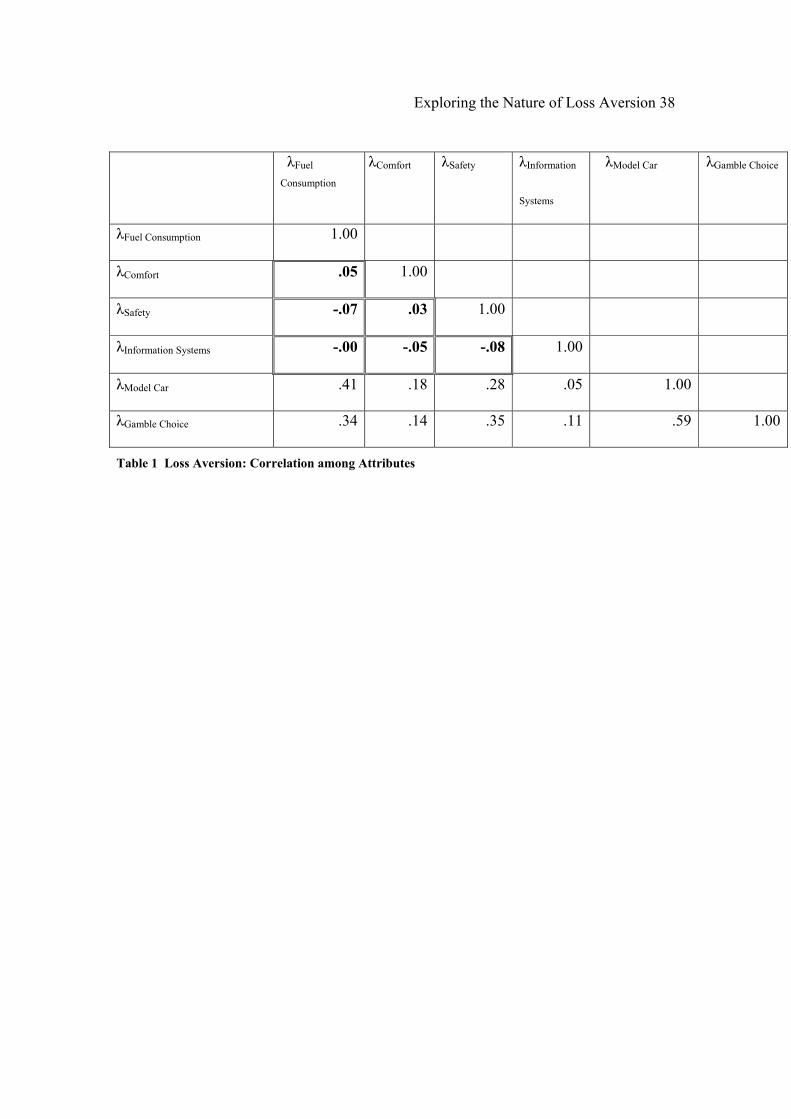
Loss aversion as a characteristic of the individual is tested in Table 1, which
shows the inter-attribute correlations among the four car attributes which are the primary
focuses of this paper. The relevant intercorrelations are bolded in the table. None of
these correlations reach significance. In contrast, we include the two measures, reported
in the Gächter et al. paper, which are more direct measures of loss aversion for money:
Setting actual buying and selling prices for a model replica of the purchased car, and

Exploring the Nature of Loss Aversion 14
choices among actual gambles. In contrast to the car attributes, these two methods
correlate quite highly, r = .59, p < .0001. This suggests that it is possible for measures of
loss aversion to agree, and that the lack of correlation we see is not due to response error.
In fact, the correlation between these two measures is impressive, since the buying and
selling prices are judgments of riskless value, while the gambles are risky choices.
While these measures of monetary loss aversion have some modest correlation with loss
aversion for the car attributes, there seems little evidence for the description of global
loss aversion across attributes.
We provided a more formal test, by adding a random effect representing
individual differences (See Table 1, Model 2, Appendix 2) in loss aversion to the model
describing loss aversion for the car attributes as a constant. In essence, it is the
equivalent of a repeated measures ANOVA, allowing for personal overall levels of loss
aversion. This model shows little improvement in fit, and the variance component
representing individual differences does not reach significance. Thus the idea that loss
aversion is a trait across attributes has little support in this data.
Is Loss Aversion a Characteristic of an Attribute?
Prior research describes attribute differences in loss aversion, as measured by the
ratio of selling to choosing (or buying) prices, and there has been significant theorizing
about the origin of these differences. This data allows us to examine these differences
across a set of attributes and to contrast these effects with other sources of variance, such
as individual differences. Further, we can examine some of the determinants of these
differences.
Exploring the Nature of Loss Aversion 15
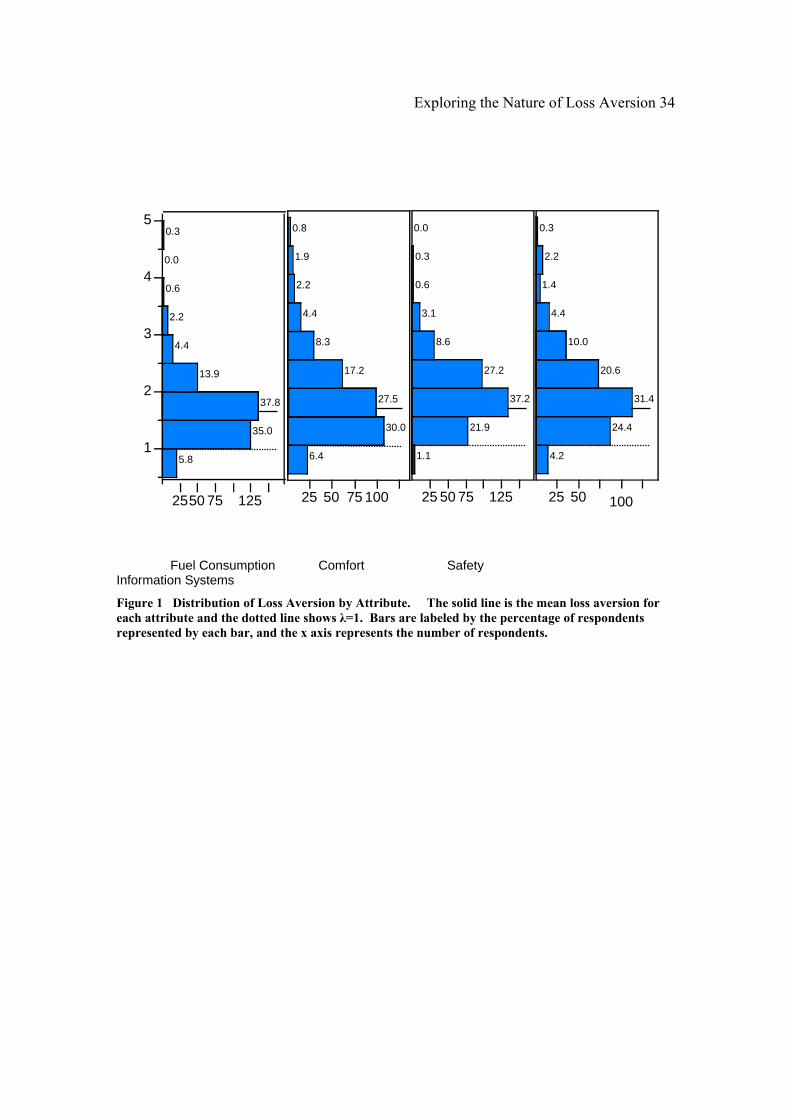
We start by looking at the dispersion of loss aversion across people and attributes.
Figure 1 displays the distribution of λij’s for each of the four attributes that we used,
calculated simply by: Selling Price/Choice Equivalence. As can be seen in the Figure,
the vast majority (greater than 93% in each case) of the λij’s are greater than 1, consistent
with individuals being, for the most part, loss averse. As can also be seen, there is
significant heterogeneity in loss represented by the considerable variance in λijs. The
coefficients of loss aversion also differ across the attributes, λFuel Consumption = 1.66, λcomfort
= 1.89, λsafety = 1.89, and λinformation=1.94, with median values of 1.56, 1.68, 1.83, and 1.80
respectively. These differences, however, seem much smaller than the appreciable
variation in the loss aversion within each attribute. 2
What determines these differences, and the marked variance? One possibility is
that individuals’ perceptions of the characteristics of the attributes determine loss
aversion. In other words, the distributions in Figure 1 may really reflect attribute
differences, but that people differ in their perception of the attributes For example,
Tversky and Kahneman’s (1991) speculation that attribute importance determines loss
aversion requires that we include a measure of individual perceptions of attribute
importance. Similarly Dhar and Wertenbroch (2000) suggest that the hedonic nature of
an attribute leads to loss aversion. Fortunately, we can test these ideas by including
individual ratings of importance and of the hedonic nature of each attribute which were
collected at the same time as the pricing judgments.
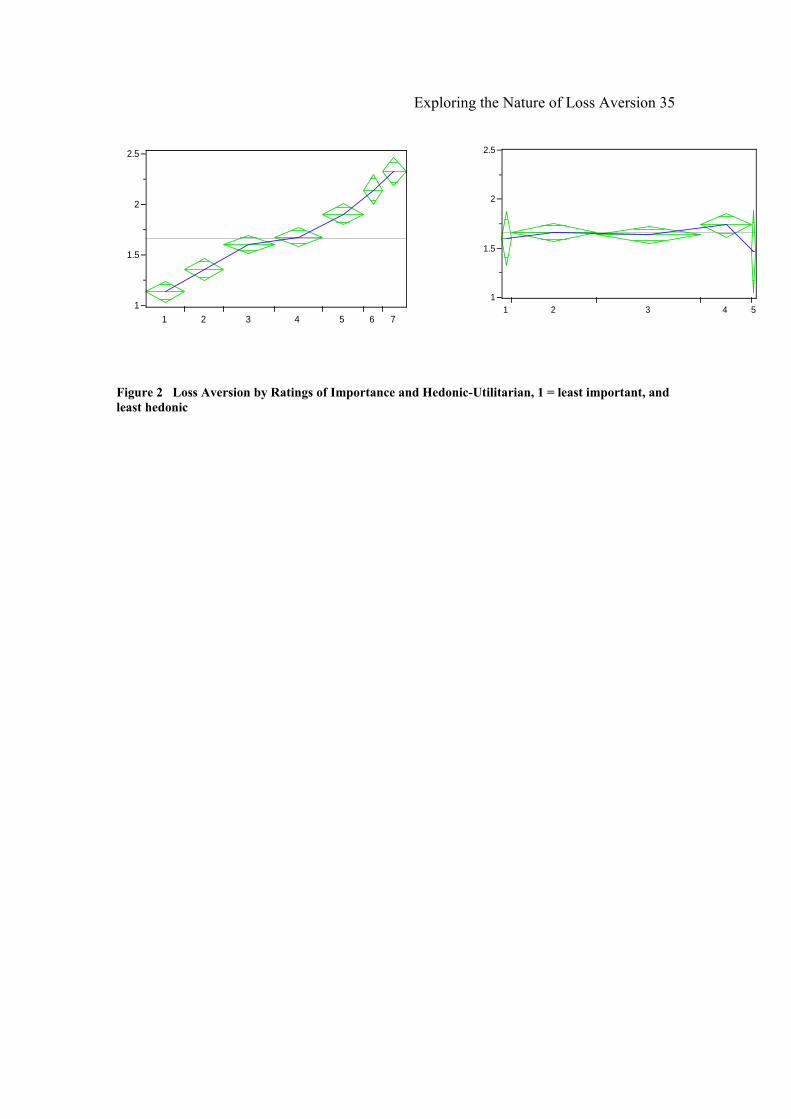
We first portray the effects of importance and attribute hedonics by examining the
level of loss aversion for the levels of the response scale, shown in Figure 2. The figures
portray the mean level of λ for each level of the 7-point rating scale, with the height of
Exploring the Nature of Loss Aversion 16
each diamond representing the error around the mean and the width representing the
number of observations corresponding to that mean. Since each graph shares the same x-
axis scale, we can compare the effects of different variables upon loss aversion. For
example, in Figure 2 it is clear that attribute importance affects loss aversion, but that
respondents’ ratings of an attribute as hedonic or utilitarian do not. This latter result is
contrary to the idea that hedonic attributes are more loss averse (Dhar & Wertenbroch,
2000; see also Horowitz, 2002), at least given our measures. The right hand of the figure
also suggests that very few respondents considered these attributes to be very hedonic,
since almost all of their responses were below 4 on the seven point scale, as shown by the
broad diamonds for those scale values.
To test these observations more formally, we estimated two hierarchical models
(see Appendix 2), the first of which allows attributes to have different degrees of loss
aversion. The resulting model (Model 3) allows attributes to differ in loss aversion,
provides a significant increase in fit, p < .0001, and a lower BIC. 3 The effect of
attribute is significant, F (3, 1077) = 11.65, p < .0001. This model confirms that the λFuel
Consumption is significantly less than that for the other attributes, which do not differ from
each other.
However the real story is contained in a model (Model 4) which includes
importance and hedonics in an attempt to explain the considerable variation within the
attributes. The regression shows that the attribute’s importance rating is a strong
predictor of loss aversion, but that the relationship between the perception of an attribute
as hedonic and loss aversion is not. To characterize the relationship with importance, we
note that for every point increase in rated importance (on a 7 point scale), λij increases by
Exploring the Nature of Loss Aversion 17
.26. We also estimated a more complex model (Model 5) which nests the attribute
characteristics within each attribute. This allows us to assess the degree to which the
effect of these attribute characteristics differs across attributes. This results in a
significant increase in fit, but produces largely the same story: The perception of an
attribute as hedonic does not predict the degree of loss aversion, but perception of the
attribute as important does. The nested model simply indicates that the effect of
importance is greater for comfort and information systems, but that the effect is
significant for all attributes.
While the effect of attribute importance is large, we offer two observations.
First, it does not account for much of the variation in the attribute differences, since the
attribute differences remain significant. Second, while the effect of importance is large,
its theoretical role seems unclear: What exactly is reflected by a respondent’s rating of
attribute importance? We will return to this point in the discussion.
Is Loss Aversion the Result of a Process?
While we obviously do not directly observe the processes used to generate these
loss averse valuations, process based theories do make predictions concerning the
relationship between loss aversion and individual characteristics. One set of predictions
concerns the effect of age, the other knowledge of the attributes.
Age and other Demographic Differences
We first examined the ability of the demographic differences to explain the
variance in the individual level coefficients of loss aversion seen in Figure 1. Recall that
our questionnaire collected information about the respondents’ gender, age, income,
occupation, education, and household wealth.
Exploring the Nature of Loss Aversion 18
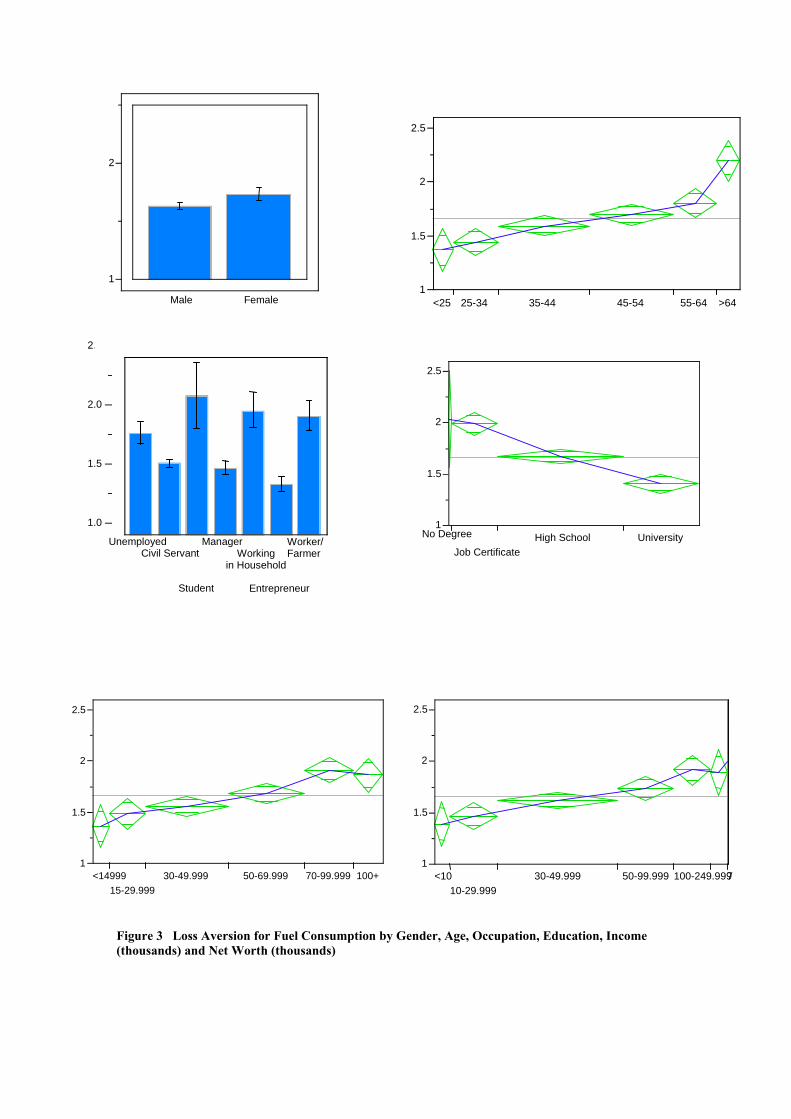
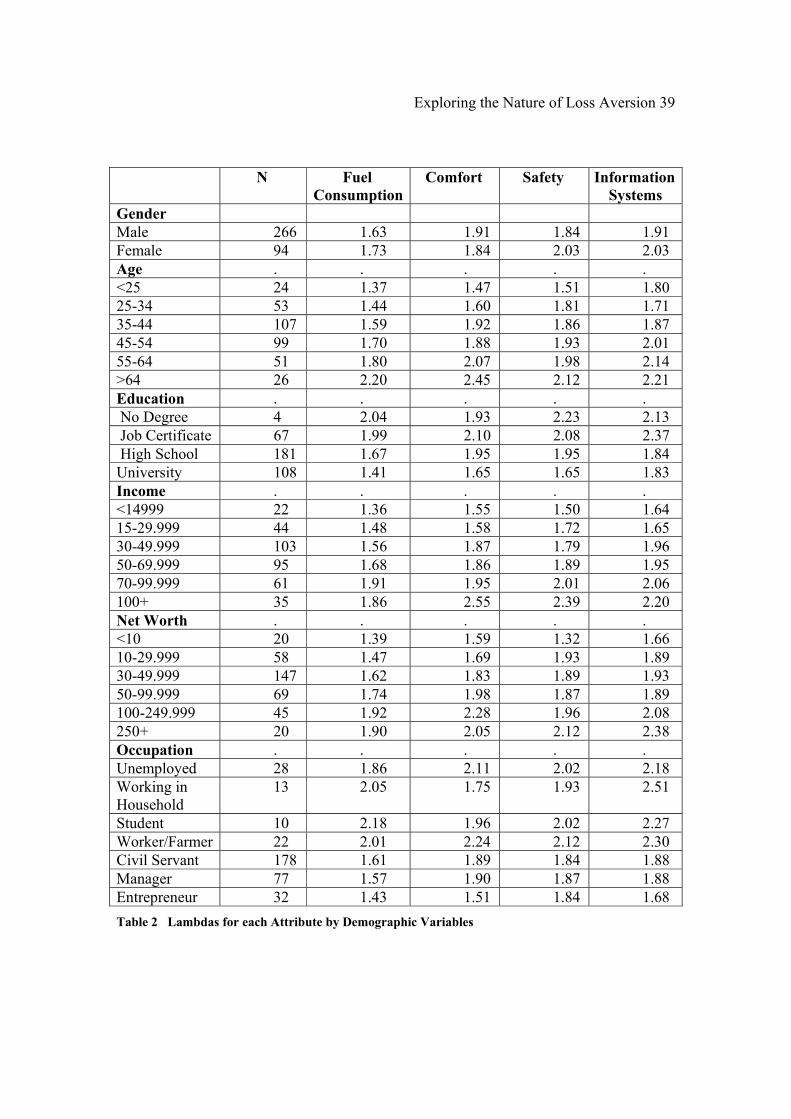
Figure 3 plots the average λij across the variables gender, age, income, wealth
education and occupation; for one attribute, fuel consumption. This pattern is similar for
all four attributes, but Table 2 reports the λij for all attributes and demographics.
Concentrating first on Age, in the upper right hand of the figure, we see, as expected, a
rather strong effect: The youngest respondents in our sample have an average loss
aversion coefficient of 1.4, the oldest, 2.4. Thus age seems to be an important moderator
of loss aversion.4
Surprisingly, there are large and systematic differences for many other
demographic measures. For the nominal variables of gender and occupation, we present
histograms with error bars; for the ordinal variables of age, education, income and
wealth, we again present a mean diamond, whose height contains confidence intervals
around the mean, and whose width indicates the size of the group.
What emerges then is a surprisingly strong and systematic pattern. Our theorized
effect of age is accompanied by a large effect for education, which decreases loss
aversion, and effects of income and wealth which increase loss aversion. Occupations
seem best described by two groups: Unemployed, Students, People working at home,
and Workers/Farmers; who are more loss averse than Managers and Entrepreneurs.
Finally, there are no systematic gender differences.
Of course these variables are interrelated, and what appears to be an effect of one
variable, say income, could be due to correlated differences in other variables, such as
age. Since age is of theoretical interest, we explore this possibility by estimating a
hierarchical model (Model 6) described in Appendix 2, using all the demographics in
Exploring the Nature of Loss Aversion 19
Figure 3 as predictors. Although our data set has a fairly large number of
respondents, we collapse across several infrequent categories to increase statistical
power. The result simplifies the picture: age and income are still significant predictors
of loss aversion. Education is no longer significant, and wealth and occupation are now
only marginal predictors, p = .1 and .07 respectively. Gender remains an insignificant
predictor. We can also test whether these demographic differences differ across
attributes by examining the attribute by demographic interactions. This shows no
differences in the pattern of demographic effects among the attributes.
To summarize, our analysis shows the effect of age predicted by a memory based
account of loss aversion: Older people are more loss averse. There is also an unexpected
effect: Those with higher levels of income display greater loss aversion.
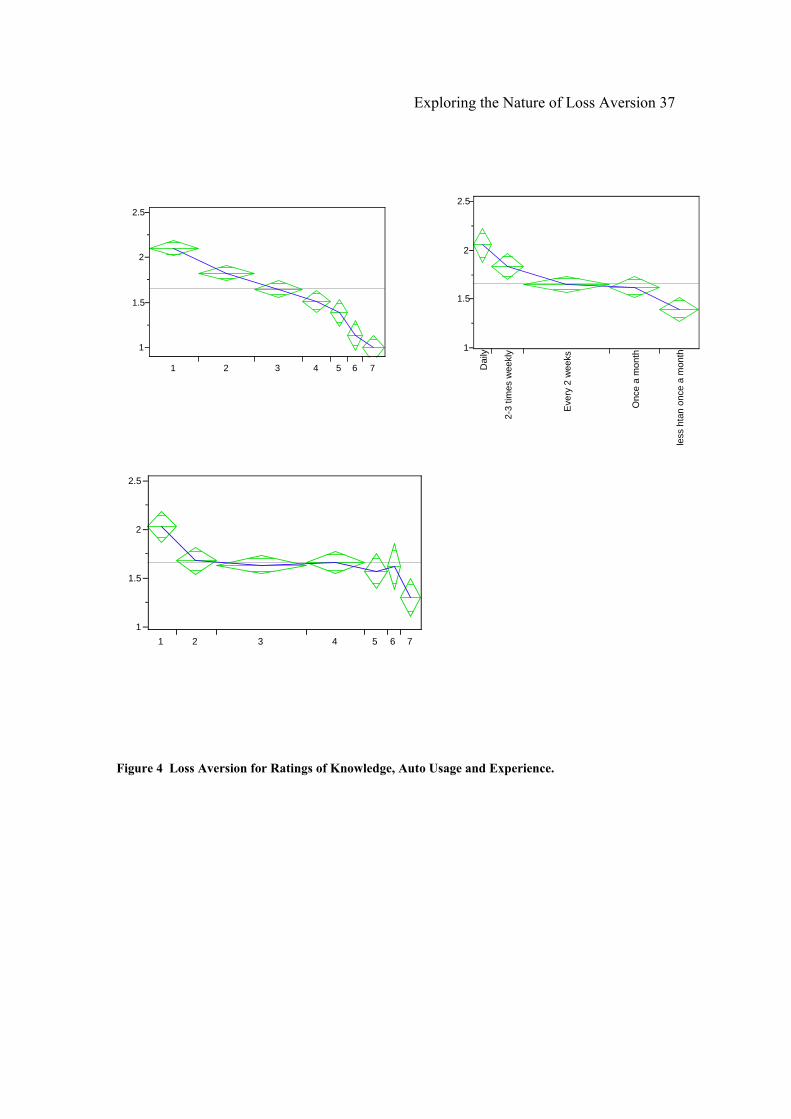
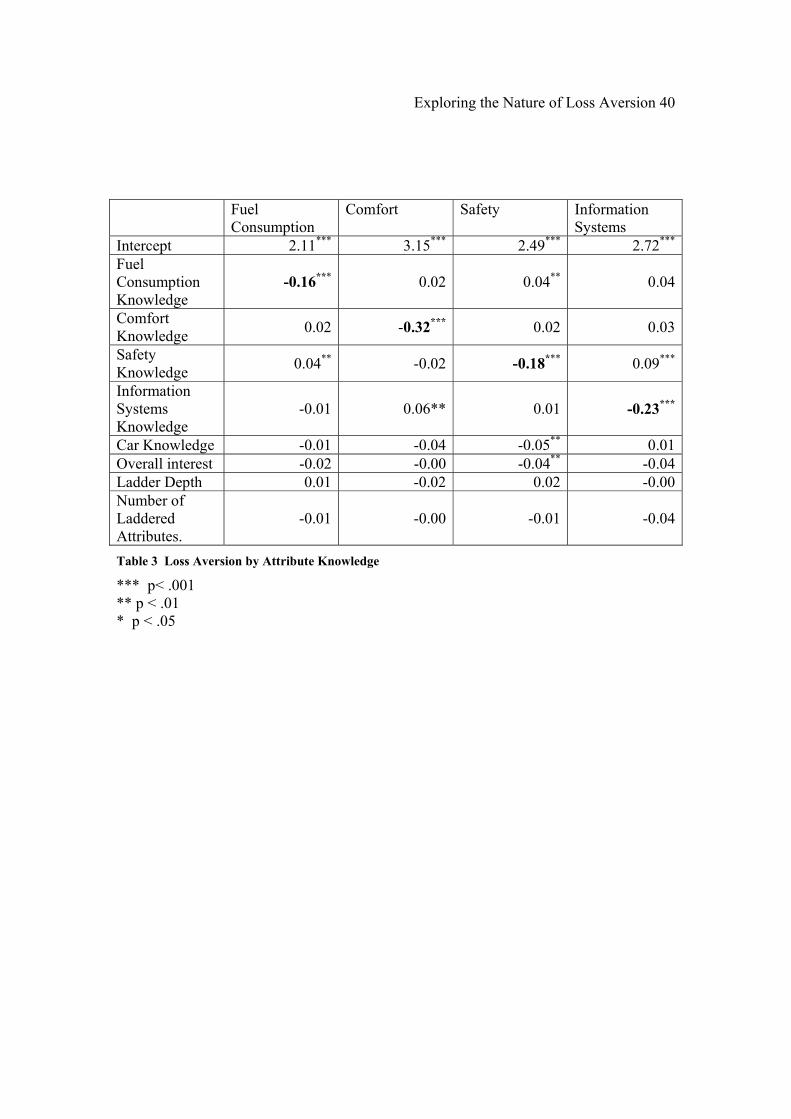
Knowledge Differences
Recall that query theory predicted that an increase in knowledge of an attribute
may lead to a decrease in loss aversion. If we believe that increases in knowledge are
accompanied by increases in the structure of that knowledge, we would expect inhibition
to have less effect and for loss aversion to diminish with knowledge. Initial evidence is
provided in the first panel of Figure 4, which depicts the mean amount of loss aversion
for each point in the knowledge scale. Clearly knowledge of the attribute has an effect.
We examined this hypothesis more formally by predicting loss aversion using an
attribute-specific rating of knowledge, as well as self-ratings of overall knowledge and
interest in cars, and two measures based on a laddering exercise (Jolly et al. 1988). These
laddering exercises, common in commercial marketing research, are thought to assess
aspects of the overall representation of the product. The overall fit (see Model 7,
Exploring the Nature of Loss Aversion 20
Appendix 2, Table1) is slightly better than that provided by the ratings of importance and
attribute hedonics. Only knowledge of the specific attribute predicts loss aversion, F (1,
1076) = 693.7, p < .00001. We can further improve the fit of the model by allowing the
weights of the knowledge variables to vary by attributes (Model 8).
To explore this more closely, we performed simple regressions on the loss
aversion measures for each of the four attributes, using the self ratings of knowledge of
each of the attributes as well as overall measures of the knowledge of cars and laddering
measures. To test the specificity of each predictor, we included not only the individual
coefficient for the specific attribute but also for the knowledge ratings of the other
attributes. Thus for the individual λ for comfort we include as predictors, not only the
self rating of knowledge for comfort, but also that for fuel consumption, safety and
information, with the expectation that the coefficients for comfort would far exceed the
predictive power of other coefficients. As can be seen in Appendix 2, Table 1, attribute-
specific ratings of knowledge produced significant decreases in loss aversion, as can be
seen by the diagonal of coefficients, and were much larger effects than any others. On
average, a 1 point increase in the self-rating of attribute-specific knowledge reduces λ for
that attribute by .16 for Fuel Consumption, .32 for comfort, .18 for Safety and .23 for
Information Systems. An important result of this analysis is that the effect of knowledge
is largely attribute-specific; coefficients on the diagonal (bolded in the figure) are always
significant and much larger than those off the diagonal. In addition, self ratings of
knowledge, the results of a laddering exercise, and self reports of overall interest had
little systematic effect upon loss aversion. Thus, as suggested by query theory, specific
knowledge of the attribute reduces loss aversion. Because this reduction is attribute-

Exploring the Nature of Loss Aversion 21
specific, and not due to other measures of general knowledge and interest, it seems less
likely that a non-memory based, motivational explanation would apply.
Experience Differences
Recall that prior research has argued that experience in markets diminishes loss
aversion. While we do not have direct measures of experience in making sales and
purchases of automobiles, we do have several self report measures of experience, and can
therefore test the related hypothesis that product experience affects loss aversion. As seen
in the second and third panels of Figure 4, an increase in experience with this product
class and usage decreases loss aversion. Note, however, that these decreases seem more
modest than those we have seen for knowledge or importance.
We examined this more formally using the hierarchical model employing the self
report measures of car usage, and experience with cars described in Appendix 2. This
model (Model 10 in Appendix 2, Table1) provides a significant decrease in loss aversion.
Both the self report measure of experience and usage are significant predictors, p < .0001.
Of course, experience and usage may be correlated with other factors, which lead us to
our last model.
Joint Prediction
We have examined many different predictors of loss aversion. Some are based on
prior speculation about attributes; these include attribute importance or the hedonic
nature of the attribute. Others follow from speculations about the nature of the decision-
maker and their experience with the transaction. Finally, others follow from a memory-
based view of loss aversion, termed query theory, which focuses on knowledge of the
attribute and the age of the decision maker. We are cautious conducting a ‘horse race’
Exploring the Nature of Loss Aversion 22
evaluating these predictors because the results may be fairly limited to this product class
and measures, and because these constructs have different theoretical status. However,
we did tentatively explore the ability of variables that have been shown to be good
predictors of loss aversion as parts of specific tests to explain loss aversion in the context
of other variables.
We examined our attribute-specific self-ratings of knowledge, importance and
whether the attribute was hedonic, along with individual-specific measures and age--all
had either been significant predictors of loss aversion in more specific tests, or predicted
by other research. While there is some correlation among these variables, the highest
correlation was .59, and remaining were less than .3, suggest that multicollinearity was
not an overwhelming challenge for this analysis.
In this multivariate analysis, all the predictors that were significant--age,
importance and knowledge--are still significant predictors, in the same direction as
before; and the hedonic nature of the attribute continues not to predict loss aversion.
Most importantly, much but not all of the attribute differences in loss aversion is
explained by these effects. Looking at the fifth column on Appendix 2, Table1, we see
that the variance due to attribute differences is reduced by about 70%, from .163 in the
baseline Model 3, to .047 in the joint estimation in Model 10. Much of this reduction is
due to two variables predicted by query theory, Age and Attribute knowledge. The third
major predictor was anticipated by prior research, Attribute importance.
Exploring the Nature of Loss Aversion 23
Summary and Conclusions
Contributions
While much of this paper has concentrated on the substantive analysis of loss aversion,
we also demonstrate a method for measuring loss aversion at the individual level. By
using choice and selling response modes, and by spacing the questions in different parts
of the questionnaire, we were able to derive individual level estimates that were
systematically related to variables that we predicted would affect loss aversion, such as
knowledge, importance and age. This method could be of use in the analysis of loss
aversion in consumer behavior in other settings.
More substantively, we have explored the nature of loss aversion in one purchase
domain, albeit one that is substantial: expenditures made by actual consumers. Our basic
result is that loss aversion is not simply a constant, a characteristic of an attribute or an
individual. Instead, we find that a substantial amount of loss aversion can be explained
by the decision maker’s knowledge of the attribute, the attributes’ importance to the
decision-maker and finally, the individual’s age. This result also has implications for the
application of loss aversion, suggesting who will be the most loss averse. In particular, it
emphasizes the role of specific product knowledge and suggests that some individuals,
particularly those who are older or less educated, may be more likely to be loss averse.
Further Research
While we believe that this sample has much more variance along many of the
predictor variables than a student sample would, and that it is more knowledgeable of the
task than most, we believe that it is important to replicate these results with other
Exploring the Nature of Loss Aversion 24
products, cultures, and methods. It is comforting, however, that our results in the
aggregate for the buying and selling prices for the model car, and for the lottery choice,
are similar to those obtained by others. A final important step would be to relate these
estimates of loss aversion to the product choices made by these decision-makers.
The Status of Loss Aversion
What is the status of loss aversion after we have examined this data set? Recall that
skeptical economists have recently argued that Loss Aversion and the Endowment Effect
are phenomena that are restricted to certain lab settings and that their importance for
actual markets is questionable. Our data have two answers to these questions. The first,
which is quite supportive of the usefulness of loss aversion, is that we find significant
degrees of loss aversion in a sample that has recently made a substantial purchase in this
product class. Thus while extreme degrees of instruction and experience may limit or
eliminate loss aversion, our data indicate that loss aversion is an important factor in
understanding these real world consumers. On the other hand, we do find that loss
aversion is moderated by several variables, including attribute knowledge and
importance. While loss aversion still typifies consumers, the amount of loss aversion
varies greatly among them. Thus, we suggest that the question should not be whether or
not loss aversion is important, but rather how important loss aversion is, and for which
attributes and consumers.
The Why of Loss Aversion
We started by describing four different conceptualizations of loss aversion: as a constant,
a trait, an attribute characteristic, or the result of the preference construction process.
Exploring the Nature of Loss Aversion 25
We argue that the view of loss aversion as the result of a process seems best supported by
this data. In particular, one explanation of loss aversion, query theory, predicts that loss
aversion will increase with age, and decrease with specific knowledge of the attributes,
results which are supported by this data. At the same time, other factors, in particular
attribute importance, seem to be important in loss aversion. Importance by itself does not
seem to shed much light on the cause of loss aversion. One must ask what it is about
important attributes that increases loss aversion. This is clearly a question for further
research, but seems consistent with the idea that emotional reactions or anticipated regret
may play a role. Since we know that emotions of disgust and sadness can moderate loss
aversion, we suspect that future research exploring this connection will be fruitful. A
more important question, it would seem, is the connection between such emotion-based
and memory based explanations.
In conclusion, a final observation seems relevant. Much of the research that has
been conducted establishing loss aversion has been done with young people enrolled in
college. While some people have suggested that this results in larger demonstrations of
loss aversion, our data suggest the opposite: In our data, respondents who are older and
have less education show more loss aversion, suggesting that research based on students
may underestimate the importance of loss aversion.
Exploring the Nature of Loss Aversion 26
Notes
1 Note that many contemporary studies, including ours, contrast selling and choice
prices, and not buying and selling prices, since the latter confound loss aversion with
possible wealth effects.
2 It is noteworthy that, while these means far exceed 1, they are lower than the
prototypical value of 2 commonly reported for loss aversion. One possibility is that
selling-choice estimates of λ are often smaller than those estimated by buying and selling
prices. Indeed, a measure of buying and selling prices that was gathered from the same
sample (Gächter et al., 2005) also shows a λ of above 2, but otherwise behaves like the λs
that we observed. In other work, we have observed similar differences between choice-
selling and buying-selling in between subjects estimates of loss aversion (Johnson et al.,
2004).
3 We can also test whether there are significant correlations among these variance
components. Not surprisingly, given the results of Table 1, modifications such as
allowing for correlation among the λ’s does not improve the fit of the model.
4 This contrasts with the results of Kavalchik et al ( 2005) who, using a similar
procedure to Plott and Zeiler, fail to find loss aversion for either older or younger adults.

Exploring the Nature of Loss Aversion 27
Bibliography
Alba, Joseph W. and J. Wesley Hutchinson (1987), "Dimensions of consumer expertise,"
Journal of Consumer Research, 13 (4), 411-54.
Anderson, John R. (1974), "Retrieval of propositional information from long-term
memory," Cognitive Psychology, 6 (4), 451-74.
Anderson, John R. and Lynne M. Reder (1999), "The fan effect: New results and new
theories," Journal of Experimental Psychology: General, 128 (2), 186-97.
Anderson, M. C., R. A. Bjork, and E. L. Bjork (1994), "Remembering Can Cause
Forgetting - Retrieval Dynamics in Long-Term-Memory," Journal of Experimental
Psychology-Learning Memory and Cognition, 20 (5), 1063-87.
Anderson, M. C. and James H. Neely (1996), "Interference and inhibition in memory
retrieval," in Memory. Handbook of perception and cognition (2nd ed.), Elizabeth Ligon
Bjork and Robert A Bjork, Eds.: Academic Press, Inc.
Birnbaum, Michael H. and S. E. Stegner (1979), "Source Credibility in Social Judgment -
Bias, Expertise, and the Judges Point of View," Journal of Personality and Social
Psychology, 37 (1), 48-74.
Exploring the Nature of Loss Aversion 28
Camerer, C. (2005), "Three cheers - psychological, theoretical, empirical - for loss
aversion," Journal of Marketing Research, 42 (2), 129-33.
Camerer, C., L. Babcock, G. Loewenstein, and R. Thaler (1997), "Labor supply of New
York City cabdrivers: One day at a time," Quarterly Journal of Economics, 112 (2), 407-
41.
Camerer, C. F. (2000), "Prospect Theory in the Wild: Evidence from the Field," in
Choice, Values, and Frames, Daniel Kahneman and Amos Tversky, Eds. Cambridge:
Cambridge Univesity Press.
Carmon, Z. and D. Ariely (2000), "Focusing on the forgone: How value can appear so
different to buyers and sellers," Journal of Consumer Research, 27 (3), 360-70.
Chase, W.G. and K.A. Ericsson (1981), "Skilled Memory," in Cognitive Skills and Their
Acquisition, J.R. Anderson, Ed. Hillsdale, N.J.: Lawrence Erlbaum Associates.
Connelly, SLisa, Lynn Hasher, and Rose T. Zacks (1991), "Age and reading: The impact
of distraction," Psychology & Aging, 6 (4), 533-41.
Dhar, Ravi and Klaus Wertenbroch (2000), "Consumer Choice Between Hedonic and
Utilitarian Goods.," in Journal of Marketing Research (JMR) Vol. 37: American
Marketing Association.
Exploring the Nature of Loss Aversion 29
Fehr, Ernst and Lorenze Goette (2002), "Do Workers Work More When Wages are
High?," in IEW Working paper. Zurich.
Fischer, G. W., Z. Carmon, D. Ariely, and G. Zauberman (1999), "Goal-based
construction of preferences: Task goals and the prominence effect," Management
Science, 45 (8), 1057-75.
Fischhoff, Baruch (1991), "Value elicitation: Is there anything in there?," American
Psychologist, 46 (8), 835-47.
Gächter, S., Andreas Herrmann, and E. J. Johnson (2005), "Measuring individual-level
loss aversion using simple experiments," in Working Paper, Columbia University. New
York, NY.
Genesove, D. and C. Mayer (2001), "Loss aversion and seller behavior: Evidence from
the housing market," Quarterly Journal of Economics, 116 (4), 1233-60.
Haich, Michael S. and John A. List (2005), "Do Professional Traders Exhibit Myopic
Loss Aversion? An Experimental Analysis," The Journal of Finance, 60 (1), 523-34.
Hardie, B. G. S., E. J. Johnson, and P. S. Fader (1993), "Modeling Loss Aversion and
Reference Dependence Effects on Brand Choice," Marketing Science, 12 (4), 378-94.
Exploring the Nature of Loss Aversion 30
Hastie, Reid and Robyn M. Dawes (2001), Rational Choice in an Uncertain World: The
Psychology of Judgment and Decision-Making. Thousand Oaks, CA: Sage Publications.
Heath, T. B., G. Ryu, S. Chatterjee, M. S. McCarthy, D. L. Mothersbaugh, S. Milberg,
and G. J. Gaeth (2000), "Asymmetric competition in choice and the leveraging of
competitive disadvantages," Journal of Consumer Research, 27 (3), 291-308.
Horowitz, John K. and Kenneth E. McConnell (2002), "A Review of WTA/WTP
Studeis," Journal of environmental Economics and Management, 44, 426-47.
Johnson, E. J., G. Haeubel, and Anat Keinan (2005), "Aspects of Endowment: A Query
Theory of Loss Aversion."
Jolly, James P., Thomas J. Reynolds, and John W. Slocum (1988), "Application of the
means-end theoretic for understanding the cognitive bases of performance appraisal,"
Organizational Behavior & Human Decision Processes, 41 (2), 153-79.
Köbberling, Veronika and Peter P. Wakker (2005), "An Index of Loss Aversion," Journal
of Economic Theory, 122, 119-31.
Exploring the Nature of Loss Aversion 31
Lerner, J., D. Small, and G. Loewenstein (2004), "Heart strings and purse
strings:Carryover effects of emotions on economic transactions," Psychological Science,
in press.
Lewis, Clayton H. and John R. Anderson (1976), "Interference with real world
knowledge," Cognitive Psychology, 8 (3), 311-35.
List, J. A. (2003), "Does market experience eliminate market anomalies?," Quarterly
Journal of Economics, 118 (1), 41-71.
---- (2004), "Neoclassical theory versus prospect theory: Evidence from the marketplace,"
Econometrica, 72 (2), 615-25.
Marsh, Elizabeth J., Patrick O. Dolan, David A. Balota, and Henry L. Roediger (2004),
"Part-Set Cuing Effects in Younger and Older Adults," Psychology & Aging, 19 (1), 134-
44.
McCloskey, Michael and Kurt Bigler (1980), "Focused memory search in fact retrieval,"
Memory & Cognition, 8 (3), 253-64.
Payne, John W., James R. Bettman, and Eric J. Johnson (1992), "Behavioral decision
research: A constructive processing perspective," Annual Review of Psychology, 43, 87-
131.
Exploring the Nature of Loss Aversion 32
Perfect, T. J., C. J. A. Moulin, M. A. Conway, and E. Perry (2002), "Assessing the
inhibitory account of retrieval-induced forgetting with implicit-memory tests," Journal of
Experimental Psychology-Learning Memory and Cognition, 28 (6), 1111-19.
Peters, E., P. Slovic, and R. Gregory (2003), "The role of affect in the WTA/WTP
disparity," Journal of Behavioral Decision Making, 16 (4), 309-30.
Plott, Charles R. and Kathryn Zeiler (2005), "The Willingness to Pay/Willingness to
Accept Gap, The "Endowment Effect," Subject Misconceptions, and Experimental
Procedures fo Eliciting Valuations.," American Economic Review, 95 (3), 530-45.
Putler, D. S. (1992), "Incorporating Reference Price Effects into a Theory of Consumer
Choice," Marketing Science, 11 (3), 287-309.
Sayman, S. and A. Onculer (2005), "Effects of study design characteristics on the WTA-
WTP disparity: A meta analytical framework," Journal of Economic Psychology, 26 (2),
289-312.
Slovic, Paul (1995), "The construction of preference," American Psychologist, 50 (5),
364-71.
Exploring the Nature of Loss Aversion 33
Tversky, A. and D. Kahneman (1991), "Loss Aversion in Riskless Choice - a Reference-
Dependent Model," Quarterly Journal of Economics, 106 (4), 1039-61.
Verbeke, Geert and Gerrt Molenberghs (2000), Linear mixed models for longitudinal
data. NY: Springer-Verlag.
Weber, Elke U. and Eric J. Johnson (2004), "Constructing Preferences From Memories,"
in The Construction of Value, Sarah Lichtenstein and Paul Slovic, Eds. New York.
Zacks, Rose T., Gabriel Radvansky, and Lynn Hasher (1996), "Studies of directed
forgetting in older adults," Journal of Experimental Psychology: Learning, Memory, &
Cognition, 22 (1), 143-56.
Exploring the Nature of Loss Aversion 34
Fuel Consumption Comfort Safety Information Systems
Figure 1 Distribution of Loss Aversion by Attribute. The solid line is the mean loss aversion for each attribute and the dotted line shows λ=1. Bars are labeled by the percentage of respondents represented by each bar, and the x axis represents the number of respondents.
1
2
3
4
5
5.8
35.0
37.8
13.9
4.4
2.2
0.6
0.0
0.3
2550 75 125
4.2
24.4
31.4
20.6
10.0
4.4
1.4
2.2
0.3
25 50
1.1
21.9
37.2
27.2
8.6
3.1
0.6
0.3
0.0
25 50 75 125
6.4
30.0
27.5
17.2
8.3
4.4
2.2
1.9
0.8
25 50 75 100 100
Exploring the Nature of Loss Aversion 35
1
1.5
2
2.5
1 2 3 4 5 6 7
1
1.5
2
2.5
1 2 3 4 5
Figure 2 Loss Aversion by Ratings of Importance and Hedonic-Utilitarian, 1 = least important, and least hedonic
Exploring the Nature of Loss Aversion 36
1
1.5
2
2.5
<1499915-29.999
30-49.999 50-69.999 70-99.999 100+
1
1.5
2
2.5
<25 25-34 35-44 45-54 55-64 >64
Figure 3 Loss Aversion for Fuel Consumption by Gender, Age, Occupation, Education, Income (thousands) and Net Worth (thousands)
1.0
1.5
2.0
2.5
Unemployed Civil Servant
Student
ManagerWorking
in Household Entrepreneur
Worker/ Farmer
1
2
Male Female
1
1.5
2
2.5
No Degree
Job Certificate High School University
1
1.5
2
2.5
<1010-29.999
30-49.999 50-99.999 100-249.9997
Exploring the Nature of Loss Aversion 37
1
1.5
2
2.5
1 2 3 4 5 6 7
1
1.5
2
2.5
1 2 3 4 5 6 7
1
1.5
2
2.5
Dai
ly
2-3
times
wee
kly
Eve
ry 2
wee
ks
Onc
e a
mon
th
less
hta
n on
ce a
mon
th
Figure 4 Loss Aversion for Ratings of Knowledge, Auto Usage and Experience.
Exploring the Nature of Loss Aversion 38
λFuel
Consumption
λComfort λSafety λInformation
Systems
λModel Car λGamble Choice
λFuel Consumption 1.00
λComfort .05 1.00
λSafety -.07 .03 1.00
λInformation Systems -.00 -.05 -.08 1.00
λModel Car .41 .18 .28 .05 1.00
λGamble Choice .34 .14 .35 .11 .59 1.00
Table 1 Loss Aversion: Correlation among Attributes
Exploring the Nature of Loss Aversion 39
N Fuel Consumption
Comfort Safety Information Systems
Gender Male 266 1.63 1.91 1.84 1.91 Female 94 1.73 1.84 2.03 2.03 Age . . . . . <25 24 1.37 1.47 1.51 1.80 25-34 53 1.44 1.60 1.81 1.71 35-44 107 1.59 1.92 1.86 1.87 45-54 99 1.70 1.88 1.93 2.01 55-64 51 1.80 2.07 1.98 2.14 >64 26 2.20 2.45 2.12 2.21 Education . . . . . No Degree 4 2.04 1.93 2.23 2.13 Job Certificate 67 1.99 2.10 2.08 2.37 High School 181 1.67 1.95 1.95 1.84 University 108 1.41 1.65 1.65 1.83 Income . . . . . <14999 22 1.36 1.55 1.50 1.64 15-29.999 44 1.48 1.58 1.72 1.65 30-49.999 103 1.56 1.87 1.79 1.96 50-69.999 95 1.68 1.86 1.89 1.95 70-99.999 61 1.91 1.95 2.01 2.06 100+ 35 1.86 2.55 2.39 2.20 Net Worth . . . . . <10 20 1.39 1.59 1.32 1.66 10-29.999 58 1.47 1.69 1.93 1.89 30-49.999 147 1.62 1.83 1.89 1.93 50-99.999 69 1.74 1.98 1.87 1.89 100-249.999 45 1.92 2.28 1.96 2.08 250+ 20 1.90 2.05 2.12 2.38 Occupation . . . . . Unemployed 28 1.86 2.11 2.02 2.18 Working in Household
13 2.05 1.75 1.93 2.51
Student 10 2.18 1.96 2.02 2.27 Worker/Farmer 22 2.01 2.24 2.12 2.30 Civil Servant 178 1.61 1.89 1.84 1.88 Manager 77 1.57 1.90 1.87 1.88 Entrepreneur 32 1.43 1.51 1.84 1.68 Table 2 Lambdas for each Attribute by Demographic Variables
Exploring the Nature of Loss Aversion 40
Fuel Consumption
Comfort Safety Information Systems
Intercept 2.11*** 3.15*** 2.49*** 2.72***
Fuel Consumption Knowledge
-0.16*** 0.02 0.04** 0.04
Comfort Knowledge 0.02 -0.32*** 0.02 0.03
Safety Knowledge 0.04** -0.02 -0.18*** 0.09***
Information Systems Knowledge
-0.01 0.06** 0.01 -0.23***
Car Knowledge -0.01 -0.04 -0.05** 0.01Overall interest -0.02 -0.00 -0.04** -0.04Ladder Depth 0.01 -0.02 0.02 -0.00Number of Laddered Attributes.
-0.01 -0.00 -0.01 -0.04
Table 3 Loss Aversion by Attribute Knowledge
*** p< .001 ** p < .01 * p < .05

Exploring the Nature of Loss Aversion 41
Appendix 1: Questionnaire.
In this appendix, we list the measures used in the instrument. The questionnaire
included measures of gender, age, family status, number of children, occupation,
education, household income, net worth, size of town, frequency of auto use, self-ratings
of knowledge of the four auto attributes.
Exploring the Nature of Loss Aversion 42
Level
Attribute Low
Medium High
Fuel Consumption
EPA fuel economy estimates (mpg) 18 (city), 28 (highway)
EPA fuel economy estimates (mpg) 14 (city), 21 (highway)
EPA fuel economy estimates (mpg) 10 (city), 14 (highway)
Comfort
Regular seats 12-way power driver and front passenger seats including 4-way power lumbar adjustment and lockable head restraints
12-way power driver and front passenger Recaro sport seats including 4-way power lumbar adjustment and lockable head restraints, memory function, leather upholstery, including door panel inserts
Safety
No airbags Full size airbags and sideguard head protection airbags for front and rear passengers
Full size airbags and sideguard head protection airbags for front and rear passengers, rear side airbags, driver and front occupants seat mounted chest side airbags
Information
No information or telematics system
Backlit instrument cluster, onboard computer, driver information display with radio display, auto check system, service interval indicator
Backlit instrument cluster, onboard computer, driver information display with radio display, auto check system,service interval indicator, Audi telematics (emergency services, accident assist, convenience services, route suppostolen vehicle tracking, ride assist)
Appendix 1 Table 1: Low, Medium, and High Levels, by Attribute, used in eliciting choice and selling prices
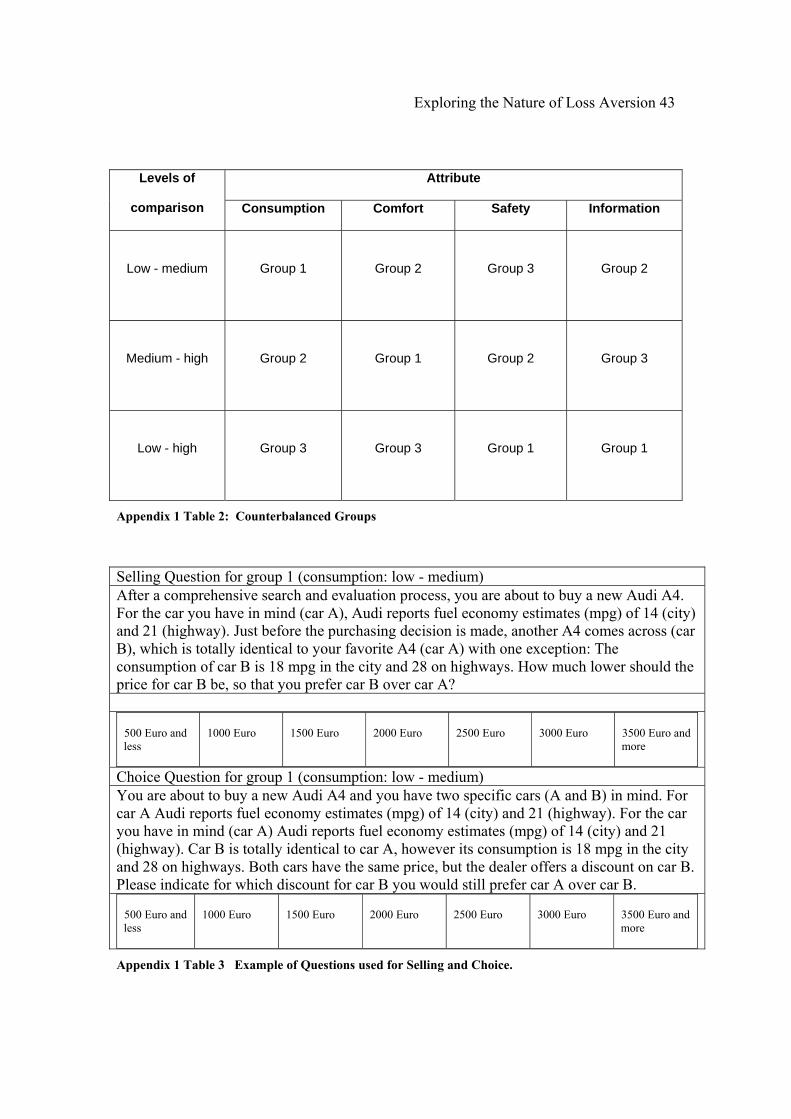
Exploring the Nature of Loss Aversion 43
Attribute Levels of
comparison Consumption Comfort Safety Information
Low - medium
Group 1
Group 2
Group 3
Group 2
Medium - high
Group 2
Group 1
Group 2
Group 3
Low - high
Group 3
Group 3
Group 1
Group 1
Appendix 1 Table 2: Counterbalanced Groups
Selling Question for group 1 (consumption: low - medium) After a comprehensive search and evaluation process, you are about to buy a new Audi A4. For the car you have in mind (car A), Audi reports fuel economy estimates (mpg) of 14 (city) and 21 (highway). Just before the purchasing decision is made, another A4 comes across (car B), which is totally identical to your favorite A4 (car A) with one exception: The consumption of car B is 18 mpg in the city and 28 on highways. How much lower should the price for car B be, so that you prefer car B over car A?
500 Euro and less
1000 Euro
1500 Euro
2000 Euro
2500 Euro
3000 Euro
3500 Euro and more
Choice Question for group 1 (consumption: low - medium) You are about to buy a new Audi A4 and you have two specific cars (A and B) in mind. For car A Audi reports fuel economy estimates (mpg) of 14 (city) and 21 (highway). For the car you have in mind (car A) Audi reports fuel economy estimates (mpg) of 14 (city) and 21 (highway). Car B is totally identical to car A, however its consumption is 18 mpg in the city and 28 on highways. Both cars have the same price, but the dealer offers a discount on car B. Please indicate for which discount for car B you would still prefer car A over car B.
500 Euro and less
1000 Euro
1500 Euro
2000 Euro
2500 Euro
3000 Euro
3500 Euro and more
Appendix 1 Table 3 Example of Questions used for Selling and Choice.
Exploring the Nature of Loss Aversion 44
Appendix 2: A random coefficients model of loss aversion.
Our models of loss aversion--as a constant, an individual difference, a characteristic of an
attribute, or a product of some underlying process--can be represented as a series of
nested models, some allowing for heterogeneity across people using random coefficients.
Tests of significance can be provided both by tests of additional variance accounted for
and by likelihood statistics. The basic model (Verbeke and Molenberghs 2000) is:
Yi = Xi β + Zibi + εi
where Yi is the observed degree of loss aversion, the Xi are the usual predictors in a
regression framework and β is a vector of regression coefficients and Zi are the subject
specific effects with estimates provided by bi.
Obviously the loss aversion as a constant model (Model 1) has only a single Xi
representing the intercept; the individual difference model (Model 2) estimates a random
coefficient for that effect. Similarly, an attribute characteristic model specifies a fixed
effect representing the attribute being assessed; that is, an additional 4 Xi’s ,one for each
of the attributes. This model is not reported here since it is subsumed in Model 3, and
does not increase the fit of Model 2.
To model heterogeneity in the effects of attributes (Model 3), we introduce a random
effect for attributes, which provides a subject-specific intercept for each attribute effect in
the Zis.
Finally tests of possible process mediators of the effects of loss aversion are conducted by
introducing additional variables as fixed effects in Xi’s, and success in accounting for
attribute variability is demonstrated by a reduction of the variance in the on-diagonal
Exploring the Nature of Loss Aversion 45
elements in bis. For example, Model 4 adds two Xis representing the subjects’ ratings of
attribute importance and the attributes’ hedonic nature. As can be seen in the 5th column
in Appendix 2, Table1, these two variables reduce the random effect of the attributes by
more than half, from .164 to .073. Similarly, Model 5 allows the βis to vary across
attributes, changing the two additional βis in Model 4, to a 8 (2 predictors x 4 attributes).
In addition to the usual tests of fit offered by the Log Likelihood, the Bayes Information
Criterion (columns 3 and 4, respectively) we can test several nested models. These tests
are reported in columns 6-9.
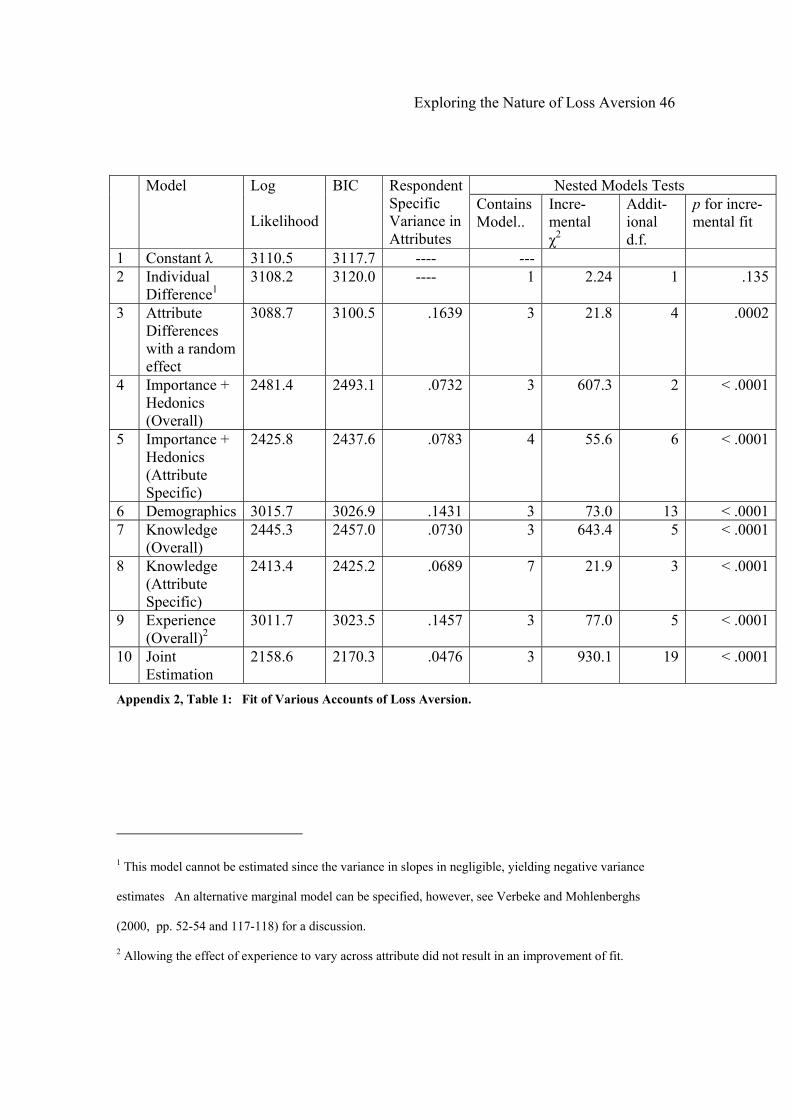
Exploring the Nature of Loss Aversion 46
Nested Models Tests Model Log
Likelihood
BIC RespondentSpecific Variance in Attributes
Contains Model..
Incre-mental χ2
Addit-ional d.f.
p for incre-mental fit
1 Constant λ 3110.5 3117.7 ---- --- 2 Individual
Difference1 3108.2 3120.0 ---- 1 2.24 1 .135
3 Attribute Differences with a random effect
3088.7 3100.5 .1639 3 21.8 4 .0002
4 Importance + Hedonics (Overall)
2481.4 2493.1 .0732 3 607.3 2 < .0001
5 Importance + Hedonics (Attribute Specific)
2425.8 2437.6 .0783 4 55.6 6 < .0001
6 Demographics 3015.7 3026.9 .1431 3 73.0 13 < .00017 Knowledge
(Overall) 2445.3 2457.0 .0730 3 643.4 5 < .0001
8 Knowledge (Attribute Specific)
2413.4 2425.2 .0689 7 21.9 3 < .0001
9 Experience (Overall)2
3011.7 3023.5 .1457 3 77.0 5 < .0001
10 Joint Estimation
2158.6 2170.3 .0476 3 930.1 19 < .0001
Appendix 2, Table 1: Fit of Various Accounts of Loss Aversion.
1 This model cannot be estimated since the variance in slopes in negligible, yielding negative variance
estimates An alternative marginal model can be specified, however, see Verbeke and Mohlenberghs
(2000, pp. 52-54 and 117-118) for a discussion.
2 Allowing the effect of experience to vary across attribute did not result in an improvement of fit.